Abstract
An intuitive method for estimating the inertia contribution from residual sources, such as induction motors and inverter-based power electronic facilities, in the Korea Electric Power Corporation (KEPCO) system is proposed. First, the method utilizes synchronized Phasor Measurement Units (PMUs) to obtain the measured system Rate of Change of Frequency (RoCoF) following an instantaneous power imbalance. Subsequently, the estimated system RoCoF for the same event is derived from simulations of the full dynamic model of the KEPCO system using Energy Management System (EMS) data. The estimated RoCoF accounts only for the inertia contribution from synchronous generators, as the dynamic model includes only these generators. The residual inertia of the entire power system is then estimated based on the ratio of the estimated RoCoF to the measured RoCoF, using the known inertia contribution from synchronous generators. The effectiveness of the proposed method is validated through dynamic simulations of the KEPCO system and demonstrated using real PMU and EMS data from actual disturbance events. The results illustrate that residual inertia was estimated at approximately 160 GW during daytime and around 67 GW during nighttime, indicating substantial variation in absolute terms. This finding highlights the importance of considering residual inertia contributions, particularly under varying load conditions.
1. Introduction
As part of a policy aiming for carbon neutrality in Korea’s power systems by 2050, the government has announced a project to build 12.7 GW of large-scale offshore wind farms on the mainland power grid of the Korea Electric Power Corporation (KEPCO), headquartered in Naju, Republic of Korea [1,2]. In addition, renewable energy capacity on the island grid of the KEPCO system is planned to increase from 0.73 GW to 4 GW by 2030 [3]. The integration of a large share of inverter-interfaced renewable energy, asynchronously connected to the KEPCO system, inevitably leads to the displacement of synchronous generators. This replacement may result in a sustained reduction of system inertia, thereby making it more difficult to maintain frequency stability in the power system.
Global efforts have focused on increasing the penetration of renewable energy sources to reduce carbon emissions. The integration of renewable energy into the grid, which displaces conventional synchronous generators, results in a reduction of both the total system inertia and the contribution from synchronous generators. This increases the relative importance of inertia provided by non-synchronous resources.
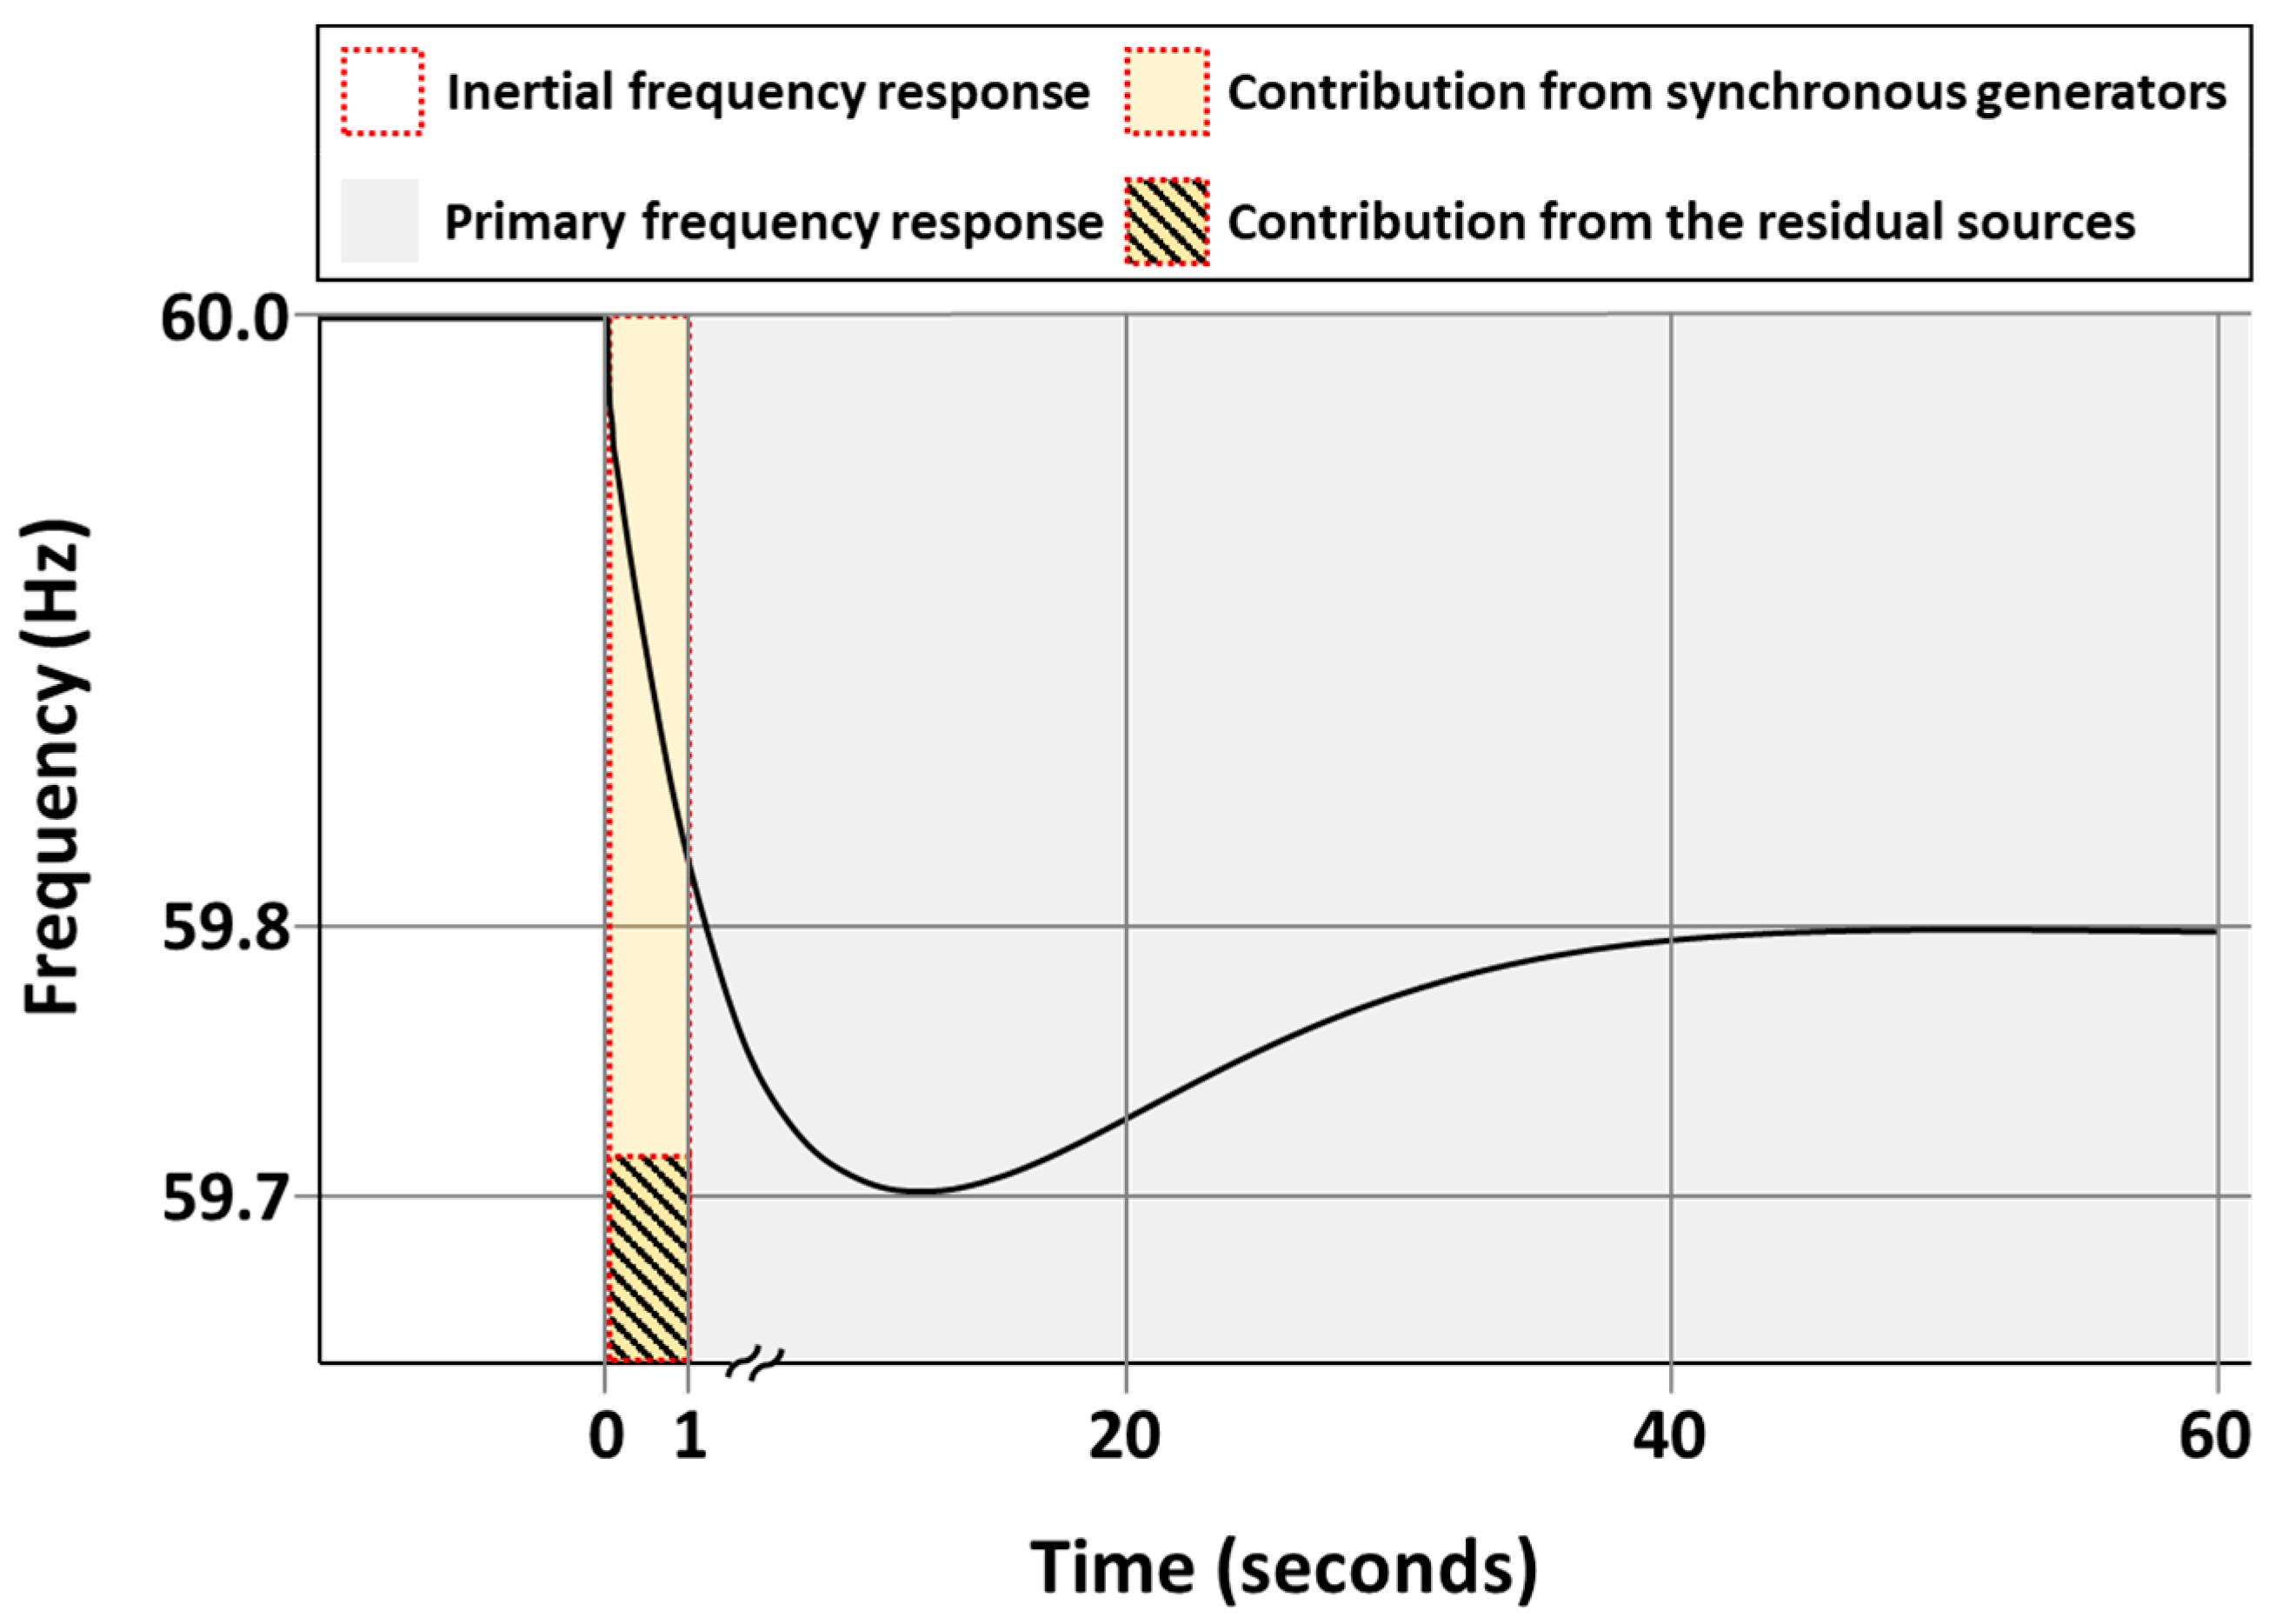
Traditionally, power system inertia has been primarily provided by synchronous rotating machines in both generation and load. In such systems, it was sufficient for operators to monitor the inertia contribution from synchronous generators using the Supervisory Control and Data Acquisition (SCADA) system, which reports the status of all synchronous generators connected to the transmission network, since system inertia was expected to vary linearly with demand [4,5,6,7]. However, in modern power systems with a significant reduction in synchronous generators, various additional sources of inertia, such as virtual inertia strategies and fast-response of inverter-based power electronic facilities, are increasingly implemented to support system inertia [8,9]. Figure 1 visualizes how such an assumption is now challenged. After a generator trip, the first-second “inertial frequency response’’ is no longer supplied solely by a synchronous machine, but increasingly by residual, non-synchronous sources such as embedded induction motors and converter-interfaced resources. As the synchronous share contracts in modern grids with high renewable penetration, the proportional contribution of these residual sources must rise correspondingly to arrest the initial Rate of Change of Frequency (RoCoF). As a result, operators must consider the contribution of unknown residual inertia from sources since the system’s overall inertia is becoming less dependent on synchronous generators alone.

Figure 1.
Frequency response components following the trip of a single generator.
To address these challenges, various inertia estimation approaches have been proposed using pre-disturbance and post-disturbance Phasor Measurement Unit (PMU) data. For example, a method to estimate the total inertia of the Great Britain system was introduced by aggregating regional inertia estimates based on PMU frequency measurements and summing them across the network [10,11]. In addition, online estimation algorithms using PMU data at generator terminals were proposed to estimate synchronous inertia based on unit step response identification models [12,13,14]. However, many of these approaches either focus only on synchronous inertia or require PMU installations at all generator locations, which can be costly and impractical for large-scale systems. As summarized in Table 1, in contrast to existing methods that primarily focus on synchronous inertia estimation or require extensive PMU deployment, the proposed approach enables residual inertia estimation with limited PMU coverage by utilizing Energy Management System (EMS) data and system-level frequency measurements.

Table 1.
Comparison of inertia estimation methods.
In this paper, we propose a method for estimating the residual inertia of the KEPCO system. The proposed approach directly calculates RoCoF from PMU frequency measurements during disturbances, capturing the combined effects of synchronous generators and residual sources such as induction motors and converter-based fast frequency response. The estimated RoCoF is also derived from dynamic simulations considering only synchronous generators using generator configuration information obtained from state estimation (SE) data. The residual inertia is then estimated by comparing the measured and estimated RoCoF values based on the swing equation and known synchronous generator inertia. The effectiveness of the proposed method is validated through simulations and actual disturbance event analyses in the KEPCO system using real PMU and EMS data.
The remainder of this paper is organized as follows: Section 2 introduces the proposed method for estimating residual inertia in the KEPCO system. Section 3 provides an overview of the existing PMU infrastructure in the KEPCO system. Section 4 presents simulation results on the island grid to validate the proposed method. Section 5 analyzes real event cases in the KEPCO system to estimate residual inertia under both daytime and nighttime conditions. Section 6 discusses practical implications, model limitations, and potential future extensions. Finally, Section 7 presents the conclusions.
Contributions
This study introduces a novel approach for estimating the residual inertia in power systems, with a focus on the KEPCO grid in South Korea. Unlike traditional methods that focus solely on synchronous generator inertia, the proposed method integrates PMU frequency data with EMS data, enabling the inclusion of both synchronous and residual inertia contributions from non-synchronous sources such as induction motors and converter-based fast frequency response (FFR). This enables a more comprehensive analysis of system inertia, providing a realistic estimate of total system inertia.
Key contributions of this study are:
- Development of a novel framework for estimating both synchronous and residual inertia, offering a more comprehensive and accurate analysis of system stability;
- Application of the proposed method using limited PMU coverage, making it applicable to systems where full PMU deployment is impractical, such as large-scale power systems;
- Validation of the method using real PMU and EMS data from the KEPCO system, showcasing its practical effectiveness in evaluating frequency stability under varying load and generation conditions;
- The proposed method allows for more informed operational decision-making by accounting for both synchronous and non-synchronous inertia, crucial for optimizing reserve allocation and improving system resilience, particularly in grids with high renewable energy penetration.
This approach enhances system inertia estimation and provides valuable insights for frequency control, reserve allocation, and efficient system operation, particularly in grids with high renewable energy penetration. It offers a more accurate estimation of system inertia, ultimately facilitating the design of optimized operational strategies and cost-effective planning for inertia support resources.
2. KEPCO Wide Monitoring Systems
The KEPCO system consists of the mainland and the island, which are interconnected by two HVDC links, as shown in Figure 2. Currently, these HVDC links inject power from the mainland to the island in only one direction. The KEPCO mainland system consists of five regions, with approximately 42% of the total system demand concentrated in the metropolitan area. Meanwhile, a large number of synchronous generators are primarily located in the southern coastal region. As a result, the mainland system operates ultra-high voltage and large-capacity transmission facilities to transmit power from non-metropolitan to metropolitan areas. In 2019, the mainland’s peak demand was approximately 90 GW, with 6.5% supplied by renewable energy sources (RESs). As the share of renewable energy increases—displacing synchronous generators—it is expected that system inertia on the mainland will significantly decrease, reaching 20% of the total power supply by 2030.
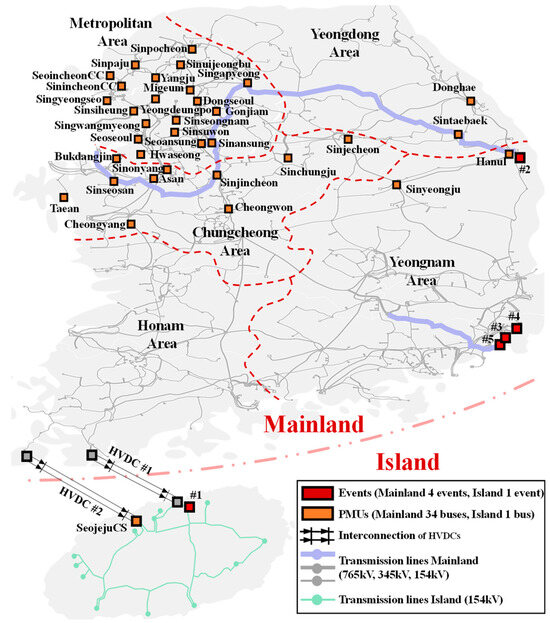
Figure 2.
PMU-monitored buses in the KEPCO systems.
In 2019, the island’s peak demand was approximately 1.2 GW, with 32.2% supplied by HVDCs and 31.1% by RESs. As a result, the island of the KEPCO system relies heavily on power supplied by HVDCs rather than synchronous generators, which can lead to larger system RoCoF values during power imbalance events. Meanwhile, HVDC#1 is a bipole LCC HVDC operated in frequency control mode with a slope of 0%, and HVDC#2 is a double monopole LCC HVDC operated in frequency control mode with a slope of 1%. When a power imbalance occurs, synchronous generators first provide an inertial response by releasing their rotational kinetic energy. Subsequently, the HVDCs begin injecting active power into the island before the primary frequency response is activated, helping to reduce the power mismatch. As the mismatch decreases, the output of the synchronous generators also decreases. Therefore, although HVDCs lack physical rotational mass, they may provide an effect similar to residual inertia on the island of the KEPCO system.
A Korea-wide area monitoring system (K-WAMS), applying the international standard IEEE C37.118 [15], was first developed in Korea in 2009 through a national R&D program funded by the Ministry of Commerce, Industry, and Energy. K-WAMS has been operated to monitor power system operations above 345 kV on the mainland and above 154 kV on the island. In addition, PMUs are used to monitor various inverter-based facilities, such as HVDC and FACTS, and to support cooperative control strategies among these facilities. KEPCO has installed PMUs in 34 substations above 345 kV, including some at 765 kV, on the mainland and in one substation above 154 kV on the island to acquire real-time synchrophasor measurements. Notably, PMUs have been concentrated in substations in the metropolitan area to monitor system constraints. In contrast, other regions of the KEPCO system are monitored by fewer PMUs, making it difficult to capture data from all generator buses. Therefore, conventional inertia estimation methods that rely on active power and frequency measurements at generator buses may not be suitable for the KEPCO system.
3. Residual Inertia Estimation
3.1. Theoretical Background
The fundamental dynamic frequency model for large power systems forms the basis for the proposed method. This model is based on the swing equation, which describes the dynamic behavior of synchronous generators in the system. Through appropriate simplifications, a single differential equation describing the system’s frequency dynamics is derived. The system frequency begins to deviate from its nominal value following an instantaneous imbalance between generation and demand. The model shows that the RoCoF is inversely proportional to system inertia during the initial inertial response, before the primary frequency control becomes active.
The frequencies of individual synchronous generators vary following a sudden power imbalance between generation and demand. These frequency variations are relatively small compared to the overall system frequency. This system frequency is commonly defined as the center of inertia frequency (fCOI) of the system. The dynamic frequency model for large power systems can be derived from the swing equation, which describes the dynamic behavior of synchronous generators.
The indices m and e denote mechanical and electrical quantities, respectively. represents the absolute value of the rotor angular frequency of generator . The initial condition for (1), corresponding to the pre-disturbance frequency, is typically set to the nominal frequency . The primary quantity of interest is the angular frequency deviation , defined as:
By differentiating Equation (2) with respect to time, we obtain . The initial condition holds when Equation (2) is expressed in terms of . To convert the torques in Equation (1) into power, the relation is applied, yielding:
The power can be expressed in megawatts (MW) instead of per unit (p.u.) by multiplying by the power base , which is the rated power of generator . Furthermore, Equation (3) can be rewritten with both sides in MW as follows:
In a highly meshed system, all units can be assumed to be connected to the same bus, representing the center of inertia of the system. With further simplifications, they can be condensed into a single equivalent unit. Summing Equation (4) for all generators yields:
Due to the strong coupling between generation units, it is typically assumed that for all . By defining the following quantities:
The fCOI is used as the representative frequency for the system. While the assumption that holds true in most synchronous systems, but it may not fully apply in weakly connected systems, where small frequency differences might exist between regions. The fundamental frequency dynamics of the system are described by the following nonlinear differential equation:
For the frequency at the center of inertia, the following relation holds . To linearize Equation (11), is typically assumed on the right-hand side. This assumption is valid for typical frequency deviations in power systems. This yields:
The system dynamics can also be expressed in terms of frequency instead of angular frequency . Using and , this becomes
A very simple and useful model can be derived if further simplifying assumptions are made. The overall goal of this analysis is to derive an expression for the variation of following a disturbance between and . Therefore, we define
where represents the steady-state mechanical power output of the generators, and represents its deviation. The total power generated is balanced by the load demand and transmission system losses.
which can, similarly to Equation (14), be expressed as
where .
If the system is in equilibrium prior to the disturbance,
hold true. It is also assumed that transmission losses remain unchanged during the disturbance.
Using Equations (14)–(18), Equation (13) is rewritten as
In addition, an instantaneous power imbalance between generation and demand is defined as the change in and at the time of the disturbance [16,17].
Moreover, the system inertia derived from the aggregated swing equation represents the sum of the inertia contributions from synchronous generators, which corresponds to the maximum possible value of the system RoCoF. However, in practice, the system inertia may also include contributions from other, unidentified sources in addition to synchronous generators. Therefore, the accurately measured RoCoF should always be lower than this maximum possible value.
After a power imbalance occurs between supply and demand, the inertial response takes place before primary frequency control actions begin. During this period, the system frequency starts to deviate from its nominal value. The system RoCoF following a power imbalance depends on the level of system inertia. The maximum RoCoF is achieved when the system inertia equals that of the synchronous generators alone. Therefore, Equation (2) can be modified as follows:
However, to estimate the total system inertia in real power systems, the contributions from unidentified sources must also be considered. Accordingly, the total system inertia is the sum of the inertia contributions from both synchronous generators and unidentified sources. Therefore, Equation (21) can be modified as follows when both contributions are included:
For the identical event, the power imbalance ΔP is considered constant. By dividing Equation (21) by Equation (22) under the assumption of an identical power imbalance, the following relation between the ratio of system RoCoF and the ratio of system inertia is derived:
3.2. Residual Inertia Estimation of Power Systems
SE data from the SCADA system in South Korea is generated every 2 s. Power mismatch events can be detected by PMUs within less than one second due to their high sampling resolution. This allows selecting SE data from just before the event. Therefore, the time difference between the PMU-detected event and the most recent SE data is within 2 s. In this paper, it is assumed that the number of generators connected to the grid remains unchanged during this interval.
For power mismatch events detected by the PMU, SE data just prior to the event can be used together with the full dynamic model of the KEPCO system from the Korean SCADA system. The total inertia from generation is calculated by summing the inertia of online synchronous generators identified in the SE data. The dynamic model considers only the inertia of synchronous generators in the KEPCO system. Therefore, the estimated system RoCoF, , considering only synchronous generator inertia, is obtained by simulating the same event using the dynamic model and SE data. This estimated RoCoF is expected to be larger than the RoCoF measured by the PMU.
The measured system RoCoF, , which includes both synchronous generator inertia and residual inertia, is obtained from PMU frequency data recorded during the same event. The residual inertia of the system can then be estimated from the ratio of the estimated RoCoF to the measured RoCoF , given the known inertia contribution from synchronous generators:
The ratio of the estimated system RoCoF, , to the measured system RoCoF, , is always greater than or equal to one, since the measured RoCoF is lower than the estimated RoCoF. Therefore, the presence of can be confirmed if does not equal in Equation (6).
4. Example of the Modeled KEPCO Island System
4.1. Simulation Scenarios and Models
The proposed method was applied to the KEPCO Island power system, which had a demand of 700 MW. A full dynamic model of the island power system was simulated using Power System Simulator for Engineering (PSSE) software 33.12.0. The scenario included four synchronous generators: two (NamjejuTP1 and NamjejuTP2) installed on the Namjeju TP, and two (JejuTP2 and JejuTP3) installed on the Jeju TP bus. The synchronous generators were represented using the GENROU model, with each generator on the Namjeju TP bus rated at 95.69 MVA and each generator on the Jeju TP bus rated at 109.21 MVA.
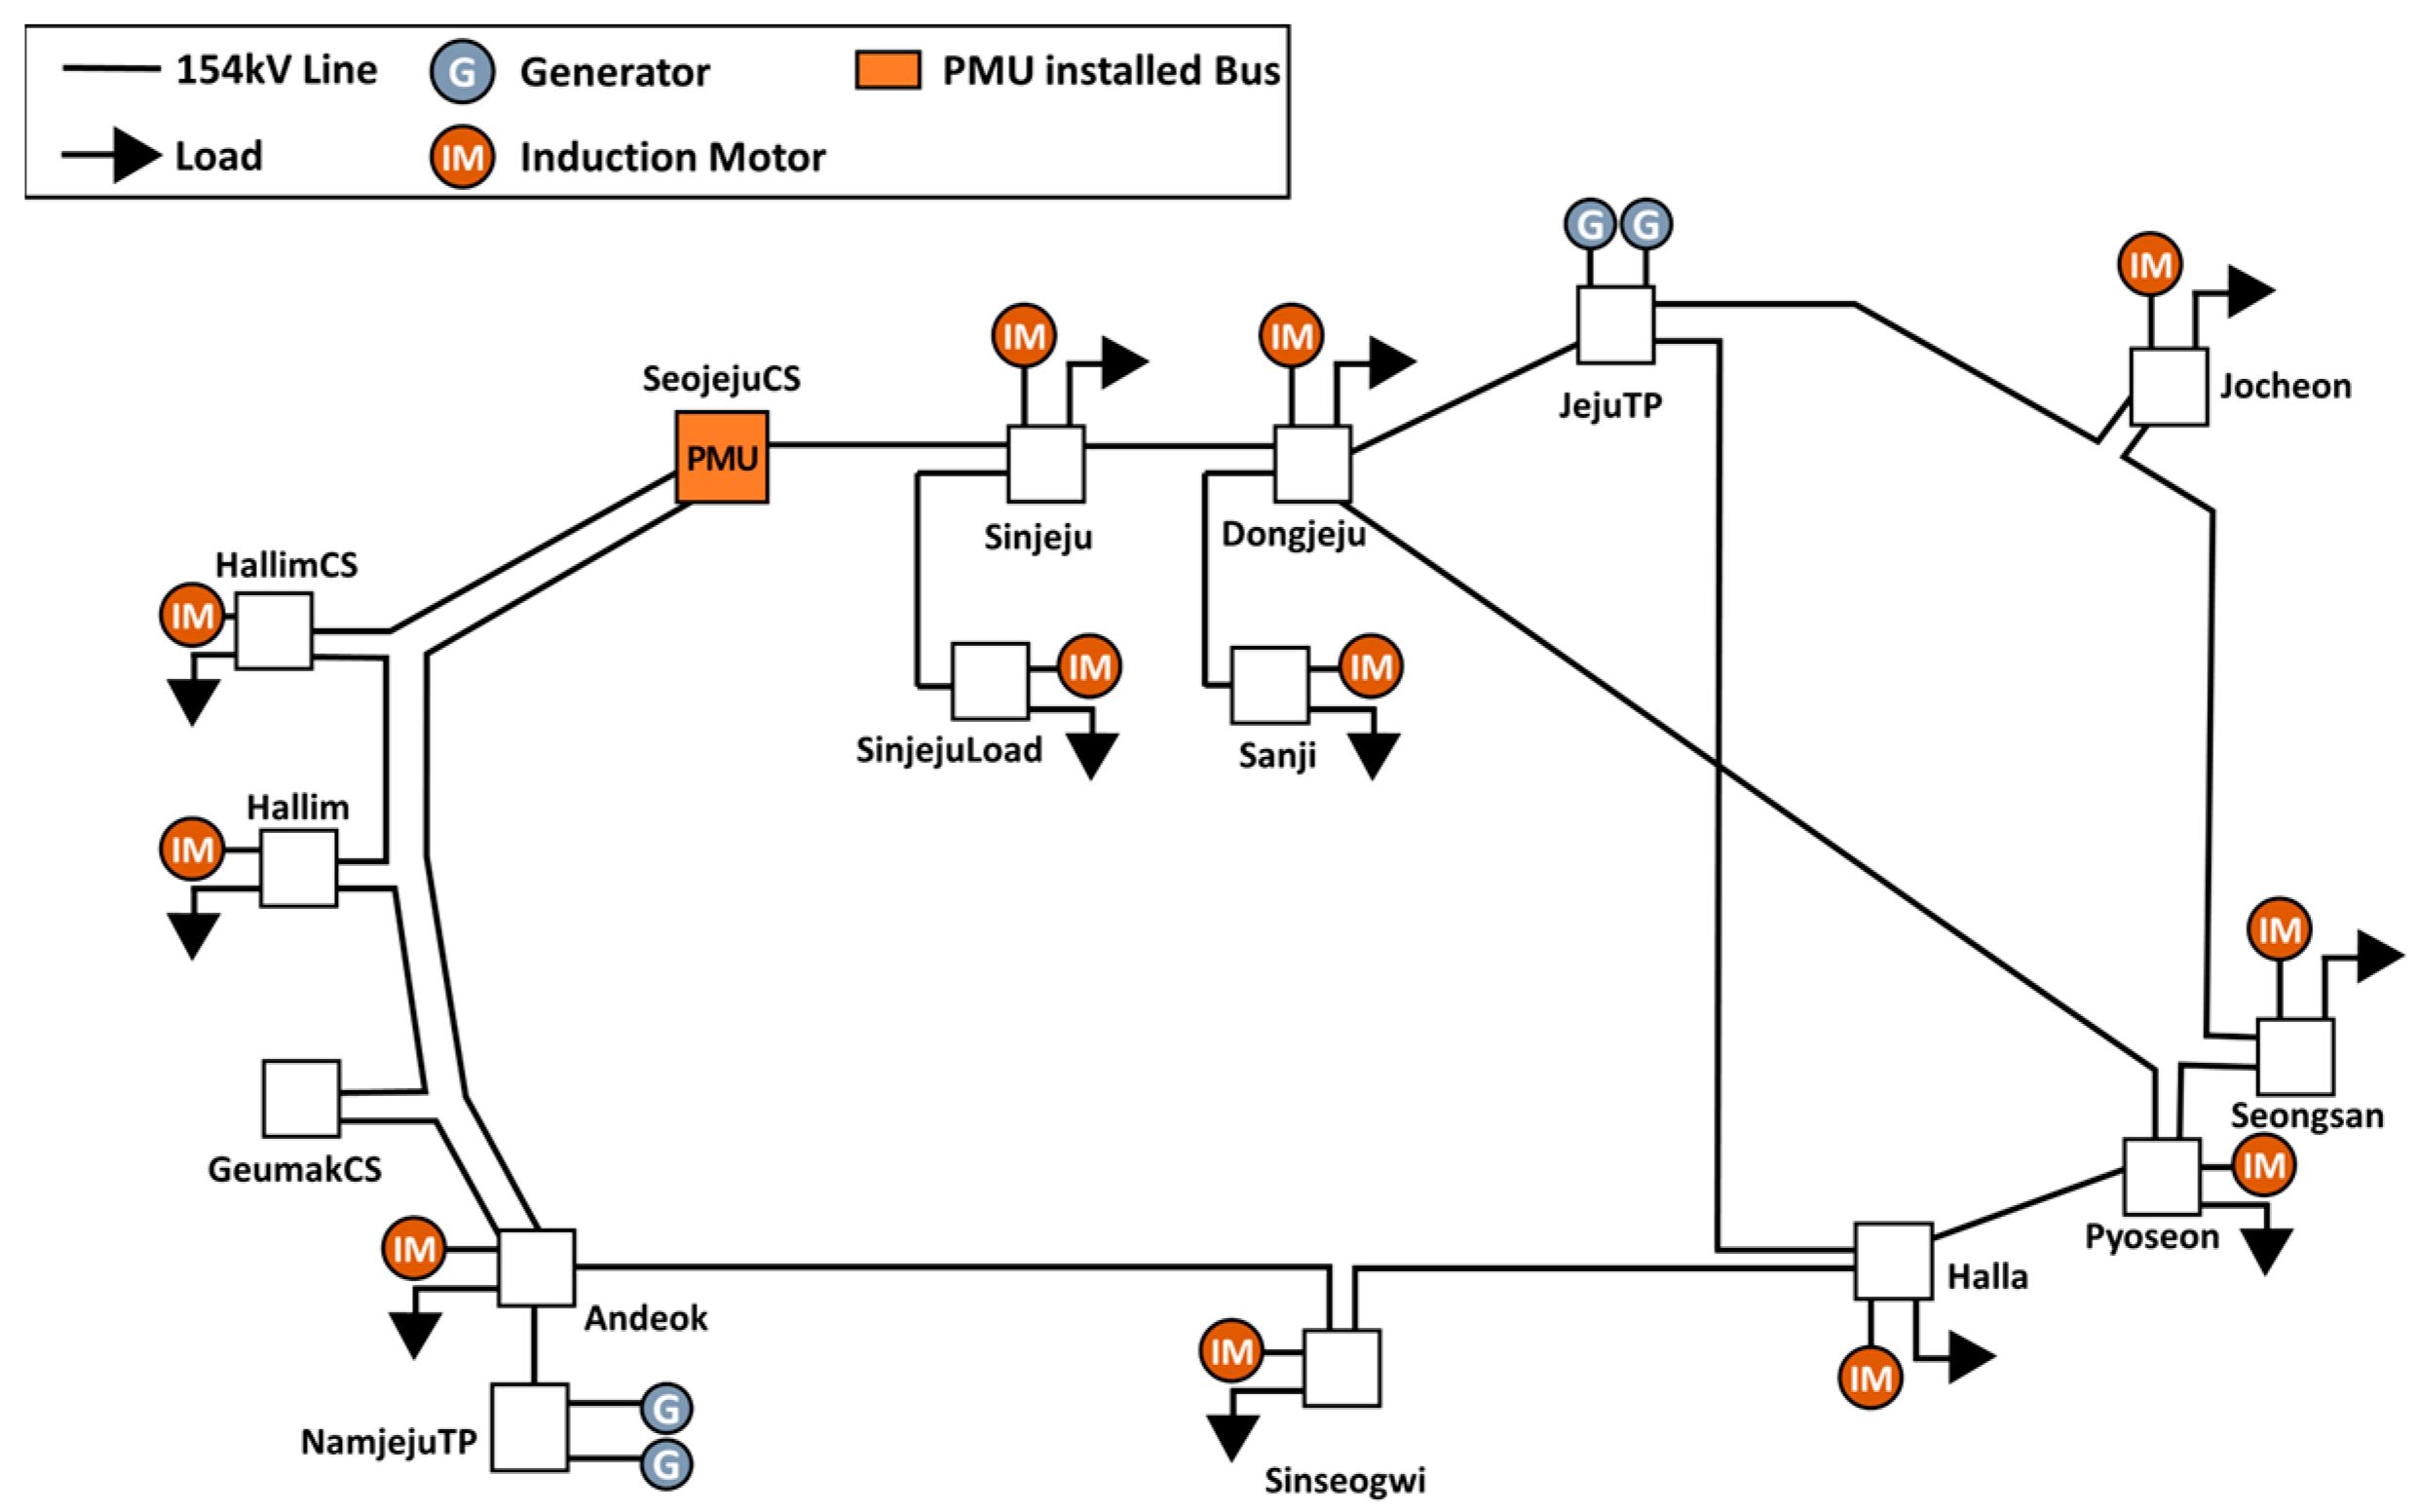
Jeju Island’s well-developed aquaculture industry relies heavily on induction motor loads, which represent the main electrical load in the region. The system configuration, including both synchronous generators and induction motor loads, is illustrated in Figure 3. To construct the 20 simulation scenarios, the inertia contribution of induction motor loads was varied to represent different levels of residual inertia. Specifically, each simulation case was constructed by assigning a random inertia constant between 0.9 s and 4.2 s to all twelve induction motors uniformly. That is, within each case, all motors shared the same inertia constant, but the values differed between cases. This allowed the total residual inertia to vary across simulations while maintaining structural consistency in the system configuration.

Figure 3.
Simplified schematic of the Island power system.
The induction motor loads were modeled using the CIM5BL model, a five-state dynamic representation of three-phase squirrel cage induction motors. This model includes stator and rotor flux dynamics, slip behavior, and torque-speed characteristics, making it suitable for analyzing short-term frequency responses to system disturbances. The inertia constant used in the model corresponds to the per-unit kinetic energy of the rotor on its rated MVA base and was directly modified in the dynamic data.
In addition, to reflect the PMU installation status in the Jeju system, the system frequency was represented by the frequency measured at the Sejeju CS bus. The scenario involved tripping the NamjejuTP1 synchronous generator, which was operating at 45 MW when the trip occurred at 1 s. The total inertia energy of the remaining three synchronous generators, excluding the tripped unit, was 1799.85 MWs. In the dynamic simulation, using the model of the synchronous generators, the RoCoF was estimated considering only the contribution from synchronous generator inertia. According to the proposed methodology, RoCoF must also be calculated based on PMU measurements, reflecting contributions from both synchronous generators and additional resources. In this paper, the RoCoF was calculated using a 500 ms sample-by-sample moving window. A 500 ms interval of frequency data was collected, and a least-squares linear regression was applied over that window. The slope of the fitted line was taken as the RoCoF at the current time.
The results were obtained for 20 cases with different ratios of additional resource inertia contributions to the total system inertia, using both the dynamic models of the synchronous generators and the induction motor loads to represent PMU-based observations. Note that the simulation assumed induction motor loads as the only additional inertia source, excluding the dynamic characteristics of other power facilities such as HVDC. Based on this simulation setup and the method for calculating RoCoF, the results from 20 different cases are presented in the following section.
4.2. Simulation Results
When considering only the dynamic model of synchronous generators versus including additional resources such as induction motor loads, the resulting frequency responses are shown in Figure 4. Under normal conditions, the frequency at the Seojeju CS bus is 60 Hz, matching the nominal system frequency. Following the generator trip at 1 s, significant fluctuations were observed in the measured frequency.
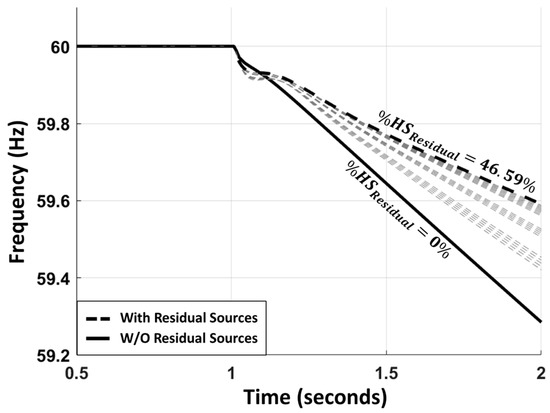
Figure 4.
Simulated frequency at the Seojeju CS bus for 20 cases with varying residual to total inertia ratios.
The solid line in Figure 4 shows the case where only the dynamic model of synchronous generators was considered, without additional inertia contribution. Without the induction motor loads, the frequency drops to approximately 59.29 Hz after the generator trip at 1 s, with a RoCoF of 0.7268 Hz/s, the highest observed in this analysis. The dotted line in Figure 4 shows the simulated frequency response after incorporating the induction motor loads. As the ratio of additional inertia increases, the frequency drops after the generator trip at 1 s becomes smaller, and the RoCoF decreases. In the case where additional inertia accounts for 46.59% of the total system inertia, the frequency drops to 59.59 Hz with a RoCoF of 0.3927 Hz/s which is the lowest observed in this analysis.
These results highlight that excluding residual inertia from system inertia assessments may lead operators to perceive a more severe inertia deficit than exists. Such conservative estimations could trigger unnecessary corrective measures, including renewable generation curtailments, excessive allocation of spinning reserves, or costly investments in synchronous condensers and energy storage systems to artificially compensate for the perceived inertia shortfall.
By explicitly quantifying the residual inertia contribution, the proposed method allows operators to obtain a more accurate estimation of total system inertia, reflecting both synchronous and non-synchronous components. This facilitates the design of optimized frequency control strategies, more efficient spinning reserve allocation, and cost-effective planning of inertia support resources. In modern power systems with high penetration of inverter-based resources, such realistic inertia assessments are essential for maintaining secure and economical system operation under diverse load and generation conditions.
Table 2 summarizes the errors between the estimated and actual inertia contributions from residual resources, based on 20 simulation cases. The base case corresponds to the scenario without residual inertia, in which the RoCoF with and without residual inertia is the same, resulting in a RoCoF ratio of 1. As the ratio of residual resource inertia increases, both the total system inertia and the contribution from these resources increase. This leads to a reduction in the RoCoF for the same disturbance event, indicating that higher residual inertia results in greater system stability.
Table 2.
Residual inertia of the KEPCO island system estimated from dynamic simulations.
Given the actual residual inertia, referred to as , a positive estimation error indicates underestimation, while a negative error indicates overestimation. The estimation errors observed in Table 2, ranging from −2.56% to +2.47%, primarily result from the RoCoF calculation applied. Although the 500 ms moving window helps suppress transient noise, its averaging effect may slightly reduce the estimated slope of the early frequency drop immediately after the disturbance. This smoothing process can bias the RoCoF estimation during the initial period, which directly affects the residual inertia calculation. Although smoothing generally leads to an underestimation and an overestimation of the initial RoCoF.
5. Residual Inertia of KEPCO Systems
5.1. Residual Inertia Result from an Island System Event
In a real event on 14 August 2020, with a system demand of 1011 MW, the JejuLNG#1 generator, supplying 80 MW, was tripped. The system frequency, shown in Figure 5, was 60 Hz before the event, and the minimum frequency recorded was 59.74 Hz. The total inertia from generators was 4393.45 MWs, as detailed in Table 3. The RoCoF, calculated based on the loss size and known generator inertia, was −0.5426 Hz/s, while the RoCoF measured at the Seojeju CS bus was −0.3230 Hz/s. Based on these values, the total system inertia was estimated to be 7430.43 MWs, with 3036.89 MWs contributed by the load.
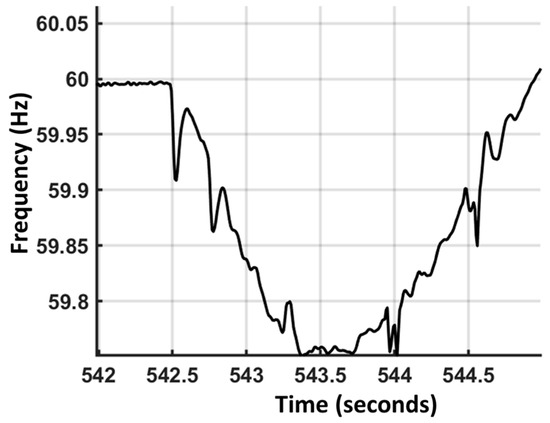
Figure 5.
Measured frequency at the PMU of Seojeju CS bus during the Jeju LNG#1 generator trip.
Table 3.
Residual inertia of the KEPCO island system estimated from a real generator-trip event.
This result indicates that if only synchronous generators were present, the RoCoF would theoretically reach −0.5426 Hz/s. However, the measured RoCoF from PMU frequency data was significantly lower at −0.3230 Hz/s. This difference suggests that residual inertia contributes to mitigating the RoCoF, reducing its magnitude by approximately 0.2196 Hz/s. These observations clearly confirm the presence of residual inertia beyond the synchronous generator inertia, as theoretically expected.
5.2. Residual Inertia Results from Mainland System Events
Between July 2020 and April 2022, the KEPCO mainland grid experienced four major generator-trip incidents, referred to as Events#1–#4. Event#1 involved the loss of a generator located in the Yeongdong region, while Events#2–#4 occurred in the Yeongnam region. In terms of operating conditions, Events#1 and#4 took place during the weekday lunchtime peak, while Events#2 and#3 occurred during late-night low-load periods.
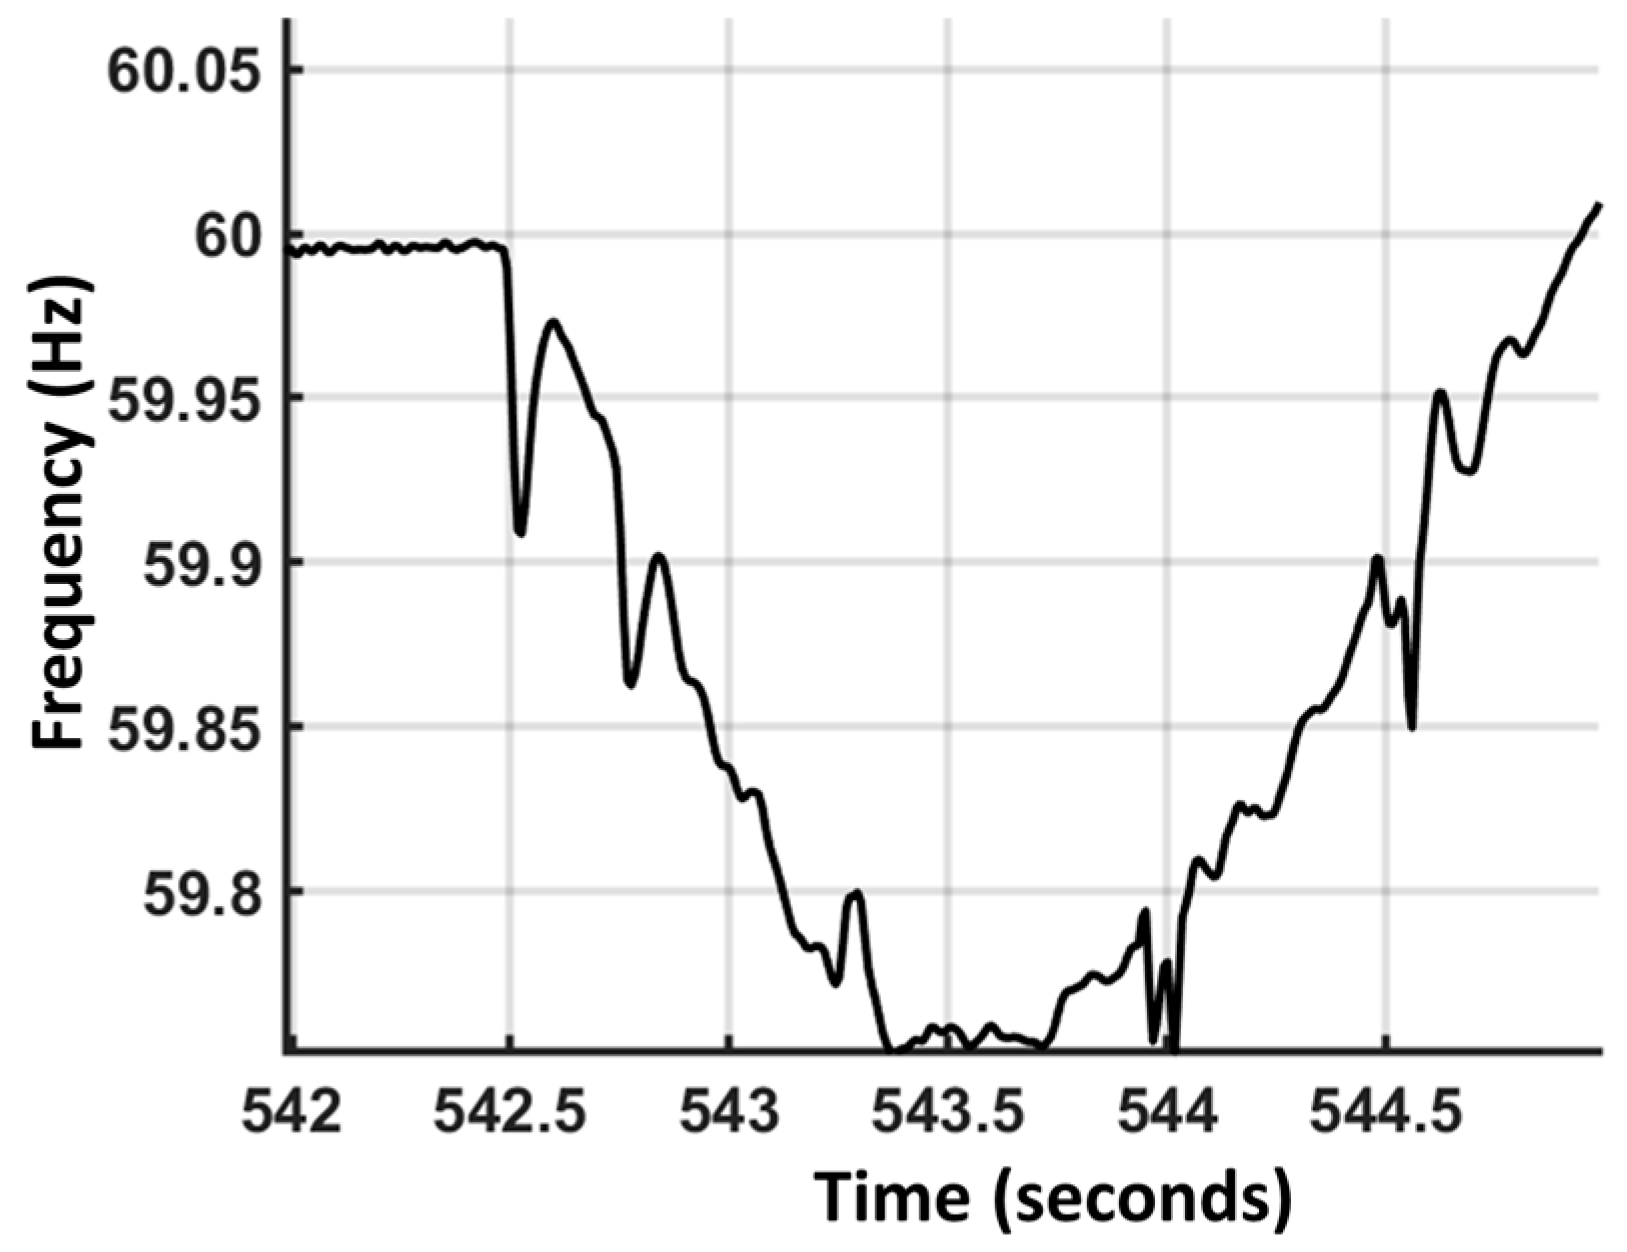
To illustrate the system-wide frequency response and the RoCoF estimation process, Figure 6 presents the representative frequency traces recorded by PMUs during Event 1. This event involved a 1 GW generator trip in Yeongdong. The frequency trajectory shown in Figure 6 represents the fCOI response of the entire mainland grid. Following the disturbance, the measured RoCoF was −0.061 Hz/s, which is smaller than the theoretical RoCoF of −0.090 Hz/s that would be expected if only synchronous generator inertia were present. This difference indicates the presence of residual inertia contributed by motor loads and converter-interfaced resources.
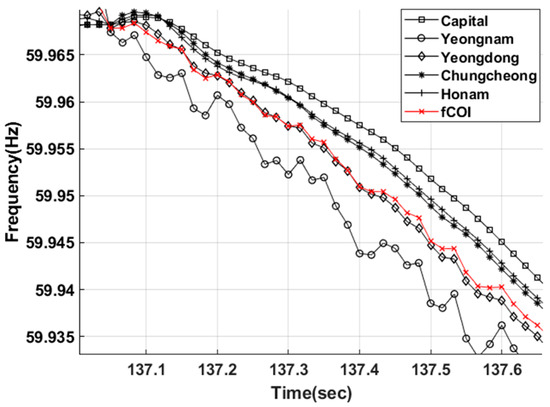
Figure 6.
The frequency of the buses monitored by PMUs in the Mainland system obtained from event#1.
As illustrated in Figure 6, the frequency deviation between the Capital and Yeongnam areas was less than 10 mHz during the first 0.5 s after the disturbance. This indicates that, despite some regional variations, fCOI provides a reliable and representative signal for inertia estimation, as it effectively captures the system’s overall frequency behavior during the early stages of the event.
The quantitative comparison results for all four events are summarized in Table 4. Across all mainland events, the measured RoCoF values from PMU data were consistently smaller than the theoretical RoCoF values calculated based only on synchronous generator inertia. This consistently lower measured RoCoF confirms the existence of residual inertia in every observed event. Moreover, larger differences between the estimated and measured RoCoF indicate stronger residual inertia effects in mitigating frequency decline.
Table 4.
Residual inertia estimation based on Mainland system events.
When comparing Events#1 and#4, both occurred during weekday lunchtime when system demand was relatively high. Event#1 involved a 1000 MW trip in Yeongdong, while Event#4 involved a 1422 MW trip in Yeongnam. Despite the larger disturbance size, Event#4 exhibited a higher synchronous inertia of 441 GWs compared to 332 GWs for Event#1, reflecting the increased system load. The residual inertia values for both events were between 159 GWs and 164 GWs.
When comparing Events#2 and#3, both occurred within hours of each other during the same night, with nearly identical disturbance sizes of 977 MW and 978 MW, respectively. The synchronous inertia decreased from 373 GWs in Event 2 to 339 GWs in Event#3, likely due to changes in unit dispatch. However, the residual inertia remained practically constant at 67 GWs and 68 GWs, indicating that residual inertia is largely unaffected under low-load nighttime conditions.
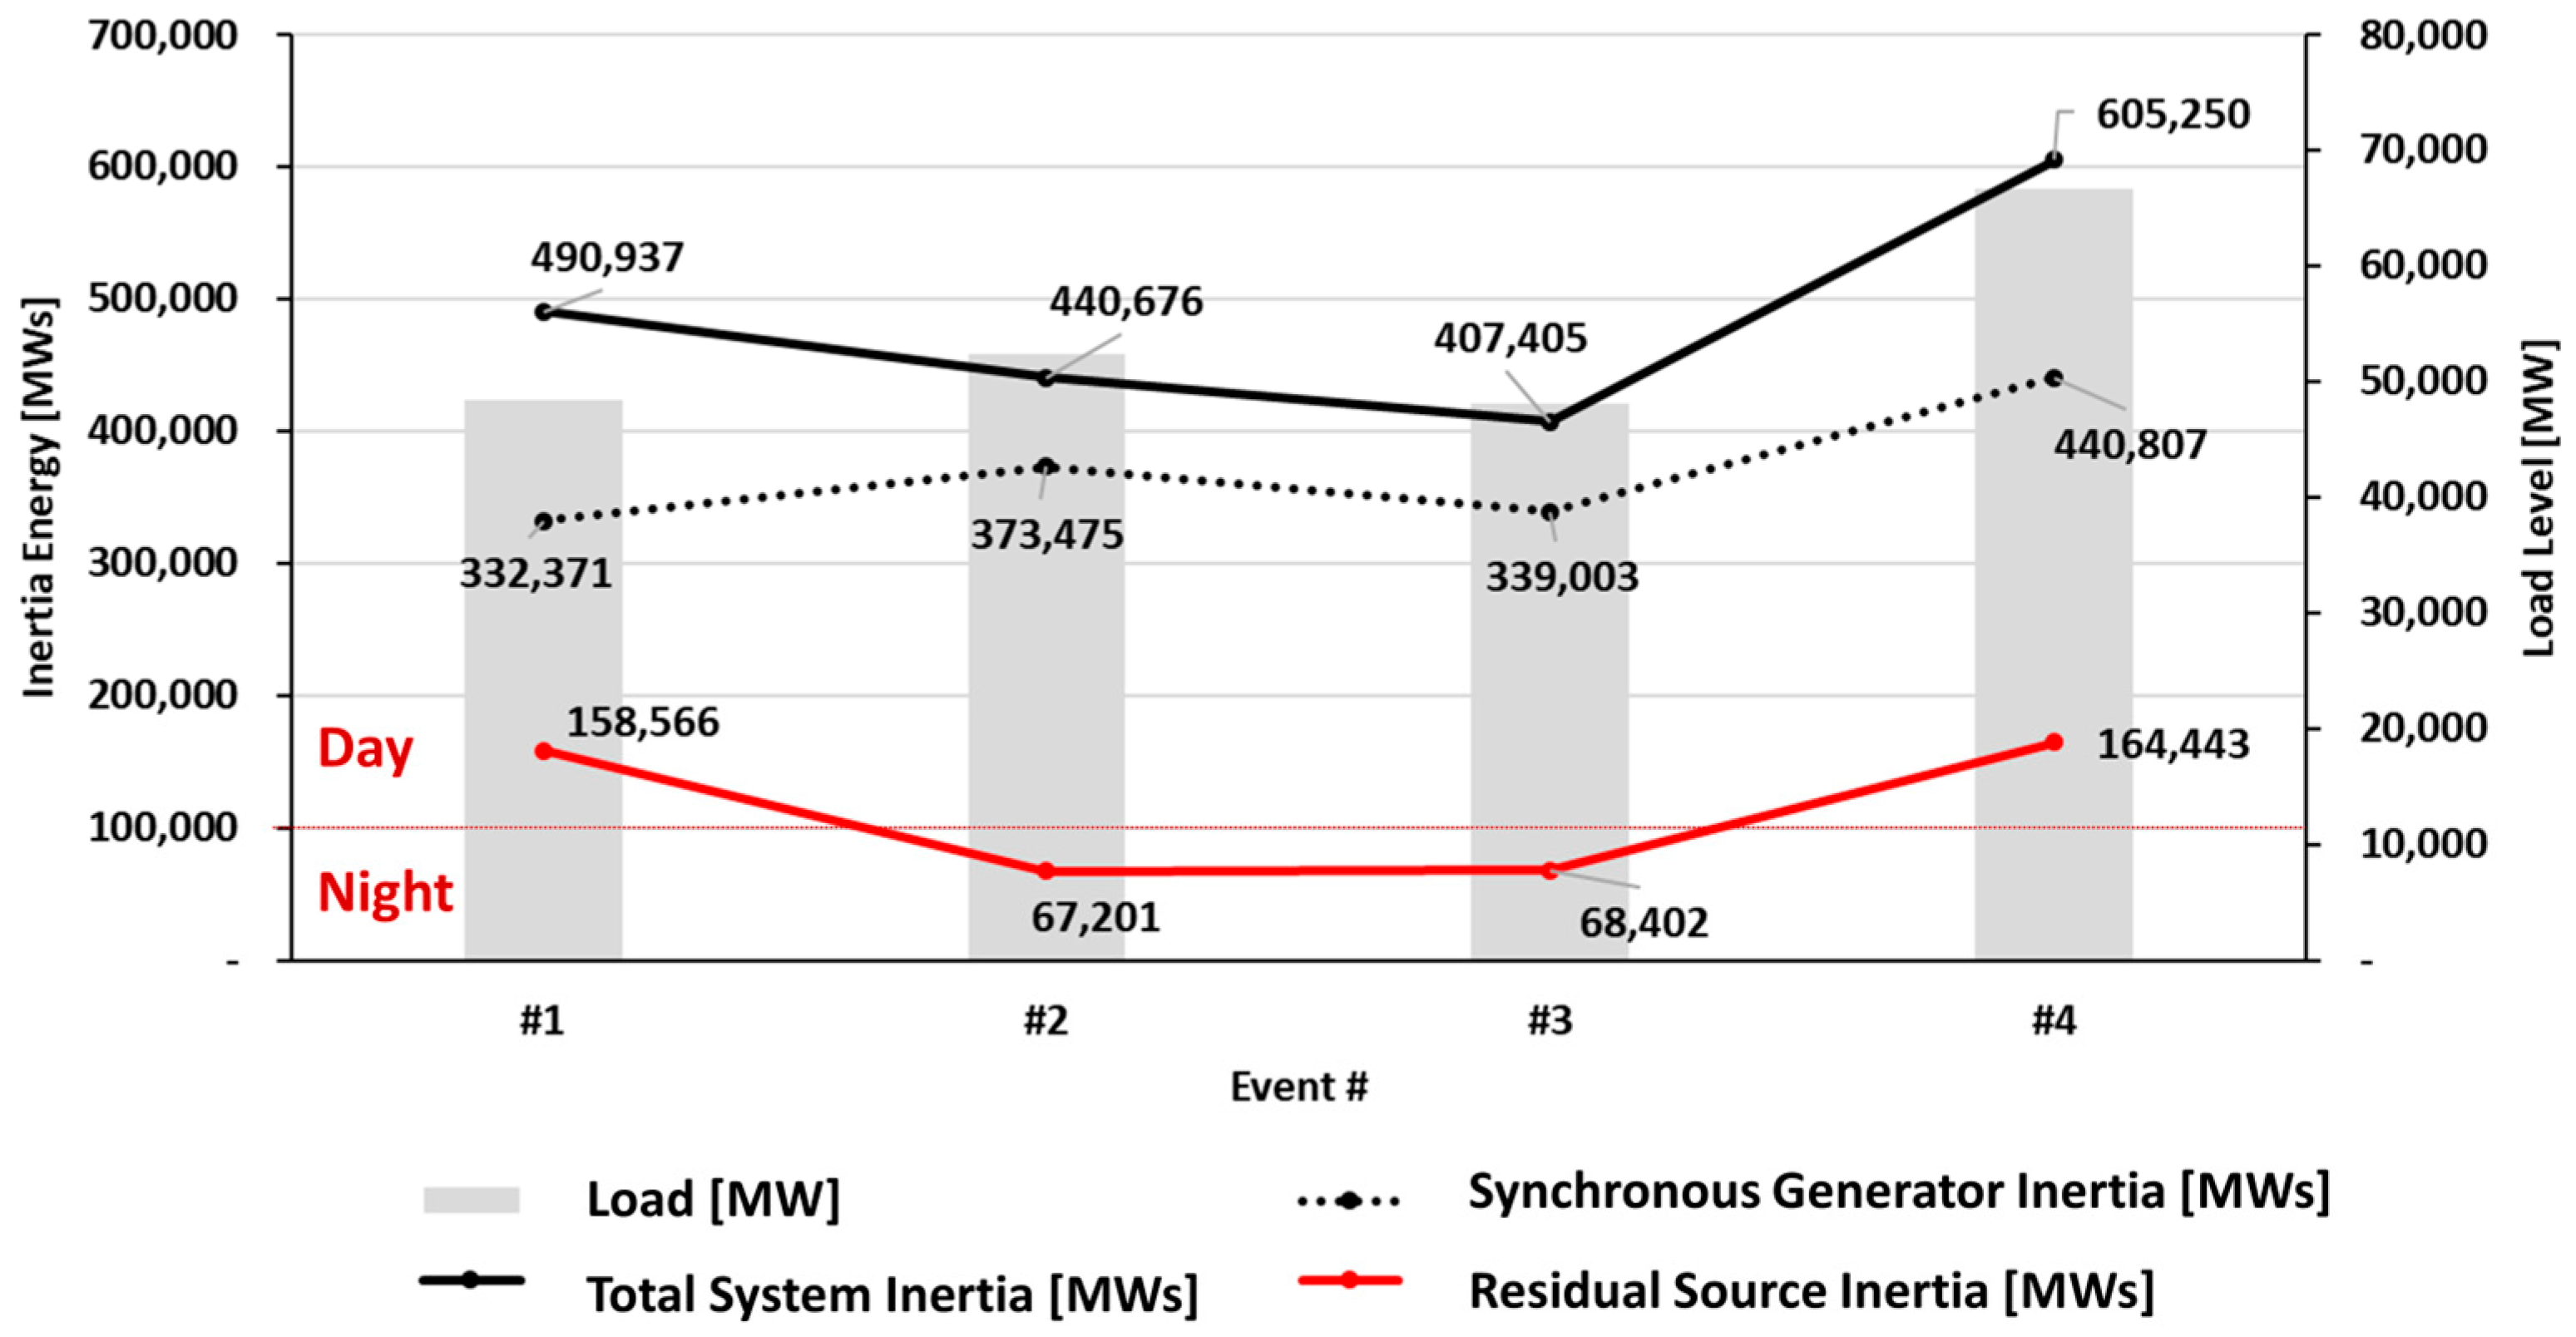
Figure 7 visualizes the relationship between system load, synchronous inertia, residual inertia, and total inertia across all four events. Despite the significant differences in event location and disturbance size between Event#1 and Event#4, the daytime residual inertia remains consistently high, indicating that time-of-day is the dominant factor. Similarly, the nighttime residual inertia remains stable and low for both Event#2 and Event#3, despite slight variations in synchronous inertia. The ratio between daytime and nighttime residual inertia is approximately 2.4 to 2.5 times higher during the day, clearly demonstrating the impact of motor load activity and system operational conditions on non-synchronous inertia availability.

Figure 7.
Residual inertia of the KEPCO mainland system during the daytime and nighttime.
For comparison, previous studies on the Great Britain power system have reported residual inertia ratios ranging from 8% to 25% with an average of approximately 18.18% [10]. In this study, the estimated residual inertia ratio for the KEPCO mainland system ranged from 15.25% to 32.30%, with an average of approximately 22.88%, reflecting system-specific characteristics. Therefore, while the KEPCO results are higher than those observed in Great Britain, this difference is not considered exceptionally unique but rather consistent with the particular nature of the KEPCO grid.
6. Discussion
6.1. Methodological Limitations and Sensitivity Considerations
The proposed method estimates residual inertia by comparing the estimated RoCoF, obtained from dynamic simulations considering only synchronous generator models, with the measured RoCoF calculated from PMU frequency data. The estimated RoCoF is determined by simulating the corresponding generator trip using synchronous generator dynamic models based on generator configuration information retrieved from SE data, which is updated every 2 s. This allows selecting generator status immediately before the disturbance, improving the accuracy of synchronous inertia modeling for the estimated RoCoF calculation. Meanwhile, the measured RoCoF reflects the actual system frequency response, including the influence of fast dynamics such as induction motor loads, inverter-based fast frequency response, and HVDC frequency control actions. However, factors such as PMU sampling resolution, signal filtering parameters, and possible model simplifications may still affect the accuracy of RoCoF calculations and consequently impact the residual inertia estimation results. These aspects represent inherent limitations of the proposed method and highlight areas where systematic sensitivity analyses could be conducted to further evaluate the method’s robustness under diverse operating conditions.
6.2. Operational Implications
The observed variations in residual inertia between daytime and nighttime periods provide valuable information for system operation planning. Since the estimated residual inertia is approximately 2.4 to 2.5 times higher during daytime hours, system operators may consider these tendencies when designing adaptive operational strategies. By analyzing additional disturbance events and expanding event-based inertia estimation, it may be possible to better characterize the residual inertia behavior in the KEPCO system. Such knowledge could support more informed reserve management, more efficient resource utilization, and improved system resilience under varying load and generation conditions.
6.3. Applicability to Other Power Systems
The proposed residual inertia estimation framework is applicable to other power systems with varying levels of PMU coverage and renewable energy integration. Since the method relies primarily on PMU measurements at system-level buses and EMS or state estimation data for synchronous generator modeling, it can be adopted even in systems with limited PMU deployment. Furthermore, the estimation process captures residual inertia contributions regardless of the specific mix of synchronous and non-synchronous resources, making it broadly applicable to modern power systems with diverse operating conditions.
6.4. Future Works
As a potential future research direction, machine learning (ML) approaches such as neural networks or random forests may be applied to dynamically predict residual inertia using real-time PMU and EMS data. Such methods could complement the proposed ratio-based framework by enhancing estimation accuracy under varying system operating conditions. Recent studies have demonstrated the applicability of ML techniques for power system monitoring and other data-driven applications [18,19,20,21], which may support further developments in residual inertia estimation.
7. Conclusions
This study proposed and demonstrated a practical method to estimate the residual inertia of the KEPCO power system by leveraging PMU data and EMS data. The method was designed to capture residual inertial contributions from non-synchronous sources—such as motor loads and converter-interfaced resources—which are not accounted for in conventional synchronous generator-based inertia assessments. The proposed methodology was first validated through detailed simulations on the KEPCO Island power system model, confirming its effectiveness across a wide range of residual-to-total inertia ratios. The validation of real cases was performed using actual generator trip events on both the KEPCO Island and mainland systems. The results show that residual inertia is not static, but highly dependent on operating conditions and the level of industrial motor activity. The results also confirm that relying solely on the inertia of synchronous generators would overestimate or underestimate actual system inertia depending on the time of day, leading to inaccurate stability assessments. The proposed estimation method allows operators to quantify time-varying system inertia in real-time, improving situational awareness and enabling more dynamic frequency control. This capability is particularly critical as the KEPCO system continues to increase its share of inverter-based renewable energy, which displaces conventional synchronous inertia.
Author Contributions
N.C. conceived and designed the research methodology, performed the system simulation, and wrote the paper; S.N. provided the PMU data and EMS data and contributed to the writing of the paper. All authors have read and agreed to the published version of the manuscript.
Funding
This research was supported by Korea Electric Power Research Institute (Grant number: CX72240027) and Korea Institute of Energy Technology Evaluation and Planning (KETEP), and the Ministry of Trade, Industry and Energy (MOTIE) of the Republic of Korea (Grant Number: RS-2024-00421642).
Data Availability Statement
The original contributions presented in this study are included in the article. Further inquiries can be directed to the corresponding author.
Conflicts of Interest
The authors declare no conflicts of interest.
Abbreviations
The following abbreviations are used in this manuscript:
| PMU | Phasor Measurement Unit |
| EMS | Energy Management System |
| SE | State Estimation |
| SCADA | Supervisory Control and Data Acquisition |
| fCOI | Center of Inertia Frequency |
| RES | Renewable Energy Source |
| HVDC | High Voltage Direct Current |
| FACTS | Flexible AC Transmission Systems |
| KEPCO | Korea Electric Power Corporation |
| K-WAMS | Korea Wide Area Monitoring System |
| RoCoF | Rate of Change of Frequency |
| PSSE | Power System Simulator for Engineering |
References
- The Government of the Republic of Korea. 2050 Carbon Neutral Strategy of the Republic of Korea. Republic of Korea, 2020. Available online: https://www.korea.kr/archive/expDocView.do?docId=39241 (accessed on 11 May 2024).
- Kwon, P.S. Transforming the Energy Sector to Reach Net-Zero. Republic of Korea, 2021. Available online: https://news.skecoplant.com/plant-tomorrow/1695 (accessed on 17 July 2024).
- Ministry of Trade, Industry and Energy of the Republic of Korea. The 10th Basic Plan for Long-Term Electricity Supply and Demand. Republic of Korea. 2023. Available online: https://www.motie.go.kr/kor/article/ATCLc01b2801b/68162/view (accessed on 11 July 2024).
- Castro Martínez, J.; Arnaltes, S.; Alonso Martínez, J.; Rodríguez Amenedo, J.L. Contribution of Wind Farms to the Stability of Power Systems with High Penetration of Renewables. Energies 2021, 14, 2207. [Google Scholar] [CrossRef]
- National Grid. Normal Infeed Loss Risk, GSR015. National Grid. 2014. Available online: https://www.neso.energy/industry-information/codes/sqss/modifications/gsr015-normal-infeed-loss-risk (accessed on 15 May 2024).
- Fingrid. TSO Report on Balancing in Accordance with Article 60 of Commission Regulation (EU) 2017/2195 of 23 November 2017 Establishing a Guideline on Electricity Balancing. Fingrid. February 2022. Available online: https://www.fingrid.fi/globalassets/dokumentit/fi/sahkomarkkinat/reservit/ebgl60-tso-report-on-balancing-2022.pdf (accessed on 13 May 2024).
- ENTSO-E. Future System Inertia 2. ENTSO-E. 2017. Available online: https://www.statnett.no/globalassets/for-aktorer-i-kraftsystemet/utvikling-av-kraftsystemet/nordisk-frekvensstabilitet/future-system-inertia-phase-2.pdf (accessed on 11 July 2024).
- Shao, H.; Cai, X.; Zhou, D.; Li, Z.; Zheng, D.; Cao, Y.; Wang, Y.; Rao, F. Equivalent Modeling and Comprehensive Evaluation of Inertia Emulation Control Strategy for DFIG Wind Turbine Generator. IEEE Access 2019, 7, 64798–64811. [Google Scholar] [CrossRef]
- Arani, A.N.; El-Saadany, E. Implementing Virtual Inertia in DFIG-Based Wind Power Generation. IEEE Trans. Power Syst. 2013, 28, 1373–1384. [Google Scholar] [CrossRef]
- Ashton, P.M.; Saunders, C.S.; Taylor, G.A.; Carter, A.M.; Bradley, M.E. Inertia Estimation of the GB Power System Using Synchrophasor Measurements. IEEE Trans. Power Syst. 2015, 30, 701–709. [Google Scholar] [CrossRef]
- Ashton, P.M.; Taylor, G.A.; Carter, A.M.; Bradley, M.E.; Hung, W. Application of Phasor Measurement Units to Estimate Power System Inertial Frequency Response. In Proceedings of the IEEE Power & Energy Society General Meeting, Vancouver, BC, Canada, 21–25 July 2013; pp. 1–5. [Google Scholar]
- Shiroei, M.; Mohammadi-Ivatloo, B.; Parniani, M. Low-Order Dynamic Equivalent Estimation of Power Systems Using Data of Phasor Measurement Units. Int. J. Electr. Power Energy Syst. 2016, 74, 134–141. [Google Scholar] [CrossRef]
- Duong, D.T.; Uhlen, K.; Jansson, E.A. Estimation of Hydro Turbine–Governor System’s Transfer Function from PMU Measurements. In Proceedings of the IEEE Power & Energy Society General Meeting, Boston, MA, USA, 17–21 July 2016; pp. 1–5. [Google Scholar]
- Lara-Jimenez, J.D.; Ramírez, J.M.; Mancilla-David, F. Allocation of PMUs for Power-System-Wide Inertial Frequency Response Estimation. IET Gen. Transm. Distrib. 2017, 11, 2902–2911. [Google Scholar] [CrossRef]
- IEEE C37.118.2-2011; IEEE Standard for Synchrophasor Data Transfer for Power Systems. IEEE: New York, NY, USA, 2011.
- Kundur, P. Power System Stability and Control; McGraw Hill: New York, NY, USA, 1994; pp. 109–115. [Google Scholar]
- Anderson, P.M.; Mirheydar, M. A Low-Order System Frequency Response Model. IEEE Trans. Power Syst. 1990, 5, 720–729. [Google Scholar] [CrossRef]
- El Aeraj, O.; Leghris, C. Intrusion Detection System Based on an Intelligent Multilayer Model Using Machine Learning. J. Artif. Intell. Technology. 2024, 4, 332–341. [Google Scholar]
- Shadi, M.R.; Ameli, M.T.; Azad, S. A real-time hierarchical framework for fault detection, classification, and location in power systems using PMUs data and deep learning. Int. J. Electr. Power Energy Syst. 2022, 134, 107399. [Google Scholar] [CrossRef]
- Touil, M.; Bahatti, L.; Elmagri, A. Automatic sleep quality analysis using an artificial intelligence algorithm and EEG signal processing. J. Artif. Intell. Technol. 2024, 4, 153–159. [Google Scholar] [CrossRef]
- Fang, T.; Hui, Z.; Rey, W.P.; Yang, A.; Liu, B.; Xie, Z. Digital Restoration of Historical Buildings by Integrating 3D PC Reconstruction and GAN Algorithm. J. Artif. Intell. Technol. 2024, 4, 179–187. [Google Scholar] [CrossRef]


Disclaimer/Publisher’s Note: The statements, opinions and data contained in all publications are solely those of the individual author(s) and contributor(s) and not of MDPI and/or the editor(s). MDPI and/or the editor(s) disclaim responsibility for any injury to people or property resulting from any ideas, methods, instructions or products referred to in the content. |
© 2025 by the authors. Licensee MDPI, Basel, Switzerland. This article is an open access article distributed under the terms and conditions of the Creative Commons Attribution (CC BY) license (https://creativecommons.org/licenses/by/4.0/).