1. Introduction
Self-assembly—the spontaneous organization of molecules into ordered structures without external direction—is a fundamental process underlying both biological systems and advanced material design [
1,
2]. Arginine is particularly notable among self-assembling biomolecules due to its guanidinium group and positive charge, which enable a diverse array of non-covalent interactions including hydrogen bonding, cation–
, and
–
stacking [
3,
4]. These unique properties make arginine a powerful model for exploring the principles of molecular assembly, with broad implications for nanotechnology, biomaterials, and biochemical research [
5,
6].
Extensive research has highlighted the central role of the guanidinium group in arginine’s self-assembly behavior. Its planar geometry and delocalized charge facilitate strong and directional hydrogen bonding, which stabilizes supramolecular architectures in both aqueous and non-aqueous environments [
7,
8,
9,
10,
11,
12,
13]. In protein structures, guanidinium moieties form key hydrogen bonds and engage in
–
stacking interactions with aromatic residues, aiding in protein folding and nucleic acid binding [
14,
15,
16]. Electrostatic interactions also play a critical role, as guanidinium forms salt bridges with carboxylates and phosphates, while hydrophobic methylene segments further support aggregation [
17,
18,
19,
20]. Numerous studies have explored how pH, concentration, and temperature modulate these interactions, including the hydrotropic properties of arginine and its dual role in preventing or promoting protein aggregation under varying conditions [
21,
22,
23,
24]. Applications in drug delivery, tissue engineering, and pharmaceutical stabilization further underscore arginine’s multifunctionality [
25,
26,
27,
28]. Recent studies have demonstrated the expanding role of machine learning and cognitive computing in biophysical modeling and soft matter systems, including bio-inspired soft robotic platforms for gastrointestinal applications [
29] and intelligent flow control in flexible mechanical systems [
30]. These works reflect a broader computational trend that complements molecular-level investigations such as the current work, which focus on atomistic resolution and concentration-dependent thermodynamic behavior in biomolecular systems. Recent years have also seen the emergence of data-driven and coarse-grained computational frameworks aimed at understanding peptide aggregation. For example, AI-expert employs machine learning integrated with MD to design self-assembling peptide sequences [
31], while hybrid coarse-grained models have been applied to predict phase behavior in intrinsically disordered and multi-domain proteins [
32]. Similarly, engineering approaches combining MD with machine learning have further optimized the self-assembly of peptide biomaterials [
33].
Despite these advances, a detailed understanding of how thermodynamic and structural parameters co-regulate arginine’s self-assembly—particularly as a function of concentration—remains incomplete. While several experimental and theoretical studies have explored aspects of arginine’s aggregation behavior, many focus on qualitative descriptions or specific interactions without establishing quantitative links to global structural or thermodynamic properties. For example, Das et al. demonstrated that supramolecular assemblies of arginine inhibit protein aggregation, but did not evaluate concentration-dependent thermodynamic transitions [
22]. Smirnova et al. observed arginine-induced protein aggregation and supramolecular transformations, yet lacked detailed spatial or energetic resolution [
23]. Similarly, Mamsa and Meloni reported that arginine-rich peptides modulate amyloid aggregation through hydrogen bonding, but did not systematically investigate configurational compaction or heat capacity trends [
34]. These gaps highlight the need for simulation-based approaches that can bridge molecular interaction data with macroscopic observables across concentration regimes.
This study investigates the concentration-dependent self-assembly behavior of arginine in aqueous environments using molecular dynamics simulations. The selection of arginine over other basic amino acids is based on its unique physicochemical properties. Arginine’s guanidinium group is capable of forming stable like-charge pairs through planar stacking and hydration-mediated interactions, a phenomenon not observed with lysine or histidine [
3]. This effect contributes to arginine’s propensity for molecular condensation, aggregation, and phase separation. Comprehensive reviews also describe how guanidinium–guanidinium pairing operates across chemical and biological environments, supporting its distinctive role in protein–protein interactions and cellular uptake processes [
4]. These properties render arginine an especially suitable model for investigating concentration-dependent self-assembly mechanisms in aqueous systems. The concentration range selected in this study (26–605 mM) spans dilute to highly concentrated regimes, enabling exploration of arginine self-association from isolated to cooperative and saturated states. Rather than modeling a specific protein environment, this range was chosen to uncover general thermodynamic trends that underlie arginine-driven condensation in aqueous systems. While arginine plays vital roles in DNA-binding proteins, transcription factors, and signal transduction cascades, our aim is to identify universal self-assembly mechanisms arising from guanidinium-based interactions, which are relevant across many classes of biomolecules. Analysis of key thermodynamic and structural parameters—including heat capacity, hydrogen bonding networks, and radius of gyration—reveals critical thresholds that govern molecular clustering and supramolecular stability. Visual snapshots and normalized spatial histograms offer both qualitative and quantitative validation of aggregation patterns. This integrative approach enhances our understanding of arginine’s self-assembly mechanisms and provides insights relevant to biomolecular organization and the design of supramolecular materials.
3. Results and Discussion
The influence of concentration on the self-assembly behavior of arginine molecules is systematically examined in this study. All simulations were performed at a constant temperature of 300 K, spanning more than 23 concentrations ranging from 26 mM to 605 mM. This temperature (300 K, approximately 27 °C) was selected as a standard reference point commonly used in molecular dynamics simulations to ensure comparability with previous studies [
41,
42]. While slightly below physiological temperature (around 310 K), it preserves the relevant physicochemical trends and avoids unnecessary noise in sampling thermodynamic quantities.
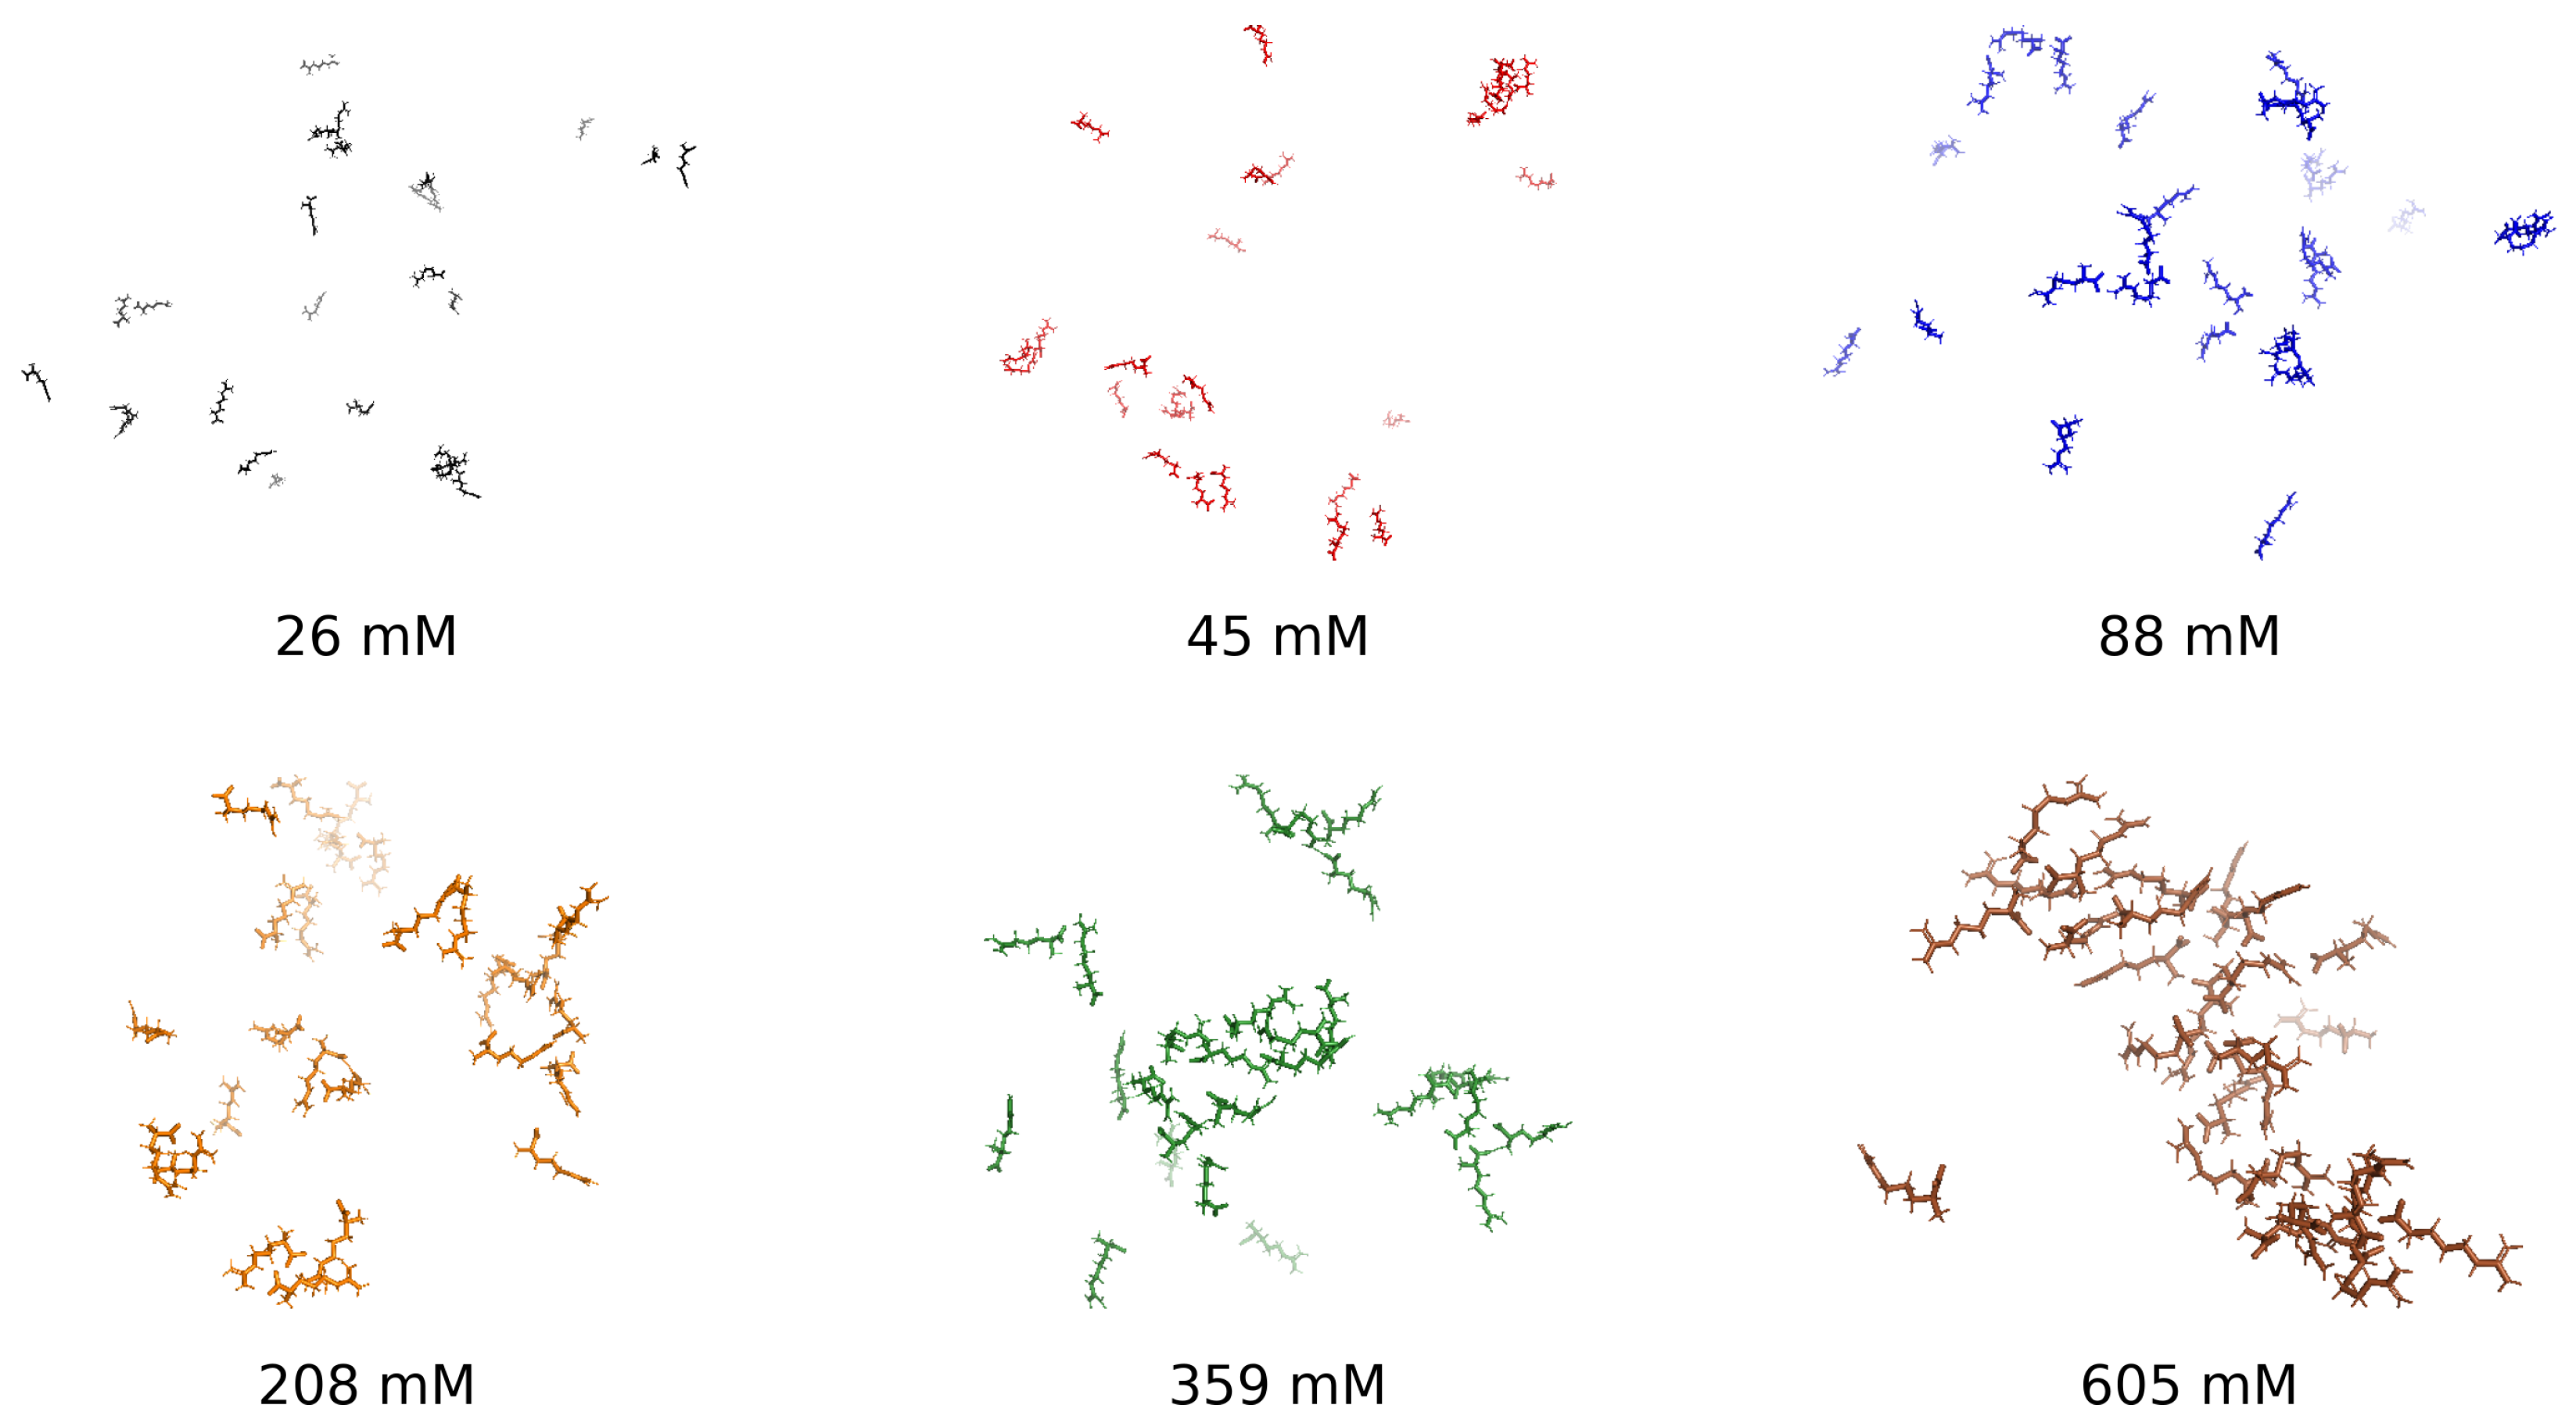
To establish a visual foundation for the concentration-dependent behavior of arginine in aqueous solution,
Figure 1 presents representative molecular snapshots at six concentrations, ranging from dilute (26 mM) to highly crowded (605 mM). These images qualitatively illustrate the progressive self-association behavior captured in the structural and thermodynamic analyses that follow. At low concentrations, the system remains dispersed, with arginine molecules interacting minimally. Intermediate concentrations reveal cooperative clustering, while high concentrations produce densely packed aggregates, suggesting steric saturation and restricted configurational dynamics. This progression forms the conceptual basis for a three-regime aggregation model—dilute, cooperative, and saturated—quantitatively explored through radial distribution functions, hydrogen bonding statistics, radius of gyration, and thermodynamic response functions.
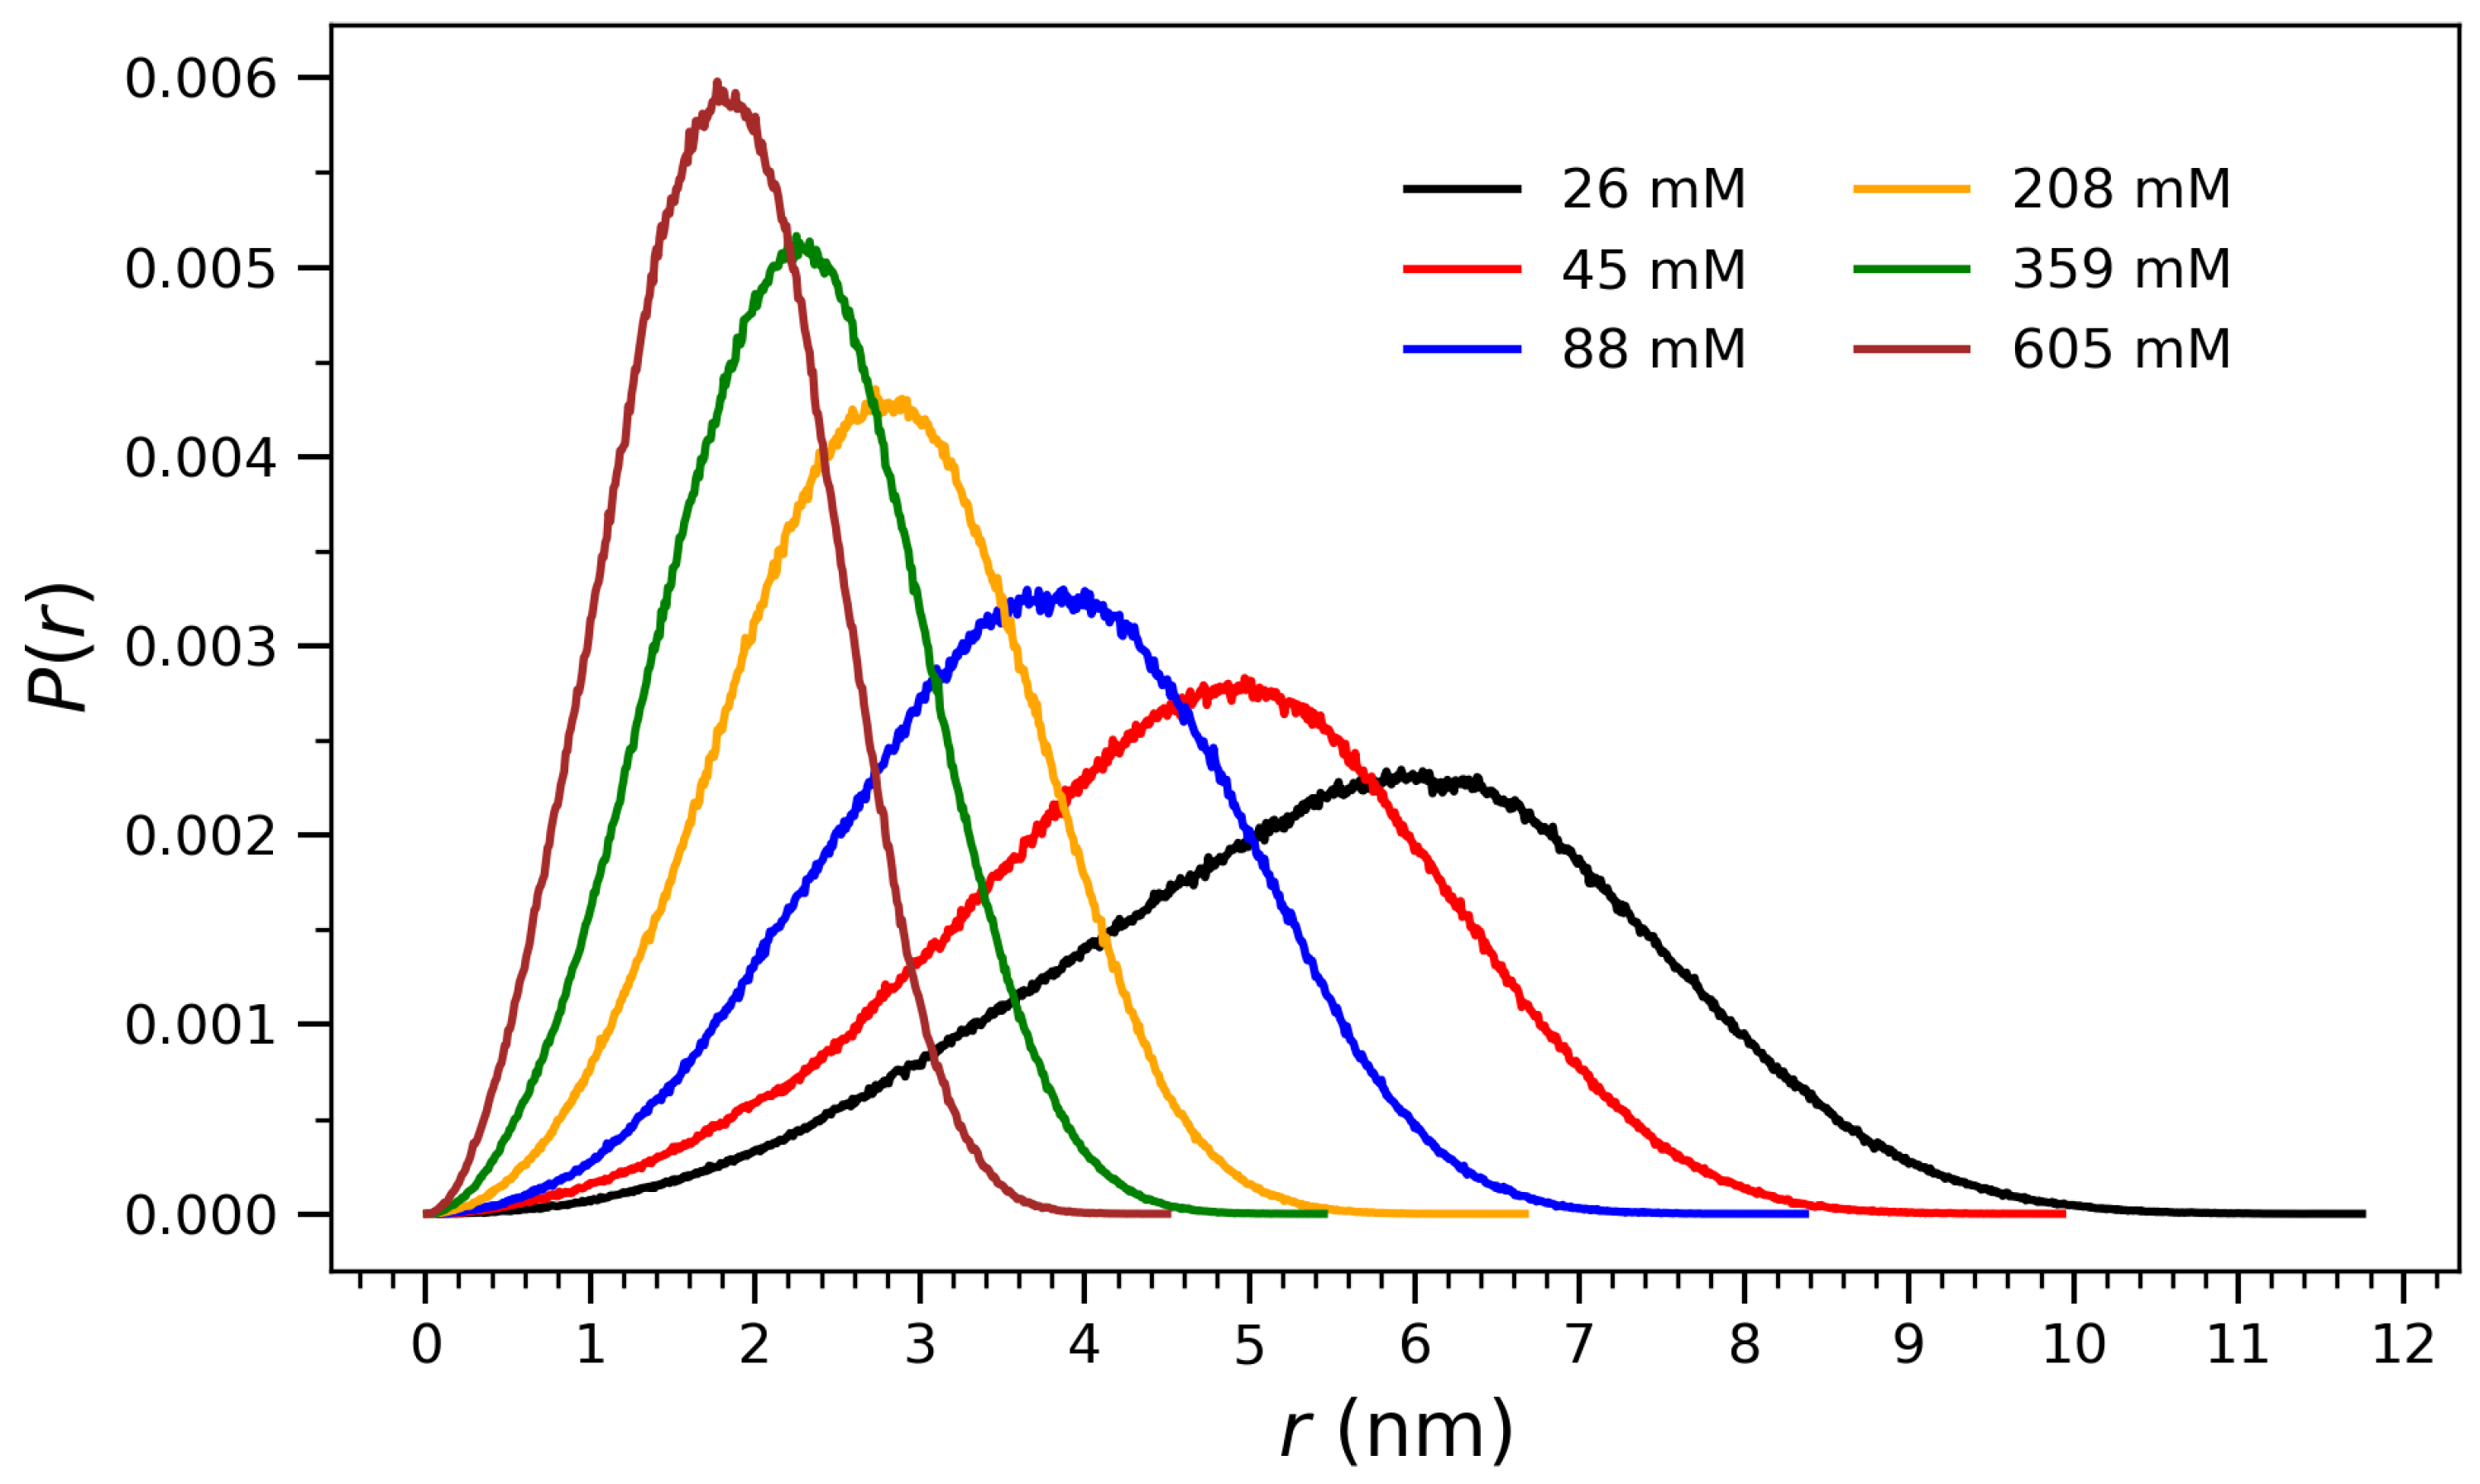
To quantify the structural evolution observed in
Figure 1, radial distribution profiles
of atomic distances from the center of mass were computed at each concentration.
Figure 2 presents normalized distributions
of radial distances from the center of mass for arginine molecules at various concentrations, ranging from 26 mM to 605 mM. These distributions provide structural insight into the spatial organization of the molecular ensembles and their compaction behavior as a function of concentration. At low concentrations (e.g., 26 mM and 45 mM), the
profiles are broad and centered at higher
r values, indicating diffuse and extended conformations in which the molecules are more spatially dispersed. As the concentration increases, the distributions shift toward smaller
r and become narrower, reflecting progressive compaction and crowding effects. At the highest concentration (605 mM), the distribution exhibits a sharp peak near 2 nm, consistent with the formation of a densely packed aggregate and a structurally well-defined core. This behavior is indicative of a cooperative collapse mechanism, in which increasing concentration enhances intermolecular interactions—such as guanidinium-mediated hydrogen bonding and electrostatic attraction—leading to structural reorganization around the center of mass. The observed trend will be discussed through the interpretation drawn from
Figure 3,
Figure 4,
Figure 5 and
Figure 6, where both the radius of gyration and hydrogen bonding exhibit saturation behavior characteristic of phase-like aggregation.
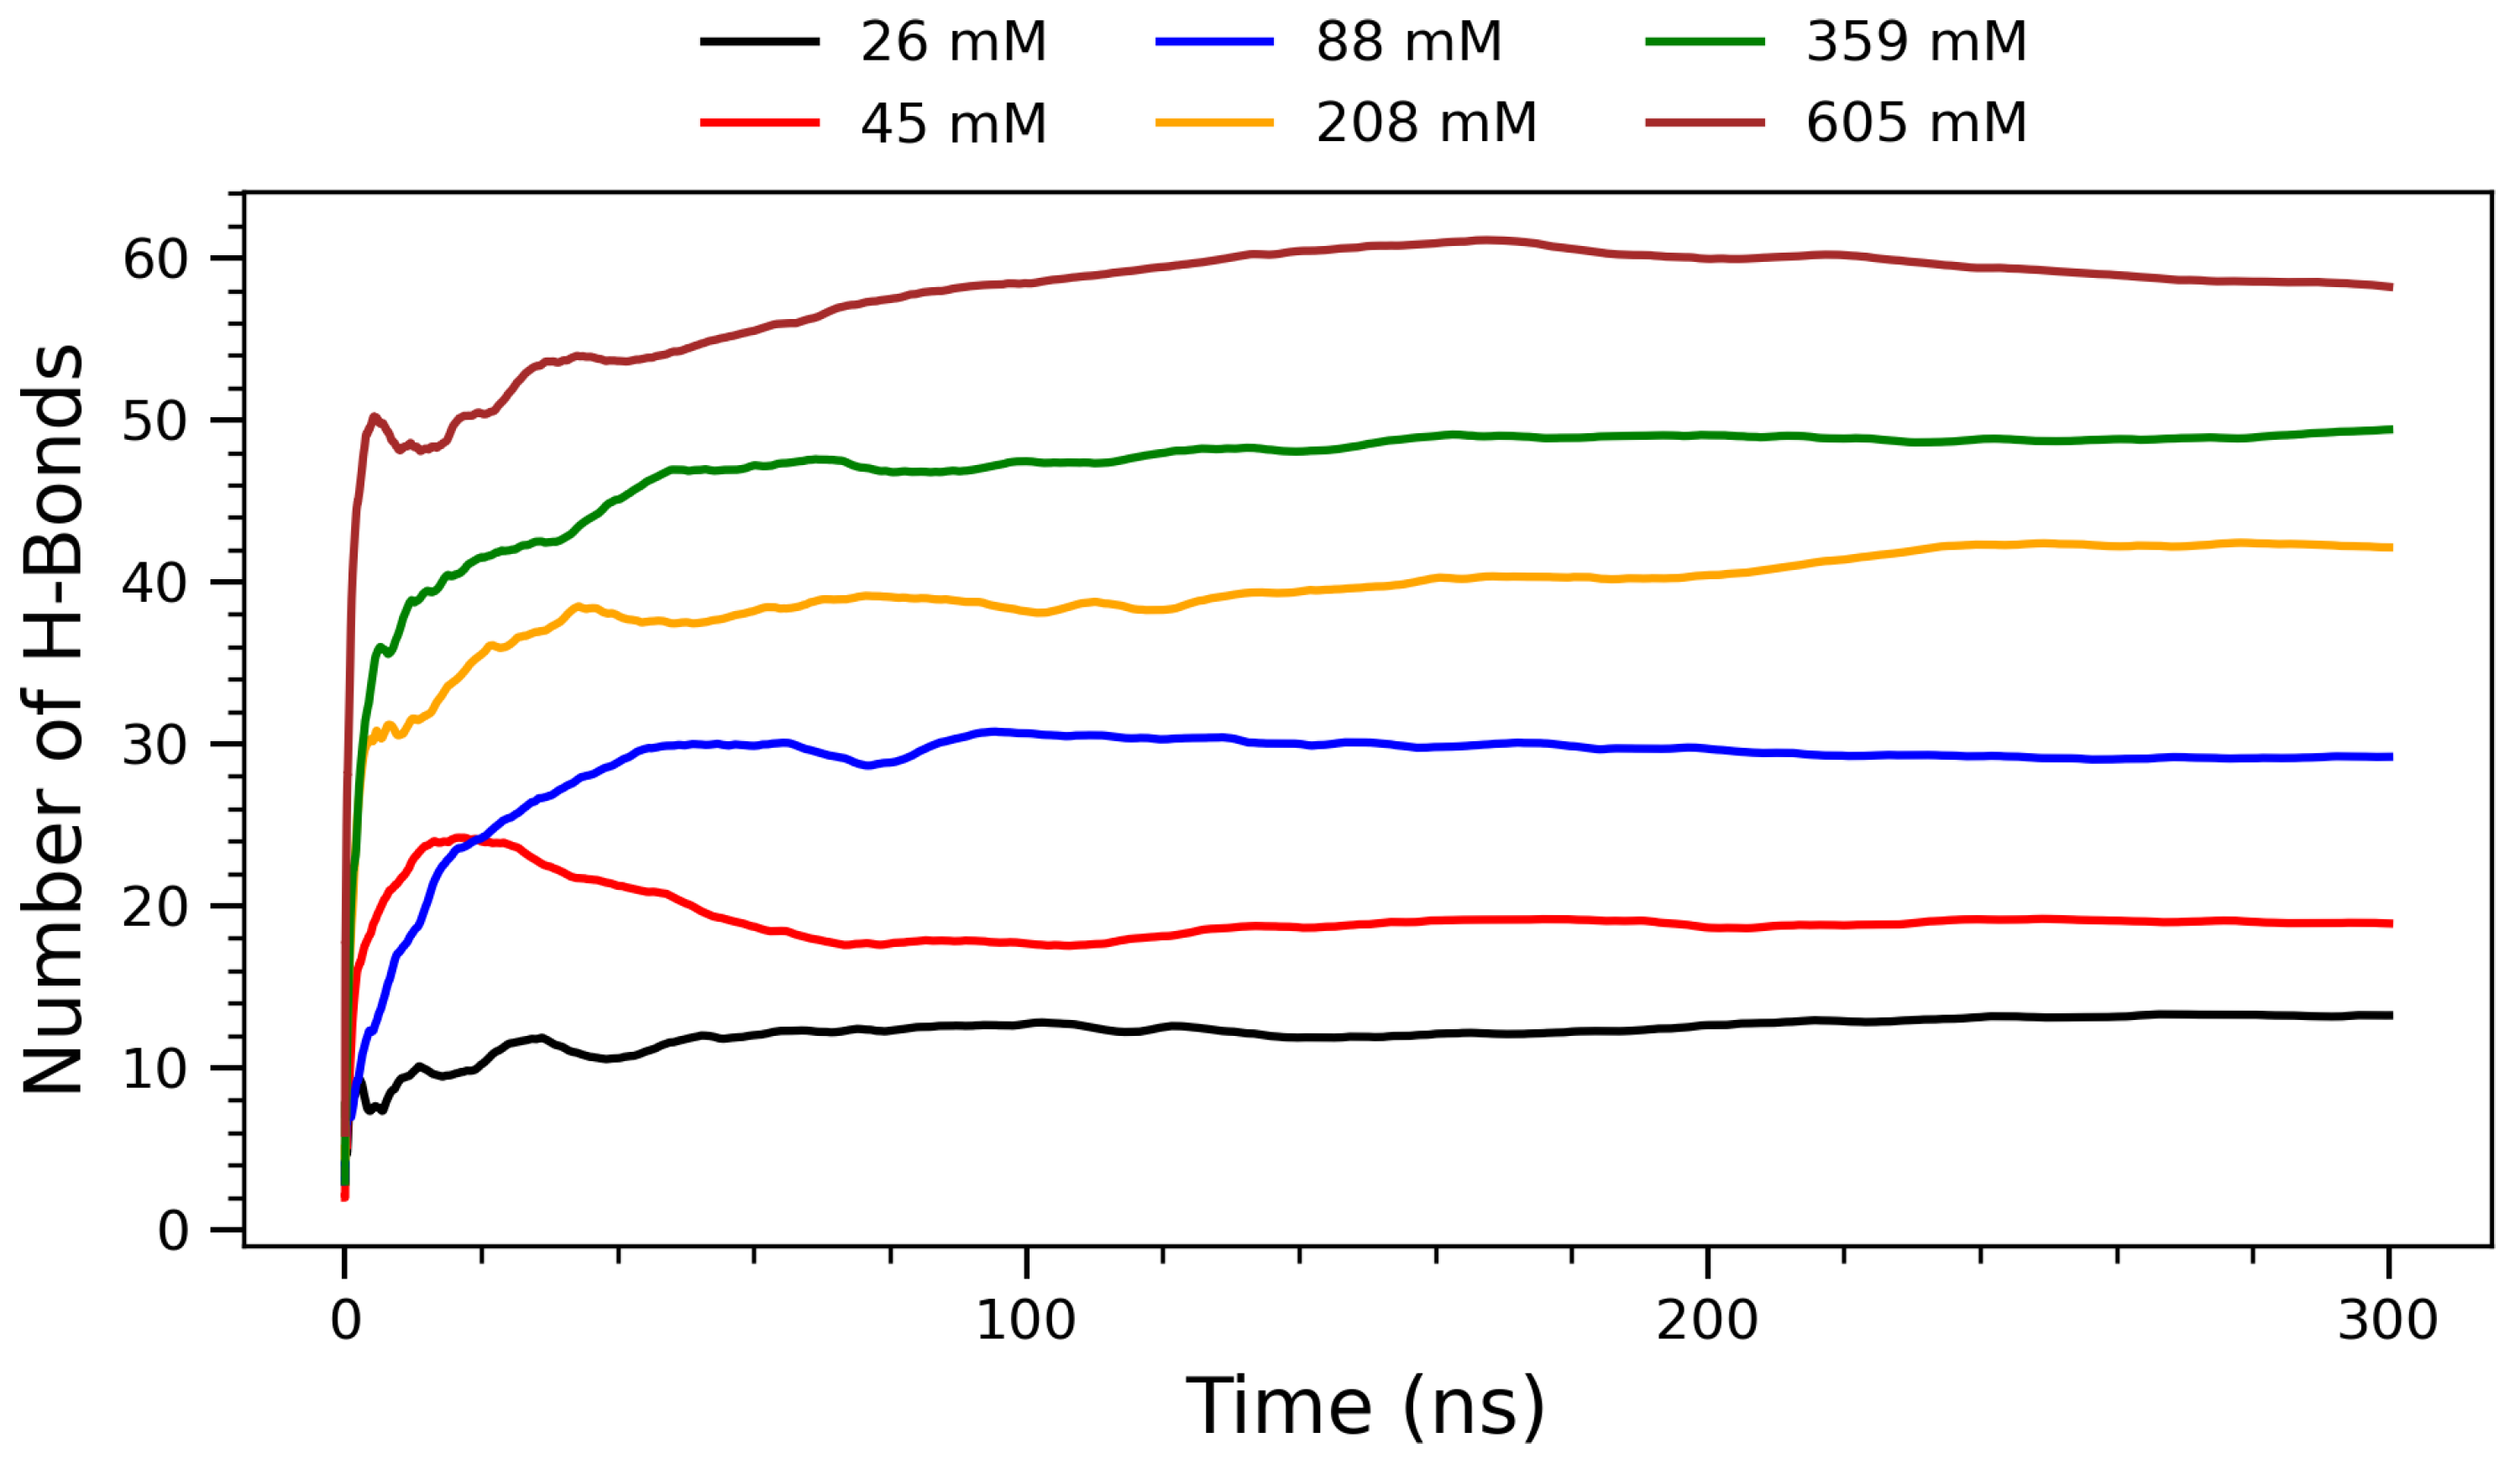
To further characterize the concentration-dependent interactions, the time evolution of hydrogen bond formation was examined across the simulations.
Figure 3 shows the evolution of hydrogen bonding between arginine molecules over a 300 ns simulation period for six representative concentrations. The number of H-bonds increases with concentration, reflecting a progressive enhancement in intermolecular interactions and molecular crowding. At lower concentrations (26 mm and 45 mM), H-bond formation is limited due to greater molecular separation and dominance of solute–solvent interactions. The intermediate concentration of 88 mM exhibits a transitional behavior: while its H-bond count is noticeably higher than at 45 mM, it saturates more quickly than the higher concentrations, suggesting that moderate crowding begins to enhance H-bonding efficiency without inducing significant kinetic delays. As the concentration increases (208 mM and above), arginine molecules approach each other more frequently, allowing their guanidinium groups to participate in more extensive and directional hydrogen bonding. This concentration-dependent increase in H-bonding is chemically significant, as the guanidinium group of arginine is uniquely suited to form stable, charge-assisted hydrogen bonds due to its planar geometry and delocalized positive charge [
11,
43]. Biologically, such interactions are critical in stabilizing protein tertiary and quaternary structures, as well as mediating protein–DNA and protein–membrane interactions. The ability of arginine residues to form persistent H-bond networks also plays a role in the assembly of amyloid fibrils and in modulating protein aggregation behavior [
44]. These observations are supported by experimental findings showing that arginine-rich peptides can modulate amyloid-beta and tau aggregation by forming hydrogen bond-rich interfaces, thus reducing cytotoxicity [
34]. From a supramolecular chemistry perspective, the formation of H-bonded clusters at higher concentrations suggests that arginine can act as a building block for self-assembled nanostructures [
25]. This property is particularly relevant for the design of functional biomaterials, drug delivery systems, and peptide-based hydrogels, where the stability and reversibility of hydrogen bonds are harnessed to create dynamic, responsive architectures [
26]. The plateau observed in each curve indicates that the systems reach structural equilibrium within the simulation timescale. Notably, at the highest concentration (605 mM), the H-bond count saturates, suggesting a limit in bonding capacity due to spatial constraints or solvent exclusion. This trend supports the hypothesis that arginine self-assembly is driven by a delicate balance between enthalpic (H-bonds) and entropic (hydration, packing) factors.
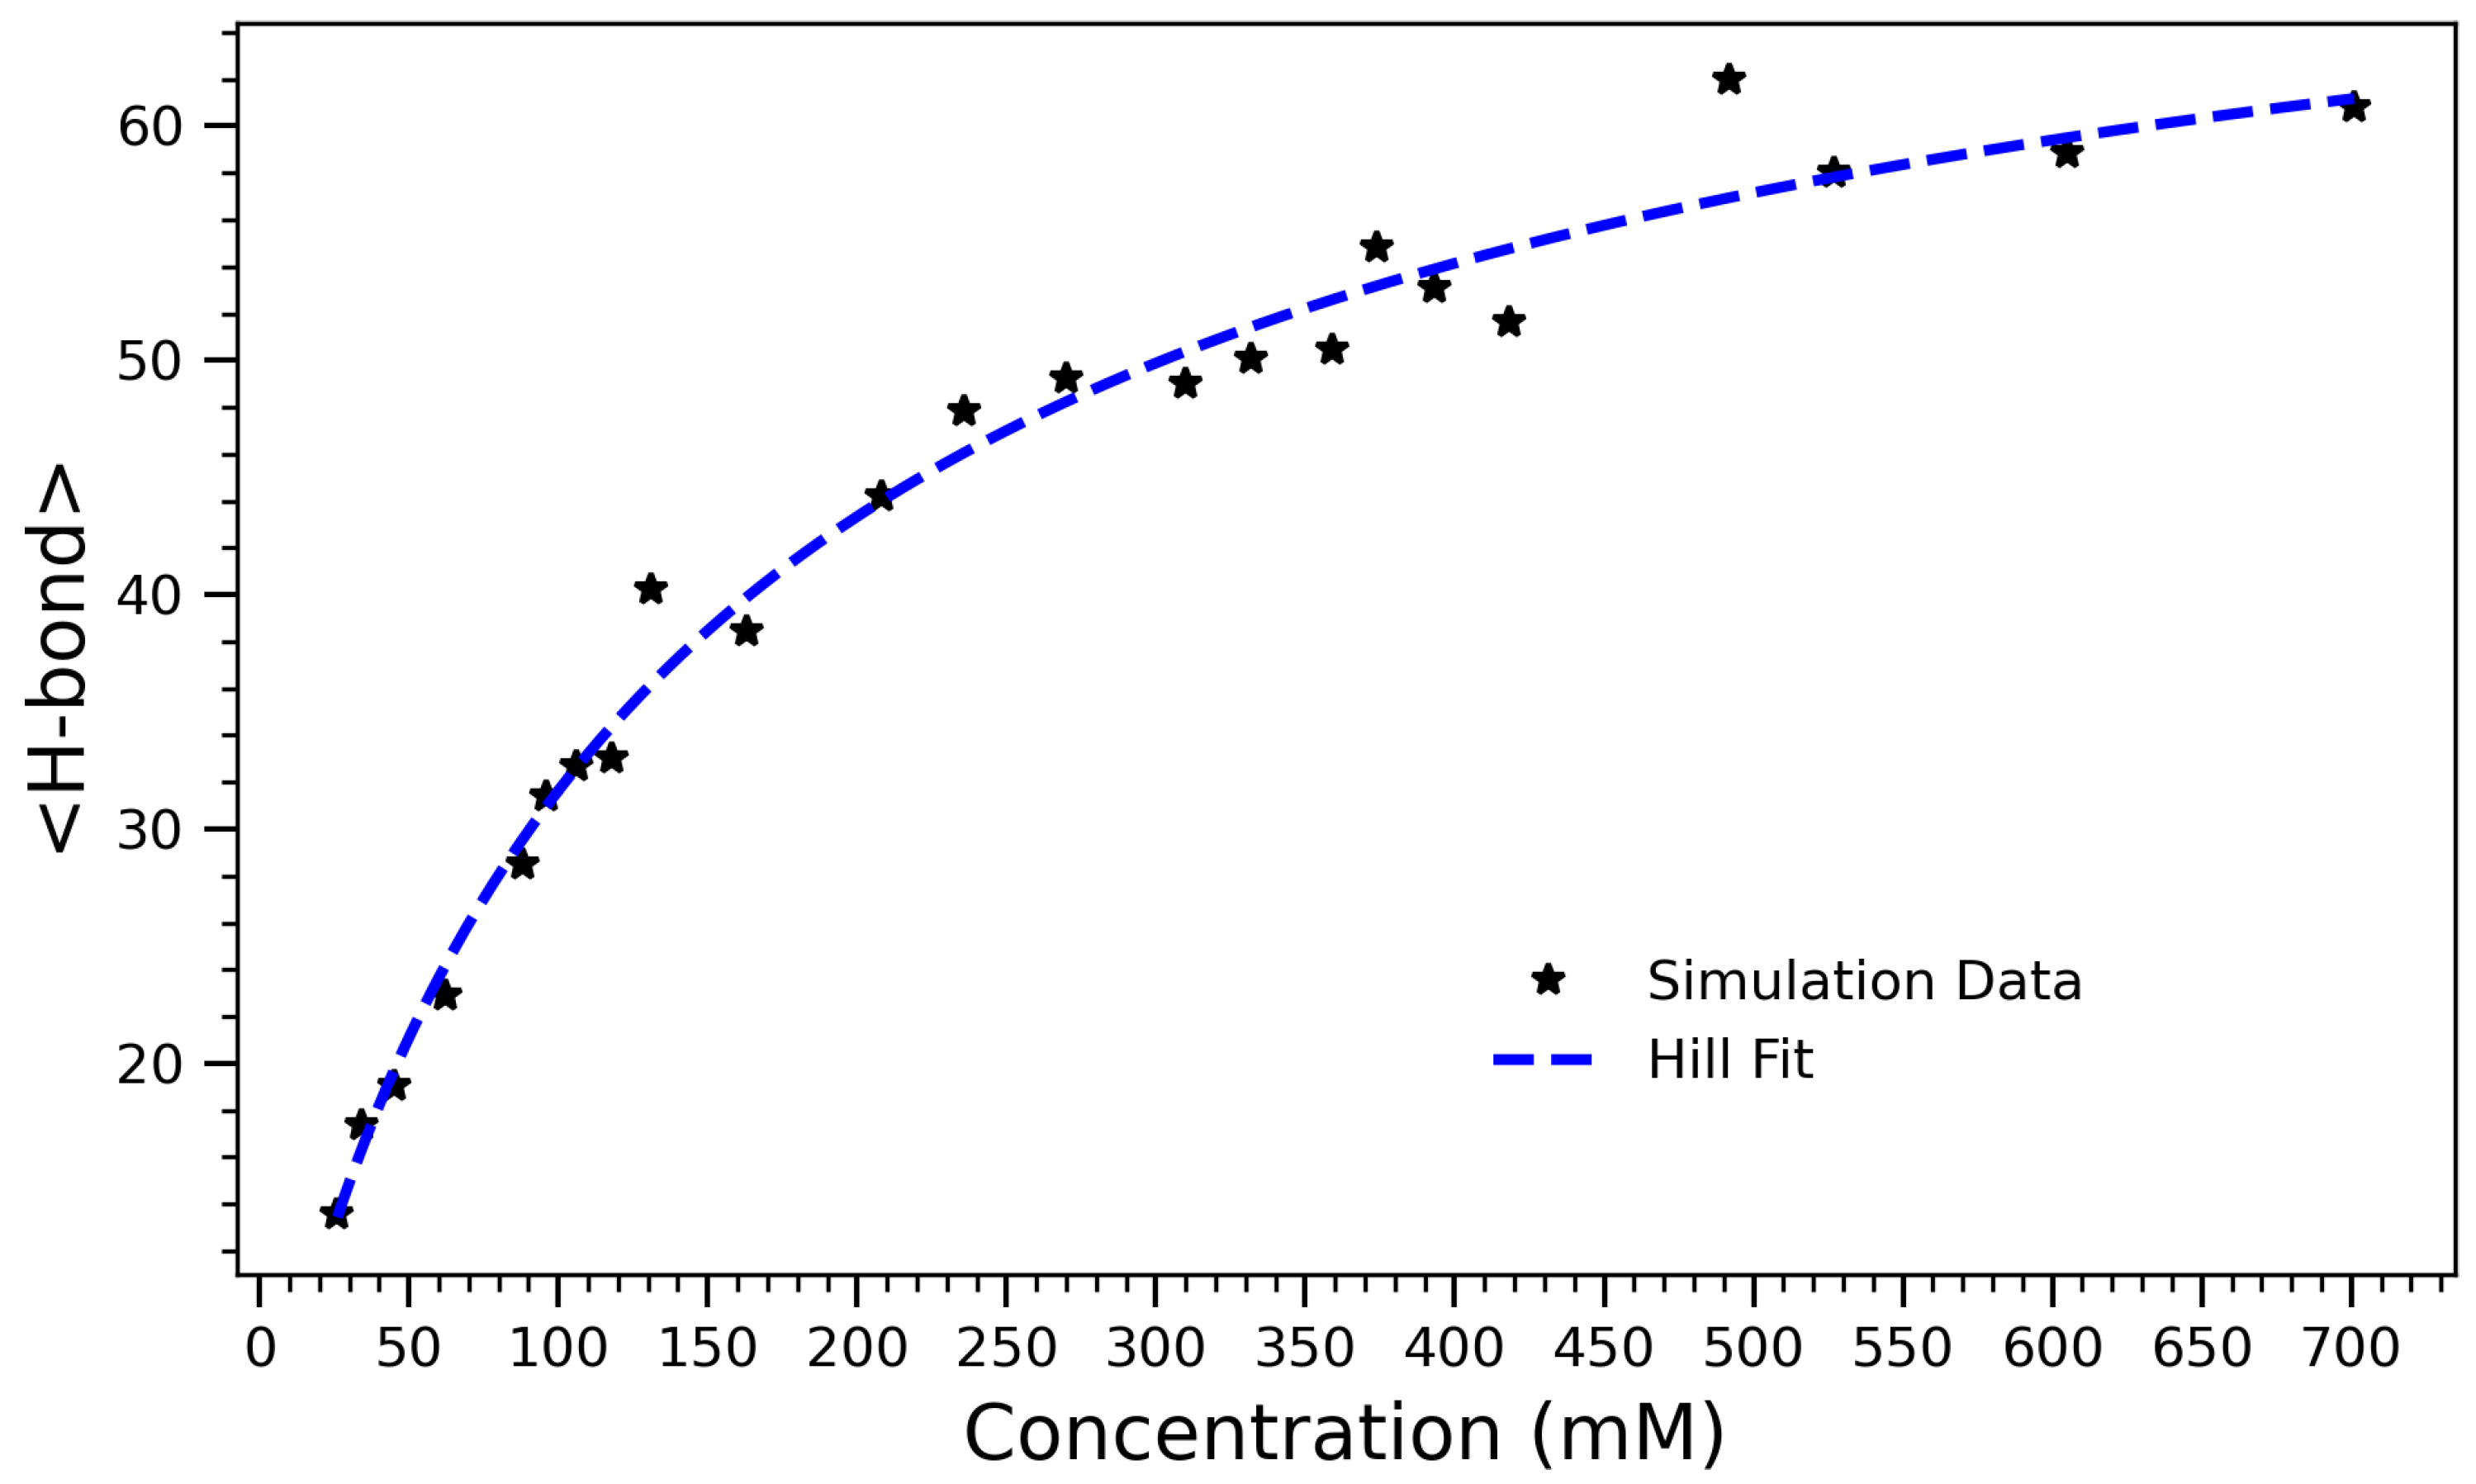
To capture the overall effect of concentration on hydrogen bonding, the average number of hydrogen bonds formed in each system over the course of the simulation was computed.
Figure 4 presents the number of hydrogen bonds formed in arginine solutions as a function of concentration. The data exhibit a characteristic sigmoidal trend, reflecting a transition from a sparsely interactive regime at low concentrations to a saturated, highly bonded state at higher concentrations. The system’s behavior is well-described by the Hill equation [
45],
which models the concentration-dependent saturation of binding or interaction sites. Here,
A represents the maximum achievable number of hydrogen bonds,
K is the concentration at which half of this maximum is reached, and
n is the Hill coefficient, which quantifies the degree of cooperativity. The fitted parameters are
,
, and
. In the context of crowding and self-assembly, the Hill coefficient
n reflects the sharpness of the structural transition rather than true cooperative binding. Values
indicate gradual, saturating behavior, while
reflects sharper, more collective transitions. This value indicates that H-bond formation increases sub-linearly with concentration, likely due to spatial hindrance at high density. In other words, as the molecular environment becomes increasingly crowded, the system approaches a saturation point where further bonding is physically constrained. The Hill model provides both a good quantitative fit and an interpretable framework for describing the self-associative behavior of arginine in aqueous environments. The half-maximal value
suggests that significant aggregation and H-bond formation occur even at moderate concentrations, consistent with earlier structural and thermodynamic observations (e.g., contact number and radius of gyration trends). These results support a three-phase interpretation of the system: an initial low-concentration regime with limited interactions, a cooperative buildup phase where hydrogen bonding rapidly increases, and a high-concentration plateau governed by crowding and spatial saturation.
It is recognized that high-concentration simulations may be susceptible to crowding-induced artifacts and enhanced charge–charge interactions, particularly in systems rich in guanidinium groups. In such environments, limited dielectric screening and constrained solvent access can lead to exaggerated electrostatic attraction, potentially lowering the apparent aggregation threshold. While the current study does not include explicit control simulations (e.g., charge-neutralized analogs, different dielectric environments), it has mitigated concerns by carefully analyzing convergence behavior, structural equilibration, and consistency across independent observables (e.g., , , hydrogen bonds, and contact number). Nonetheless, it is acknowledged that future studies could benefit from systematic controls—such as simulations with modified partial charges, reduced ionic strength, or implicit solvent models—to quantitatively assess the impact of electrostatic crowding on arginine self-association. These are important extensions to confirm the physical relevance of the observed transitions.
To assess the global structural compaction of the system, the time evolution of the radius of gyration (
) was examined for each concentration.
Figure 5 presents the running averages of the radius of gyration (
) for arginine molecules over 300 nanoseconds at six different concentrations, ranging from 26 mM to 605 mM. The radius of gyration quantifies the spatial distribution of molecular components around the system’s center of mass and is defined by the following mass-weighted formula:
where
is the mass of the
i-th atom,
is its position vector, and
is the center of mass of the system. This formulation allows for a more accurate measure of the molecule’s structural compactness by incorporating atomic masses [
46,
47]. All curves in
Figure 5 exhibit a steep rise in
during the initial phase of the simulation (first ∼50 ns), after which they plateau, suggesting that the systems reach structural equilibrium early in the trajectory. The convergence of
over time further supports the stability and reproducibility of the observed aggregation behavior across concentrations. The data of this figure reveal a clear monotonic decrease in
with increasing concentration, suggesting progressive compaction of the molecular ensemble as intermolecular interactions become more prominent. At lower concentrations (26 mM and 45 mM), the systems exhibit large
values—approximately 5.5 nm and 4.5 nm, respectively—indicating that arginine molecules remain relatively dispersed in solution. This reflects a regime where electrostatic repulsion and thermal motion dominate, leading to extended configurations with limited aggregation. As the concentration increases to intermediate values (88 mM),
steadily decreases, marking a transition toward more compact structures as the frequency of intermolecular contacts rises. At higher concentrations (208 mM, 359 mM and 605 mM), the radius of gyration stabilizes below 3 nm. This trend is consistent with the formation of densely packed arginine clusters, where spatial crowding and solvent exclusion constrain further structural expansion. The initial rapid drop in
observed at early simulation times corresponds to a collapse phase, likely driven by long-range electrostatic attractions and hydrophobic side-chain interactions. The subsequent plateau phase indicates structural equilibrium. These observations are in agreement with experimental findings from small-angle X-ray scattering (SAXS) and NMR studies of arginine-rich peptides [
48], which also report cooperative self-association and concentration-dependent compaction. The inverse relationship between
and concentration highlights the emergence of condensed phases at higher concentrations, potentially relevant to mechanisms of biomolecular condensation and phase separation in cellular environments. Overall, this figure provides strong evidence of concentration-dependent structural reorganization in arginine solutions, offering quantitative support for the onset and stabilization of molecular self-assembly under increasing crowding conditions.
To quantify the concentration-dependent structural collapse, the average radius of gyration (
) was computed for each system, revealing a systematic compaction trend with increasing concentration.
Figure 6 illustrates the radius of gyration (
) of arginine molecules as a function of concentration. The observed decrease in
reflects the progressive structural compaction of the molecular ensemble with increasing crowding. To model this non-linear collapse, an inverted Hill equation of the form was employed:
where
C represents the initial radius at low concentration,
A is the magnitude of the decrease,
K is the half-maximal compaction concentration, and
n is the Hill coefficient, quantifying the cooperativity of the collapse process. The best-fit parameters are
,
,
, and
. The low value of
K indicates that structural compaction begins at relatively low concentrations, suggesting that even modest levels of arginine are sufficient to trigger significant intermolecular interactions. Consistent with our earlier interpretation, the Hill coefficient
n < 1 suggests a gradual compaction process, in which collapse occurs progressively rather than through an abrupt transition. The smooth saturation of
at high concentrations is consistent with a thermodynamically crowded regime in which further compression is physically constrained. This behavior parallels the saturation trends observed in hydrogen bonding and contact number data, supporting a unified picture of arginine self-association driven by a balance of enthalpic interactions and entropic penalties. The application of the Hill equation to a structural compaction process proves both quantitatively effective and conceptually illuminating. It provides an interpretable framework for understanding how concentration-dependent interactions drive large-scale structural transitions in biomolecular systems. This structural compaction correlates strongly with the behavior observed in
Figure 4, where the number of hydrogen bonds increases with concentration but plateaus above 500 mM. Together, these observations suggest that hydrogen bonding plays a central role in driving early compaction but becomes self-limiting as molecular crowding imposes steric and hydration-based constraints. Experimental observations reinforce this interpretation. Small-angle X-ray scattering (SAXS) and NMR studies on arginine-rich peptides, such as those reported by Tesei et al. [
48], have shown that increasing concentration leads to self-association, conformational compaction, and altered hydration. Notably, SAXS-derived
values for poly-arginine peptides decrease non-linearly with concentration, consistent with the simulated collapse.
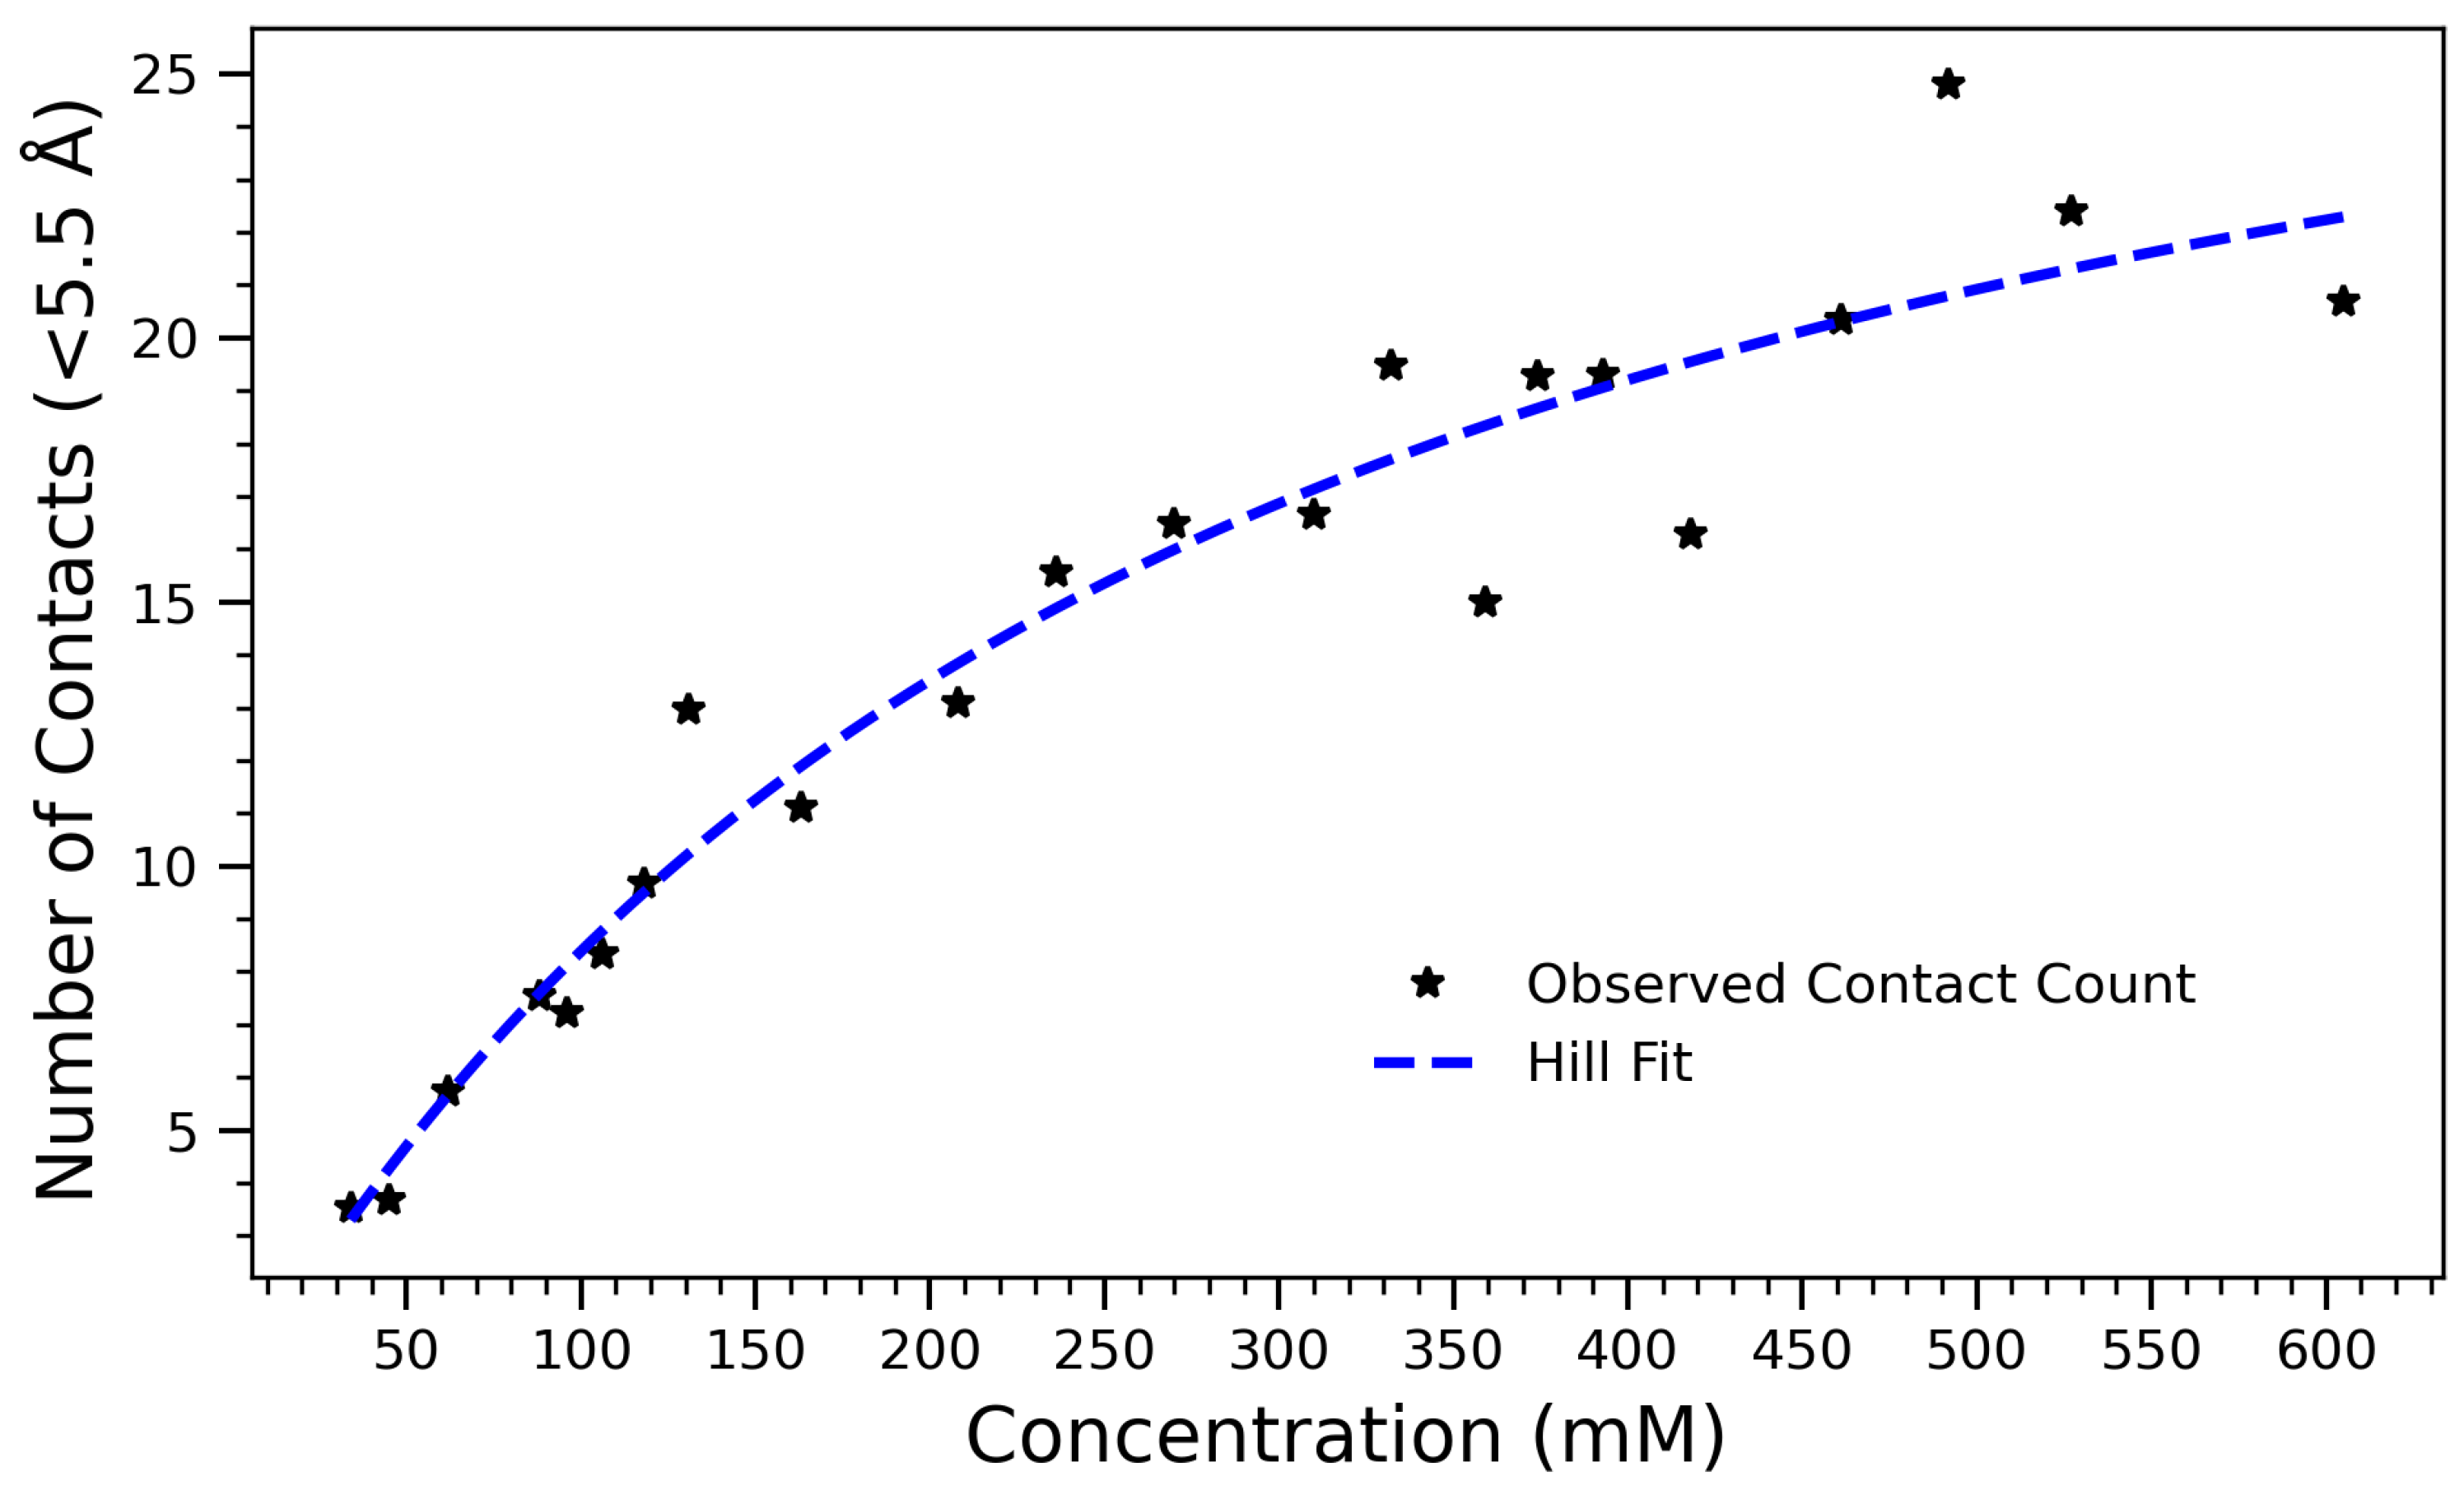
As a complementary structural metric, the average number of intermolecular close contacts (within 5.5 Å) was calculated at each concentration, further illustrating the non-linear saturation of self-association.
Figure 7 illustrates the number of intermolecular contacts formed within 5.5 Å as a function of arginine concentration. The observed data, which increases monotonically and saturates at higher concentrations, is well described by Equation (
1), where
A is the maximum number of contacts,
K is the concentration at which half the maximum is achieved, and
n is the Hill coefficient that reflects cooperativity in the system. The fitted parameters are
,
, and
. These values indicate that contact formation follows a saturable, nearly non-cooperative process (
), characteristic of diffusion-limited or sterically regulated aggregation. As the concentration of arginine increases, molecules come into close proximity more frequently, leading to more short-range contacts within the 5.5 Å threshold. However, beyond a certain concentration, the number of contacts begins to plateau, likely due to spatial constraints, excluded volume effects, and saturation of favorable interaction sites. The use of the Hill equation provides both a quantitatively accurate and physically meaningful framework for interpreting the contact formation process. The half-maximal concentration
highlights a threshold beyond which most arginine molecules are already engaged in intermolecular interactions, consistent with other observations such as hydrogen bond saturation and a reduced radius of gyration. The alignment of these structural and thermodynamic indicators reinforces the interpretation of a three-regime transition: a dilute regime with low interaction frequency, a cooperative buildup phase, and a dense, saturated state dominated by steric effects. Likewise, the Hill model applied to contact formation within 5.5 Å exhibits saturating behavior with a half-maximal point near 265 mM. This supports a physical interpretation in which the growing number of close contacts initially drives collapse, but further compression is hindered by volume exclusion effects. These simulations collectively support a three-regime model of structural transition: (1) a dilute, dynamic state with minimal interaction; (2) a cooperative assembly phase marked by rapid changes in
, hydrogen bonding, and contact number; and (3) a densely packed phase with minimal configurational flexibility.
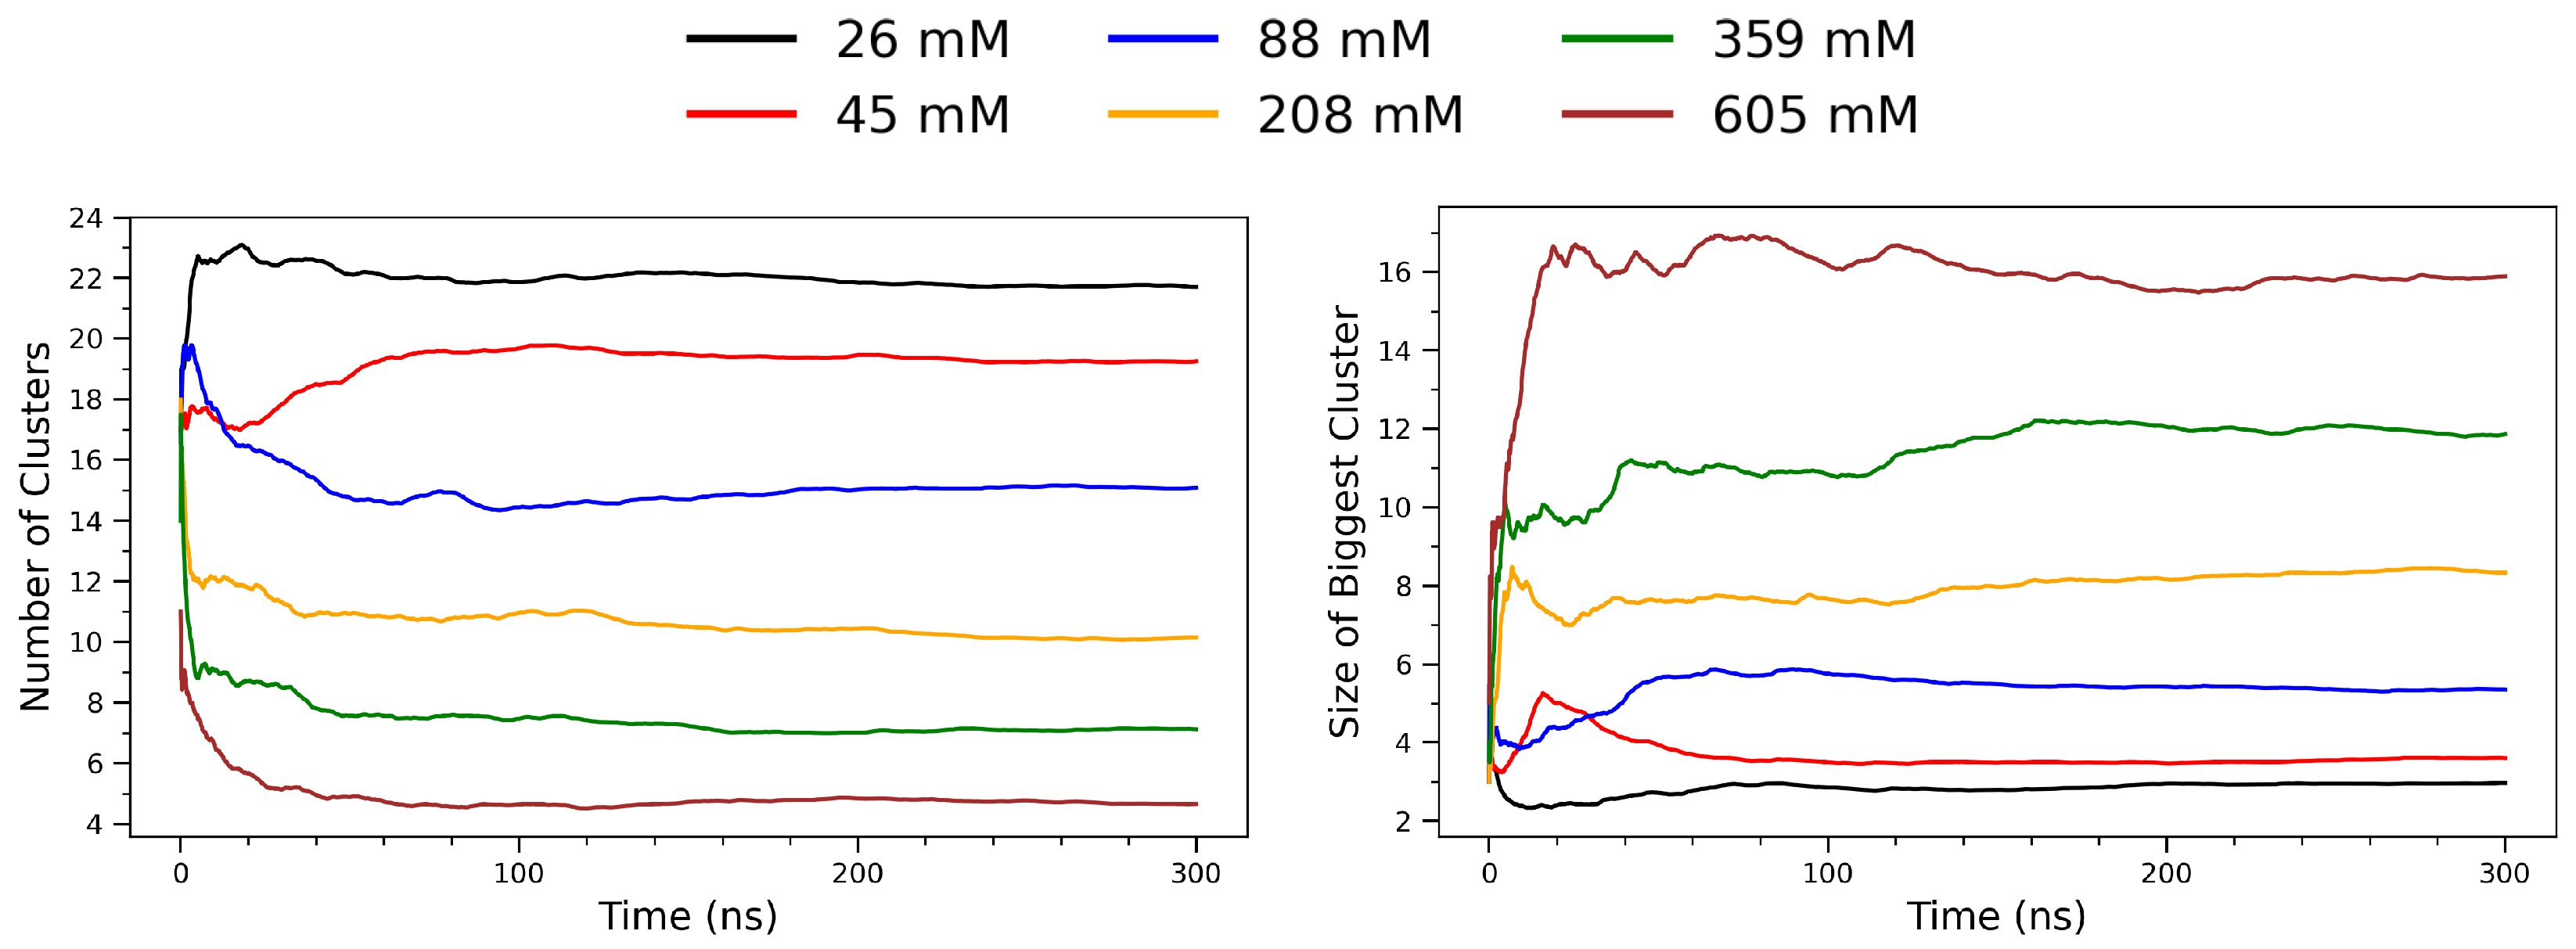
To analyze the spatial aggregation behavior of arginine molecules, a frame-by-frame clustering analysis was performed on multi-model PDB trajectory files using a Python script based on the
MDAnalysis (version 2.8.0) library [
49]. Each trajectory consisted of a sequence of atomic coordinates representing time-resolved snapshots of the molecular system. In this analysis, only the alpha carbon (
C) atoms of each arginine residue were selected as representative coordinates. For each frame, pairwise Euclidean distances between all selected atoms were calculated using
scipy.spatial.distance.pdist (version 1.15.2) [
50]. A binary adjacency matrix was constructed by applying a distance cutoff of 5.5 Å: any pair of residues separated by less than this threshold were considered directly connected. For each frame, two metrics were computed and recorded: (i) the total number of clusters, and (ii) the size of the largest cluster (i.e., the number of residues it contains).
Figure 8 illustrates the temporal evolution of arginine clustering behavior across a range of concentrations, from 26 mM to 605 mM. The left panel shows the total number of clusters identified per frame, while the right panel depicts the size of the largest cluster (in number of residues) over time. At low concentrations (e.g., 26 mM; black curve), the system maintains a high and relatively stable number of small clusters throughout the simulation, indicative of limited molecular association. As the concentration increases, a notable decrease in the number of distinct clusters is observed. This trend reflects enhanced intermolecular encounters and aggregation propensity under crowding conditions, where arginine molecules more frequently come into spatial proximity and form stable aggregates. In contrast, the right panel reveals that the size of the largest cluster increases substantially with concentration. At 26–88 mM, the largest cluster remains small (typically fewer than five monomers), suggesting transient dimer or trimer formation. However, at 359 mM and 605 mM (green and brown curves, respectively), the largest clusters grow rapidly and stabilize at sizes exceeding 10 residues. This behavior indicates the formation of stable supramolecular assemblies sustained throughout the simulation window. Together, the two panels demonstrate a clear inverse relationship between the number of clusters and the size of the largest cluster as a function of concentration. This pattern is consistent with a percolation-like transition [
51,
52], where increased molecular density leads to cluster coalescence and the emergence of long-lived, cooperative aggregates.
To complement the structural descriptors with a thermodynamic perspective, the isobaric heat capacity (
) was computed as a function of concentration. The heat capacity (
) is given as
where
H is the enthalpy,
is the Boltzmann constant, and
T is the temperature in Kelvin; the heat capacity plays a crucial role in analyzing phase transitions. During phase transitions such as melting, boiling, or sublimation,
often exhibits anomalies that correspond to energy absorption or release [
53,
54].
Figure 9 illustrates the variation in isobaric heat capacity (
) for arginine solutions as a function of concentration. The curve reveals distinct thermodynamic regimes and suggests underlying structural transitions within the system. At low concentrations (below 150 mM),
exhibits a steep decline from values exceeding 5000 J/mol·K, indicating a transition from a highly dynamic and disordered state to one of increasing molecular interaction and reduced configurational freedom. This trend reflects the gradual restriction of rotational and translational degrees of freedom due to enhanced intermolecular interactions and solvent structuring. A particularly striking feature is the sharp peak in
near 360 mM. Such a pronounced local maximum is indicative of a thermodynamic anomaly and may correspond to a cooperative transition within the system. Potential interpretations include the onset of arginine self-association, the formation of ordered aggregates, or a disruption in hydration dynamics, all of which could cause a sudden change in the system’s ability to store thermal energy. The abrupt nature of this peak resembles features observed in first-order phase transitions, where enthalpic and entropic contributions change discontinuously due to molecular reorganization. Beyond this peak, the heat capacity flattens into a low plateau, suggesting entry into a thermodynamically saturated regime. In this regime, further increases in concentration no longer substantially alter the energy landscape or dynamic behavior of the system, likely due to dense packing and the saturation of available interaction sites. These thermodynamic features align well with previously observed structural indicators, such as the saturation of hydrogen bonding (
Figure 4) and the compaction of molecular configurations (
Figure 2 and
Figure 6). Together, the
profile provides compelling evidence for a three-regime model of arginine behavior: a dilute, dynamic phase; a cooperative transition zone; and a condensed, ordered phase governed by crowding and aggregation. Overall, this thermodynamic signature supports the structural interpretations drawn from spatial and bonding analyses, confirming that arginine undergoes a concentration-dependent self-assembly process that culminates in energetically stable, aggregated states. The peak in
thus serves as a sensitive probe of the critical concentration range for arginine aggregation and structural transition. Heat capacity peaks associated with conformational rearrangements have also been observed in protein folding experiments [
55], affirming its utility as a thermodynamic marker of structural transitions similar to those reported here for arginine self-assembly. The non-monotonic behavior observed in the heat capacity data provides an important thermodynamic complement to the structural observables. While hydrogen bonding, contact number, and radius of gyration evolve monotonically with concentration and saturate at higher densities, the sharp peak in
near 360 mM suggests a distinct thermodynamic transition. This discrepancy does not reflect inconsistency, but rather a deeper thermodynamic response—one likely tied to changes in hydration structure, entropy of packing, or cooperative fluctuations in the system. Similar intermediate-concentration anomalies have been experimentally observed in DSC studies of arginine and arginine salt solutions [
56,
57], reinforcing the interpretation that the
peak captures a reorganization event rather than a simple accumulation of contacts or bonds. Thus, heat capacity offers a valuable energetic lens on the structural transitions described in this study, helping to unify molecular packing and solvent-mediated effects within a coherent thermodynamic framework (The pronounced peak in isobaric heat capacity (
) near 360 mM was interpreted as a thermodynamic signature of hydration rearrangement and configurational reorganization. While this interpretation is consistent with structural compaction and hydrogen bond saturation, it is acknowledged that no direct solvent-related metrics-such as water residence time, solvation shell coordination numbers, or local tetrahedrality-were evaluated in the present study. These metrics could provide more explicit evidence of water network restructuring and entropic contributions associated with aggregation. Future work could incorporate such hydration-sensitive analyses, possibly through radial water density functions, hydrogen bond autocorrelation, or orientational order parameters (e.g.,
), to better resolve the relationship between solvation dynamics and the observed thermodynamic transitions).
These findings support the hypothesis that molecular crowding plays a critical role in driving supramolecular assembly in arginine-rich environments. The observed trend provides insight into how arginine self-assembly is regulated by concentration, with implications for understanding its behavior in biological, pharmaceutical, and nanomaterial contexts. Although this study focuses on free arginine in aqueous solution, the observed self-assembly features—such as cooperative hydrogen bonding, close-contact clustering, and concentration-dependent behavior—are highly relevant to functional proteins. In particular, arginine-rich motifs in RNA-binding proteins, cell-penetrating peptides, and transcription factors rely on guanidinium-mediated hydrogen bonds and electrostatics to interact with nucleic acids and membranes.


