Abstract
With the acceleration of the oilfield development process during the high water content period, the contradiction between the increase in energy consumption and the decrease in the energy efficiency of the gathering and transportation system has become increasingly obvious. This paper develops a grey relational analysis model using a combination of AHP and EWM. Based on the characteristics of light oil production, a four-level evaluation indicator system is developed. Based on game theory, AHP can provide subjective weights, the EWM can provide objective weights, and subjective and objective combinations are used for a more reasonable assignment. Concurrently, the 0.05 distinguishing coefficient and the ideal reference values are selected as the GRA reference sequence to evaluate the energy consumption of the gathering and transportation system as a whole and each subsystem. The analysis of a light oil block indicates significant room for improvement in the energy efficiency correlation across the system. Taking the central processing station as an example, the grey relational degree of electricity consumption per unit of injected water is measured at 0.12, marking it as the weakest link in the system. This study supports efficiency enhancement by identifying energy consumption bottlenecks within the system.
1. Introduction
1.1. Background
Against the background of accelerating the low-carbon transformation of energy globally, the oil and gas industry is facing the challenge of energy efficiency upgrading. For example, in oil and gas field development, applying the supramolecular gel technology proposed by Li et al. [1] and using nanotechnology can enhance oil recovery [2], combined with solar high-temperature photothermal technology to achieve low-carbon development [3]. In a typical old oilfield with high water content, the light oil block gathering and transportation system faces problems such as high consumption and low efficiency. Owing to high water-cut characteristics in light oil blocks, the amount of invalid water to be treated during the gathering and transportation process increases sharply, and a large amount of energy is used for the treatment of produced water, which seriously affects the production efficiency of the oilfield and restricts its sustainable development. At present, some oilfields are promoting energy saving and carbon reduction, actively building a low-carbon and efficient modern energy system, and carrying out all-around tapping of potential to increase efficiency. Therefore, there is a need to find an evaluation method that can identify the weak links of energy efficiency in the gathering and transportation system and provide a decision-making basis for tapping potential and increasing efficiency. In this context, this study develops a comprehensive evaluation model integrating the AHP (analytic hierarchy process) and EWM (entropy weight method), combined with grey correlation analysis, enabling energy efficiency assessment of light oil development blocks in an oilfield.
1.2. Related Works
In terms of energy use analysis, combining the process flow and characteristics of natural gas field gathering and transportation systems, the traditional ‘three-stage’ energy analysis method was improved, and the system energy use was analyzed by using the improved AHP (Ji et al. [4]). For the three-pipe heat tracing gathering process, AHP was employed to construct an energy efficiency evaluation indicator system of a crude oil transfer station, and the crude oil transfer station was divided into three subsystems: heat system, electric power system, and oil gathering pipeline network for evaluation (Si et al. [5]). To address limitations in energy efficiency evaluation for oilfield energy systems, an indicator system was developed encompassing artificial lift, gathering, and water injection subsystems, with defined energy efficiency thresholds (Cao et al. [6]). By compensating for the shortcomings of traditional thermodynamic analysis, an improved comprehensive analysis method of energy use was proposed for system evaluation (Liu et al. [7]). Energy use analyses were conducted for unit-level equipment in each process step of the gathering and transportation system, and emission reduction strategies were formulated for them (Awow et al. [8]).
Prevalent approaches to quantitative evaluation methodologies include the AHP, EWM, GRA (grey relational analysis), and FCE (fuzzy comprehensive evaluation). Integrating AHP with decision analysis techniques has demonstrated utility in assessing the feasibility of thermal energy storage in depleted reservoirs (Abdulhaq et al. [9]). Similarly, the combination of AHP and expert scoring has been employed for the safety evaluation of enhanced oil recovery (EOR) projects in the Dagang Oilfield (Li et al. [10]). AHP is widely recognized for its application in multi-objective decision-making and comprehensive evaluations [11,12,13,14]. GRA has proven effective in safety assessments of oil and gas pipelines (Zheng et al. [15]), while fuzzy theory has been implemented to evaluate information value within the petroleum industry (Oluyemi et al. [16]). Notably, hybrid methodologies such as AHP-EWM integration have been utilized for robotic equipment selection (Chung et al. [17]). Current research commonly combines weighting methods with comprehensive evaluation approaches, distinguishing between subjective and objective weighting. For example, principal component analysis coupled with GRA has been used to assess energy consumption patterns in pumping units (Zhao et al. [18]). Pure objective weighting methods see limited practical application as sole reliance on data fails to accurately reflect operational realities. Consequently, most researchers adopt subjective weighting integrated with comprehensive evaluation approaches. For instance, expert survey-based weighting combined with GRA was employed to assess hydrocarbon exploration efficiency (Xiao et al. [19]). The AHP-FCE synthesis was successfully implemented to identify critical factors influencing oilfield development performance (Zhang et al. [20]). Analogously, a multi-level fuzzy evaluation framework for waterflooding development dynamics was developed to assess injection–production performance (Xiong et al. [21]). To improve accuracy in determining indicator weights, researchers have integrated subjective and objective weighting methods. Combined with matter-element extension modeling, this approach effectively identifies safety vulnerabilities and weak points in emergency management systems (Gao [22]). Similarly, the integration of AHP-EWM weighting with FCE has revealed operational intelligence gaps in oil depots (Wang et al. [23]).
If the evaluation scope is focused on the oil and gas gathering and transportation system, the applications are as follows: Based on the gathering and transportation system, energy consumption was selected as the reference sequence in GRA, and an evaluation model was established that comprehensively analyzed the factors affecting energy consumption in the process of crude oil gathering and transportation (Zhou et al. [24]). Taking the heating furnace and pump unit as the primary energy-consuming equipment, the EWM and GRA were employed to investigate the seasonal variation patterns of the energy efficiency coefficient in the crude oil gathering and transportation system and determine the weak links of energy consumption (Tang et al. [25]). AHP combined with FCE was applied to assess the energy utilization status of an oil production plant in the Shengli Oilfield, based on the plant’s operational data (Li et al. [26]). The introduction of triangular fuzzy numbers and the improvement of the judgment matrix reduce the shortcomings of AHP to a certain extent and establish an energy efficiency evaluation method for the oilfield surface gathering and transportation system based on AHP and the improved FCE (Cheng et al. [27]). For the system, an evaluation model was proposed based on the TOPSIS method (Peng [28]). On this basis, the GA-BP neural network was integrated for enhancement (Zhang et al. [29]). Similarly, based on the TOPSIS principle, a weighting approach using a linear combination of preference factors was proposed (Sun et al. [30]). In addition to the pure gathering and transportation system, an energy efficiency evaluation method integrating a gas reservoir–wellbore–gathering pipeline network was also introduced (He et al. [31]).
This paper aims to construct an energy efficiency evaluation model that is simple for field use and has excellent effectiveness. Therefore, the factors considered in model construction are as follows: Conventional comprehensive evaluation models predominantly employ either subjective or objective weighting methods. Subjective weighting excessively relies on empirical judgment, while objective weighting lacks comprehensive consideration of field operational realities. In previous studies using GRA, researchers typically selected energy consumption as the reference sequence to evaluate the influence of various indicators on energy consumption, which proves insufficient for direct optimization target identification. Although the distinguishing coefficient is conventionally set at the median value of 0.5, empirical adjustments demonstrate that adopting 0.05 yields more rational results, thereby enhancing the discriminative capacity of grey relational degrees [32]. Given the complexity of oil and gas gathering and transportation systems, no universally optimal method exists for comprehensive evaluation. All methodologies inherently involve subjective determinations, such as reference sequence selection in GRA and membership degree specification in FCE, where inappropriate choices may compromise interpretability and validity. Concurrently, establishing a multi-level indicator system for gathering and transportation systems necessitates a judicious selection of subsystems and subordinate evaluation indicators, as these decisions critically determine the systematicity of evaluations and the practical applicability of outcomes.
1.3. Contribution
To overcome the limitations of traditional evaluation models applied in oil and gas gathering and transportation systems, this study develops an evaluation methodology integrating subjective–objective weighting with GRA. An evaluation model is developed for the gathering and transportation system in the central light oil block of a certain oilfield to systematically identify weak links in the system, providing decision support for optimizing operations and improving economic efficiency.
The proposed model demonstrates the following advantages: First, the evaluation method integrating AHP and EWM for combined weighting with GRA was selected through comparative optimization. The indicator system was then established based on the light oil production characteristics of the oilfield. Second, to meet the requirements of energy efficiency evaluation for gathering and transportation systems and intuitively demonstrate optimization objectives, the optimal values of indicators were selected as the reference sequence for GRA. The distinguishing coefficient was set to 0.05 to enhance the capability of the grey relational degree in reflecting energy efficiency performance across different indicators. Finally, the practical application of this model in the light oil block of the oilfield verified the practicality and superiority of the evaluation model. The method successfully identified critical indicators necessitating optimization across diverse station conditions.
1.4. Organization
The subsequent sections are structured as follows: Section 2 begins with the engineering context, articulating the research objectives and practical significance. In Section 3, a comprehensive evaluation model is established, and its computational and implementation steps are described. Section 4 validates the effectiveness and applicability of the proposed method through a practical case study. Section 5 summarizes the research findings of this study.
2. Problem Description
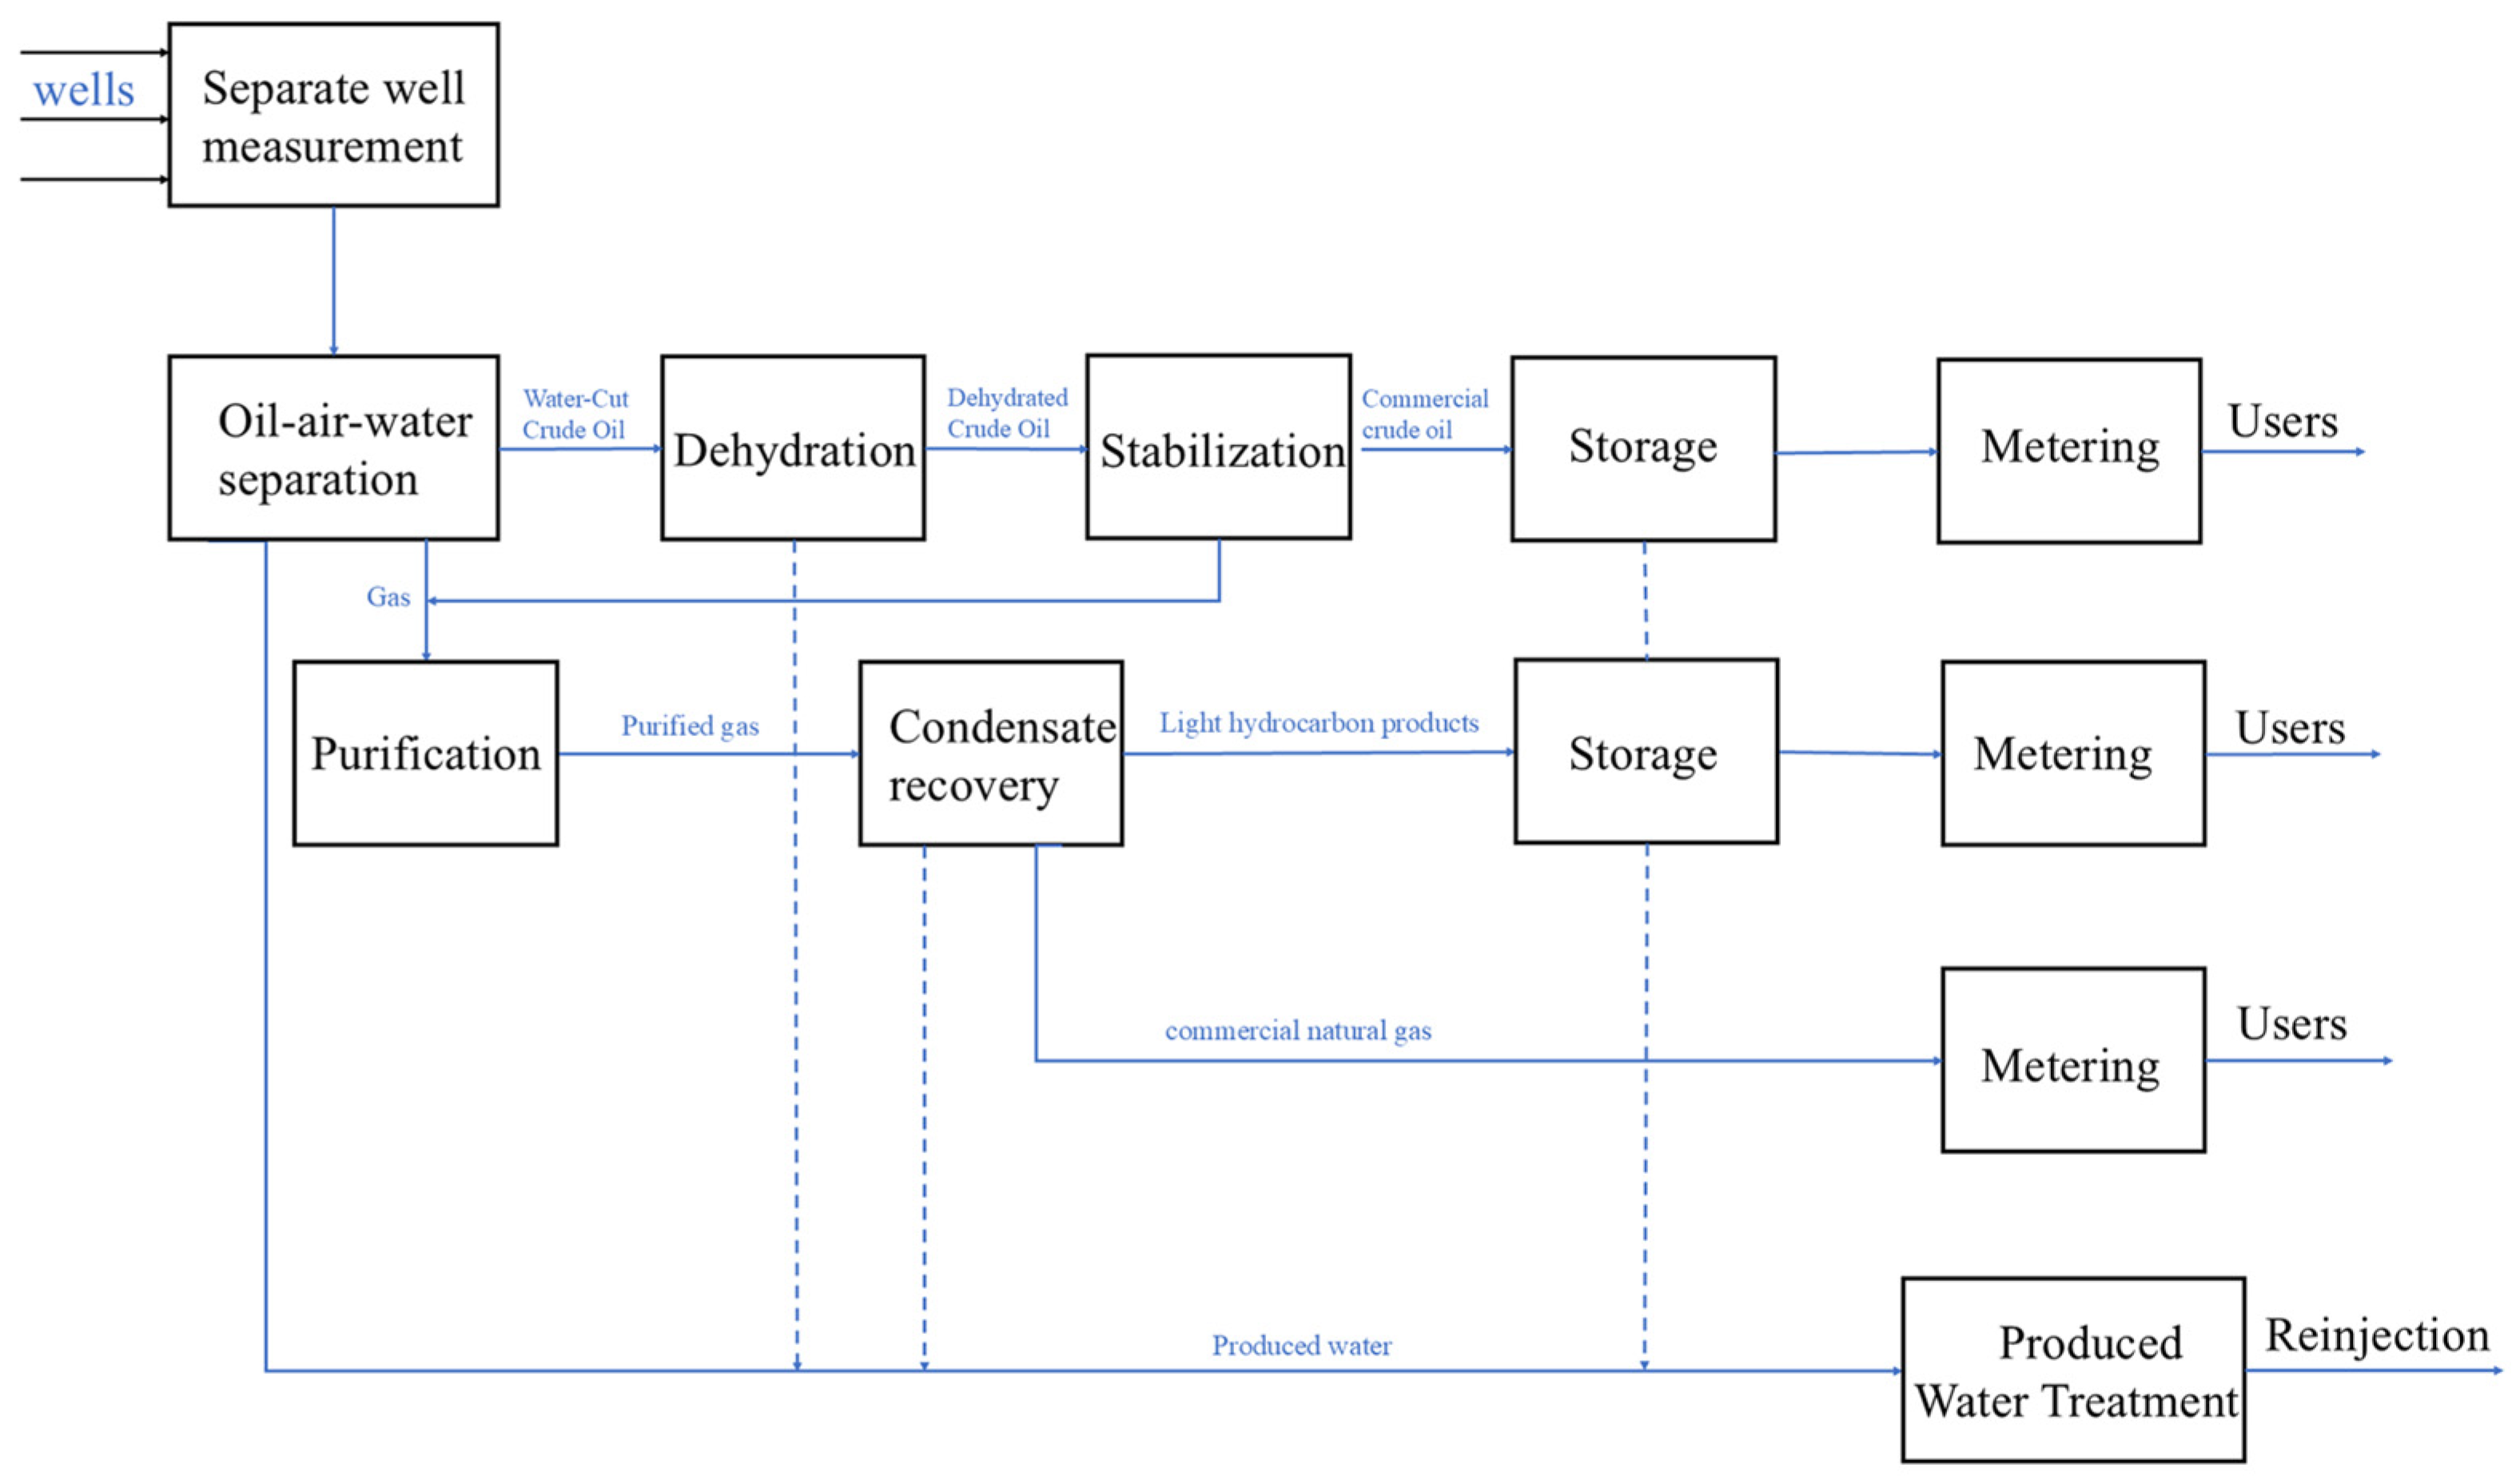
Oil and gas gathering and transportation systems collect well stream products from individual wells across the oilfield and separate them into crude oil, associated gas, and produced water. Through necessary purification and processing, these products are converted into oilfield commodities, as illustrated in the workflow of Figure 1. As the central hub, oil and gas gathering and transportation systems are complex due to factors such as geological conditions, fluid properties, and development stages. These systems require dynamic adjustments of process flows based on actual demands.
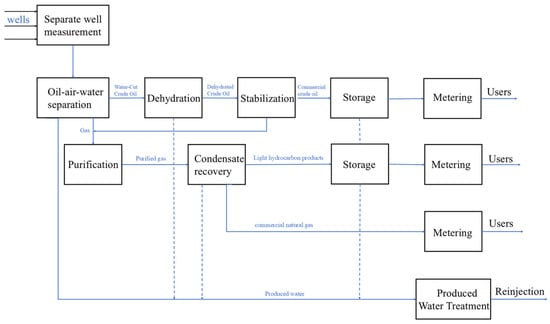
Figure 1.
Process flow of oil and gas gathering and transportation system.
The gathering and transportation system in an oilfield’s light oil block primarily comprises central processing stations, multiphase pumping stations, dehydration stations, and a pipeline network. Operational issues include high energy consumption, significant pressure drops in inter-station pipelines, and continuously increasing energy demands for oil transportation. Critical production indicators demonstrate substantial optimization potential, including energy consumption per unit of crude oil, containment efficiency of gathering and transportation systems, per-well surface facility investment, and oil pipeline failure rate. Notably, energy consumption per unit of crude oil significantly exceeds industry averages while demonstrating an upward trend. To address the issues of high energy consumption and low operational efficiency in the gathering and transportation system of the light oil block in the oilfield in this study, energy efficiency evaluations were performed to identify inefficiency weak points in the system. Targeted optimization measures are proposed to improve existing production indicators and enhance operational efficiency, ultimately aiming to reduce energy consumption in the light oil gathering and transportation system. This meets the urgent requirements for cost reduction and efficiency enhancement in light oil blocks of oilfields.
3. Method
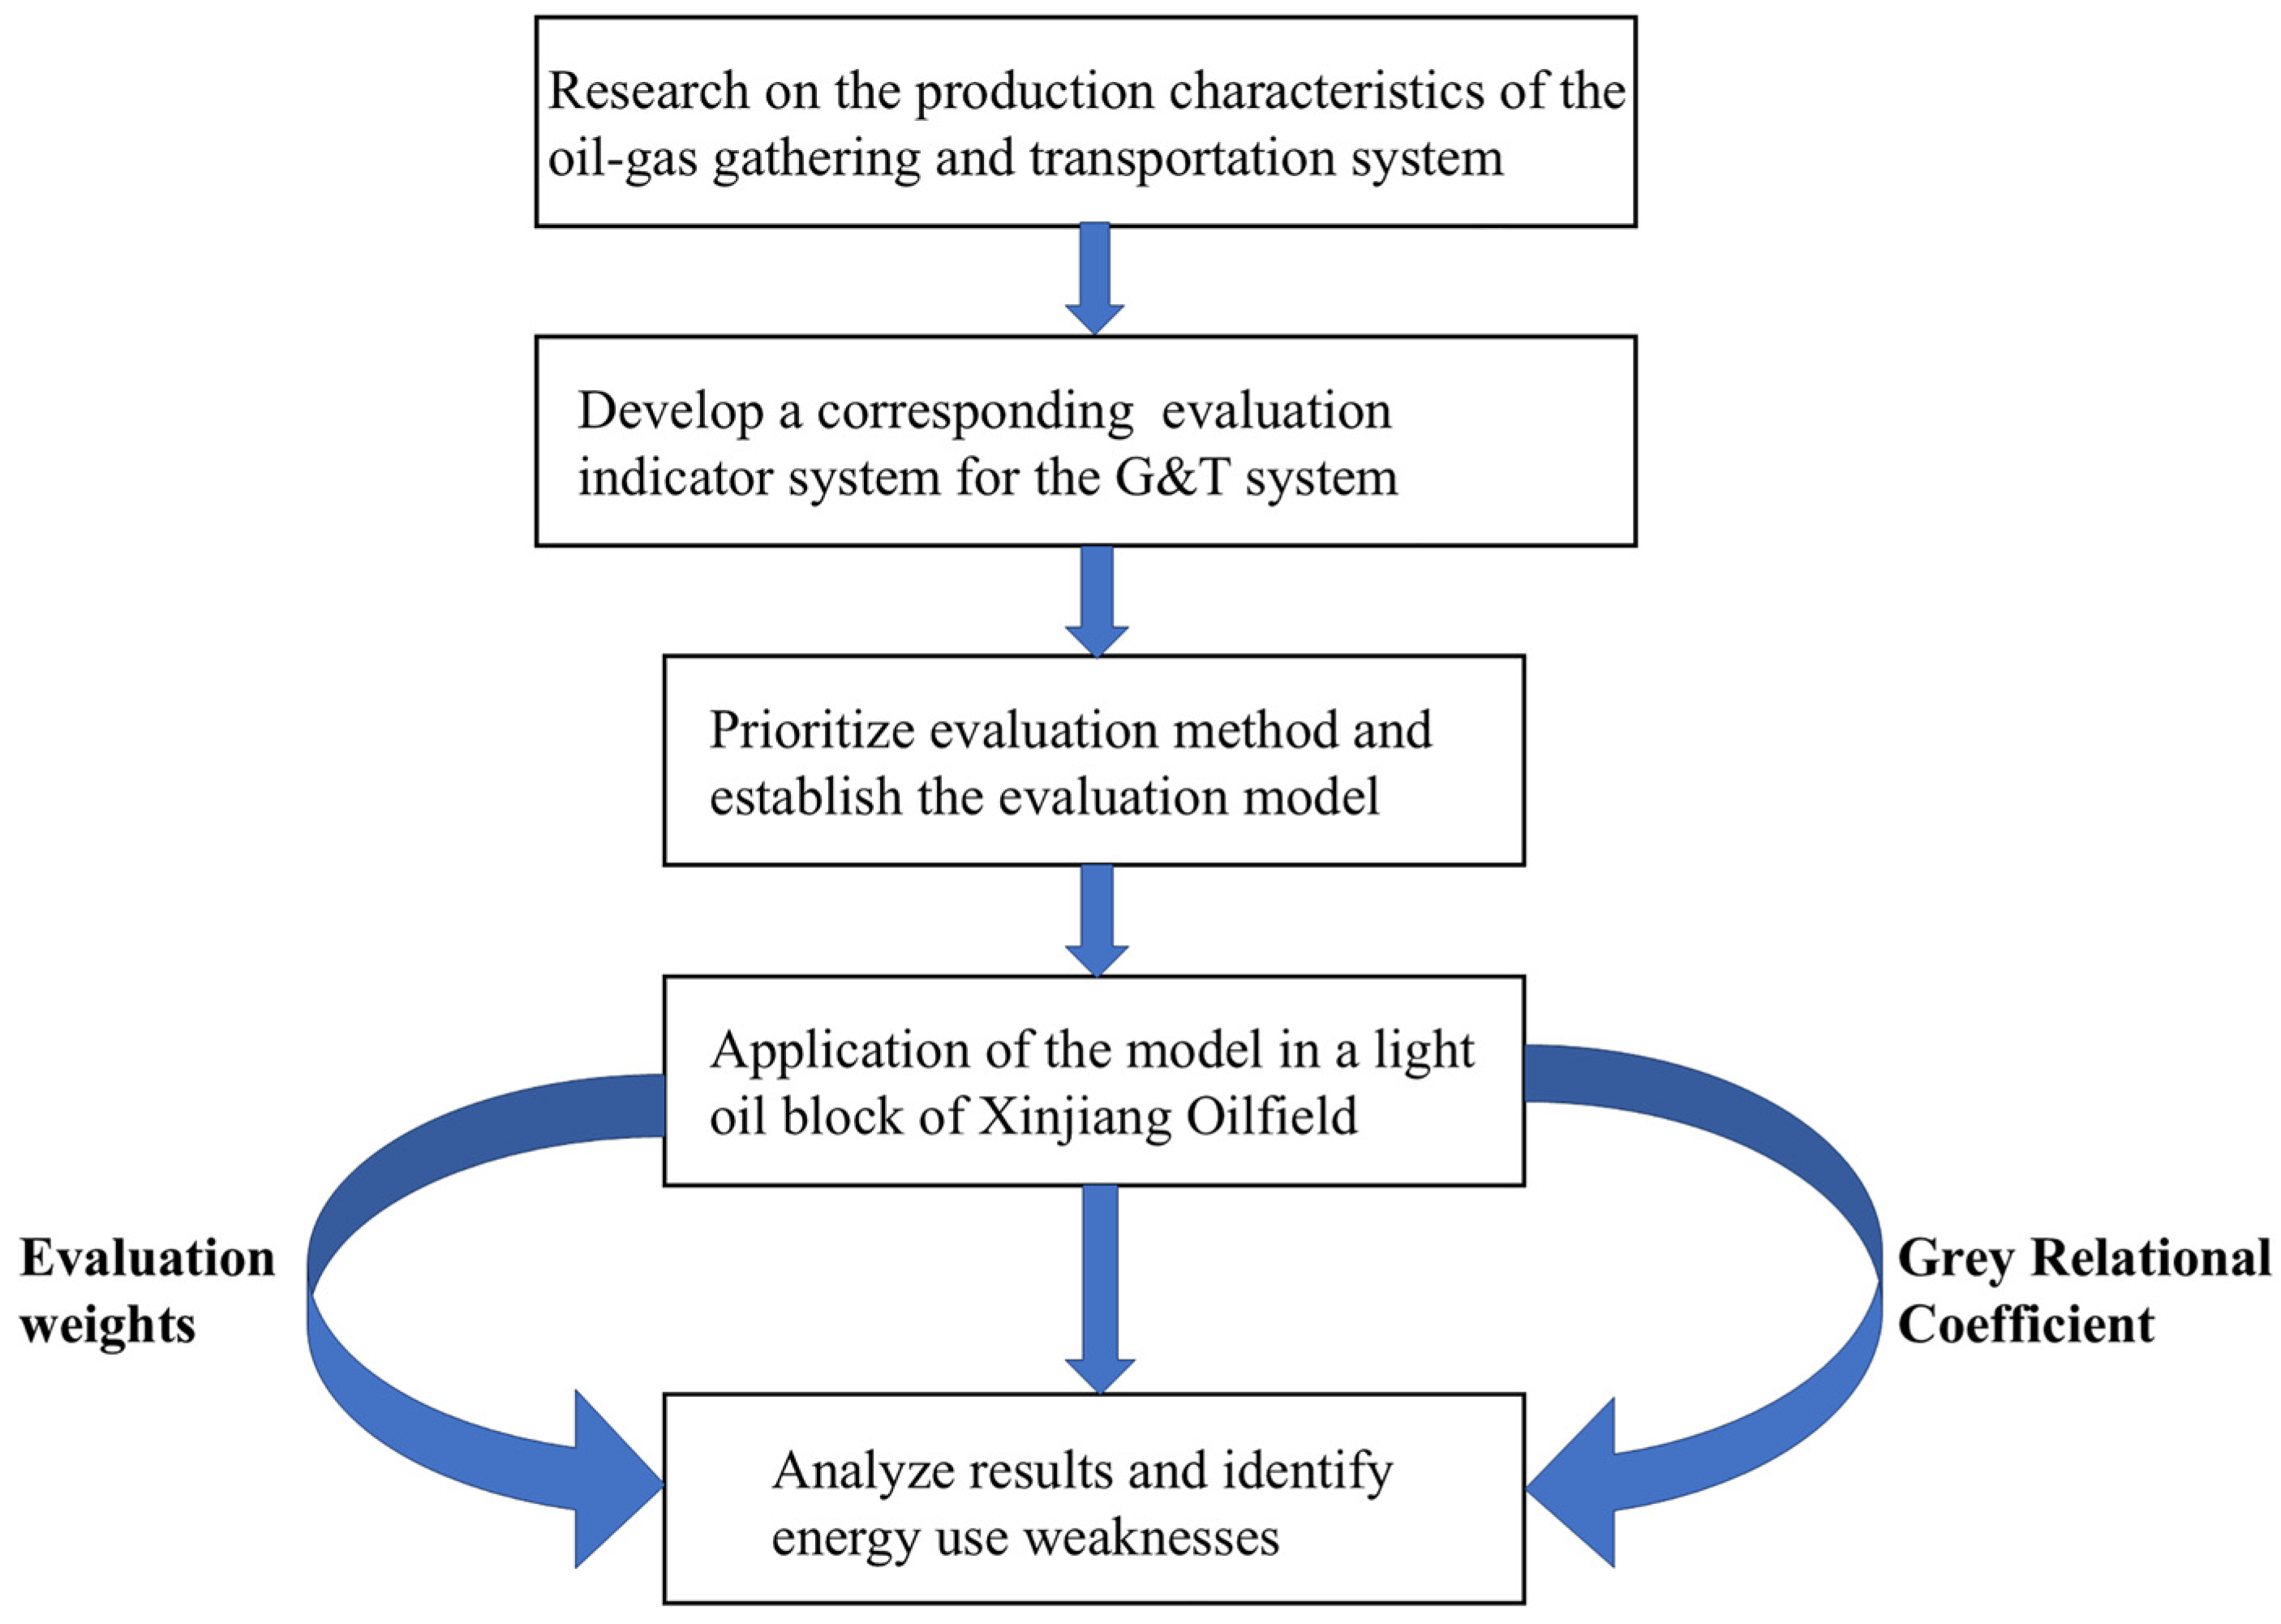
The AHP was employed to determine the subjective weights of indicators, while the EWM provided objective weight values. The combined weighting of these subjective and objective weights yields scientifically robust indicator weights. Additionally, an evaluation indicator system was established through energy consumption analysis based on the oilfield’s operational characteristics, with appropriate reference sequences and distinguishing coefficients selected for GRA. Finally, through the application of this model to the light oil block in the oilfield, we identified specific indicators urgently requiring optimization across different stations. The calculation process is shown in Figure 2.
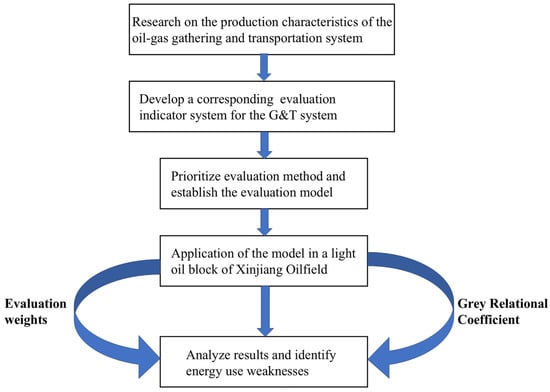
Figure 2.
Comprehensive evaluation flowchart.
3.1. Construction of Evaluation Indicator System
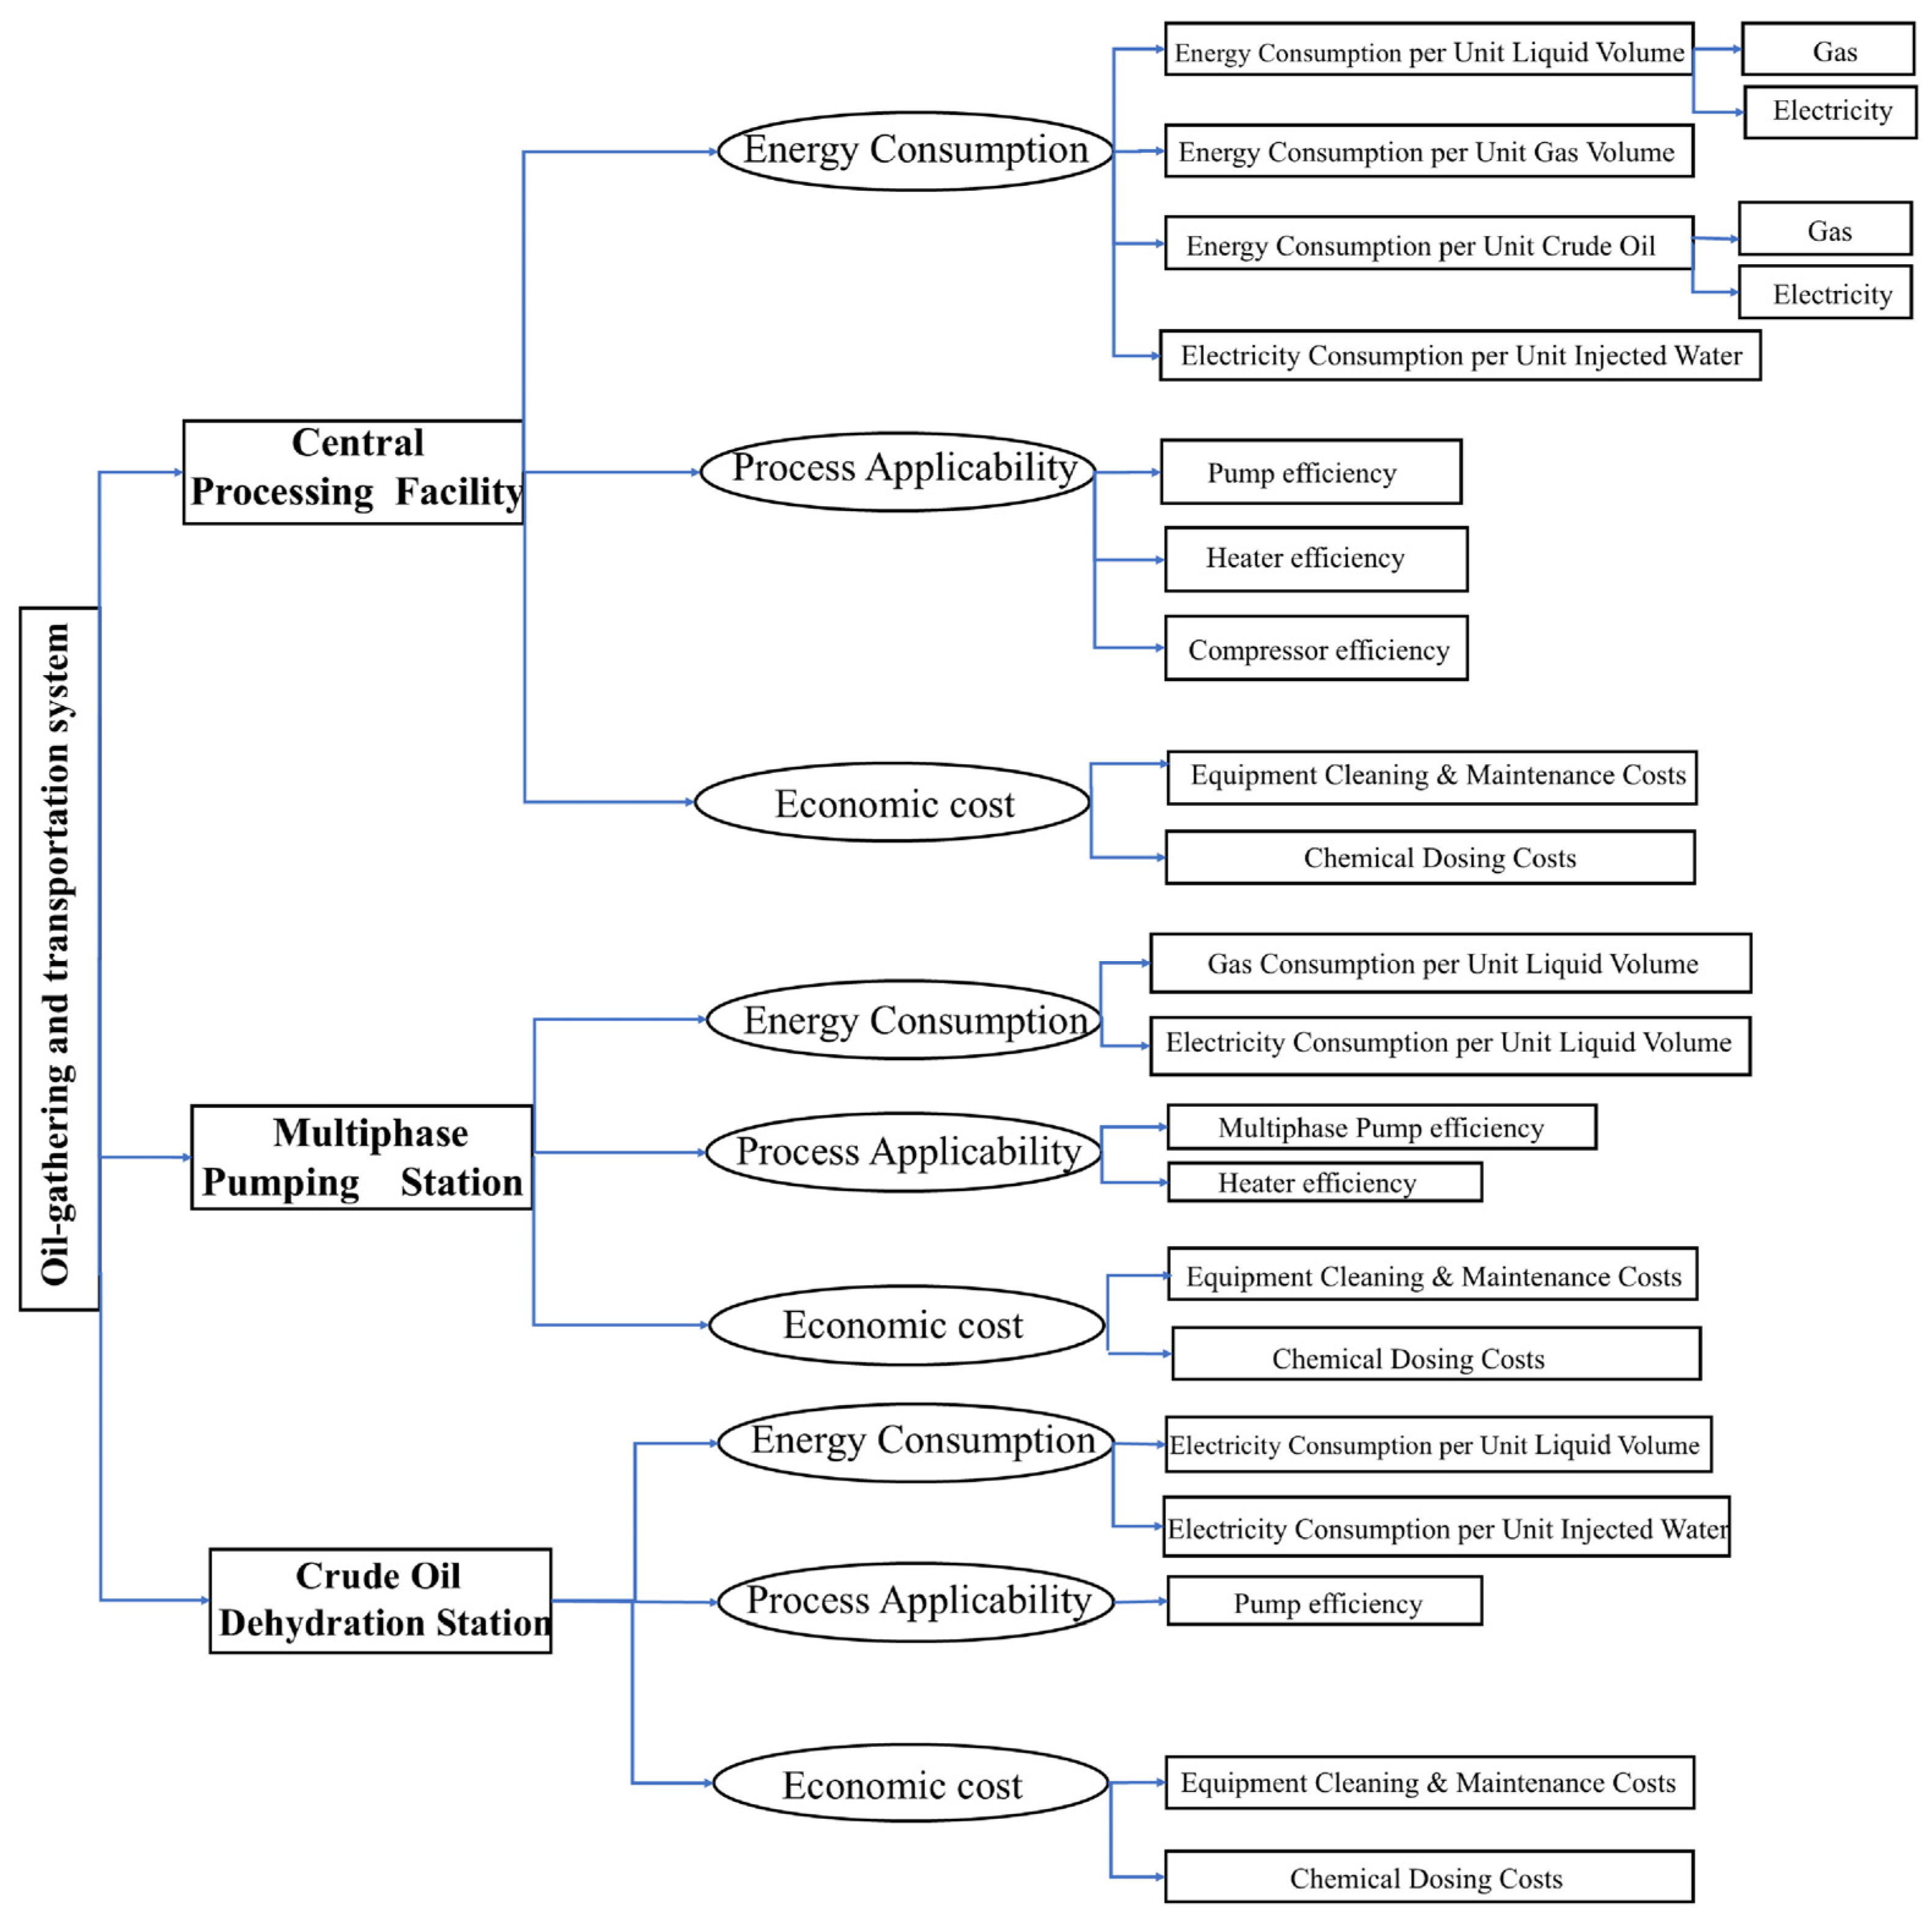
The evaluation indicator system construction must reflect the system’s essence while comprehensively considering inter-subsystem correlations and holistic performance, with indicators integrating actual production data for accessibility and quantifiability. This study established a four-level energy efficiency evaluation indicator system for the gathering and transportation system of an oilfield based on its characteristics. Level 1 corresponds to the stations of the gathering and transportation system. Level 2 includes three parts for each station: energy consumption, process applicability, and economic costs. Level 3 consists of equipment-level indicators or directly calculable evaluation metrics. Level 4 further refines indicators from Level 3 that cannot be directly calculated, such as pump efficiency and energy consumption per unit of liquid volume. Additionally, indicator screening was performed according to the actual production characteristics of the oilfield.
An investigation of evaluation systems across over ten domestic oilfield gathering and transportation systems identified universally applicable indicators, such as energy consumption per unit of liquid volume and crude oil. Equipment-level indicators requiring detailed specification, including heater efficiency and pump efficiency, must be selected according to the actual operational conditions of specific gathering and transportation systems. Similarly, economic cost indicators were selected according to respective process flows. For the water-flooded light oil development block in the central region of the oilfield, adaptive screening of the investigated indicators was performed through an analysis of gathering and transportation system processes, major energy-consuming equipment at each station, and production operation and maintenance costs. Secondary indicators related to energy consumption, process applicability, and economic costs were selected based on station-specific conditions, establishing the evaluation system based on the characteristics of the oilfield, as shown in Figure 3. In this paper, the economic cost indicators include chemical dosing costs and equipment cleaning and maintenance costs. Chemical dosing costs mainly refer to the expenses for various demulsifiers. Equipment cleaning and maintenance costs include the maintenance and repair costs for various pumps, storage tank repair costs, and burner repair costs. The calculation methods for other types of indicators are shown in Appendix A.1.
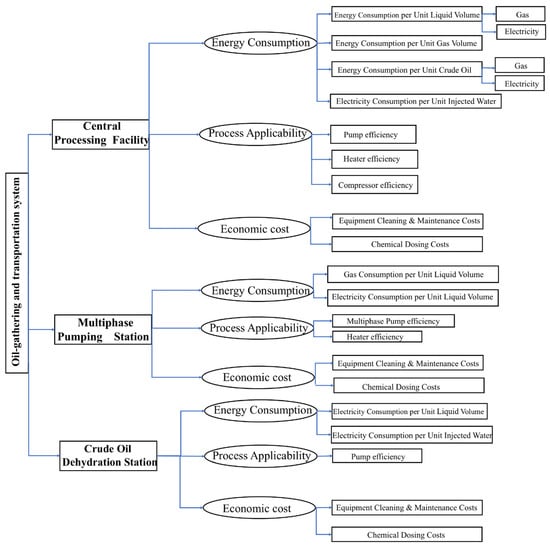
Figure 3.
Evaluation system for oilfield production characteristics.
3.2. Indicator Weighting Calculation
The rational determination of indicator weights forms the foundation for establishing a comprehensive evaluation system. Therefore, the selection of weighting methods proves critical as it significantly impacts evaluation outcomes. Weighting methods can be categorized into two types: subjective weighting and objective weighting. This study adopted a combined subjective–objective weighting approach.
3.2.1. AHP for Subjective Weight Determination
Common subjective weighting methods include AHP, the G1 method, and the Delphi method. Compared to the Delphi method, AHP offers easier implementation, while its incorporation of consistency verification ensures a more accurate weight calculation than the G1 method. As a widely used comprehensive evaluation technique, AHP has been extensively applied across multiple domains [33]. This method effectively integrates quantitative computation with qualitative analysis, making it particularly suitable for addressing multi-factor decision-making problems [34]. Its application to oil and gas gathering and transportation systems enables the decomposition of complex operational challenges and provides scientific foundations for optimal decision selection. Furthermore, AHP can be synergistically combined with other evaluation methods to mitigate limitations inherent in standalone AHP implementations [35]. Consequently, this study applied the AHP method to energy efficiency evaluation in oil and gas gathering and transportation systems. It effectively combined the inherent complexity and multi-level structure of the gathering and transportation system by deriving subjective weights for the indicators.
The procedural steps for determining subjective weights via the AHP are outlined as follows [36]:
First, construct an n-order judgment matrix and perform normalization processing on aij to obtain the value wij.
Then, calculate the maximum eigenvalue of judgment matrix A and compute the consistency index (CI).
Calculate the consistency ratio based on corresponding to the order n of the judgment matrix:
If , the judgment matrix passes the consistency check; otherwise, the matrix must be revised until it meets the consistency requirement.
After passing the consistency test, the indicator subjective weights can be calculated:
3.2.2. EWM for Objective Weight Determination
Common objective weighting methods include the EWM, principal component analysis, and factor analysis. The entropy weight method has gained widespread application in decision-making in recent years [37,38,39]. Compared with the other two methods, the EWM is more suitable for scenarios with limited data volume or suboptimal data distribution, as it relies on the degree of data dispersion for weighting [40]. Given the complexity of oilfield gathering and transportation systems, where data distribution and volume may be inadequate, we selected the entropy weight method to derive objective weights.
The procedural steps for determining objective weights via the EWM are outlined as follows [23]:
First, construct the indicator matrix and normalize the data. Classify indicators into positive indicators (where higher values are better) and negative indicators (where lower values are preferred). Positive indicators are processed according to Formula (5), and negative indicators are determined according to Formula (6); then, obtain the processed value yij.
In Formula (5), min xj represents the minimum value of the j-th indicator, and the rest can be deduced by analogy. In this study, energy consumption data and cost data were negative indicators, while efficiency was considered a positive indicator.
Then, calculate the information entropy for all m indicators.
Once the information entropy is obtained, the indicator objective weights can be calculated:
3.2.3. Integration of Subjective and Objective Weights
Subjective and objective weighting methods each have their own advantages and limitations in practical applications. The advantage of subjective weighting lies in its ability to incorporate professional knowledge and practical experience, but excessive reliance on subjective judgments may cause weights to deviate from actual data. In contrast, objective weighting methods rely entirely on data characteristics for calculation, which effectively enhances the verifiability of results but lacks the integration of professional knowledge to assess their rationality. Therefore, this study adopted a combined subjective–objective weighting approach to determine evaluation indicator weights, effectively integrating the advantages of both methods to obtain more reliable weights.
The integration of AHP and EWM yields a combined weighting solution. Assuming AHP-derived weights and EWM-derived weights , a weighted combination method was employed to obtain the final indicator weights .
3.3. Comprehensive Evaluation Model Construction
Following the determination of evaluation indicator weights, the construction of a comprehensive evaluation model commenced. Widely adopted comprehensive evaluation methods include GRA, FCE, neural network evaluation (NNE), and data envelopment analysis (DEA). For oil and gas gathering and transportation systems, empirical validation has demonstrated the relatively strong applicability of GRA and FCE.
Compared to FCE, GRA exhibits superior capability in handling scenarios with limited or incomplete datasets [40]. In energy efficiency evaluation for oil and gas gathering and transportation systems, data completeness constitutes a critical consideration. GRA directly quantifies energy efficiency performance across indicators through grey relational degrees, offering computational simplicity—an advantage particularly suited to systems with numerous energy efficiency-influencing parameters. Furthermore, FCE relies on subjectively determined membership degrees, where inappropriate selections may induce significant result fluctuations [41]. In contrast, GRA derives results objectively from operational data. GRA has gained extensive application in fields involving sequential data analysis, such as engineering effectiveness and system performance assessments [34]. Consequently, this study employed GRA for energy efficiency evaluation of oil and gas gathering and transportation systems.
The grey relational degree is an indicator that measures the consistency of variation trends between two system factors. If the trends of two factors change with a high degree of synchronization, the grey relational degree is higher, and vice versa. GRA quantifies this relationship by analyzing the similarity in developmental trends (i.e., grey relational degree) between factors. The comprehensive evaluation procedure using GRA was structured as follows [42]:
Determine the analysis sequence by selecting the optimal values of each evaluation indicator as the reference sequence.
- (1)
- Normalize individual sequences.
- (2)
- Calculate the absolute difference between the reference and comparative sequences.
- (3)
- Calculate the correlation degree :
In Formula (8), the distinguishing coefficient ranges between 0 and 1. In this study, was 0.05. Studies have shown that the grey relational degree exhibits favorable performance under this value [32]. denotes the minimum difference, and represents the maximum difference.
- (4)
- Calculate the grey relational degree :
The evaluation was conducted based on the calculated grey relational degree. A higher grey relational degree indicated greater similarity between the evaluation indicator and the reference ideal value, signifying the superior operational energy performance of the indicator. Conversely, a lower grey relational degree reflected poorer energy utilization efficiency (The ideal value selected in this paper refers to the optimal value of the same indicator within the evaluated time interval.).
Based on the GRA method, the quantitative evaluation of all indicators enabled the precise identification of energy efficiency weak points, thereby facilitating targeted optimization.
4. Case Study
4.1. Basic Data
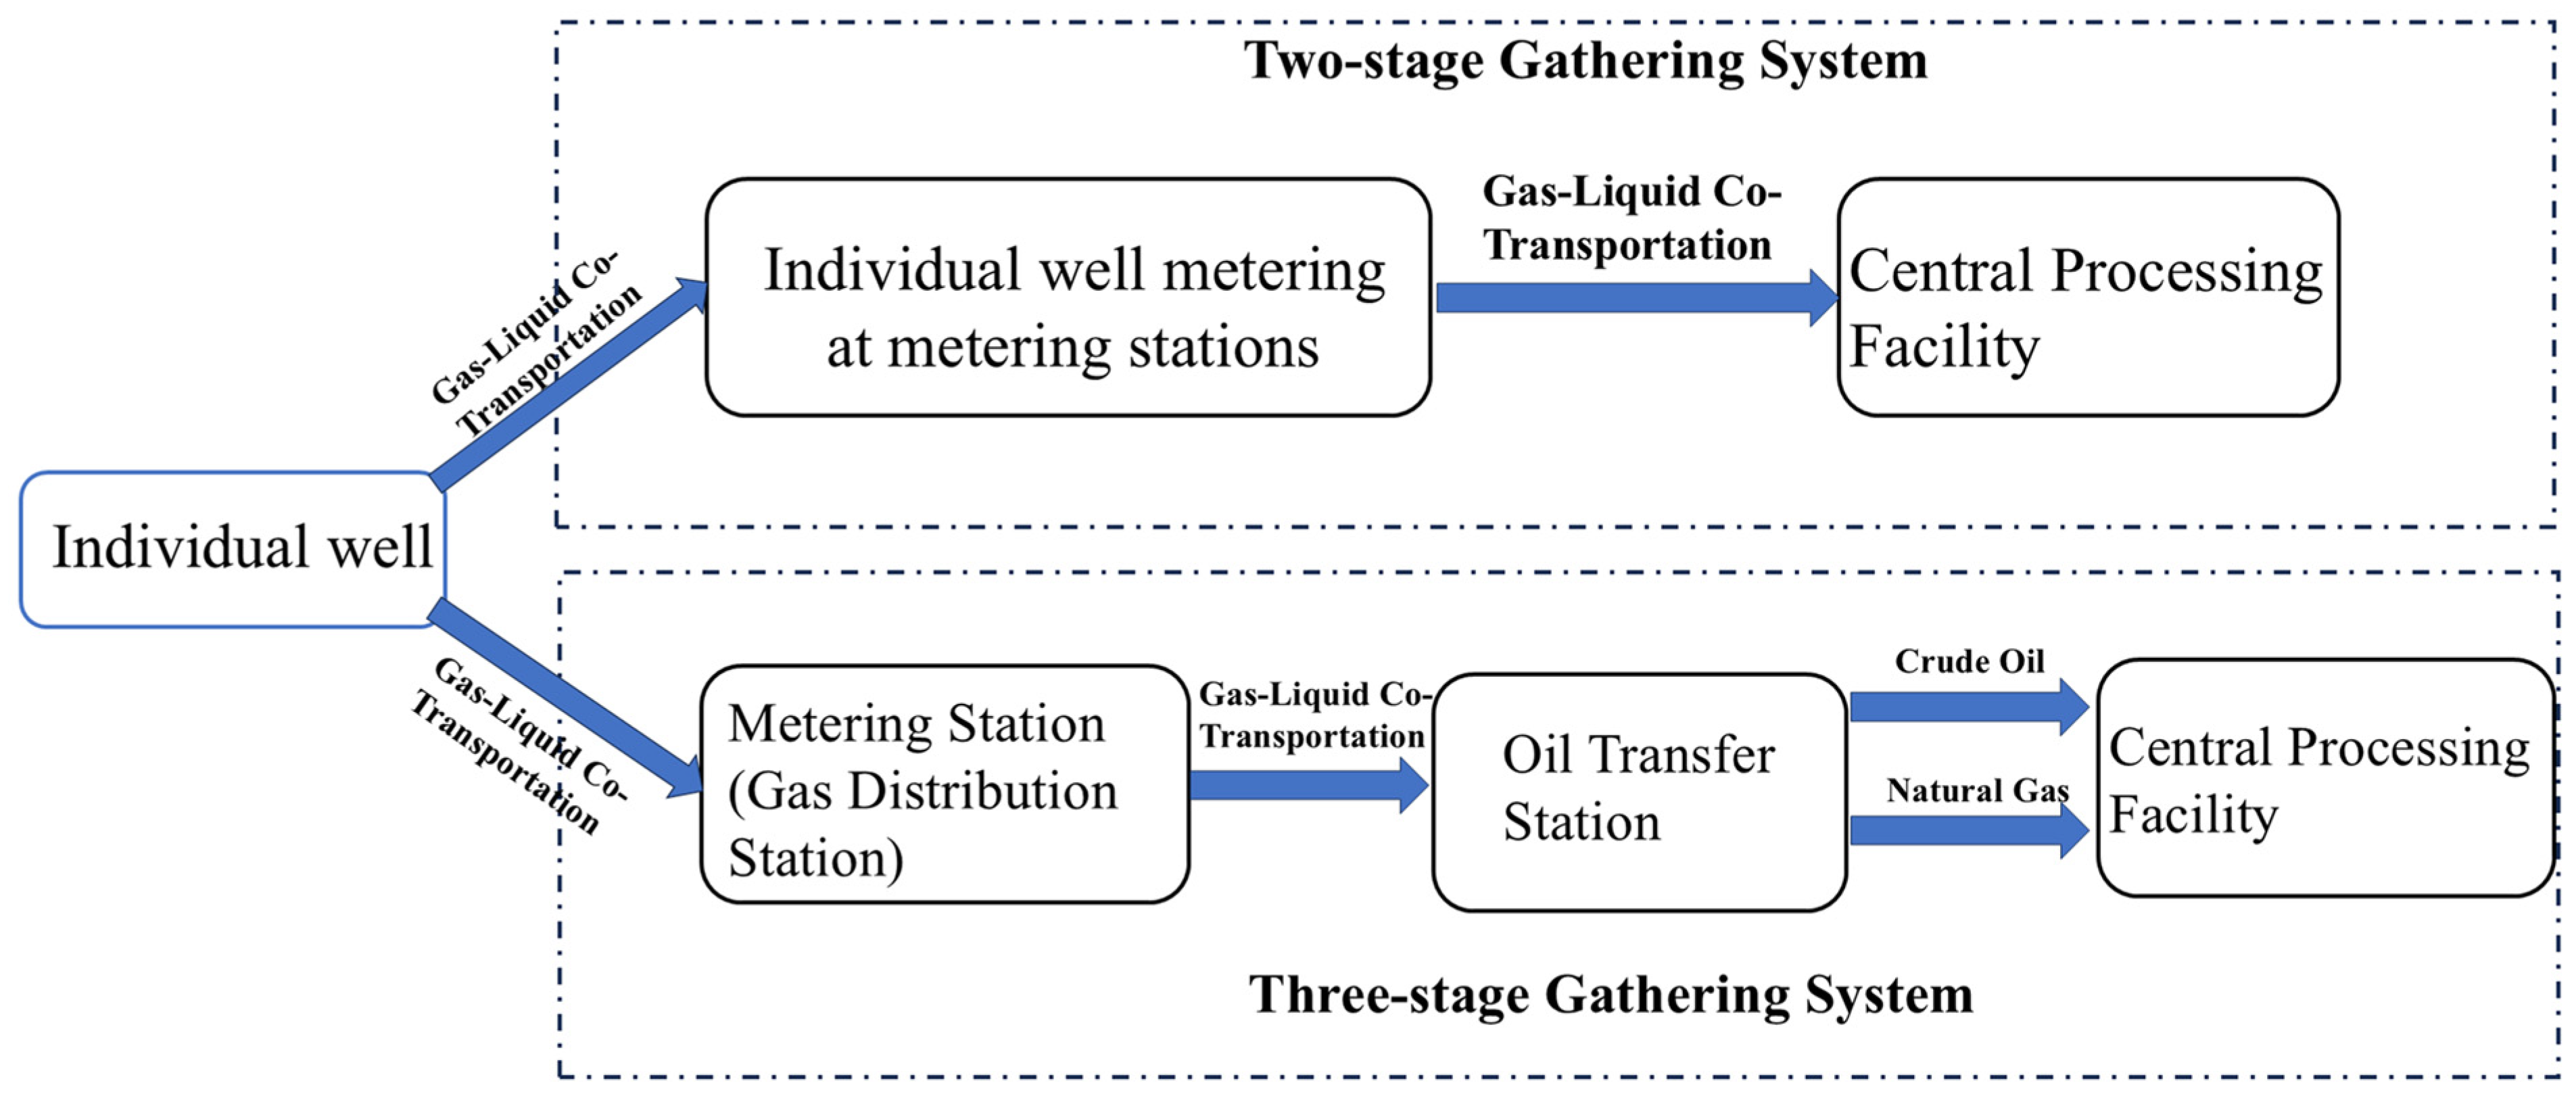
Light oil fields primarily employ two-stage (wellhead-metering–light crude processing) and three-stage (wellhead-metering–transfer–light crude processing) station deployment patterns. These configurations are, respectively, applied to fields with smaller and larger gathering radii and produced water volumes [43,44]. The station deployment patterns are illustrated in Figure 4.
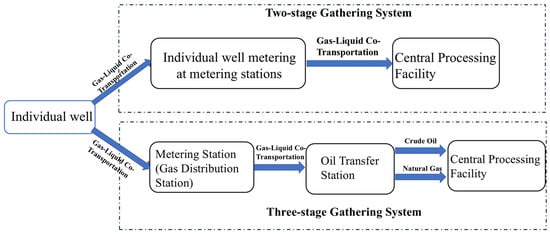
Figure 4.
Surface gathering and transportation system of light oil.
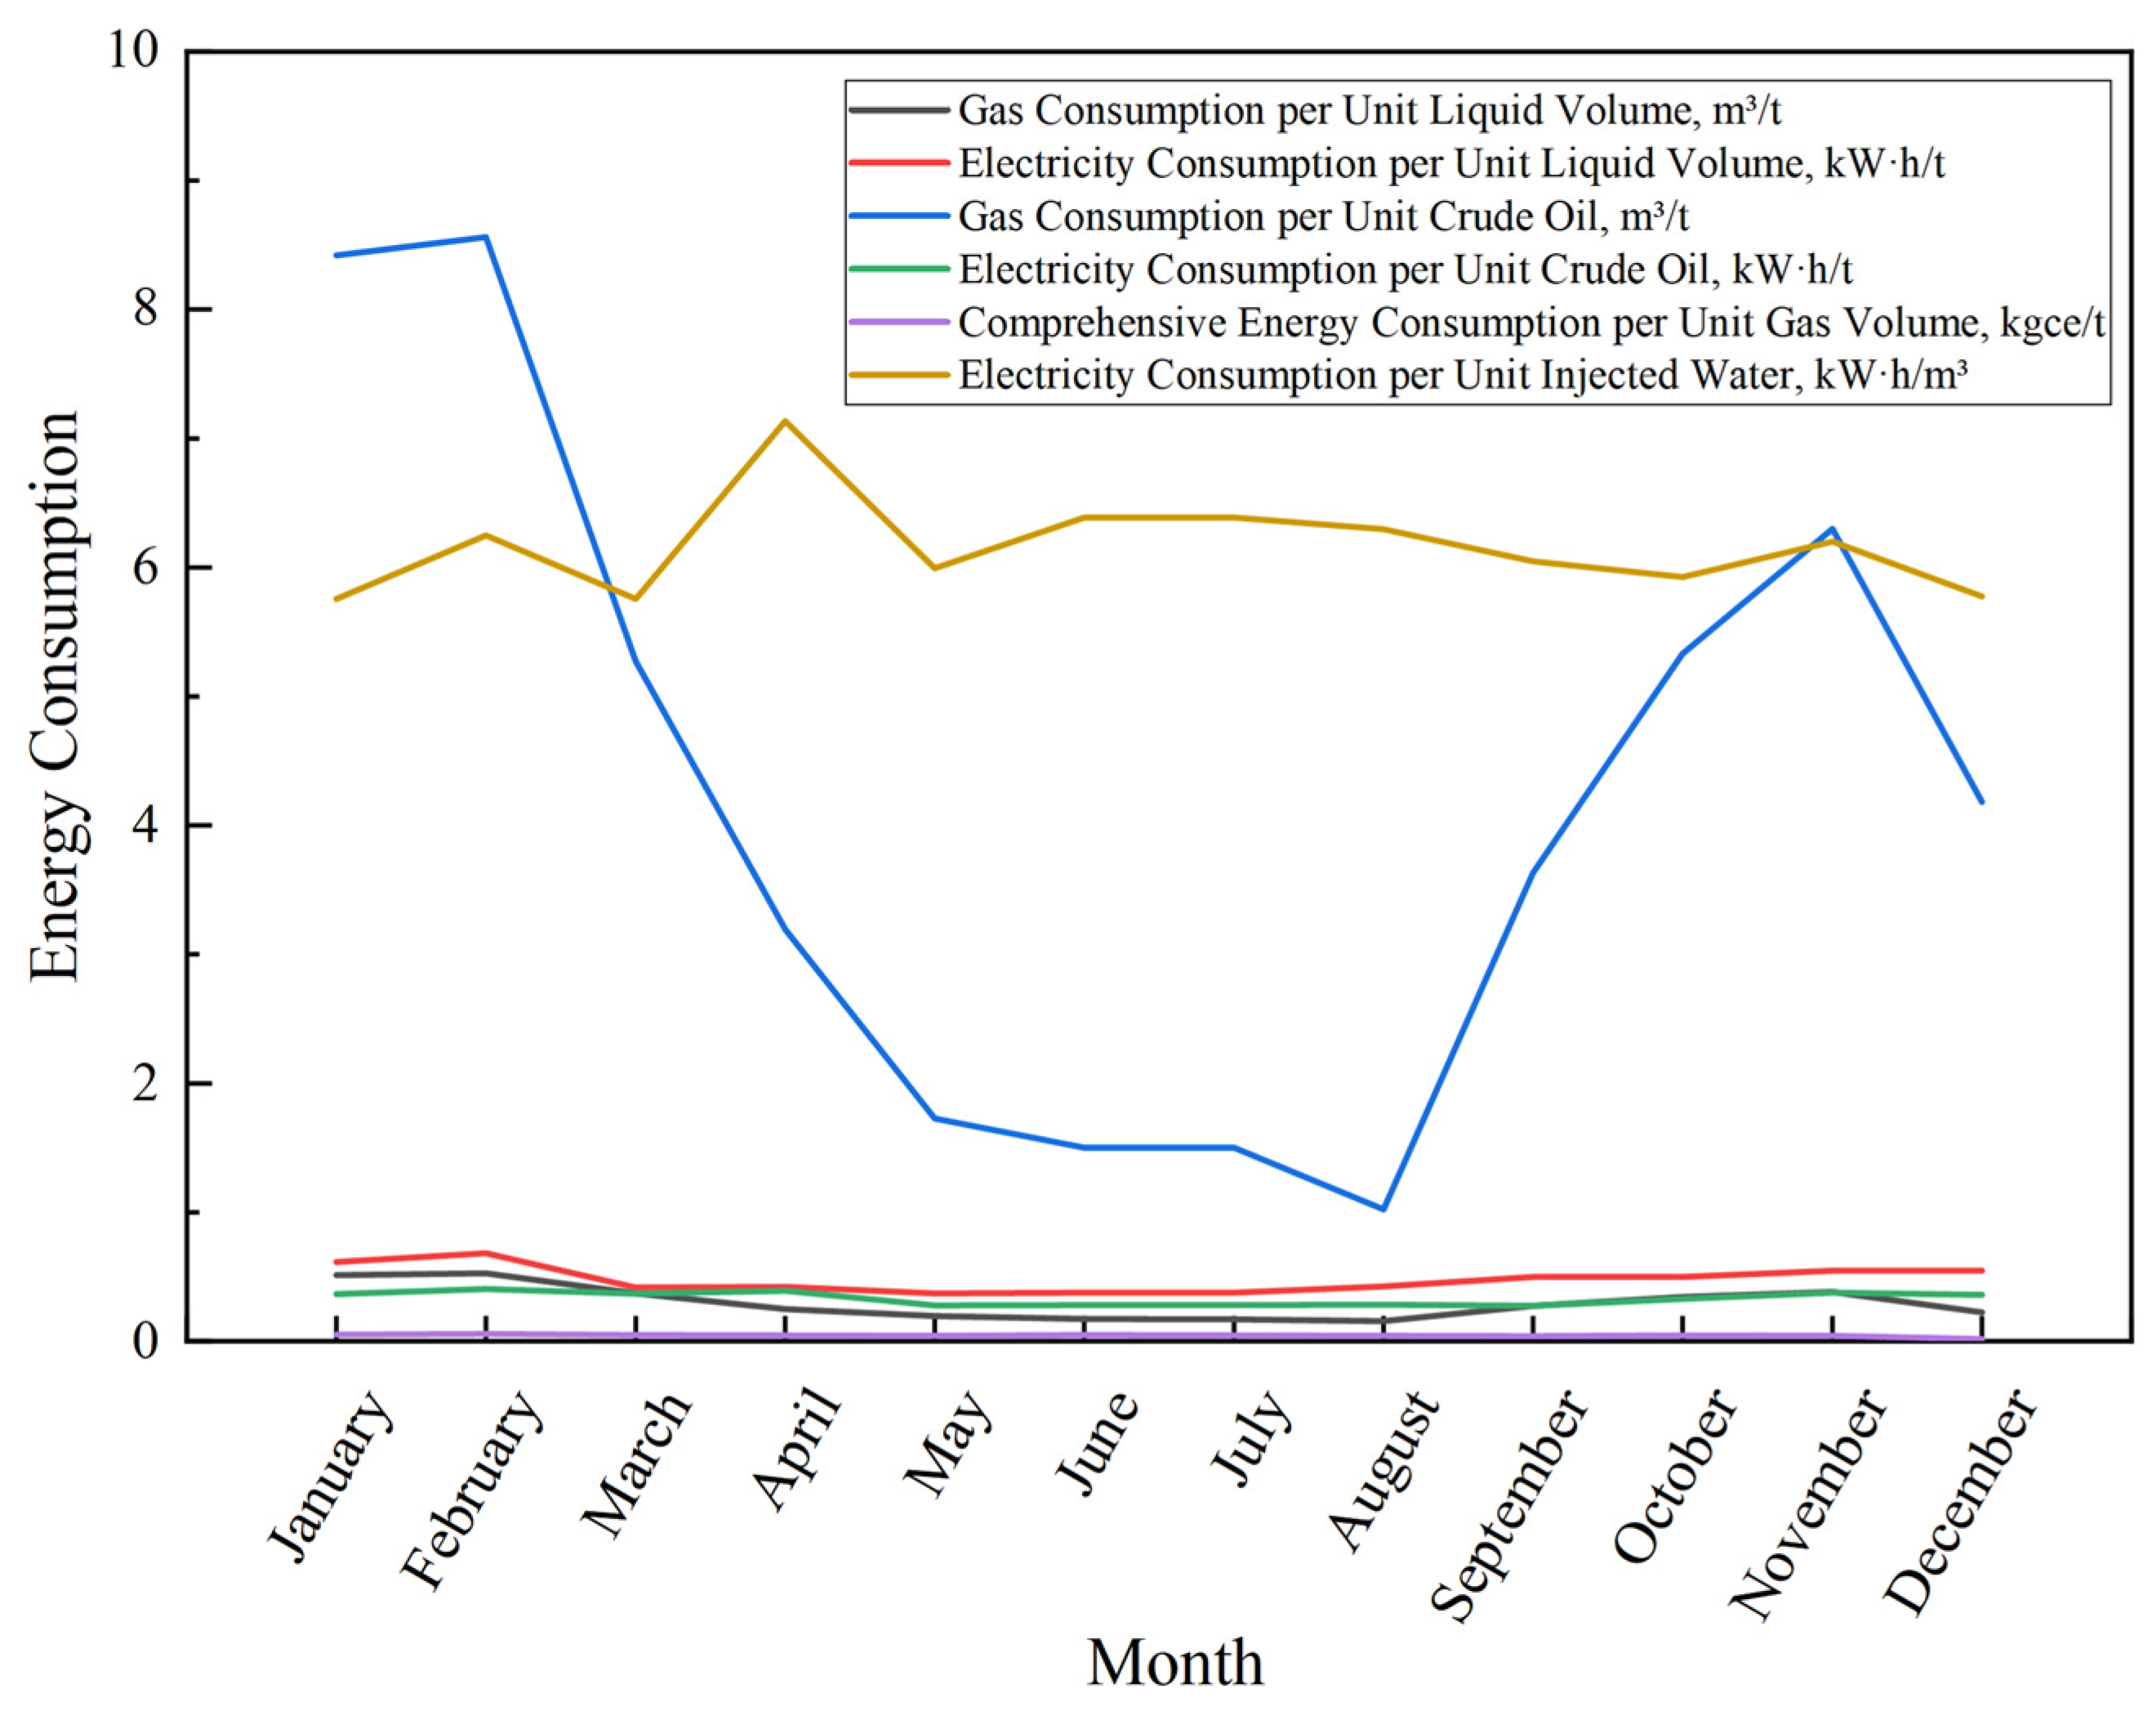
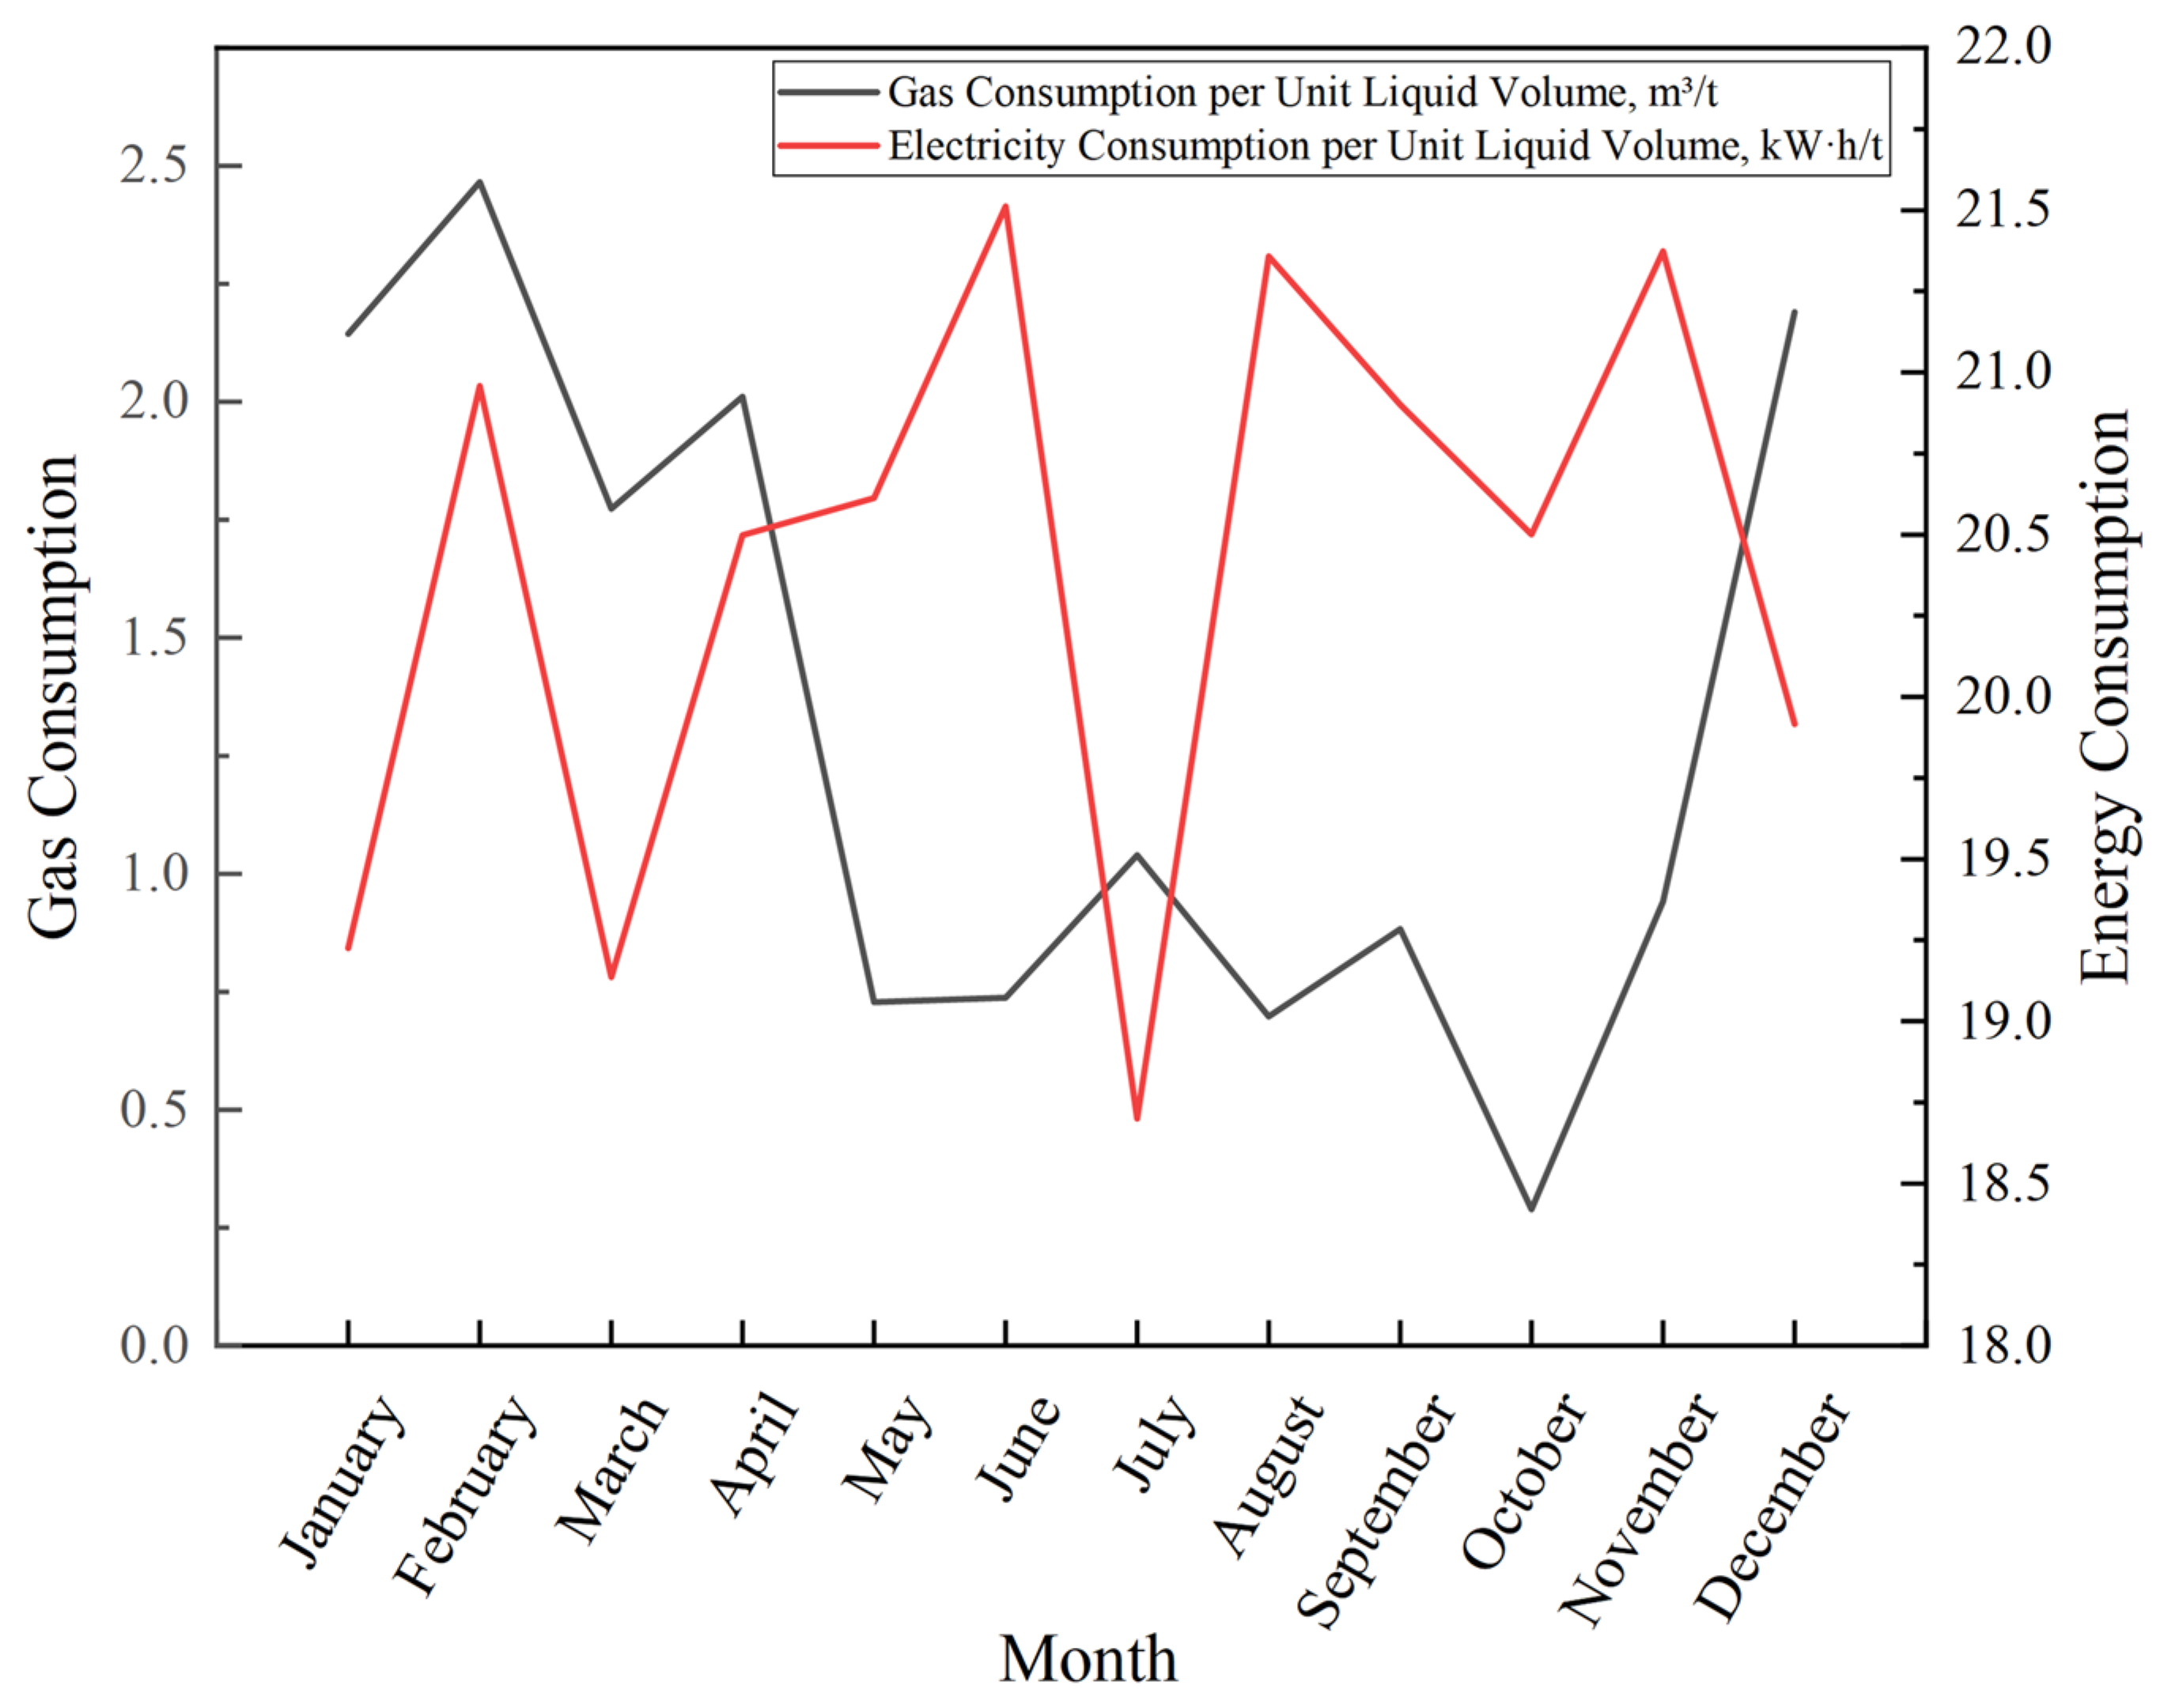
This study investigated a gathering block in an oilfield, focusing on its central processing station, Lu-22 multiphase pumping station, Lu-12 dehydration station, and Lu-15 multiphase pumping station (hereinafter referred to as A, B, C, and D). Annual operational data from these stations were collected, processed, and analyzed, with specific metrics detailed in Figure 5, Figure 6 and Figure 7.
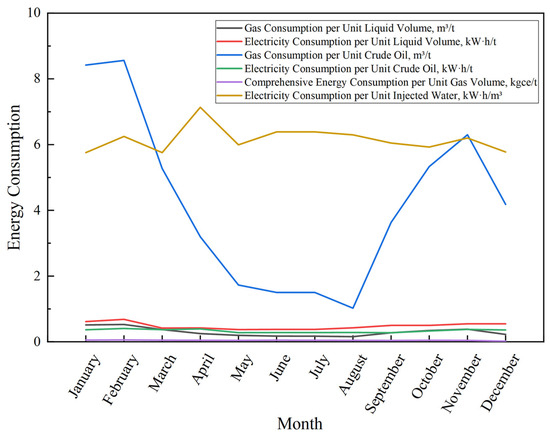
Figure 5.
Annual energy consumption data for Station A.
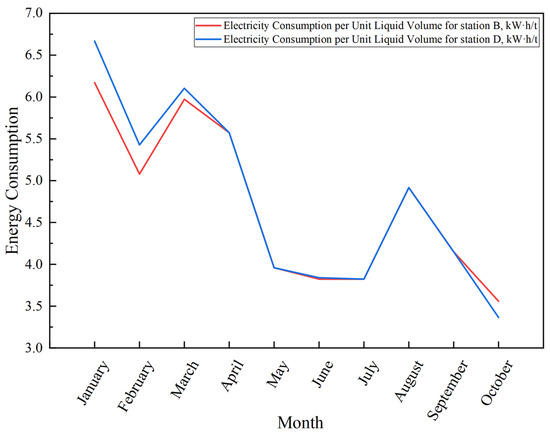
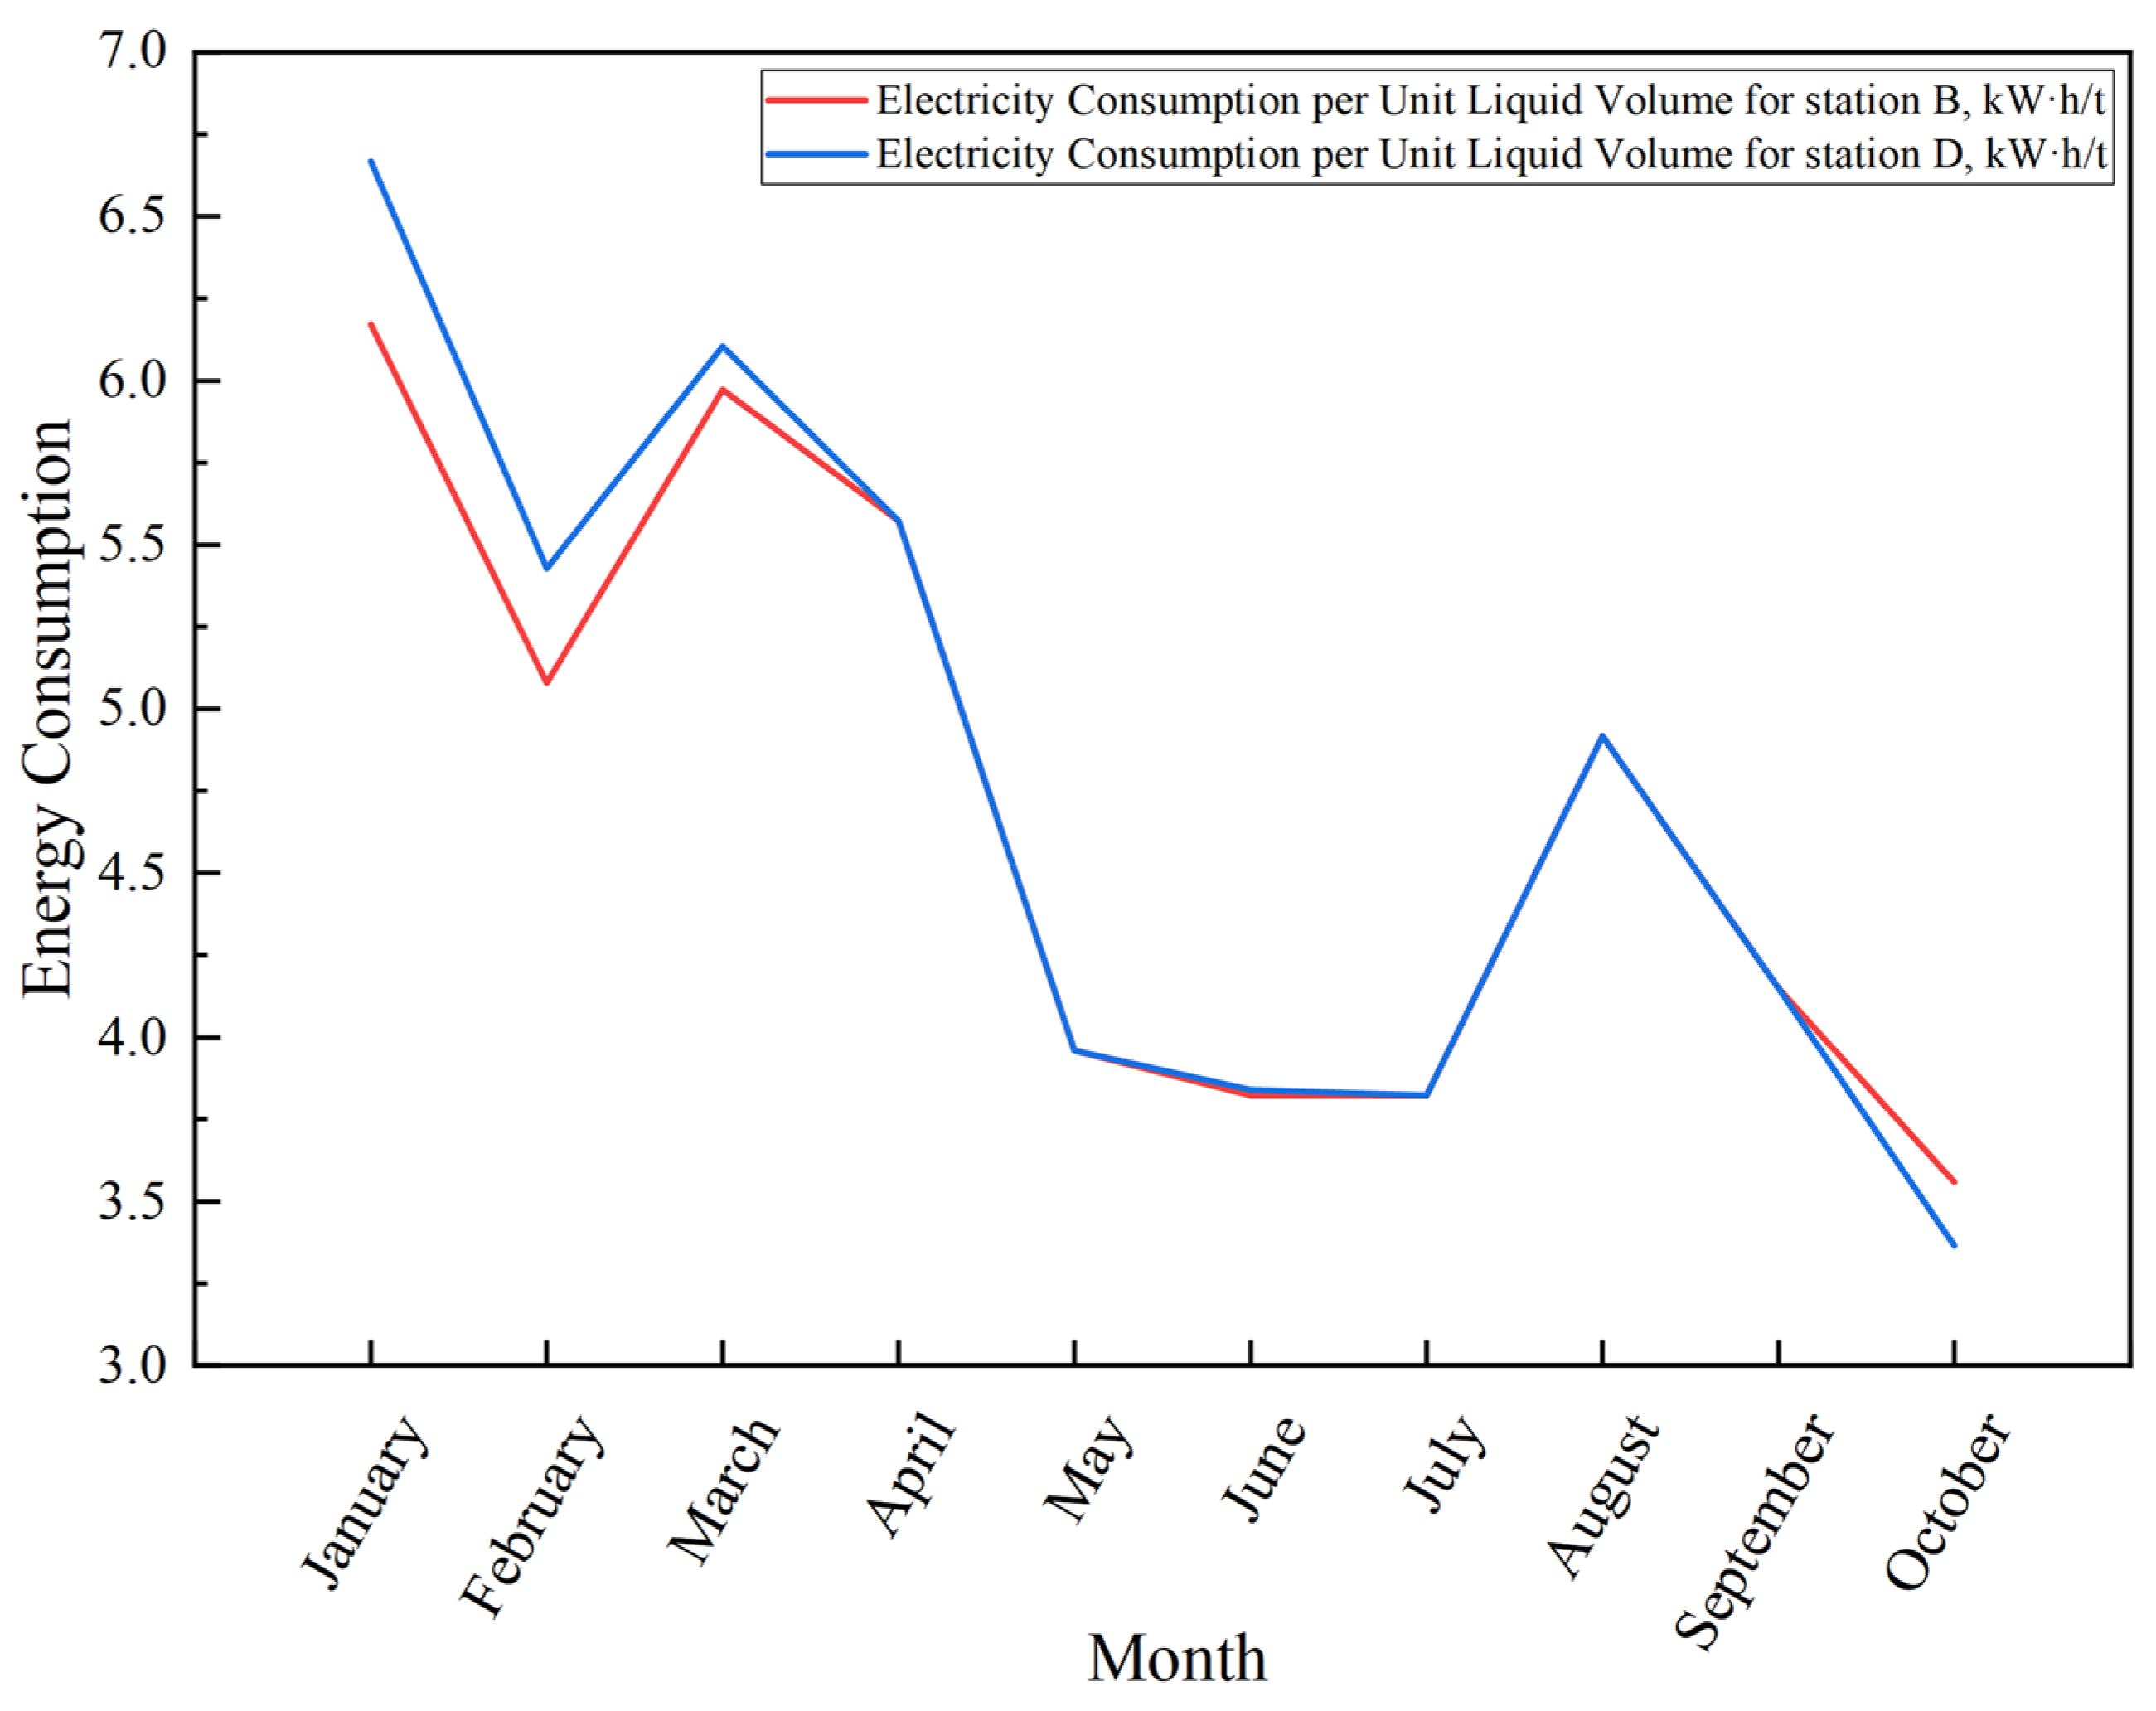
Figure 6.
Annual energy consumption data for Station B and Station D.
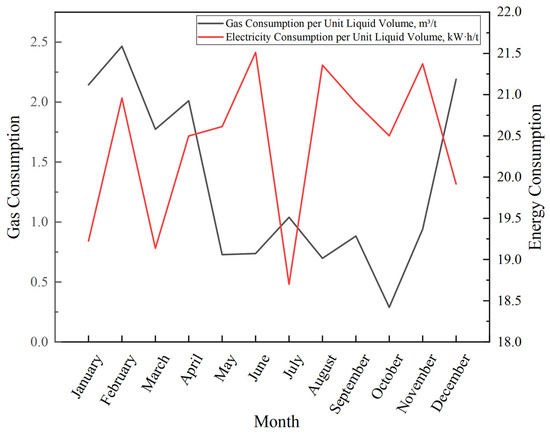
Figure 7.
Annual energy consumption data for Station C.
4.2. Calculation of Indicator Weights
Taking the central processing station as an example, its AHP judgment matrix is presented below (the judgment matrices of other stations can be found in Appendix A.2).
This study adopted the consistency ratio (CR) test method from the AHP to conduct consistency validation on the scoring sheet data. The calculation results are as follows (the remaining stations also passed inspection):
The consistency test confirmed the rationality of the judgment matrix, validating its applicability for subjective weight calculation.
For objective weight determination, quantitative analysis was conducted using the previously established EWM. A weighted combination approach effectively integrates subjective and objective weights, constructing a comprehensive weighting system that balances expert judgment with data-driven characteristics. The computational results are summarized in Table 1.

Table 1.
Indicator weights for a gathering and transportation block in an oilfield.
Table 2 presents the weights of Level 1 indicators for individual stations within the oil and gas gathering and transportation system.
Table 2.
Allocation of weights for first-level indicators in a specific block of the oilfield.
4.3. Results and Discussion
A gathering–transportation block in the oilfield was selected, and the proposed comprehensive evaluation model was applied to assess the energy-use efficiency of the gathering and transportation system. The optimal indicator set selected in this study included all four-level indicators. The grey relational degrees of the relevant factors were determined, and the relational sequence was analyzed using the monthly system energy consumption of each indicator as the comparative sequence and the optimal indicator set as the reference sequence.
The grey relational degrees between the influencing factors at each station and the optimal values were determined using the GRA formula, as illustrated in Figure 8, Figure 9 and Figure 10.
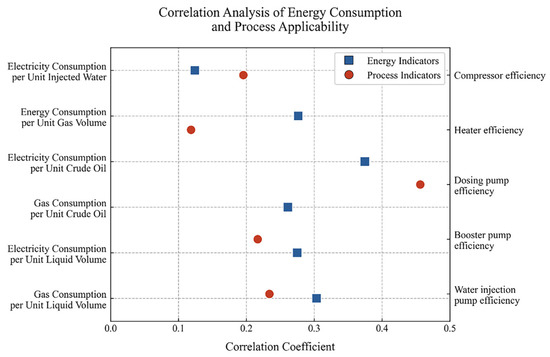
Figure 8.
The grey relational degrees of the indicators for Station A.
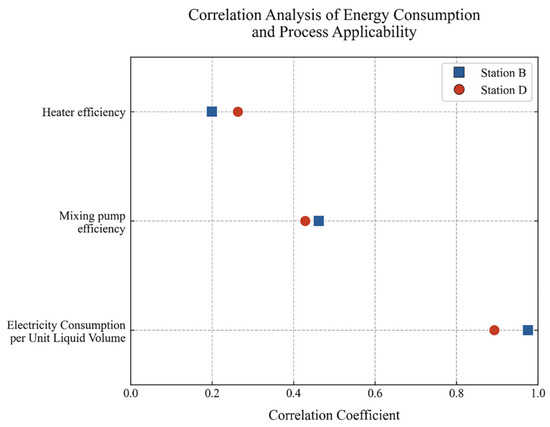
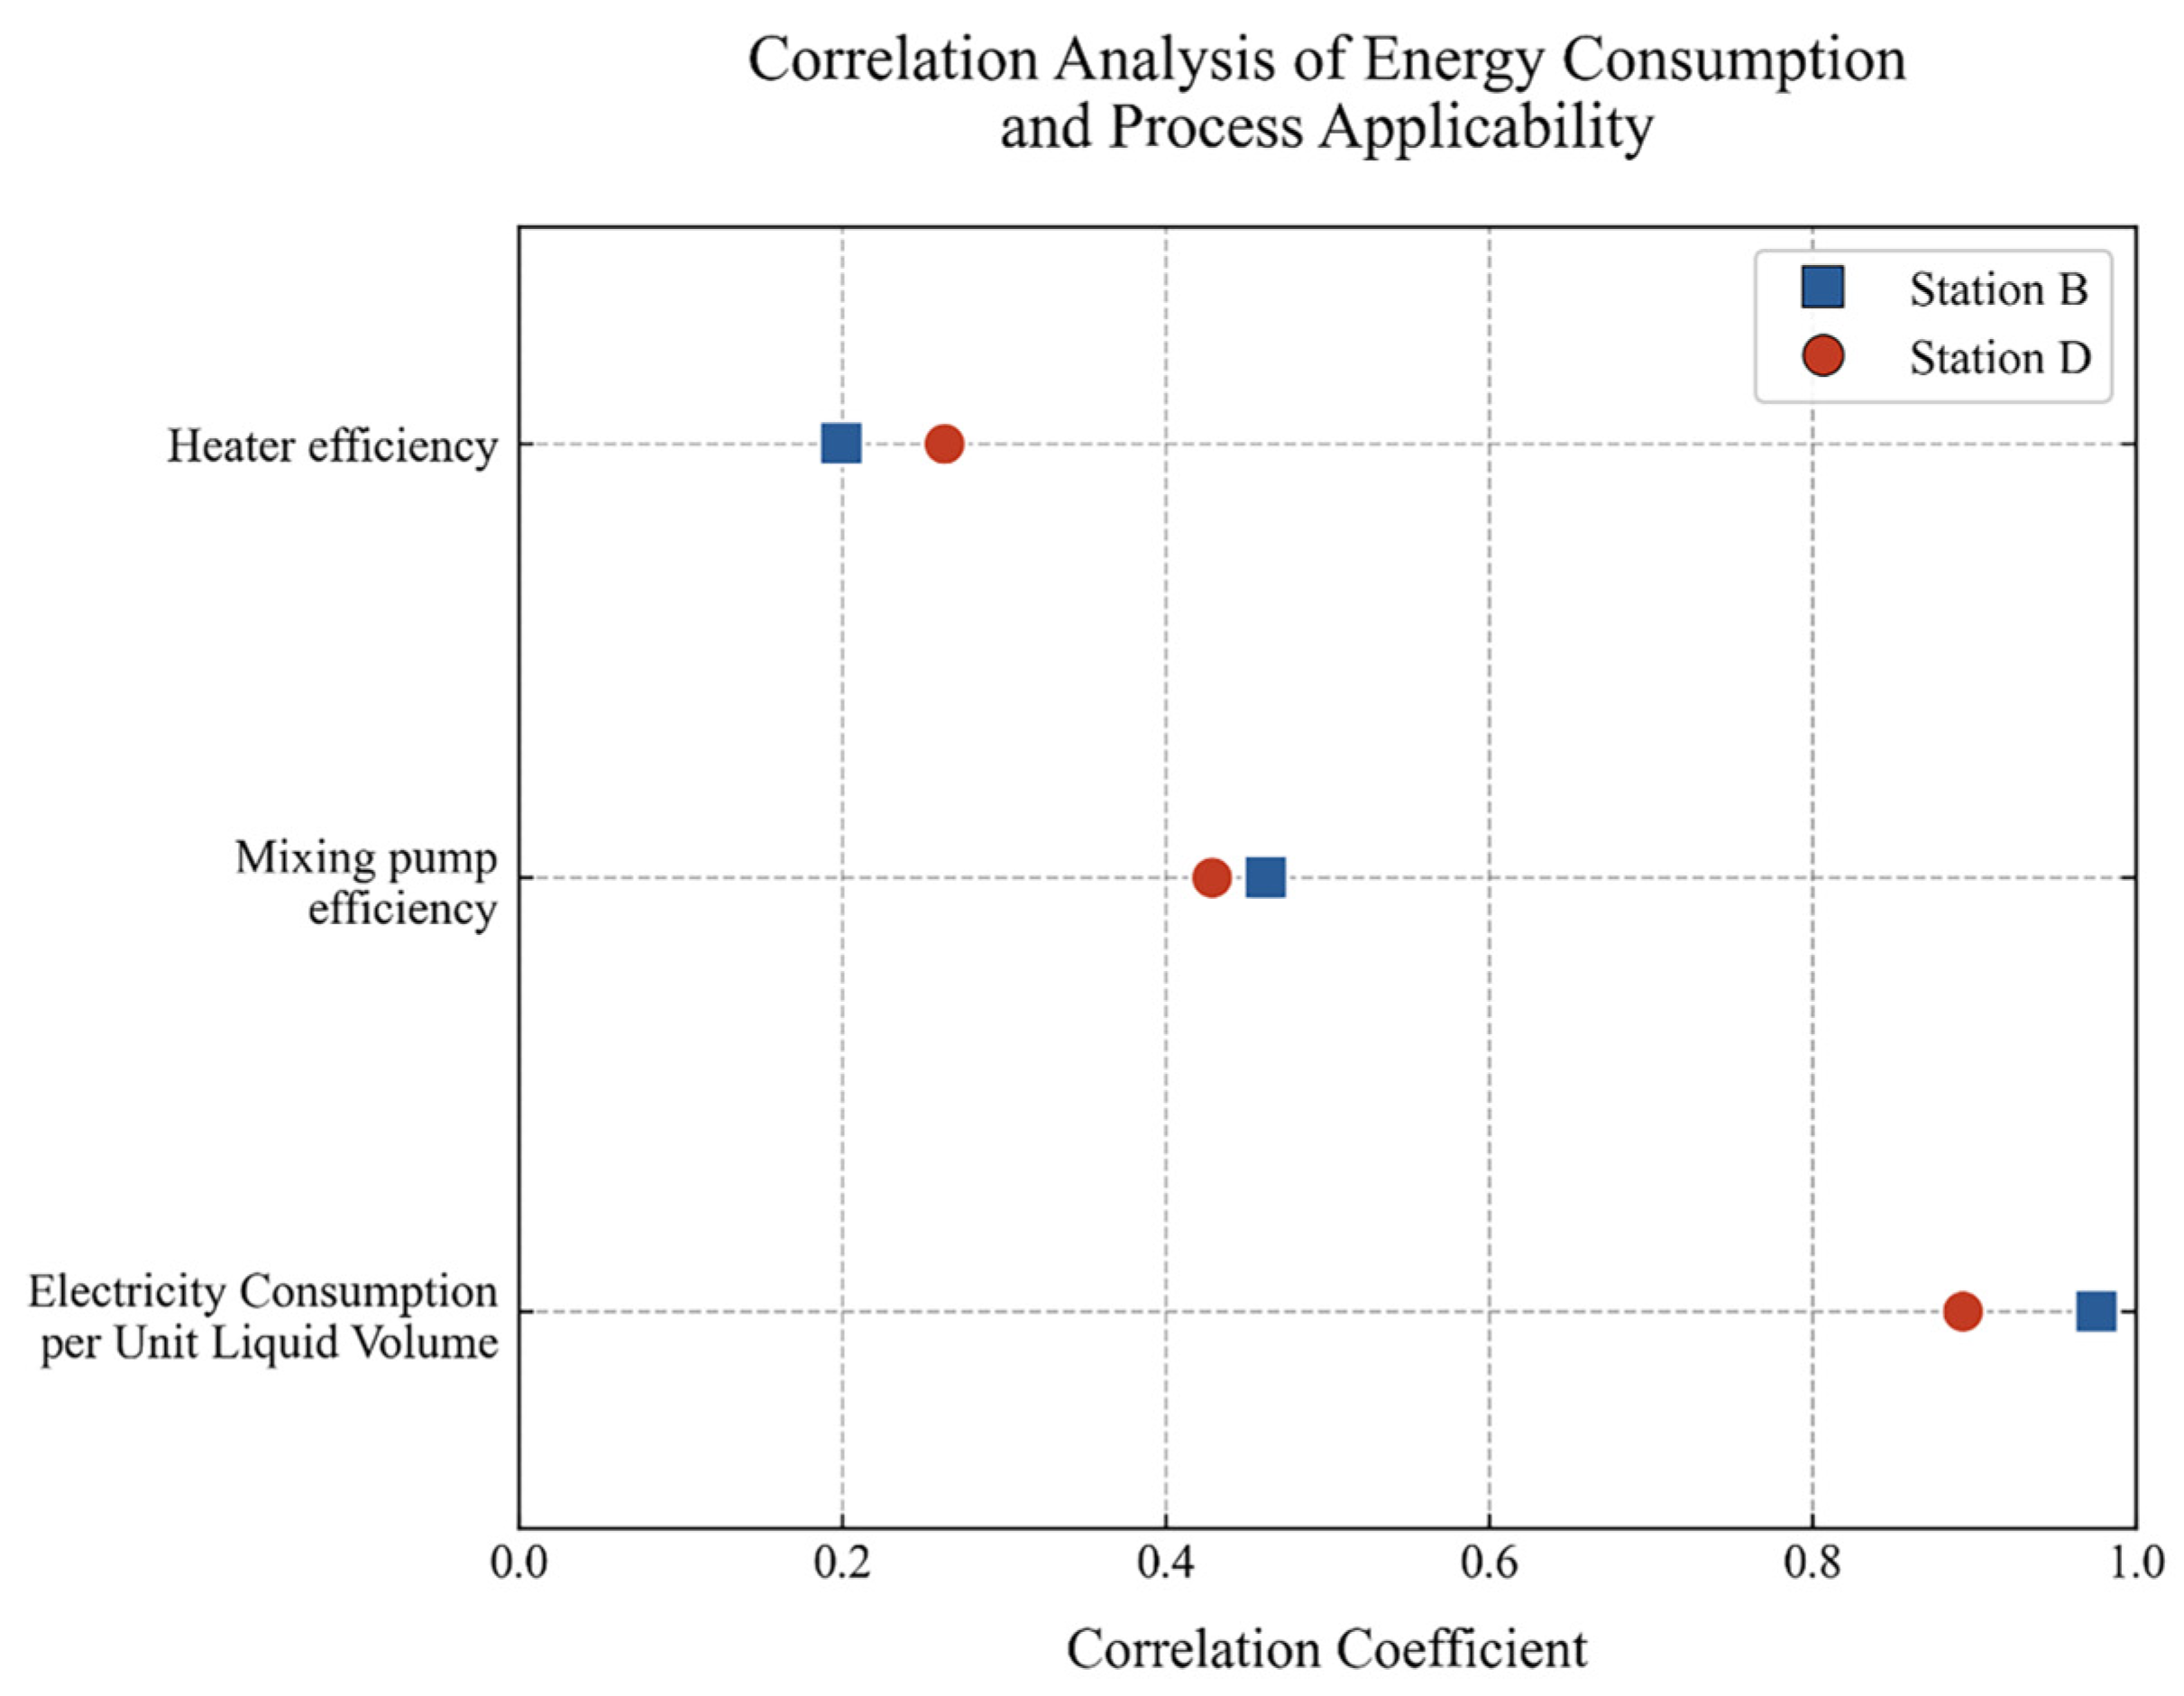
Figure 9.
The grey relational degrees of the indicators for Stations B and D.
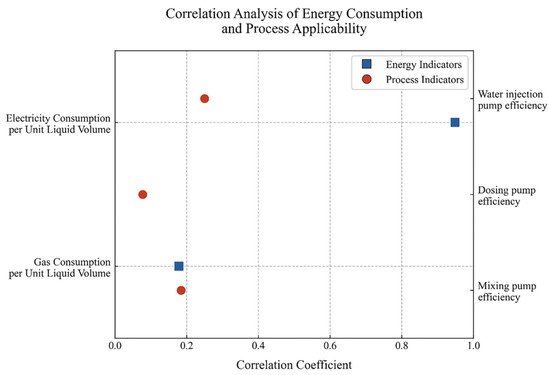
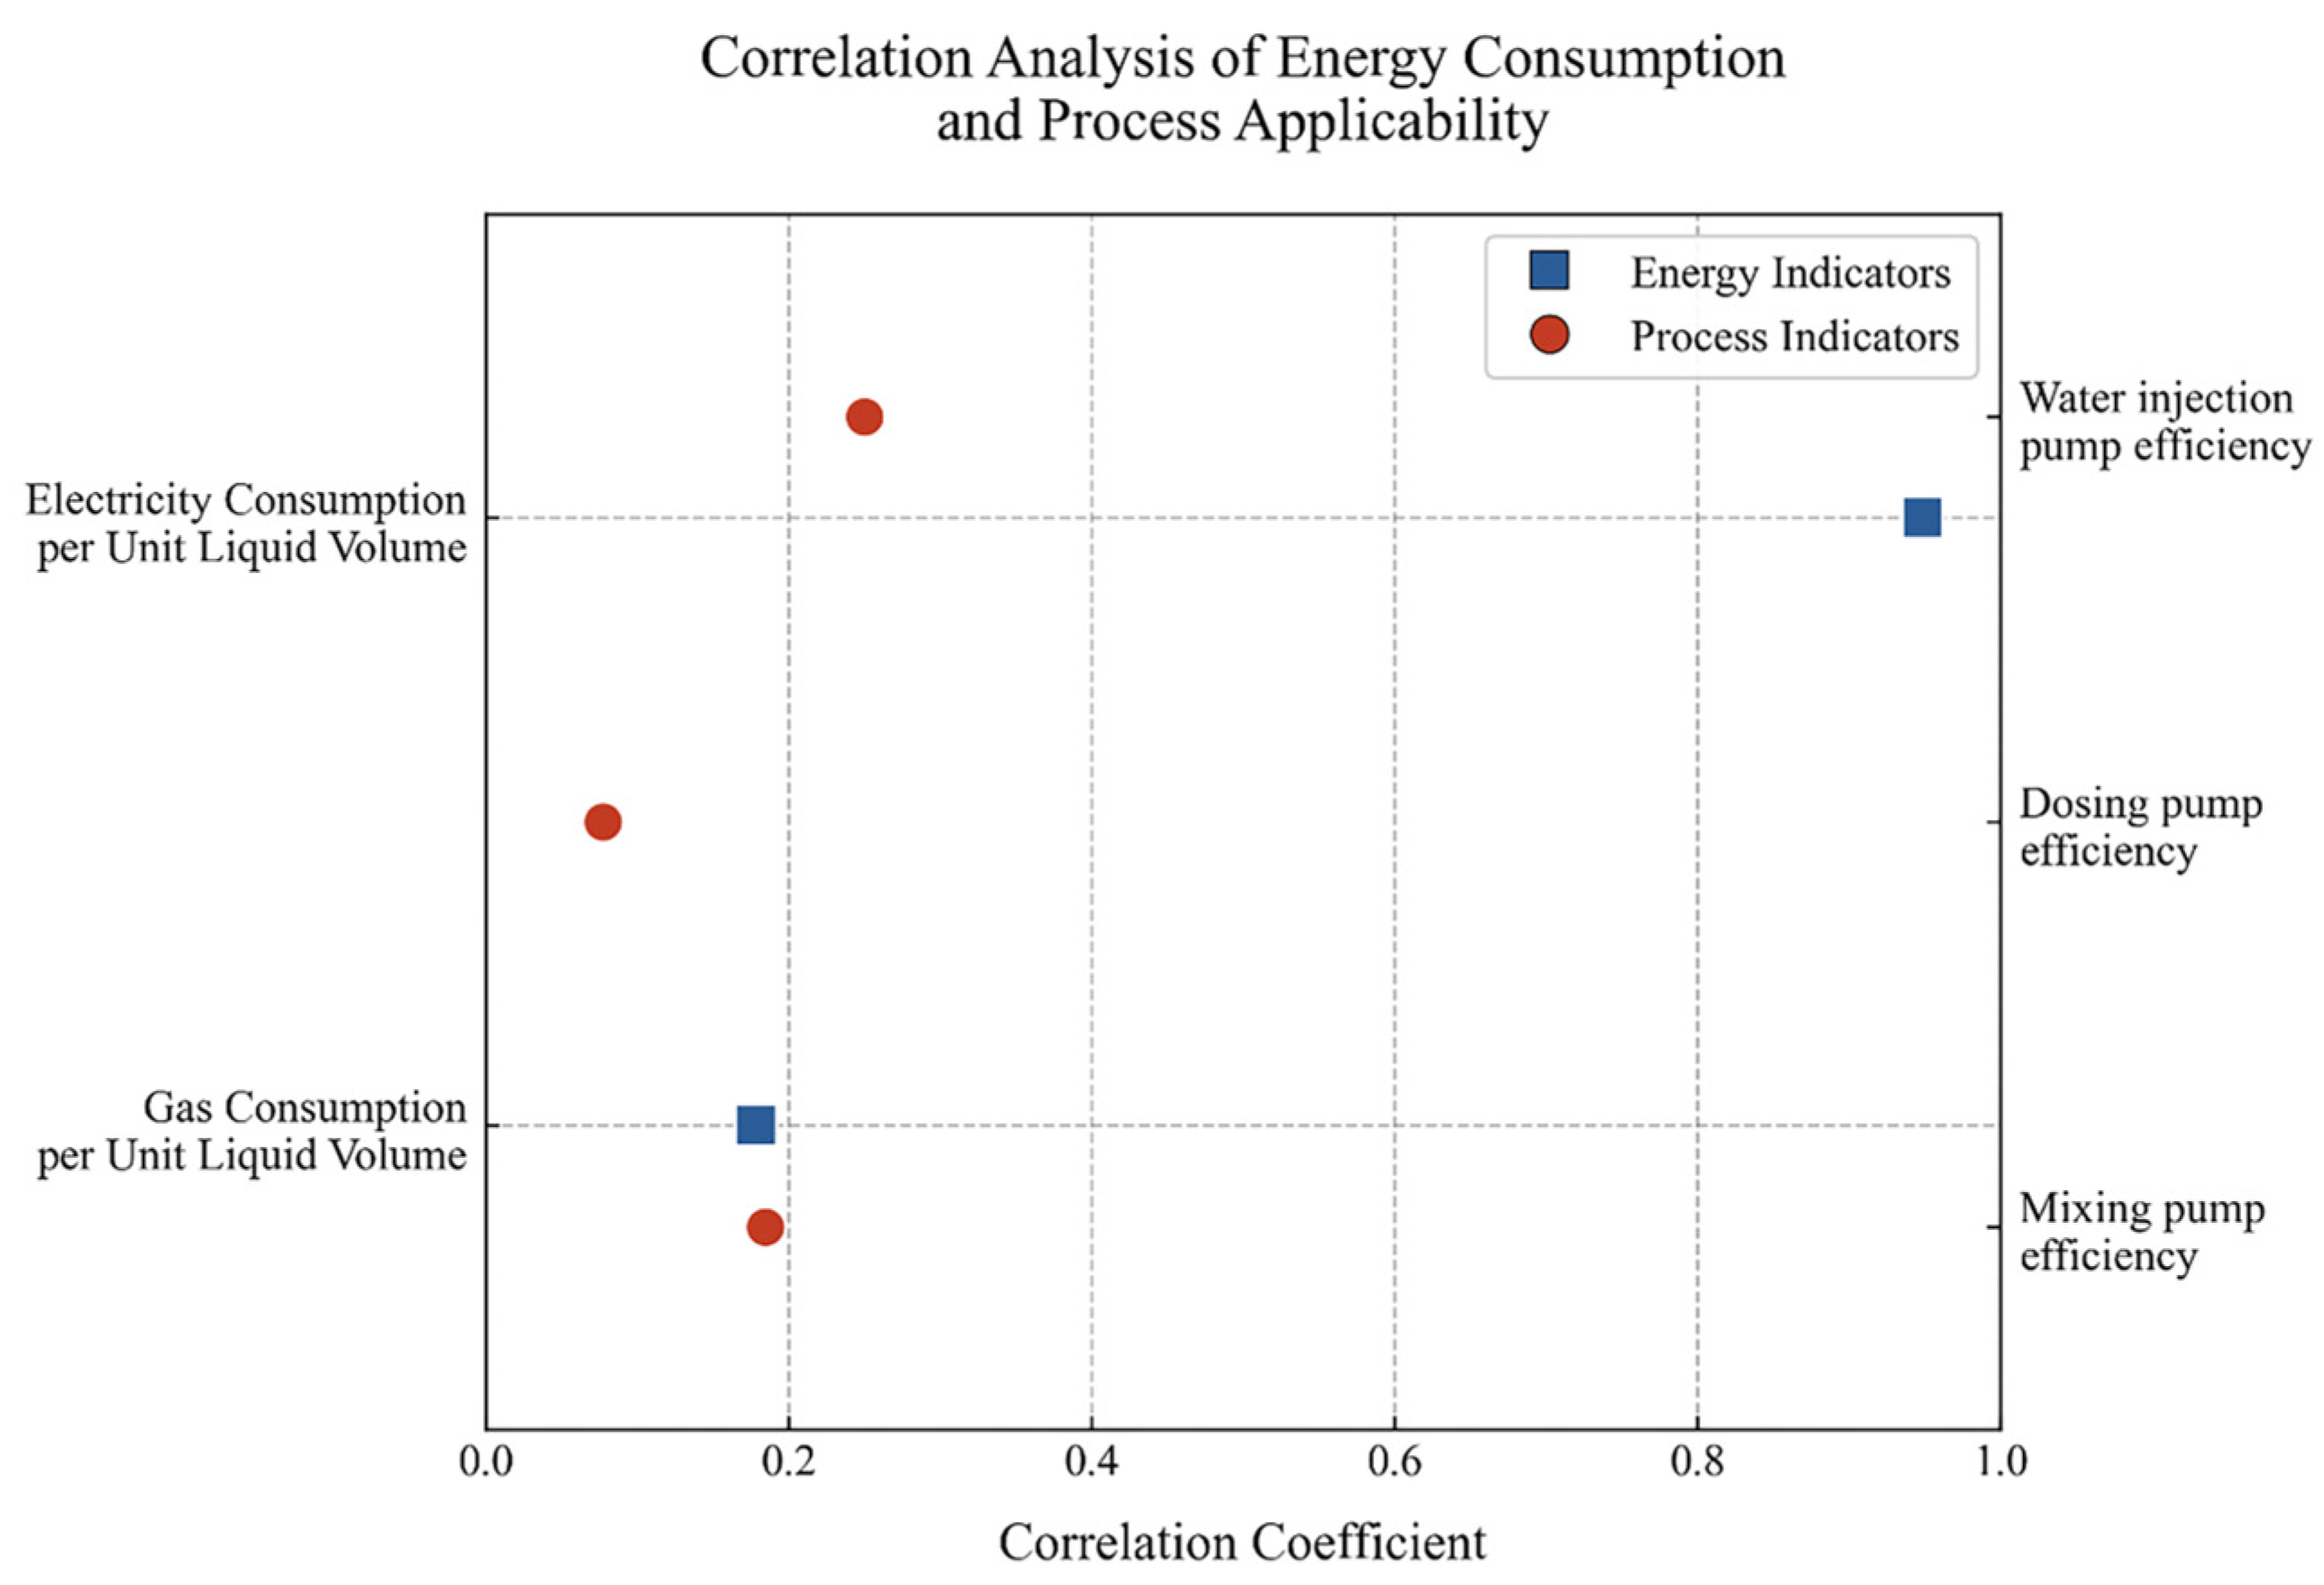
Figure 10.
The grey relational degrees of the indicators for Station C.
Figure 8 demonstrates that among the energy and process indicators, the “electricity consumption per unit of crude oil” and the “dosing pump efficiency” had the highest grey relational degree under their respective categories, indicating that their values were closest to the optimal level. Conversely, the “electricity consumption per unit of injected water” and the “heater efficiency” demonstrated the lowest grey relational degree, signifying the larger deviation from the optimal value. This highlights that these two indicators were the key points for improving the overall energy-use efficiency of Station A.
Figure 9 reveals the grey correlation degrees of indicators for two stations with identical functions. The indicator with the weakest correlation to the optimal value for both stations was “heater efficiency”. Therefore, the heater was the weak link in energy consumption for these two stations.
For the two energy indicators in Figure 10, the grey correlation degree of the “gas consumption per unit of liquid volume” was significantly lower than that of the “electricity consumption per unit of liquid volume”. This indicated greater deviation from the optimal operating state, suggesting that Station C required prioritized investigation and optimization of factors affecting this parameter.
Taking the central processing station as an example, Figure 8 shows that the primary evaluation indicators affecting energy consumption and process applicability were electricity consumption per unit of injected water and heater efficiency, listed in order of influence. Additionally, the calculations revealed that chemical dosing costs at various operational stages had the most significant impact among economic cost indicators. The elevated electricity consumption for water injection stems from the substantial reinjection of produced water into reservoirs, which is needed due to the light oil characteristics and the predominance of water-flooding development in this block. The low viscosity of light oil reduces internal frictional resistance within pumps and decreases energy losses caused by fluid turbulence and mechanical friction, resulting in higher operational efficiency of pump units and better process applicability. However, the poor process applicability of heating furnaces indicates low thermal energy utilization efficiency, necessitating strengthened pipeline insulation. In oilfields, light oil reservoirs are primarily developed through water flooding, binary flooding, and volume fracturing. The produced fluids contain complex components such as crosslinking agents and viscosifiers, which exhibit high stability and pose demulsification challenges. This necessitates elevated concentrations and dosages of demulsifiers, significantly increasing chemical expenditure.
GRA results indicated that within the technical energy consumption of the central processing station in the oilfield, the indicators with the poorest energy efficiency were electricity consumption per unit of injected water and heater efficiency, while the highest economic cost was chemical dosing costs. The electricity consumption per unit of injected water showed the lowest grey relational degree, indicating the need to optimize the water injection system through technologies like segmented water injection for rational water allocation. Aligned with the oil stabilization and water control strategy, this technology applies zonal segmented water injection to reservoirs with varying production structures, enhancing economic returns. To address the issues of high chemical dosing and operational costs in conventional and chemical flooding-produced water treatment, microbial treatment technology can be implemented. This technology utilizes a microbial treatment process combining gravity oil removal, biological contact oxidation, and filtration to achieve zero chemical dosage throughout the entire process.
Both multiphase pumping stations exhibited low heating furnace efficiency. Correlated with seasonal fluctuations in gas consumption per unit of crude oil at the centralized processing station (Figure 5), the inefficiency may originate from the inadequate insulation of long-distance pipelines and extreme winter temperature variations in the area, aggravating heat loss. Improving thermal energy utilization across the gathering and transportation system and enhancing heater efficiency is critical for energy conservation. Specific measures include flue gas temperature control, air intake regulation of heating furnaces, and rational activation/deactivation of furnaces during summer.
In dehydration stations, the poorest energy efficiency was observed in gas consumption per unit of liquid volume. The analysis of annual gas consumption trends revealed seasonal fluctuations, with the lowest value in October, likely due to ambient temperature matching pipeline transport temperature, reducing gas demand. This inefficiency may result from winter heating inefficiency and suboptimal associated gas recovery. Additionally, high polymer content in unconventional production fluids increases dehydration temperature, duration, and gas consumption. Solutions include adopting high-efficiency coalescence dehydration to lower temperature and chemical usage, alongside optimizing steam injection boiler efficiency to reduce gas consumption.
By applying the comprehensive evaluation model proposed in this study, the key factors affecting energy consumption in oil and gas gathering and transportation systems and their impact levels were evaluated and determined based on existing oilfield data. This method aids in optimizing energy management and improving the energy utilization efficiency of gathering and transportation systems. Through its application in this block of the oilfield, it can be observed that using this model allows for rapid analysis of the energy efficiency status of each indicator in the oil and gas gathering process. This enables the identification of weak points in the gathering and transportation system and provides suggestions for improvement, demonstrating characteristics of speed, reliability, and strong practicality.
5. Conclusions
This study proposes a GRA evaluation method based on combined weighting. Targeting the actual production characteristics of the light oil water-flooding development block in the central region of a certain oilfield, the potential factors influencing energy consumption were analyzed. Based on this, an evaluation indicator system applicable to oil and gas gathering and transportation systems was established, with Level 1 indicators including central processing stations, multiphase pumping stations, dehydration stations, and pipeline networks. Through comparative analysis, the GRA method was optimized. A combined subjective–objective weighting approach was adopted to enhance the rationality of indicator weights. Based on the characteristics of light oil gathering and transportation systems, the optimal values of evaluation indicators were selected as the reference sequence, and a GRA model was established using the AHP-EWM with a distinguishing coefficient of 0.05. By calculating grey relational degrees, the energy usage conditions within each station can be reflected, providing a basis for tapping potential and enhancing efficiency.
The evaluation model constructed in this study was applied to a light oil gathering and transportation block in an oilfield. Through quantitative analysis, the weight distribution of energy efficiency indicators and grey relational degrees for each station were determined. Case analysis demonstrated that the grey relational degree of electricity consumption per unit of injected water at the central processing station was 0.12, indicating excessive electrical energy consumption in water injection, which can be mitigated by optimizing system layouts and operational parameters to minimize throttling or reflux losses. For the two multiphase pumping stations, the grey relational degrees of heater efficiency (0.20 and 0.26) revealed significant inefficiencies in thermal energy utilization, necessitating retrofits such as installing heat exchangers for waste heat recovery and reducing flue gas temperatures to enhance combustion efficiency and equipment lifespan. Additionally, the dehydration station exhibited the lowest grey relational degree (0.18) for integrated gas consumption per unit of liquid volume, suggesting energy efficiency improvements through enhanced heating system performance. This model accurately identifies station-specific energy efficiency vulnerabilities, facilitating targeted retrofitting measures. Comparative analysis shows strong alignment between the evaluation results and conclusions from prior oilfield studies [45,46], confirming the model’s applicability and providing a novel methodology for energy efficiency assessment in similar gathering and transportation systems.
6. Limitations and Future Outlook
This study achieved good results in the application of a light oil block in an oilfield, but there are still the following limitations:
- (1)
- The model in this paper was constructed based on the characteristics of light oil blocks, and their applicability to blocks with significantly different gathering and transportation modes needs to be further verified.
- (2)
- The current method is a static evaluation method, which can identify the main energy efficiency bottlenecks but may not be able to dynamically capture the changes in the system.
To address these limitations, future research will focus on the following factors:
- (1)
- Based on the proposed model, we plan to introduce dynamic capture capabilities, explore the adaptive update of indicator weights, etc., to identify new emerging inefficiency points.
- (2)
- We plan to expand the dataset and apply the model to blocks with different characteristics to verify its universality; according to the differences in application scenarios, we will study the customized needs of the evaluation indicator system.
Author Contributions
Y.S. (Yao Shi): funding acquisition, investigation, writing—review and editing; Y.S. (Yingting Sun): formal analysis, methodology; Y.Z.: formal analysis, resources; M.M.: funding acquisition, writing—review and editing; Y.C.: conceptualization, resources; M.X.: writing—original draft preparation, visualization, writing—review and editing; K.W.: visualization, software, writing—review and editing; B.H.: methodology, writing—review and editing; S.S.: validation, writing—review and editing. All authors have read and agreed to the published version of the manuscript.
Funding
This research was funded by [Science Foundation of China University of Petroleum] grant number [2462023BJRC018] and grant number [2462020YXZZ045].
Institutional Review Board Statement
Not applicable.
Informed Consent Statement
Not applicable.
Data Availability Statement
Data are contained within the article.
Conflicts of Interest
Yao Shi, Yingting Sun, Yonghu Zhang, Maerpuha Mahan were employed by the Xinjiang Oilfield Company Research Institute of Oil Production Technology, and Yingli Chen was employed by Xinjiang Oilfield Company Oil Production Plant No. 2. The remaining authors declare that the research was conducted in the absence of any commercial or financial relationships that could be construed as a potential conflict of interest.
Appendix A
Appendix A.1. AHP Indicators Description
The calculation methods for energy consumption and process applicability indicators established in this paper are as follows:
1. Energy Consumption Indicators:
- (1)
- Electricity Consumption per Unit of Crude Oil (Me):
NTe—Electricity consumption of this station (current month), kWh;
Goil—Crude oil production of this station (current month), t.
- (2)
- Gas Consumption per Unit of Crude Oil (Mgas):
ETh—Thermal energy supplied to the medium by this station, kJ;
Qgas—Low calorific value of standard fuel (oil/gas/coal), kJ/m3·(kg);
Qbase—Received low calorific value of standard fuel (oil/gas/coal), kJ/m3·(kg);
BT—Fuel consumption of this station, kg or m3.
- (3)
- Electricity Consumption per Unit of Liquid Volume (Mel):
Gl—Produced liquid handling volume of this station (current month), t.
- (4)
- Gas Consumption per Unit of Liquid Volume (Mgasl)
- (5)
- Energy Consumption per Unit of Gas Volume (Mg)
Ggas—Associated gas handling volume of this station (current month), m3.
- (6)
- Electricity Consumption per Unit of Injected Water (Mi):
Gi—Water injection Volume, m3.
2. Process Applicability Indicators:
- (1)
- Pump Efficiency ():
PU—Pump output power, kW;
PA—Pump input power, kW;
Ne—Effective power, kW;
N—Shaft power, kW;
QT—Theoretical flow rate, m3/s;
HT—Theoretical head, m.
- (2)
- Compressor Efficiency ():
Z—Compressibility factor of natural gas;
R—Universal gas constant, J/(mol·K);
T—Inlet temperature of the compressor, K;
k—Polytropic exponent.
- (3)
- Heater Efficiency ():
D—Mass flow rate of the heated medium, kg/h;
hout, hin—Enthalpy of the heated medium at the outlet and inlet, kJ/kg;
B—Fuel consumption rate of the heater, kg/h;
Qin—Input heat, kJ/kg.
Appendix A.2. AHP Judgment Matrix
Table A1.
Judgment matrix for indicators of Station B.
Table A1.
Judgment matrix for indicators of Station B.
| Gas Consumption per Unit of Liquid Volume | Electricity Consumption per Unit of Liquid Volume | Multiphase Pump Efficiency | Heater Efficiency | Chemical Dosing Costs | Equipment Cleaning & Maintenance Costs | |
|---|---|---|---|---|---|---|
| Gas Consumption per Unit of Liquid Volume | 1 | 4/5 | 3/4 | 5/4 | 4 | 5/2 |
| Electricity Consumption per Unit of Liquid Volume | 5/4 | 1 | 4/5 | 3/2 | 5 | 3 |
| Multiphase Pump Efficiency | 4/3 | 5/4 | 1 | 3/2 | 4 | 4 |
| Heater Efficiency | 4/5 | 2/3 | 2/3 | 1 | 4 | 2 |
| Chemical Dosing Costs | 1/4 | 1/5 | 1/4 | 1/4 | 1 | 1/2 |
| Equipment Cleaning and Maintenance Costs | 2/5 | 1/3 | 1/4 | 1/2 | 2 | 1 |
Table A2.
Judgment matrix for indicators of Station C.
Table A2.
Judgment matrix for indicators of Station C.
| Gas Consumption per Unit of Liquid Volume | Electricity Consumption per Unit of Liquid Volume | Multiphase Pump Efficiency | Dosing Pump Efficiency | Injection Water Pump Efficiency | Chemical Dosing Costs | Equipment Cleaning & Maintenance Costs | |
|---|---|---|---|---|---|---|---|
| Gas Consumption per Unit of Liquid Volume | 1 | 1/3 | 5/4 | 5/3 | 1 | 3/2 | 5/4 |
| Electricity Consumption per Unit of Liquid Volume | 3 | 1 | 4 | 5 | 3 | 5 | 4 |
| Multiphase Pump Efficiency | 4/5 | 1/4 | 1 | 3/2 | 4/5 | 4/3 | 5/4 |
| Dosing Pump Efficiency | 3/5 | 1/5 | 2/3 | 1 | 3/5 | 4/5 | 2/3 |
| Injection Water Pump Efficiency | 1 | 1/3 | 5/4 | 5/3 | 1 | 3/2 | 5/4 |
| Chemical Dosing Costs | 2/3 | 1/5 | 3/4 | 5/4 | 2/3 | 1 | 4/5 |
| Equipment Cleaning and Maintenance Costs | 4/5 | 1/4 | 4/5 | 3/2 | 4/5 | 5/4 | 1 |
Table A3.
Judgment matrix for indicators of Station D (both Station B and Station D are multiphase pumping stations).
Table A3.
Judgment matrix for indicators of Station D (both Station B and Station D are multiphase pumping stations).
| Gas Consumption per Unit of Liquid Volume | Electricity Consumption per Unit of Liquid Volume | Multiphase Pump Efficiency | Heater Efficiency | Chemical Dosing Costs | Equipment Cleaning & Maintenance Costs | |
|---|---|---|---|---|---|---|
| Gas Consumption per Unit of Liquid Volume | 1 | 4/5 | 3/4 | 5/4 | 4 | 5/2 |
| Electricity Consumption per Unit of Liquid Volume | 5/4 | 1 | 4/5 | 3/2 | 5 | 3 |
| Multiphase Pump Efficiency | 4/3 | 5/4 | 1 | 3/2 | 4 | 4 |
| Heater Efficiency | 4/5 | 2/3 | 2/3 | 1 | 4 | 2 |
| Chemical Dosing Costs | 1/4 | 1/5 | 1/4 | 1/4 | 1 | 1/2 |
| Equipment Cleaning and Maintenance Costs | 2/5 | 1/3 | 1/4 | 1/2 | 2 | 1 |
References
- Li, Z.; Hao, J.; Lu, Y.; Hu, W.; Jiang, H.; Zhou, B.; Yang, H.; Kang, W.; Sarsenbekuly, B. Tunable macroscopic self-healing of supramolecular gel through host–guest inclusion. Phys. Fluids 2024, 36, 113–126. [Google Scholar] [CrossRef]
- Liang, T.; Yang, C.; Zhang, Y.; Li, P.; Qu, M.; Hou, J. Research and Application Progress of Nanofluid for Enhanced Oil Recovery. Xinjiang Oil Gas 2023, 19, 29–41. [Google Scholar] [CrossRef]
- Fan, Y.; Li, H.; Duan, S.; Gu, P.; Ren, N. Concentrated Solar Steam Generation Technology Enables Low Carbon Shallow SuperHeavy Oil Production. Xinjiang Oil Gas 2023, 19, 82–87. [Google Scholar] [CrossRef]
- Liu, W.; Ji, G.; Luo, Z.; Tian, Z. Energy analysis and evaluation method study of natural gas gathering and transportation system. Chem. Eng. Oil Gas 2016, 45, 109–116. [Google Scholar]
- Si, Z.; Duan, Z.; Qian, Q.; Chang, T.; Huang, Z. Research on Energy Efficiency Evaluation System of Oil Transfer Station System Based on Analytic Hierarchy Process. Oil-Gasfield Surf. Eng. 2019, 38, 5. [Google Scholar] [CrossRef]
- Cao, Y.; Song, M.; Zhao, W.; Xu, X.; Lin, G. Analysis on energy efficiency evaluation method of key energy system in oil and gas fields: Taking the Tarim oilfield as an example. Chem. Eng. Oil Gas 2020, 49, 106–114. [Google Scholar]
- Liu, S.; Shen, J. Improved Thermoeconomic Energy Efficiency Analysis for Integrated Energy Systems. Processes 2022, 10, 137. [Google Scholar] [CrossRef]
- Awow, C.D.; Muguthu, J.; Njoka, F. Energy efficiency potentials in oil & gas operations: A case study of South Sudan’s petroleum industry. Energy Rep. 2025, 13, 1673–1690. [Google Scholar]
- Abdulhaq, H.A.; Geiger, J.; Vass, I.; Tóth, T.M.; Medgyes, T.; Szanyi, J. Transforming Abandoned Hydrocarbon Fields into Heat Storage Solutions: A Hungarian Case Study Using Enhanced Multi-Criteria Decision Analysis–Analytic Hierarchy Process and Geostatistical Methods. Energies 2024, 17, 3954. [Google Scholar] [CrossRef]
- Li, Q.; Hao, Y.; Wang, P.; Wang, F.; Xu, M.; Bai, L.; Wang, X.; Zhang, Y. Research on Safety Evaluation of CO2 Enhanced Oil and Gas Recovery (CO2-EOR) Project: A Case Study of Dagang Oilfield. Processes 2024, 13, 28. [Google Scholar] [CrossRef]
- Majidi, A.G.; Ramos, V.; Rosa-Santos, P.; Akpınar, A.; das Neves, L.; Taveira-Pinto, F. Development of a multi-criteria decision-making tool for combined offshore wind and wave energy site selection. Appl. Energy 2025, 384, 125422. [Google Scholar] [CrossRef]
- Phani Raghav, L.; Seshu Kumar, R.; Koteswara Raju, D.; Singh, A.R. Analytic Hierarchy Process (AHP)—Swarm intelligence based flexible demand response management of grid-connected microgrid. Appl. Energy 2022, 306, 118058. [Google Scholar] [CrossRef]
- Chen, L.; Xiao, K.; Hu, F.; Li, Y. Performance evaluation and optimization design of integrated energy system based on thermodynamic, exergoeconomic, and exergoenvironmental analyses. Appl. Energy 2022, 326, 119987. [Google Scholar] [CrossRef]
- Zhao, Y.; Liu, C.; Liu, Z.; Li, P. Indentification for Leakage Risks of Crude Oil Tanks Based on Fault TreeAnalytic Hierarchy Process. Xinjiang Oil Gas 2023, 19, 80–85. [Google Scholar] [CrossRef]
- Zheng, M.; Teng, H.; Hu, J.; Zhao, Y.; Yu, L. Notable Problems of Grey Theory Used in Safety Evaluation of Oil and Gas Pipeline. Welded Pipe Tube 2013, 36, 20–22. [Google Scholar]
- Oluyemi, G.; Vilela, M.; Petrovski, A. A fuzzy inference system applied to value of information assessment for oil and gas industry. Decis. Mak. Appl. Manag. Eng. 2019, 2, 1–18. [Google Scholar]
- Tran, N.T.; Trinh, V.L.; Chung, C.K. An Integrated Approach of Fuzzy AHP-TOPSIS for Multi-Criteria Decision-Making in Industrial Robot Selection. Processes 2024, 12, 1723. [Google Scholar] [CrossRef]
- Zhao, D.; Zhang, J.; Wang, S.; Li, Z. Study on Energy Consumption Evaluation System of Oil Field Gathering Pump Unit Based on Correlation Coefficient Index Screening Method. Math. Pract. Theory 2021, 51, 137–144. [Google Scholar]
- Xiao, L.; Chen, W.; Cui, X.; Zhong, S.; Yu, C.; Yu, T.; Zhang, S. Application of Gray Analysis Method in Benefit Evaluation of Oil and Gas Exploration. Drill. Prod. Technol. 2007, 30, 67–69. [Google Scholar]
- Zhang, X.; Fan, J.; Chen, T.; Gu, Q. Integrative assessment of water flooding through fuzzy theory. Spec. Oil Gas Reserv. 2002, 9, 34–36+82. [Google Scholar]
- Xiong, Y.; Sun, L.; Sun, L.; Wu, Y. Fuzzy evaluation for developing high pour point oil with water drive in Shen 84 block. Spec. Oil Gas Reserv. 2001, 8, 49–52+114. [Google Scholar]
- Gao, Y. Evaluation of Oil and Gas Pipeline Emergency Management Capability based on Combination-weighted and Matter-element Extension Model. Welded Pipe Tube 2024, 47. [Google Scholar] [CrossRef]
- Wang, J.; Jiao, J.; Li, H.; Gong, J.; Li, X.; He, Z.; Sun, X. Smart Oil Depot Maturity Assessment Using the AHP-EWM Fuzzy Comprehensive Evaluation Model. Pet. New Energy 2024, 36, 41–47. [Google Scholar] [CrossRef]
- Yingming, Z.; Shuwei, W.; Dong, L.; Guozhong, W. Application of Grey Correlation Method in Energy Consumption Analysis of Crude Oil Gathering System. In Proceedings of the 2010 International Conference on Digital Manufacturing & Automation, Changsha, China, 18–20 December 2010. [Google Scholar]
- Tang, C.; Pang, Y.; Li, Z.; Zhang, X.; Sun, W. Study on Multi Level Energy Efficiency Evaluation System of Crude Oil Gathering and Transportation System. Math. Pract. Theory 2021, 51, 1–8. [Google Scholar]
- Li, Y.; Wu, X.; Han, F. Study on the Energy Consumption of the Gathering and Transportation System Based on the AHP Integrated Fuzzy Comprehensive Evaluation Method. Oil-Gas Field Surf. Eng. 2017, 36, 41–45. [Google Scholar] [CrossRef]
- Cheng, Q.; Chang, T.; Wang, Y.; Wang, S.; Wang, R.; Meng, F. Establishment and Analysis Method of Energy Efficiency Index System of Oil Field Gathering and Transportation System. J. Petrochem. Univ. 2020, 33, 67–73. [Google Scholar] [CrossRef]
- Peng, F. Research on comprehensive energy efficiency evaluation of gathering and transportation system based on combination model. Energy Conserv. Meas. Pet. Petrochem. Ind. 2024, 14, 67–72. [Google Scholar] [CrossRef]
- Zhang, X.; Cheng, Q.; Sun, W.; Zhao, Y.; Li, Z. Research on a TOPSIS energy efficiency evaluation system for crude oil gathering and transportation systems based on a GA-BP neural network. Pet. Sci. 2024, 21, 621–640. [Google Scholar] [CrossRef]
- Sun, S.; Wang, Y.; Ma, D.; Su, J.; Wu, D.; Li, X.; Lan, M. Energy Consumption Analysis of Closed Transfer Station Gathering and Transportation System in Ultra-Thick Oilfield Based on Grey Correlation-Fuzzy Comprehensive Evaluation. In Proceedings of the 2024 3rd International Conference on Energy and Electrical Power Systems (ICEEPS), Guangzhou, China, 14–16 July 2024; pp. 1–7. [Google Scholar]
- He, S.; Li, H.; Fan, J.; Qi, H.; Ji, Y.; Tang, K.; Du, M.; Yu, R. Evaluation of energy efficiency for the gas reservoir-wellbore-gathering and transmission pipeline network system in Dongsheng Gas Field. Oil Gas Storage Transp. 2025, 44, 220–229. [Google Scholar] [CrossRef]
- Shen, M.; Xue, X.; Zhang, X. Determination of Discrimination Coefficient in Grey Incidence Analysis. J. Air Force Eng. Univ. 2003, 4, 68–70. [Google Scholar]
- Guo, J.; Zhang, Z.; Sun, Q. Study and Applications of Analytic Hierarchy Process. China Saf. Sci. J. 2008, 169, 1–29. [Google Scholar]
- Qi, G.; Huang, R.; Zeng, Z.; Wan, J. An AHP based multi-factors weight method for route selection of oil and gas pipelines. Sci. Surv. Mapp. 2013, 38, 122–125. [Google Scholar]
- Liu, Z. Study on application of AHP in agricultural system. Guangdong Agric. Sci. 2013, 40, 228–232. [Google Scholar]
- Saaty, R.W. The Analytic Hierarchy Process: What and How It Is Used. Math. Model. 1987, 9, 161–176. [Google Scholar] [CrossRef]
- Wu, J.; Li, P.; Qian, H.; Chen, J. On the sensitivity of entropy weight to sample statistics in assessing water quality: Statistical analysis based on large stochastic samples. Environ. Earth Sci. 2015, 74, 2185–2195. [Google Scholar] [CrossRef]
- Yan, F.; Qian, B.; Xiao, X.; Ma, L. Geo-accumulation vector model for evaluating the heavy metal pollution in the sediments of Western Dongting Lake. J. Hydrol. 2019, 573, 40–48. [Google Scholar]
- Yan, F.; Qiao, D.; Qian, B.; Ma, L.; Xing, X.; Zhang, Y.; Wang, X. Improvement of CCME WQI using grey relational method. J. Hydrol. 2016, 543, 316–323. [Google Scholar] [CrossRef]
- Zhu, Y.; Tian, D.; Yan, F. Effectiveness of Entropy Weight Method in Decision-Making. Math. Probl. Eng. 2020, 2020, 3564835. [Google Scholar] [CrossRef]
- Arce, M.E.; Saavedra, N.; Míguez, J.L.; Granada, E. The use of grey-based methods in multi-criteria decision analysis for the evaluation of sustainable energy systems: A review. Renew. Sustain. Energy Rev. 2015, 47, 924–932. [Google Scholar] [CrossRef]
- Deng, J. Control problems of grey systems. Syst. Control Lett. 1982, 1, 288–294. [Google Scholar]
- Wu, J. Characteristics and Application of Submerged Water Injection in Thin Oil Reservoirs. Chem. Eng. Des. Commun. 2019, 45, 55. [Google Scholar]
- Zhu, F.; Ren, Y.; Teng, H. Ground Gathering and Transportation Technology of Light Oil and Heavy Oil in Xinjiang Oilfiled. Contemp. Chem. Ind. 2016, 45, 1564–1567. [Google Scholar] [CrossRef]
- Zhou, Y.; Xu, X.; Cao, Y.; Xue, X.; Li, H.; Li, W. Study on the Energy Consumption Evaluation Index System for the Water Injection System in Xinjiang Oilfield. Oil-Gas Field Surf. Eng. 2018, 37, 19–23+27. [Google Scholar]
- Ruan, L.; Zhu, T.; Wang, Y. Research and Application of Heating and Energy-saving Technology of Thin Oil Gathering and Transporting System. Energy Conserv. Pet. Petrochem. Ind. 2021, 11, 10–13. [Google Scholar] [CrossRef]

Disclaimer/Publisher’s Note: The statements, opinions and data contained in all publications are solely those of the individual author(s) and contributor(s) and not of MDPI and/or the editor(s). MDPI and/or the editor(s) disclaim responsibility for any injury to people or property resulting from any ideas, methods, instructions or products referred to in the content. |
© 2025 by the authors. Licensee MDPI, Basel, Switzerland. This article is an open access article distributed under the terms and conditions of the Creative Commons Attribution (CC BY) license (https://creativecommons.org/licenses/by/4.0/).