1. Introduction
As a clean and efficient energy source, natural gas constitutes one of China’s primary energy supplies [
1]. Due to their flammability and explosiveness, natural gas transportation pipelines and venting systems in gas transmission stations present risks of explosion [
2], deflagration, and even detonation when internal combustion occurs followed by flame propagation. To effectively mitigate flame spread along pipelines caused by accidental ignition or deflagration of combustible gases during transmission, flame arrestors are routinely installed at such facilities [
3]. Flame arrestors are not only widely used in the oil and natural gas industries, but also play a significant role in the chemical industry. These devices are both a critical barrier against catastrophic events such as explosions and a core component for enterprises to comply with stringent safety regulations.
Field investigations have revealed (
Figure 1) that current flame arrestors demonstrate suboptimal flame-arresting performance and elevated failure rates [
4]. An investigation into the elevated failure rates has identified that the primary cause lies in the deposition of corrosion-induced particulates entrained in the gas stream within flame arrestors during pipeline operation. When blockage occurs in flame arrestors, high-pressure natural gas may backflow into low-pressure venting pipelines during depressurization operations, causing overpressurization of low-pressure equipment. Simultaneously, such blockages compromise the pressure relief capacity of the system, creating critical safety hazards. To mitigate the identified issues, this study proposes two strategies: implementing routine cleaning and maintenance and, secondly, conducting parameter optimization studies.
With the rapid development of computer technology, numerical simulation has become a key method in modern research on flame arresters.
Farah et al. [
5,
6] systematically developed a Forchheimer equation based on a porous media model, deriving resistance coefficients through experimental and numerical methodologies, which demonstrated high predictive accuracy (error margin < 5%) for pressure drop estimation in crimped ribbon flame arresters. This framework provides an effective tool for simplified modeling of complex three-dimensional flow dynamics. Yang et al. [
7] integrated computational fluid dynamics (CFD) with explosion experiments to assess the effectiveness of flame arresters in suppressing pressure fluctuations within LPG carrier vessel ventilation systems. The demonstrated strong congruence between the numerical results and experimental data substantiates the applicability of CFD for design optimization in large-scale systems. The Tesla valve structure flame arrester unit proposed by Shen et al. [
8] reduces the flame quenching length to 61% of the conventional convoluted belt structure through the mechanism of airflow diversion and collision, revealing the critical influence of structural parameters (e.g., angle and inlet design) on quenching efficiency. Liu et al. [
9] investigated the propagation characteristics of premixed gases. They found that propane–air and ethylene–air mixtures showed similar flame velocities and pressure variations, while hydrogen–air mixtures exhibited unique staged acceleration and deceleration during propagation. This provides a theoretical basis for flame arrester design in different gas environments.
Current research predominantly focuses on the flame-arresting performance of flame arresters, while analyses of particle deposition within arresters remain scarce. However, researchers worldwide have conducted deposition studies on particles in containers. Seyfi et al. [
10] combined a Eulerian–Lagrangian framework with CFD simulations to investigate carbon black particle deposition in 90° pipeline elbows. Their results show that small particles (1–100 μm) exhibit higher penetration efficiency due to strong flow-following capability, while significant flow disturbances in elbow regions increase deposition. Additionally, elevated flow velocity enhances particle deposition, providing theoretical guidance for optimizing flow velocity in the porous media flow channels of flame arresters. In another study, Veluswamy et al. [
11] carried out CFD modeling of particle deposition downstream of a natural gas pipeline valve and found that turbulence intensity and valve opening had a dominant effect on deposition distribution: a decrease in the valve opening significantly enhances the proportion of downstream particles deposited, while the inlet Reynolds number has a relatively limited effect. This suggests that the geometrical parameters of localized structures (e.g., porous cell gaps) within the flame arrester may indirectly affect particle deposition behavior by modulating turbulence characteristics.
Therefore, building upon existing research on particle deposition analysis, this study establishes a numerical model of a pipeline flame arrester to analyze the characteristics of the pressure field, velocity field, gas phase volume concentration field, and solid deposition rate field within the arrester. The study identifies the influence patterns of porosity, thickness of the flame arrestor element, flame speed at the inlet, length of the flame, particle diameter, particle concentration on pressure drop, flame-arresting speed, and deposition rate, thereby laying the foundation for the optimization of the flame arrestor design.
3. Numerical Methods
3.1. Model Construction and Mesh Generation
The object of this study is a pipeline fire arrester. The diameters of the pipelines at both ends of the flame arrester are 60 mm, and its length is 400 mm. The diameter of the porous medium in the flame arrester is 140 mm, with a channel length of 100 mm. The parameters of the porous medium are specified as follows: the porosity is assigned a value of 0.8; the viscous resistance coefficients in the X, Y, and Z directions are 1.66 × 10⁶, 1.66 × 10⁹, and 1.66 × 10⁹, respectively; and the inertial resistance coefficients in the X, Y, and Z directions are 223,278, 223,278, and 223,278, respectively.
In consideration of the structural features of the pipeline flame arrester, an O-type subdivision method was selected for the structural grid generation of the model. The meshing results are presented in
Figure 2.
3.2. Boundary Conditions
In this study, the model incorporates a variety of boundary conditions, including inlet and outlet boundaries, wall boundaries, and a specified initial flow field state. The detailed settings are as follows:
- (1)
Inlet: The velocity inlet boundary condition is applied with a constant velocity. The temperature is set to the adiabatic flame temperature corresponding to the methane–air mixture.
- (2)
Outlet: Pressure outlet boundary condition with pressure set to atmospheric pressure. Initial temperature: 300 K; oxygen content: 23%, nitrogen content: 77%.
- (3)
Wall: All walls are treated as isothermal surfaces with a constant temperature.
In the initial conditions, a small region near the closed end is designated as the burned zone, with its adiabatic flame temperature set to 2323 K. The initial conditions of the gas mixture are specified in
Table 1. The oxygen concentration refers to the parameter setting in Cui Jinkai’s research on flame arresters [
17].
Table 2 summarizes the initial conditions for particle deposition.
- (2)
Ignition
After initializing the flow field, ignition is applied to a specific region to supplement the process. This small region is set as the combusted zone, with its temperature set to 2323 K. At the same time, to induce the reaction, a certain amount of reaction products is introduced into this region. During the iteration process, the temperature of this region will automatically adjust to the temperature level corresponding to the normal combustion of methane.
3.3. Numerical Calculation Method
The finite volume method was adopted as the discretization technique in this study. During the simulation of flame extinction in the pipeline flame arrester, challenges arise due to the highly transient combustion reactions and the significant flow issues caused by the strong compressibility of the flame. To address such unsteady problems, the couple algorithm is used, which significantly reduces the number of iterations required to achieve convergence while allowing for larger time steps and relaxation factors [
18].
This study employs the coupled algorithm to simulate flame extinction within the flame arrester. The numerical model is solved using ANSYS WORKBENCH 19.2.
3.4. Grid Independence Verification of the Numerical Solution
To simulate the propagation of methane–air flames inside the flame arrester, the time step is set to 10−6 s, which is adopted to achieve optimal mesh density, and the temperature distribution along the axis of the flame arrester is observed after 1000 time steps (i.e., 1 ms). Using the same meshing method, four mesh models with different densities were created, with the number of mesh nodes for the four different densities being 59,092, 33,892, 18,720, and 12,046, respectively.
Huang et al. [
19] analyzed the temperature distribution along the central axis of a flame arrestor under four different mesh densities corresponding to varying numbers of mesh nodes. The simulation results obtained with 59,092 and 33,892 mesh nodes showed high similarity, whereas those obtained with 12,046 and 18,720 nodes exhibited significant discrepancies. This indicates that increasing the number of mesh nodes leads to more accurate results, and the temperature distribution along the centerline of the flame arrestor gradually stabilizes as mesh resolution improves. When the number of nodes exceeds 33,892, the temperature distribution curve shows no significant changes, suggesting that the numerical solution achieved under this mesh density demonstrates mesh independence.
Therefore, in the subsequent sensitivity analysis of this study, it must be ensured that the number of mesh nodes for each model is above 35,000, which can meet the accuracy requirements of the simulation and also maximize the savings in time costs, thereby improving analysis efficiency.
3.5. Validation of the Numerical Model
The model results are compared with the experimental results of Sun et al. [
20]. The effects of different gas/air concentrations on the flame speed in pipe D = 150 mm (with arrester) are given. A model validation case is defined as the case with the propane concentration of 4.02%. The flame speed is measured via eight flame detectors installed on the unprotected side of the pipe at distances of 2.7 m, 4.6 m, 5.8 m, and 7.5 m from the ignition source.
Figure 3 shows the changes in the flame speed in the pipe as obtained by the experiment and by the numerical simulation.
As shown in
Figure 3, the numerical simulation results show good agreement with the experimental data, with an error of less than 3%, indicating that the numerical model developed in this study is feasible for investigating the performance of flame arrestors.
4. Internal Flow Field Analysis of the Flame Arrester
Since the flame-arresting performance of the arrester is closely related to its internal flow field, the flame-arresting characteristics of the pipeline flame arrester are obtained by analyzing the internal flow field, including pressure, velocity, gas phase volume concentration, and deposition rate fields.
4.1. Pressure Field
The pressure distribution in the flame-arresting system when the gas is unburned and the variation in the pressure difference between the burned and unburned regions over time are shown in
Figure 4 and
Figure 5.
Based on the calculated pressure results within the flame arrester, the following can be concluded:
During the propagation stage, the methane–air mixture begins to burn. At this point, the flame propagation mainly relies on the diffusion of temperature and composition; so the flame speed is relatively slow, and the combustion duration inside the pipe is longer. As the combustion continues, the gas in the pipeline is disturbed due to the effects of combustion, and the turbulence intensity increases at the location of the combustion reaction. Meanwhile, the pressure wave in front of the flame front rises sharply due to the continuous expansion of the gas products from the combustion reaction.
During the quenching stage, when the flame contacts the flame-arresting unit, quenching begins. As the heat released by the flame continuously decreases, the temperature shows a significant downward trend. Due to the consumption of gas on the unprotected side participating in the reaction, the pressure wave oscillations on that side decrease. Simultaneously, the flame arrester unit is capable of absorbing energy from the pressure wave and mitigating vibrations. Upon contact with the pressure wave, part of it is reflected and propagates in the opposite direction, while the remainder enters the unit. This portion of the pressure wave undergoes multiple reflections and scattering processes within the flame arrester’s channel, leading to oscillations in the gas inside the unit; these oscillating gases will then reflect and scatter again upon contact with the channel walls. This repetitive process leads to the continuous dissipation of pressure wave energy within the channel, resulting in a gradual attenuation of the pressure wave intensity.
According to the results obtained from numerical simulations, the pressure distribution variation during the flame propagation and quenching in the flame-arresting system can be divided into three stages: slow rise, rapid rise, and oscillatory decay. This result is consistent with the pressure changes obtained by Zheng Jinlei [
21], who placed pressure sensors at different positions in the unprotected side of the flame arrester’s pipeline during the flame propagation process.
4.2. Velocity Field
The velocity distribution in the flame arrester system when the gas is unburned is shown in
Figure 6.
As shown in
Figure 6, when the gas remains unburned, the velocity in the pipe upstream of the flame arrester is 20 m/s, the gas velocity downstream of the flame arrester is 25 m/s, while the velocity within the arrester is 17.5 m/s.
The temperature distribution of the pipeline flame arrester during the flame propagation phase is shown in
Figure 7.
As shown in
Figure 7, during the propagation stage, when the flame initially ignites, the chemical reaction rate of the combustion is relatively slow, resulting in a lower flame speed. However, as time progresses, the combustion products continue to expand, leading to an increase in flame velocity.
The temperature distribution of the pipeline flame arrester during the quenching stage is shown in
Figure 8.
As shown in
Figure 8, during the quenching stage, when the flame begins to extinguish, the velocity increases due to the narrowing of the pores. After the flame is completely extinguished, a large amount of combustion products pass through the pores and the flame-arresting unit, leading to a sharp increase in airflow velocity.
Figure 9 and
Figure 10 illustrate the variation in airflow velocity inside the flame arrester over time during flame propagation and quenching.
Figure 9 depicts the variation in airflow velocity over time during the flame propagation process in the pipeline. The airflow velocity gradually increases as time progresses due to the intense chemical reactions accompanying flame propagation. These reactions generate large amounts of carbon dioxide and gaseous water at the rear of the flame, while methane and oxygen at the front are rapidly consumed. This consumption creates a pressure difference between the two ends of the flame front, accelerating the airflow forward. Consequently, during the 0–21 ms time period, the airflow velocity continues to increase.
Figure 10 illustrates the variation in airflow velocity over time as the flame begins to quench and after quenching is completed. The flame starts to undergo quenching when it comes into contact with the flame arrestor element, and at this stage, methane and oxygen at the upstream end of the flame arrester unit are fully consumed. As the gas enters the flame arrester’s channels, the reduced cross-sectional area causes a gradual increase in airflow velocity. Once the flame is fully quenched, combustion byproducts, including carbon dioxide and gaseous water, rapidly enter the flame arrester unit, resulting in a sharp increase in airflow velocity.
4.3. Gas Phase Volume Concentration and Flame Arrester Efficiency
- (1)
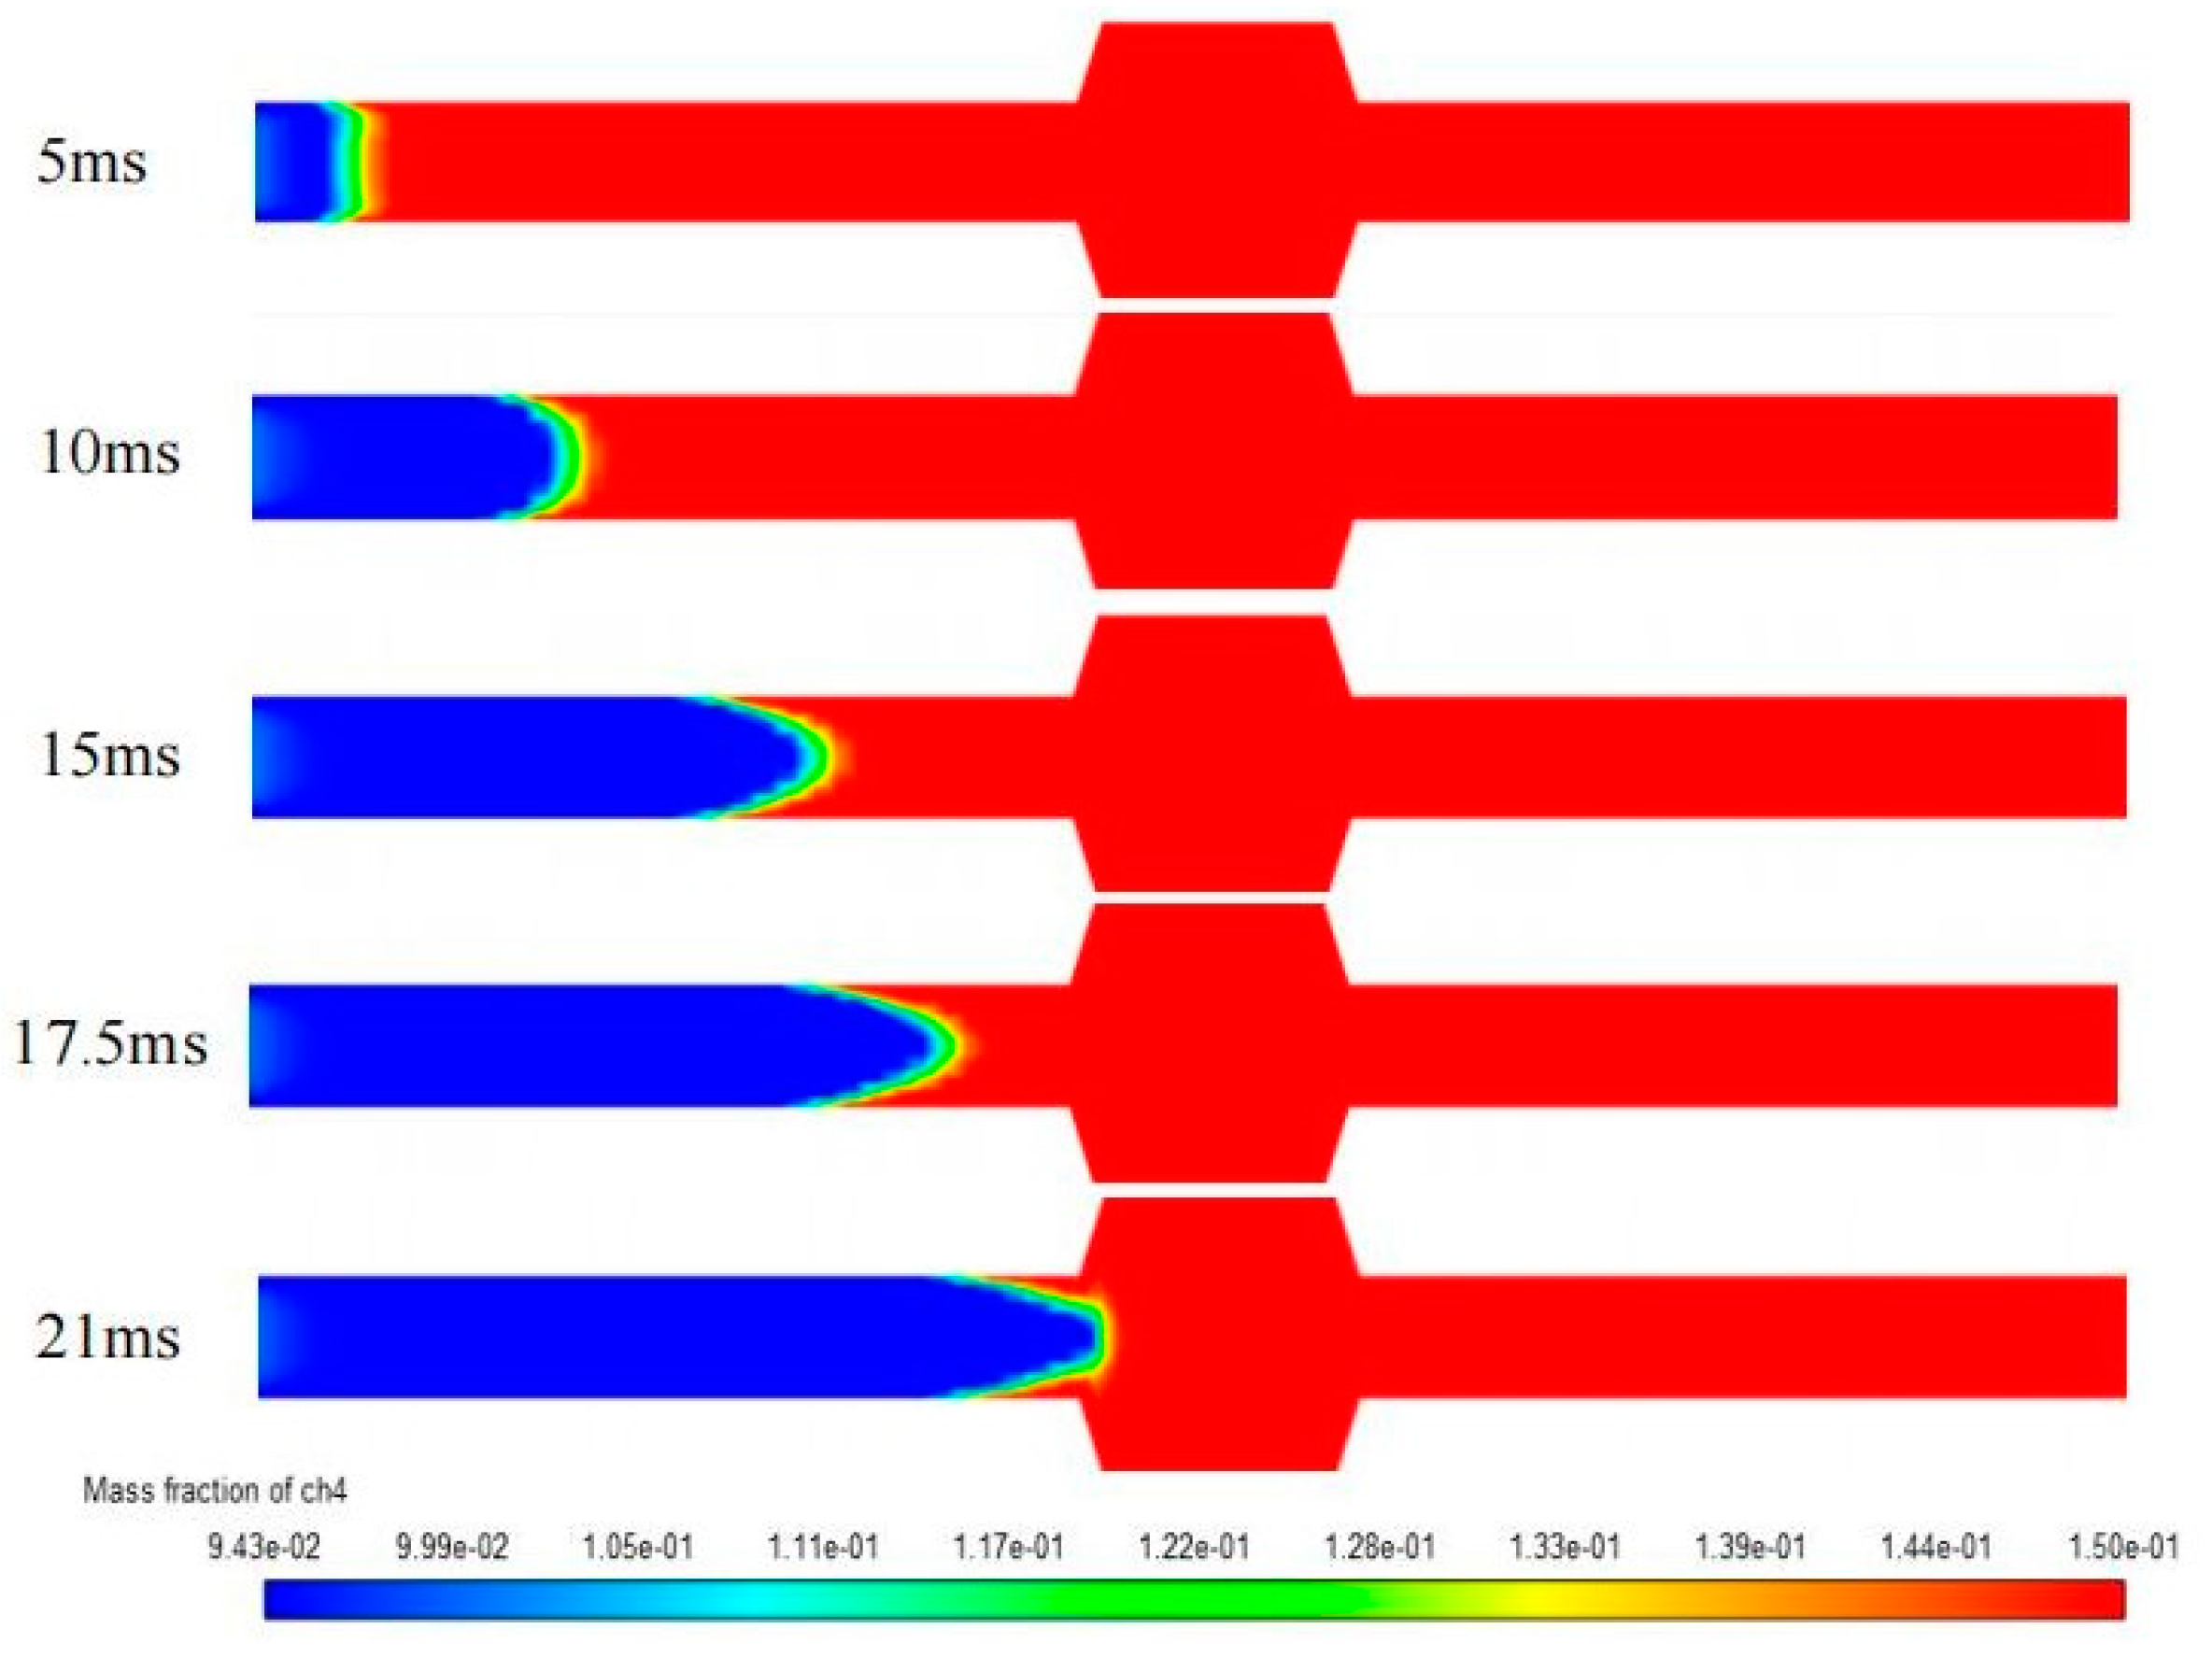
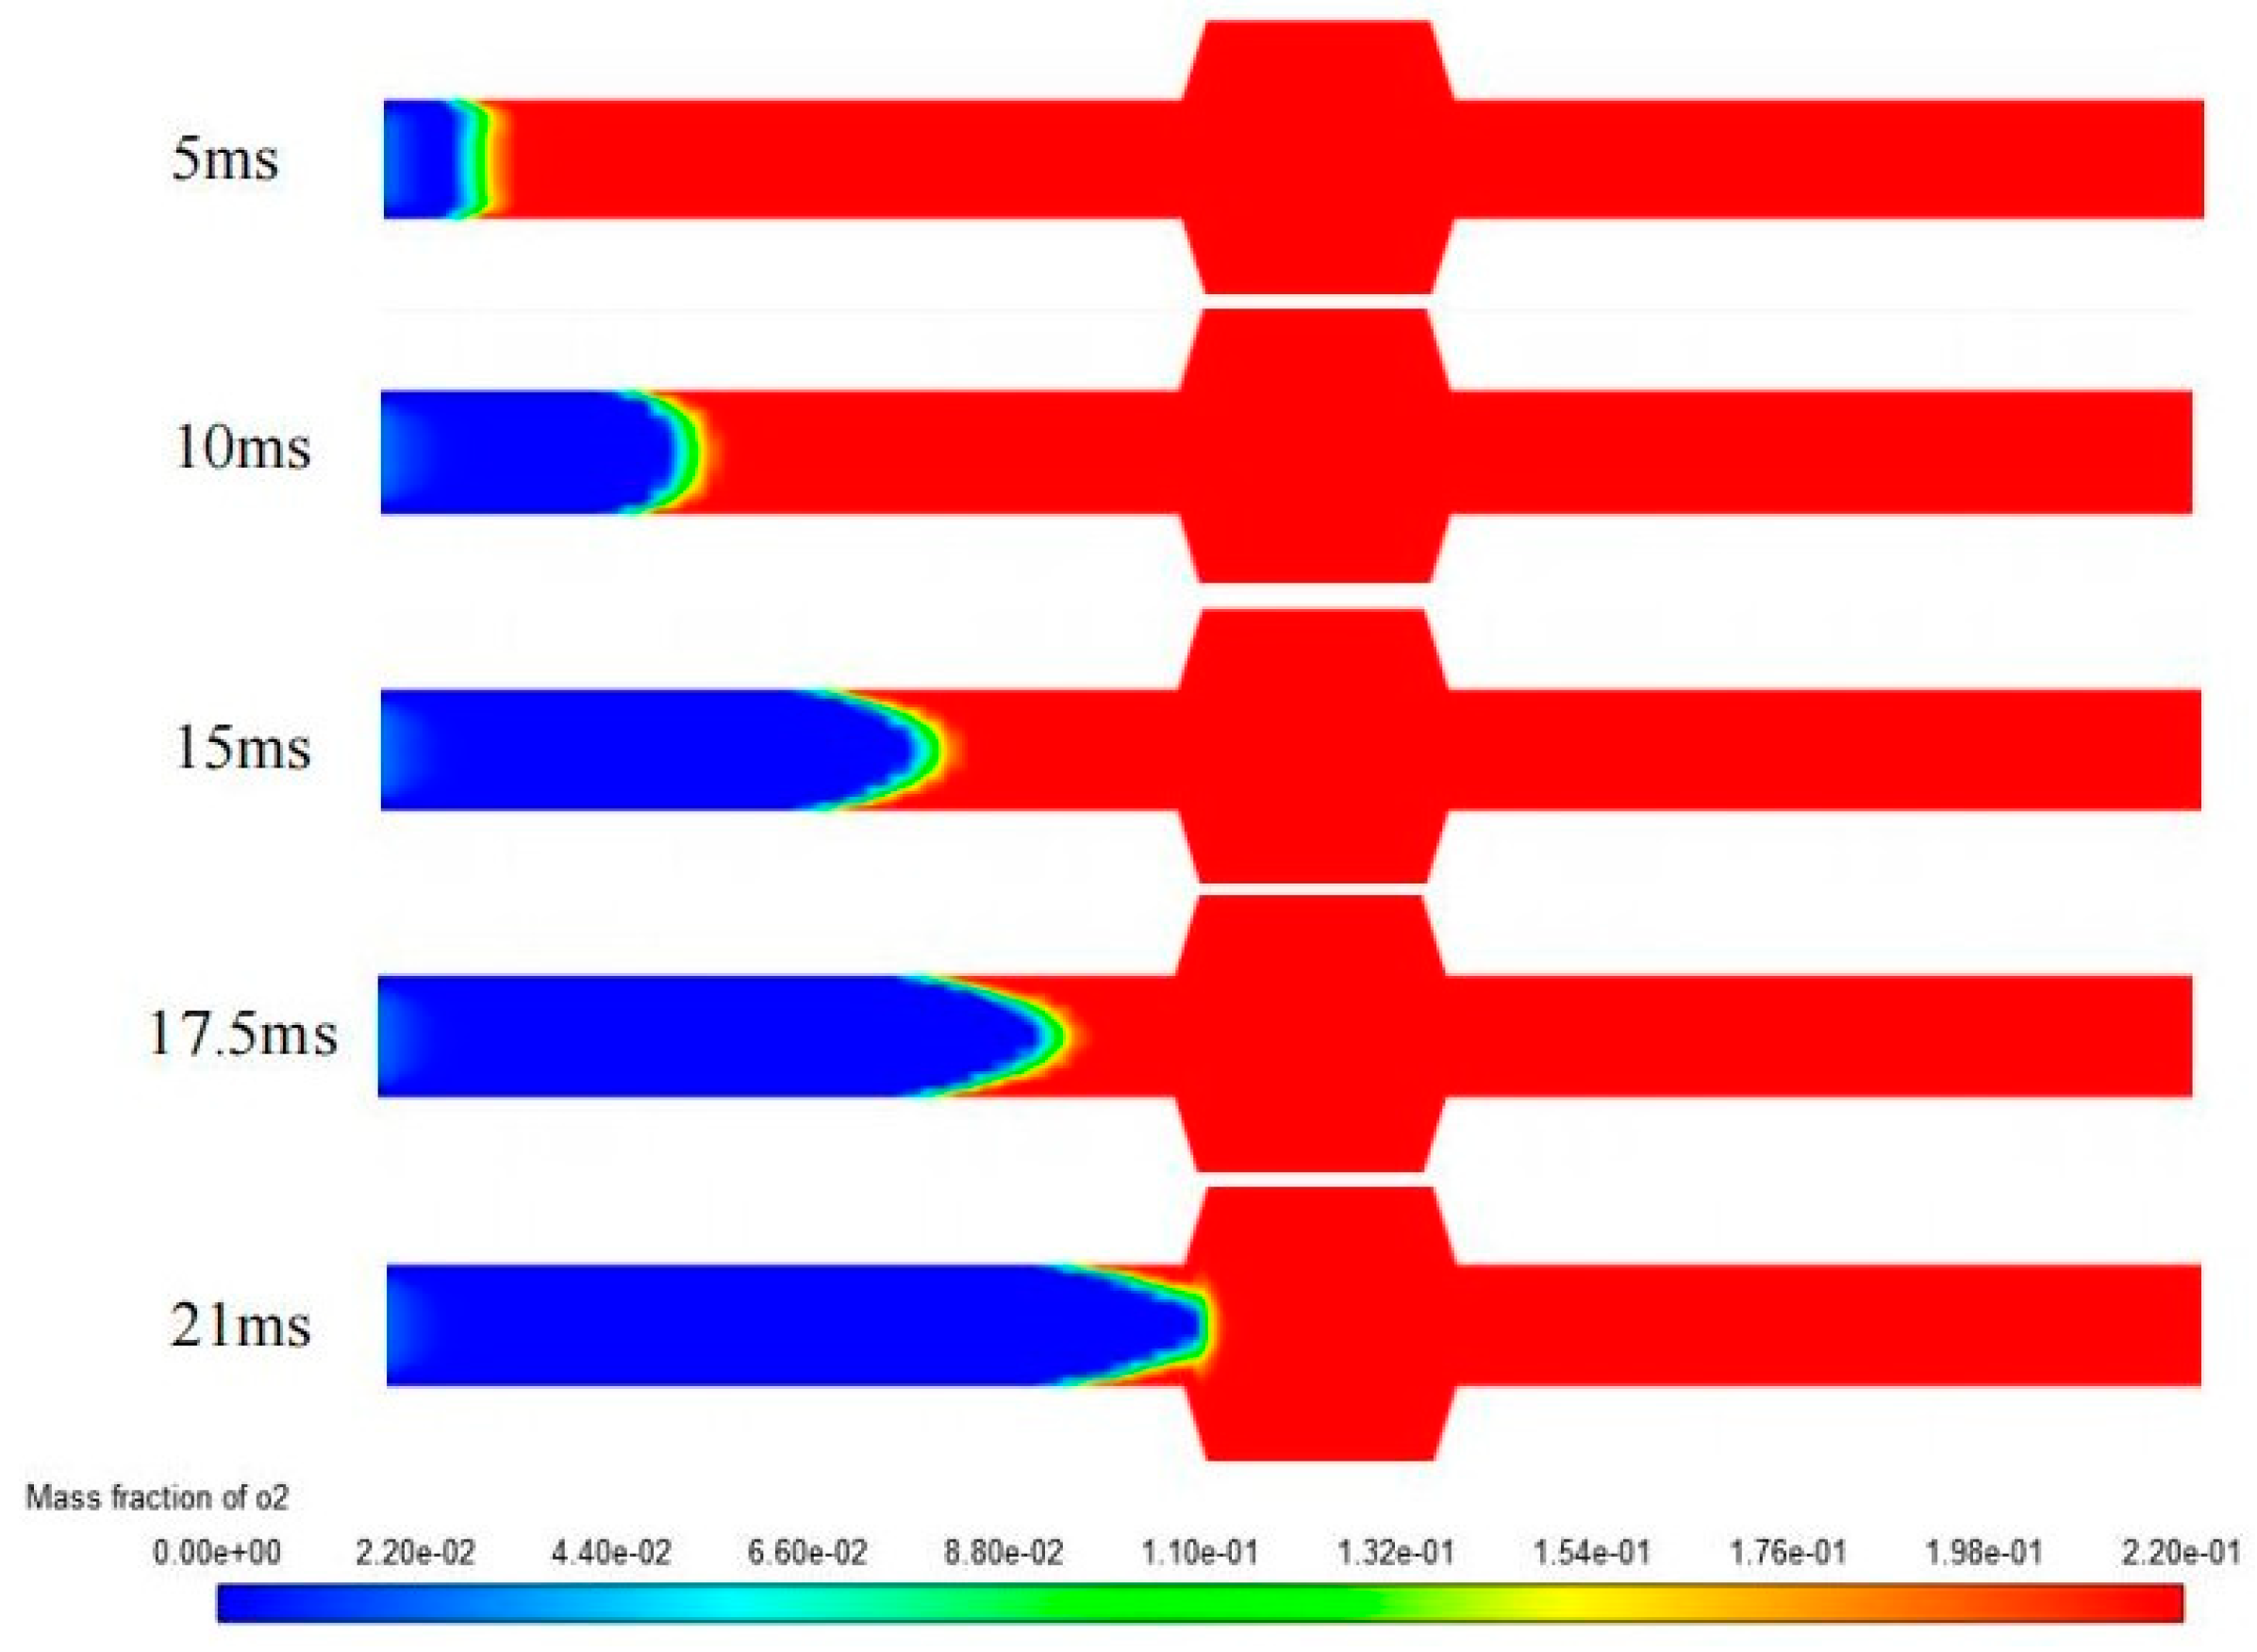
Variation in CH4 and O2 gas phase concentrations
The distribution of methane and oxygen gas phase concentrations at different moments during the flame propagation and quenching process within the flame arrestor system is shown in
Figure 11 and
Figure 12.
As shown in
Figure 11 and
Figure 12, with the occurrence of combustion, large amounts of methane and oxygen are consumed by the reaction, and their component distribution rapidly decreases along the direction of flame propagation. When the flame reaches the flame arrester, the methane and oxygen content no longer changes behind the quenching point as the flame is extinguished.
- (2)
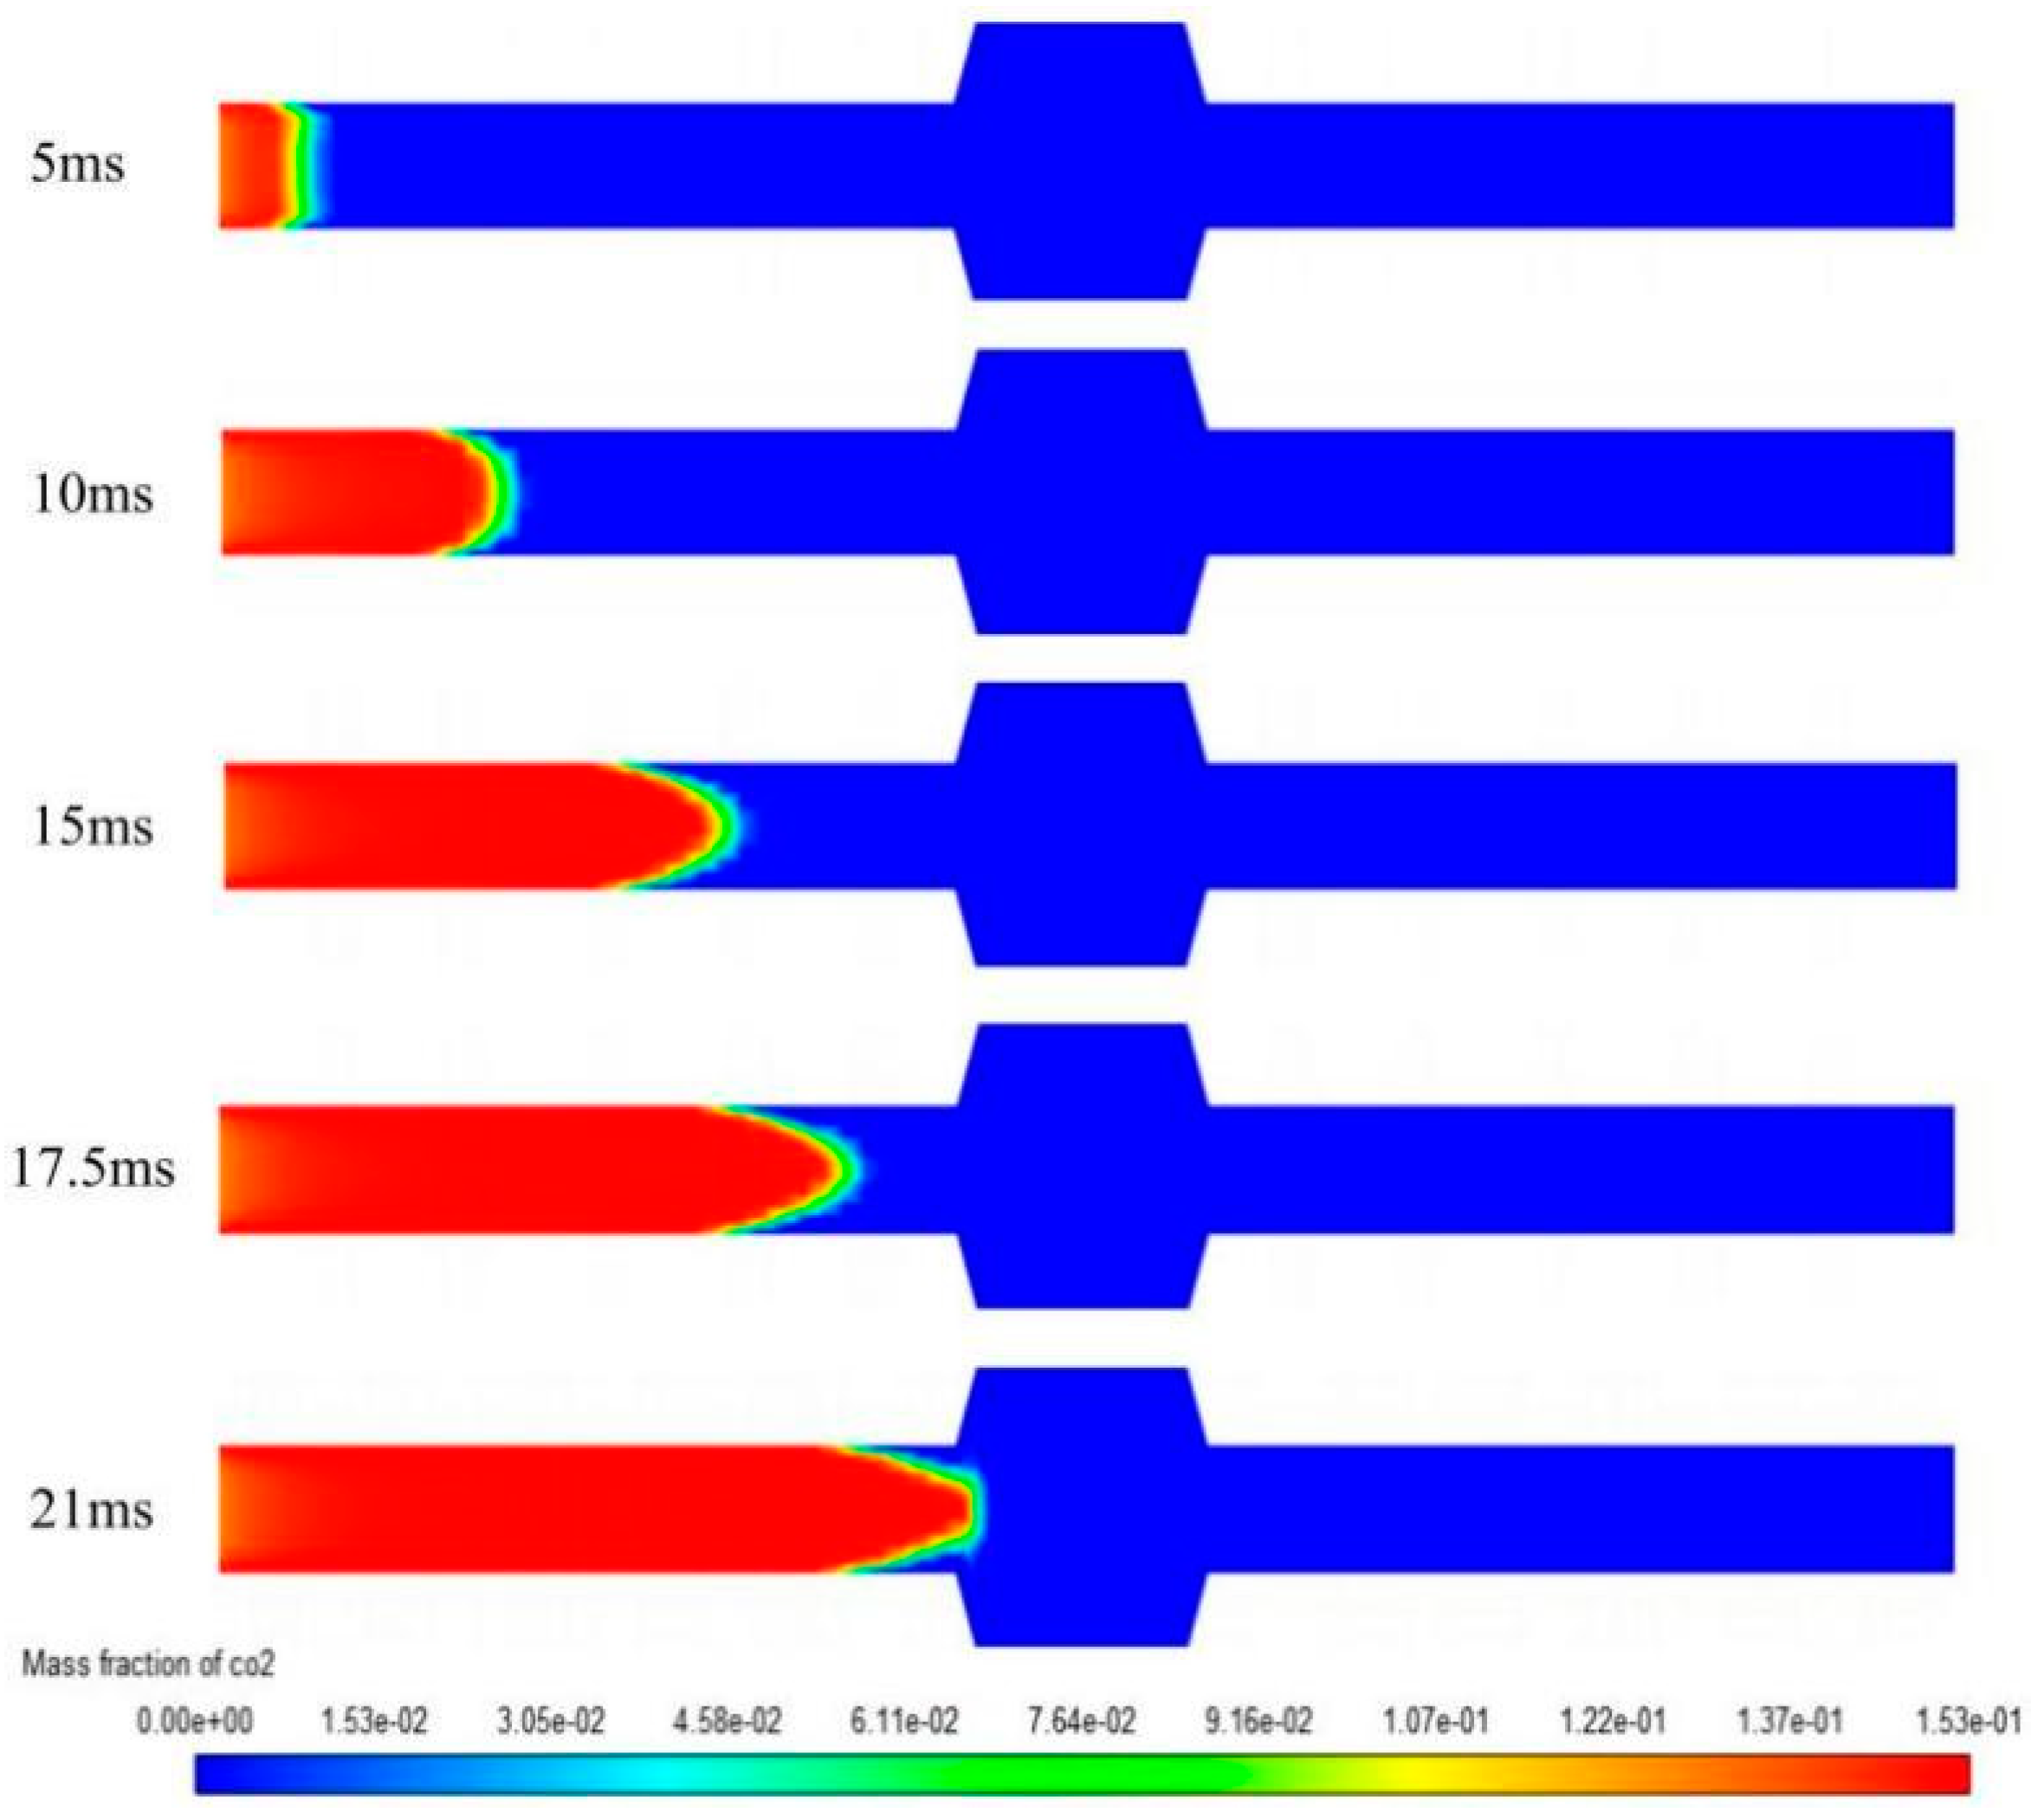
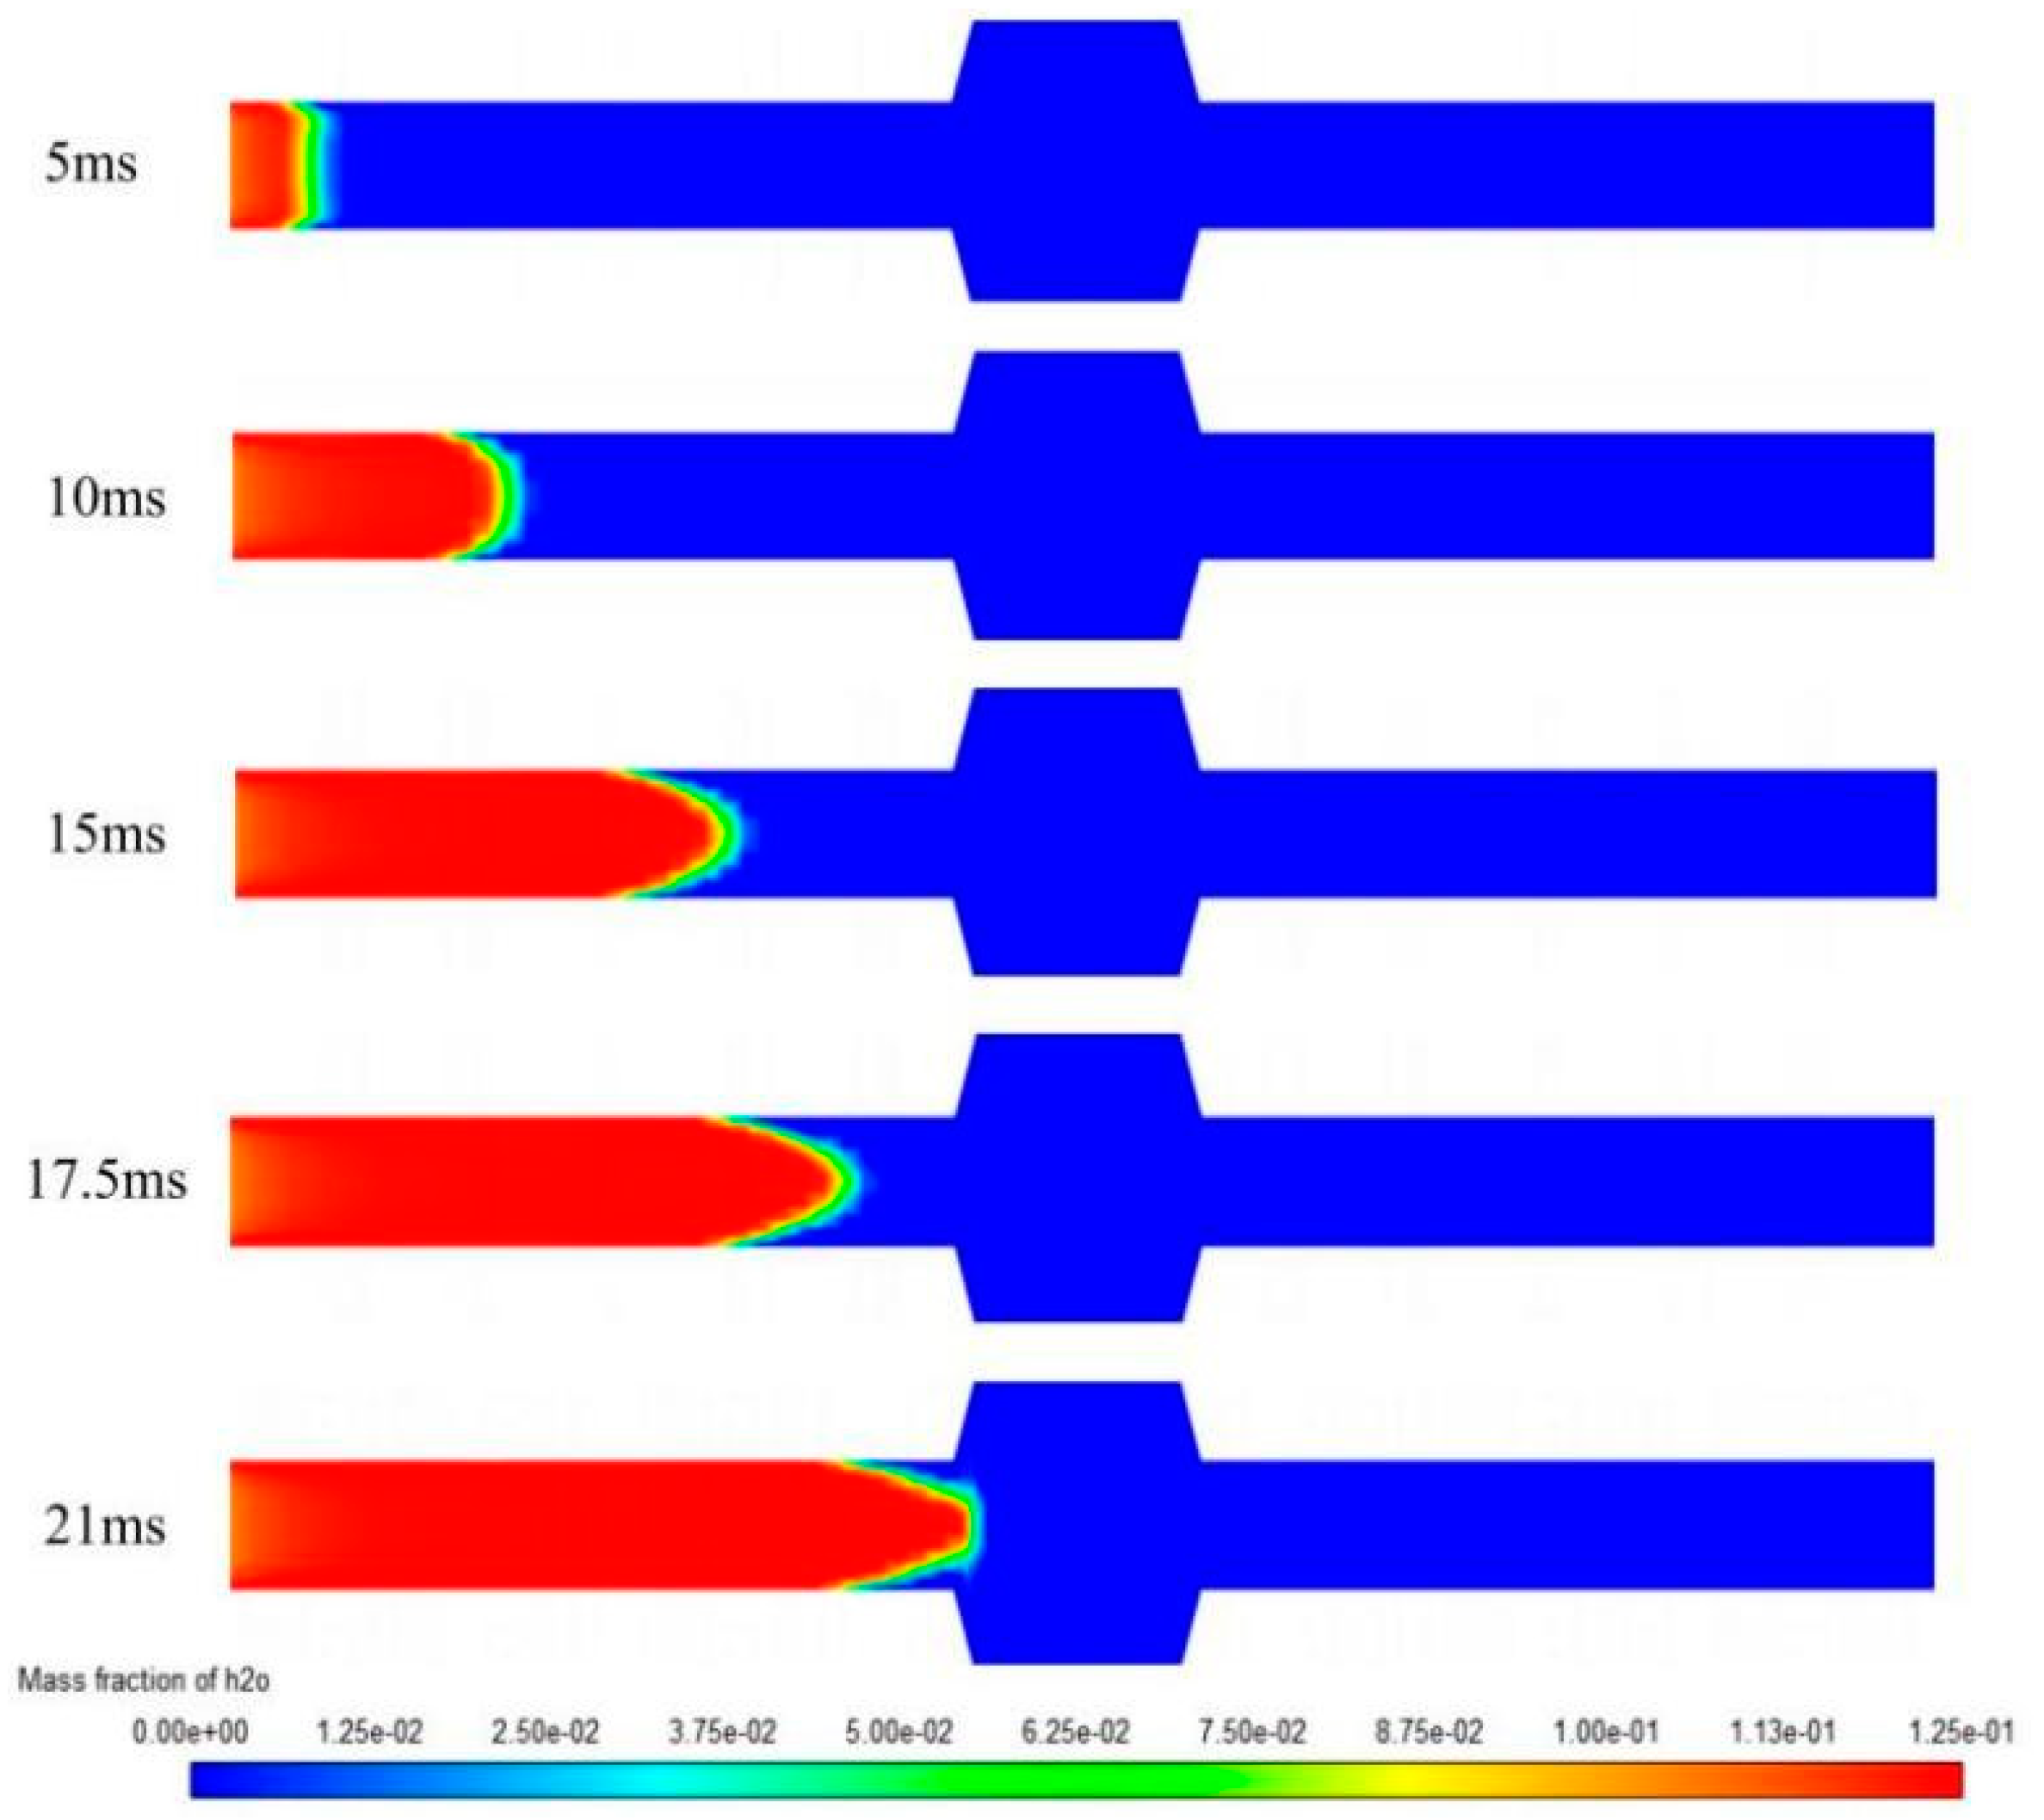
Variation in CO2 and H2O gas phase concentrations
Figure 13 and
Figure 14 illustrate the distribution of carbon dioxide and water vapor at different time points during the flame propagation process.
As shown in
Figure 13 and
Figure 14, with the progression of combustion, large amounts of carbon dioxide and water vapor are produced, and their concentration distribution rapidly increases in the direction of flame propagation. When the flame reaches the flame arrester, combustion ceases with the quenching of the flame. Behind the quenching point, the concentrations of carbon dioxide and water vapor produced by the reaction are both zero.
4.4. Deposition Rate Field of the Flame Arrester
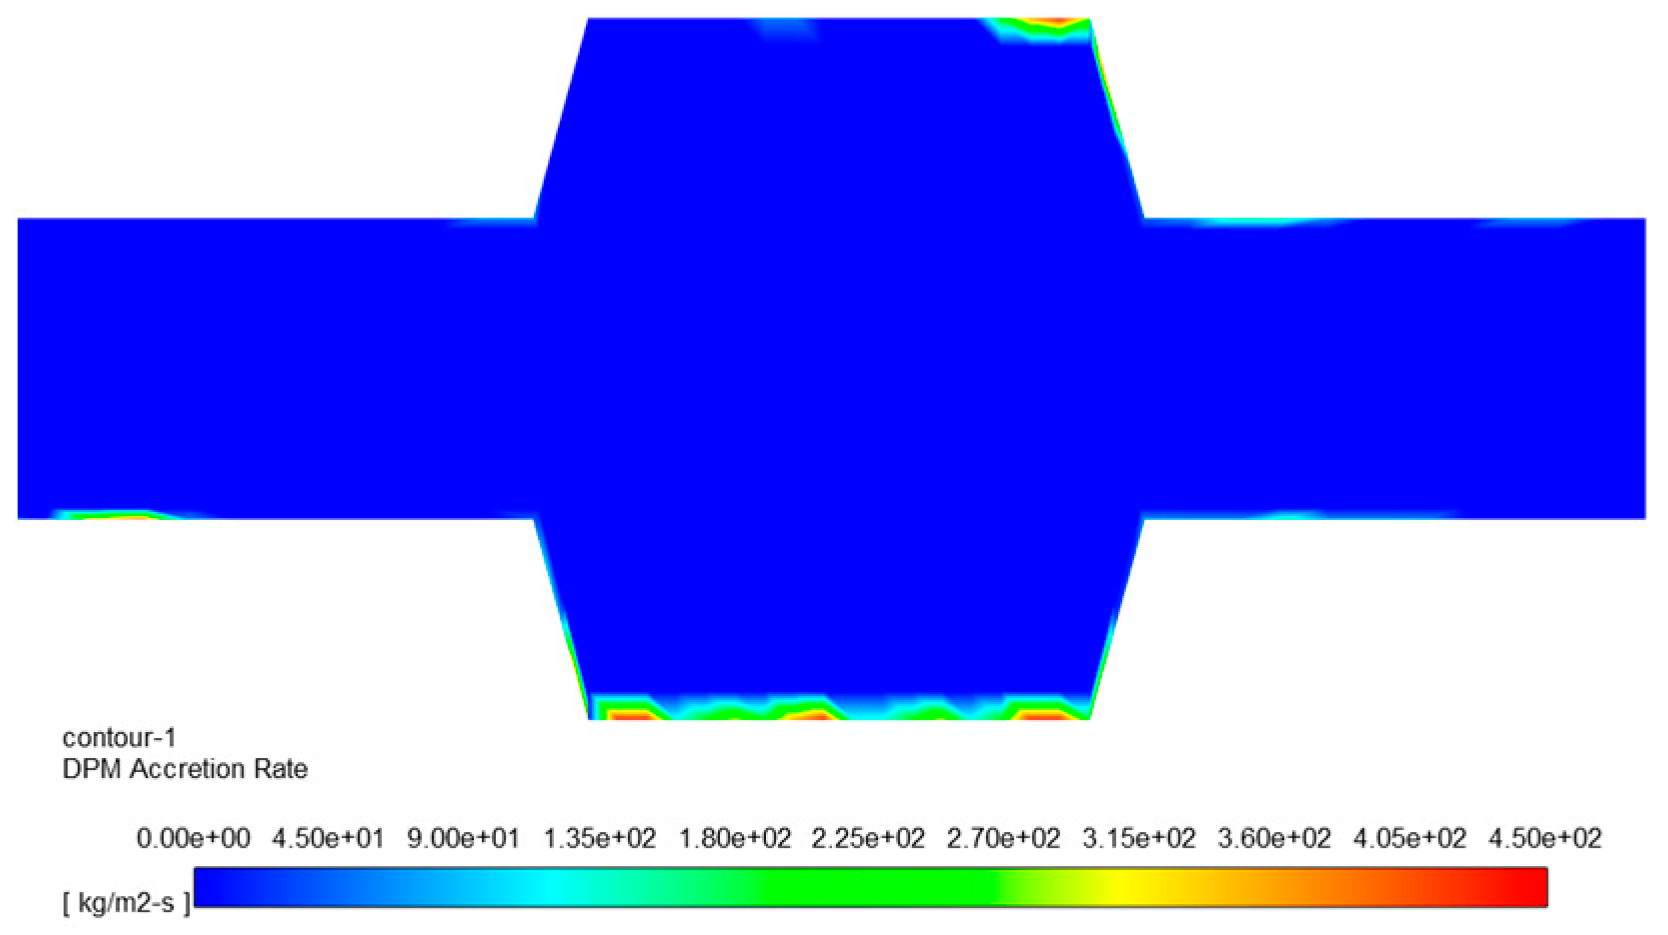
The deposition rate refers to the mass of deposited material per unit time and unit area and can be used to describe the accumulation rate of deposits in a specific environment or process. In this study, deposition rate is used to characterize the speed at which particulate matter in the airflow is accumulated or collected by the flame arrester system during the flame propagation and quenching process.
As shown in
Figure 15, the contaminants deposited in the venting pipeline of the gas station flow toward the flame arrester unit with the gas flow in the pipeline; they are prone to accumulate at the front of the flame arrester inlet, the lower end of the arrestor, and the corners at the upper end of the arrestor.
Analyzing the deposition rate flow field of the flame arrester is of great significance for improving its performance, optimizing design, and maintenance. By studying the relationship between flow field distribution, particle properties, fluid properties, and deposition efficiency, it can provide strong support for the design, application, and maintenance of flame arresters.
5. Results and Discussions
5.1. Porosity Influence Analysis
One of the key factors influencing the flame-arresting performance of the flame arrester is porosity, which plays a crucial role in the design and optimization of the flame arrester. In this section of the simulation, methane–air pipeline flame arresters with a diameter of D = 60 mm and porosities of 0.2, 0.3, 0.4, 0.5, 0.6, 0.7, 0.8, and 0.9 are selected, and flame extinction simulations are conducted under the condition of a pipeline length of 400 mm.
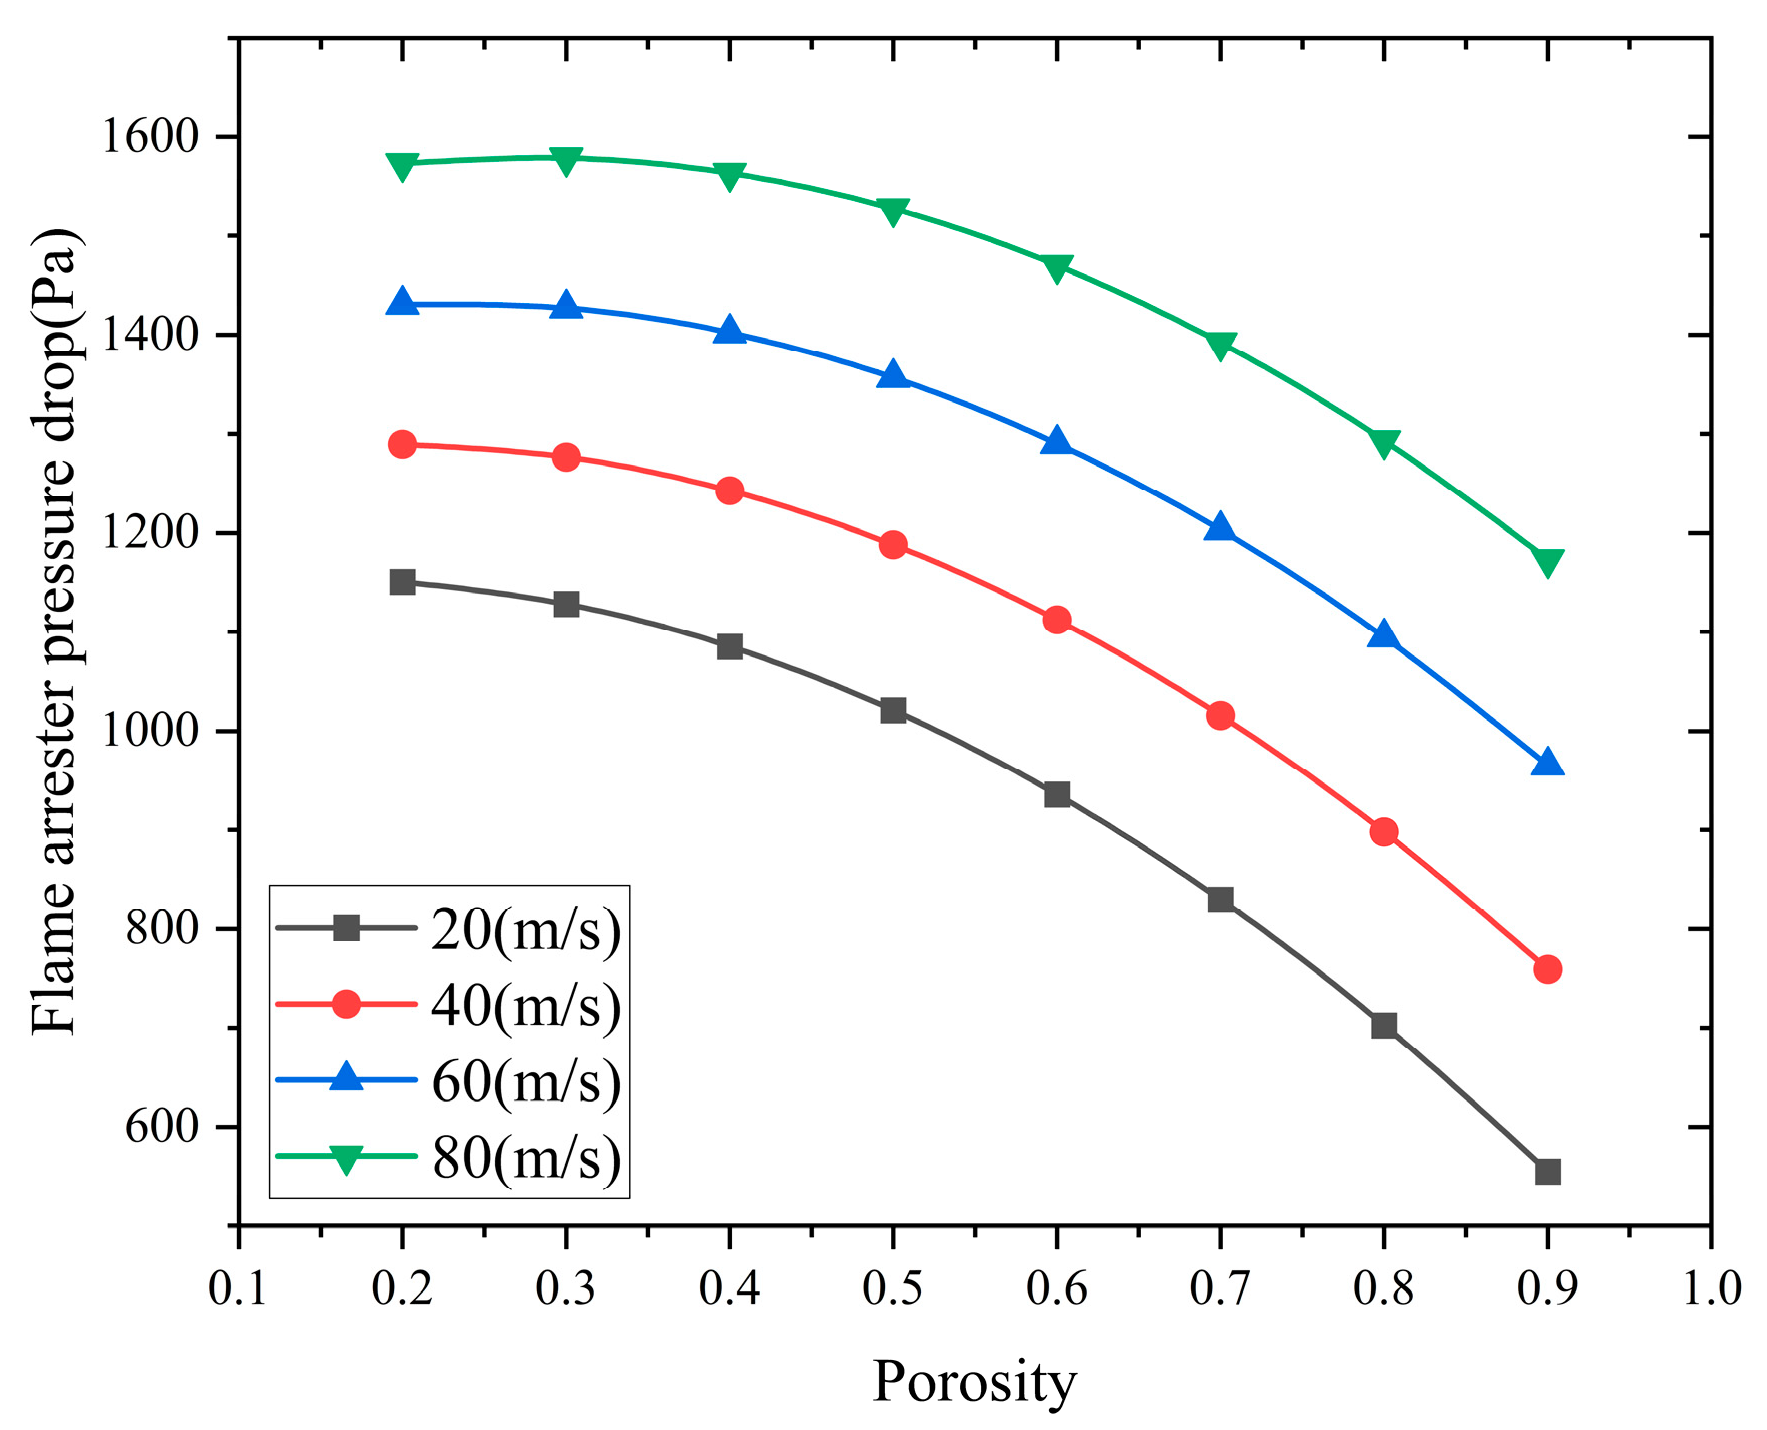
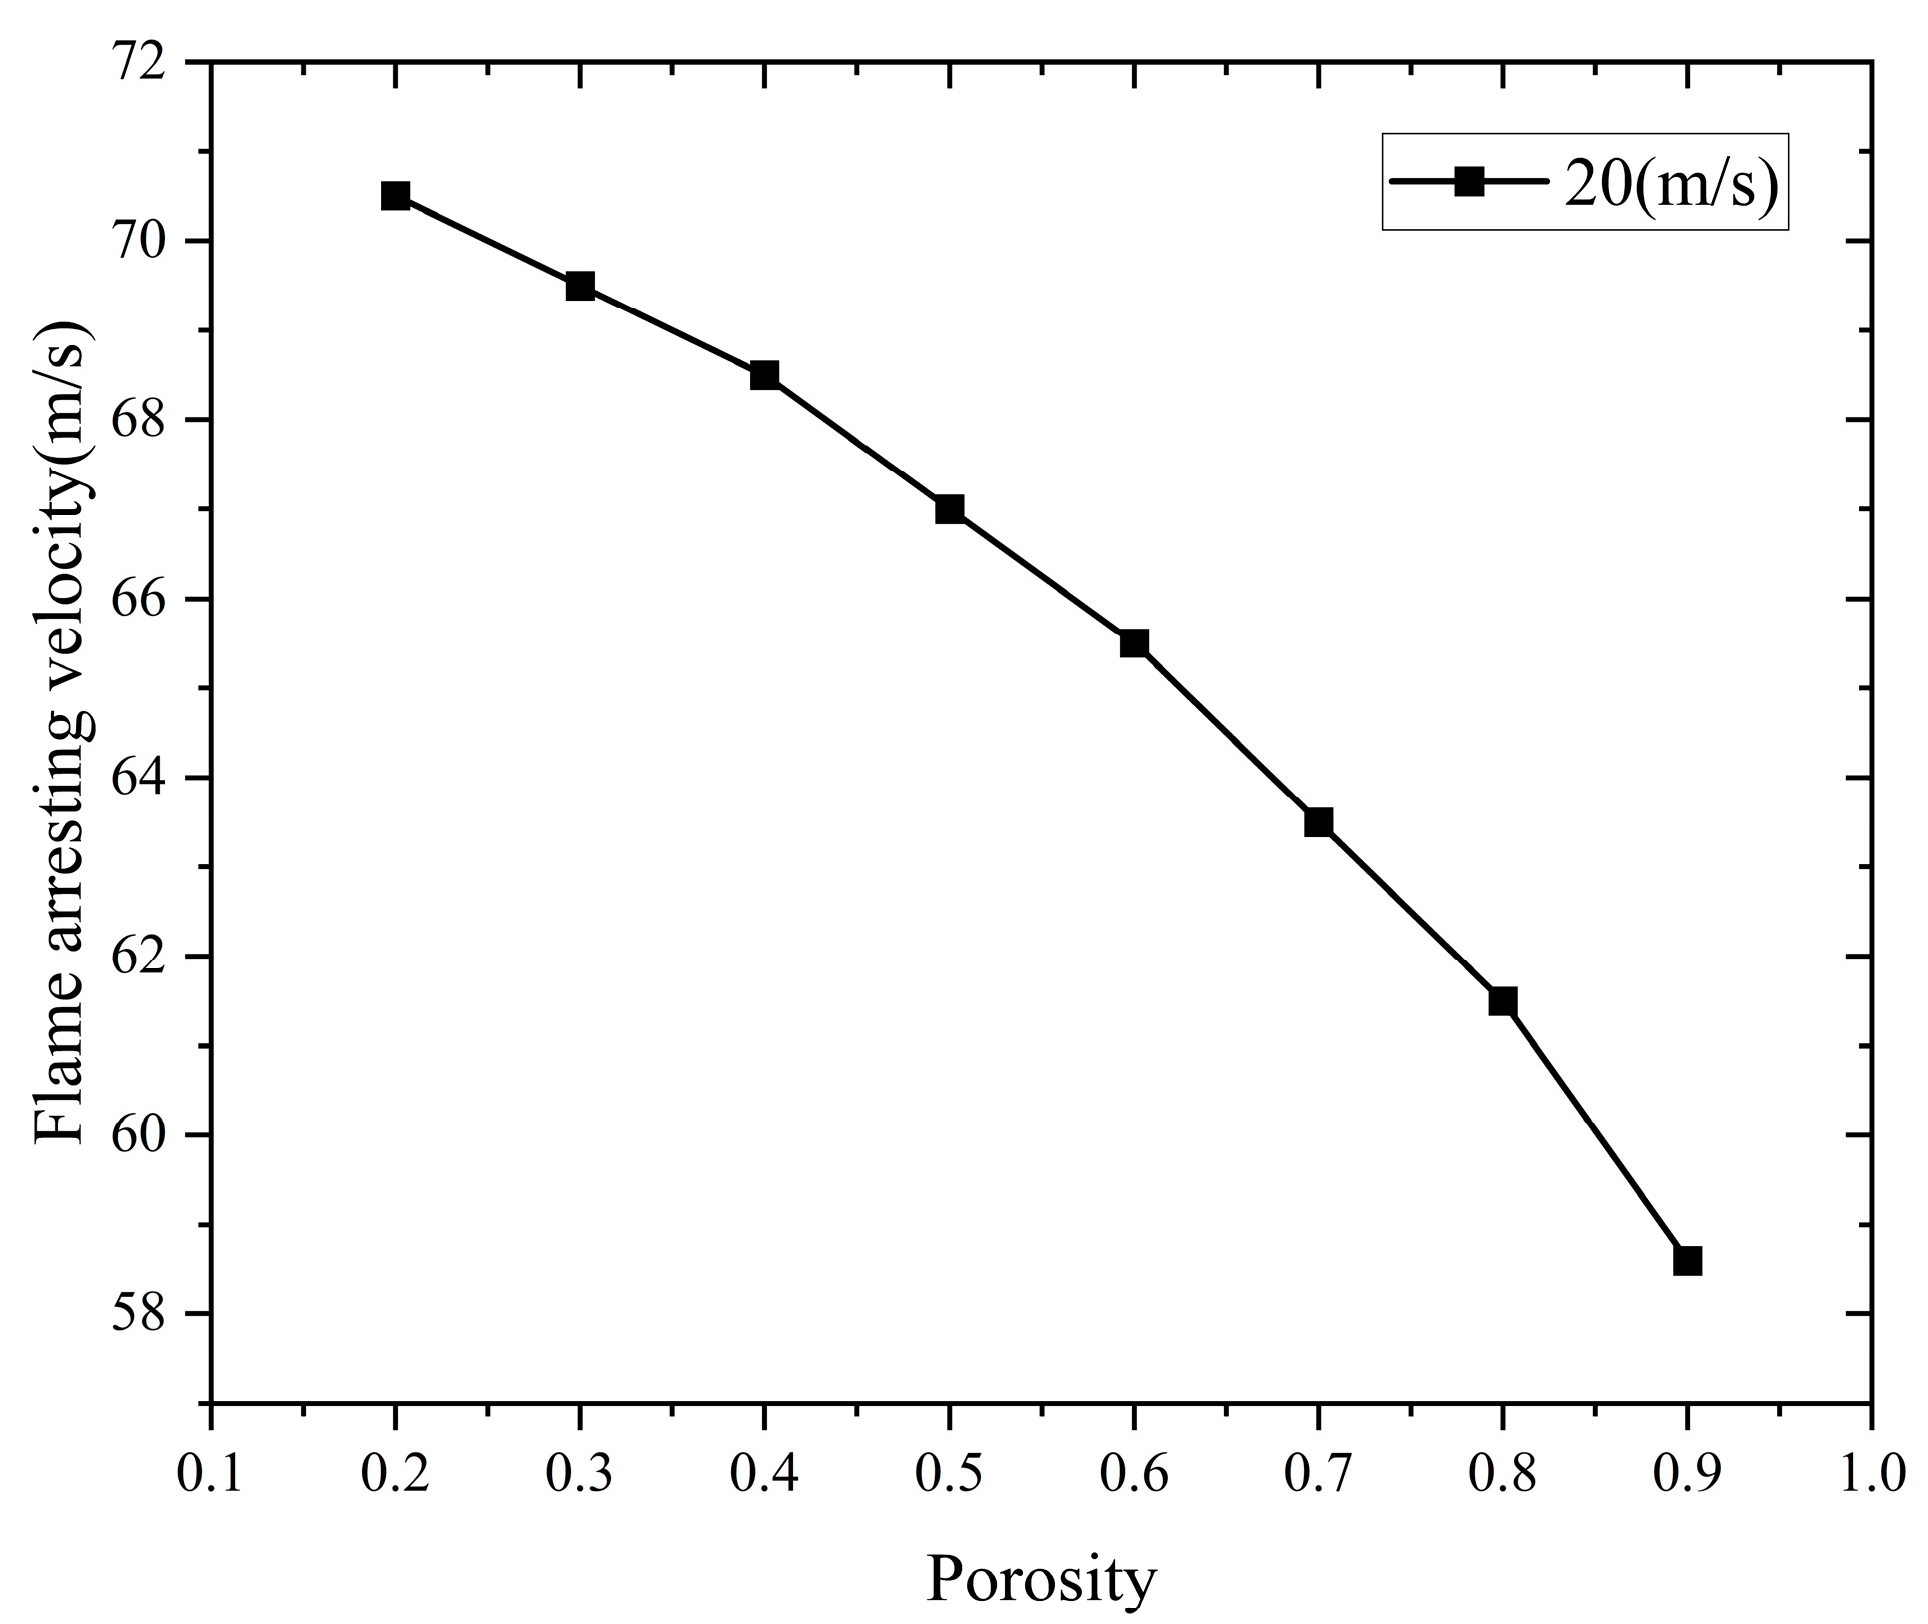
5.1.1. The Effect of Porosity on the Pressure Drop and Flame-Arresting Velocity of the Flame Arrester
After successful flame arrest, the effect of porosity on the pressure drop at both ends of the flame arrester and the flame-arresting speed is shown in
Figure 16 and
Figure 17.
Figure 16 and
Figure 17 show that as the porosity increases, both the pressure drop and flame-arresting speed of the flame arrester exhibit a quadratic decreasing trend, indicating that porosity has a significant impact on the performance of the flame arrester.
This indicates that during flame propagation, as the porosity decreases, the flame combustion rate accelerates due to the interaction between the flame and the pressure waves reflected by the flame arrester core. This interaction leads to a faster flame propagation speed, causing deformation of the flame front. The deformation generates further interactions between the pressure waves and the flame. This process exhibits a positive feedback effect, intensifying the combustion process. This cycle repeats, significantly increasing the pressure drop across the flame arrester and the flame-arresting speed.
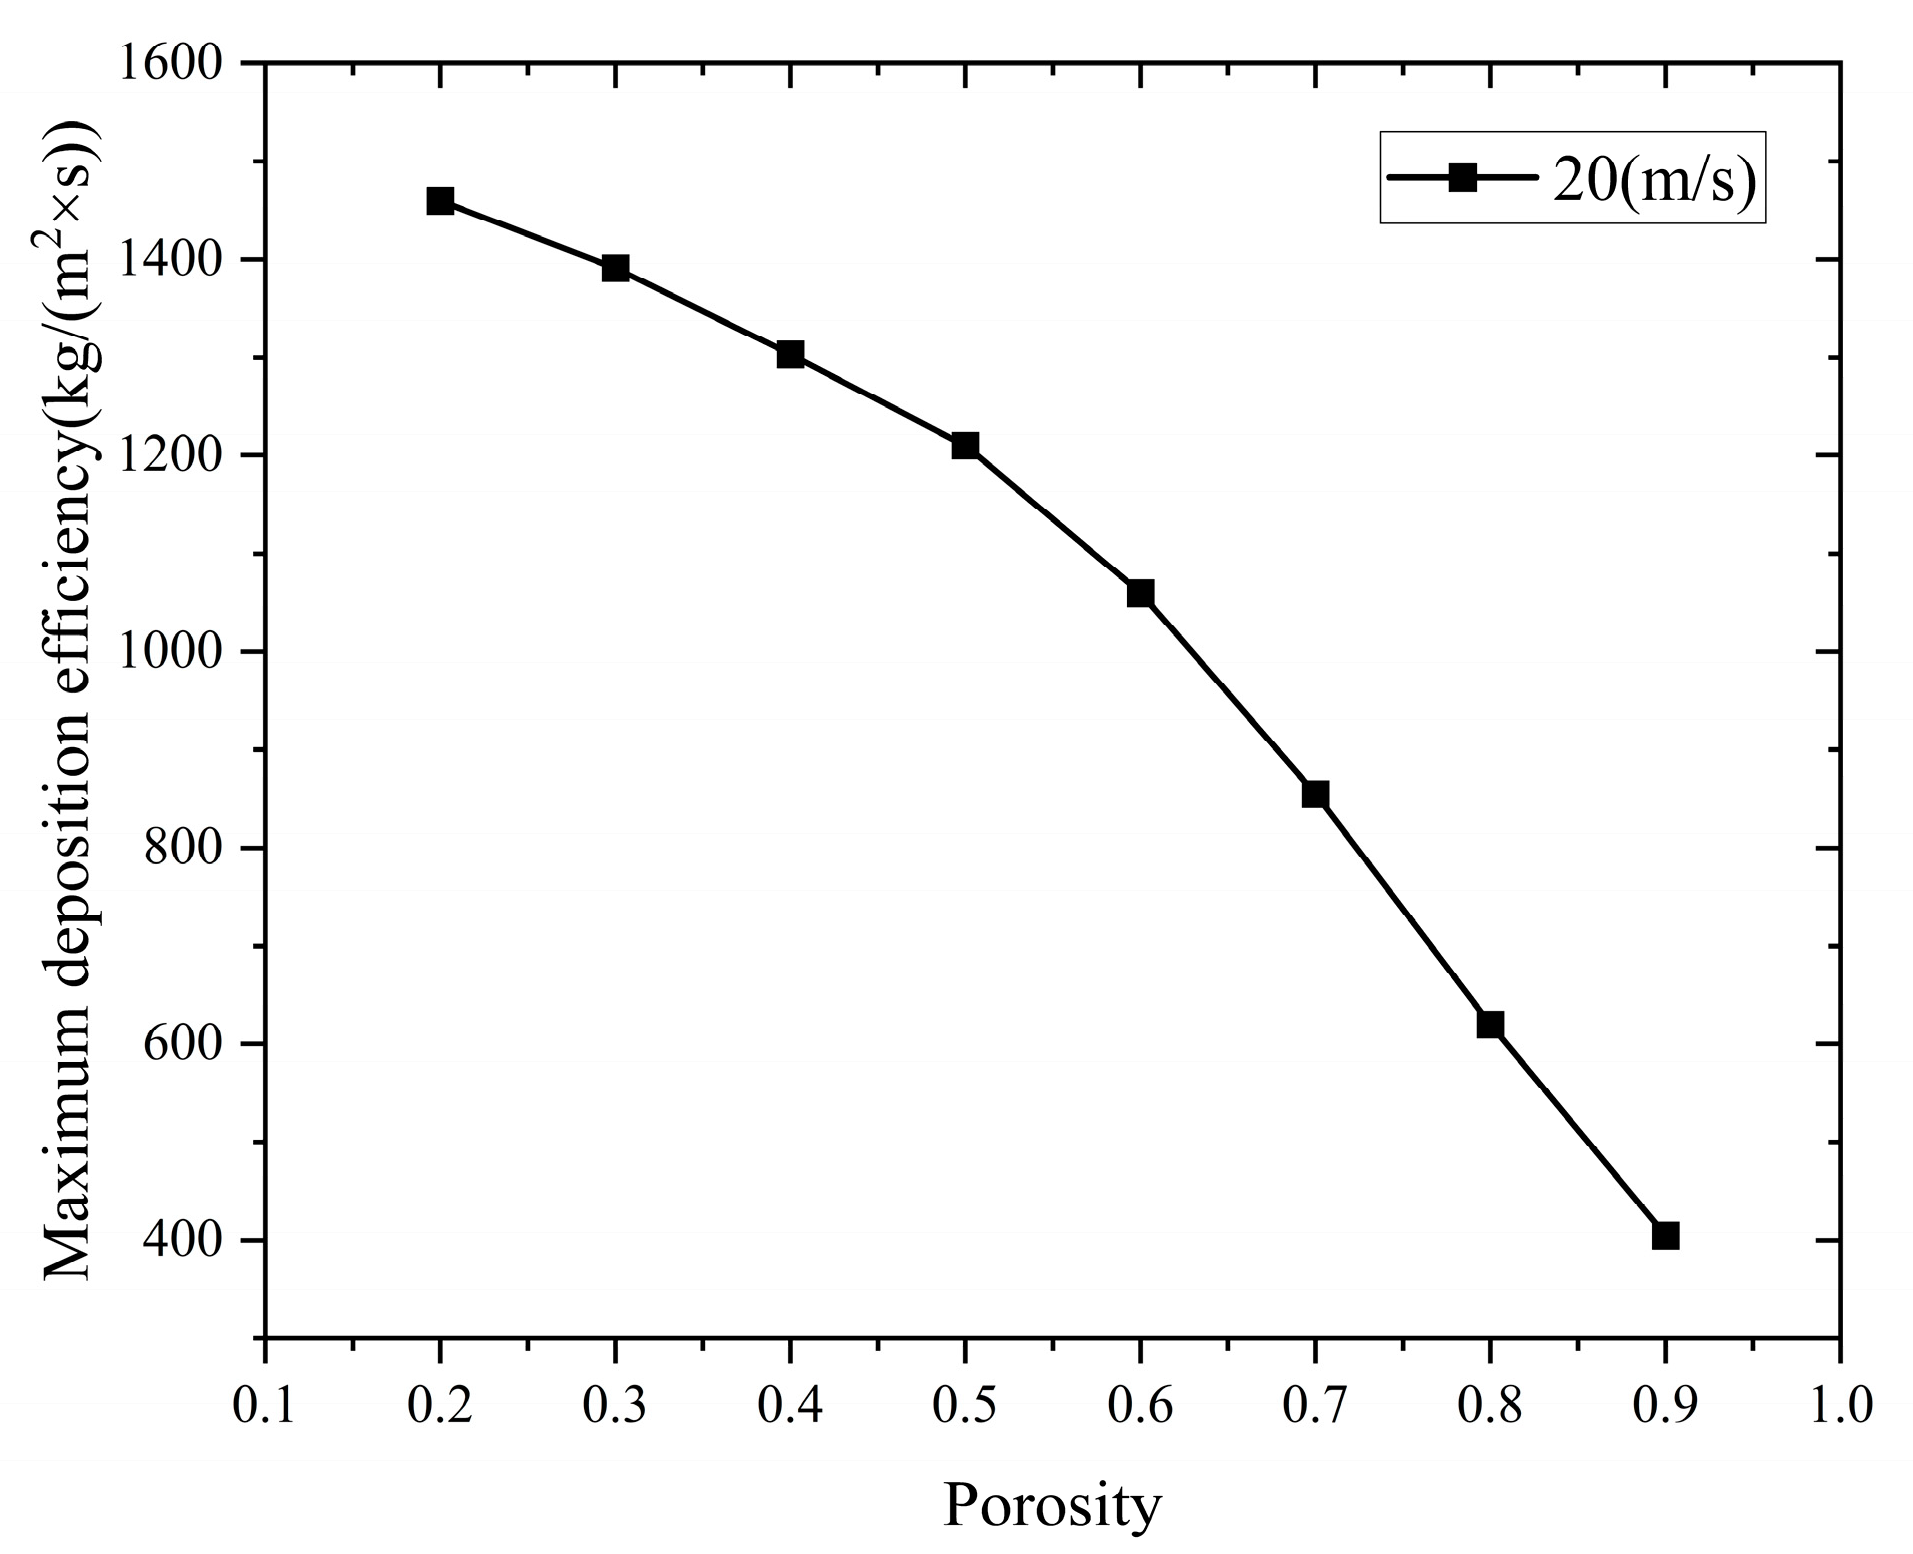
5.1.2. The Effect of Porosity on the Deposition Rate
The impact of different porosity levels on the maximum deposition rate of the flame arrester is shown in
Figure 18.
Figure 18 shows that as the porosity increases, the maximum deposition rate within the flame arrester decreases exponentially.
This indicates that when porosity decreases, particles are more likely to deposit within the flame arrester system, resulting in a greater accumulation. At the same time, it becomes more difficult for the particles to be carried away by the airflow within the system, leading to clogging of the flame arrester and ultimately impairing its flame-arresting performance.
5.2. Analysis of the Impact of the Flame Arrester Core Thickness
Properly controlling the thickness of the flame arrester core is crucial for ensuring the effectiveness and stability of the flame arrester.
In this section, the thickness of the flame arrester core is taken as h = 80 mm, 100 mm, 120 mm, 140 mm, 160 mm, and 180 mm.
Figure 19 illustrates the effect of core thickness on the quenching length at various flame speeds.
Figure 19 shows that the flame quenching length decreases exponentially as the thickness of the flame arrester core increases.
These results demonstrate that increasing the thickness of the flame arrester core effectively quenches the methane–air flame.
5.2.1. The Influence of Flame Arrester Core Thickness on Pressure Drop and Fire-Arresting Speed
Flame arrester core thicknesses of h = 80 mm, 100 mm, 120 mm, 140 mm, 160 mm, and 180 mm were used to simulate the variation in pressure loss across the flame arrester under different core thickness conditions. After the flame-arresting process is completed, the effect of core thickness on pressure drop under different inlet flame velocities is as shown in
Figure 20.
From
Figure 20, the pressure drop across the flame arrester decreases quadratically with the increase in the thickness of the flame arrester core.
From
Figure 21, the flame-arresting speed decreases exponentially with the increase in the thickness of the flame arrester core.
This indicates that increasing the core thickness allows faster quenching of the methane–air flame.
5.2.2. The Influence of Flame Arrester Core Thickness on Particle Deposition Rate
The impact of the flame arrester core thickness on the maximum deposition rate is shown in
Figure 22.
From
Figure 22, in the methane pipeline flame arrester with a diameter of 60 mm, the maximum deposition rate increases quadratically with increasing core thickness.
This suggests that as the core thickness increases, the surface area in contact with the fluid also increases, providing more opportunities to capture contaminants within the fluid.
Therefore, as the core thickness increases, the maximum deposition rate also increases.
5.3. Analysis of the Impact of Inlet Flame Velocity
5.3.1. Influence of Inlet Flame Velocity on Pressure Drop and Flame-Arresting Velocity
The influence of varying inlet flame speeds on pressure drop and flame-arresting velocity is analyzed.
Figure 23 and
Figure 24 present the effects of inlet flame speed on pressure drop and flame-arresting velocity for flame arresters of different lengths.
Figure 23 and
Figure 24 illustrate that as flame velocity increases, the pressure decrease across the quenched flame arrestor grows in a straight line. Conversely, the flame-arresting velocity rises quadratically with rising inlet flame velocity. This suggests that lowering the inlet flame velocity can more rapidly and efficiently quench the methane–air premixed flame.
5.3.2. The Influence of Inlet Flame Velocity on Deposition Rate
The impact of the inlet flame speed on the maximum deposition rate of the flame arrester is shown in
Figure 25.
From
Figure 25, the maximum deposition rate within the flame arrester decreases quadratically with the increase in the inlet flame speed.
This indicates that a decrease in the inlet flame speed means that particles carried by the fluid are less likely to be swept away, providing more opportunities for deposition within the flame arrester. This results in an increased deposition rate, making it more difficult to “blow” contaminants out of the system, leading to particle accumulation and clogging and ultimately affecting the flame-arresting performance of the arrester.
5.4. The Influence of Flame Arrester Length
The flame-arresting effect of the flame arrester is significantly influenced by its length. To reduce the flow resistance loss of the flame arrester, the metal sheets of the flame arrester core should be made as thin as possible, while meeting processing conditions and strength requirements.
According to the working principle of the flame arrester, to ensure better heat exchange between the flame and the arrester core, the contact area between the flame and the core must be larger. Theoretically, the longer the flame arrester, the more sufficient the heat exchange will be, and the better the quenching effect will be.
5.4.1. The Influence of Flame Arrester Length on Pressure Drop and Fire-Arresting Speed
The impact of flame arrester length on the pressure drop of the arrester at different speeds is shown in
Figure 26.
From
Figure 26, with the increase in flame arrester length, the pressure drop at both ends of the arrester increases exponentially, and the slope of the curve gradually becomes steeper.
This indicates that as the flame arrester length increases, the flame-arresting effect improves. However, when the length becomes too long, it increases the flow resistance of the gas, which leads to a steeper slope in the curve.
The impact of flame arrester length on the flame-arresting speed is shown in
Figure 27.
From
Figure 27, the flame-arresting speed increases with the increase in flame arrester length. This indicates that the shorter the flame arrester, the better its flame-arresting effect.
This is because the flame arrester mainly achieves its flame-arresting function by absorbing the flame’s energy and reducing the temperature. A sufficiently long arrester can provide more channel length to absorb the flame’s energy, quenching it within the core.
However, the length of the flame arrester is not always better when longer; an excessively long arrester can increase the system’s resistance, which may affect the normal operation of the system.
When the length of the flame arrester increases, although the flame-arresting speed increases, the quenching length also increases accordingly.
5.4.2. The Influence of Flame Arrester Length on Deposition Rate
The impact of flame arrester length on the maximum deposition rate is shown in
Figure 28.
From
Figure 28, with the increase in the length of the flame arrester, the maximum deposition efficiency within the arrester decreases quadratically.
This indicates that with the increase in flame arrester length, the deposition rate within the arrester increases, leading to a longer residence time of contaminant particles in the arrester, making them more likely to be captured by the pipe wall.
If the flame speed in the system is not high, it becomes difficult to carry the contaminant particles out, leading to deposition, which can result in clogging and ultimately affect the flame-arresting performance of the arrester.
5.5. Influence of Particle Diameter and Concentration on Flame-Arrester Performance
This section investigates the impact of varying particle diameters (2 μm, 5 μm, 10 μm, 50 μm, 100 μm, and 200 μm) and changes in particle concentration on flame-arresting performance.
5.5.1. Influence of Particle Diameter and Concentration on Pressure Drop and Flame-Arresting Velocity
Figure 29 illustrates the effect of particle concentration on the pressure drop across the flame arrester at various particle diameters.
From
Figure 29, it can be observed that as the particle diameter and concentration increase, the pressure drop across the flame arrestor gradually increases, although the rate of increase is minimal. It is evident that within the range of particle diameters from 2 μm to 100 μm and particle concentrations between 0 and 0.06 kg/s, the impact on the pressure drop across the flame arrestor is negligible.
The impact of particle concentration on the flame-arresting speed at different particle diameters is shown in
Figure 30.
From
Figure 30, it can be observed that as the particle diameter and concentration increase, the firestopping velocity decreases gradually; however, the rate of decrease is minimal. It is evident that within the range of particle diameters from 2 μm to 100 μm and particle concentrations between 0 and 0.06 kg/s, the impact on the firestopping velocity is negligible.
5.5.2. The Influence of Particle Size and Concentration on Deposition Rate
The impact of particle concentration on the deposition rate of the flame arrester at different particle diameters is shown in
Figure 31.
From
Figure 31, it can be observed that as the particle diameter and concentration increase, the maximum deposition rate in the flame arrestor decreases, although the rate of decrease is minimal. It is evident that within the range of particle diameters from 2 μm to 100 μm and particle concentrations between 0 and 0.06 kg/s, the impact on the maximum deposition rate in the flame arrestor is negligible.
It can be seen that when the particle size is between 2 μm and 100 μm, and the particle concentration ranges from 0 to 0.06 kg/s, the impact on the flame arrester performance is minimal. However, when the particle concentration inside the pipe increases, it will affect the performance of the flame arrester.
Therefore, under higher particle concentrations, regular cleaning and maintenance of the flame arrester are required.


