1. Introduction
Sewage sludge typically contains 92–99.5% water, necessitating efficient dewatering techniques. Filter presses, widely used for solid–liquid separation, achieve dewatering by applying pressure differentials [
1,
2,
3,
4]. In operation, an external pumping system feeds sludge slurry into filtration chambers, where water pressure compresses the sludge cake [
5]. This process offers several advantages, including high filtration efficiency and reduced final moisture content in the filter cake (cake moisture) [
6].
However, many filter presses lack dedicated sensors for monitoring sludge dewatering. As a result, human operators must manually determine the appropriate compression time, often relying on visual estimation of the filtrate volume and daily fluctuations in sludge characteristics [
7]. In recent works, innovative technologies have been developed in improving sludge dewaterability and various approaches utilizing machine learning and nonlinear predictive models have been proposed to automate the dewatering process [
8,
9,
10,
11,
12,
13,
14,
15,
16,
17,
18,
19,
20,
21,
22,
23,
24,
25,
26,
27,
28,
29]. For example, Liu and You [
12] investigated the optimization of concentrated pressure filtration and demonstrated that support vector regression (SVR) achieved high accuracy in predicting the optimal dewatering times in industrial simulations. Yao et al. [
13] proposed a real-time monitoring method using machine vision and a convolutional neural network with multilabel learning to analyze the filtrate flow. Similarly, Masoume et al. [
16] applied random forest regression (RFR) and SVR to predict the cake moisture, concluding that the RFR model outperformed SVR.
While these machine learning-based approaches have achieved moderate success, they typically require large volumes of high-quality data and significant computational resources. Moreover, their black-box nature often limits model interpretability, raising concerns about reliability in practical applications.
With this background, this study proposes a regression-based approach grounded in mathematical functions, designed for practical deployment in industrial systems. By analyzing correlations between indirectly measurable parameters and the cake moisture, we developed a model that is both computationally efficient and theoretically interpretable. Mathematical functions offer a transparent means to describe the relationships between various indirect indicators and the cake moisture, providing a practical alternative to complex machine learning models.
The cake moisture, which represents the percentage of water retained in the sludge, is directly related to both the filtrate volume and the volume flow rate—the amount of water that passes through the filter [
14]. However, directly measuring the volume flow rate in real time is difficult due to the large volume of filtrate discharged, especially during the initial stage of the dewatering process. Consequently, we estimate the cake moisture using indirectly measurable data, such as images of the drain outlet and instrument readings (e.g., differential pressure).
In this study, we installed a fixed-position camera to capture two-dimensional images of the drain outlet, enabling indirect estimation of the filtrate volume. These images visually represent the amount of filtrate during the measurement period. In the proposed image-based approach, image processing techniques were applied to isolate the water regions within the images. Through analysis of the correlation between the number of pixels in these regions and the actual filtrate volume, a mathematical approximation was formulated to estimate the filtrate from the image data.
On the other hand, the differential pressure was employed as an easily measurable indicator. Defined as the pressure difference between the slurry and the pressurized water, this pressure tends to be lower when the cake moisture is high and increases as the moisture content decreases. To investigate this relationship, a sampling survey was conducted to analyze correlations among the differential pressure, cake moisture, and volume flow rate. Based on these analyses, a mathematical regression model was developed to approximate the relationships among the three variables.
For estimating the cake moisture, two approaches are proposed in this study: one that directly estimates the cake moisture from the differential pressure, and another that infers the volume flow rate from the differential pressure and subsequently estimates the cake moisture. A comparative validation using operational data collected over different months was conducted to assess the practical effectiveness of both approaches.
The combination of image analysis and the differential pressure for cake moisture estimation is the main contribution of this study. The models proposed in this study are simple mathematical models instead of complex machine learning approaches, offering both practicality and reliability for actual operation in industrial systems.
The remainder of this paper is organized as follows:
Section 2 discusses the sludge dewatering process in filter presses in detail.
Section 3 describes the procedures and models used for estimating the volume flow rate and cake moisture.
Section 4 presents the estimation results, corresponding discussions in
Section 5, and
Section 6 describes the conclusions.
2. Sludge Dewatering in Filter Press Process
A filter press is used to separate solids and liquids via filtration and compression processes. The purpose of this process is to reduce the percentage of cake moisture.
Figure 1 shows the flowsheet of the filter press provided by Tsukishima JFE Aqua Solution Co., Ltd. (Kawasaki, Japan). The filter press has two different pumps: a slurry feed pump and a pressurized water pump, which produce two types of pressures.
Table 1 shows the specifications of these sensors. During dewatering, the volume flow rate (Q) represents the amount of water (filtrate) passing through the filtration area per unit time.
Notably, the filtrate is measured every minute. However, because of the limitation of measuring the large initial filtrate volume, no flow data was available for the first few minutes of dewatering. Filtrate flow information was only recorded during the final minutes before stopping. The volume flow rate was also measured only in the last minutes of compression, not from the beginning of the process. In addition, the cake moisture was measured only before starting dewatering and after stopping compression. However, the cake moisture in the last minutes of compression can be calculated using the volume flow rate information.
During the measuring time, a visible camera is also installed to capture the image of the filtrate (
Figure 2).
Table 2 shows the camera and lighting specifications. The volume flow rate can be estimated by using this captured filtrate image per unit time.
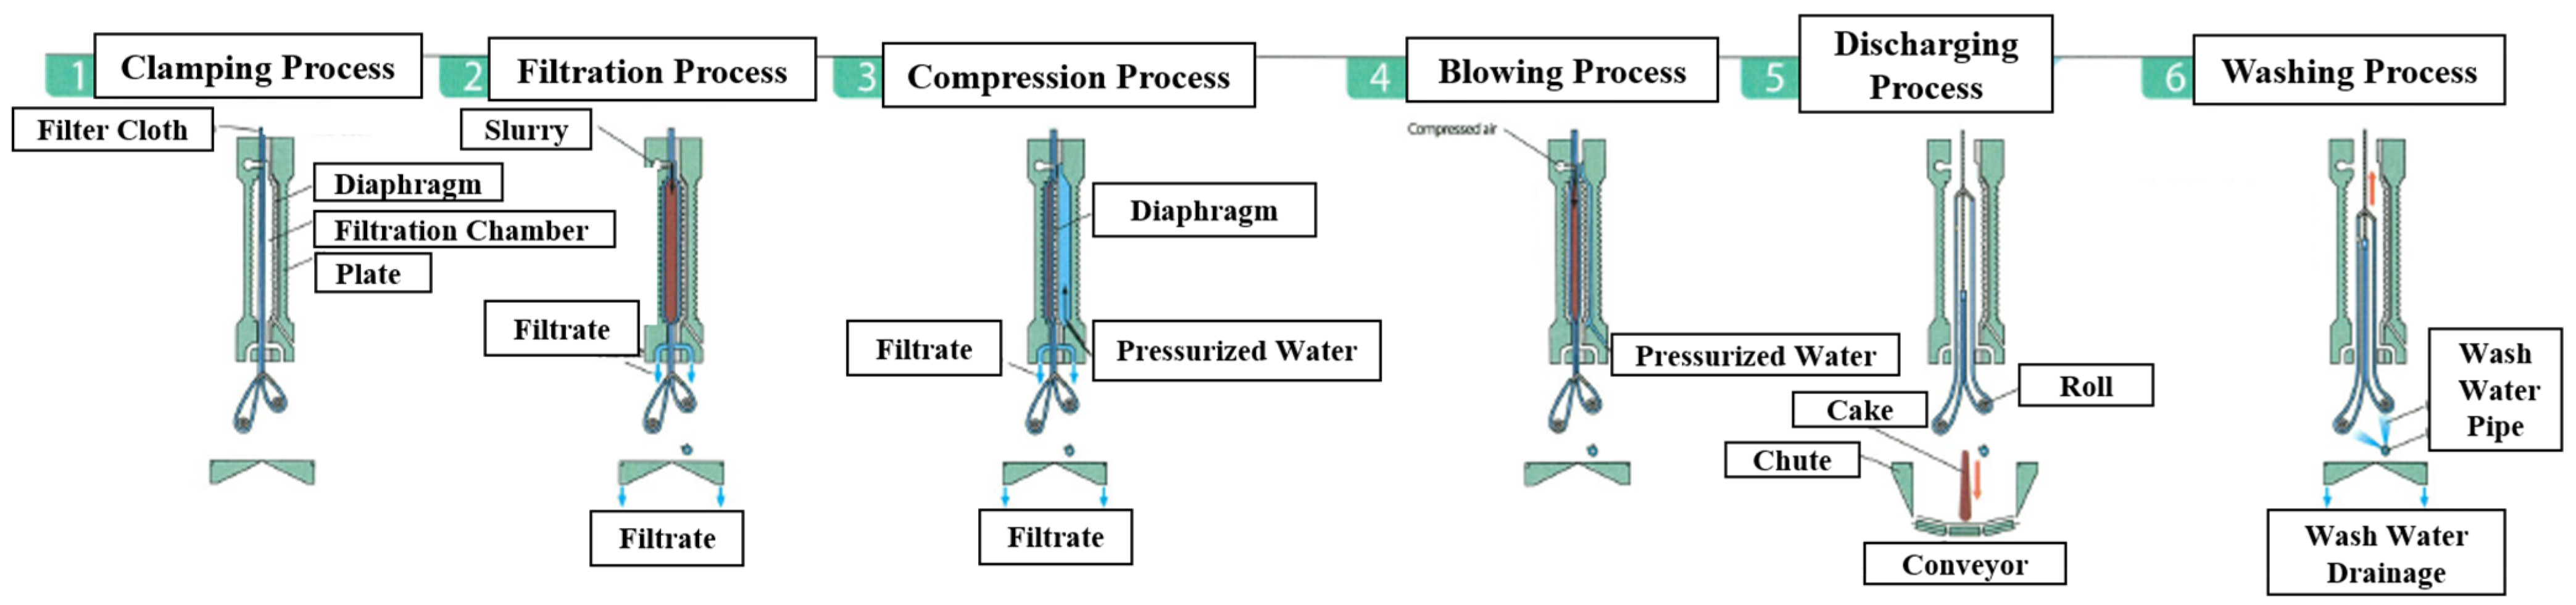
There are six stages of dewatering in a filter press: tightening, filtration, compression, blowing, discharging, and washing (
Figure 3). In this study, we focused only on two processes: filtration (stage 2) and compression (stage 3). During the filtration process, a slurry feed pump feeds the slurry into the filter chamber, and the filtrate exits the filter. Compression is initiated when the filtrate flow decreases.
The compression process uses pressurized water, which increases when the slurry pressure decreases (
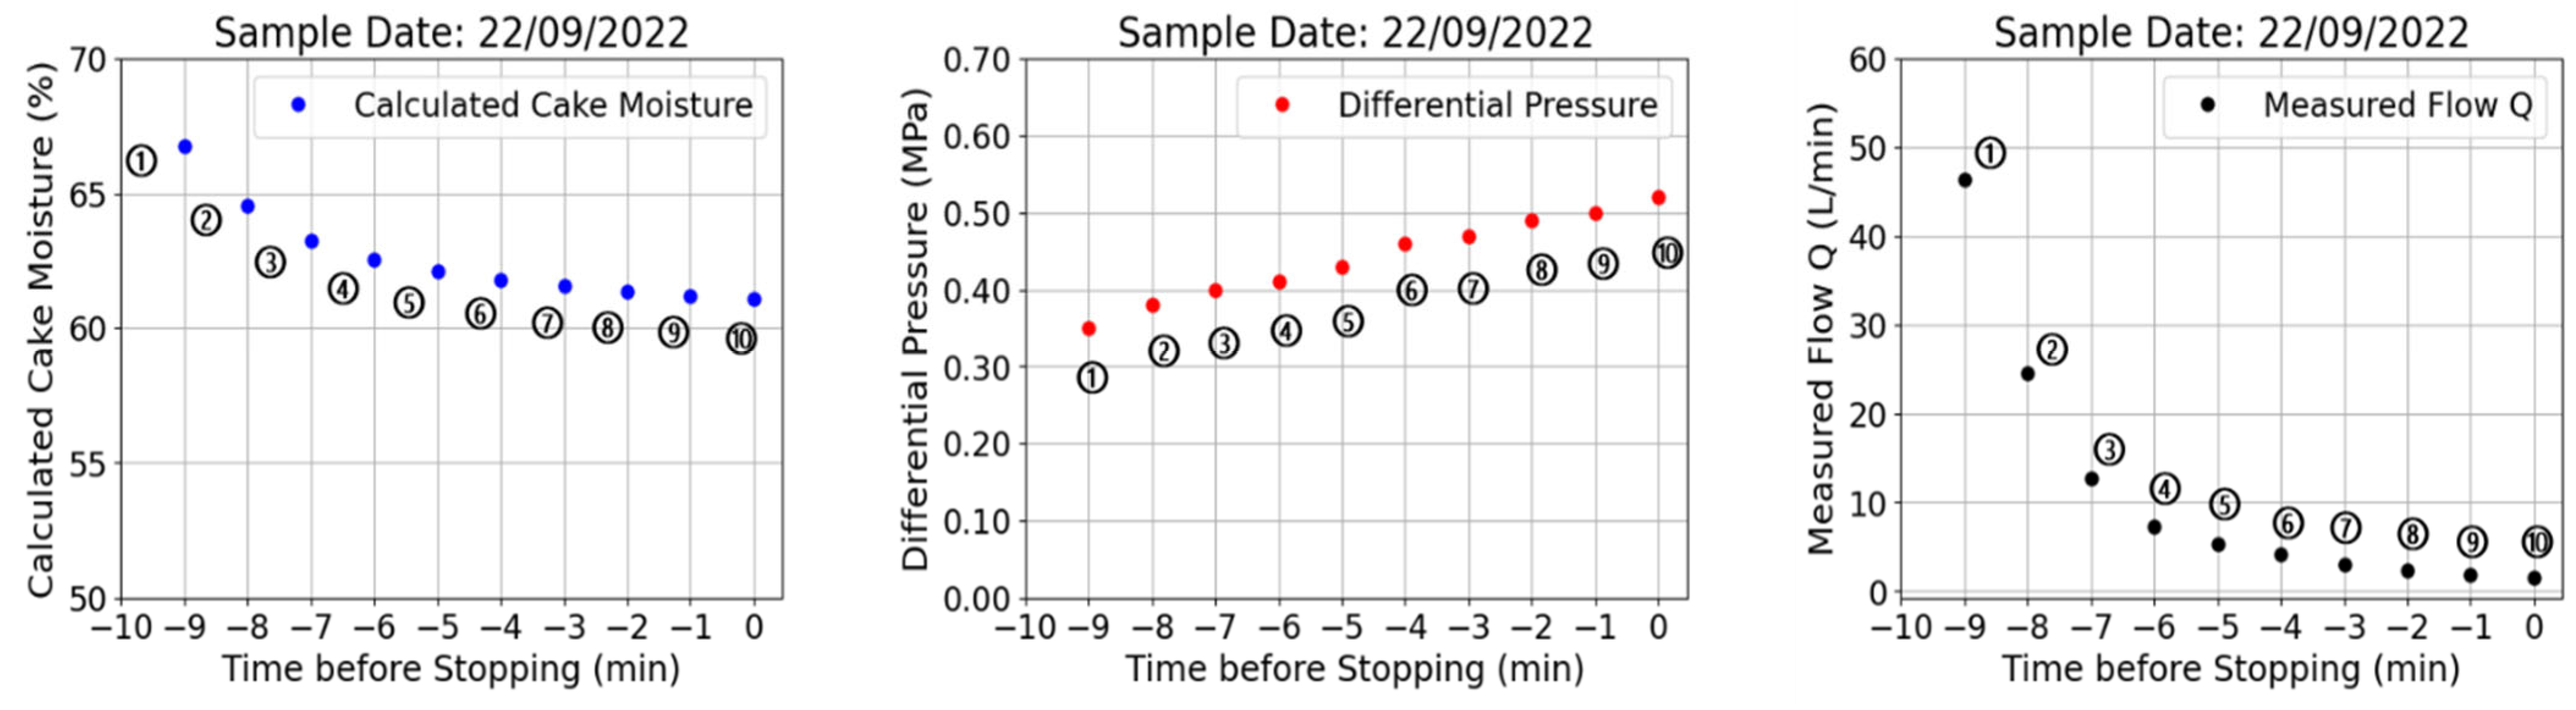
Figure 4). The difference between these two pressures is called the differential pressure. The trend in the differential pressure over one day is shown in
Figure 5 (middle). It increases over time until the compression process is complete. The differential pressure increases as the cake moisture increases (
Figure 5, left). However, the volume flow rate decreases (
Figure 5, right).
Table 3 shows the descriptive statistics (mean, standard deviation, and range) of these three dewatering parameters in one day.
Controlling the compression time is important because this process consumes more energy than other processes. Our approach attempts to control the compression time using existing measurement equipment without the need to add new measurement devices. However, due to data limitations, the time analysis in this study focused only on the measurement time of the volume flow rate.
Figure 3 shows the sample data for 22 September 2022, where the measurement time during the compression process was 10 min before stopping; the entire process took 25 min. Negative values of the time show the time before the compression stops. A value of zero indicates the stopping time.
3. Methodology and Proposed Models
In this section, we explain the flowchart of this study and the proposed model for the estimation of the volume flow rate and cake moisture, a key parameter that controls the compression time in the sludge dewatering process. In this study, we used Python 3.11 as the software for data analysis and data visualization.
Table 4 shows the packages for image processing and regression model analysis.
3.1. Methodology
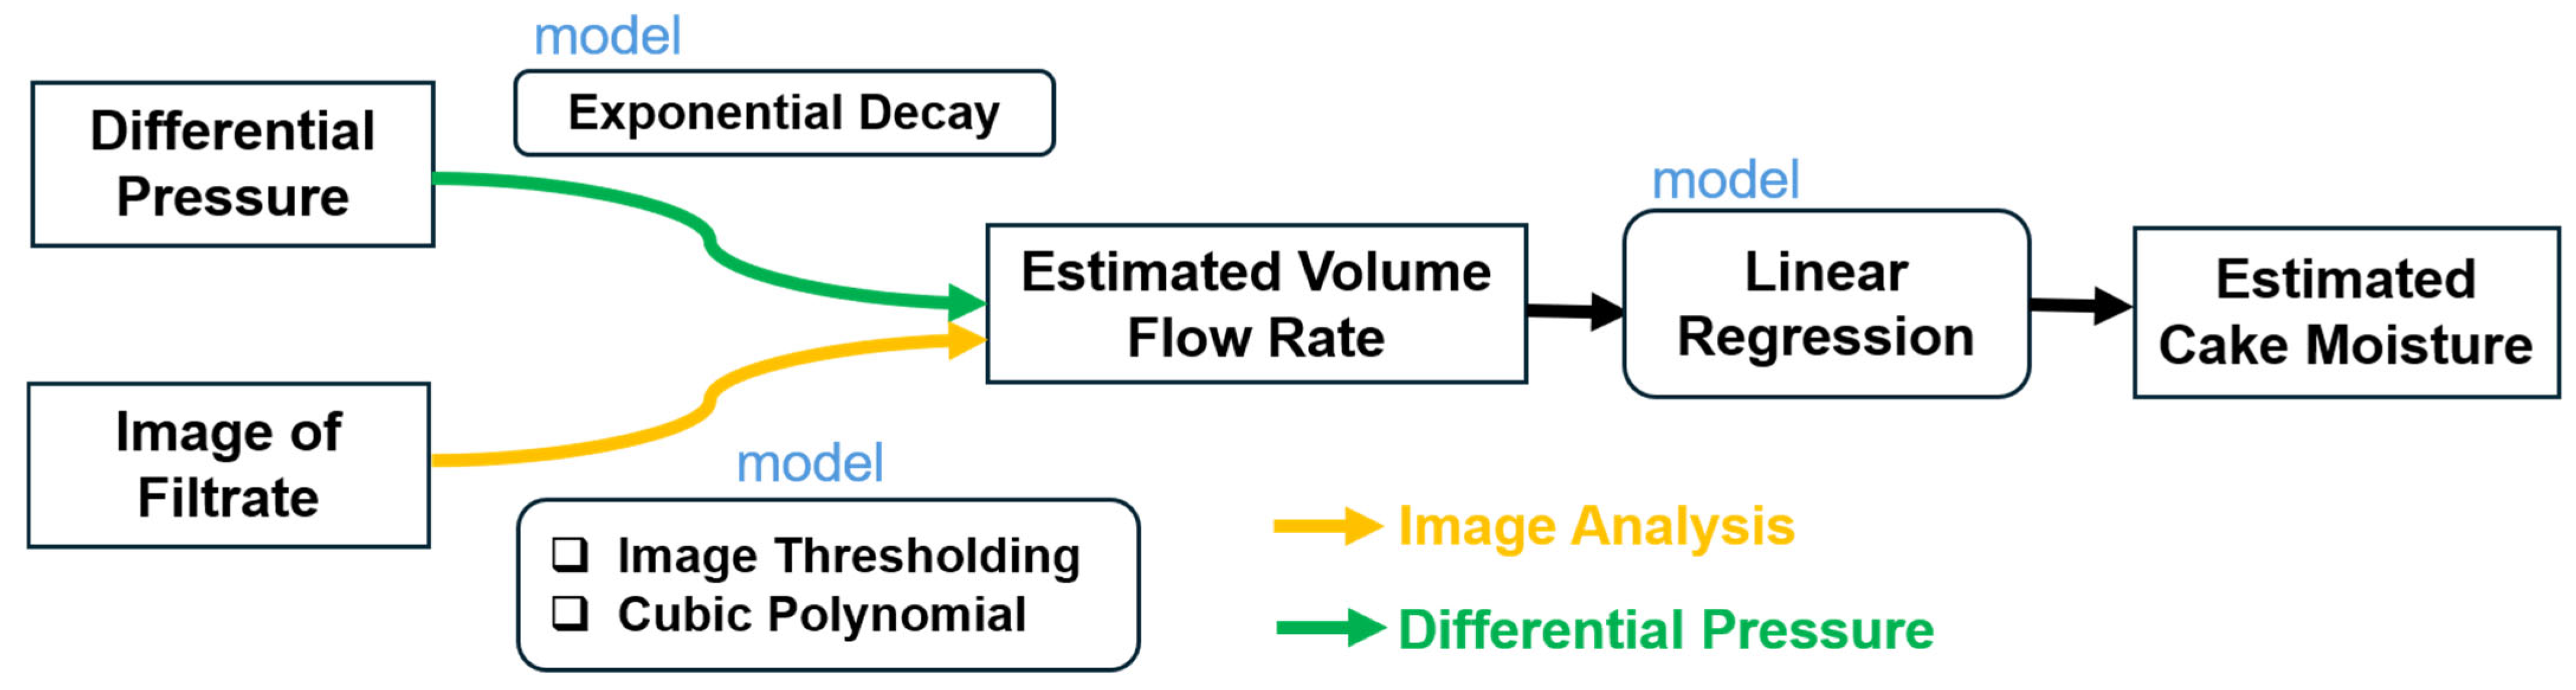
The volume flow rate is a strongly related parameter to the cake moisture. In this study, we used two different pieces of information to estimate the volume flow rate: an image of the filtrate and the differential pressure (
Figure 6). In the image analysis, the image thresholding method is selected for the image segmentation technique and cubic polynomial regression for the volume flow rate estimation [
30,
31]. The relationship between the differential pressure and volume flow rate follows the exponential decay function.
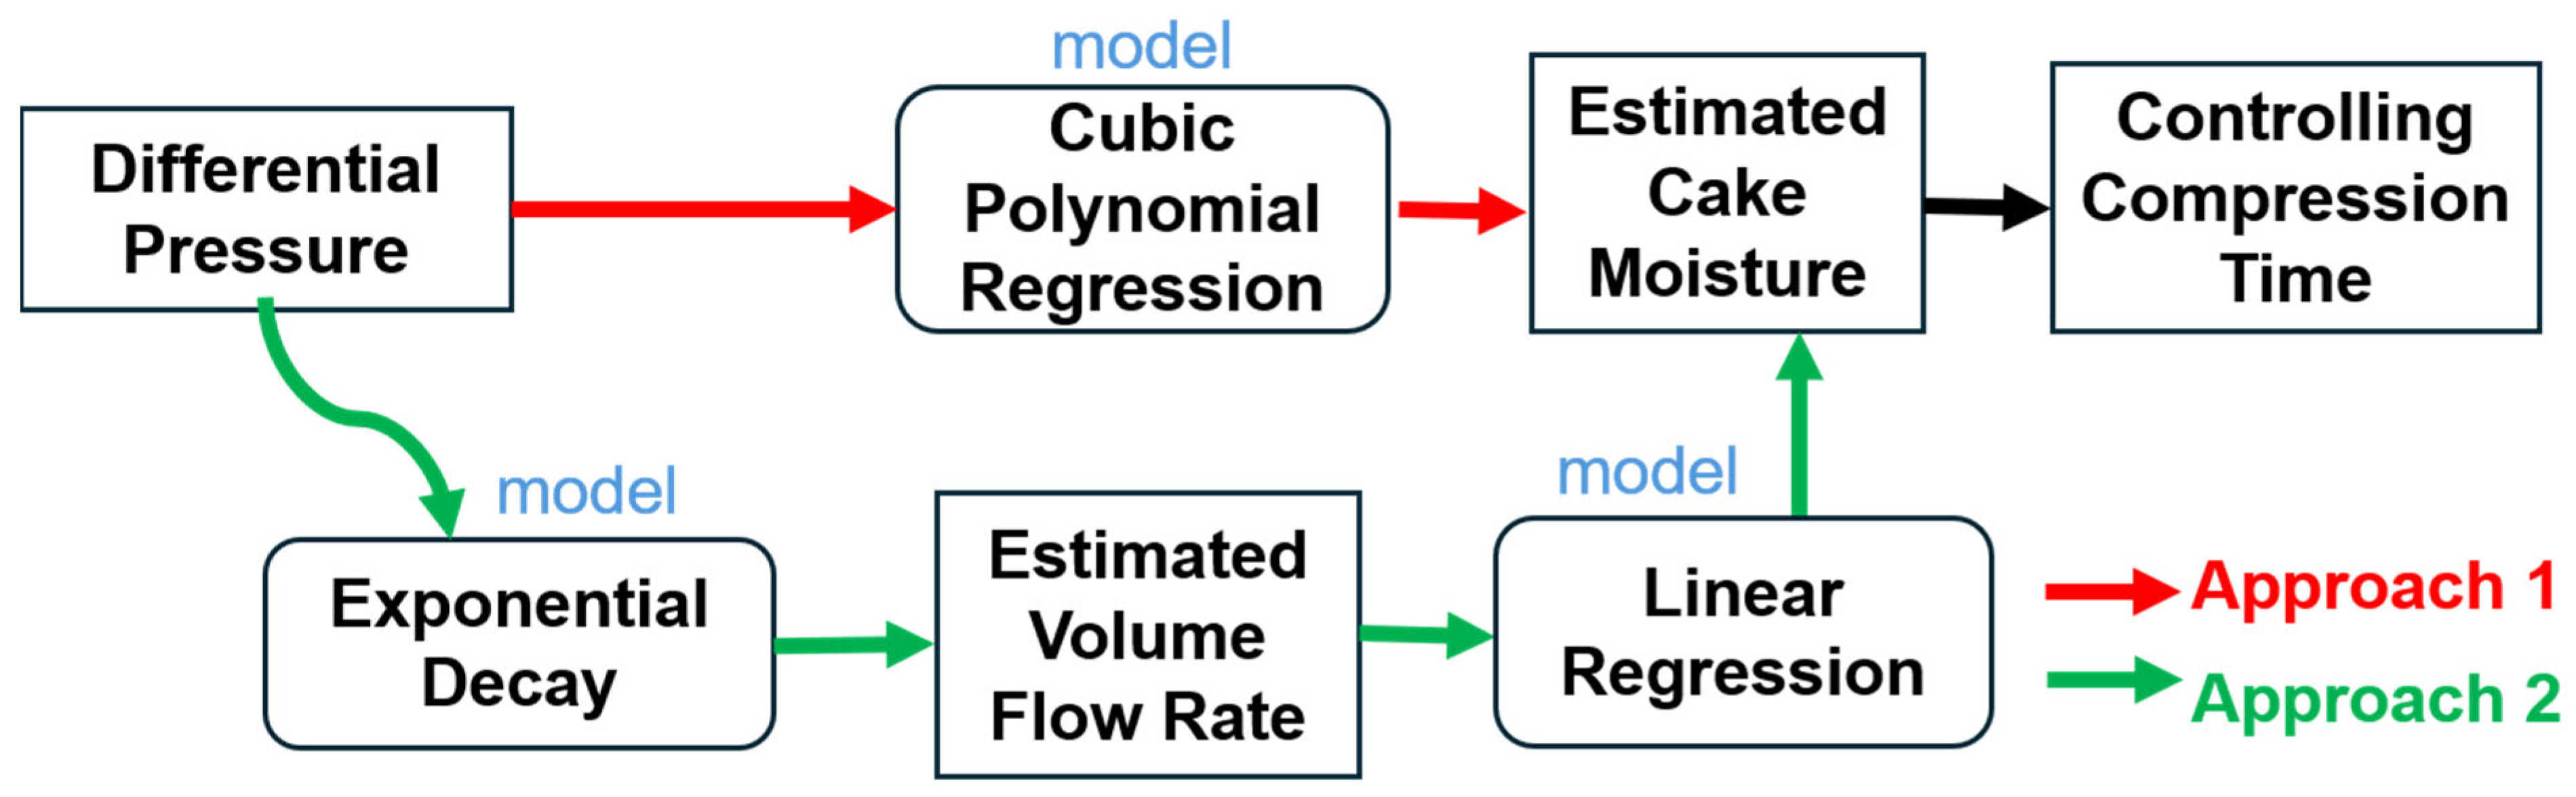
A regression model based on a mathematical function was selected to estimate the cake moisture, the important parameter for controlling the compression time following this research flowchart in
Figure 7. As mentioned earlier, we considered two approaches for estimating the cake moisture. In the first approach, we used the differential pressure directly to estimate the cake moisture. In the second approach, the differential pressure was used to estimate the filtrate flow using an exponential decay function. The cake moisture was estimated from the estimated filtrate flow. In the first approach, we applied cubic polynomial regression, whereas in the second approach, linear regression was selected. The stopping time was determined based on the target cake moisture condition (65–70%). This study focuses on the last stage of dewatering, which is the time when the volume flow rate is measured. This stage is called the sampling time.
3.2. Proposed Model
3.2.1. Image Thresholding
There are many image segmentation techniques that have been developed in computer vision. Image thresholding is one of the simple yet powerful methods to highlight the target object from its background [
30]. The first step of this method is as follows: change the image of the filtrate and its background (
Figure 2) into grayscale images.
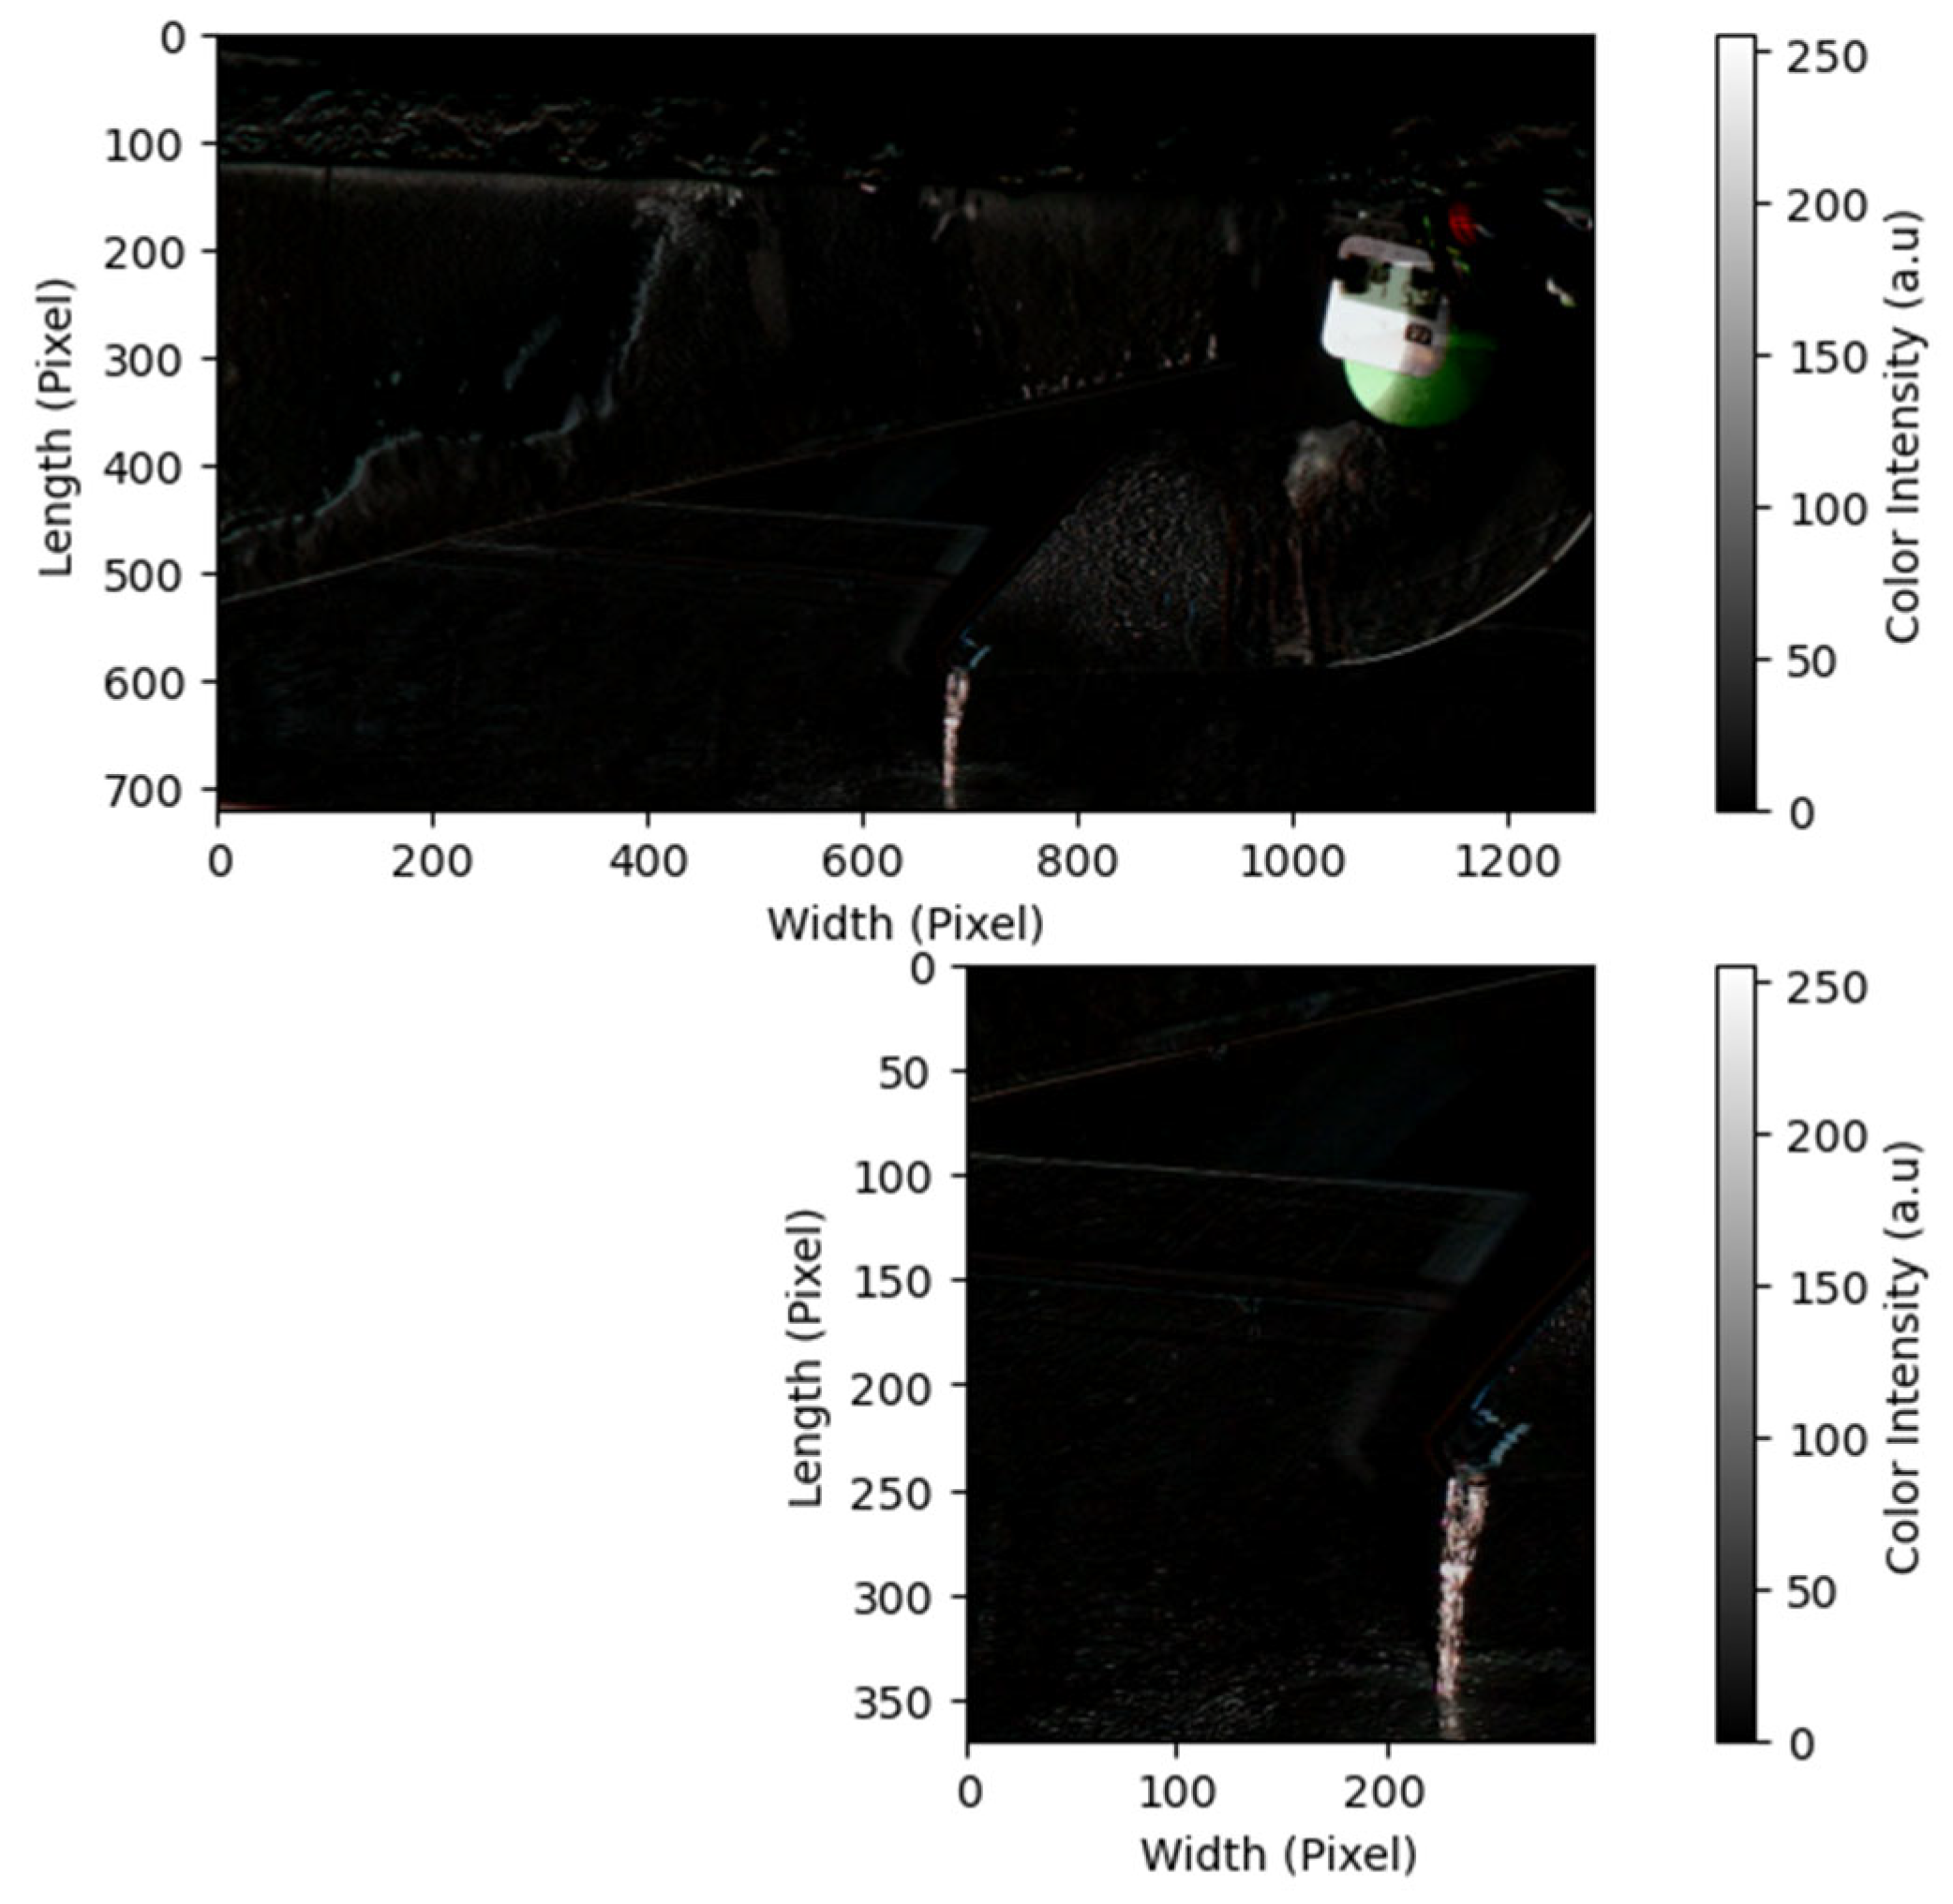
Figure 8 shows the difference between the two images and the bright part is assumed to be water. For further analysis, the filtrate area is manually cropped to limit the analysis area. Since the camera position is not moving during the measuring process, the cropping size is the same for all images.
The binary image of the target object (filtrate) is separated from its background following
where
T is the threshold value determined based on the color intensity of the grayscale image (0–255). The image thresholding method changes the grayscale image to a binary (black and white) image. The normalized scale for a binary image is 0 for black color and 1 for white color. Finally, the pixel numbers of the white color represent the pixel number of the filtrate. In this study, we selected Otsu’s method for an automatic technique that calculates the optimal threshold value by minimizing the intra class variance based on the observed distribution of the pixel values.
In an ideal situation, there are 60 filtrate images that are captured every minute to represent one value of the filtrate flow rate. However, some images cannot be used for analysis because the filtrate is obscured by a ladle, the measurement tool used to measure the volume of filtrate every minute. In this case, blurred images are excluded because the filtrate cannot be clearly seen in the image. For this reason, we used the average value of the pixel numbers of the filtrate image in one minute to estimate the volume flow rate. Based on the relationship between the pixel numbers and volume flow rate [
31], we proposed polynomial regression for the estimation. Since real water is three dimensions, cubic polynomial regression (degree three) was the selected model.
In this study, we compared the results of the estimated volume flow rate based on the image analysis with the estimated flow rate based on the differential pressure.
3.2.2. Regression Model Based on Mathematical Analysis
Exponential decay has been used in various systems [
32,
33,
34,
35,
36]. In this study, the volume flow rate decreased over time following an exponential decay function, which is mathematically expressed as
where
y is the estimated volume flow rate (L/min),
x is the time step (min),
a is the amplitude related to the initial value (L/min),
b is the decay factor (L/min
2), and
c is a constant (L/min). When
c = 0, the optimum values of parameters
a and
b are determined using least-squares fitting as follows:
Here, n is the total sample data and i is some individual sample indexed, where i ∈ {1, 2, …, n}. In this study, parameter a is the initial volume flow rate, parameter b controls the speed of dewatering over time (the range between 0 and 1), where a higher value of b indicates that the dewatering process is faster, and parameter c is the final volume flow rate before stopping the compression. The most important parameter is the decay factor b because it represents the portion of the original amount of the volume flow rate that remains after each time period. The decay factor controls the speed of the decrease in the volume flow rate in the dewatering process. The speed of the dewatering process is related to the compression time. Therefore, the compression time can be controlled based on the number of decay factors.
The cake moisture during the compression and measurement processes was calculated based on the volume flow rate; hence, we propose a linear regression model as the prediction model. Linear regression assumes that the predicted variable has a strong relationship with the input (independent) variables as a straight line [
37,
38] following the equation:
where
y is the estimated cake moisture (%),
x is the volume flow rate (L/min), α is the
y-axis intercept, and
β is the slope or gradient of the line. Linear regression is a first-degree polynomial regression.
Polynomial regression is generally used when the points in the data are not captured by linear regression and are modeled as an
n-th degree polynomial. It also fits nonlinear relationships [
39]. For a lower degree, the relationship has a specific name: when
n = 2, it is called a quadratic polynomial regression; when
n = 3, it is called a cubic polynomial regression. Some applications of cubic equations in engineering are related to the pressure, temperature, and specific volume of a substance. Usually, the temperature and pressure are independent [
40]. In this study, we applied cubic polynomial regression to estimate the cake moisture from the differential pressure as follows:
where
y is the estimated cake moisture (%);
x is the differential pressure (MPa); and
a,
b,
c, and
d are the coefficients of the equation, where a is strictly not equal to zero.
The coefficient of determination (
R2 or R-squared) can be interpreted as the proportion of variance in the dependent variable that is predictable from the independent variable, as follows:
where
is the predicted value,
is the actual value, and
is the mean of the actual values.
The residual or error (
e) between the estimated and actual values is given by
where
yactual is the actual data or calculated cake moisture (%) and
ypredicted is the predicted data or estimated cake moisture (%).
4. Simulation Results
The time for the compression process in sludge dewatering depends on the cake moisture condition that is estimated using the two approaches: direct estimation from the indirect indicators, the differential pressure, and another using a closely related parameter, the volume flow rate. Therefore, first estimating the volume flow rate is vital. The volume flow rate can be estimated from the captured image of the filtrate and differential pressure. The result of the estimated volume flow rate was used for the cake moisture estimation and compared with the cake moisture estimated from the differential pressure.
4.1. Image Thresholding for Detecting the Filtrate Area
In this study, the volume flow rate is estimated from the pixel number of the filtrate in the 2D image per unit time. The best threshold value of the color intensity is determined by analyzing the line profile in the image to separate the filtrate area and its background. The optimum threshold value based on Otsu’s method to distinguish the color intensity of water and its background is 60. Since the position of the camera does not move during the measuring time, this threshold value can be used for all the captured images.
Figure 9 (below) shows the binary (black and white) image produced by following (1) with the white area representing the filtrate area in the image. By calculating the pixel number of the filtrate, the volume flow rate can be estimated using cubic polynomial regression (6).
4.2. Comparison Between Image Analysis and Differential Pressure for Volume Flow Rate and Cake Moisture Estimation
Figure 10a shows the relationship between the pixel numbers and volume flow rate. The pixel numbers increase as the volume flow rate increases. However, the differential decreases following the exponential decay function (
Figure 10b). Both figures show the results of the volume flow rate estimation using two different inputs (pixel numbers and differential pressure), and two regression models based on mathematical functions (cubic polynomial and exponential decay).
The results of the cake moisture estimation from the volume flow rate using linear regression are represented in
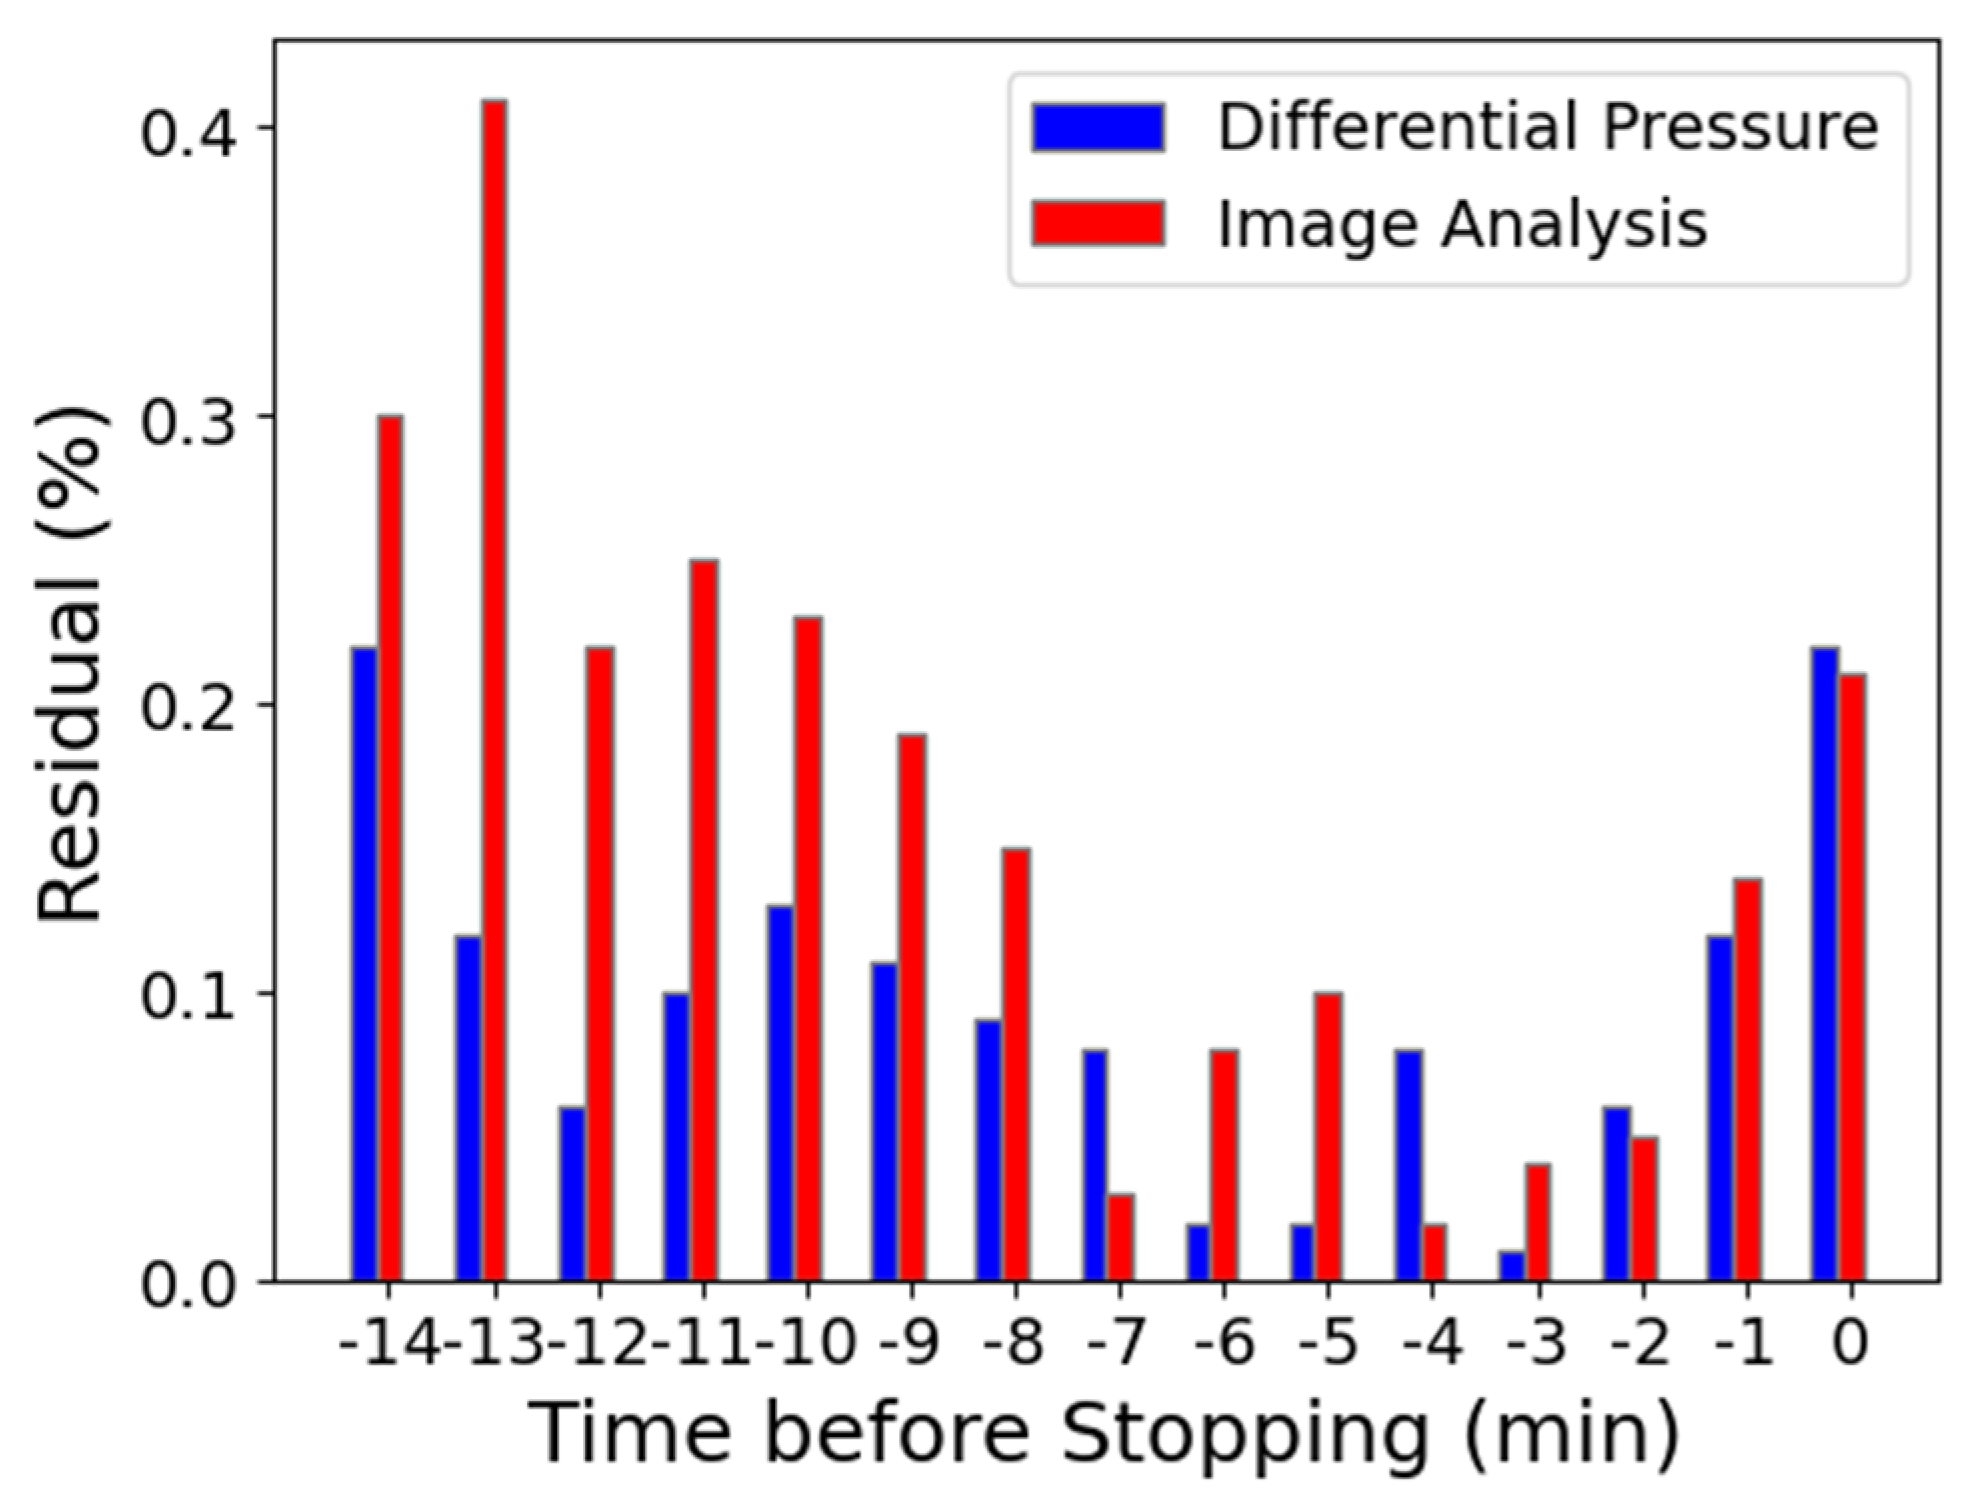
Figure 11. The estimation results show both input data are a suitable model for the cake moisture estimation. However, the comparison of the error in
Figure 12 shows that the cake moisture estimation from the differential pressure gives the better estimation result compared to the image analysis.
4.3. Decay Factor for Controling the Compression Time
The previous results show that the differential pressure is a better parameter for estimating the volume flow rate and cake moisture estimation. The volume flow rate decreases as the differential pressure increases, following an exponential decay function. In this simulation, two functions of exponential decay (2) are used for the analysis when
c ≠ 0 and
c = 0 (
Table 5). The optimum values of
a and
b were determined using least-squares fitting (3,4).
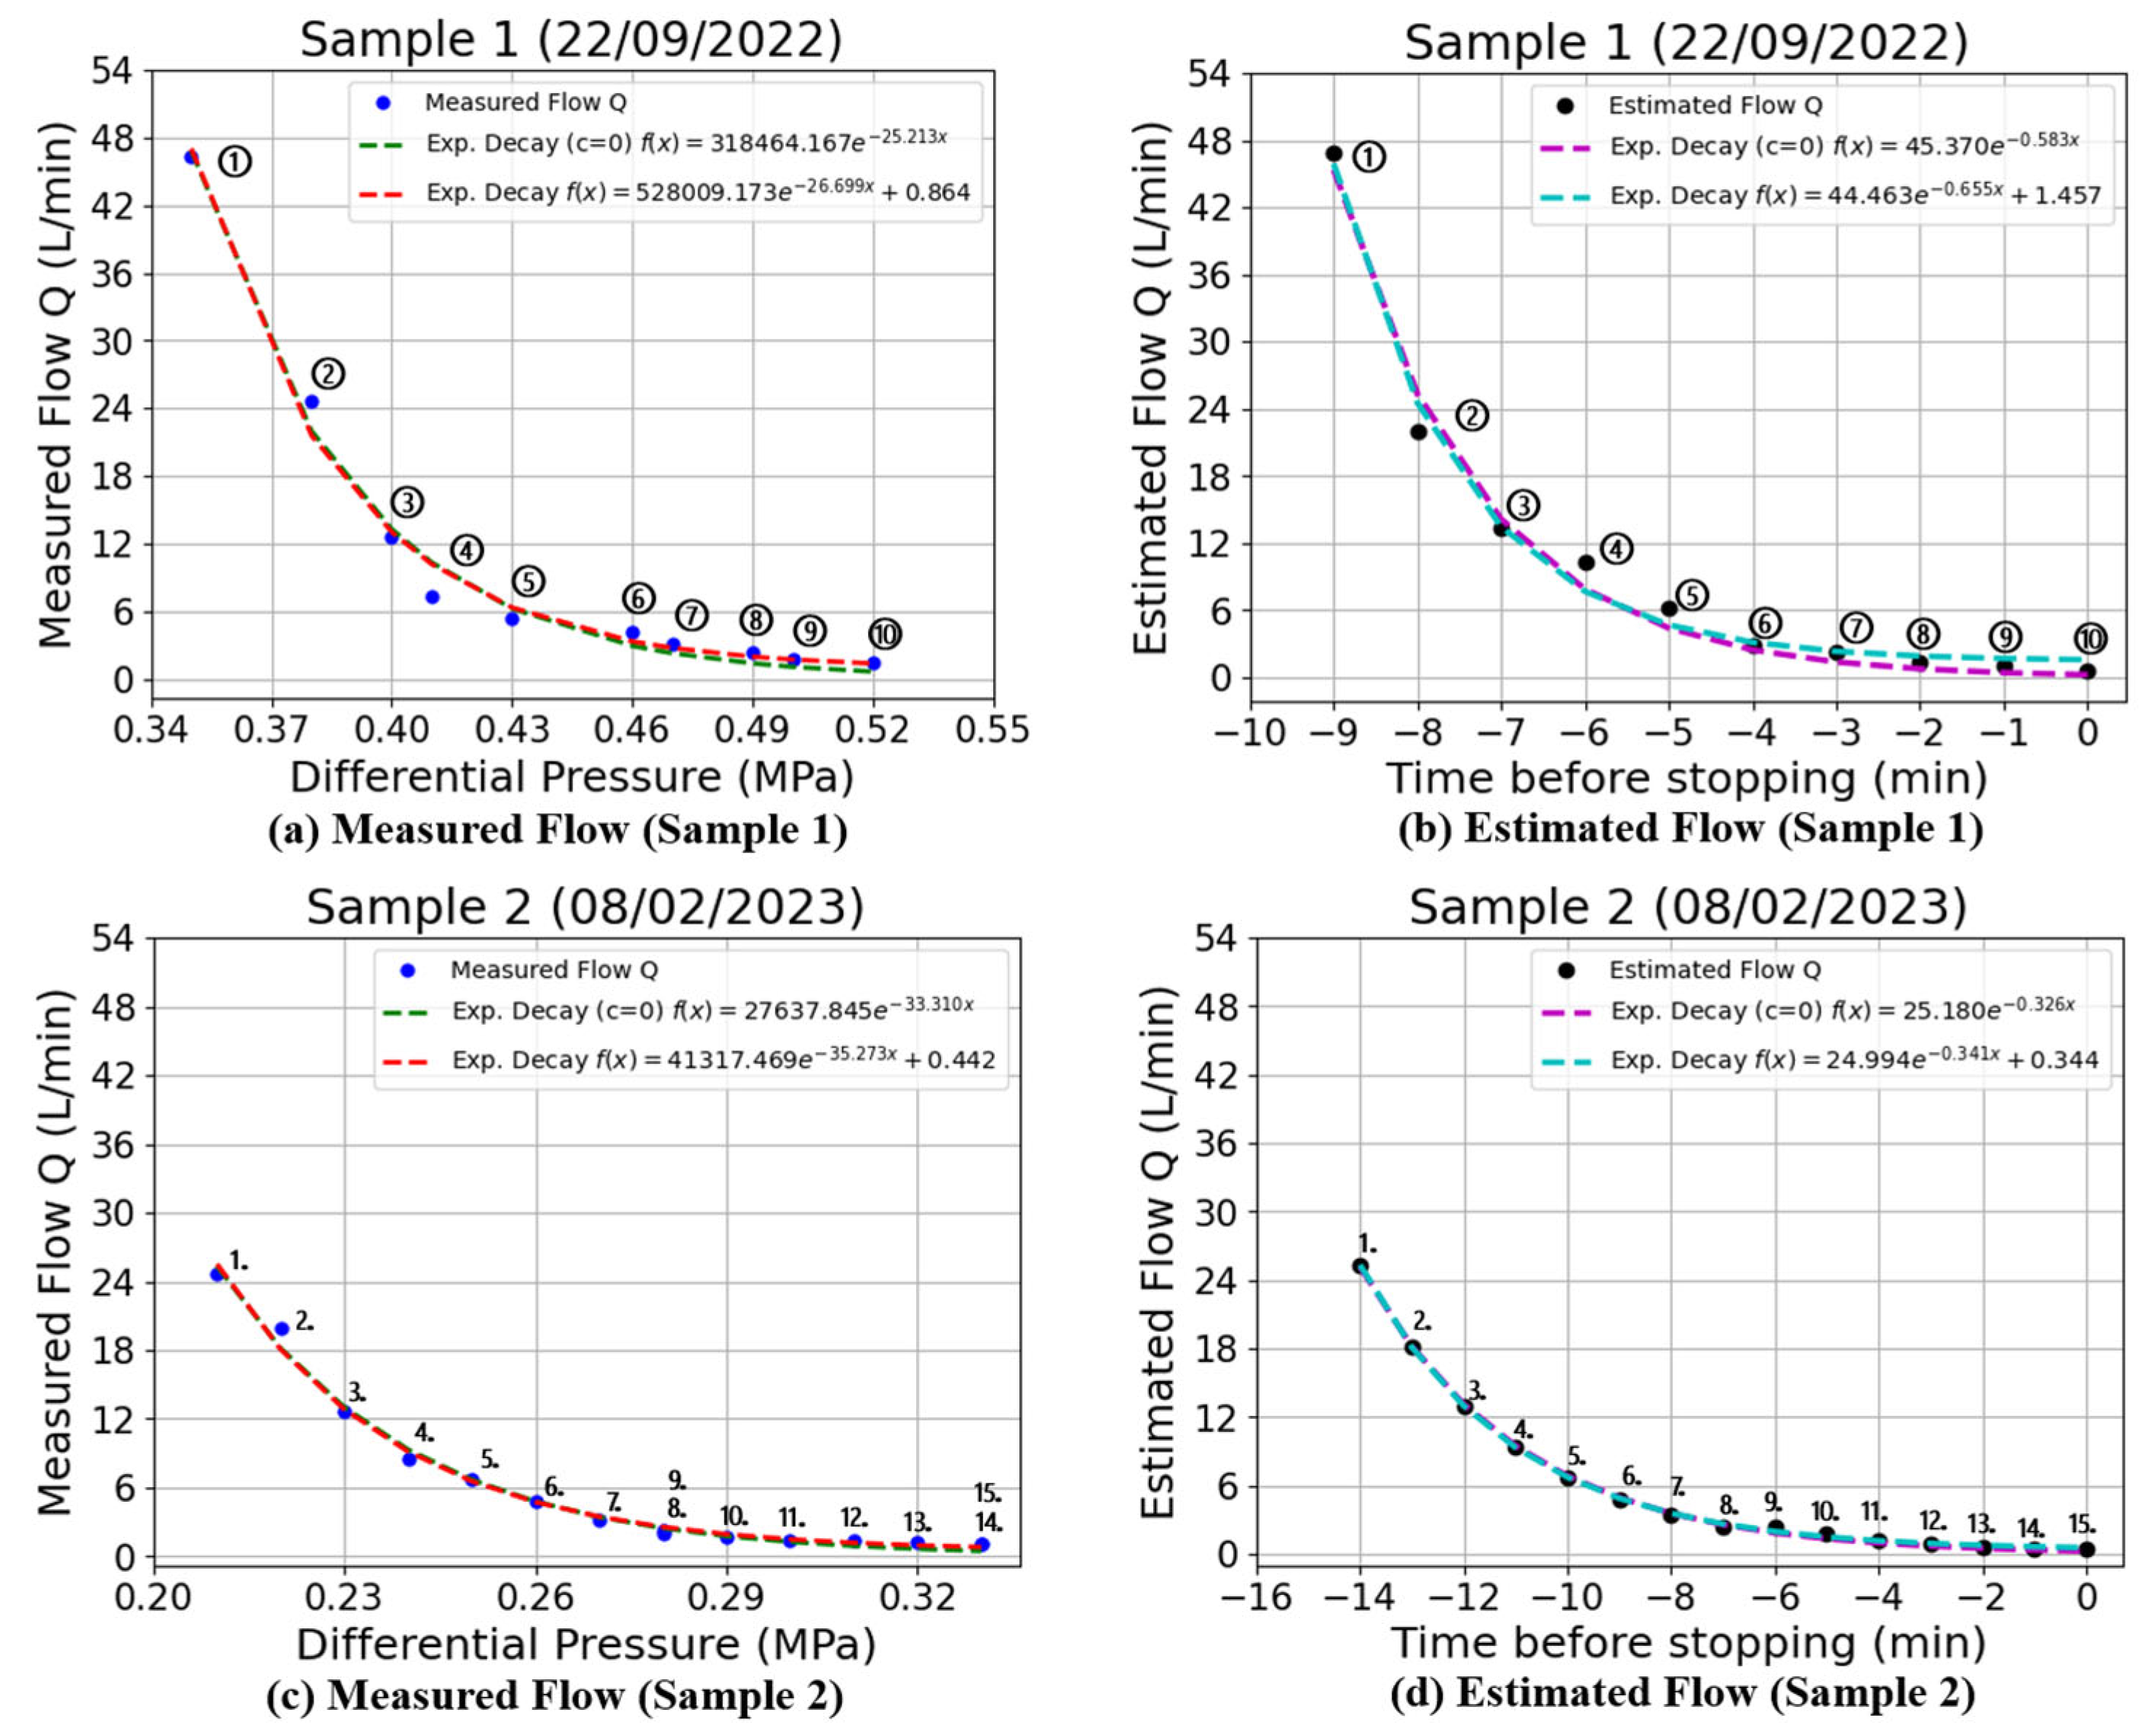
Two sample data points were selected for comparing the simulation results of the volume flow rate using exponential decay functions: the month with the shortest dewatering time (September) and the month with the longest dewatering time (February). Sample 1 was obtained on 22 September 2022 with a compression time of 25 min and measurement time of 10 min before stopping. Sample 2 was obtained on 8 February 2023, with a compression time of 45 min and a measurement time of 14 min before stopping.
Figure 13a,c show the results estimated for the volume flow rate using exponential decay. The correlation between the volume flow rate and time is shown in
Figure 13b,d, where the volume flow rate decreased over time. From the results of both exponential decay functions, the decay factor
b has only a small difference of 0.072 L/min
2 for Sample 1 and 0.015 L/min
2 for Sample 2.
Figure 14 shows the monthly average of the decay factor over one year of data (April 2022–February 2023). The results show that the decay factor increases from April to September and starts to decrease from October to February.
The value of the decay factor is strongly related to the speed of dewatering; the higher the decay factor, the faster the dewatering. The decay factor b is a key parameter that controls the duration of the sludge dewatering process.
4.4. Cake Moisture Estimation Using Two Different Pieces of Information: Differential Pressure and Volume Flow Rate
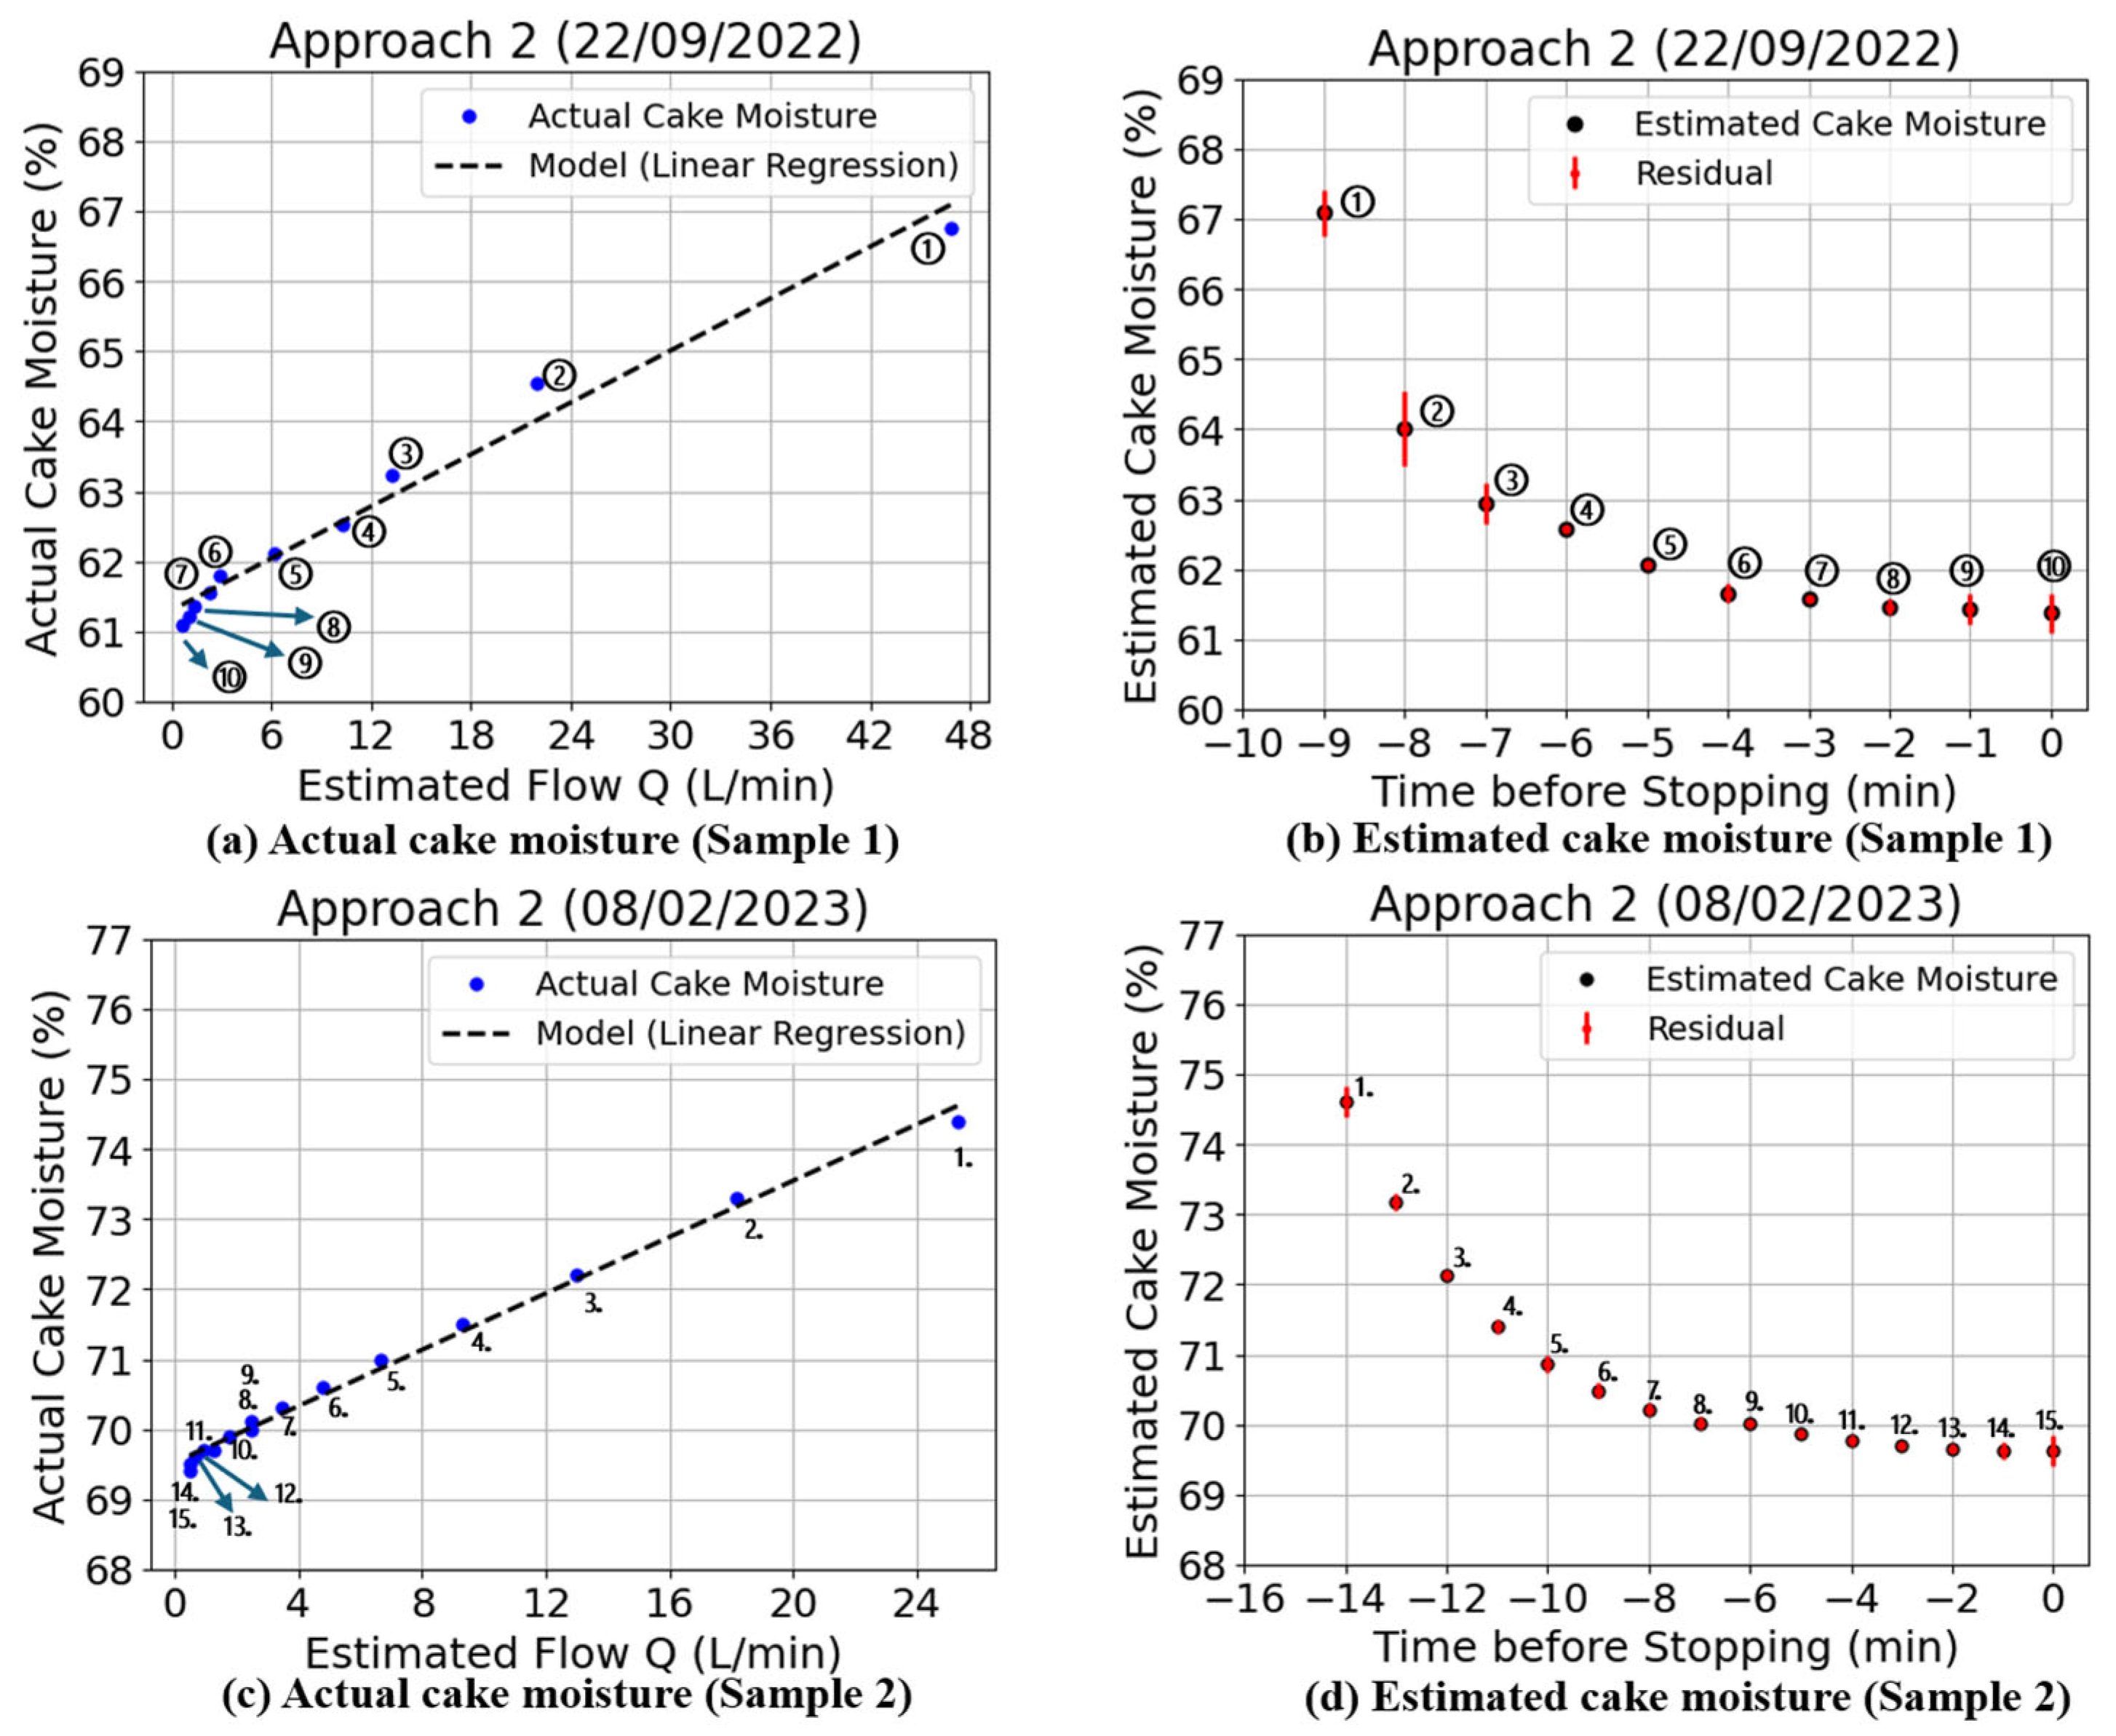
Two approaches were used to estimate the cake moisture. In the first approach, the proposed mathematical model is cubic polynomial regression (6), and the input parameter is an indirect indicator (differential pressure). The mathematical model selected for the second approach is linear regression (5), and the input is a closely related parameter, the volume flow rate. The residual (8) was calculated based on the difference between the actual and estimated cake moisture to check the accuracy of both approaches.
Two sampling days were selected for the cake moisture estimation.
Figure 15a,c show the results of Approach 1, where the cake moisture decreased as the differential pressure increased. The relationship between the estimated cake moisture times is given by
Figure 15b,d.
The results of Approach 2 are shown in
Figure 16a,c, where the cake moisture increases as the volume flow rate increases. The relationship between the estimated cake moisture times is shown in
Figure 16b,d.
The residual (red line) in the figure indicates that both approaches have small errors.
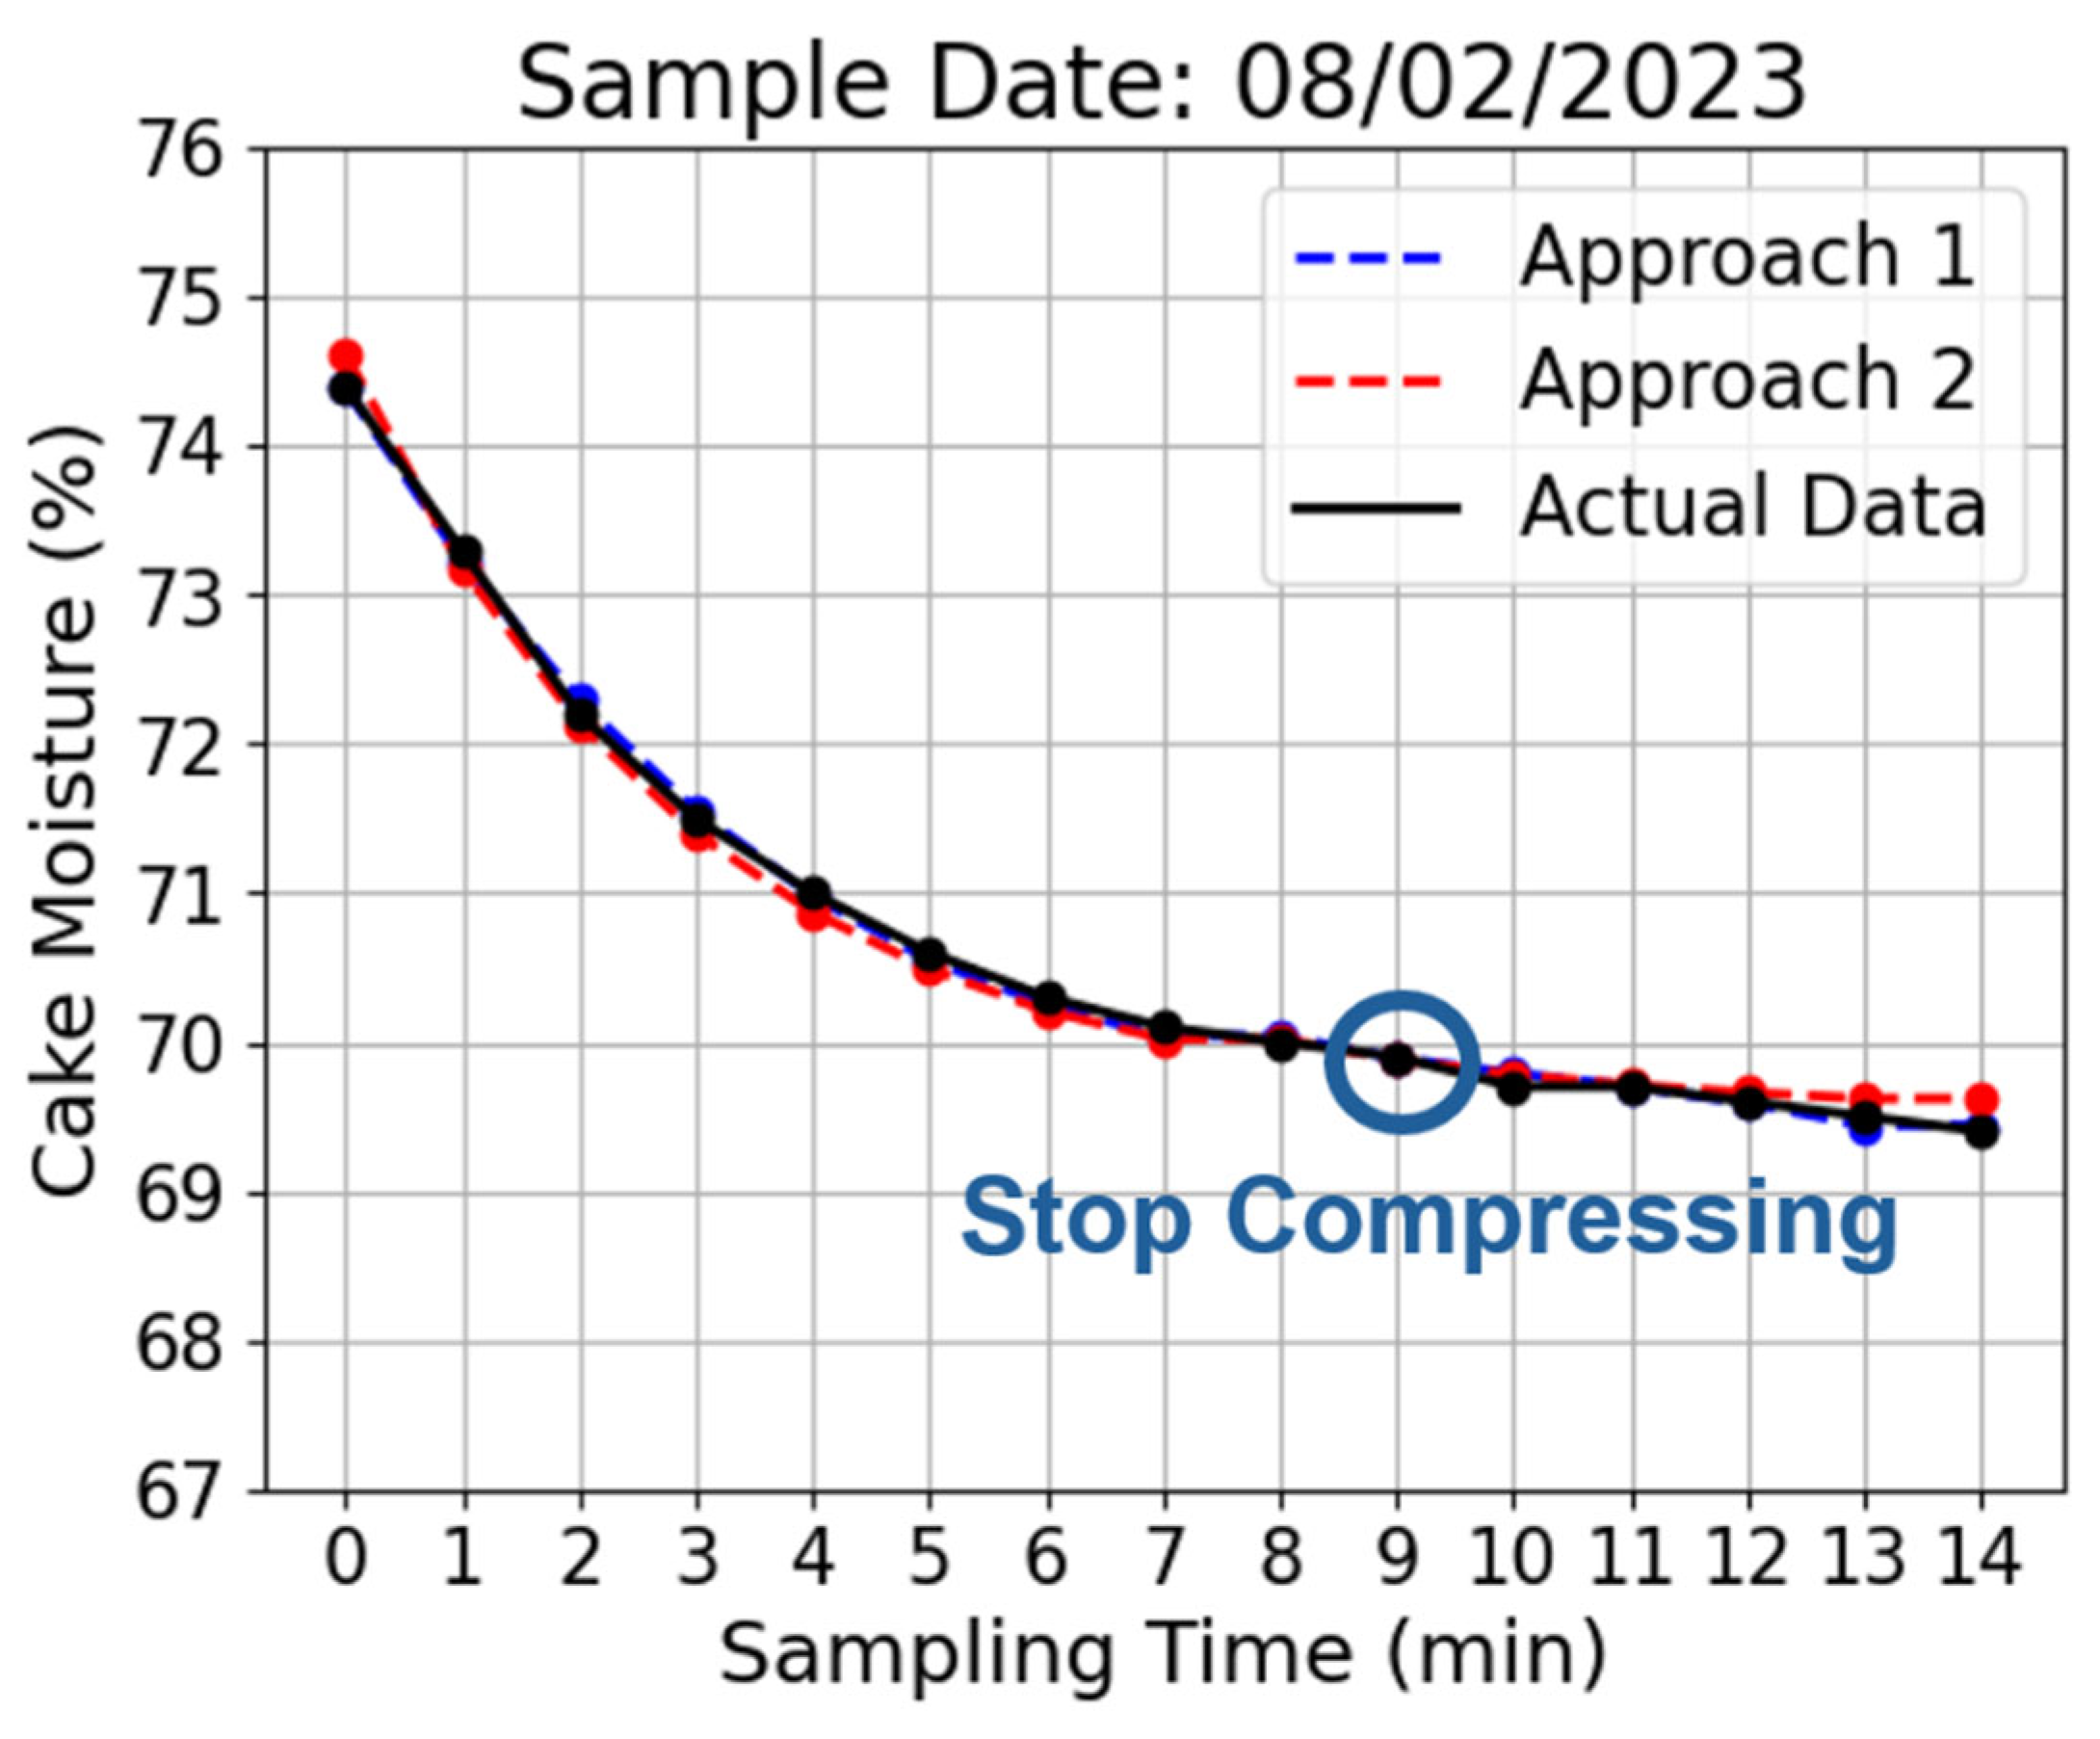
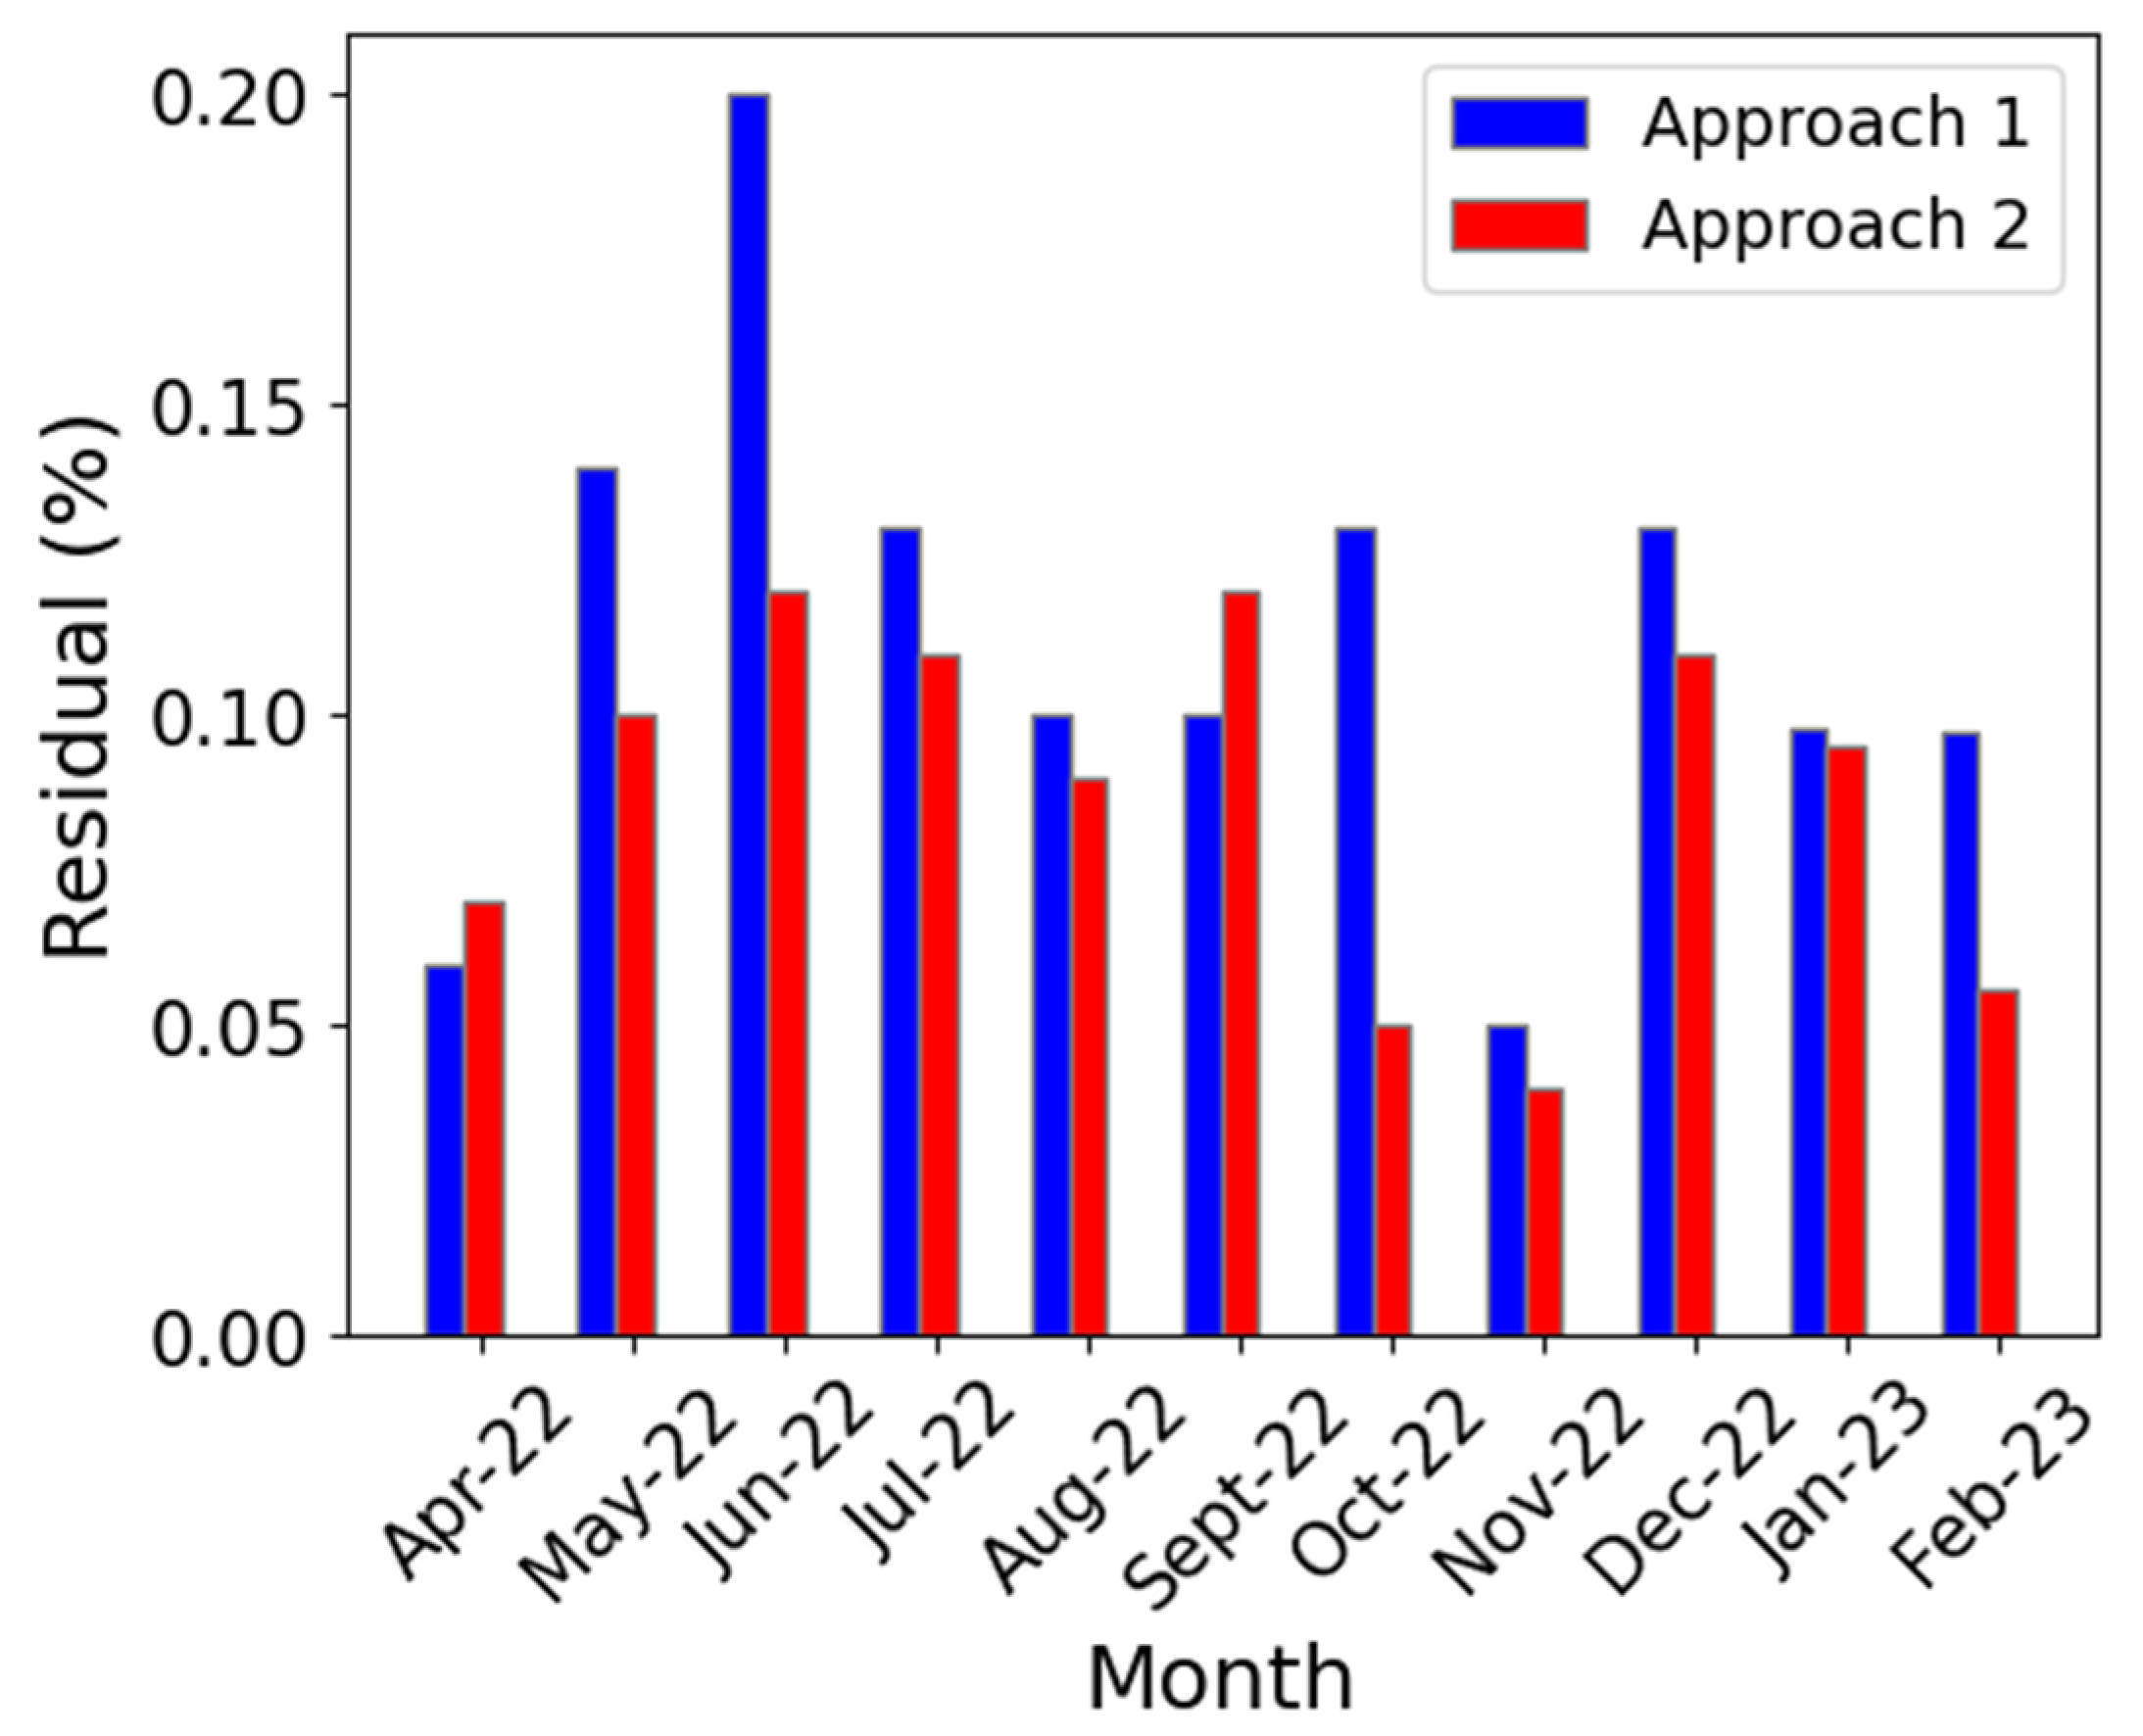
Figure 17 shows a comparison of the estimation results of both approaches and the actual cake moisture. The monthly average error of the simulation results for a one-year period (April 2022 to February 2023) is shown in
Figure 18.
To strengthen the cake moisture results,
Table 6 shows some statistical tests to support the performance of the regression models.
4.5. Controlling the Compression Time Based on Estimated Cake Moisture
The compression time of the sludge dewatering was determined based on the target cake moisture condition (65–70%). Before dewatering began, the cake moisture content was above 95%, and the compression time was approximately 25–45 min. However, cake moisture information is only available a few minutes before stopping, with a sampling time of approximately 10–20 min. On the example day (8 February 2023), the compression time was 45 min and the sampling time was 14 min, with an initial cake moisture of 74%.
Figure 17 shows that from both approaches, the target cake moisture was achieved at a sampling time of 9 min. Given that the target is achieved in minute 9, we can save 5 min of electricity usage for compression, which is important for energy efficiency.
5. Discussion
In the simulation results, the cake moisture was estimated using indirect indicators, the differential pressure, and related parameters, the volume flow rate. This study proposed a regression model based on a mathematical function such as the exponential decay function, linear regression, and cubic polynomial regression, instead of machine learning models. This model is used for describing the relationship between the input and output of dewatering parameters and for estimating the cake moisture to control the compression time. The data used in this study is from April 2022 to February 2023.
We compared two different parameters for the volume flow rate estimation: image analysis and differential pressure analysis. The result of the estimated volume flow rate is important for cake moisture estimation.
Figure 12 shows that the differential pressure produced the better results compared to the image analysis because the pressure sensors perform more stably compared to the image analysis. As mentioned earlier, in an ideal situation, there are 60 images taken every minute; however, not all images can be used.
The volume flow rate decreases over time, following an exponential decay function (
Figure 5). The most important parameter in this function is the decay factor (
b), which controls the speed of dewatering and the duration of the compression.
Figure 14 shows that the decay factor values increased from April to September and decreased from October to February. From April to September, the dewatering process accelerated as the decay factor increased, indicating that the compression time decreased. However, from October to February, the dewatering process slowed as the decay factor decreased. It took longer for the compression process to occur during this period. In the estimation results, parameter
c represents the volume flow rate at the end of the compression process.
The limitations of this study were that the measurement and compression times were different. During the first few minutes of compression, measuring the filtrate flow rate was difficult. Therefore, we only have complete data for all parameters in the last few minutes before stopping (measurement time). Another limitation of this study was that the measurement time for each day was different. Therefore, the exponential decay function needs to be improved to align the measurement and compression times on different days.
Linear regression was selected for estimating the cake moisture using the filtrate flow rate, and cubic polynomial regression was used with the differential pressure as the input data. The results show that the estimation errors for both approaches were minimal. However, in general, Approach 2, which involved estimating the cake moisture using the volume filtrate rate, provided better results. In the dewatering process, the cake moisture is the percentage of water content that has a stronger relationship with the flowing filtrate over time (volume flow rate), as directly measured by the investigation team. In contrast, the differential pressure is related to the speed of reducing the cake moisture during the compression process.
To control the optimal time for compression, we used the estimated cake moisture when the target cake moisture was achieved (65–70%). These two approaches for estimating the cake moisture yielded similar results for the optimum time to stop dewatering in a filter press.
Figure 17 shows that it is better to stop compression when the angle of the curve tends to be flat. Controlling the compression time is important to save time and energy.
This study proposed image processing and differential pressure analysis for cake moisture estimation. The regression model results obtained using these two analyses are useful for improving transparency in industrial systems and the feasibility of deploying models in actual operations.
However, in the future, the mathematical function must be improved for achieving the automatic control of compression with higher accuracy using only existing measurement devices. As part of our future work, we plan to focus on early-stage data points to predict future cake moisture conditions by incorporating multiple dimensions of input data and accounting for the influence of environmental parameters. Furthermore, the effects of parameters not measured in this study, such as humidity, warrant further investigation.
6. Conclusions
Controlling the compression time of the filter press during sludge dewatering is important for time and energy efficiencies. The optimum dewatering time for this system is strongly related to the cake moisture conditions. In this study, the cake moisture had no direct relationship with the input parameter of the differential pressure. However, this differential pressure can be used as a closely related parameter, that is, the volume flow rate, for cake moisture estimation. The relationship of these dewatering parameters is described using a regression model based on a mathematical function.
There are two different techniques to estimate the volume flow rate: image analysis and differential pressure analysis. The results show that estimating using the differential pressure performs better than image analysis.
The volume flow rate decreased over time as the differential pressure increased, following an exponential decay function, and the speed of the decrease was different for each month. The decay factor is an important parameter because it can be used to check the dewatering speed and control the stopping time. A higher decay factor indicates a faster dewatering process. The results show that the dewatering process accelerated from April 2022 to September 2022 and slowed from October 2022 to February 2023, with the decay factor changing in the range 0.30–0.60 L/min2.
The cake moisture was estimated using the following mathematical models: linear regression and cubic polynomial regression based on the volume flow rate and differential pressure information, respectively. The results show that the estimation using the volume filtrate rate was better than that using the differential pressure, mainly because the volume filtration rate is strongly related to the cake moisture, whereas the differential pressure is an indirect parameter.
In future work, we will develop a model for estimating future cake moisture conditions automatically using early-stage dewatering data and apply it for controlling the optimum time for the dewatering process in the filter press.
Author Contributions
Conceptualization: P.S.R., N.Y., H.I., J.S. and S.W.; methodology: P.S.R., N.Y., H.I., J.S. and S.W.; formal analysis, P.S.R. and S.W.; investigation, P.S.R., N.Y., H.I., J.S. and S.W.; data curation, P.S.R., N.Y., H.I., J.S. and S.W.; supervision, N.Y., H.I., J.S., S.K., Y.O., K.S., W.T. and S.W. All authors participated in writing the manuscript. All authors have read and agreed to the published version of the manuscript.
Funding
This research received no funding.
Data Availability Statement
The data presented in this study are available on request from the corresponding author. We cannot provide our data in an open access because it contains customer data.
Acknowledgments
We extend our appreciation for the assistance supported through the Project Based Learning-AI (PBL-AI) program and the Ministry of Education, Culture, Sports, Science, and Technology (Monbukagakusho: MEXT) scholarship awarded to Poltak Sandro Rumahorbo.
Conflicts of Interest
Authors: N.Y., H.I., and J.S. are employed by the DX Promotion Section, Engineering Planning Center, Tsukishima JFE Aqua Solution Co.; the remaining authors declare that the research was conducted in the absence of any commercial or financial relationships that could be construed as a potential conflict of interest.
References
- Górka, J.; Cimochowicz-Rybicka, M.; Kryłów, M. Use of a water treatment in a sewage sludge dewatering Process. E3S Web Conf. 2018, 30, 02006. [Google Scholar] [CrossRef]
- Lv, H.; Xiong, Q.; Liu, D.; Wu, X. Coupling electro-dewatering and low-temperature air-drying for efficient dewatering of sludge. Sci. Rep. 2021, 11, 19167. [Google Scholar] [CrossRef]
- Sørensen, P.B.; Moldrup, P.; Hansen, J.A. Filtration and expression of compressible cakes. Chem. Eng. Sci. 1996, 51, 967–979. [Google Scholar] [CrossRef]
- Vorobiev, E. Dewatering of non-uniformly structured wet compacts under additional compressive pressure: Predictive model. Powder Technol. 2022, 404, 117469. [Google Scholar] [CrossRef]
- Silva, M. Pressure filter feeding methods: Case study. In Proceedings of the 23rd International Conference on Paste, Thickened and Filtered Tailings, Virtual, 2–6 November 2020. [Google Scholar] [CrossRef]
- Kurita, Y.; Suwa, S.; Murata, S. Filter presses: A review of developments in automatic filter presses. Filtr. Sep. 2010, 47, 32–35. [Google Scholar] [CrossRef]
- Kholisa, B.; Fester, V.G.; Haldenwang, R. Prediction of filtrate suspended solids and solids capture based on operating parameters for belt filter press. Chem. Eng. Res. Des. 2018, 134, 268–276. [Google Scholar] [CrossRef]
- Stefan, C.; Cantre, S. Estimating the Dewatering Time in Geosynthetic Tube Dewatering Projects. In Proceedings of the 8th International Conference on Geosynthetics, Yokohama, Japan, 18–22 September 2006; pp. 503–506. [Google Scholar]
- Gul, S.; Oort, E.V. A machine learning approach to filtrate loss determination and test automation for drilling and completion fluids. J. Petrol. Sci. Eng. 2020, 186, 106727. [Google Scholar] [CrossRef]
- Vorobiev, E. Predictive model of constant rate expression for dewatering of semi-solid materials. Chem. Eng. Sci. 2023, 272, 118588. [Google Scholar] [CrossRef]
- Wakeman, R.J.; Tarleton, E.S. A Framework methodology for the simulation and sizing of diaphragm filter presses. Minerals 1994, 7, 1411–1425. [Google Scholar] [CrossRef]
- Liu, H.; You, K. Optimization of Dewatering Process of Concentrate Pressure Filtering by Support Vector Regression. Sci. Rep. 2022, 12, 7135. [Google Scholar] [CrossRef]
- Cui, Y.; Lv, Z.; Wang, W.; Zhang, K.; Li, W.; Zhao, X.; Xu, Z. A real-time analysis system for filtrate state in plate-and-frame filter press process based on the machine vision. Measurement 2022, 202, 111884. [Google Scholar] [CrossRef]
- Raheem, A.M.; Vipulanandan, C. Testing and modeling of filter cake formation using new seepage-consolidation concept. Eng. Sci. Technol. Int. J. 2019, 22, 979–989. [Google Scholar] [CrossRef]
- Huttunen, M.; Nygren, L.; Kinnarinen, T.; Ekberg, B.; Lindh, T.; Karvonen, V.; Ahola, J.; Häkkinen, A. Real-time monitoring of the moisture content of filter cakes in vacuum filters by a novel soft sensor. Sep. Purif. Technol. 2019, 223, 282–291. [Google Scholar] [CrossRef]
- Kazemi, M.; Moradkhani, D.; Alipour, A.A. Application of random forest and support vector machine for investigation of pressure filtration performance, a zinc plant filter cake modeling. Int. J. Mineral. Process. Extr. Metall. 2023, 8, 15–23. [Google Scholar]
- Nie, L.; Ma, W.; Xie, X. Prediction and analysis of dominant factors influencing moisture content during vacuum screening based on machine learning. Sci. Rep. 2024, 14, 18272. [Google Scholar] [CrossRef]
- Saputri, R.Y.; Nisa, Q.A.K.; Yulianto, M.E.; Paramita, V. Effect of pressure differences on sludge filtration process efficiency by using plate filter press. J. Vocat. Stud. Appl. Res. 2019, 1, 22–26. [Google Scholar] [CrossRef]
- Rao, B.; Wang, G.; Xu, P. Recent advances in sludge dewatering and drying technology. Dry. Technol. 2022, 40, 3049–3063. [Google Scholar] [CrossRef]
- Hou, J.; Hong, C.; Ling, W.; Hu, J.; Feng, W.; Xing, Y.; Wang, Y.; Zhao, C.; Feng, L. Research progress in improving sludge dewaterability: Sludge characteristics, chemical conditioning, and influencing factors. J. Environ. Manag. 2024, 351, 119863. [Google Scholar] [CrossRef] [PubMed]
- Hyrycz, M.; Ochowiak, M.; Krupińska, A.; Włodarczak, S. Influence of Effluent Quality from Sludge Dewatering on Electricity Consumption. Pol. J. Chem. Technol. 2023, 25, 50–55. [Google Scholar] [CrossRef]
- Qi, Y.; Chen, J.; Xu, H.; Wu, S.; Yang, Z.; Zhou, A.; Hao, Y. Optimizing sludge dewatering efficiency with ultrasonic Treatment: Insights into Parameters, Effects, and microstructural changes. Ultrason. Sonochem. 2023, 102, 106736. [Google Scholar] [CrossRef]
- Madala, P. The Role of Sludge Dewatering Technologies in Modern Wastewater Management. J. Mech. Civ. Ind. Eng. 2025, 6, 11–17. [Google Scholar] [CrossRef]
- Sun, L.; Hassanpouryouzband, A.; Sun, H.; Wang, T.; Zhang, L.; Yang, L.; Zhao, J. Advancement in Sewage Sludge Dewatering with Hydrate Crystal Phase Change: Unveiling the Micro-Moisture Migration and Dewaterability Mechanisms. ACS Publ. 2023, 11, 12075–12083. [Google Scholar] [CrossRef]
- Tan, Y.Y.; Huong, Y.Z.; Tang, F.E.; Saptoro, A. A review of sewage sludge dewatering and stabilization in reed bed system: Towards the process-based modelling. Int. J. Environ. Sci. Technol. 2024, 21, 997–1020. [Google Scholar] [CrossRef]
- Yılmaz, G. Sludge Dewatering by Chamber Filter Presses. In Handbook of Water and Used Water Purification; Springer: Berlin/Heidelberg, Germany, 2024; pp. 839–846. [Google Scholar] [CrossRef]
- Yuan, H.; Zhu, N. Progress of improving waste activated sludge dewaterability: Influence factors, conditioning technologies and implications and perspectives. Sci. Total Environ. 2024, 912, 168602. [Google Scholar] [CrossRef]
- Zhang, H.; Liu, W.-H.; Gao, Y.-Y.; Zeng, Y.-P.; Ma, L.-L.; Wu, J.-N.; Zhou, S.-G.; Cui, X.-Q.; Zheng, R.-J.; Wang, H.-F. A novel approach for sludge deep-dewatering via flowing-out enhancement but not relying on cell lysis and bound water release. Water Res. 2024, 257, 121743. [Google Scholar] [CrossRef]
- Zhang, X.; Ye, P.; Wu, Y. Enhanced technology for sewage sludge advanced dewatering from an engineering practice perspective: A review. J. Environ. Manag. 2022, 321, 115938. [Google Scholar] [CrossRef]
- Rumahorbo, P.S.; Baar, S.; Kondo, S.; Yazawa, N.; Ito, H.; Sugimoto, J.; Okada, Y.; Sato, K.; Watanabe, S. Filtrate Estimation from Filter Press in a Water Treatment Facility based on Image Analysis. In Proceedings of the Joint 13th International Conference on Soft Computing and Intelligent Systems and 25th International Symposium on Advanced Intelligent Systems (SCIS&ISIS), Himeji, Japan, 9–12 November 2024. [Google Scholar] [CrossRef]
- Ismail, H.; Marhaban, M.H. A simple approach to determine the best threshold value for automatic image thresholding. In Proceedings of the IEEE International Conference on Signal and Image Processing Applications, Kuala Lumpur, Malaysia, 18–19 November 2009. [Google Scholar] [CrossRef]
- Sreevani, G. Applications of exponential functions. Int. J. Adv. Eng. Manag. 2021, 3, 553–558. [Google Scholar]
- Shintani, M.; Umeno, K. Time-rescaling regression method for exponential decay time series predictions. JSIAM Lett. 2022, 14, 45–48. [Google Scholar] [CrossRef]
- Awadalla, M.; Yameni, Y.Y. Modeling exponential growth and exponential decay real phenomena by ψ-caputo fractional derivative. J. Adv. Math. Comput. Sci. 2018, 28, 1–13. [Google Scholar] [CrossRef]
- Langtangen, H.P. Algorithms and Implementations. In Finite Difference Computing with Exponential Decay Models; Springer International Publishing: Cham, Switzerland, 2016; pp. 1–38. [Google Scholar] [CrossRef]
- Fraile, R.; García-Ortega, E. Fitting an Exponential Distribution. J. Appl. Meteorol. 2005, 44, 1620–1625. [Google Scholar] [CrossRef]
- Palmer, P.B.; O’Connell, D.G. Regression analysis for prediction: Understanding the process. Cardiopulm. Phys. Ther. J. 2009, 20, 23–26. [Google Scholar] [CrossRef] [PubMed]
- Grzelak, M.; Borucka, A.; Guzanek, P. Application of linear regression for evaluation of production processes effectiveness. In Innovations in Industrial Engineering; Machado, J., Soares, F., Trojanowska, J., Ivanov, V., Eds.; Springer International Publishing: Cham, Switzerland, 2022; pp. 36–47. [Google Scholar] [CrossRef]
- Ostertagová, E. Modelling using polynomial regression. Procedia Eng. 2012, 48, 500–506. [Google Scholar] [CrossRef]
- Zahedi, Z.; Kamil, A.A.; Irvan, I.; Jelita; Amin, H.; Marwan, A.; Surpani, S. Some applications of cubic equations in engineering. Math. Modell. Eng. Probl. 2022, 9, 129–135. [Google Scholar] [CrossRef]
Figure 1.
Flowsheet of filter press in sludge dewatering.
Figure 1.
Flowsheet of filter press in sludge dewatering.
Figure 2.
Filtrate image captured by a visible-light camera during measuring process. Sample data: 8 February 2023.
Figure 2.
Filtrate image captured by a visible-light camera during measuring process. Sample data: 8 February 2023.
Figure 3.
Stages of dewatering process in filter press: (1) tightening process, (2) filtration process, (3) compression process, (4) blowing process, (5) discharging process, (6) washing process.
Figure 3.
Stages of dewatering process in filter press: (1) tightening process, (2) filtration process, (3) compression process, (4) blowing process, (5) discharging process, (6) washing process.
Figure 4.
The trend of water pressure and slurry pressure during measuring time before stopping compression.
Figure 4.
The trend of water pressure and slurry pressure during measuring time before stopping compression.
Figure 5.
Trend of dewatering parameters in one sample day (22 September 2022): calculated cake moisture (left), differential pressure (middle), and volume flow rate (right).
Figure 5.
Trend of dewatering parameters in one sample day (22 September 2022): calculated cake moisture (left), differential pressure (middle), and volume flow rate (right).
Figure 6.
Flowchart of comparison between image analysis and differential pressure for volume flow rate and cake moisture estimation.
Figure 6.
Flowchart of comparison between image analysis and differential pressure for volume flow rate and cake moisture estimation.
Figure 7.
Flowchart of controlling the compression time from estimated cake moisture condition with two approaches using mathematical models: exponential decay, linear regression, and cubic polynomial regression.
Figure 7.
Flowchart of controlling the compression time from estimated cake moisture condition with two approaches using mathematical models: exponential decay, linear regression, and cubic polynomial regression.
Figure 8.
The difference between grayscale image with filtrate and its background (above) and the cropping size of the analysis area (below).
Figure 8.
The difference between grayscale image with filtrate and its background (above) and the cropping size of the analysis area (below).
Figure 9.
Original image of filtrate (above) and a binary image of detected filtrate (below).
Figure 9.
Original image of filtrate (above) and a binary image of detected filtrate (below).
Figure 10.
The estimated volume flow rate based on the following: pixel number (a) and differential pressure (b).
Figure 10.
The estimated volume flow rate based on the following: pixel number (a) and differential pressure (b).
Figure 11.
The estimated cake moisture based on the following: image analysis (a) and differential pressure (b).
Figure 11.
The estimated cake moisture based on the following: image analysis (a) and differential pressure (b).
Figure 12.
Error comparison between image analysis and differential pressure.
Figure 12.
Error comparison between image analysis and differential pressure.
Figure 13.
Volume flow rate estimation using exponential decay (left) and relationship between estimated volume flow rate and time (right) using two sample data: (a,b) 22 September 2022 and (c,d) 8 February 2023. ID number in plot data in the left figure is the same as that in the right figure.
Figure 13.
Volume flow rate estimation using exponential decay (left) and relationship between estimated volume flow rate and time (right) using two sample data: (a,b) 22 September 2022 and (c,d) 8 February 2023. ID number in plot data in the left figure is the same as that in the right figure.
Figure 14.
Monthly average of decay factor (b) over one year: April 2022–February 2023.
Figure 14.
Monthly average of decay factor (b) over one year: April 2022–February 2023.
Figure 15.
Cake moisture estimation using differential pressure (approach 1): (a,c) Cubic polynomial regression for cake moisture estimation. (b,d) Relationship between cake moisture and residual/error. ID number in plot data in the left figure is the same as that in the right figure.
Figure 15.
Cake moisture estimation using differential pressure (approach 1): (a,c) Cubic polynomial regression for cake moisture estimation. (b,d) Relationship between cake moisture and residual/error. ID number in plot data in the left figure is the same as that in the right figure.
Figure 16.
Cake moisture estimation using estimated volume flow rate (approach 2): (a,c) Linear regression for cake moisture estimation. (c,d) Relationship between cake moisture and residual/error (right). ID number in plot data in the left figure is the same as that in the right figure.
Figure 16.
Cake moisture estimation using estimated volume flow rate (approach 2): (a,c) Linear regression for cake moisture estimation. (c,d) Relationship between cake moisture and residual/error (right). ID number in plot data in the left figure is the same as that in the right figure.
Figure 17.
Controlling the compression time based on estimated cake moisture using two approaches.
Figure 17.
Controlling the compression time based on estimated cake moisture using two approaches.
Figure 18.
Comparison residual of cake moisture estimation between two approaches using monthly average error.
Figure 18.
Comparison residual of cake moisture estimation between two approaches using monthly average error.
Table 1.
Specifications of pressure sensors.
Table 1.
Specifications of pressure sensors.
| Description | Slurry Feed Pressure | Pressurized Water Pressure |
|---|
| Type | KEYENCE GP-M025 | KEYENCE GP-M025 |
| Pressure Range | −0.1 to 2.5 MPa | −0.1 to 2.5 MPa |
| Output | 4 to 20 Ma D.C. | 4 to 20 Ma D.C. |
Table 2.
Camera and lighting specifications.
Table 2.
Camera and lighting specifications.
| Camera | Lightning |
|---|
| Model: Canon VB-M44 (Tokyo, Japan) | Model: NYT1031NLE9 |
| Resolution: 1280 × 720 | Color Temperature: 5000 K |
| Frame Rate: 15 fps | Luminous Flux: 3445 lm |
Table 3.
Descriptive statistics for dewatering parameters.
Table 3.
Descriptive statistics for dewatering parameters.
| Descriptive Statistics | Dewatering Parameters |
|---|
| Cake Moisture (%) | Differential Pressure (MPa) | Volume Flow Rate (L/min) |
|---|
| Mean | 62.62 | 0.44 | 10.19 |
| Standard Deviation | 1.81 | 0.06 | 14.32 |
| Range | 61.1–66.77 | 0.35–0.42 | 1.52–46.6 |
Table 4.
Python packages for image processing and regression model analysis.
Table 4.
Python packages for image processing and regression model analysis.
| Techniques | Packages |
|---|
| Image Processing | OpenCV, matplotlib, mediapy |
| Regression Model | Sckit = learn, SciPy, statistics |
Table 5.
R-squared for estimation results using exponential decay function.
Table 5.
R-squared for estimation results using exponential decay function.
| Date | Decay Factor | Coefficient of Determination (R-Squared) |
|---|
| c = 0 | c ≠ 0 | c = 0 | c ≠ 0 |
|---|
| 22 September 2022 | 0.583 | 0.655 | 0.9865 | 0.9902 |
| 8 February 2023 | 0.326 | 0.341 | 0.9918 | 0.9927 |
Table 6.
Comparison of errors and statistical tests.
Table 6.
Comparison of errors and statistical tests.
| Errors | Image Processing | Pressure Sensors |
|---|
| Approach 1 | Approach 2 |
|---|
| MAE | 0.603 | 0.042 | 0.095 |
| MSE | 0.629 | 0.026 | 0.012 |
| RMSE | 0.793 | 0.051 | 0.113 |
| R2 | 0.988 | 0.999 | 0.988 |
| 95% CI | 0.033–0.145 | 0.003–0.004 | 0.015–0.338 |
| p-value | <0.001 | <0.001 | <0.001 |
| Disclaimer/Publisher’s Note: The statements, opinions and data contained in all publications are solely those of the individual author(s) and contributor(s) and not of MDPI and/or the editor(s). MDPI and/or the editor(s) disclaim responsibility for any injury to people or property resulting from any ideas, methods, instructions or products referred to in the content. |
© 2025 by the authors. Licensee MDPI, Basel, Switzerland. This article is an open access article distributed under the terms and conditions of the Creative Commons Attribution (CC BY) license (https://creativecommons.org/licenses/by/4.0/).


 ,
, 


