Abstract
Ultra-deep tight sandy conglomerate reservoirs in the Junggar Basin are characterized by vertically alternating lithologies that include mudstone, sandy conglomerate, and sandstone. High in situ stresses and formation temperatures contribute to a brittle–ductile transition process in the reservoir rocks. However, the brittle behavior and ductile hydraulic fracture propagation mechanisms under in situ conditions remain inadequately understood. In this study, ultra-deep core samples were subjected to triaxial compression tests under varying confining pressures and temperatures to simulate different burial depths and evaluate their brittleness. A three-dimensional hydraulic fracture propagation model was developed in ABAQUS 2023 finite element software, incorporating a cohesive zone ductile constitutive model. Numerical simulations were conducted, considering interlayer horizontal stress differences, injection rate, and fracturing fluid viscosity, to systematically analyze the influence of geological and engineering factors on ductile fracture propagation. A fracture length–height competition diagram was constructed to illustrate the propagation mechanisms. The results reveal that high temperatures significantly accelerate the brittle–ductile transition, which occurs at confining pressures between 55 and 65 MPa. Following this transition, failure modes shift from single-shear failure to a multi-localized fracture with bulging deformation. Interlayer horizontal stress differences were found to strongly influence fracture penetration, with larger stress differences hindering vertical growth. Increasing injection rates promoted the uniform distribution of lateral fractures and fracture tip development, while medium- to high-viscosity fracturing fluids enhanced fracture width and vertical stimulation uniformity. These findings provide important insights for optimizing fracturing strategies and expanding the effective stimulation volume in the ultra-deep tight sandy conglomerate reservoirs of the Junggar Basin.
1. Introduction
In the western uplift region of the Junggar Basin, ultra-deep tight sandy conglomerate reservoirs are widely distributed and host abundant oil and gas resources. Hydraulic fracturing is the primary stimulation technique employed for enhancing productivity in these formations [1,2]. Recent exploration results have revealed that these reservoirs consist of vertically alternating layers of sandstone, sandy conglomerate, and mudstone, with pay zones exhibiting both dispersed and continuous distribution patterns. Significant heterogeneities exist among these layers in terms of their physical properties (e.g., porosity and permeability), mechanical properties (e.g., tensile strength and Young’s modulus), and interlayer horizontal stress [3,4]. This strong vertical heterogeneity severely limits the vertical propagation of fractures and makes the uniform lateral development of fractures more difficult [4,5,6]. Additionally, high in situ stresses and high formation temperatures can induce brittle–ductile transition in reservoir rocks, where increased ductility markedly alters hydraulic fracture propagation behavior [6].
The brittleness of rocks plays a critical role in reservoir stimulation because highly brittle rocks are more favorable for fracturing purposes and the development of a larger effective stimulated reservoir volume [7]. Extensive research has been conducted on the brittle–ductile transformation of rocks, revealing that temperature and pressure have significant effects on rock brittleness [8,9,10]. Following a brittle–ductile transition, the capacity of the rock to sustain macroscopic failure after fracturing undergoes notable changes [7,11]. Ding et al. [12] carried out triaxial compression tests on sandstone and observed that increasing the confining pressure leads to a gradual transition from brittle failure to plastic flow, accompanied by an increase in peak strain. González-Gómez et al. [13] conducted uniaxial compression experiments on heat-treated limestone and found that high-temperature treatment enhanced rock ductility while significantly reducing both strength and elastic modulus. Rybacki et al. [7] performed triaxial compression tests on shale under different temperature conditions and reported that increases in temperature and pressure induce a transition from brittle to semi-brittle behavior, characterized by brittle failure at the micro-scale and ductile deformation at the macro-scale. Xie et al. [14] conducted triaxial compression experiments under in situ stress conditions for rocks at different burial depths, revealing that variations in mineral composition affect brittleness, which tends to increase with depth. Although considerable efforts have been made to investigate the brittle–ductile transformation of deep rocks, few studies have employed ultra-deep core samples while simultaneously considering the coupled effects of temperature and pressure to evaluate the brittle–ductile characteristics of sandy conglomerates. The brittle–ductile behavior of rocks under the in situ geomechanical conditions of the ultra-deep formations in the Junggar Basin remains poorly understood, leading to a lack of theoretical basis for guiding field development [12,15].
In recent years, numerical simulation methods have been widely employed to investigate hydraulic fracture propagation in sandy conglomerate composite reservoirs. Among these, the cohesive zone method based on damage mechanics has become a widely adopted approach for modeling hydraulic fracture propagation [16,17,18,19,20]. For example, Lv et al. [16] developed a two-dimensional hydraulic fracturing model to explore fracture propagation patterns in composite reservoirs and found that high injection rates, combined with low-viscosity fracturing fluids, promote cross-layer fracture propagation. Hou et al. [4] further established a three-dimensional model to analyze fracture growth across lithological interfaces under varying interface strengths and interlayer stress conditions, providing a quantitative assessment of the coupled effects of lithology and geomechanical factors on fracture penetration. However, these studies generally modeled reservoir rock as a purely elastic material, overlooking the significant influence of brittle–ductile behavior on fracture propagation in ultra-deep formations. Therefore, it is imperative to develop a ductile fracture propagation model that more accurately reflects the mechanical and geological features of sandy conglomerate reservoirs in the western Junggar Basin. Such a model would provide important insights into the competitive propagation mechanisms between fracture length and height under different geological and engineering conditions.
To deepen our understanding of brittle–ductile transition characteristics in ultra-deep formations, develop a hydraulic fracturing model suited to regional geological conditions, and elucidate the competitive propagation mechanisms between fracture length and height, this study investigates core samples retrieved from depths greater than 5000 m in the western Junggar Basin. A series of triaxial compression tests were conducted under varying confining pressures and temperatures to simulate different burial environments. Through an analysis of failure modes and stress–strain responses, the brittle–ductile behavior of the ultra-deep tight sandy conglomerate was systematically characterized. Based on the experimental data, a cohesive ductile constitutive model was developed to reflect the geological conditions of the study area. Numerical simulations incorporating both geological and engineering parameters were subsequently carried out, resulting in a diagram that reveals the competitive relationship between fracture length and height. The findings provide valuable guidance for optimizing fracturing design and expanding the effective stimulation range of ultra-deep sandy conglomerate reservoirs in the western Junggar Basin.
2. Geological Characteristics of Tight Sandy Conglomerate Reservoirs
In the tight sandy conglomerate composite reservoirs of the Junggar Basin, mudstone, sandy conglomerate, and sandstone are commonly interbedded. Influenced by in situ stresses and formation temperatures, these rocks exhibit certain brittle–ductile transitions. Taking the Jiangbasi Formation in the Shibei Depression as an example, core observations and logging interpretations (Figure 1) indicate strong vertical heterogeneity within the reservoir. The interbedded distribution of mudstone, sandy conglomerate, and sandstone is irregular, with formation thicknesses ranging from approximately 5 to 20 m. The interlayer horizontal stress difference is typically 2–5 MPa, and the longitudinal architecture consists of connected thin layers (5–10 m) and isolated thick layers (10–20 m).
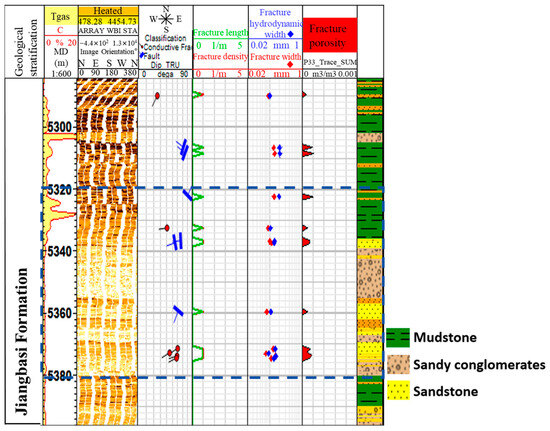
Figure 1.
Imaging logging map of dense gravel reservoirs.
For thin single-layer pay zones, the multi-layer fracturing results indicate that vertical heterogeneity, particularly interlayer horizontal stress differences and lithological differences, significantly constrains fracture height growth, thereby limiting cross-layer fracture propagation. In thick single-layer pay zones, when the fluid-driving capacity at the hydraulic fracture tip is insufficient, lateral fracture propagation becomes uneven. Under such conditions, fracturing fluids tend to migrate preferentially along lithological interfaces rather than uniformly penetrating the reservoir, further reducing stimulation efficiency.
3. Triaxial Mechanical Experiments on Ultra-Deep Core Samples
3.1. Materials and Experimental Methodology
The core samples used in this study were obtained from the 5000–5500 m interval of Well X5, located in the western uplift of the Junggar Basin. The cores were processed into standard cylindrical samples measuring 50 mm in height and 25 mm in diameter. To investigate the effects of pressure and temperature on the brittle–ductile mechanical behavior of rocks under ultra-deep reservoir conditions, triaxial compression tests were conducted. The test conditions were designed to simulate reservoir environments at burial depths of 5500 m and 6500 m, with the corresponding experimental parameters summarized in Table 1. Specifically, the sandy conglomerate contains a low gravel content and small particle sizes, exhibiting characteristics similar to sandstone. However, notable differences remain in its physical properties (e.g., porosity and permeability) and mechanical properties (e.g., tensile strength and Young’s modulus) compared to typical sandstone.

Table 1.
Experimental parameters of samples at different temperatures and circumferential pressures.
The main experimental procedures were as follows. (1) Prior to testing, each sample was wrapped with a heat-shrinkable film, mounted onto the base of the pressure chamber, and equipped with both axial and circumferential extensometers. The alignment of the loading piston, upper platen, sample, and lower platen was carefully checked to ensure that they were colinear. (2) During the test, the triaxial pressure chamber was sealed, and an initial axial load of 2 MPa was applied to secure the sample. Confining pressure oil was then injected, and the confining pressure was applied. (3) The temperature was raised to the predetermined value using the heating system. (4) Axial loading was applied under strain control at a constant rate of 0.05 mm/min until sample failure. (5) Upon completion of the test, the data were recorded, and the system was shut down.
3.2. Experimental Results
The failure modes of the core samples under different simulated depth conditions are illustrated in Figure 2. Regions outlined or marked in blue indicate the development of shear fractures, while those outlined or marked in red correspond to the formation of tensile fractures.
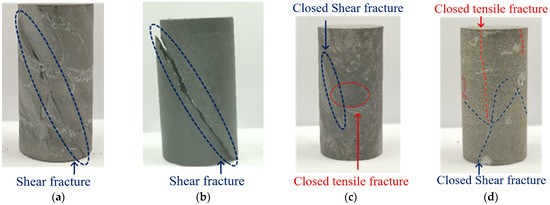
Figure 2.
Failure modes of core samples from triaxial compression tests. (a) Sample 1. (b) Sample 2. (c) Sample 3. (d) Sample 4.
3.2.1. The Influence of Confining Pressure on the Failure Modes of Ultra-Deep Core Samples
Figure 2a,b shows the failure patterns of core samples under different simulated depth conditions, considering only variations in the stress environment. Under confining pressures of 55 MPa and 65 MPa, the samples predominantly exhibited single shear failure. Apart from the main shear fractures, no significant macroscopic cracks were observed around the samples. After reaching peak stress, the load-bearing capacity of the samples dropped sharply. The applied confining pressure did not prevent the generation of internal micro-fractures, their coalescence into macroscopic fractures, or the eventual formation of a well-defined shear surface. The consistent occurrence of single shear failure under relatively high-stress conditions indicates that the ultra-deep core samples from the study area exhibit high brittleness. As the confining pressure increased, the angle between the fracture surface and the loading axis increased from 23.9° to 27.3°, while the angle of the fracture face decreased from 66.1° to 62.7°. These changes suggest a reduction in overall rock brittleness and an enhancement of ductile behavior [21,22].
3.2.2. The Influence of Confining Pressure and Temperature on the Failure Modes of Ultra-Deep Core Samples
Figure 2c,d shows the failure modes of the core samples under different simulated depths, considering both stress and temperature conditions. At a confining pressure of 55 MPa and a temperature of 130 °C, the sample developed a main shear fracture, accompanied by a tensile fracture in the middle region. The failure mode transitioned from a single localized fracture, indicative of strong brittleness, to a multi-local failure with secondary fractures, suggesting that the high temperature increased the ductility of the rock. Constrained by the confining pressure, the sample was unable to fail rapidly along the main fracture surface. As a result, dislocation slip occurred in some grains, leading to the formation of secondary fractures. At this stage, the angle between the fracture surface and the loading axis was 19.3°, which is smaller than that observed in Figure 2a. This result suggests that when using fracture angle as a brittleness indicator, it is essential to ensure that the sample undergoes single-shear failure. In ultra-deep formations, high temperatures intensify the brittle–ductile transition, and this effect must be evaluated prior to field application. Under combined conditions of 65 MPa confining pressure and 150 °C temperature, no continuous shear fracture was observed on the sample surface after failure. Instead, the failure mode shifted to bulging deformation, accompanied by multiple localized fractures. Compared with Figure 2b, the high temperature significantly intensified the brittle–ductile transition, with the macroscopic failure behavior evolving from localized shear failure to ductile bulging deformation. At this point, the high confining pressure inhibited complete structural instability. Following peak stress, the dominant failure mechanism involved plastic deformation and the dislocation slip of mineral grains. Numerous tensile and shear fractures appeared on the sample surface, yet none penetrated the entire sample.
3.2.3. The Influence of Confining Pressure and Temperature on the Stress–Strain Curves of Ultra-Deep Core Samples
The stress–strain curves of the core samples under different simulated depth conditions are presented in Figure 3. Under ambient temperature conditions at confining pressures of 55 MPa and 65 MPa, the samples predominantly exhibited brittle failure. The axial stress–strain curves displayed a linear trend prior to reaching peak stress, followed by a rapid stress drop after failure. Under high-temperature conditions, when the confining pressure was 55 MPa, the stress–strain curve and failure mode still indicated primarily brittle behavior, although a distinct pre-peak yield stage was observed. Compared to the curve under ambient temperature conditions, the initial portion of the stress–strain response remained nearly identical, but deviations appeared near the peak due to the onset of ductile deformation. At 65 MPa confining pressure and high temperature, both the stress–strain curve and failure mode indicated that the sample underwent a brittle–ductile transition, characterized by a pronounced pre-peak yield stage. After reaching peak stress, the stress decreased at a significantly slower rate, and the energy required for failure markedly increased. Compared to the response observed at 65 MPa under ambient temperature conditions, the combined effects of high temperature and confining pressure led to substantial changes in mechanical behavior, highlighting the influence of the brittle–ductile transition. These results confirm that for rocks in this region, depths between 5500 m and 6500 m, corresponding to confining pressures of 55–65 MPa and gradually increasing reservoir temperatures, represent the critical range for the brittle–ductile transition.
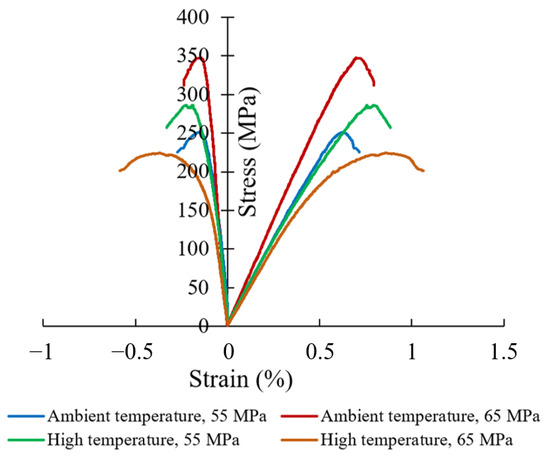
Figure 3.
Stress–strain curves of the core samples in triaxial compression tests.
4. Physical Model of Hydraulic Fracturing Process
The hydraulic fracturing process is a complex fluid–solid coupled process involving rock deformation, fracture initiation and propagation, and fluid flow within the fractures. In this study, a three-dimensional hydraulic fracturing model was developed using the cohesive zone method (CZM). The damage factor parameters were calibrated based on the stress–strain curves obtained from triaxial tests on core samples, resulting in a cohesive zone ductile constitutive model that effectively captures the mechanical behavior of sandy conglomerate under regional geological conditions.
4.1. Coupled Flow-Solid Equations
The equilibrium equation for the rock matrix is expressed as follows [23,24,25]:
where is the effective stress matrix, Pa; pw is the pore pressure, Pa; I is the unit matrix; is the imaginary strain rate matrix, in s−1; is the imaginary velocity matrix, in m/s; is the surface force matrix, in N/m2; and is the body force matrix, in N/m3.
The continuity equation governing the fluid medium is expressed as follows [4,26]:
where J is the volume change rate of the porous medium; ρw is the fluid density, in kg/m3; nw is the ratio of the fluid volume to the total volume; X is the spatial vector, in m; and vw is the seepage velocity of the fluid, in m/s.
The fluid seepage rate through the rock matrix conforms to Darcy’s law [4,26]:
where g is the acceleration of gravity, in m/s2 and k is the permeability matrix of the rock, in m/s.
4.2. Hydraulic Fracture Initiation and Propagation Criteria
In this study, the CZM was employed to simulate the initiation and propagation behavior of hydraulic fractures. The deformation process of the reservoir was divided into two stages: linear elastic behavior prior to fracture initiation and damage evolution following fracture initiation [27,28]. The maximum principal stress criterion was adopted to determine whether a CZM element experienced initial damage. Specifically, when the ratio of the stress in any of the three defined directions to its corresponding critical value exceeds 1, a hydraulic fracture is considered to be initiated [24]:
where σn is the normal stress of the cohesive unit, in MPa; is the critical normal stress at the time of cohesive unit failure, in MPa; and represent the first tangential and second tangential stresses of the cohesive unit, in MPa; and represent the critical tangential stresses at the time of cohesive unit failure in the first tangential and second tangential directions, in MPa; < > represents the cohesive unit without damage.
After hydraulic fracture initiation, the stiffness attenuation of the cohesive element was used to characterize its propagation process. The stress expression is as follows [24]:
where tn, ts, and tt represent the actual normal stress and the first and second tangential stresses applied to the cohesive unit, respectively, in Pa; , , and represent the normal stress and the first and second tangential stresses predicted by the T-S criterion when no damage is produced, respectively, in Pa; D is the damage factor.
The cohesive zone is the area in front of the fracture tip, where micro-fractures are generated and gradually connect to form a macroscopic fracture. The cohesive element uses the bilinear traction-separation (T-S) criterion to determine fracture propagation. Based on the energy balance relationship, the critical displacement of the fracture can be calculated using the following formula [27,28]:
where is the displacement of the cohesive unit at complete destruction, in m; KIC is the fracture toughness of the rock, in Pa·m1/2; υ is the Poisson’s ratio; E is the Young’s modulus, in Pa; σt is the tensile strength of the rock, in Pa.
After that, the constitutive curve exhibited linear softening behavior, as shown in Figure 4, and D increased linearly from 0 to 1. When the separation displacement reached its critical value, the interface produced irreversible complete damage, and the interface was detached. The expression of damage factor is as follows [24]:
where is the maximum displacement of the cohesive unit during the loading process, m; is the displacement of the cohesive unit at the initial damage; when the damage is not generated, D is 0, when the cohesive unit is completely destroyed, D is 1.
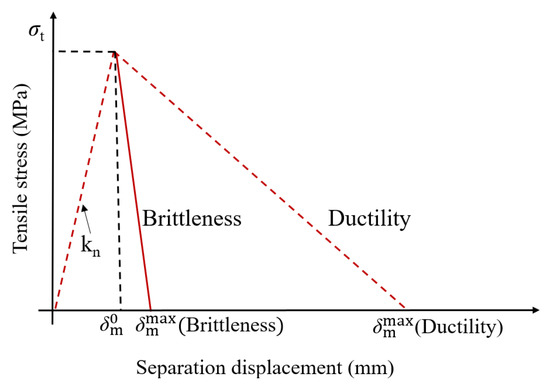
Figure 4.
The fracture process and the traction-separation law.
Previous studies have shown that brittle rocks undergo rigid softening after damage, then the stress decreases rapidly. After the brittle–ductile transition, the rock transforms under elastic softening, the rate of stress reduction slows down, and the critical displacement increases [27,28,29].
4.3. Fluid Flow
During hydraulic fracture propagation, the fracturing fluid enters the fracture, generating a tangential flow that drives the fluid forward along the fracture, as well as a normal flow that leaks off into the surrounding rock matrix.
The tangential flow is governed by the following equation [30,31]:
where q is the flow rate along the fracture propagation direction, in m3/s; w is the hydraulic fracture width, in m; μ is the fracturing fluid viscosity, in mPa·s; and is the fluid pressure gradient, in MPa/m.
The normal (leak-off) flow into the rock matrix is governed by the following equation [32]:
where qt and qb are the flow rate of filtration loss on the upper and lower surfaces of the cohesive element, respectively, in m3/s; ct and cb are the filtration loss coefficients on the upper and lower surfaces of the cohesive element; pi, pt, and pb are the pore pressures at the intermediate node, the upper surface node, and the lower surface node of the cohesive element, respectively, in Pa.
5. Establishment and Validation of Hydraulic Fracturing Models for Tight Sandy Conglomerate Reservoirs
5.1. Calibration of Cohesive Zone Ductile Constitutive Models
A triaxial compression model was developed in ABAQUS 2023 finite element software, based on the mechanical test results of Sample 4, to conduct numerical simulations and calibrate the cohesive zone ductile constitutive model. The Young’s modulus was set to 39 GPa, Poisson’s ratio to 0.22, and the loading rate to 0.05 mm/min. The critical displacement parameter was adjusted based on the experimental results to ensure that the model transitioned from brittle damage to ductile damage, consistent with the mechanical behavior observed in core samples from the sandy conglomerate reservoirs of the Junggar Basin. The simulated failure mode and the corresponding stress–strain response are presented in Figure 5.
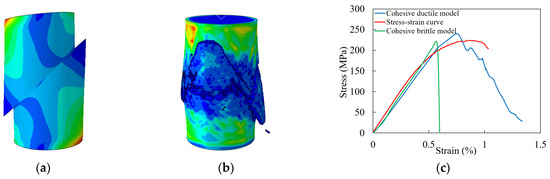
Figure 5.
Numerical simulation results of triaxial compression. (a) Failure mode of the cohesive brittle constitutive model. (b) Failure mode of the cohesive ductile constitutive model. (c) Simulated stress–strain curve.
As shown in Figure 5, increasing the critical displacement from 0.001 m to 0.002 m enhances the ductility of the sample. Under the cohesive zone ductile constitutive model, both the simulated failure mode and stress–strain curve closely resemble those observed in high-temperature experimental tests. Therefore, when simulating hydraulic fracture propagation in the tight sandy conglomerate composite reservoirs of the Junggar Basin, the cohesive zone ductile constitutive model provides improved predictive accuracy and better represents the actual mechanical behavior of the reservoir.
5.2. Establishment of Composite Reservoir Models
In this study, a three-dimensional hydraulic fracturing numerical model for tight sandy conglomerate reservoirs in the Junggar Basin was developed using ABAQUS 2023 finite element software. The model incorporates a triaxial in situ stress system represented by σh (minimum horizontal principal stress), σH (maximum horizontal principal stress), and σv (vertical stress). To systematically investigate the controlling mechanisms of geological and engineering factors, including interlayer horizontal stress difference, injection rate, and fracturing fluid viscosity, on fracture height and length propagation, a three-layer model with equal thickness (20 m per layer) and heterogeneous lithology was constructed based on the actual geological data. From top to bottom, the lithological sequence consists of a mudstone layer, a sandy conglomerate layer, and a sandstone layer. Utilizing the geometric symmetry of the reservoir, a semi-model with dimensions of 250 m × 50 m × 60 m was established, as shown in Figure 6. The formation matrix was simulated using C3D8P elements to capture both fluid seepage and mechanical deformation, while hydraulic fracture propagation along predefined paths was modeled using COH3D8P cohesive elements. The injection point was placed at the center of the middle sandy conglomerate layer. The complete model comprised 63,750 elements. Simulation parameters for each lithological layer were assigned based on core mechanical testing, as well as the petrophysical and geomechanical properties interpreted from the well logs, as detailed in Table 2 and Table 3.
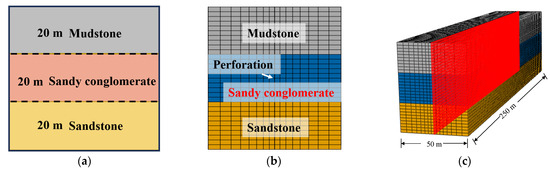
Figure 6.
Numerical model of hydraulic fracturing in a tight sandy conglomerate reservoir. (a) Schematic of the stratigraphic layering. (b) Schematic of the layered numerical model. (c) Mesh configuration of the three-dimensional model.
Table 2.
Rock matrix model parameters for the different layers.
Table 3.
Defined parameters of the cohesive element model.
5.3. Field Data Validation of Hydraulic Fracturing Models
Fracturing operations were conducted in the Baijiantan Formation of the Junggar Basin, with the targeted intervals primarily consisting of sandstone layers. Based on the mechanical testing of core samples and well-logging interpretation, a reservoir model was established with a Young’s modulus of 28 GPa, a tensile strength of 3 MPa, and a Poisson’s ratio of 0.3. According to the actual field pumping schedule, the injection parameters were set as follows: a flow rate of 12 m3/min, a fracturing fluid viscosity of 50 mPa·s, and a total fluid volume of 300 m3.
Numerical simulations were conducted using both the cohesive zone brittle constitutive model and the cohesive zone ductile constitutive model. The corresponding bottomhole pressure–time curves are shown in Figure 7. In the brittle model, the simulated breakdown pressure was 70.2 MPa, and the injection pressure required for stable fracture propagation ranged from 60 to 64 MPa. In contrast, the ductile model yielded a higher breakdown pressure of 80.2 MPa, with a stable propagation pressure range of between 60 and 80 MPa. Field data analysis indicated that the actual breakdown pressure was 78.3 MPa, and the injection pressure for stable fracture propagation ranged from 61.7 to 85.95 MPa.
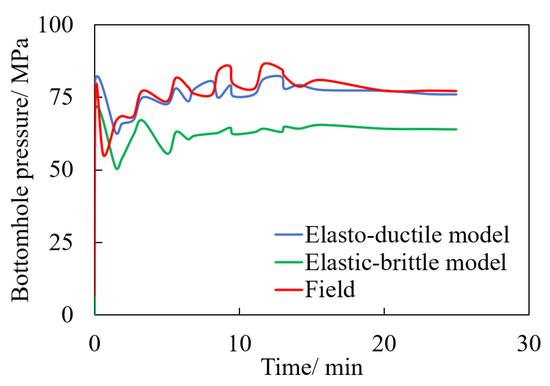
Figure 7.
Comparison between the simulated pumping pressure curve and the actual construction pressure curve.
The comparison between the simulated injection pressure curve and the actual field data indicates that the breakdown pressure and the stable propagation pressure, as simulated by the hydraulic fracturing model that was based on the cohesive zone ductile constitutive model, closely align with the measured field values. In contrast, the model based on the cohesive zone’s brittle constitutive behavior shows larger deviations. These findings suggest that the cohesive zone ductile model provides higher reliability and better applicability for simulating hydraulic fracturing in this reservoir.
6. Numerical Simulation Results
In this section, the hydraulic fracturing numerical model incorporating the cohesive zone ductile constitutive model, which was established and validated in Section 5, is employed to investigate the ductile fracture propagation behavior of ultra-deep sandy conglomerate composite reservoirs in the Junggar Basin under varying geological and engineering conditions. Based on the actual field construction conditions, the basic simulation parameters were set as follows: an interlayer horizontal stress difference of 4 MPa, an injection rate of 12 m3/min, a fracturing fluid viscosity of 10 mPa·s, and a total fluid volume of 300 m3.
6.1. Interlayer Horizontal Stress Difference
After the injection of fracturing fluid, the propagation of hydraulic fractures in both length and height was influenced by in situ stress conditions, resulting in variations in fracture geometry. In composite reservoirs, differences in the minimum horizontal principal stress between layers must be considered when evaluating their impact on fracture propagation. To investigate this effect, the interlayer horizontal stress difference was incrementally varied to 2 MPa, 4 MPa, and 6 MPa. The resulting fracture morphologies under different interlayer stress conditions were obtained after fluid injection, as shown in Figure 8.
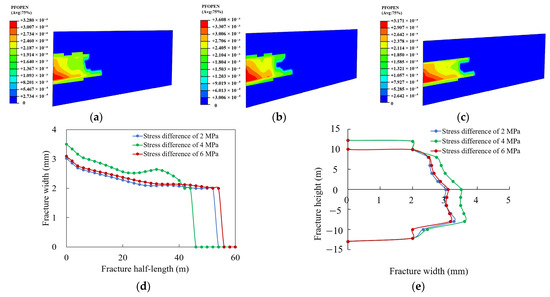
Figure 8.
Changes in fracture propagation morphology with interlayer horizontal stress difference. (a) Interlayer horizontal stress difference of 2 MPa. (b) Interlayer horizontal stress difference of 4 MPa. (c) Interlayer horizontal stress difference of 6 MPa. (d) Fracture width profile. (e) Fracture height profile.
During hydraulic fracture propagation, the sandy conglomerate layer, with its higher tensile strength, required a longer period of pressure buildup and higher net pressure within the fracture to initiate and sustain propagation. In the initial stage, fracture initiation occurred within the sandy conglomerate layer. As propagation continued, the hydraulic energy inside the fracture gradually dissipated. In the later stage, a greater volume of fracturing fluid migrated into the underlying sandstone layer, which provided more favorable conditions for fluid flow and fracture propagation. This promoted increased fracture width and enhanced lateral development. Meanwhile, fluid inflow into the sandy conglomerate layer declined, leading to the stagnation of fracture propagation in that zone and the formation of a distinct gap in the middle of the fracture.
The initiation of a hydraulic fracture requires fluid pressure to exceed both the tensile strength of the rock and the minimum horizontal principal stress. As the interlayer horizontal stress difference increases, the minimum horizontal stress in the barrier layer also increases, enhancing the barrier layer stress effect and making it more difficult for fractures to initiate and propagate across the barrier layer. As shown in Figure 8a, when the interlayer horizontal stress difference was 2 MPa, the hydraulic fracture propagated vertically, penetrating both the upper and lower layers. A larger proportion of the fracturing fluid entered the sandstone layer, which has a lower Young’s modulus and higher porosity, resulting in a wider fracture width near the sandstone interface and greater fracture length. When the interlayer horizontal stress difference increased to 4 MPa (Figure 8b), the fracture width increased while the fracture length decreased. At an interlayer horizontal stress difference of 6 MPa (Figure 8c), the enhanced barrier layer stress effect significantly inhibited upward fracture propagation, while the overall fracture length increased. As shown in Figure 8d,e, under the same total fluid volume, increasing the interlayer horizontal stress difference led to a reduction in fracture height, a significant increase in fracture length, and improved lateral fracture development within the central reservoir layer.
Therefore, in tight sandy conglomerate composite reservoirs, increasing the interlayer horizontal stress difference enhances the barrier layer stress effect, thereby restricting cross-layer fracture propagation. However, it also promotes more effective fracture development within the target layer, particularly by increasing the effective fracture length near the fracture tip.
6.2. Injection Rate
After the injection of fracturing fluid, stress concentration occurred at the fracture tip. When the maximum tensile stress generated by the hydraulic energy exceeded the tensile strength of the rock, fracture initiation and propagation occurred. The hydraulic energy available for fracture development varies with the injection rate, thereby influencing the fracture propagation pattern. To investigate this effect, the injection rate was sequentially set to 12 m3/min, 14 m3/min, and 16 m3/min, while maintaining a constant total fluid volume of 300 m3. The resulting fracture geometries under different injection rate conditions are shown in Figure 9.
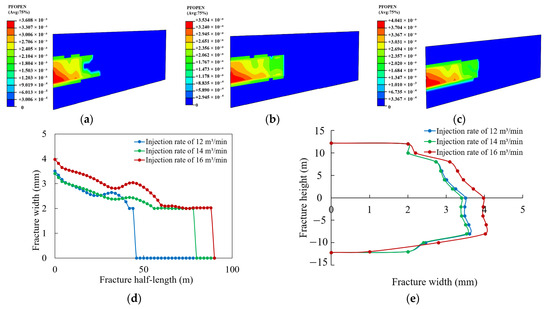
Figure 9.
Variation in fracture propagation morphology with injection rate. (a) Injection rate of 12 m3/min. (b) Injection rate of 14 m3/min. (c) Injection rate of 16 m3/min. (d) Fracture width profile. (e) Fracture height profile.
In tight sandy conglomerate composite reservoirs, variations in lithology and in situ stress result in non-uniform fracture propagation. Fracturing fluid tends to be insufficient at the tip of the central fracture, with a larger portion diverted toward interlayer interfaces. Near the weaker sandstone layer, the fracture exhibits an increased aperture. As shown in Figure 9a, when the injection rate was 12 m3/min, nearly half of the leading edge of the central fracture within the sandy conglomerate layer remained unfractured. In the mechanically stronger mudstone layer, cross-layer propagation was uneven and poorly developed. As the injection rate increased from 12 m3/min to 16 m3/min (Figure 9b,c), the ability to accumulate net pressure within the fracture improved, enabling the formation of a larger fracture volume within the same injection time. The elevated hydraulic energy facilitated more uniform propagation of the central fracture, significantly increasing the effective fracture length at the tip and moderately improving fracture width. As shown in Figure 9d,e, under a constant total fluid volume, increasing the injection rate notably improved fracture propagation in the central reservoir layer. Although fracture width increased only slightly, the overall fracture volume expanded. Meanwhile, in the direction of fracture propagation, the gradient of decreasing fracture width became less steep, indicating improved uniformity in both central fracture development and cross-layer propagation. Therefore, in “mudstone–sandy conglomerate–sandstone” composite reservoirs, increasing the injection rate effectively mitigates the adverse effects of vertical lithological heterogeneity on the uniform propagation of central fractures and the cross-layer propagation of hydraulic fractures.
6.3. Fracturing Fluid Viscosity
Changes in the viscosity of the fracturing fluid can influence its flow characteristics, alter local fracture friction, and reduce fluid leak-off into the formation, thereby affecting the development of hydraulic fractures. To investigate this effect, the fracturing fluid viscosity was sequentially set to 10 mPa·s, 50 mPa·s, and 100 mPa·s. With a fixed total injection volume of 300 m3, the resulting fracture propagation patterns under different viscosities were obtained, as shown in Figure 10.
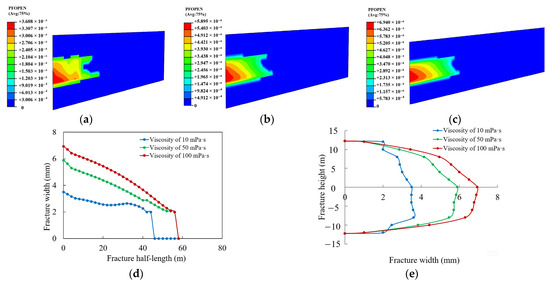
Figure 10.
Variation in fracture propagation morphology with fracturing fluid viscosity. (a) Viscosity of 10 mPa·s. (b) Viscosity of 50 mPa·s. (c) Viscosity of 100 mPa·s. (d) Fracture width profile. (e) Fracture height profile.
As shown in Figure 10a, when the viscosity of the fracturing fluid was 10 mPa·s, vertical lithological heterogeneity within the reservoir significantly influenced the geometry of the hydraulic fracture. Along the fracture length direction, the width of the central fracture exhibited substantial fluctuations, with a low degree of opening at the fracture tip. Vertically, the fracture width was narrower in the upper reservoir and wider in the lower reservoir, indicating a non-uniform distribution. When the viscosity increased to 50 mPa·s (Figure 10b), the higher viscosity fracturing fluid effectively reduced fluid leak-off during the fracturing process. This enhanced the fluid volume available for driving fracture propagation, decreased the pressure drop gradient within the fracture, and led to increases in both overall fracture width and effective fracture length. The variation pattern of fracture width along the fracture length direction transitioned from irregular fluctuations to a more linear decreasing trend. At a viscosity of 100 mPa·s (Figure 10c), the overall fracture width increased further. Vertically, the distribution pattern of fracture width changed from a gradual top-to-bottom decrease to a configuration with maximum width in the middle reservoir and smaller widths in the upper and lower layers. As shown in Figure 10d,e, for tight sandy conglomerate composite reservoirs, high-viscosity fracturing fluids can increase flow resistance within the fracture, significantly enhance fracture width development in the central reservoir, and promote greater fracture length propagation. At the same time, fluid entry into the upper and lower layers is suppressed, thereby improving the uniform propagation of fractures within the target middle layer.
7. Discussion
In tight sandy conglomerate composite reservoirs, fracture propagation is highly non-uniform, due to the combined effects of interlayer horizontal stress differences and vertical lithological heterogeneity. Based on the simulation results presented in Section 6, a fracture length–height competition diagram was developed, as shown in Figure 11. For single pay zone scenarios, optimizing the lateral propagation and uniformity of the central fracture while limiting vertical growth is favorable. In contrast, for multi-layer reservoirs, promoting effective cross-layer fracture propagation to connect multiple intervals can significantly enhance oil and gas recovery. Overall, for multi-layer stimulation, selecting a target interval with low interlayer horizontal stress differences (<4 MPa) and employing medium- to high-viscosity fracturing fluids (10–100 mPa·s) at high injection rates (>14 m3/min) is conducive to promoting cross-layer fracture propagation and expanding the stimulated reservoir volume. In contrast, in single-layer stimulation, targeting intervals with high interlayer horizontal stress differences (>4 MPa), combined with high viscosity fracturing fluids (50–100 mPa·s) and high injection rates (>14 m3/min), can improve the lateral propagation balance of fractures within the target layer, increase fracture width and tip opening, and ultimately expand the effective stimulated area.
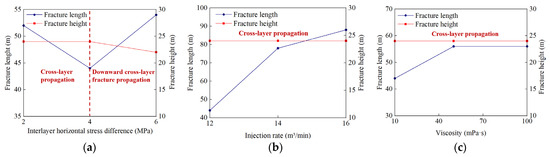
Figure 11.
Fracture length–height competition diagram under different influencing factors. (a) Interlayer horizontal stress difference. (b) Injection rate. (c) Fracturing fluid viscosity.
Based on the above findings, a field application was conducted in the Jiangbasi Formation of Well XX6 in the Junggar Basin. The reservoir is characterized by a mudstone–sandy conglomerate–sandstone sequence. Casing fracturing was implemented in three intervals with a total thickness of 11.2 m. The fracturing strategy focused on intervals with low interlayer horizontal stress differences (3–4 MPa), using a high injection rate of 14 m3/min and alternating injections of medium- and high-viscosity fracturing fluids. This approach facilitated both vertical cross-layer propagation and the relatively uniform lateral propagation of hydraulic fractures. Following the treatment, the well achieved daily gas production of 6581 m3 and daily water production of 31.96 m3, indicating effective multi-layer stimulation and sufficient vertical reservoir activation.
8. Conclusions
- (1)
- Core samples from the 5000–5500 m interval of Well X5 in the western uplift of the Junggar Basin were subjected to triaxial compression tests. The results indicate that, when considering both temperature and pressure, the brittle–ductile transition for rocks in this region occurs between 55 MPa (130 °C) and 65 MPa (150 °C). Elevated temperatures significantly accelerate the brittle–ductile transition of the core samples.
- (2)
- After the brittle–ductile transition occurs, the failure mode changes from localized shear failure along a single shear plane to bulging deformation involving multiple localized fractures. The stress–strain curve exhibits a pronounced pre-peak yield stage, and the post-peak stress drop rate is significantly reduced.
- (3)
- Based on the laboratory experiment results, a cohesive ductile constitutive model tailored to regional geological characteristics was developed, and a ductile hydraulic fracturing model for ultra-deep sandy conglomerate reservoirs was established. A fracture length–height competition diagram was constructed to analyze fracture propagation behavior. The results indicate that vertical heterogeneity within the reservoir leads to unbalanced lateral fracture propagation. Fracturing fluid tends to migrate toward interlayer interfaces, and fracture development is more pronounced near sandstone layers with weaker mechanical properties. Increasing the injection rate and employing medium- to high-viscosity fracturing fluids effectively enhances the lateral uniformity of fracture propagation within the target layer.
Author Contributions
Methodology, X.M.; Software, H.Z. and J.Z.; Data curation, S.C. and Y.W.; Writing—original draft, Z.J., P.Z. and H.X.; Writing—review & editing, Z.J., P.Z. and H.X. All authors have read and agreed to the published version of the manuscript.
Funding
This work was financially supported by the National Key Research and Development Program of China “Key Technical Index System and Standardization of the Whole Process of CO2 Fracturing and Storage of Large Oil and Gas Reservoirs” (No. 2023YFF0614102), the transverse project of Sinopec Xinjiang Xinchun Petroleum Development Co., Ltd. “Research on crack initiation and propagation of ultra-deep fracturing” (No. 30203569-23-ZC0613-0012), and the Natural Science Foundation of Sichuan Province (No. 2025ZNSFSC0371).
Data Availability Statement
The original contributions presented in the study are included in the article; further inquiries can be directed to the corresponding author.
Conflicts of Interest
Authors Xianbo Meng and Yong Wang were employed by the company Sinopec Shengli Oilfield Company. The remaining authors declare that the research was conducted in the absence of any commercial or financial relationships that could be construed as a potential conflict of interest. The authors declare that this study received funding from the National Key Research and Development Program of China, the transverse project of Sinopec Xinjiang Xinchun Petroleum Development Co., Ltd. and the Natural Science Foundation of Sichuan Province. The funder had the following involvement with the study: The funder provided financial support and technical assistance during the research process.
References
- Liu, X.; Wang, X.; Zhao, B.; Xiong, J.; Liu, L. Propagation of Hydraulic Fractures and Fracability Evaluation of Sandy Conglomerate Reservoirs. Xinjiang Pet. Geol. 2023, 44, 169–177. [Google Scholar]
- Zan, L.; Wang, S.; Zhang, Z.; Sheng, L.; Xing, H. Research Status of Glutenite Reservoir. J. Yangtze Univ. (Nat. Sci. Ed.) 2011, 8, 63–66. [Google Scholar]
- Zeng, F.; Guo, J.; Chen, M. Research and Application of Fracturing Technology for Large Thick Glutenite Reservoir. J. Oil Gas Techno. 2011, 33, 123–126. [Google Scholar]
- Cui, Z.; Hou, B.; Fu, S.; Lv, J. Fractures Cross-Layer Propagation Characteristics of Integrated Fracturing in Shale Oil Tight Reservoir. Fault-Block Oil Gas Field 2022, 29, 111–117. [Google Scholar]
- Yan, L.; Chen, F.; Wang, Z.; Yan, Y.; Cao, J.; Wang, S. Challenges and Technical Countermeasures for Effective Development of Shale Oil in China. Pet. Drill. Tech. 2024, 48, 63–69. [Google Scholar]
- Yang, Z.; Hou, L.; Lin, S.; Luo, X.; Zhang, L.; Wu, S.; Cui, J. Geologic Characteristics and Exploration Potential of Tight Oil and Shale Oil in Lucaogou Formation in Jimsar Sag. China Pet. Explor. 2018, 23, 76–85. [Google Scholar]
- Rybacki, E.; Meier, T.; Dresen, G. What Controls the Mechanical Properties of Shale Rocks?—Part II: Brittleness. J. Pet. Sci. Eng. 2016, 144, 39–58. [Google Scholar] [CrossRef]
- Zhang, G.; Wu, S.; Guo, P.; Zhang, S. Mechanical deformation, acoustic emission characteristics, and microcrack development in porous sandstone during the brittle–ductile transition. Rock Mech. Rock Eng. 2023, 56, 9099–9120. [Google Scholar] [CrossRef]
- Zhang, S.; Abdallah, K.; Li, L.; Hamdi, E.; Liu, J. Multiphase flow controlled by synergistic injection-production pressure: Enabling CO2 geo-sequestration with additional gas recovery from vertically heterogeneous depleted shale reservoirs. Fuel 2025, 398, 135591. [Google Scholar] [CrossRef]
- Ranjith, P.; Viete, D.; Chen, B.; Perera, M. Transformation plasticity and the effect of temperature on the mechanical behaviour of Hawkesbury sandstone at atmospheric pressure. Eng. Geol. 2012, 151, 120–127. [Google Scholar]
- Tarasov, B.; Potvin, Y. Universal Criteria for Rock Brittleness Estimation Under Triaxial Compression. Int. J. Rock Mech. Min. Sci. 2013, 59, 57–69. [Google Scholar] [CrossRef]
- Ding, R.; Zhang, F.; Wang, Y.; Li, X.; Lin, B. Brittleness of Deep Sandstone in Central Junggar Basin and Its Influence on Fracture Modes of Rocks. Pet. Geol. Recovery Effic. 2024, 31, 54–62. [Google Scholar]
- González-Gómez, W.; Quintana, P.; May-Pat, A.; Avilés, F.; May-Crespo, J.; Alvarado-Gil, J. Thermal Effects on the Physical Properties of Limestones from the Yucatan Peninsula. Int. J. Rock Mech. Min. Sci. 2015, 75, 182–189. [Google Scholar] [CrossRef]
- Xie, H.; Gao, M.; Fu, C.; Lu, Y.; Yang, M.; Hu, J.; Yang, B. Mechanical Behavior of Brittle-Ductile Transition in Rocks at Different Depths. J. China Coal Soc. 2021, 46, 701–715. [Google Scholar]
- Zhang, P.; Mishra, B.; Heasley, K. Experimental Investigation on the Influence of High Pressure and High Temperature on the Mechanical Properties of Deep Reservoir Rocks. Rock Mech. Rock Eng. 2015, 48, 2197–2211. [Google Scholar] [CrossRef]
- Lv, Z.; Pan, L.; Hao, L.; Zou, N.; Zou, Z. Numerical Simulation of Factors Influencing Hydraulic Fracture Propagation in Sandstone-Mudstone Interbedded Reservoirs. Xinjiang Pet. Geol. 2023, 44, 729–738. [Google Scholar]
- Pan, R.; Zhang, G. The Influence of Fracturing Energy Anisotropy on Hydraulic Fracturing Path in Layered Rocks. Chin. J. Rock Mech. Eng. 2018, 37, 2309–2318. [Google Scholar]
- Lan, T.; Hu, B.; Dong, W.; Zhang, X. Numerical Simulation Research of Hydraulic Fracture Extension Laws in Coal and Sandstone Interbed. China Energy Environ. Prot. 2018, 40, 38–44,49. [Google Scholar]
- Zhao, H.; Wang, X.; Liu, Z.; Yan, Y.; Yang, H. Investigation on the Hydraulic Fracture Propagation of Multilayers-Commingled Fracturing in Coal Measures. J. Pet. Sci. Eng. 2018, 167, 774–784. [Google Scholar] [CrossRef]
- Guo, J.; Luo, B.; Lu, C.; Lai, J.; Ren, J. Numerical Investigation of Hydraulic Fracture Propagation in a Layered Reservoir Using the Cohesive Zone Method. Eng. Fract. Mech. 2017, 186, 195–207. [Google Scholar] [CrossRef]
- Zhou, H.; Meng, F.; Zhang, C.; Xu, R.; Lu, J. Quantitative Evaluation of Rock Brittleness Based on Stress-Strain Curve. Chin. J. Rock Mech. Eng. 2014, 33, 1114–1122. [Google Scholar]
- Xia, Y.; Li, L.; Tang, C.; Ma, S.; Li, M. Rock Brittleness Evaluation Based on Stress Dropping Rate After Peak Stress and Energy Ratio. Chin. J. Rock Mech. Eng. 2016, 35, 1141–1154. [Google Scholar]
- Li, M.; Zhou, F.; Huang, G.; Wang, B.; Hu, X.; Li, H. A Finite Element Simulation Method for Multi-Fracture Propagation in Horizontal Wells Based on Fluid Pipe Element. J. China Univ. Pet. (Ed. Nat. Sci.) 2022, 46, 105–112. [Google Scholar]
- Wang, C.; Zhang, H.; Zhao, J.; Wang, T. Study on Hydraulic Fracture Propagation in Elastoplastic Reservoir. China Pet. Mach. 2022, 50, 80–88. [Google Scholar]
- Jiao, Z.; Zhang, A.; Du, L.; Yang, Y.; Fan, H. Numerical Study of the Effect of Perforation Friction and Engineering Parameters on Multicluster Fracturing in Horizontal Wells. Geofluids 2021, 2021, 18. [Google Scholar] [CrossRef]
- Yang, Y.; Jiao, Z.; Du, L.; Fan, H. Numerical Simulation of Shale Reservoir Fluid-Driven Fracture Network Morphology Based on Global CZM. Front. Earth Sci. 2021, 9, 775446. [Google Scholar] [CrossRef]
- Sarris, E.; Papanastasiou, P. The Influence of the Cohesive Process Zone in Hydraulic Fracturing Modelling. Int. J. Fract. 2011, 167, 33–45. [Google Scholar] [CrossRef]
- Sarris, E.; Papanastasiou, P. Modeling of Hydraulic Fracturing in a Poroelastic Cohesive Formation. Int. J. Geomech. 2011, 12, 160–167. [Google Scholar] [CrossRef]
- Wang, H. Poro-elasto-plastic Modeling of Complex Hydraulic Fracture Propagation: Simultaneous Multi-Fracturing and Producing Well Interference. Acta Mech. 2016, 227, 507–525. [Google Scholar] [CrossRef]
- Guo, J.; Lu, Q.; Zhu, H.; Wang, Y.; Ma, L. Perforating Cluster Space Optimization Method of Horizontal Well Multi-Stage Fracturing in Extremely Thick Unconventional Gas Reservoir. J. Nat. Gas Sci. Eng. 2015, 26, 1648–1662. [Google Scholar] [CrossRef]
- Wang, B.; Zhou, F.; Wang, D.; Liang, T.; Yuan, L.; Hu, J. Numerical Simulation on Near-Wellbore Temporary Plugging and Diverting During Refracturing Using XFEM-Based CZM. J. Nat. Gas Sci. Eng. 2018, 55, 368–381. [Google Scholar] [CrossRef]
- Yang, Q.; Li, B.; Shao, M.; Zhang, H. Production Performance of Perforation Clusters During Multistage Fracturing in Shale Gas Reservoirs. ACS Omega 2021, 6, 26231–26238. [Google Scholar] [CrossRef] [PubMed]
Disclaimer/Publisher’s Note: The statements, opinions and data contained in all publications are solely those of the individual author(s) and contributor(s) and not of MDPI and/or the editor(s). MDPI and/or the editor(s) disclaim responsibility for any injury to people or property resulting from any ideas, methods, instructions or products referred to in the content. |
© 2025 by the authors. Licensee MDPI, Basel, Switzerland. This article is an open access article distributed under the terms and conditions of the Creative Commons Attribution (CC BY) license (https://creativecommons.org/licenses/by/4.0/).