Article

Efficiency of a New Biochar Made from Agave Bagasse to Remove Conventional Pollutants in Samples from Laguna de Bustillos, Chihuahua, Mexico, and Pharmaceutical Derivatives in Synthetic Water

by
Wendy Nayely Medina-Esparza
1,
Oscar Aguilar-Juárez
2,*,
Sergio Gómez-Salazar
3,
René Morán-Salazar
4,
Montserrat López-Covarrubias
5,
Luz Olivia Leal-Quezada
1,
Jorge Del Real-Olvera
2 and
Víctor Manuel Reyes-Gómez
6
1
Departamento de Medio Ambiente y Energía, Centro de Investigación en Materiales Avanzados, S.C., Miguel de Cervantes 120, Chihuahua 31136, Mexico
2
Unidad de Tecnología Ambiental, Centro de Investigación y Asistencia en Tecnología y Diseño del Estado de Jalisco, Normalistas 800, Guadalajara 44270, Mexico
3
Departamento de Ingeniería Química, Universidad de Guadalajara-CUCEI, Blvd. Marcelino García Barragán # 1421, Guadalajara 44430, Mexico
4
Departamento de Química, Universidad de Guadalajara-CUCEI, Blvd. Marcelino García Barragán # 1421, Guadalajara 44430, Mexico
5
Ingeniería en Nanotecnología, Universidad de Guadalajara-CUTonalá, Nuevo Perif. Ote. 555, Ejido San José, Tateposco, Tonalá 45425, Mexico
6
Red Ambiente y Sustentabilidad, Instituto de Ecología, A.C., Miguel de Cervantes 120, Chihuahua 31136, Mexico
*
Author to whom correspondence should be addressed.
Processes 2025, 13(6), 1861; https://doi.org/10.3390/pr13061861
Submission received: 1 May 2025 / Revised: 29 May 2025 / Accepted: 5 June 2025 / Published: 12 June 2025
(This article belongs to the Section Separation Processes)

Abstract

Research on using biochar as an adsorbent of contaminants in aqueous matrices has gained significant relevance in recent years due to the surface chemistry and porous structure of biochar, which facilitate the retention of a wide range of pollutants. This study explores the adsorption performance of a novel biochar produced from agave bagasse—a readily available agro-industrial waste in Mexico—through low-temperature pyrolysis. The biochar was evaluated for its capacity to remove conventional water quality parameters (chemical oxygen demand (COD), nitrates (NO3), total nitrogen (TN), total phosphorus (TP), ammonium (NH4+), turbidity, apparent color, and true color) from water samples collected from the polluted Bustillos Lagoon in Chihuahua, Mexico. Additionally, the removal of emerging pharmaceutical contaminants, specifically acetaminophen (Act) and diclofenac (Dfc), was assessed in synthetic aqueous solutions. Potentiometric titration analyses revealed a significant contribution of surface acidity in the adsorption of pharmaceutical derivatives, highlighting the relevance of functional groups retained during low-temperature pyrolysis. The biochar derived from agave bagasse (BBAF1) was tested in a fixed-bed column system and compared with two commercial activated carbons (CACCF2 and CVCF3). The BBAF1 biochar achieved average removal efficiencies ranging from 50% to 90% for all conventional parameters. In contrast, those of ACT and DFC were between 0.43 and 0.67 mg g−1 (59–85%) and 0.34 and 0.62 mg g−1 (37–79%), respectively, demonstrating their potential as an adsorbent material for improving water quality. This work supports the development of circular economic strategies by valorizing agricultural residues while offering an effective solution to environmental pollution challenges.

Graphical Abstract

1. Introduction

Adequate wastewater treatment must address both conventional pollutants, such as nitrates (NO3), total nitrogen (TN), total phosphorus (TP), ammonium (NH4+), chemical oxygen demand (COD), turbidity, and color, as well as emerging contaminants, including pharmaceutical derivatives and personal care products. The inadequate removal of these substances from municipal and industrial effluents poses serious environmental and public health risks [1]. In recent years, carbon-based materials such as activated carbon, graphene oxide, carbon nanotubes, and biochar have been extensively studied for water treatment applications due to their high surface area, porosity, and the presence of functional groups that enhance adsorption capabilities [2,3]. These materials have been applied in diverse treatment methods, including adsorption [4], photocatalysis, and membrane filtration, to remove a wide variety of contaminants such as heavy metals, dyes, and pharmaceutical residues [5,6,7]. The development and optimization of these materials are crucial for creating more sustainable, cost-effective, and efficient technologies to address global water pollution and scarcity challenges.
In recent years, biochar has gained prominence as a promising adsorbent material for water treatment, and it is also effective in gas purification, petroleum gas deodorization, and catalytic carriers [8,9]. It is a carbon material derived from a wide range of biomass feedstocks, including plant matter (leaves, fruits, roots, flowers) and organic waste (sewage sludge, fungal debris) [10]. This material is produced by biomass pyrolysis and is a promising solution for wastewater treatment due to its unique properties, such as its high porosity, large specific surface area, and abundant functional groups that facilitate the adsorption of pollutants [11]. Biochar effectively removes a variety of pollutants, including arsenic [12] and heavy metals, organic pollutants, nutrients, and emerging pollutants such as pharmaceuticals derivatives [13,14].
Despite its efficiency, the high production cost and the environmental impact of activated carbon manufacturing have driven research into alternatives such as biochar, which can offer similar functionality at a lower cost and with less environmental impact [15]. The production of biochar not only contributes to environmental remediation but also supports circular economy models by transforming waste into value-added products [16]. Additionally, biochar offers a cost-effective and environmentally friendly alternative to activated carbon, whose manufacture involves high energy input and chemical activation processes.
Recent studies have demonstrated the ability of biochar to adsorb pharmaceuticals derivatives, a class of emerging pollutants with significant environmental and health implications. Products like acetaminophen, a popular analgesic and antipyretic used to treat fever and mild-to-moderate pain, and diclofenac, an analgesic, anti-inflammatory, and anti-arthritic pharmaceutical (Figure 1), are often found in surface water because conventional wastewater treatment plants are not designed to remove them effectively [17]. These compounds persist in aquatic environments, bioaccumulate, and alter ecosystems, so their removal is a priority in wastewater treatment. The raw material used for biochar production greatly influences its properties and adsorption capacity. Agave bagasse, a by-product of tequila and mezcal production, is a very abundant agricultural waste product in Mexico. It is rich in lignocellulosic content, making it an ideal precursor for biochar production [18]. Using agave bagasse to produce biochar is a win–win solution that addresses waste management challenges and offers a cost-effective solution for water treatment, especially in tequila- and mezcal-producing regions, where this by-product is readily available.
This study investigates the feasibility of utilizing biochar derived from agave bagasse, produced through low-temperature pyrolysis at 250 °C, as an alternative adsorbent for treating contaminated surface water. Water samples were collected from Laguna de Bustillos, a contaminated lagoon in Chihuahua, Mexico, to evaluate the removal of parameters such as COD, NO3, NT, PT, ammonium, turbidity, apparent color, and true color; synthetically enriched water was used to evaluate the removal of acetaminophen and diclofenac.
Among the novelties of this study, it is one of the first applications of agave bagasse biochar produced using low-temperature pyrolysis at 250 °C as an adsorbent for both conventional and emerging water pollutants. The effectiveness of the material was evaluated in samples of actual contaminated water from Laguna de Bustillos. Simultaneous removal of conventional pollutants and pharmaceutical compounds was observed, with direct comparison of performance with commercial activated carbons. Surface acidity analysis by potentiometric titration provided insight into the role of functional groups in pharmaceutical adsorption mechanisms.
This study aimed to achieve several objectives: to synthesize biochar from agave bagasse using a simple, low-energy pyrolysis method and to characterize the biochar and evaluate its surface properties relevant to adsorption; to assess its effectiveness in removing conventional pollutants from lagoon water; to determine the removal efficiency of pharmaceutical derivatives from synthetic aqueous solutions; to compare the performance of agave bagasse biochar with two commercial activated carbons under identical experimental conditions; and to investigate the influence of surface functional groups on adsorption mechanisms by potentiometric titration analysis.

2. Materials and Methods
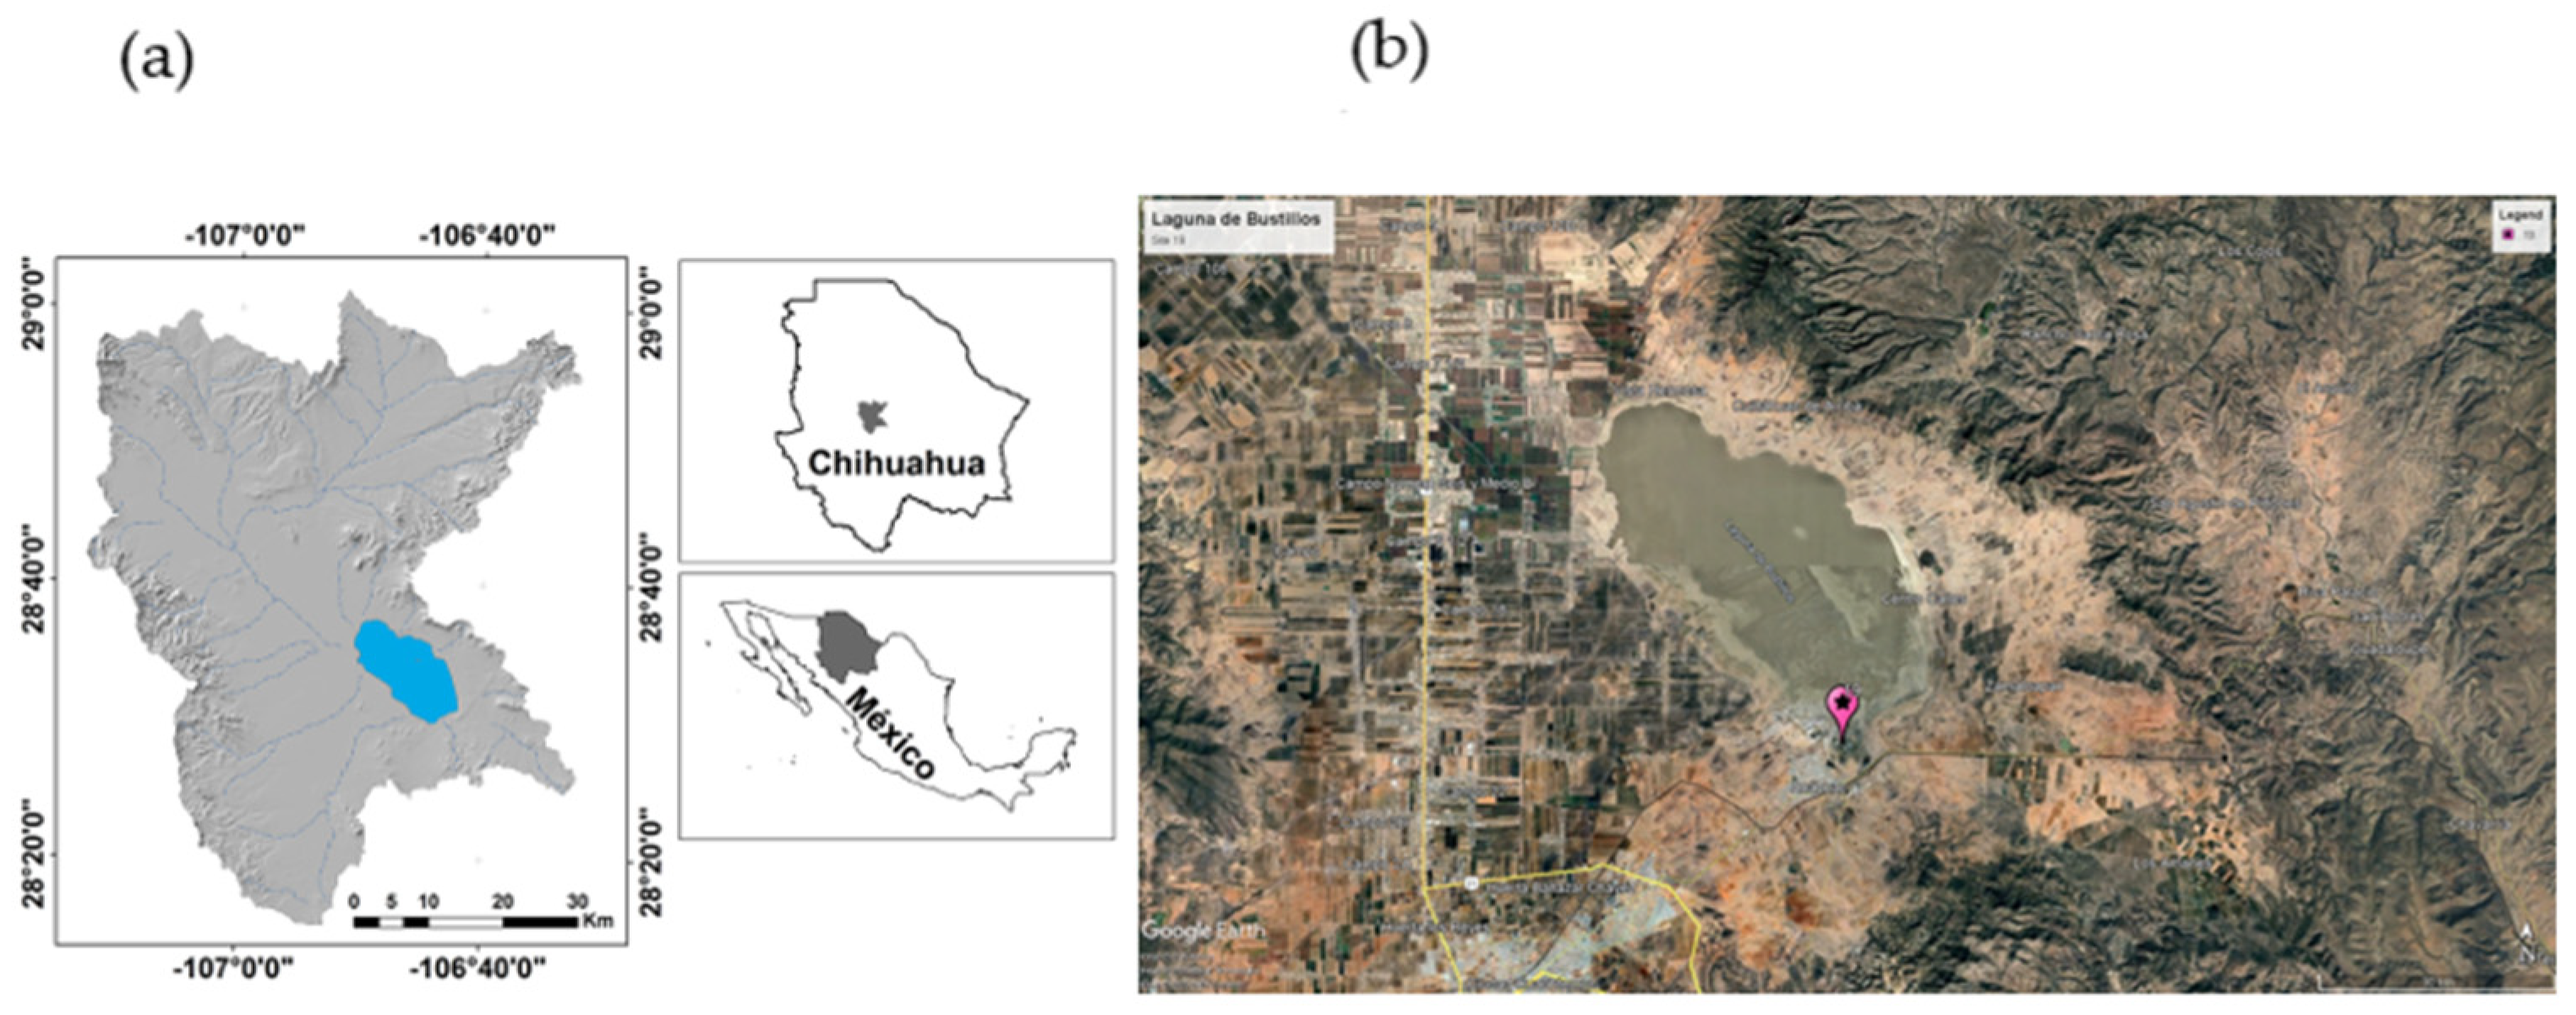
2.1. Study Site

Laguna de Bustillos (LB) is located in 28°30′38.69″ N, 106°45′41.09″ W within the municipality of Cuauhtémoc, Chihuahua, Mexico (Figure 2). It is a wetland of significant importance for the state and one of sixty natural lakes in Mexico [19]. This lagoon is the main reservoir for rainwater runoff in northwest Chihuahua, since it is in the lowest part of an endorheic basin of the same name. At certain times of the year, more than 15,000 migratory birds can congregate in the LB [20]. The LB hosts a record of 187 species of fauna, and covers the southern part of the Sierra del Nido zone, considered a priority area for bird conservation in Mexico [21]. LB is located just a few kilometers from the municipalities of Anáhuac and Cuauhtémoc and has been an important natural and agroeconomic element for the development of the Mennonite and Mestizo communities in the region. However, due to inadequate management of human activities, this lagoon receives currents with sediments and contaminated wastewater, which deteriorates the water quality.
One of the main sources of contamination in this body of water is the input of wastewater, which is often discharged into the tributaries that feed the LB, transporting polluting materials that have altered the water quality of the lagoon [22,23,24]. The streams that flow into the LB are of radial type and flow into the lagoon, the most important being La Vieja stream, which originates in the northwest of the LB basin in the Chuchupate Mountain range under the name of La Quemada. This stream continues its course towards the southeast until it flows into the lagoon, traveling approximately 65 km. Another important tributary of Laguna de Bustillos is the San Antonio stream. The first one crosses the northwest region, passing through a dam in the Bustillos ejido and, 10 km further downstream, flows into the LB. The San Antonio stream crosses the city of Cuauhtémoc before pouring its waters into the lagoon.
Figure 2. Laguna de Bustillos, Chihuahua, Mexico. (a) Geographical location (taken from Peña et al., 2015 [25]); (b) site 19, where water sample was taken.
Processes 13 01861 g002

2.2. Materials

Polypropylene bottles (1 L) were used to collect water samples from the lagoon. A DRB200 Digestion Reactor from HACH (Loveland, CO, USA) and high-range HACH brand vial kits were used for monitoring of the parameters COD, NO3, NO2, NT, and PO4.

2.3. Water Sample Collection and Analysis

Water samples (approx. 10 L) were collected from Laguna de Bustillos (LB), Chihuahua, Mexico (Figure 1a) in January 2024. They were placed in polyethylene bottles, transported at 4 °C, and stored until analysis. The sampling location is shown in Figure 2b. The composition of this water sample is shown in Table 1.
The parameters that were analyzed included COD, nitrates, total nitrogen, ammonium, phosphates, turbidity, and color. Standardized methods were employed to determine each contaminant’s concentration. These methods were selected in accordance with the guidelines of the Standard Methods for the Examination of Water and Wastewater and the HACH technique in high range [26].

2.4. Biochar Synthesis

Agave bagasse is considered a residue of tequila production, and the process begins with harvesting the hearts of the plant Agave tequilana Weber which are between 5 and 8 years old. Then comes the “jima”, in which the leaves are removed from the plant to leave only the inner ball or heart of the agave, which is then torn to extract the sugar. The sugars in the torn fibers of the agave are extracted as a water solution and agave sugar through a diffuser. From here, the agave juice and bagasse are obtained. In this work, bagasse wastes were obtained from a tequila company situated in Amatitán, Jalisco, México (20°50′02″ N, 103°43′51″ W), and were then sun-dried for 3 days to eliminate moisture and stored in a dark, dry place. The biochar was produced by pyrolysis of bagasse at 250 °C for a given time under an inert atmosphere. The resulting material was ground in a ceramic mortar and sieved in two sizes (0.6 and 0.08 mm) to obtain a uniform particle size. It was then washed with distilled water. For practical and comparative reasons, it is preferable to wash and dry the biochar until all impurities in the form of fine particles that may be added to the effluent are removed. The effects of varying pyrolysis temperatures (250 and 300 °C) and times (15–30 min) on biomass reduction were investigated. Several tests were performed at different times and with different quantities of agave bagasse to estimate the biomass reduction and select the optimal parameters to obtain a higher percentage of recovery of the material synthesized for this study.
The material was then left to dry at 100 °C to remove any remaining moisture [17,27]. This process is shown in Figure 3. The sample was identified as BBAF1.

2.5. Biochar Characterizations

The pollutant removal efficiency of the BBAF1 sample from Laguna de Bustillos (LB) was monitored for 6 days by measuring all parameters and compared with two commercially available biochars used as controls: a coconut shell biochar, CACCF2, purchased from Carbotecnia (Zapopan, Mexico), and a wood biochar, CVCF3, purchased from Grow Depot (Torreon, Mexico) (Figure 4). From the seventh day, only the COD parameter was monitored to see at what point the biochar stopped adsorbing pollutants and reached saturation. For this purpose, three 25 cm long and 2.8 cm internal diameter acrylic columns were used and packed as follows: column 1 was packed with 35 g of the BBAF1 sample; column 2, used as control 1, was packed with 38 g of the CACCF2 sample; and column 3, used as control 2, was packed with 32.5 g of the CVCF3 sample. In these experiments, approximately 60 mL of LB water was passed through the columns by gravity, and effluent samples were collected at several time intervals for subsequent analysis. Measurements of the various water quality parameters were taken before and after the sample passed through the columns. The experimental setup is shown in Figure 3. On the other hand, the removal of Act and Dfc by the three biochars was also tested in the three columns under the same experimental conditions, and their concentrations were measured using a HACH UV-Vis spectrophotometer (HACH, Mexico city, Mexico) operating at a wavelength between 270 and 290 nm. Solutions of 30 mg L−1 each of Act (pH 7.30) and Dfc (pH 7.70) were prepared in Mili-Q water and used for the experiments.
The three biochar samples were characterized by (1) scanning electron microscopy (SEM) to examine the morphological and structural characteristics. Electron micrographs were obtained using a Hitachi SU3500 scanning electron microscope (Hitachi, Tokio, Japan) operating at 10 kV and 15 kV. The conditions for the CVCF3 sample were low vacuum in the SEM chamber and 60 Pa pressure, whereas high vacuum was used in the chamber for the BBAF1 and CACCF22 samples. Secondary electron (SE) and backscattered electron (BSE-COMP) signals were used. (2) Fourier transform infrared attenuated total reflection spectra (FTIR-ATR) were used to determine the several types of chemical functional groups present in the samples. A Bruker Alpha FTIR-ATR system (Bruker Optics, Billerica, MA, USA) with a 300 Golden Gate diamond ATR model was used. Samples were scanned over the range 4000–450 cm−1 with a resolution of 2 cm−1. (3) Nitrogen adsorption–desorption isotherms at 77 K were obtained using an ASAP 2020 KMP sorptometer (Micrometrics, Norcross, GA, USA). The data was analyzed using the Brunauer–Emmett–Teller (BET) method. Prior to measurements, approximately 0.2 g of biochar samples was conditioned at 413 K and 10 µm Hg vacuum for 24 h to desorb any species attached to the surface of the biochar, such as water and CO2, which could interfere with the measurement. The specific surface area was determined by the Brunauer–Emmett–Teller (BET) method using adsorption data in the relative pressure range 0 < P/Po < 0.3; the total pore volume was determined by adsorption at P/Po = 0.995 and the pore size distribution was obtained by the Barret–Joyner–Halenda (BJH) method. (4) The crystalline characteristics of the three biochar samples were obtained by Powder X-ray Diffraction (XRD) using a PANALYTICAL EMPYREAN diffractometer (Malvern Panalytical, Malvern, UK) with CuKα radiation with the following operation parameters: λ = 1.54051 Å, 2θ range of 10–70°, step size of 0.02°, time step of 20 s/step, intensity of 30 mA, and power of 40 kV. (5) PZC was determined from electrophoretic mobility measurements of biochars and converted to ζ-potential using the Smoluchowski equation. Measurements were made using a Malvern Zetasizer (Worcestershire, UK).

2.6. Potentiometric Titration Procedure of Biochars

The functionalities of the surface biochar moieties of the BBAF1, CACCF2, and CAVCF3 samples were studied by an automatic potentiometric titration methodology. About 0.05 g of biochar was put down in a double-walled Pyrex container, contacted with 50 mL of an inert electrolyte solution (0.1 N NaNO3), and equilibrated at 25 °C for 12 h using CO2-free conditions by continuous N2 bubbling so that the possible CO2 adsorbed on the solid surface was removed and to avoid the dissolution of this gas into the system. An Orion VersaStar Pro pH meter from ThermoScientific (Waltham, MA, USA) (±0.001 pH units) was used for pH measurements; commercially available pH buffer solutions (pH 4.00, 7.00, and 10.00) were used to calibrate a single junction glass pH electrode (Orion, Ross Ultra Thode pH range: 1–13, filled with 3 M KCl). After conditioning and equilibrium was attained, an aliquot of either acid or base was added to the suspension to displace the pH to the desired initial titration pH value. Then, a 0.1N NaOH titrant solution (or 0.1N HNO3) was added dropwise with a Dosimat 876 plus Metrohm microburet to start the titration (addition resolution of ±0.001 cm3). To control the titrant dose, the microburet was interfaced to a PC and a LabView code computer program controlled all the titration. A stability pH criterion was implemented to administer titrant increments as follows: the limitations allowed for the pH change (ΔpH) and the time intervals (Δt) for pH value comparison. In these measurements, ΔpH = 0.005 pH units, Δt = 60 s, and Δv = 0.05 cm3. A pH range of 3–11 was selected to perform all titrations. A proton adsorption isotherm was generated from the number of protons, Q (mmol g−1), that react with the surface functional groups of the biochar, and calculated by a proton balance given by
Q = 1 m V i ( C a i C b i ) + V N T ( V i + V ) [ H + ] f [ O H ] f
where m is the mass of adsorbent, Vi is the initial volume of solution, V is the volume of titrant, C a i and C b i are the initial analytical concentrations of acid (or base) added initially to the system, NT is the normality of titrant, and [H+]f and [OH]f are the actual concentrations of these ions corrected for activity coefficients from the experimentally measured values using the Davies equation [28]. A proton isotherm, Q(pH), was derived by converting the titration data of Vtitrant added vs. pH. The Proton Affinity Distribution (PAD) approach was applied to the data to assess the pKa values of the corresponding surface functional groups. The calculation was performed with the SAIEUS program [29,30].

3. Results and Discussion

3.1. BBAF1 Synthesis

The percentage of biomass reduction by weight of BBAF1 during the biochar synthesis process is given in Table 2. Several tests were carried out with different amounts of BBAF1 and pyrolysis to obtain an estimate of the biomass reduction. The results obtained show that the weight of dry BBAF1 was reduced by an average of 50%. An additional experiment was carried out to produce bagasse biochar by varying the temperature and pyrolysis time to evaluate the percentage of material recovery and to obtain optimal synthesis conditions. It was observed (Table 2) that in all cases a recovery percentage close to 50% of the material was obtained. However, when the bagasse was pyrolyzed at 250 °C for 15 min, the highest percentage of biochar was obtained, reaching 53.5%, so these parameters were selected for this study.

3.2. Structural Characteristics of the BBAF1, CACCF2, and CVCF3 Biochars
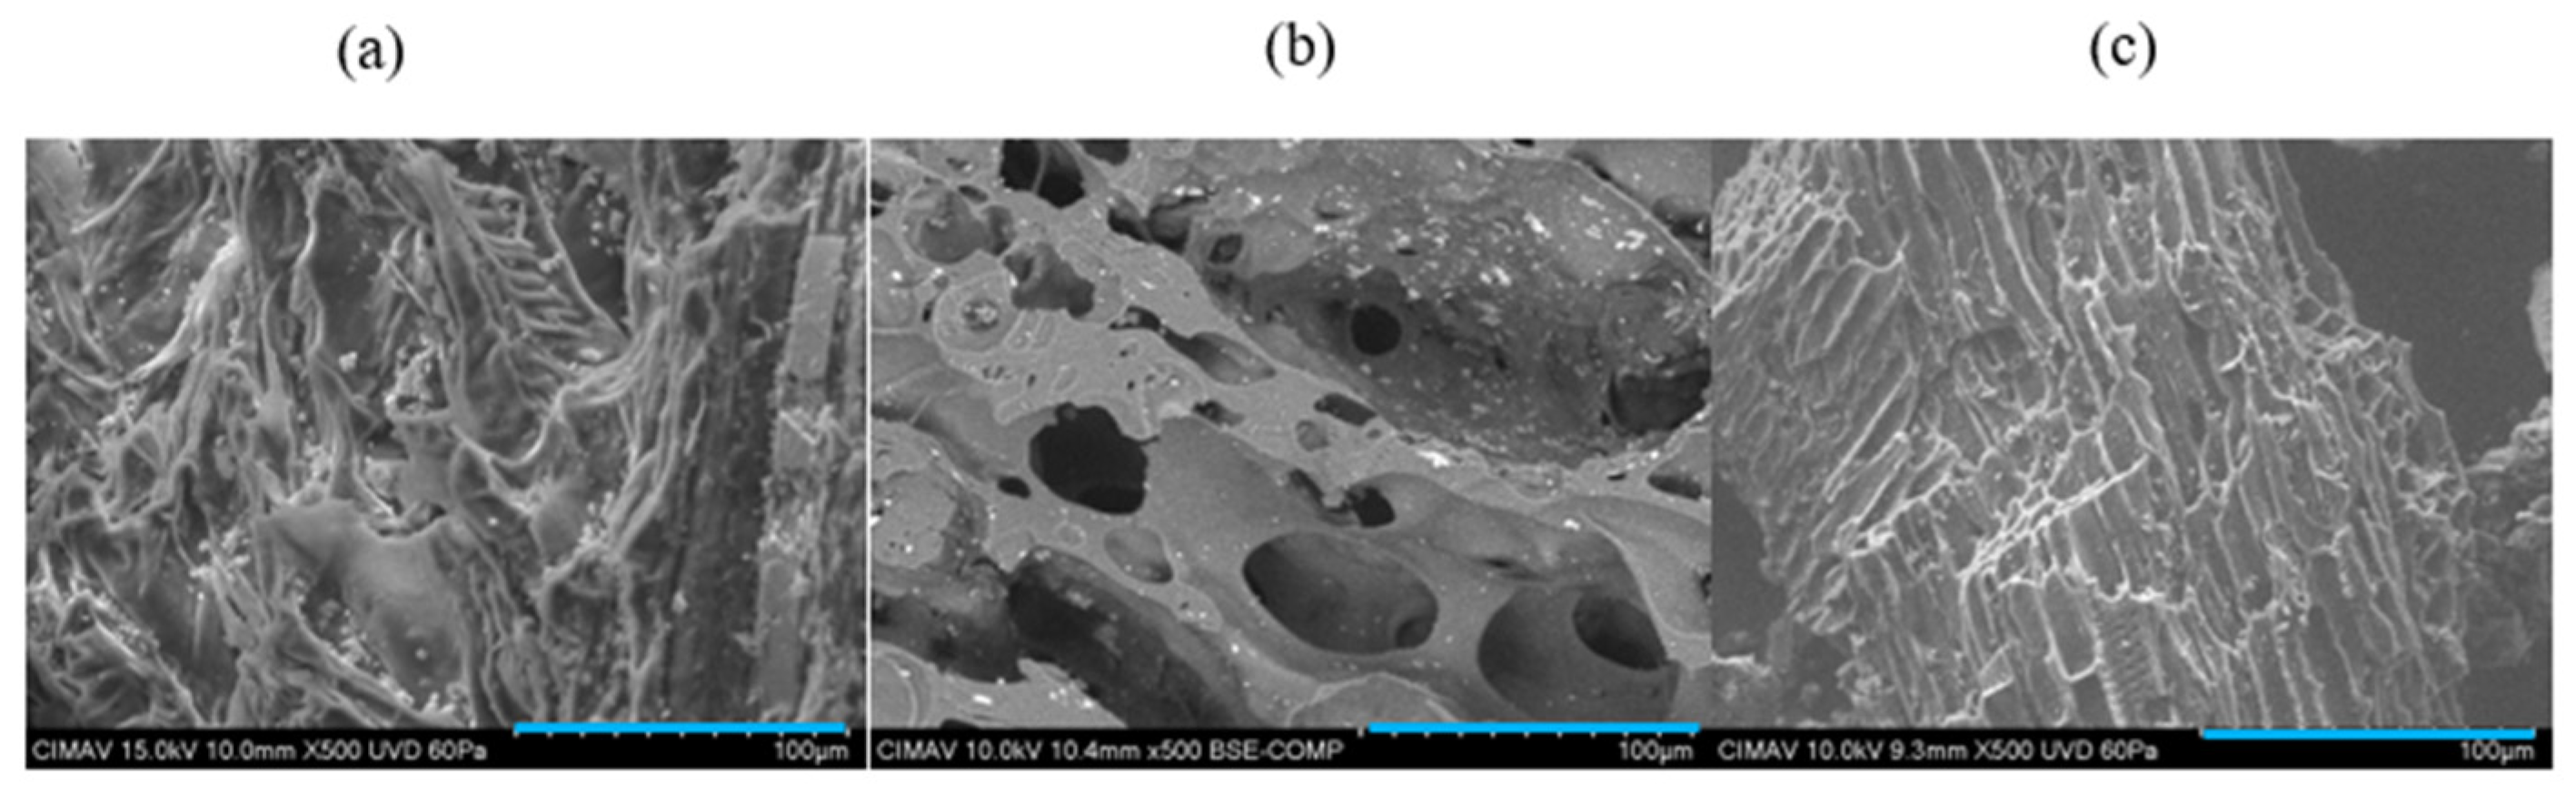
3.2.1. SEM

Scanning electron microscopy (SEM) images of the three biochars provide valuable information on their morphology and surface structure. In the case of the BBAF1 sample (Figure 5a), a fibrous structure can be observed, derived from the cellulose chains present in the hearts of Agave tequilana Weber at the beginning of the tequila production process. The micrograph of the CACCF2 sample (Figure 5b) shows a porous surface with an abundance of macropores, characteristic of biochars synthesized from coconut shells. The presence of these porous structures is crucial for their adsorption capacity. More defined dispersed particles and a more ordered fibrous structure are observed in the CVCF3 sample (Figure 5c). The rough surface and complex pore network observed indicate large surface areas in the CACCF2 and CVCF3 samples (Figure 5b,c), which is beneficial for the adsorption of pollutants [27]. Table 3 shows a comparison of the morphology of some biochars made from bagasse.

3.2.2. FTIR

The FTIR spectra of samples BBF1, CACCF2, and CVCF3 are shown in Figure 6. Common features of the three samples can be observed in this figure. For example, a broad signal at 3653–3100 cm−1 is observed for the three samples and is due to the stretching vibrations of the -OH phenol and alcohol groups or adsorbed water molecules [34]. The broad absorption band observed between 3653 and 3100 cm−1 in all three biochar samples (BBAF1, CACCF2, and CVCF3) corresponds to the O–H stretching vibrations. This band is characteristic of hydroxyl groups, which may originate from alcohols, phenols, or adsorbed water molecules. The broadness of the band suggests strong hydrogen bonding interactions between the surface and the OH groups or with water. This indicates that the surface of all three biochars contains polar functional groups capable of forming hydrogen bonds, which can enhance their adsorption capacity toward polar contaminants such as pharmaceuticals and heavy metals in aqueous solutions. The intensity differences among the samples may reflect variations in surface chemistry and degree of oxidation.
Peaks at around 1560 and 1570 cm−1 are due to the stretching vibrations of the C=O bonds of carboxyl group and possibly traces of aldehydes, ketones, and esters. These signals may also be due to esters of carboxyl groups and anhydrides [35,36]. The signal between 1100 and 1000 cm−1 in the three samples is attributed to the presence of C-O bonds from polysaccharides [37] derived from the cellulose originally present in the three samples. The oscillatory vibrations of the C-H bond from aromatic and heteroaromatic functionalities are observed by the band located between 800 and 600 cm−1 [38]. In the case of the CVCF3 sample, a peak is observed at 1393 cm−1. This band can be assigned to either C–H bending or –CH3 deformation in carbon-based or lignocellulosic materials, such as biochar and activated carbon, or –COO– symmetric stretching vibrations of carboxylate groups from oxidized biomass and organic acids, such as oxidized biochar and biopolymers.

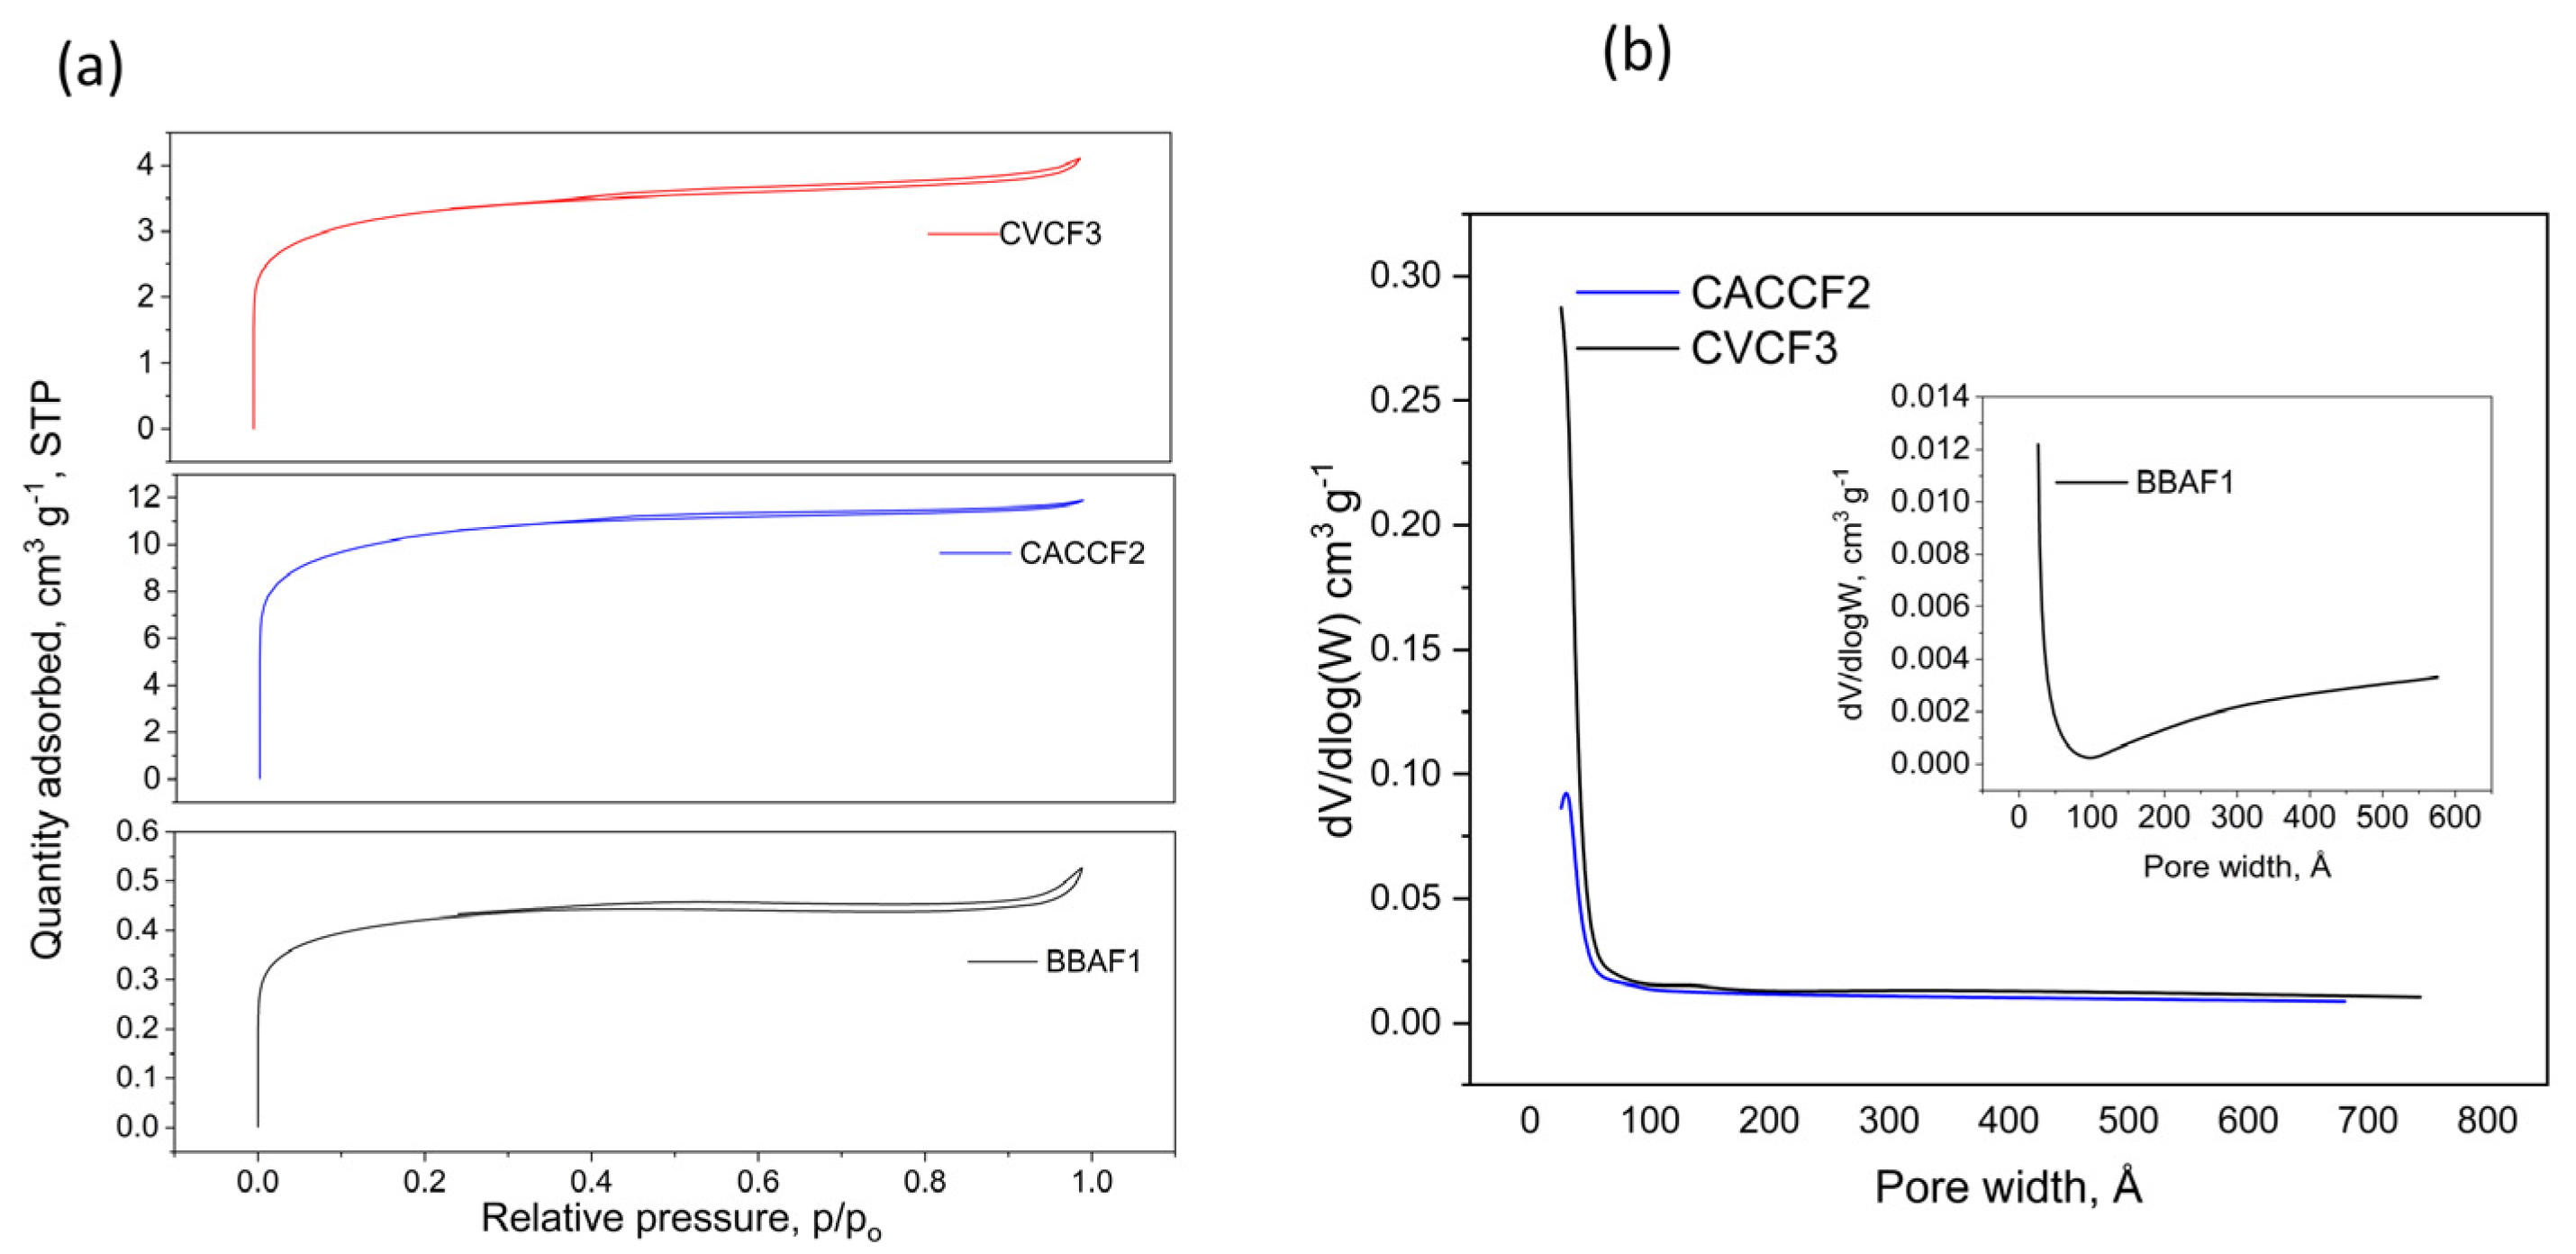
3.2.3. N2 Adsorption Isotherm Results

The results of the textural parameters (Table 4) of the studied carbons indicate well-developed porous structures as reflected by their large SBET (34.70–855.24 m2 g−1), pore diameters, Dp, in the mesopore region (38.3–65.4 Å), large and uniform pore total pore volumes, Vt (0.018–0.409 cm3 g−1), and micropore volumes, Vmic (0.008–0.198 cm3 g−1), which contribute to a significant proportion of the observed surface areas. The highest SBET observed (855.24 m2 g−1) corresponds to the coconut shell carbon (CACCF2), whereas the smallest surface area (34.70 m2 g−1) corresponds to our agave bagasse biochar (BBAF1). As a whole, the micro- and mesoporosity degrees, as reflected by the Vmicro/Vt and Vmeso/Vt ratios, respectively, are comparable in magnitude, with a slight predominance of the mesoporosity degree for the three carbons analyzed: the highest mesoporosity (58.39%) is observed for the coconut shell carbon (CVCF3), and the smallest corresponds to the commercial biochar (CACCF2, 51.44%).
Since the values of parameter C in the BET equation cannot be negative for physical consistency, the values shown in Table 3 represent the corrected data of the isotherms, since the original values obtained from the instrument were negative, and corrections were made to the SBET using the Rouquerol method [39] incorporated in the Microactive V 6.0 software (Micromeritics, Norcross, GA, USA). On the other hand, the N2 adsorption/desorption isotherm data shown in Figure 7a indicate that the isotherms are a combination of types I and II, according to the IUPAC classification [40]. A high degree of microporosity is present in the three samples, as observed in the low-relative-pressure region (p/po ≤ 0.05), which is associated with the filling of micropores. A small but well-defined hysteresis loop is observed in all isotherms, corresponding to the H4 type. This type of hysteresis is often associated with micro–mesoporous carbons [41] and is characteristic of pores with wedge-shaped geometries. The pore size distributions (PSDs) are narrow in the range of 25–50 Å for the CVCF3 and CACCF2 samples (Figure 7b), 25–70 Å for the BBAF1 sample (Figure 7b inset), and monomodal for the three samples.

3.2.4. XRD and ζ-Potential Results

Figure 8a presents the X-ray diffraction (XRD) patterns of the three biochar samples: BBAF1 (derived from agave leaves), CACCF2 (derived from wood), and CVCF3 (derived from coconut shells). All three patterns display broad diffraction features characteristic of amorphous or poorly crystalline carbonaceous materials yet exhibit distinct differences depending on the precursor material. The CACCF2 sample (blue curve), obtained from wood, shows a broad peak centered around 2θ ≈ 23°, along with a sharper peak at ap-proximately 2θ ≈ 27°, which may correspond to the (002) plane of graphitic carbon. The presence of this more defined peak suggests a higher degree of structural ordering or partial graphitization compared to the other samples. Additional small peaks at around 2θ ≈ 15–40° indicate the presence of inorganic crystalline impurities, possibly mineral residues from the biomass. The BBAF1 sample (red curve), derived from agave leaves, shows a broader and less intense peak in the same region, indicating a more amorphous structure with less graphitic ordering. The diffraction pattern exhibits minor features that may correspond to residual salts or minerals naturally present in agave biomass. The CVCF3 sample (black curve), derived from coconut shells, shows the most distinct and sharp diffraction peaks at around 2θ ≈ 20–35°, indicating a higher content of crystalline inorganic phases, such as silica (SiO2), potassium compounds, or calcium salts commonly found in coconut shells. The broader background signals still confirm the presence of amorphous carbon as the main component, but the higher number and intensity of crystalline peaks suggest a lower purity of carbonaceous material or the retention of native minerals after pyrolysis. Overall, the XRD patterns reveal that the structural ordering and mineral content of the biochars are strongly dependent on the feedstock type, with CACCF2 showing the highest degree of carbon ordering and CVCF3 exhibiting significant mineral crystallinity.
The point of zero charge (PZC) of the biochars was determined from ζ-potential measurements as a function of pH, and the results are shown in Figure 8b. The PZC is defined as the pH at which the zeta potential equals zero (ζ = 0 mV), indicating a net neutral surface charge. When the experimental data did not include an exact ζ = 0-point, linear interpolation was applied between two consecutive pH values where ζ-potential changes sign. In this study, the biochar BBAF1 exhibited negative ζ-potentials throughout the entire measured pH range (1–10), indicating that its PZC is <1.0. This suggests a highly acidic surface, likely due to the presence of oxygenated functional groups (–COOH and –OH) generated during the pyrolysis of agave polysaccharides such as inulin and cellulose. The commercial biochar CACCF2 exhibited a PZC of approximately 0.14, also indicative of an acidic surface, though slightly less acidic than BBAF1. The lignin and cellulose content in wood generates acidic groups upon pyrolysis, albeit to a lesser extent than the carbohydrate-rich agave biomass. On the other hand, the biochar CVCF3 showed an estimated PZC of 0.4, indicating a relatively lower surface acidity. This behavior can be attributed to the high lignin and tannin content in coconut shells, which promotes the formation of less functionalized aromatic structures during pyrolysis, resulting in a surface with a lower density of acidic groups. In summary, the surface acidity of the biochars, as inferred from their PZC values, follows the trend BBAF1 > CACCF2 > CVCF3. This trend highlights the influence of the biomass precursor type on the surface functionalization of biochars, allowing for the anticipation of significant differences in their behavior as adsorbents.

3.3. Pollutant Removal from Laguna Bustillos

After the characterization of the LB water sample (Table 1), the efficiency of the biochar in removing conventional pollutants was evaluated by different parameters (COD, NO3, NO2, NH3, NT, PO4, turbidity, color). The results are shown in Table 4. Compared to the data presented in Table 1, on the 15th day, columns 1 and 2 still removed about 50% of the COD, while column 3 was the first one to reach saturation of the material, showing values higher than 414 mg L−1 of COD in the water sample of the LB without any treatment. On the 16th day, all parameters were measured again (Table 5), and it was observed that most of them had increased, proving that the material had reached its saturation point and could no longer adsorb pollutants. The BBAF1 biochar showed a removal rate between 50 and 90% for the different parameters analyzed. In contrast, the controls showed significantly lower removal rates, highlighting the effectiveness of this biochar in adsorbing pollutants.

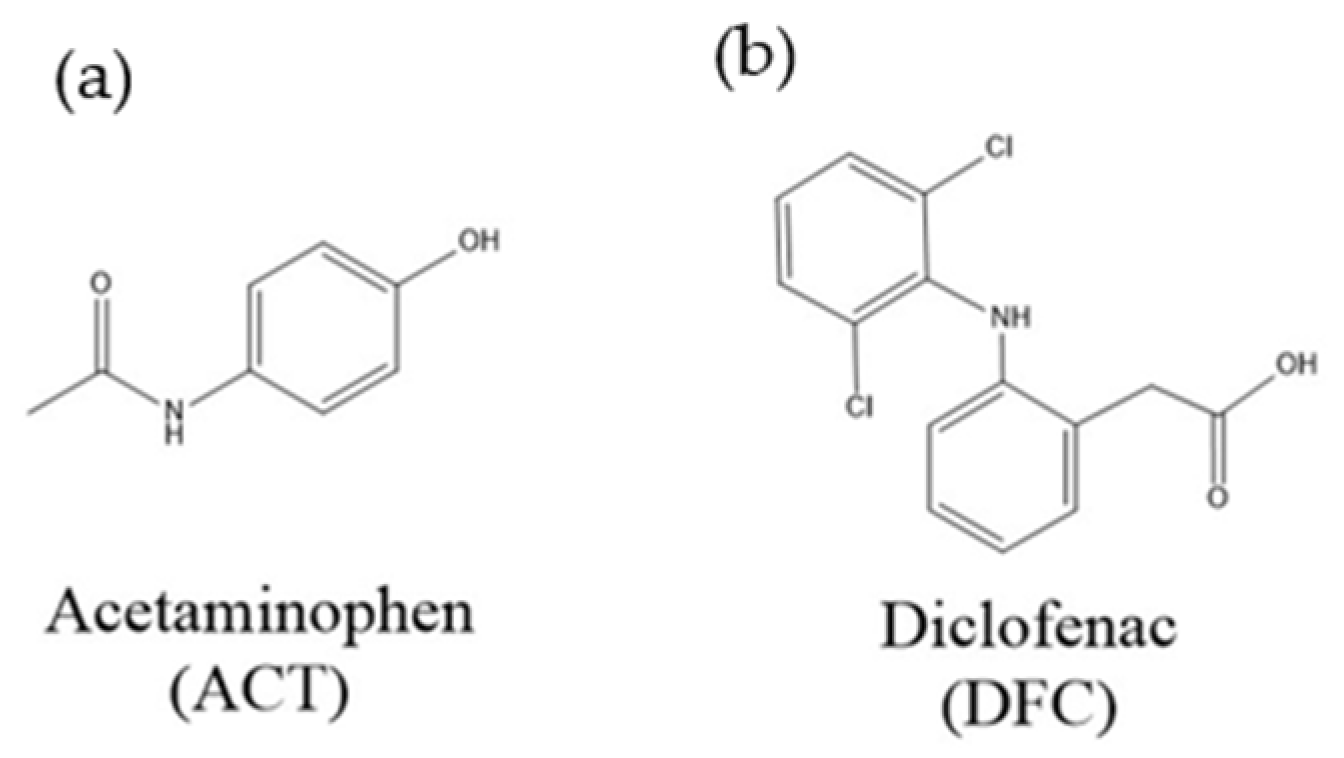
3.4. Act and Dfc Removal in Packed Columns

The adsorption of Act and Dfc reached 60% with biochar, compared to 80% and 40% in controls 2 and 3, respectively. Regarding the pharmaceutical removal obtained in the three filters, the results of the experiments with synthetic solutions of 30 mg/L of Act and Dfc in LB water (sample 19) are shown in Table 6. The three materials showed the removal of both pharmaceutical derivates, with column 2 (CACCF2) achieving the highest adsorption of Act and Dfc, reaching percentages close to 80% for both drugs, followed by the BBAF1 biochar, with 60% for both. It should be noted that both materials (CACCF2 and BBAF1) have remarkably similar characteristics in terms of their composition, since both come from similar raw materials, which could be verified by comparing the FTIR spectra (Figure 5) and the overlapping of the peaks in the same bands. This similarity in composition is probably the reason for their similar behavior in the adsorption of substances. Although both materials have similar characteristics, coconut shell activated carbon is the one that shows the best efficiency in terms of the adsorption of conventional and pharmaceutical contaminants. However, if we consider the large amount of energy used to produce activated carbon, the high temperatures, and even the chemicals used to activate it, the use of agave bagasse biochar is more sustainable because the relatively low temperatures used in the pyrolysis process translates into much lower energy consumption.
Table 7 shows some examples of diverse types of biochar made from different raw materials that have been shown to have good adsorption capacity for different pollutants in water samples. The difference in the removal percentages of organic and inorganic substances can be attributed to the nature of the material from which they were made and the interaction that it has with the pollutant molecules. It has been reported that for the adsorption of ionic species, electrostatic attraction, surface complexation, ion exchange, and co-precipitation have been identified as the dominant adsorption mechanisms. On the other hand, for the adsorption of organic molecules, hydrogen bonding, π-π interaction, and hydrophobic interaction have been dominant [42].

3.5. Potentiometric Titration Results

To identify the surface functional groups of the three biochars responsible for acetaminophen and diclofenac removal in the three columns tested, automated potentiometric titration was used. The raw data obtained from the titrations are plotted as proton binding isotherms (Q vs. pH) for the three biochars (Figure 9a). Positive values for Q (pH) represent proton uptake and negative values indicate proton release, i.e., the more negative the value of Q, the more acidic the sample is. The Q (pH) values for the three samples are all negative, indicating the acidic nature of the carbons and that only proton dissociation reactions occur in the pH range measured (from pH 3.0 to 11.0). A Brønsted acidity characterizes the three samples. Although it is not possible to assign the changes in the slopes observed in the proton binding isotherms to the organic surface functional groups of carbonaceous materials [30,50], it is still possible to identify the groups dissociating at pKa < 7 as carboxylic (-COOH), and those with pKa > 7 as phenolic (Ph-OH) [51]. This means that in the three biochars tested, these groups predominate and the rest are neglected. The proton uptake isotherms show that the surface of the CVCF3 sample is the most acidic, as evidenced by the highest increase in protons released (the highest negative values of Q), followed by the CACCF2 and BBAF1 samples. In this sense, the order of increased acidity is CVCF3 > CACCF2 > BBAF1. This trend is explained by the fact that in a biochar containing carboxyl and phenolic groups (as in BBAF1 and CACCF2, Table 8), the carboxyl groups can partially neutralize the acidity of the phenolic groups and the carboxyl groups can form hydrogen bonds with the phenolic groups and reduce their acidity. In addition, the carboxyl groups can also adsorb some of the protons that would otherwise be released by the phenolic groups, thereby reducing the acidity of the biochar. On the other hand, in the biochar with phenolic groups (CVCF3, Table 6), there are no carboxyl groups to neutralize the acidity of the phenolic groups, which means that phenolic groups can more easily release protons, thus increasing the acidity of the biochar [52].
Deconvolution of the proton uptake isotherms using the SAIEUS method produces the f(pK) curves shown in Figure 9b. The areas under the curves indicate the number of groups of the strength groups assigned by the pKa value of a given peak. The values of the acid constants, pKa, i.e., the exact position of the peaks, the number of groups formed by a particular peak, and the other parameters are given in Table 7. The total number of groups determined on the surfaces of the BBAF1, CACCF2, and CVCF3 samples is 1.02, 0.16, and 0.32 mmol g−1, respectively. These results indicate the carbons’ surface reactivity variation for the tested pharmaceuticals. On the other hand, for the BBAF1 carbon, three proton equilibria are detected from the pKa distributions, two in the strong acid range due to carboxyls (pKa 5.54 and pKa 6.73) and one in the basic range due to phenols (pKa 9.91); the CACCF2 sample shows a distinct picture with two proton equilibria detected, one in the acidic range due to carboxyl (pKa 6.3) and the other one in the neutral range attributed to phenols (pKa 7.6); the CVCF3 sample shows only one proton equilibrium in the basic range (pKa 9.16). The results obtained from the potentiometric titrations suggest that the surface chemistry of carbons plays a key role in the removal of the two pharmaceuticals tested, as discussed below.

3.6. Act and Dfc Removal

The initial pH of the Act solution was 7.30. When this solution was contacted with the carbons in the three columns, different scenarios were obtained. Using the Henderson–Hasselbalch equation, it was possible to obtain the corresponding amounts of each functional group of the three carbons for the corresponding pKa values, as shown in Table 8. In the case of the BBAF1 sample (column 1), at this pH, the carboxyl groups on the surface of this sample exist as neutral and negative species, carboxylate (-COO-, 98.3% for pKa 5.54 and 78.3% for pKa 6.73) and carboxylic acid (-COOH, 1.7% for pKa 5.54 and 21.3% for pKa 6.73), while the phenolic groups are present as phenolates (-PhO-, 0.25% for pKa 9.91) and neutral phenols (-PhOH, 99.75% for pKa 9.91). This sample shows the highest number of total negative charges (177.25%) generated by the carboxyl groups compared to those in CACCF2 (column 2). Despite this fact, the CACCF2 sample is the one that removed the highest amount of acetaminophen (85%, Table 6). These differences are explained by the fact that the CACCF2 sample contains the highest number of deprotonated phenolic groups (PhO-, 33.3% for pKa 7.6), compared to the other two biochars (0.25% for BBAF1 and 1.4% for CVCF3). It is known that deprotonated phenolic groups are more reactive than deprotonated carboxylic groups because the former exhibit greater charge density, greater stabilization, less steric hindrance, and greater basicity (March and Smith 2007) [53]. In the case of the CVCF3 sample, there are no carboxyl groups present, and most of the functional groups are neutral phenols (PhOH, 96.61% for pKa 9.16). The lower acetaminophen removal (48% Table 6) compared to those in BBAF1(59% Table 6) and CACCF2 (85% Table 6) is attributed to the fact that carboxyl groups are not present in this sample, and the CVCF3–acetaminophen association takes place mainly through the phenolate groups of CVCF3 and the neutral phenols of Act, despite the low amount of these phenolate groups (3.39%). In the case of Dfc, the removal trends are the same as for Act for the three biochar samples, except that the amounts of each functional group (%) are slightly different from those of Act due to the different pKa values of each functional group (Table 9). The condensation reactions between the carboxyl groups and the phenolic groups are the same as for Act.
To understand the association of Act/Dfc with the surfaces of the three biochar samples, a chemical species distribution plot was generated using the MINEQL+ V 4.6 software [54]. The calculations used a pKa of 9.5 for Act and a pKa of 4.2 for Dfc [55,56]. The results of these calculations (Figure 10a) indicate that at pH 7.30, acetaminophen predominates as the neutrally charged species, Act, with ~97% total mass, and a small amount of the negatively charged species, Act-, is present with only ~3% total mass. Consequently, the reaction between the neutral phenolic groups (PhOH) of Act and the negative carboxyl groups (-COO-) of the BBAF1 and CACCF2 samples produces a condensation reaction in which the product is an ester, as shown in Figure 11a [53]. The reaction between the neutral phenol groups of the BBAF1 and CACCF2 samples and the neutral phenol groups of Act does not produce a specific product because neutral phenols are not reactive with each other under these conditions. In the case of Dfc, the negatively charged species, Dfc -, predominate at pH 7.70 with ~99.9% total mass (Figure 10b) and the negative charge is generated by the carboxylate groups (Figure 11b). When the negatively charged carboxyl groups of Dfc - react with (a) the neutral and deprotonated carboxyl groups of samples BBAF1 and CACCF2, (b) the deprotonated phenols (PhO-), and the neutrally charged phenols (PhOH) of samples BBAF1, CACCF2, and CVCF3, an ester is obtained in all cases [4,53].

4. Discussion

The adsorption of contaminants by biochars is influenced by a complex interplay of physicochemical factors, including surface charge, background ionic composition, and the molecular structure of the target pollutants. In this study, a synthesized biochar (BBAF1) and two commercial biochars (CACCF2 and CVCF3) were tested for their ability to remove contaminants from water collected from the Bustillos Lagoon (Mexico), as well as two emerging organic contaminants—acetaminophen and diclofenac—from aqueous solutions. All three biochars exhibited extremely low points of zero charge (PZC): BBAF1 < 1.0, CACCF2 = 0.14, and CVCF3 = 0.4. These values indicate that under typical environmental pH conditions (6–8), the biochar surfaces are predominantly negatively charged. This electrostatic environment would, in principle, favor the adsorption of cationic species and hinder the uptake of anionic contaminants such as diclofenac, which exists primarily in anionic form at circumneutral pH. However, the experimental results showed a substantial adsorption of both acetaminophen and diclofenac, suggesting that electrostatic repulsion is not the dominant mechanism governing removal. Instead, several other interactions appear to play a significant role. π–π interactions: Both acetaminophen and diclofenac possess aromatic structures capable of engaging in π–π stacking with the graphitic domains of biochars. These non-electrostatic interactions are particularly relevant in highly carbonized biochars such as CVCF3. Hydrogen bonding: Functional groups on the biochar surface (e.g., hydroxyl, carbonyl, carboxyl) can form hydrogen bonds with the amide, hydroxyl, or carboxylic acid groups present in acetaminophen and diclofenac, enhancing their retention on the adsorbent surface. Cation bridging: Divalent cations (e.g., Ca2+, Mg2+) present in natural waters may serve as electrostatic bridges between the negatively charged biochar surface and the anionic forms of the contaminants, facilitating adsorption even in the presence of repulsive forces. Specific interactions with surface functional groups: Particularly in the case of BBAF1, which derives from plant biomass and retains oxygen-containing functionalities, surface complexation with polar or partially ionized species may contribute to adsorption despite electrostatic repulsion. Moreover, background anions (e.g., SO42−, NO3, Cl) and monovalent cations (e.g., Na+, K+) can compete with contaminants for adsorption sites or shield surface charges, slightly reducing removal efficiency. Among the three materials, CVCF3 demonstrated the most stable adsorption performance under ionic interference, likely due to its high surface area, structural uniformity, and enhanced hydrophobicity. BBAF1, by contrast, showed higher sensitivity to multivalent cations and background electrolyte composition, reflecting its greater surface polarity and functional group density. While electrostatic interactions are often considered primary determinants of adsorption, the observed removal of acetaminophen and diclofenac by negatively charged biochars emphasizes the importance of non-electrostatic mechanisms. These findings underscore the multifactorial nature of adsorption processes and the need to consider real water chemistry when evaluating biochar performance for the removal of emerging organic pollutants.

5. Conclusions

Agave bagasse biochar (BBAF1) has been identified as a potentially effective adsorbent for the removal of pollutants from contaminated lagoon water samples, exhibiting removal efficiencies approaching 50% for all parameters examined. The high adsorption capacity of this material can be attributed to the porosity and specific surface area developed during the pyrolysis process. The XRD patterns indicate that both the degree of structural organization and the mineral composition of the biochars are closely influenced by the nature of the original biomass. The role of the surface chemistry of the three biochars in the removal of two popular pharmaceuticals (Act and Dfc) was revealed by potentiometric titrations and the ζ-potential measurements, indicating that the degree of surface acidity of the biochars played a significant role in the removal of these pharmaceuticals. A possible uptake mechanism was proposed in which the carboxylic and phenolic surface groups interacted with both Act and Dfc. The findings indicate that the agave biochar BBAF1 has the potential to serve as a viable and sustainable solution for enhancing water quality in aquatic environments, and a comparison with controls demonstrated that the biochar exhibited significantly superior performance compared to conventional treatment methods.

Author Contributions

All authors contributed to the study conception and design. Material preparation and data collection and analysis were performed by W.N.M.-E. and S.G.-S. The first draft of the manuscript was written by W.N.M.-E. and all authors commented on previous versions of the manuscript. All authors have read and agreed to the published version of the manuscript.

Funding

This research was funded by Proyect FGRA.A.033 y A.466: “Manejo Integral de la Cuenca Laguna de Bustillos: Etapa I: remediación de la contaminación de la LB, reforestación y restauración de suelo de cabecera; Etapa II, manejo sustentable de las aguas superficiales y subterráneas en la laguna de Bustillos y el Acuífero de Cuauhtémoc, Chihuahua”, Consejo Nacional de Humanidades, Ciencias y Tecnologías (CONAHCYT), Departamento de Ingeniería Química, Universidad de Guadalajara-CUCEI. Centro de Investigación y Asistencia en Tecnología y Diseño del Estado de Jalisco (CIATEJ) y Centro de Investigación en Materiales Avanzados, S.C. (CIMAV), Chihuahua, México.

Data Availability Statement

The raw data supporting the conclusions of this article will be made available by the authors on request.

Acknowledgments

(1) Unidad de Tecnología Ambiental, Centro de Investigación y Asistencia en Tecnología y Diseño del Estado de Jalisco (CIATEJ). (2) Centro de Investigación en Materiales Avanzados, S.C. (CIMAV), Chihuahua, México. (3) Departamento de Ingeniería Química, Universidad de Guadalajara-CUCEI. (4) Proyect FGRA A.466. (5) Víctor Manuel Reyes Gómez and Technician Hugo Alberto Fuentes Hernández of Red Ambiente y Sustentabilidad del INECOL-Chihuahua, for their support in the logistics of water sampling in LB, water quality measurement and purchase of reagents.

Conflicts of Interest

The authors declare no conflicts of interest.

Abbreviations

The following abbreviations are used in this manuscript:
ActAcetaminophen
DfcDiclofenac
BBAF1Biochar Bagasse Agave Filter 1
CACCF2Coconut Shell Activated Carbon Filter 2
CVCF3Comercial Vegetable Carbon Filter 3
NO3Nitrates
NO2Nitrites
NH3Ammonia
TNTotal Nitrogen
CODChemical Oxygen Demand
TP Total Phosphorus
PO4Phosphate
LBBustillos Lagoon
kmKilometer
LLiter
FTUFormazin Turbidity Units
PtCoPlatinum-Cobalt scale
pHPotential of hydrogen
UV-Visultraviolet and visible
SEMScanning Electron Microscope
PaPascal
SESecondary electron
BSE-COMPBackscattered electron
FTIR-ATRFourier transform infrared attenuated total reflection spectra
BETBrunauer–Emmett–Teller
CO2Carbon dioxide
BJHBarret-Joyner-Halenda
N Normality
MMolarity
NaNO3Sodium Nitrate
HNO3Nitric Acid
ÅAngstrom

References

  1. The United Nations World Water Development Report 2020: Water and Climate Change. Available online: https://unesdoc.unesco.org/ark:/48223/pf0000372985.locale=en (accessed on 5 November 2024).
  2. Wang, X.; Liu, J.; Yu, Z.; Li, Y. Functionalized carbon-based nanomaterials for wastewater treatment. Mater. Adv. 2021, 2, 31–49. [Google Scholar]
  3. Feng, Y.; Zhang, J.; Zhao, W. Carbon-based adsorbents for emerging contaminant removal from water: Recent advances and prospects. Environ. Chem. Eng. 2024, 12. [Google Scholar]
  4. You, X.; Liu, M.; Chen, X.; Li, Y.; Yang, Y. Mechanistic insight into the simultaneous removal of Cr(VI) and phosphate by a novel versatile bimetallic material. J. Environ. Chem. Eng. 2024, 12. [Google Scholar] [CrossRef]
  5. Sabzehmeidani, M.M.; Mahnaee, S.; Ghaedi, M.; Heidari, H.; Roy, V.A.L. Carbon based materials: A review of adsorbents for inorganic and organic compounds. Mater. Adv. 2021, 2, 598–627. [Google Scholar] [CrossRef]
  6. Cui, J.; Zhang, F.; Li, H.; Cui, J.; Ren, Y.; Yu, X. Recent Progress in Biochar-Based Photocatalysts for Wastewater Treatment: Synthesis, Mechanisms, and Applications. Appl. Sci. 2020, 10, 1019. [Google Scholar] [CrossRef]
  7. Cevallos-Mendoza, J.; Amorim, C.G.; Rodríguez-Díaz, J.M.; Montenegro, M.d.C.B.S.M. Removal of Contaminants from Water by Membrane Filtration: A Review. Membranes 2022, 12, 570. [Google Scholar] [CrossRef]
  8. Saadi, W.; Ruiz, B.; Najar-Souissi, S.; Ouederni, A.; Fuente, E. High-pressure gas adsorption on activated carbons from pomegranate peels biochar: A promising approach for biogas purification. Biomass Bioenergy 2024, 186, 107258. [Google Scholar] [CrossRef]
  9. Wang, S.; Peng, Y. Natural zeolites as effective adsorbents in water and wastewater treatment. Chem. Eng. J. 2010, 156, 11–24. [Google Scholar] [CrossRef]
  10. Yalasangi, V.; Mayilswamy, N.; Kandasubramanian, B. Biochar-derived adsorbents for removal of Rhodamine B from wastewater. Bioresour. Technol. Rep. 2024, 28, 101987. [Google Scholar] [CrossRef]
  11. Lehmann, J.; Joseph, S. Biochar for environmental management: Science, technology and implementation. In Biochar for Environmental Management, 3rd ed.; Lehmann, J., Joseph, S., Eds.; Routledge: London, UK, 2024; pp. 222–591. [Google Scholar]
  12. García, A.P.G.; Hernández, S.C.; Jiménez, L.D. Agave lechuguilla waste can be applied as biochar-adsorbent to remove arsenic from water. Int. J. Environ. Sci. Technol. 2024, 22, 9193–9208. [Google Scholar] [CrossRef]
  13. Ahmad, M.; Rajapaksha, A.U.; Lim, J.E.; Zhang, M.; Bolan, N.; Mohan, D.; Vithanage, M.; Lee, S.S.; Ok, Y.S. Biochar as a sorbent for contaminant management in soil and water: A review. Chemosphere 2014, 99, 19–33. [Google Scholar] [CrossRef] [PubMed]
  14. Mohan, D.; Kumar, H.; Sarswat, A.; Alexandre-Franco, M.; Pittman, C.U., Jr. Cadmium and lead remediation using magnetic oak wood and oak bark fast pyrolysis bio-chars. Chem. Eng. J. 2014, 236, 513–528. [Google Scholar] [CrossRef]
  15. Ioannidou, O.; Zabaniotou, A. Agricultural residues as precursors for activated carbon production—A review. Renew. Sustain. Energy Rev. 2007, 11, 1966–2005. [Google Scholar] [CrossRef]
  16. Zhang, M.; Gao, B.; Yao, Y.; Xue, Y.; Inyang, M. Synthesis of porous MgO-biochar nanocomposites for removal of phosphate and nitrate from aqueous solutions. Chem. Eng. J. 2017, 210, 26–32. [Google Scholar] [CrossRef]
  17. Tran, N.H.; Reinhard, M.; Gin, K.Y.-H. Occurrence and fate of emerging contaminants in municipal wastewater treatment plants from different geographical regions-a review. Water Res. 2018, 133, 182–207. [Google Scholar] [CrossRef]
  18. Thomas, H.; Cavalcante, J.D.N.; Araújo, P.C.E.; Silvino, D.S.E.; Perin, G.F.; da Silva, R.L.A.; Torres, S.A.; Cezar, M.R.S.; Dutra, D.E. Valorization of lignocellulosic agave residues via pyrolysis and its use as adsorbent for methylene blue removal. Biomass Conv. Bioref. 2024, 15, 6743–6756. [Google Scholar] [CrossRef]
  19. Salcedo-Chitica, A. Assessment of the Eutrophication Status in Laguna de Bustillos, Anáhuac, Mexico; Geological Engineering, Autonomous University of Chihuahua: Chihuahua, Mexico, 2015. [Google Scholar]
  20. CONABIO – AvesMX. 2015. Available online: https://avesmx.conabio.gob.mx/AICA.html (accessed on 1 November 2024).
  21. Vidal, R.; Berlanga, H.; Del Coro Arizmendi, M. Important Bird Areas Americas—Priority sites for biodiversity conservation. BirdLife International (BirdLife Conservation Series No.16). Quito, Ecuador. Available online: https://www.researchgate.net/publication/343558933_Important_bird_areas_Americas_-_Priority_sites_for_biodiversity_conser-vation_BirdLife_International_BirdLife_Conservation_Series_No_16_Quito_Ecuador#fullTextFileContent (accessed on 4 June 2025).
  22. Rubio-Arias, H.; Saucedo, R.A.; Lara, C.R.; Wood, K.; Jiménez, J. Water quality in the Laguna de Bustillos of Chihuahua, México. WIT Trans. Ecol. Environ. 2005, 80, 155–160. [Google Scholar]
  23. Quintana, M.R.M.; Soto, C.G.; Rubio, A.H.; Espinoza, P.J.R.; Holguín, L.C.; Camarillo, A.J. Evaluation of physicochemical parameters and metal content in sediments of the Laguna de Bustillos in Chihuahua. Sci. Front. UACJ Sci. Technol. Mag. 2014, 12, 37–45. [Google Scholar]
  24. Ochoa-Rivero, J.M.; Reyes-Fierro, A.V.; Peralta-Pérez, M.D.R.; de la Serna, F.J.Z.-D.; Ballinas-Casarrubias, L.; Salmerón, I.; Rubio-Arias, H.; Rocha-Gutiérrez, B.A. Levels and Distribution of Pollutants in the Waters of an Aquatic Ecosystem in Northern Mexico. Int. J. Environ. Res. Public Health 2017, 14, 456. [Google Scholar] [CrossRef]
  25. Peña, L.; Torres, M.; Alatorre, L.; Sáenz, A.; Aguilar, S.A.; Sánchez-Flores, E. Land use changes and impacts on runoff in a watershed in Chihuahua, Mexico: Modeling from a hydrofunctional perspective. In Investigación Interdisciplinaria una Mirada Desde el Norte de México, 2015; Chávez, J., Olivas, I.R.Á., Eds.; Universidad Autónoma de Ciudad Juárez: Chihuahua, México, 2015. [Google Scholar]
  26. Rice, E.W.; Baird, R.B.; Eaton, A.D. Standard Methods for the Examination of Water and Wastewater, 23rd ed.; American Public Health Association: Washington, DC, USA, 2017. [Google Scholar]
  27. López-Covarrubias, M.; Aguilar-Juárez, O. Treatment of tequila vinasses using biochar derived from agave bagasse. Trends Renew. Energy Sustain. (TERYS) 2023, 2, 327–333. [Google Scholar]
  28. Davies, C.W. Ion Association; Butterworths: London, UK, 1962; pp. 37–53. [Google Scholar]
  29. Jagiełło, J.; Bandosz, T.; Schwarz, J. Carbon surface characterization in terms of its acidity constant distribution. Carbon 1994, 32, 1026–1028. [Google Scholar] [CrossRef]
  30. Jagiello, J. Stable numerical solution of the adsorption integral equation using splines. Langmuir 1994, 10, 2778–2785. [Google Scholar] [CrossRef]
  31. Hidalgo-Reyes, M.; Caballero-Caballero, M.; Hernández-Gómez, L.H.; Urriolagoitia-Calderón, G. Chemical and morphological characterization of Agave angustifolia bagasse fibers. Botanical Sci. 2015, 93(4), 807–817. [Google Scholar] [CrossRef]
  32. Application of magnetic biochar derived from sugarcane bagasse in water treatment. In Water Reuse Desalination; IWA Publishing: London, UK, 2022; Volume 14, pp. 613–625.
  33. MedCrave (online). Biochar from sugarcane bagasse for reactive dye adsorption considering a circular economy approach. Eng. Fash. Technol. 2020, 6, 65–70. [Google Scholar]
  34. Hernández-Ramírez, J.; Salazar-Rábago, J.J.; Labrada-Delgado, G.J.; Aragón-Piña, A. Evaluación de la capacidad adsorbente del biocarbón producido a partir de hojas de agave. Rev. Int. Contam. Ambient. 2020, 36, 79–91. [Google Scholar]
  35. Janu, R.; Mrlik, V.; Ribitsch, D.; Hofman, J.; Sedláček, P.; Bielská, L.; Soja, G. Biochar surface functional groups as affected by biomass feedstock, biochar composition and pyrolysis temperature. Carbon Resour. Convers. 2021, 4, 36–46. [Google Scholar] [CrossRef]
  36. Chia, C.H.; Gong, B.; Joseph, S.D.; Marjo, C.E.; Munroe, P.; Rich, A.M. Imaging of mineral-enriched biochar by FTIR, Raman and SEM–EDX. Vib. Spectrosc. 2012, 62, 248–257. [Google Scholar] [CrossRef]
  37. Granados, P.; Mireles, S.; Pereira, E.; Cheng, C.-L.; Kang, J.J. Effects of Biochar Production Methods and Biomass Types on Lead Removal from Aqueous Solution. Appl. Sci. 2022, 12, 5040. [Google Scholar] [CrossRef]
  38. Bavariani, M.Z.; Ronaghi, A.; Ghasemi, R. Influence of Pyrolysis Temperatures on FTIR Analysis, Nutrient Bioavailability, and Agricultural use of Poultry Manure Biochars. Commun. Soil Sci. Plant Anal. 2019, 50, 402–411. [Google Scholar] [CrossRef]
  39. Armynah, B.; Atika; Djafar, Z.; Piarah, W.H.; Tahir, D. Analysis of Chemical and Physical Properties of Biochar from Rice Husk Biomass. J. Phys. Conf. Ser 2018, 979, 012038. [Google Scholar] [CrossRef]
  40. Rouquerol, J.; Llewellyn, P.; Rouquerol, F. Is the bet equation applicable to microporous adsorbents? Stud. Surf. Sci. Catal. 2007, 160, 49–56. [Google Scholar] [CrossRef]
  41. Thommes, M.; Kaneko, K.; Neimark, A.V.; Olivier, J.P.; Rodriguez-Reinoso, F.; Rouquerol, J.; Sing, K.S.W. Physisorption of gases, with special reference to the evaluation of surface area and pore size distribution (IUPAC Technical Report). Pure Appl. Chem. 2015, 87, 1051–1069. [Google Scholar] [CrossRef]
  42. Barquilha, C.E.; Braga, M.C. Adsorption of organic and inorganic pollutants onto biochars: Challenges, operating conditions, and mechanisms. Bioresour. Technol. Rep. 2021, 15, 100728. [Google Scholar] [CrossRef]
  43. Yang, J.; Wei, Q.; Li, D.; Yu, J.; Cai, Z. Study on adsorption performance of manganese titanium oxide composite biochar for removal of Rhodamine B. J. Indian Chem. Soc. 2023, 100, 100958. [Google Scholar] [CrossRef]
  44. Van Thinh, N.; Yusuke, S.; Tu, P.H.; Kuwahara, Y. Novel co-doped iron oxide and graphitic carbon nanosheets on biochar for arsenite removal from contaminated water: Synthesis, applicability and mechanism. Bioresour. Technol. Rep. 2022, 17, 100929. [Google Scholar] [CrossRef]
  45. Siqueira, T.C.A.; da Silva, I.Z.; Rubio, A.J.; Bergamasco, R.; Gasparotto, F.; Paccola, E.A.d.S.; Yamaguchi, N.U. Sugarcane Bagasse as an Efficient Biosorbent for Methylene Blue Removal: Kinetics, Isotherms and Thermodynamics. Int. J. Environ. Res. Public Health 2020, 17, 526. [Google Scholar] [CrossRef]
  46. Lin, L.; Qiu, W.; Wang, D.; Huang, Q.; Song, Z.; Chau, H.W. Arsenic removal in aqueous solution by a novel Fe-Mn modified biochar composite: Characterization and mechanism. Ecotoxicol. Environ. Saf. 2017, 144, 514–521. [Google Scholar] [CrossRef]
  47. Hu, Y.; Zhu, Y.; Zhang, Y.; Lin, T.; Zeng, G.; Zhang, S.; Wang, Y.; He, W.; Zhang, M.; Long, H. An efficient adsorbent: Simultaneous activated and magnetic ZnO doped biochar derived from camphor leaves for ciprofloxacin adsorption. Bioresour. Technol. 2019, 288, 121511. [Google Scholar] [CrossRef]
  48. Ocampo-Perez, R.; Padilla-Ortega, E.; Medellin-Castillo, N.; Coronado-Oyarvide, P.; Aguilar-Madera, C.; Segovia-Sandoval, S.; Flores-Ramírez, R.; Parra-Marfil, A. Synthesis of biochar from chili seeds and its application to remove ibuprofen from water. Equilibrium and 3D modeling. Sci. Total Environ. 2019, 655, 1397–1408. [Google Scholar] [CrossRef]
  49. Beyan, S.M.; Prabhu, S.V.; Sissay, T.T.; Getahun, A.A. Sugarcane bagasse based activated carbon preparation and its adsorption efficacy on removal of BOD and COD from textile effluents: RSM based modeling, optimization and kinetic aspects. Bioresour. Technol. Rep. 2021, 14, 100664. [Google Scholar] [CrossRef]
  50. Salame, I.I.; Bandosz, T.J. Comparison of the Surface Features of Two Wood-Based Activated Carbons. Ind. Eng. Chem. Res. 2000, 39, 301–306. [Google Scholar] [CrossRef]
  51. Bandosz, T.J.; Jagiello, J.; Contescu, C.; Schwarz, J.A. Characterization of the surfaces of activated carbons in terms of their acidity constant distributions. Carbon 1993, 31, 1193–1202. [Google Scholar] [CrossRef]
  52. Bandosz, T.J. Surface chemistry of carbon materials. In Carbon Materials for Catalysis; Serp, P., Figueiredo, J.L., Eds.; John Wiley & Sons, Inc.: Hoboken, NJ, USA, 2008. [Google Scholar]
  53. March, J.; Smith, M. Organic Chemistry, 6th ed.; J. Wiley and Sons, Inc.: Hoboken, NJ, USA, 2007. [Google Scholar]
  54. Schecher, W.D.; McAvoy, D.C. MINEQL+ V5.0: A Chemical Equilibrium Program for Personal Computers; Procter & Gamble Company: Cincinnati, OH, USA, 2023. [Google Scholar]
  55. Prescott, L.F. Kinetics and metabolism of paracetamol and phenacetin. Br. J. Clin. Pharmac. 1980, 10, 2915–2985. [Google Scholar] [CrossRef] [PubMed]
  56. Settimo, L.; Bellman, K.; Knegtel, R.M.A. Comparison of the Accuracy of Experimental and Predicted pKa Values of Basic and Acidic Compounds. Pharm. Res. 2013, 31, 1082–1095. [Google Scholar] [CrossRef]
Figure 1. Molecular structure of (a) acetaminophen and (b) diclofenac.
Processes 13 01861 g001
Figure 3. Biochar synthesis process.
Processes 13 01861 g003
Figure 4. Three-column setup for LB water treatment.
Processes 13 01861 g004
Figure 5. SEM images of biochars (a) BBAF1, (b) CACCF2, and (c) CVCF3. The blue line represents a scale of 200 µm.
Processes 13 01861 g005
Figure 6. FTIR spectra of the BBAF1, CACCF2, and CVCF3 biochars.
Processes 13 01861 g006
Figure 7. (a) N2 adsorption/desorption isotherms for the three biochar samples BBAF1, CACCF2, and CVCF3. (b) Pore size distributions for the three biochar samples BBAF1, CACCF2, and CVCF3 obtained by the BJH method.
Processes 13 01861 g007
Figure 8. (a) XRD pattern of the three biochars characterized in this study. (b) ζ-potential results of the three biochars.
Processes 13 01861 g008
Figure 9. Potentiometric titration results of the three biochar samples. (a) Proton binding isotherms Q(pH). (b) Proton affinity distributions obtained by the SAIEUS method; the curves were shifted for clarity.
Processes 13 01861 g009
Figure 10. Species distribution diagrams of (a) acetaminophen and (b) diclofenac.
Processes 13 01861 g010
Figure 11. Possible removal mechanism of two pharmaceuticals by the three biochars, BBAF1, CACCF2, and CVCF3: (a) Act, (b) Dfc.
Processes 13 01861 g011
Table 1. Composition of the LB water sample 19.
ParameterConcentration
(mg L−1)
ParameterConcentration
(mg L−1)
ParameterConcentration
(mg L−1)
COD414NO20.139Turbidity214 FTU
NO31.3PO46.1Apparent Color646 PtCo
NH32.2NT8.63True color18 PtCo
pH7.8
Table 2. Recovery percentage of the BBAF1 sample during the synthesis process.
Temperature (°C)Pyrolysis Time
(min)
Initial Weight (g)Final Weight
(g)
Recovery Percentage (%)
2501515.78.453.5
2502513.56.850.3
2503019.38.242.4
3001515.17.750.9
Table 3. Comparative SEM morphology of biochars derived from bagasse.
SampleFeedstockPyrolysis ConditionsMorphology DescriptionReference
BBAF1Agave tequilana Weber bagasse250 °C,
20 min
Fibrous structure derived from cellulose chains in agave cores; moderate surface porosity with visible microcavities.This study
Biochar from Agave angustifoliaAgave angustifolia bagasse400 °C
1 h
Rough surface with heterogeneous porosity; partial preservation of fibrous structure.[31]
Magnetic biochar from sugarcane bagasseSugarcane bagasse500 °C,
2 h
Highly porous surface with lamellar structures; pore formation due to multicellular thermal degradation.[32]
Activated biochar from sugarcane bagasseSugarcane bagasse600 °C,
1.5 h
Presence of microtubes (0.6–1.0 µm) and cavities <0.5 µm; highly porous, enhancing adsorption.[33]
Biochar from agave leavesAgave spp. leaves400 °C, 1 hPorous structure with wide pore size distribution (0.01–300 µm); porosity results from volatile component loss.[34]
Table 4. Results of textural parameters of the BABF1, CACCF2, and CVCF3 biochars studied in this work.
SampleSBET
(m2 g−1)
CBETPore Size, Dp (Å)Vt
(cm3 g−1)
Vmic
(cm3 g−1)
Vmeso a
(cm3 g−1)
Vmic/Vt
%
Vmeso/Vt
%
Sexto
(m2 g−1)
Smic
(m2 g−1)
BBAF134.70 ± 0.141410.065.40.0180.0080.00945.5654.2914.2420.45
CACCF2855.24 ± 6.721042.838.30.4090.1980.21148.5551.44374.43480.81
CVCF3269.35 ± 3.88689.5848.30.1390.0580.08142.0458.39127.36141.98
a Vmeso was calculated as the difference between the total volume of pores (Vt) and micropore volume (Vmic).
Table 5. Measurements of all parameters of conventional pollutant removal by the three biochars over the course of 16 days.
DayColumn
No.
Parameter
CODNO3NO2NH3NTPO4TurbidityApparent ColorTrue Color
112170.80.0480.3422.644.28.916018
22200.60.039----2.935.9184915
33080.70.048----3.35.9228319
211380.70.044----2.834.347.4212019
22020.70.043----3.146.14.45010
33912.10.057----5.317.22513613
311850.6340.0320.2463.451.532.036215
22890.620.0360.2722.943.892.793712
33080.8770.0650.1954.948.425.920215
411930.990.028----3.212.522.97213
22060.5490.04----3.536.172.058218
32130.6730.099----19.121.6391819
511910.6640.03----4.062.773.457415
22110.4290.037----4.116.683.144219
33090.8440.097----8.28.175025426
612350.8610.2041.10.9843.13.226517
22300.4240.0932.12.485.913.045113
34010.6670.0713.075.6311.34429322
1613841.10.1441.928.354.19.28825
22990.6330.0971.028.113.38.17321
39010.9210.1064.5310.35.76614233
Table 6. Act and Dfc removal percentages in the three columns tested.
PharmaceuticalpHRemoval mg g−1 (% in Parenthesis)
Column 1Column 2Column 3
Act7.30.506 (59)0.67 (85)0.43 (48)
Dfc7.70.549 (64)0.624 (79)0.342 (37)
Table 7. Adsorption of different contaminants onto biochars.
FeedstockAdsorbateAdsorption Capacity, mg g−1Reference
Banana peel biochar Rhodamine B 19.06 [43]
Co-doped Fe2O3 and graphitic carbon nanosheets on biocharArsenite 49.2 [44]
Sugar cane bagasseMethylene blue9.41 [45]
Corn straws As (III)2.9–8.3 [46]
Camphor leavesCiprofloxacin379.7 [47]
Chili seedsIbuprofen12.8–26.1 [48]
Sugarcane bagasse-based activated carbonDQO884 [49]
Agave bagasse biocharAct and Dfc0.67 and 0.62, respectivelyThis work
Agave bagasse biocharDQO5.91 This work
Table 8. Results of potentiometric titration parameters of the BBAF1, CACCF2, and CVCF3 biochar samples.
SamplepKaAssignmentContent of Groups, mmol/gLigand Density/nm2
BBAF15.54Carboxyls0.172.95
6.73Carboxyls0.23.47
9.91OHs0.6511.28
CACCF26.3Carboxyls0.050.03
7.6OHs0.110.07
CVCF39.16OHs0.320.71
Table 9. Results of the amounts of individual functional groups (%) and the total amounts of negative and neutral groups (%) present in the three biochar samples when contacted with the acetaminophen and diclofenac solutions.
Sample/Functional GrouppKaIndividual Functional Group Contents, % aTotal %
-COO--COOHPhO-PhOHNegative Functional GroupsNeutral Functional Groups
Act initial solution pH = 7.30
BBAF1
Carboxyls5.5498.31.7----177.25101.45
Carboxyls6.7378.721.3----
OH9.91----0.2599.75
CACCF2
Carboxyls6.390.99.1----124.275.8
OH7.6----33.366.7
CVCF3
OH9.16----1.498.61.498.6
Dfc initial solution pH = 7.70
BBAF1
Carboxyls5.5499.310.69----190.22109.78
Carboxyls6.7390.39.7----
OH9.91----0.6199.39
CACCF2
Carboxyls6.396.153.85----152.0547.95
OH7.6----55.944.1
CVCF3
OH9.16----3.3996.613.3996.61
a Calculated using the Henserson–Hasselbalch equation and the corresponding pKa values for each individual functional group.
Disclaimer/Publisher’s Note: The statements, opinions and data contained in all publications are solely those of the individual author(s) and contributor(s) and not of MDPI and/or the editor(s). MDPI and/or the editor(s) disclaim responsibility for any injury to people or property resulting from any ideas, methods, instructions or products referred to in the content.

