Article

In-Depth Analysis of Shut-In Time Using Post-Fracturing Flowback Fluid Data—Shale of the Longmaxi Formation in the Luzhou Basin and Weiyuan Basin of China as an Example

1
Research Institute of Petroleum Exploration & Development, PetroChina Company Limited, Beijing 100083, China
2
PetroChina Oil, Gas & New Energies Company, Beijing 100007, China
3
State Key Laboratory for Geomechanics and Deep Underground Engineering, China University of Mining & Technology, Beijing 100083, China
*
Author to whom correspondence should be addressed.
Processes 2025, 13(6), 1832; https://doi.org/10.3390/pr13061832
Submission received: 8 May 2025 / Revised: 4 June 2025 / Accepted: 6 June 2025 / Published: 10 June 2025

Abstract

The development of shale gas relies on hydraulic fracturing technology and requires the injection of a large amount of fracturing fluid. The well shut-off period after fracturing can promote water infiltration and suction. Optimizing the well shut-off time is crucial for enhancing the recovery rate. Among existing methods, the dimensionless time model is widely used, but it has limitations because it does not represent the length of on-site scale features. In this study, we focused on the shut-in time for a deep shale gas well (Lu-A) in Luzhou and a medium-deep shale gas well (Wei-B) in Weiyuan. By integrating the spontaneous seepage and aspiration experiments in the laboratory and the post-pressure backflow data (including mineralization degree, liquid volume recovery rate, etc.), a multi-scale well shutdown time prediction model considering the characteristic length was established. The experimental results show that the spontaneous resorption characteristic times of Lu-A and Wei-B are 3 h and 22 h, respectively. Based on the inversion of crack monitoring data, the key parameters such as the weighted average crack width (1.73/1.30 mm) and crack spacing (0.20/0.32 m) of Lu-A and Wei-B were obtained. Through the scale upgrade calculation of the feature length (0.10/0.16 m), the system determined that the optimal well shutdown times for the two wells were 14.5 days and 16.7 days, respectively. The optimization method based on a multi-parameter analysis of backflow fluid proposed in this study not only solves the limitations of the traditional dimensionless time model in characterizing the feature length but also provides a theoretical basis for the formulation of the well shutdown system and nozzle control strategy of shale gas wells.

1. Introduction

Shale gas plays a significant role in global natural gas production, with major producers including the United States and China [1]. The successful exploration and development of shale gas in North America have paved the way for commercial production in recent years [2,3]. This success can be largely attributed to the widespread use of multistage hydraulic fracturing in horizontal wells, a technique that involves injecting a large volume of fracturing fluid to create complex fracture networks [4,5,6]. Following hydraulic fracturing, the fracturing fluid is rapidly flowed back to the surface to minimize formation damage. Due to the strong heterogeneity of shale, it usually has a negative impact on the recovery efficiency [7], resulting in a very low backflow efficiency of many shale gas wells. However, a large amount of natural gas can still be produced, which indicates the importance of the complexity of the fracture network. To address this, operators often implement a shut-in period after fracturing to promote water imbibition and enhance fracture network complexity, particularly in shale gas reservoirs with abundant natural fractures [8,9,10,11,12,13].
Both fracturing and drilling operations have an impact on the well shutdown time [14,15]. Wang and Leung [16] used the commercial simulator Computer Modeling Group (CMG) to simulate the reflux and retention of fracturing fluid after large-scale hydraulic fracturing. Their simulation studies showed that during the well shutdown process, the water in the fractures seeps into the matrix. As the well shutdown time increases, the infiltration range expands, which promotes the entry of oil into the fractures and increase the initial production. Ghanbari et al. [17,18] and Sharma [19] indicated that prolonging the shut-in time could be beneficial for improving early production but may have a negative impact on long-term production. This long-term production decline can be attributed to the trapping of fracture fluid near the matrix–fracture interface, known as the water block. Therefore, it is crucial to determine an appropriate shut-in time to fully leverage the permeability displacement effect and enhance the recovery rate of unconventional oil and gas reservoirs.
Currently, there are three main methods for determining the optimal shut-in time. The first method is using empirical formulas [20], which establishes correlations between the shut-in time and specific reservoir/fracturing parameters. However, this method has limited applicability and is only suitable for specific wells or formations. The second method is using analytical solutions, which involves solving the dimensionless time model and combining it with experimental results of spontaneous imbibition to calculate the shut-in time at the field scale [21,22,23]. However, the dimensionless time model lacks consideration of the characteristic length (Lc). Qing et al. [21] first introduced the application of this method, and they combined results of spontaneous imbibition experiments (Horn River shale core samples) with the dimensionless time model proposed by Ma et al. [24,25]. In their study, 1 h at the lab scale corresponded to 3 days at the field scale. However, the most significant parameter, the characteristic length (Lc), was not mentioned. The third method is using numerical solutions, which involves solving the Buckley–Leverett equation in the porous media to estimate the correlation between production and shut-in time [26,27,28]. However, these solutions do not consider the dynamic variation in relative permeabilities during the imbibition process [29]. Among the methods mentioned above, the second one may be easily applied, though the characteristic length is controversial.
On the other hand, field data have shown a significant increase in the salinity of the fracturing flowback fluid, which may exceed the salinity of the injected fracturing fluid. This unique characteristic provides valuable information for evaluating the characteristics of the fracture network after hydraulic fracturing (post-fracturing analysis). Zolfaghari et al. [30] conducted a study on the relationship between the salinity of the flowback fluid and the cumulative liquid production. They proposed a new method for determining the fracture width after fracturing by utilizing this correlation. Additionally, the flowback efficiency and ionic composition of the fracturing fluid can offer further insights into understanding the fracture network. Yang et al. [31] developed an analytical solution for the fracture spacing based on a three-dimensional water imbibition model. They also established a correlation between the dimensionless time and flowback efficiency.
Building upon the pioneering works of Zolfaghari and Yang, our study introduces a dual data-driven approach that innovatively bridges laboratory-scale spontaneous imbibition dynamics with field-scale fracture network parameters to determine optimal shut-in time. Core samples from contrasting reservoir depths—Lu-A (deep shale) and Wei-B (medium-deep shale)—were subjected to spontaneous imbibition experiments to identify the critical imbibition equilibrium point (lab-scale shut-in threshold), where water uptake plateaued. This lab-derived threshold was then synergistically integrated with post-fracturing flowback data through a novel two-model coupling strategy: Zolfaghari’s fracture width model and Yang’s fracture spacing equation. By further incorporating a characteristic-length analysis, we developed reservoir-specific calculation protocols that translate lab-observed imbibition behaviors into field-operational shut-in timelines. This cross-scale analytical workflow uniquely resolves the mismatch between laboratory insights and field-scale heterogeneity, offering a physics-informed, data-calibrated solution for shut-in optimization in complex shale systems.

2. Geological Settings

Luzhou and Weiyuan are significant shale gas fields situated in the southeastern region of Sichuan Province and the western part of Chongqing, China (Figure 1). These fields exhibit distinct geological differences in their tectonic characteristics [32]. In the Luzhou area, the primary influence comes from fold and fault structures. The fold structures are characterized by east–west linear synclines, while the fault structures predominantly align in the northeast and northwest directions. These structural characteristics play a pivotal role in the formation and accumulation of shale gas in the Luzhou shale gas field. In contrast, the Weiyuan area is characterized by intricate fault structures, resulting in the formation of multiple fault blocks and anticlines, which significantly impact the distribution and accumulation of shale gas.
In terms of burial depth, shale gas in Luzhou is primarily found in deep reservoirs at depths ranging from approximately 3500 to 4500 m. On the other hand, shale gas in Weiyuan is mainly distributed in medium to deep reservoirs at depths ranging from around 2000 to 3500 m. Both the Luzhou and Weiyuan gas fields have demonstrated great potential for shale gas exploration and development [33,34]. The Longmaxi Formation possesses several key attributes that contributes to its significance in this regard. It is known for its abundant organic matter, which serves as a favorable source rock for the generation and accumulation of shale gas. Additionally, the formation has reached an optimal thermal maturity, resulting in the efficient conversion of organic matter into hydrocarbons. The Longmaxi Formation is characterized by its considerable thickness and lateral continuity, providing a substantial volume of shale rock that can potentially host significant shale gas resources. Furthermore, it exhibits favorable reservoir properties such as high total organic carbon (TOC) content, porosity, and permeability, all of which contribute to a promising gas storage and flow within the shale reservoir. The formation can be further divided into two layers, namely L1 and L2, with layer L1 being subdivided into two sublayers, L11 and L12. Sublayer L11 can be further divided into four units, namely L111, L112, L113 and L114, from top to bottom. Among these units, L111 and L112 exhibit the greatest development potential. These characteristics collectively make the Longmaxi Formation a highly promising target for shale gas exploration and development in both the Luzhou and Weiyuan gas fields.
Figure 1. Geological setting and stratigraphic division of Luzhou and Weiyuan gas fields [35].
Processes 13 01832 g001

3. Experimental Section

The spontaneous imbibition experiment was carried out on rock samples to investigate the shut-in time at the laboratory scale. The shut-in time refers to the point at which the imbibed volume of water reaches a stable stage. Simultaneously, ion diffusion experiments were conducted to study the behavior of imbibition–ion diffusion in deep shale and medium-deep shale. These experiments aimed to understand the interaction between the rock matrix and the imbibed fluid and provide insights into the transport mechanisms of ions within the shale formation.

3.1. Samples

Rock samples from the Longmaxi Formation, specifically units L111 and L112, were obtained from Well Lu-A (vertical depth 3986.12–3989.18 m), a deep shale in the Luzhou gas field, and Well Wei-B (vertical depth 2705.18–2710.13 m), a medium-deep shale in the Weiyuan gas field. As seen in Figure 2, the main mineral composition in the rock samples comprised quartz (33.7% to 63.0%), feldspar (2.8% to 8.4%), calcite (2.3% to 9.1%), dolomite (4.3% to 10.8%), pyrite (4.2% to 9.1%), and clay minerals (20.9% to 42.1%). The clay minerals predominantly consisted of illite (63.0% to 77.2% relative content), an illite/montmorillonite mixed layer (18.5% to 30.5% relative content), and the chlorite group (5.0% to 11.5% relative content). Yang et al. [36,37] demonstrated through nanoindentation and scratch techniques that the mechanical properties of the intrinsic minerals of shale could affect the mechanical performance of shale
The test results of basic physical parameters (as seen in Table 1 and Figure 3) revealed that the porosity, measured using the static volumetric method with helium as the testing medium, ranged from 6.21% to 7.15%. The permeability, measured using the pulse-decay method with nitrogen as the testing medium, ranged from 0.010 mD to 0.019 mD. The liquid sample used was high-purity distilled water with a density of 1.0 g/cm3 at room temperature and a viscosity of 1.0 mPa·s.

3.2. Methods

To conduct spontaneous imbibition and ion diffusion experiments on shale samples. As seen in Figure 4, the following detailed steps were meticulously followed:
  • Sample Preparation
The samples were subjected to a drying process in a sealed oven at 105 °C for 48 h to eliminate any moisture content. After cooling, the mass of the dry samples was accurately measured.
2.
NMR Analysis
The dried samples underwent analysis using a MiniMR-VTP low-field nuclear magnetic resonance (NMR) analyzer, manufactured by Suzhou Niumai Analytical Instruments Co., Ltd. (Suzhou, China). This specific NMR analyzer featured parameters such as a magnetic field strength of 0.5 T, magnet temperature of 32 °C, echo time of 0.3 ms, interval time of 3000 ms, and a number of echoes set at 8000. The NMR analysis provided valuable T2 spectra of the dried samples.
3.
Beaker Preparation
The beaker and electrodes of the conductivity meter were thoroughly washed with distilled water. After ensuring cleanliness, 200 mL of distilled water was carefully added to the beaker, and its conductivity was measured. If the conductivity exceeded 2 μS/cm, the beaker underwent further cleaning until the measured value met the required standards.
4.
Conducting Spontaneous Imbibition and Ion Diffusion Experiments
The dried samples were gently placed within the beaker containing distilled water for the spontaneous imbibition experiment. To minimize water evaporation and minimize experimental errors, the beaker was properly sealed with plastic wrap.
After a specific time interval, the samples were delicately removed from the beaker, ensuring the surfaces were wiped clean from any residual liquid. The precise mass of each sample was then measured using a Mettler analytical balance, specifically the ME204E model, known for its accuracy of 0.0001 g and a capacity of 220 g.
The T2 spectra of the samples were meticulously analyzed using a nuclear magnetic resonance analyzer, while the conductivity of the liquid within the beaker was measured using a conductivity meter.
All experimental data, encompassing mass, T2 spectra, and conductivity, were meticulously recorded. Subsequently, the samples were carefully returned to the beaker to resume the spontaneous imbibition experiment.
5.
Continuous Testing
At regular intervals, the samples were periodically removed, and the aforementioned steps were repeated until no significant changes in mass and T2 spectra were observed after multiple tests.
By meticulously following these steps, the spontaneous imbibition and ion diffusion experiments on the shale samples were successfully conducted. This approach enabled the observation and analysis of the imbibition behavior, via the conductivity characteristics, over a specified period of time.
Figure 4. Experimental flow chart.
Processes 13 01832 g004

3.3. Results and Discussion

In order to compare the behavior of imbibition and ion diffusion between the deep shale and medium-deep shale, simultaneous spontaneous imbibition and ion diffusion experiments were conducted. The corresponding NMR T2 spectra during the imbibition process are illustrated in Figure 5. The T2 relaxation time (transverse relaxation time) in nuclear magnetic resonance (NMR) refers to the time required for a proton’s spin to lose phase consistency in a transverse plane perpendicular to the main magnetic field. The T2 spectrum reflects the internal structure and composition differences of the sample by measuring the T2 relaxation time distribution of different components in the sample, such as water, oil, or fluids in different pores. The T2 spectra exhibited a bimodal shape, characterized by relaxation times ranging from 0.1–10 ms to 10–100 ms. According to Jiang et al. [38], T2 values within the range of 0.1–100 ms correspond to nanoscale pores (0.01–1 μm) in the core, while T2 values exceeding 100 ms are indicative of mesopores and macropores (>1 μm). Thus, it can be inferred that the water absorbed during the imbibition process primarily occupied nanoscale pores within the shale matrix. During the infiltration and absorption process, the peaks of the T2 spectra of rock samples A1 and A2 shifted to the right, indicating that the pore diameters in the matrix increased. This might be related to the water absorption and expansion of clay minerals and the dissolution of salts. Moreover, A1 fluctuated at 1000 ms, indicating that the sample may have had large pores or fine cracks. The T2 spectral shapes of rock samples B1 and B2 remained basically unchanged, which indicated that there was no obvious change in the pore structure inside the core. Furthermore, the T2 spectrum results measured at different times showed that the signal amplitude of the dry rock sample was the smallest. As time went by, the signal amplitude increased and then remained basically unchanged, indicating that the water content in the rock samples remained basically unchanged and reached the saturated state. The permeation and absorption saturation durations of rock samples A and B were 193 h and 120 h, respectively.
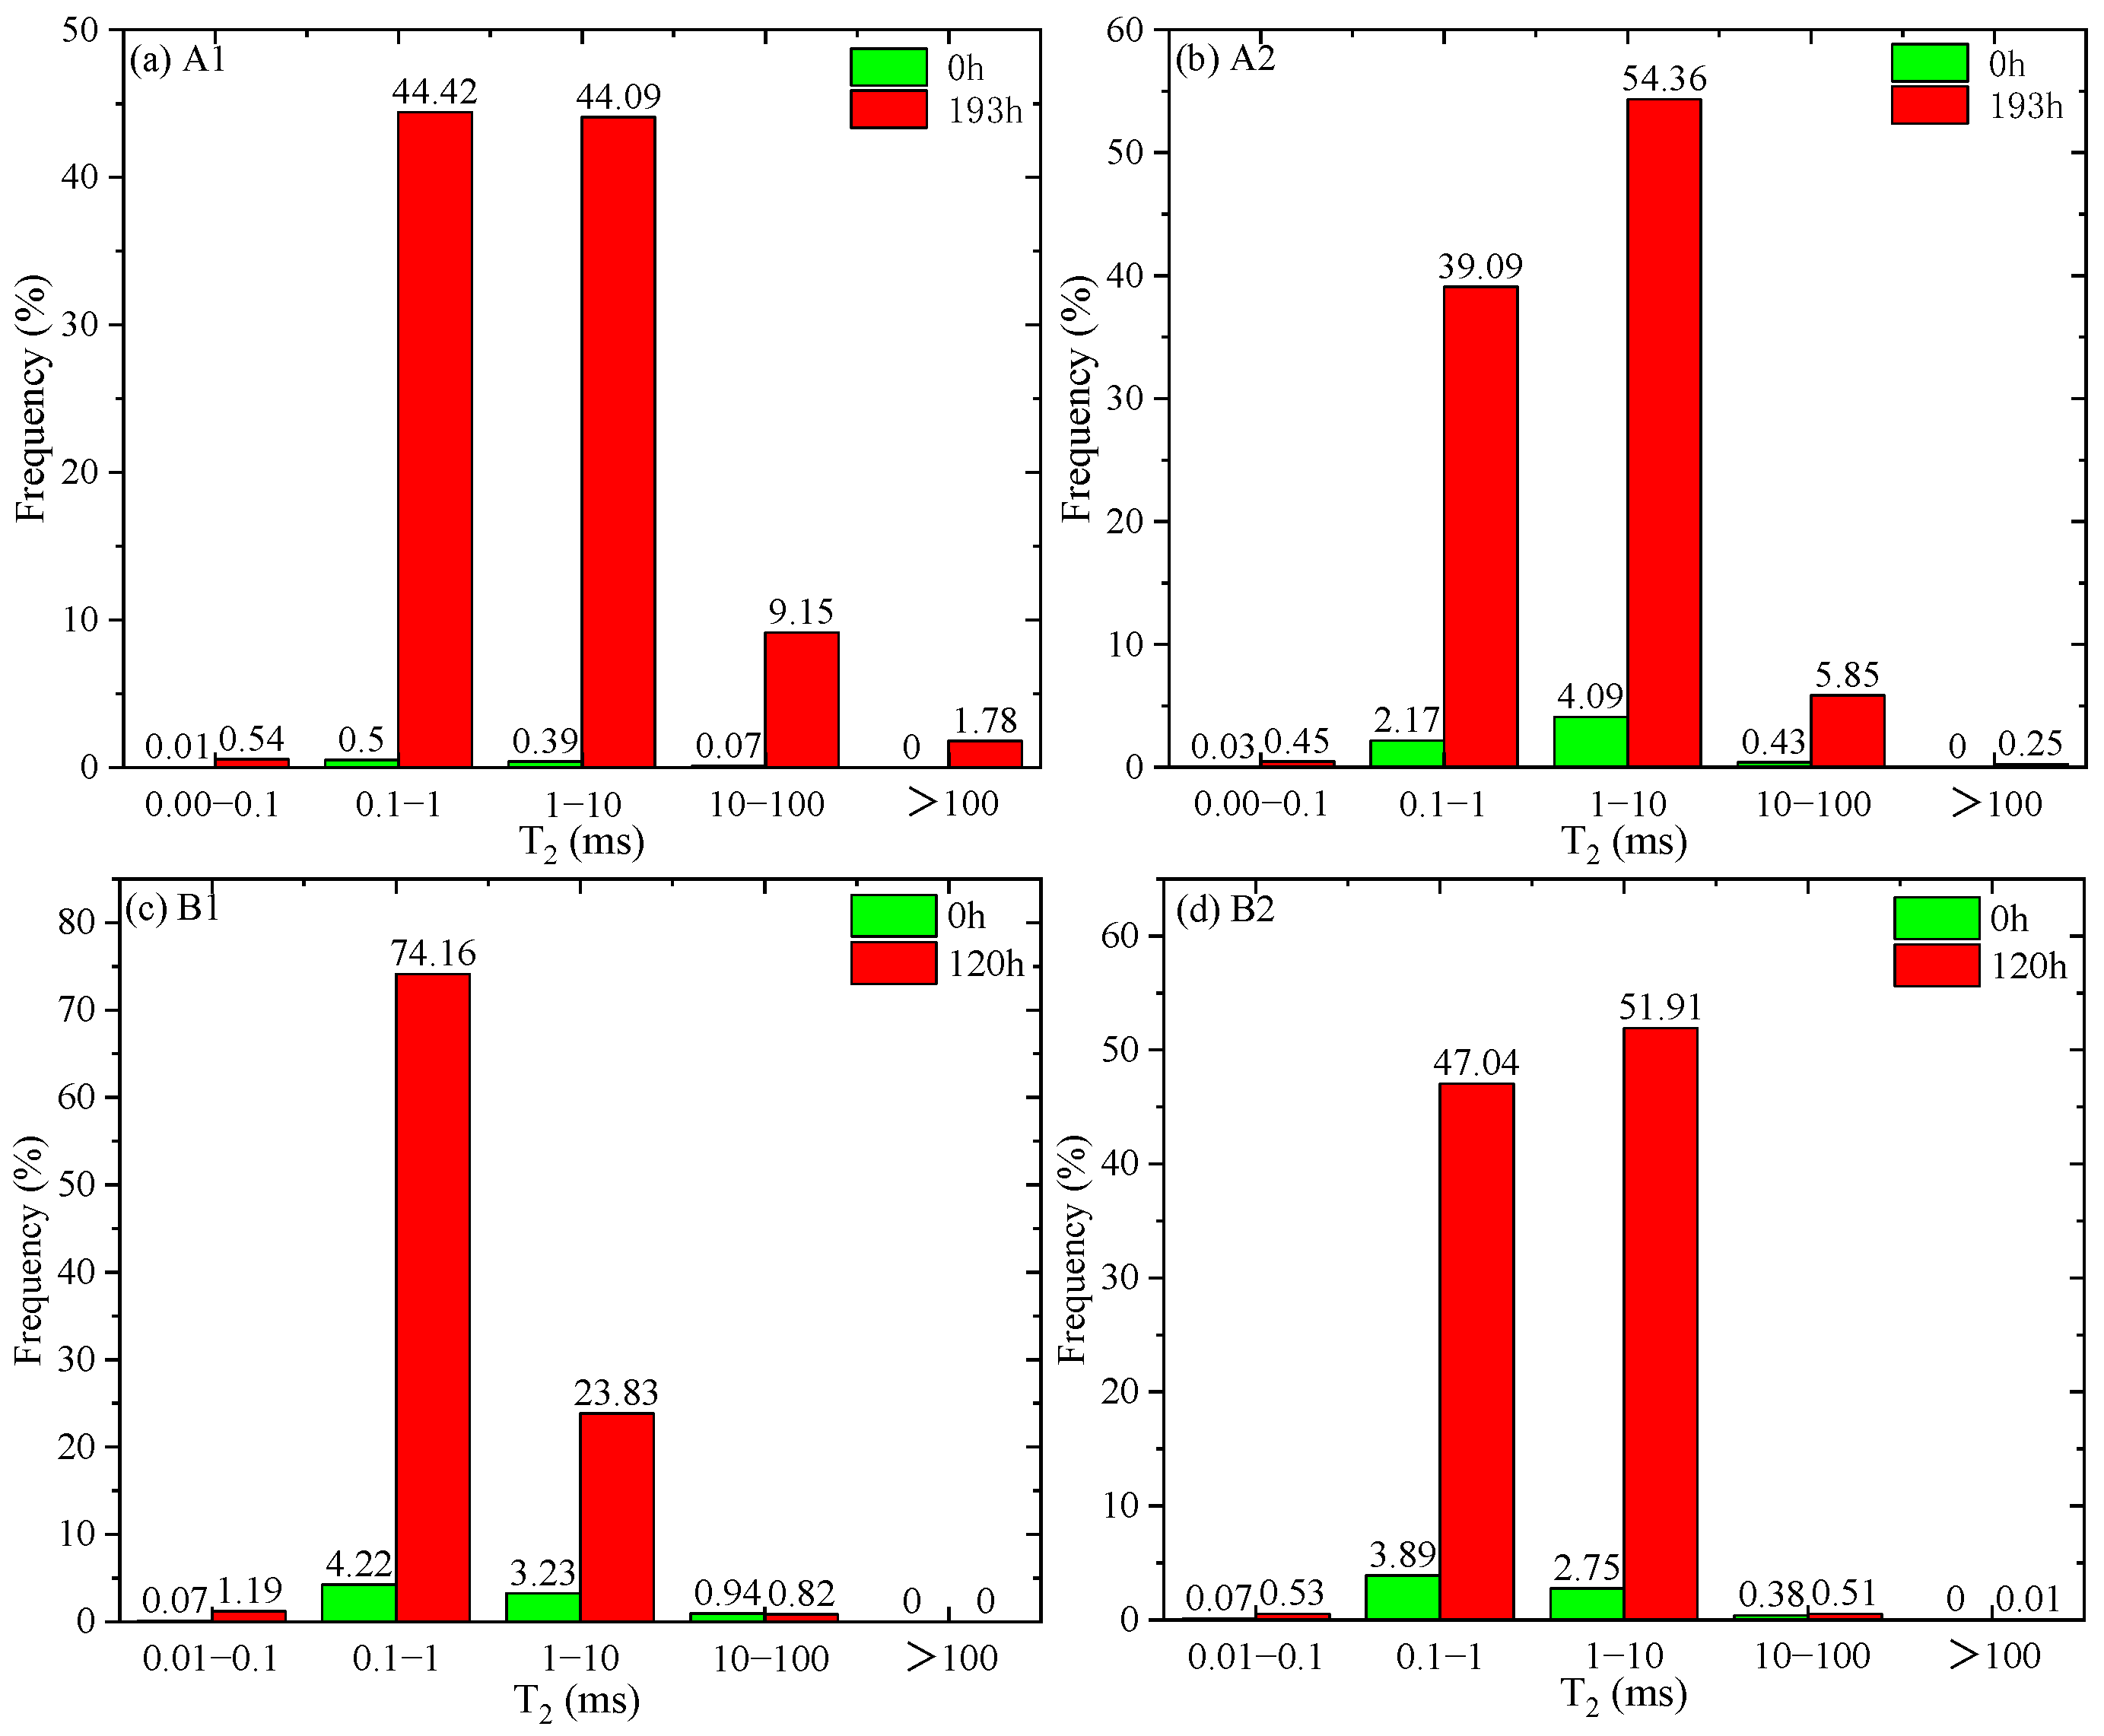
Comparing the signal distribution frequencies of different relaxation times before and after the imbibition experiment (Figure 6), it was evident that hydrogen proton signals in the dry sample were relatively weak, primarily originating from clay water or water associated with crystalline minerals. However, following imbibition, hydrogen proton signals predominantly distributed within the range of T2 values between 0.1 and 100 ms, accounting for over 98.5% of the total signal. Among these, the frequency distribution of the two cores from Wei-B was consistent, with T2 values ranging from 0.1 to 1 ms and accounting for approximately 65% of the data, which was significantly higher than that of the two cores from Lu-A. This suggests that the absorbed water primarily distributes within nanoscale micropores. The distribution characteristics of hydrogen proton signals after imbibition differed for the two cores from Lu-A. In core A1, the absorbed water mainly distributed within nanoscale mesopores (T2 values ranging from 1–10 ms, accounting for approximately 70%), while in core A2, the absorbed water was distributed within both nanoscale micropores and nanoscale mesopores (T2 values ranging from 0.1–1 ms and 1–10 ms, accounting for 48.3% and 43.1%, respectively).
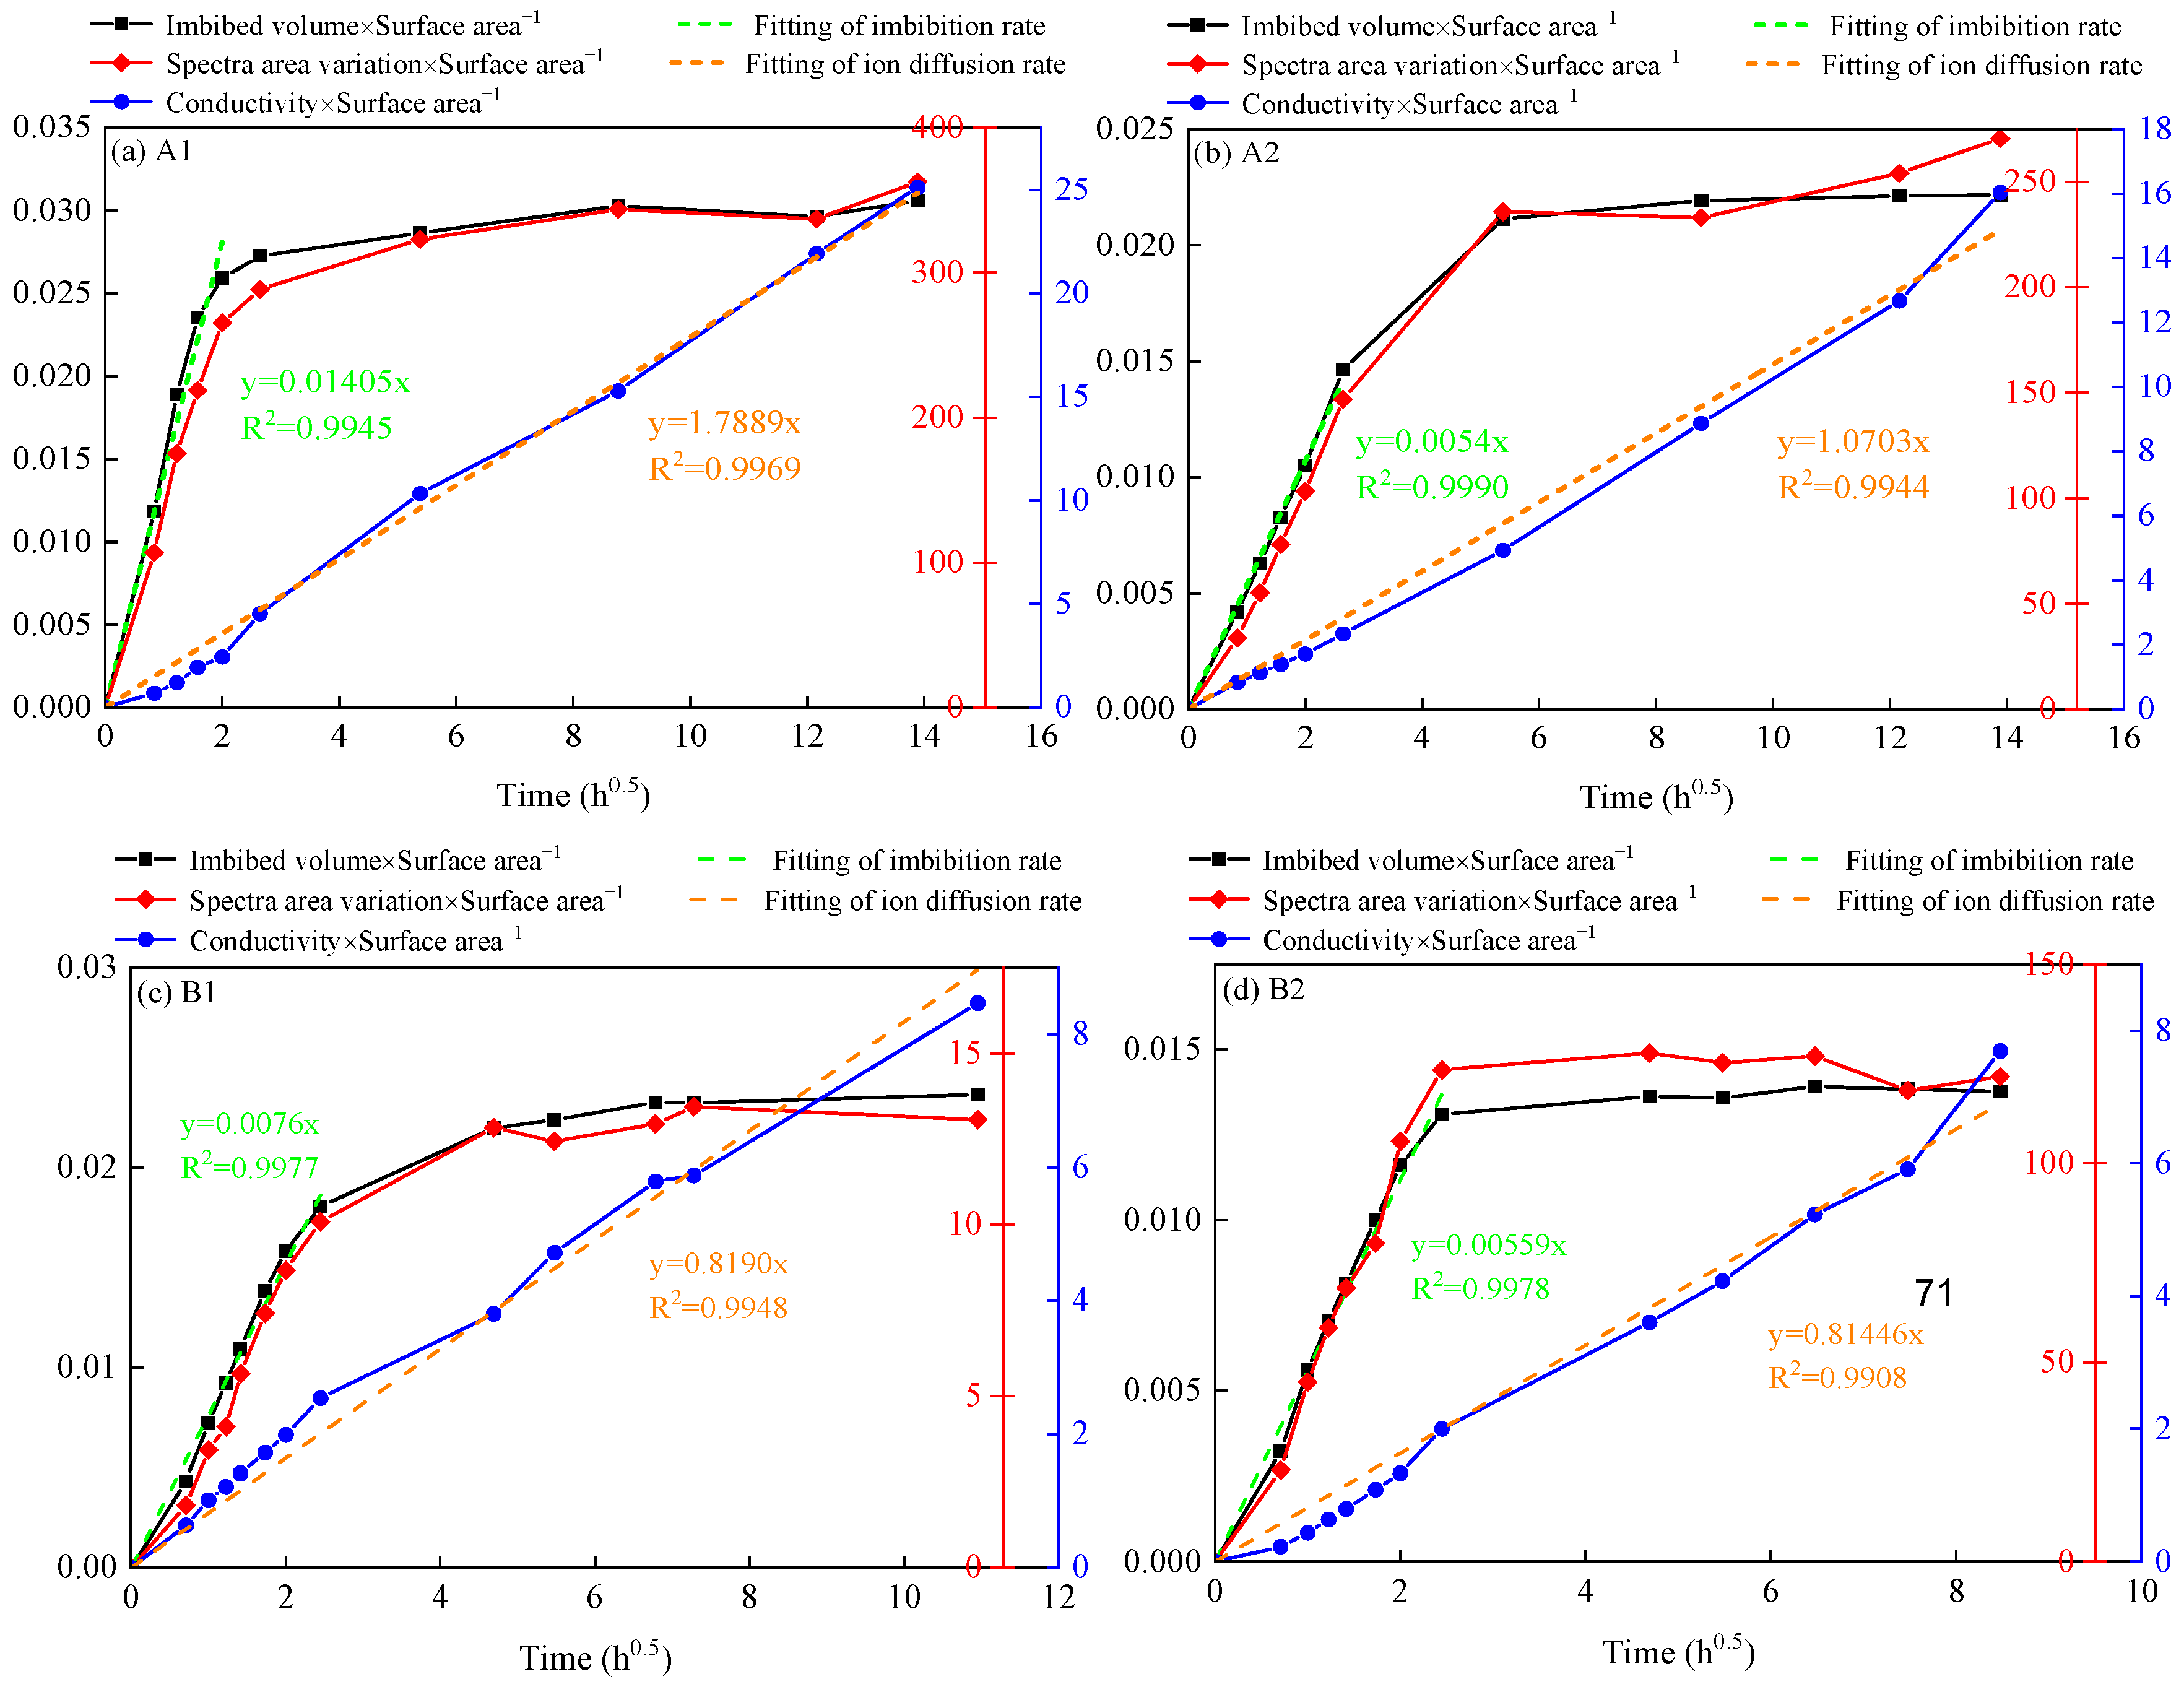
The changes in the water imbibition volume (calculated based on the measured mass using the weighing method), the area under the NMR T2 spectrum (difference between the T2 spectrum area at different time points and the T2 spectrum area of the dry rock sample), and the square root of conductivity over time are presented in Figure 7. It can be observed that the trend of water imbibition volume was consistent with the trend of T2 spectrum area, indicating minimal differences between the two testing methods. In the initial stage of imbibition, the water uptake volume of the cores showed a proportional relationship with the square root of time, aligning with the findings of Handy et al.’s [20] study. Subsequently, the curve reached a turning point (corresponding to 22 h, 29 h, 3 h, and 4 h for cores A1, A2, B1, and B2, respectively, in spontaneous imbibition experiments), and the curve became almost parallel to the time axis, indicating that cores no longer exhibited significant water imbibition characteristics, consistent with the results of the NMR scans. The conductivity also demonstrated a proportional relationship with the square root of time, which persisted throughout the imbibition process. Moreover, Yang et al. [39,40] studied the relationship between water absorption and ion diffusion by explaining the microscopic mechanism. The rates of water absorption and ion diffusion were approximately linearly correlated, and ion diffusion was synchronous with water absorption. Moreover, there were different infiltration and absorption characteristics in different periods.
These observations provide valuable insights into the imbibition behavior and the transport mechanisms of water within the shale samples, further enhancing our understanding of the interaction between the rock matrix and the imbibed fluid.

4. Determination of Characteristic Length Scale at the Field Scale

Determining the characteristic length scale at the field scale is crucial for evaluating the morphology of hydraulic fracture networks in shale gas wells. The “liquid production–salt production” flowback dynamic curve of these wells provides valuable information for this analysis. By performing post-fracture parameter inversion using the flowback data, it becomes possible to accurately assess the characteristic length scale. This process involved applying the model proposed by Yang et al. [28] and considering the relationship between dimensionless time and flowback efficiency. Additionally, the model developed by A. Zolfaghari et al. [30] was utilized to invert the fracture width, ultimately leading to the calculation of the characteristic length scale at the field scale.

4.1. Theoretical Model

A predictive model for flowback efficiency was developed based on the three-dimensional fracture-matrix imbibition theory proposed by Yang et al. [13]. In this model, the post-fractured reservoir, which had undergone an extensive hydraulic fracturing, was idealized as a cube containing fractures (as illustrated in Figure 8). Proppant was then placed within these fractures.
Applying the principle of mass conservation, the volume of injected fracturing fluid is equal to the volume of hydraulic fractures (excluding fluid losses), resulting in the generation of m matrix blocks during the fracturing operation.
m = V i n j a + n d 3 a 3
Here, m represents the number of matrix blocks generated during fracturing; Vinj denotes the volume of injected fracturing fluid in cubic, m3; a represents the length of the matrix block in meters; d represents the diameter of the proppant particles, m; n represents the number of proppant layers in the fractures.
The ratio of the volume of fracturing fluid imbibed into the rock matrix blocks to the volume of injected fracturing fluid can be expressed as:
V i m b V i n j = m a 3 a 2 x 3 ϕ S w f S w i m a + n d 3 a 3 = 1 1 L D 3 1 + n d / a 3 1 ϕ S w f S w i
L D = 2 x / a
where Vimb represents the volume of fracturing fluid imbibed into the matrix blocks, m3; x represents the distance of water imbibition, m; LD represents the dimensionless length; Swf represents the final water saturation; Swi represents the initial water saturation; and ϕ represents the porosity.
By derivation, Yang et al. [13] obtained the following calculation formula for the flowback efficiency:
R r e = 1 V i m b V i n j = 1 1 ( 1 4 2 t D ) 3 ( 1 + n d / a ) 3 1 ϕ S w f S w i
t D = t k φ σ μ w L C 2 L a b = t k φ σ μ w L C 2 F i e l d
L C = V b / i = 1 i = n A i L A i
Here, Rre denotes the flowback efficiency of the fracturing fluid; tD represents the dimensionless time; LC represents the characteristic length, which is dependent on the size of matrix blocks and boundary conditions. It is not the average distance between the main fractures, but the effective average size of the matrix blocks defined by the fracture network, m; Vb represents the volume of rock matrix, cm3; Aj represents the area of the imbibition contact surface in the j direction, cm2; LAj represents the distance from the imbibition front edge along the opening surface to the closed boundary in the j direction, cm; K represents the permeability, mD; and μw represents the viscosity, in mPa·s.
Based on Equation (6), the relationship between the length of the matrix block and the characteristic length can be calculated as follows.
a = 2 L C
Equations (3)–(7) provide the relationship between the length of the matrix block and the characteristic length. By utilizing results from imbibition tests and field fracturing flowback fluid data, it becomes possible to determine the dimensionless time and calculate the flowback efficiency. The only remaining variable is the fracture width, which directly influences the characteristic length.
In Equation (6), LC is jointly determined by the matrix volume Vb and the distribution of contact area. When a increases (LC), Vb grows as a3, providing more space for microcracks and causing Aj to increase with the increase in the number of microcracks. Although the increase in Aj may increase the A j L A j in the denominator of Equation (6), the growth of the cube of Vb (due to the large a) dominates the increase in LC (combined with a = 2LC), directly related to the linear relationship between LC and a. Therefore, the microcracks or non-uniform crack distribution within the large matrix block (a large, LC large) achieves a larger contact area while LC is larger by increasing the contact area Aj.
To determine the fracture width, the multi-level tree-like network fracture model proposed by A. Zolfaghari et al. [30] can be utilized. This model assumes a homogeneous and infinite gas reservoir with isotropic properties. The fluid is considered to be a Newtonian fluid, and its flow follows Darcy’s law. The transport of salt from the matrix to the fractures is described by Fick’s diffusion law as follows:
J i = 2 D A f , i C m C f , i L m
Here, Ji represents the ion diffusion flux in the ith fracture, mol/s, Af,i represents the interface area between the matrix and the ith fracture, m2, Cm represents the mass concentration of salt in the matrix in mg/L, Cf,i represents the mass concentration of salt in the ith fracture, mg/L, Lm represents the distance between the artificial fracture and a specific point in the matrix, reflecting the gradient change in salt mass concentration, m, and D represents the diffusion coefficient, m2/s.
The average mass concentration of salt in the ith fracture can be calculated as follows:
C f , i W f , i = 2 D C m t / L m W f , i
Here, Δt represents the contact time between the fracture surface and the fracturing fluid, s, and Wf,i represents the width of the ith fracture, m.
Based on the mass balance equation, A. Zolfaghari et al. [30] derived the functional relationship between the fracture width and the mass concentration of salt in the fracturing flowback fluid:
f W f = C f 2 L m 2 D C m t d N P , w d C f
N p , w = Q w V f , i
Here, f(Wf) represents the distribution of fracture widths, mm, NP,w represents the normalized fracturing flowback efficiency, Vf,i represents the volume of the ith fracture, m, and Qw represents the cumulative volume of the fracturing flowback fluid, m.
In field applications, the mass concentration of salt in the matrix is obtained based on the total salinity data of the fracturing flowback fluid in the gas field. The diffusion coefficient is determined based on the type of ions present in the fracturing flowback fluid. Lm is commonly taken as 10 times the width of the fracture, as proposed by A. Zolfaghari et al. [30]. The normalized fracturing flowback efficiency is determined based on the volume of injected fracturing fluid and the volume of fracturing flowback fluid collected after fracturing.

4.2. Application of Theoretical Model

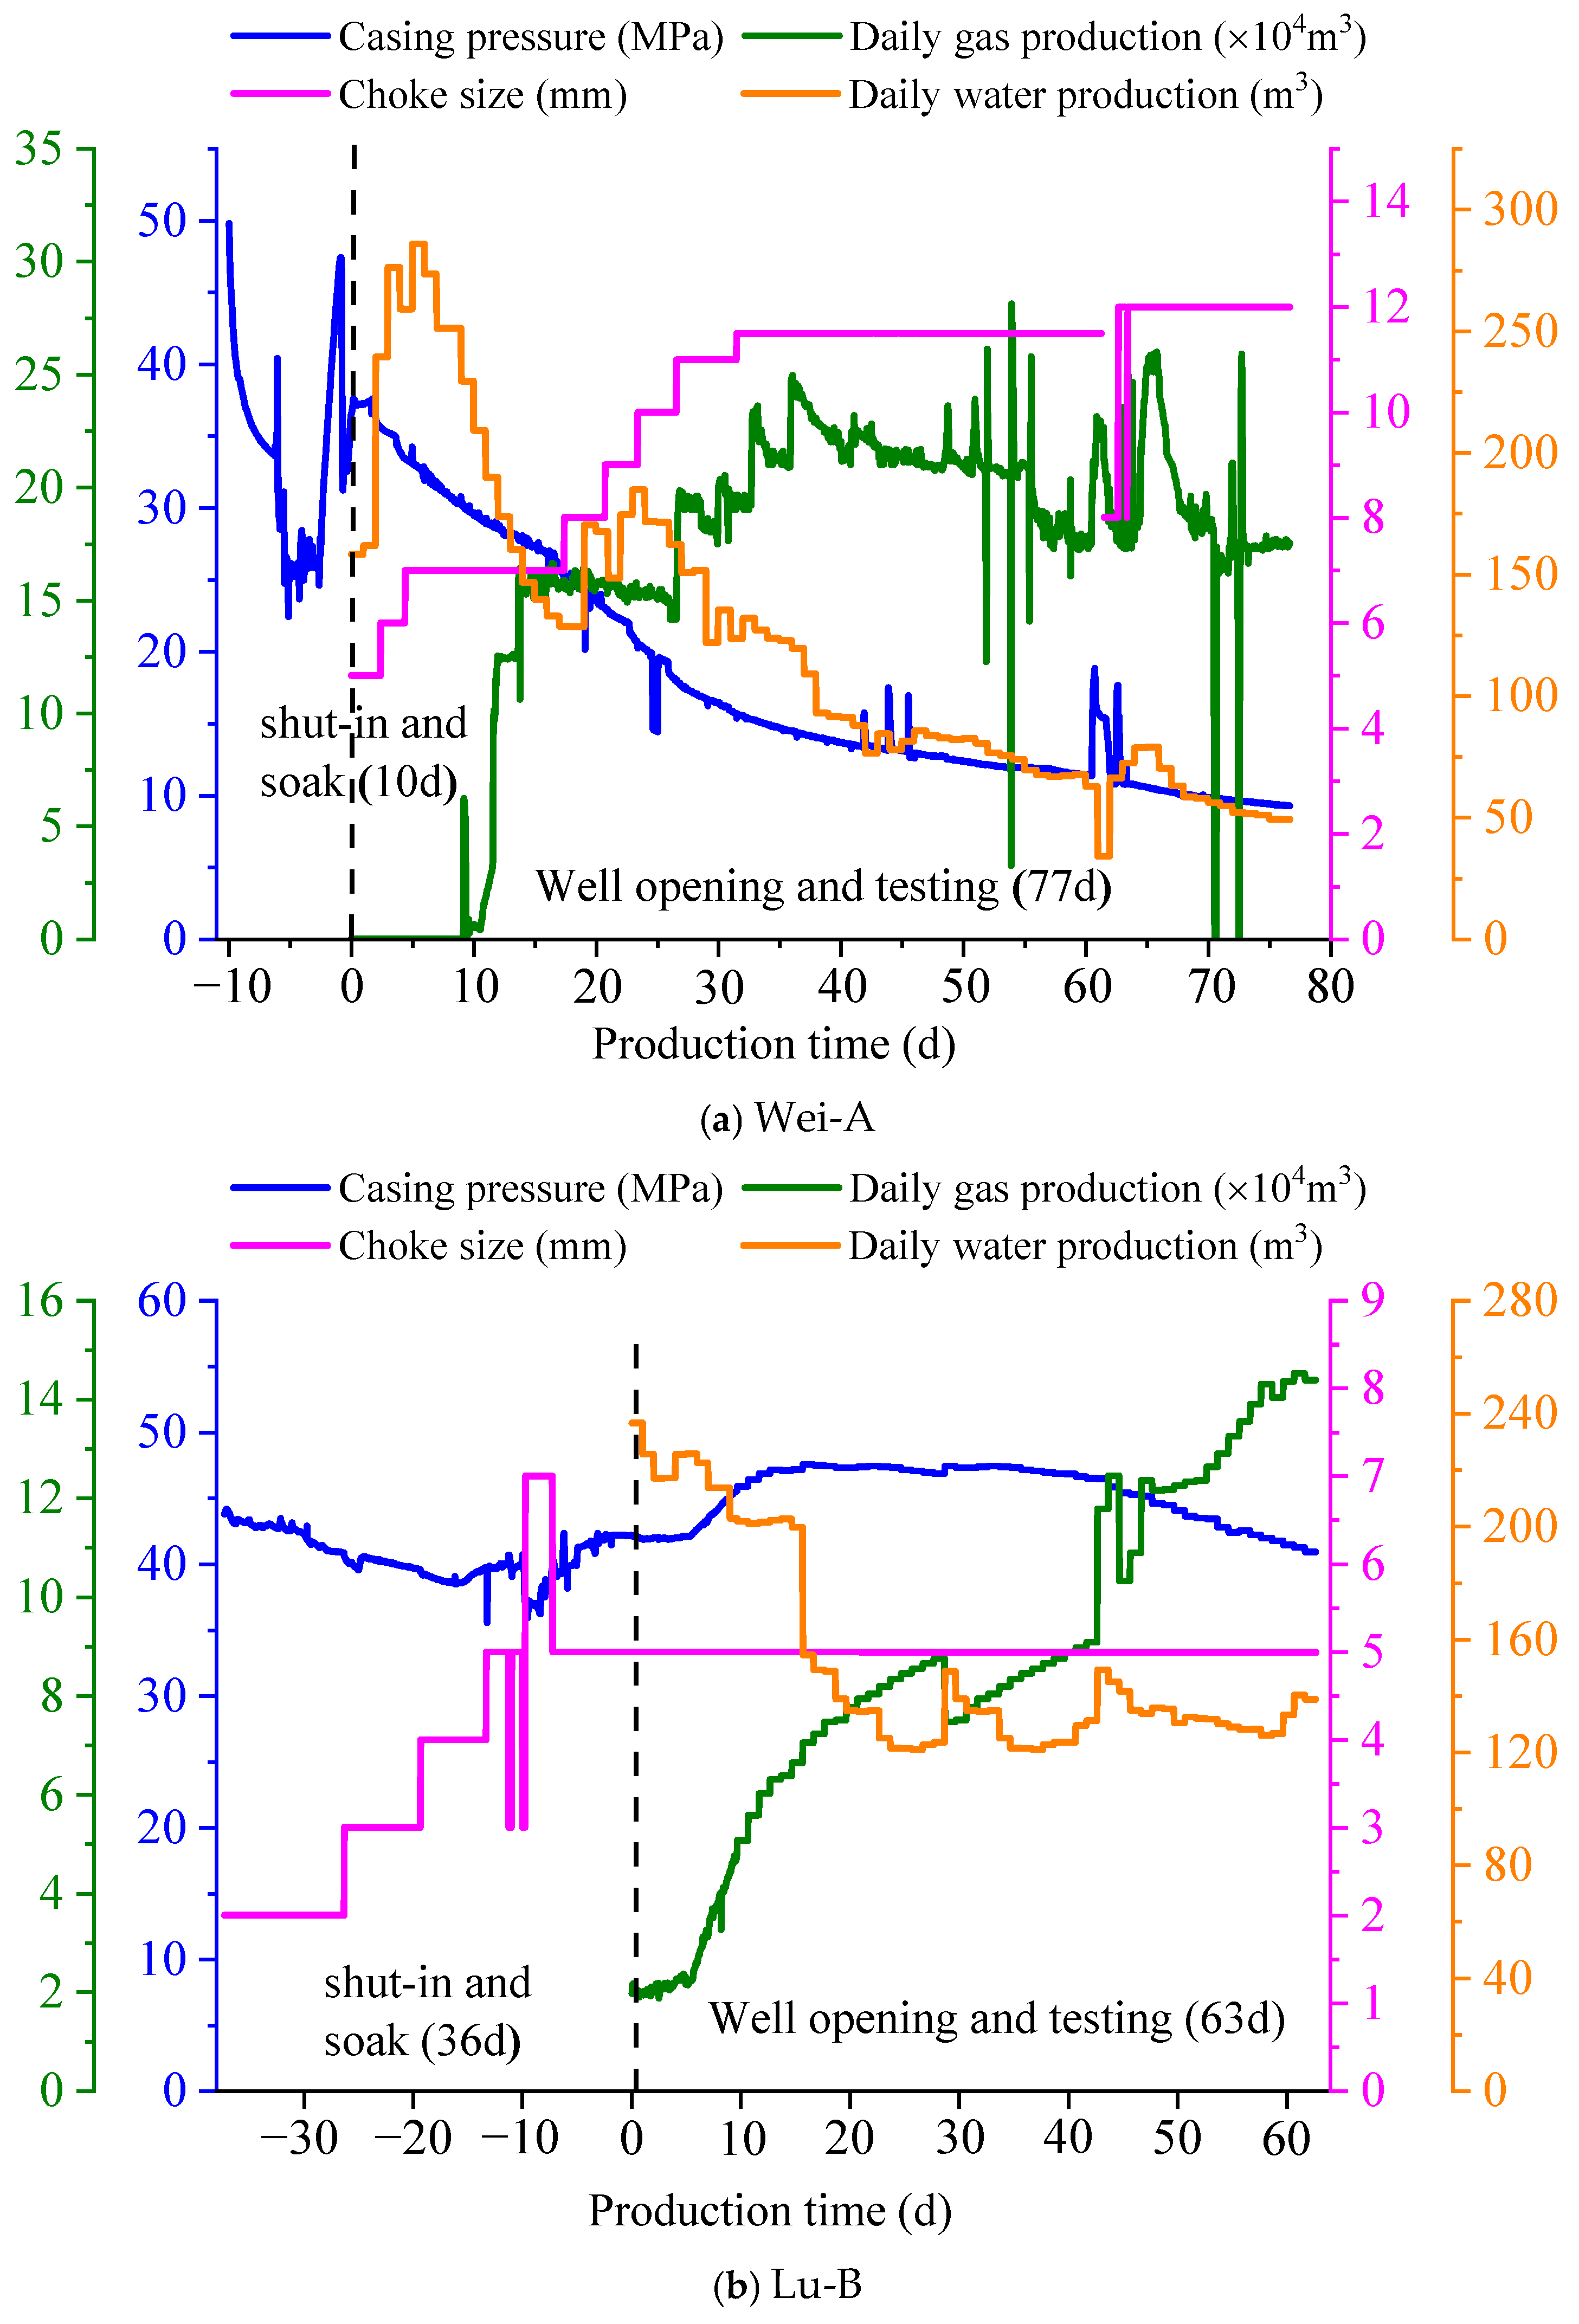
The statistical analysis of key data, including gas production, water production, casing pressure, etc., for Lu-A in Lu-And Wei-B in Wei is presented in Figure 9. Lu-A underwent fracturing in 22 stages, with a horizontal length of 1436 m and a total fracturing fluid injection of 42,323 m3, resulting in a pre-gas production flowback efficiency of 9.95%. On the other hand, Wei-B underwent fracturing in 18 stages, with a horizontal length of 1655 m and a total fracturing fluid injection of 45,440 m3, resulting in a pre-gas production flowback efficiency of 1.49%.
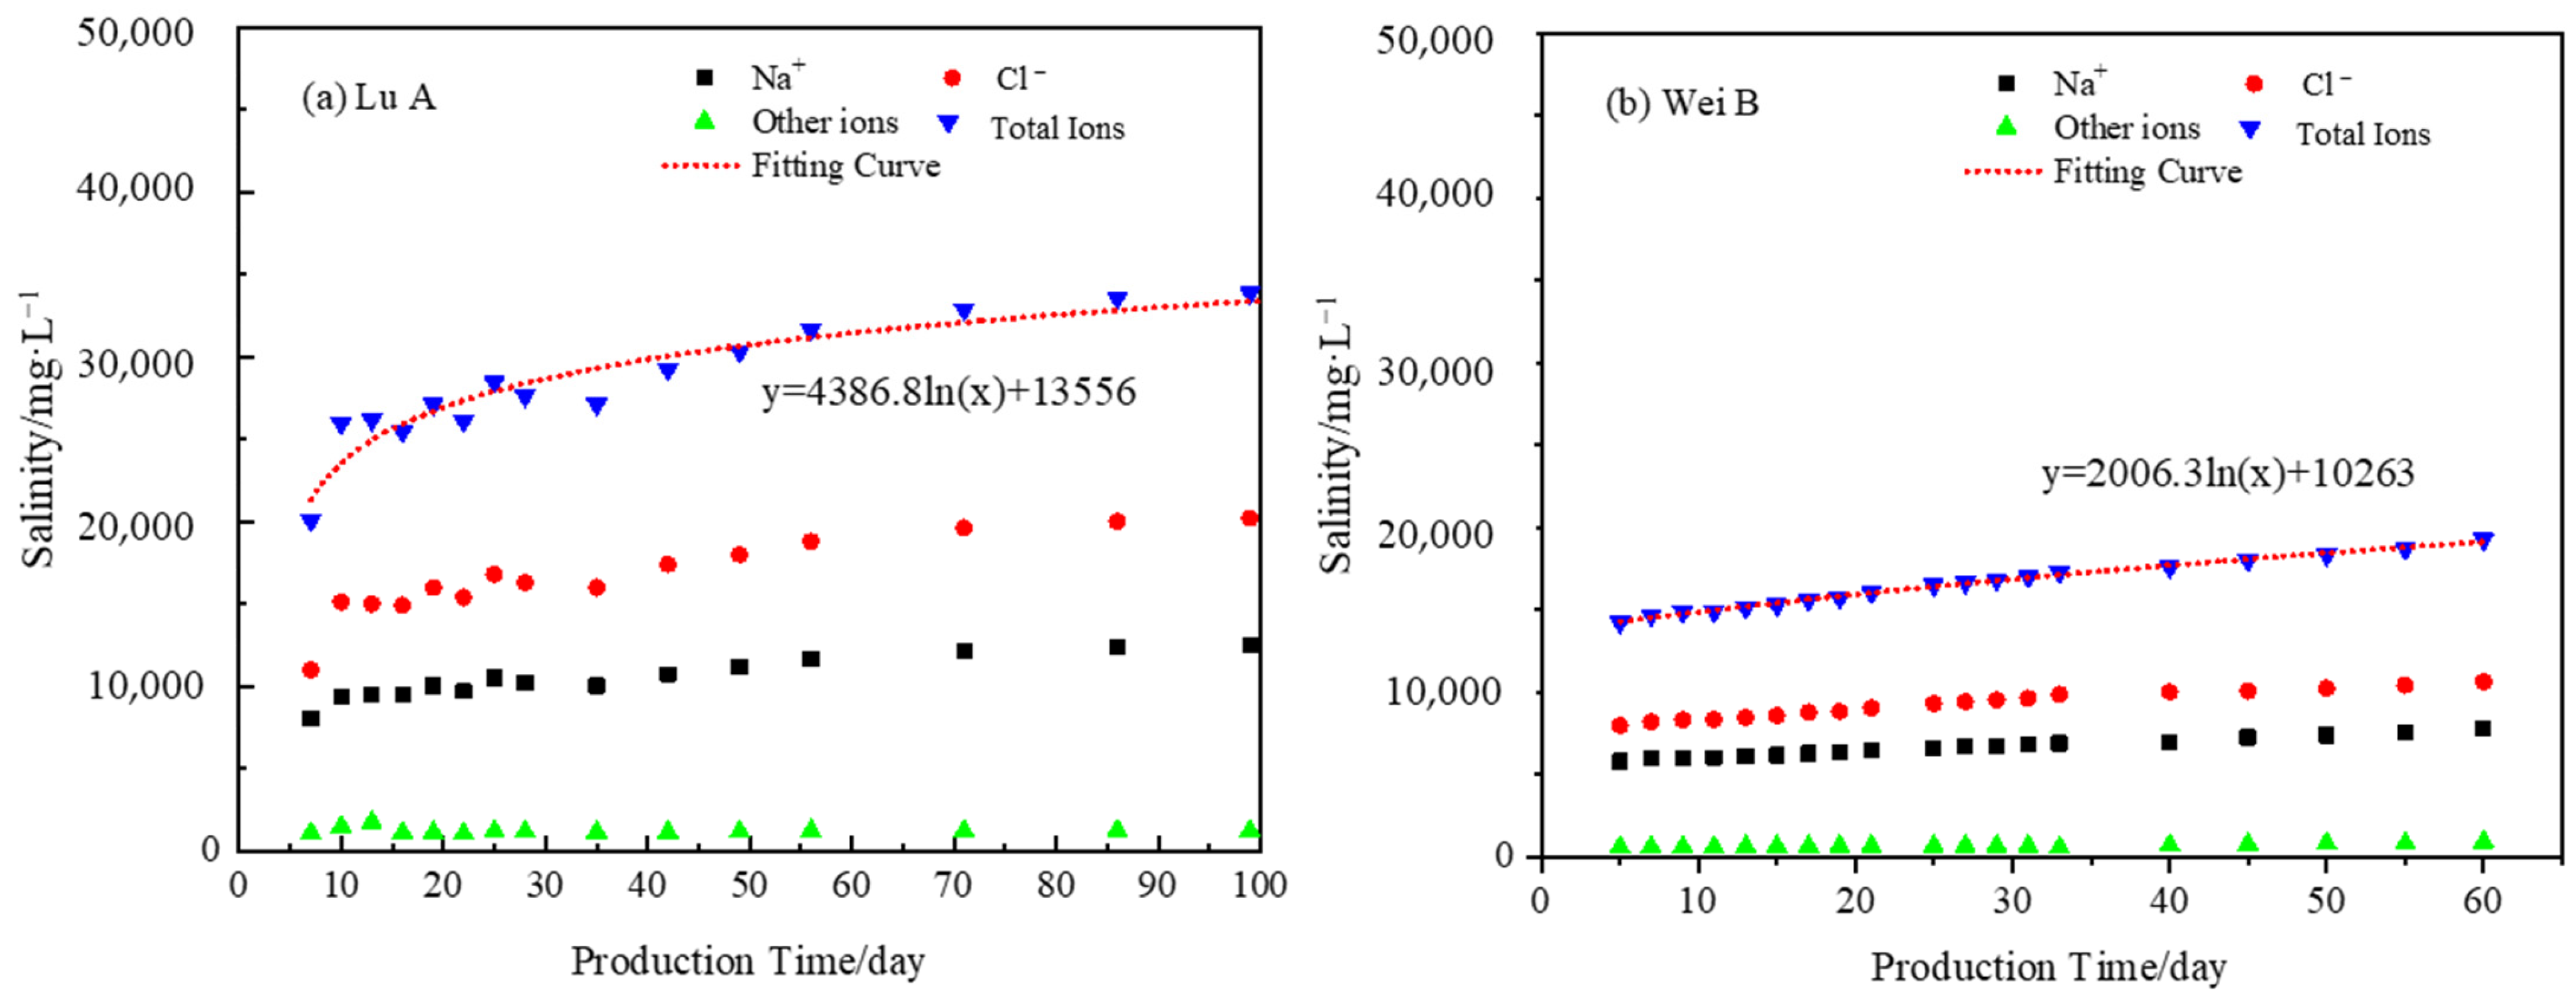
The analysis of post-fracturing flowback fluid salinity and ion types is illustrated in Figure 6. From Figure 10, it can be observed that the salt mass concentration of the flowback fluid gradually increased over time. Sodium and chloride ions were found to be the primary contributors to the salinity, while other ion concentrations remained relatively low. The mass concentration of salt in the matrix (Cm) should be determined at the value corresponding to the stable stage of the total salinity. For Wei-B, the flowback time (Figure 10b) reached approximately 100 days, and the total salinity remained nearly constant, resulting in Cm being set at 35,000 mg/L. As for Lu-A, the measured flowback fluid salinity reached 60 days (the pre-gas production period lasted for 38 days). To facilitate the comparison with Wei-B, a fitting of the total salinity curve was conducted to determine the corresponding total salinity at 100 days of the whole flowback time, yielding a Cm of 20,000 mg/L.
The main salt ions present in the flowback fluid were chloride and sodium ions, both with diffusion coefficients of 1.484 × 10⁻⁹ m2/s. This established the relationship between the average salt mass concentration (Cf,i) in the ith fracture of Lu-A and Wei-B and the fracture width (Wf,i):
C f , i ( L u   A ) = 2 × 1.484 × 10 9 × 35000 × 32400 × 10 W f , i = 33.657 W f , i
C f , i ( W e i   B ) = 2 × 1.484 × 10 9 × 20000 × 32400 × 10 W f , i = 19.233 W f , i
By utilizing the flowback fluid data and considering the changes in salt mass concentration, the relationship between f(Wf) and Wf was derived. Subsequently, the summation of f(Wf) for each salt mass concentration within the range of fracture widths was determined, resulting in the distribution of fracture volume fraction within that width range. This approach facilitated the determination of the fracture volume fraction distribution for different fracture widths in Lu-A and Wei-B (see Figure 11).
Based on the calculation results of the fracture volume fraction for different fracture widths (see Figure 11), it is evident that Wei-B had higher salt production. The calculated fracture widths for Wei-B were mainly distributed in the range from 1.0 to 2.0 mm, while for Lu-A, the fracture widths were primarily distributed in the range from 2.0 to 2.5 mm. Additionally, the weighted average fracture widths for Lu-A and Wei-B were determined to be 1.73 mm and 1.30 mm, respectively.
By incorporating the parameters obtained from the laboratory-scale shut-in time, on-site flowback efficiency, and fracture width distribution calculations for Lu-A and Wei-B into Equation (3), the probability distribution of the matrix block length (i.e., equivalent fracture spacing) was calculated (see Figure 12). The results revealed that the weighted average length of the matrix blocks for Lu-A was 0.20 m. Utilizing Equation (6), the corresponding characteristic length, LC, was determined to be 0.10 m. For Wei-B, the weighted average length of the matrix blocks was 0.32 m, and the characteristic length, LC, was 0.16 m.

5. Case Study for Shut-In Time at Field Scale

Based on the prediction model of flowback efficiency (Equation (3)), and incorporating the results of spontaneous imbibition tests, fracturing flowback fluid salinity, and inferred fracture width, a workflow for the field-scale shut-in time was established (Figure 13).
The detailed steps are as follows:
  • Conduct laboratory-scale spontaneous imbibition tests to determine the shut-in time at the lab scale.
  • Use Equation (5), with parameters such as porosity, permeability, surface tension, and lab-scale shut-in time, to calculate the dimensionless time.
  • Regularly collect and measure the total salinity, ion types, total volume, and flowback efficiency of the fracturing flowback fluid.
  • Calculate the distribution of fracture widths using Equation (10).
  • Utilize Equation (2) by substituting the dimensionless time, flowback efficiency, fracture width, and other parameters calculated in steps 2–4 to compute the matrix block length at the field scale.
  • Determine the characteristic length at the field scale using Equation (6) and calculate the field-scale shut-in time by substituting it into Equation (5).
Based on the above steps, the critical shut-in time for core sample A1 from Lu-A was determined to be 22 h, with a characteristic length of 0.10 m, resulting in a field-scale shut-in time of 12.5 days for Lu-A. For core sample B1 from Wei-B, the laboratory-scale shut-in time was 3.0 h, with a characteristic length of 0.16 m, leading to a field-scale shut-in time of 16.7 days for Wei-B.
According to Equation (5), the field-scale shut-in time is directly proportional to the square of the lab-scale shut-in time and the characteristic length. However, the calculated field-scale shut-in time may seem contradictory based on the salinity test results, as Wei-B has narrower hydraulic fractures and a more complex fracture network. To validate the complexity of the hydraulic fracture network in Wei-B, the post-fracture surface area calculation method proposed by A. Zolfaghari et al. [27] was used, along with the results of imbibition–ion diffusion tests (see Figure 3). The calculated fracture surface areas for Lu-A and Wei-B were 59,744.6 m2 and 125,960.1 m2, respectively. Combined with the calculated fracture width results from Figure 7 (i.e., the weighted average fracture widths for Lu-A and Wei-B were 1.73 mm and 1.30 mm, respectively), it can be concluded that Wei-B had higher salt production, narrower hydraulic fractures, and a larger fracture surface area and volume. Therefore, it is believed that the fracture network at that stage was denser, with smaller spacing between matrix units and a more complex network structure (Figure 14). This complex fracture system effectively reduced the diffusion distance at the micropore level through two key mechanisms: ① the spatial distribution of secondary fractures cut the matrix blocks into smaller units (the weighted average length of Wei-B matrix blocks was 0.32 m vs. 0.20 m of Lu-A), shortening the migration path of the fluid from the matrix to the main fracture; ② the exponential growth of the contact area enabled the fissure–matrix interface area within a unit volume to reach 125,960 m2 (much higher than Luzhou’s 59,744 m2), which greatly accelerated the infiltration and absorption. This geometric feature is consistent with the inverse relationship between the crack width and the contact area in the Zolfaghari model (Equation (10)), explaining why the weighted average crack width (1.30 mm) of Wei-B was narrower but had higher salt ion diffusion efficiency. Eventually, smaller feature lengths (0.16 m and 0.10 m) were calculated through Equation (6). The dominant role of the fracture network morphology in Figure 14 on the feature length was verified. This led to a shorter characteristic length and lab-scale shut-in time for Wei-B, ultimately resulting in a shorter field-scale shut-in time. Hence, the field-scale shut-in time is not a simple linear relationship and needs to consider factors such as flowback fluid salinity, flowback efficiency, and imbibition rate to further study its underlying mechanisms.
Figure 13. Comprehensive workflow for calculating shut-in time of shale gas wells.
Processes 13 01832 g013
The aforementioned calculation method for field-scale shut-in time is suitable for shale gas reservoirs with significant ion diffusion characteristics and high flowback salinity, provided that flowback data from some wells in the area have been obtained. However, for new areas, it is not applicable, and one of the future research directions is to establish a shut-in time optimization method that comprehensively considers factors such as “liquid–salt” profiles, shut-in pressure-decline curves, proppant flowback, etc.

6. Conclusions

(1)
Post-fracturing shut-in is a primary technique for enhancing ultimate gas recovery in shale gas wells. Spontaneous imbibition plays a crucial role in the microscale flow. Conducting spontaneous imbibition tests helps to gain a deeper understanding of the imbibition of fracturing fluid during field-scale shut-in. The results of spontaneous imbibition tests on cores from deep shale gas wells in Luzhou and medium-deep shale gas wells in Weiyuan indicated that during the initial stage of imbibition, water absorption of the cores showed a positive correlation with the square root of time. The time at which water absorption reached a stable stage represented the lab-scale shut-in time.
(2)
The distinctive “liquid–salt” dynamic curve of shale gas wells provides valuable insights for evaluating the morphology of volume fracturing networks. By comparing the variations in salinity and flowback efficiency of the flowback fluid between the deep shale gas wells in Luzhou and the medium-deep shale gas wells in Weiyuan, the characteristics of the fracture width distribution were analyzed. The findings revealed that the flowback fluid from the medium-deep shale gas wells exhibited higher salinity, narrower hydraulic fractures, a larger fracture surface area and volume, denser hydraulic fracture networks, and more complex fracture network morphology.
(3)
Determining the field-scale shut-in time based on dimensionless time models is a conventional research approach, but selecting the characteristic length at the field scale remains a challenge. The field-scale shut-in time does not necessarily exhibit a positive correlation with the lab-scale shut-in time. Its outcomes are influenced by factors such as imbibition rate, salinity of the fracturing flowback fluid, and flowback efficiency. It is crucial to continuously monitor the fluid loss behavior and proppant flowback behavior during shut-in to further refine the optimization method for field-scale shut-in time.

Author Contributions

Methodology, X.Y. (Xinqun Ye); Formal Analysis, Z.L.; Investigation, W.Y. (Wenhua Yu) and T.H.; Resources, X.Y. (Xinxin Yu); Data Curation, X.Z.; Writing—Original Draft, L.L.; Visualization, W.Y. (Wenhai Yu). All authors have read and agreed to the published version of the manuscript.

Funding

The authors would like to express their gratitude for the financial support provided by the General Program Grant from the National Natural Science Foundation of China (No. 52274051) and Sichuan Natural Science Foundation (No. 2023NSFSC0423).

Data Availability Statement

Dataset available on request from the authors—The raw data supporting the conclusions of this article will be made available by the authors on request.

Acknowledgments

The authors would like to express their gratitude for the financial support provided by the General Program Grant from the National Natural Science Foundation of China (No. 52274051) and Sichuan Natural Science Foundation (No. 2023NSFSC0423). Additionally, the authors would like to extend their thanks to the anonymous reviewers for their valuable advice and comments on the manuscript.

Conflicts of Interest

Author Lingdong Li was employed by the company Research Institute of Petroleum Exploration & Development of PetroChina Company Limited. The remaining authors declare that the research was conducted in the absence of any commercial or financial relationships that could be construed as a potential conflict of interest. The [company Research Institute of Petroleum Exploration & Development-companies in affiliation and funding] had no role in the design of the study; in the collection, analyses, or interpretation of data; in the writing of the manuscript, or in the decision to publish the results.

References

  1. Li, L.; Wu, F.; Cao, Y.; Cheng, F.; Wang, D.; Li, H.; Yu, Z.; You, J. Sustainable development index of shale gas exploitation in China, the UK, and the US. Environ. Sci. Ecotechnol. 2022, 12, 100202. [Google Scholar] [CrossRef] [PubMed]
  2. Aruga, K. The U.S. shale gas revolution and its effect on international gas markets. J. Unconv. Oil Gas Resour. 2016, 14, 1–5. [Google Scholar] [CrossRef]
  3. Soeder, D.J. The successful development of gas and oil resources from shales in North America. J. Pet. Sci. Eng. 2018, 163, 399–420. [Google Scholar] [CrossRef]
  4. Edwards, R.W.J.; Celia, M.A. Shale Gas Well, Hydraulic Fracturing, and Formation Data to Support Modeling of Gas and Water Flow in Shale Formations. Water Resour. Res. 2018, 54, 3196–3206. [Google Scholar] [CrossRef]
  5. Dehghanpour, H.; Ezulike, D.O.; Abbasi, M.A.; Hawkes, R.V. A comparative study of flowback rate and pressure transient behavior in multifractured horizontal wells completed in tight gas and oil reservoirs. J. Nat. Gas Sci. Eng. 2014, 17, 82–93. [Google Scholar]
  6. Yu, H.; Xu, W.; Li, B.; Huang, H.; Micheal, M.; Wang, Q.; Huang, M.; Meng, S.; Liu, H.; Wu, H. Hydraulic Fracturing and Enhanced Recovery in Shale Reservoirs: Theoretical Analysis to Engineering Applications. Energy Fuels 2023, 37, 9956–9997. [Google Scholar] [CrossRef]
  7. Yang, L.; Liu, Y.; Wang, W.; Li, M.; Wang, S.; Xu, B.; Shi, Y.; Chen, H. Pore-scale flow mechanism of immiscible gas-assisted gravity drainage in strongly heterogeneous glutenite reservoirs. Int. J. Coal Sci. Technol. 2025, 12, 12. [Google Scholar] [CrossRef]
  8. Meng, M.; Ge, H.; Shen, Y.; Ji, W. Fractal characterization of pore structure and its influence on salt ion diffusion behavior in marine shale reservoirs. Int. J. Hydrogen Energy 2020, 45, 28520–28530. [Google Scholar] [CrossRef]
  9. Eltahan, E.; Rego, F.; Yu, W.; Sepehrnoori, K. Impact of well shut-in after hydraulic-fracture treatments on productivity and recovery of tight oil reservoirs. J. Pet. Sci. Eng. 2021, 203, 108592. [Google Scholar] [CrossRef]
  10. Chen, M.; Bai, J.; Kang, Y.; Chen, Z.; You, L.; Li, X.; Liu, J.; Zhang, Y. Redistribution of fracturing fluid in shales and its impact on gas transport capacity. J. Nat. Gas Sci. Eng. 2021, 86, 103747. [Google Scholar] [CrossRef]
  11. Xu, G.; Jiang, Y.; Shi, Y.; Han, Y.; Wang, M.; Zeng, X. Experimental investigations of fracturing fluid flowback and retention under forced imbibition in fossil hydrogen energy development of tight oil based on nuclear magnetic resonance. Int. J. Hydrogen Energy 2020, 45, 13256–13271. [Google Scholar] [CrossRef]
  12. Ibrahim, A.F.; Nasr-El-Din, H.A. Effect of well shut-in after fracturing operations on near wellbore permeability. J. Pet. Sci. Eng. 2019, 181, 106213. [Google Scholar] [CrossRef]
  13. Wijaya, N.; Sheng, J. Effect of desiccation on shut-in benefits in removing water blockage in tight water-wet cores. Fuel 2019, 244, 314–323. [Google Scholar] [CrossRef]
  14. Li, Q.C.; Wu, J.; Li, Q.; Zhou, X.; Li, Y.; Chi, P.; Han, Y.; Ansari, U.; Cheng, Y. Sediment Instability Caused by Gas Production from Hydrate-Bearing Sediment in Northern South China Sea by Horizontal Wellbore: Sensitivity Analysis. Nat. Resour. Res. 2025, 34, 1595–1620. [Google Scholar]
  15. Li, Q.; Wang, Y.L.; Wang, Y.J.; San, J.; Li, Q.; Foster, G. Synthetic process on hydroxyl-containing polydimethylsiloxane as a thickener in CO2 fracturing and thickening performance test. Energy Sources Part A Recovery Util. Environ. Eff. 2018, 40, 1137–1143. [Google Scholar] [CrossRef]
  16. Wang, M.; Leung, J.Y. Numerical investigation of fluid-loss mechanisms during hydraulic fracturing flow-back operations in tight reservoirs. J. Pet. Sci. Eng. 2015, 133, 85–102. [Google Scholar] [CrossRef]
  17. Habibi, A.; Dehghanpour, H.; Binazadeh, M.; Bryan, D.; Uswak, G. Advances in Understanding Wettability of Tight Oil Formations: A Montney Case Study. SPE Reserv. Evaluation Eng. 2016, 19, 583–603. [Google Scholar] [CrossRef]
  18. Ghanbari, E.; Dehghanpour, H. The fate of fracturing water: A field and simulation study. Fuel 2016, 163, 282–294. [Google Scholar] [CrossRef]
  19. Sharma, M.; Agrawal, S. Impact of Liquid Loading in Hydraulic Fractures on Well Productivity. J. Pet. Technol. 2013, 65, 162–165. [Google Scholar]
  20. Shaibu, R.; Guo, B. The dilemma of soaking a hydraulically fractured horizontal shale well prior to flowback—A decade literature review. J. Nat. Gas Sci. Eng. 2021, 94, 104084. [Google Scholar] [CrossRef]
  21. Lan, Q.; Dehghanpour, H.; Hawkes, R.; Ghanbari, E. Water Loss Versus Soaking Time: Spontaneous Imbibition in Tight Rocks. Energy Technol. 2014, 2, 1033–1039. [Google Scholar] [CrossRef]
  22. Roychaudhuri, B.; Tsotsis, T.; Jessen, K. An Experimental Investigation of Spontaneous Imbibition in Gas Shales. J. Pet. Sci. Eng. 2013, 111, 87–97. [Google Scholar] [CrossRef]
  23. Habibi, A.; Dehghanpour, H.; Kuru, E.; Makhanov, K. Liquid Uptake of Gas Shales: A Workflow to Estimate Water Loss During Shut-in Periods After Fracturing Operations. J. Unconv. Oil Gas Resour. 2014, 7, 22–32. [Google Scholar]
  24. Zhang, X.; Morrow, N.; Ma, S. Experimental Verification of a Modified Scaling Group for Spontaneous Imbibition. Spe Reserv. Eng. 1996, 11, 280–285. [Google Scholar] [CrossRef]
  25. Ma, S.; Morrow, N.; Zhang, X. Generalized Scaling of Spontaneous Imbibition Data for Strongly Water-wet Systems. J. Pet. Sci. Eng. 1997, 18, 165–178. [Google Scholar]
  26. Wu, Y.-S.; Kazemi, H.; Torcuk, M.; Fakcharoenphol, P. Effect of shut-in time on gas flow rate in hydraulic fractured shale reservoirs. J. Nat. Gas Sci. Eng. 2016, 32, 109–121. [Google Scholar]
  27. Wijaya, N.; Sheng, J. Comparative Study of Well Soaking Timing (Pre. Vs. Post Flowback) for Water Block Removal from Matrix-Fracture Interface. Petroleum 2020, 6, 286–292. [Google Scholar]
  28. Hu, J.; Zhao, H.; Du, X.; Zhang, Y. An analytical model for shut-in time optimization after hydraulic fracturing in shale oil reservoirs with imbibition experiments. J. Pet. Sci. Eng. 2022, 210, 110055. [Google Scholar] [CrossRef]
  29. Bertoncello, A.; Honarpour, M.M.; Kabir, C.S.; Wallace, J.; Blyton, C. Imbibition and water blockage in unconventional reservoirs: Well-management implications during flowback and early production. SPE Reserv. Eval. Eng. 2014, 17, 497–506. [Google Scholar] [CrossRef]
  30. Zolfaghari, A.; Dehghanpour, H.; Bearinger, D. Fracture Characterization using Flowback Salt-Concentration Transient. SPE J. 2016, 21, 233–244. [Google Scholar] [CrossRef]
  31. Yang, L.; Wang, S.; Cai, J.; Gan, Y.; Salama, A. Main controlling factors of fracturing fluid imbibition in shale fracture network. Capillarity 2018, 1, 1–10. [Google Scholar] [CrossRef]
  32. Huang, H.; He, D.; Li, Y.; Li, J.; Zhang, L. Silurian tectonic–sedimentary setting and basin evolution in the Sichuan area, southwest China: Implications for palaeogeographic reconstructions. Mar. Pet. Geol. 2018, 92, 403–423. [Google Scholar] [CrossRef]
  33. Ma, X.; Wang, H.; Zhou, S.; Feng, Z.; Liu, H.; Guo, W. Insights into NMR response characteristics of shales and its application in shale gas reservoir evaluation. J. Nat. Gas Sci. Eng. 2020, 84, 103674. [Google Scholar] [CrossRef]
  34. Ma, X.; Xie, J.; Yong, R.; Zhu, Y.Q. Geological characteristics and high production control factors of shale gas reservoirs in silurian longmaxi formation, southern sichuan basin, SW China. Pet. Explor. Dev. 2020, 47, 901–915. [Google Scholar] [CrossRef]
  35. Feng, Y.; Xiao, X.; Gao, P.; Wang, E.; Hu, D.; Liu, R.; Li, G.; Lu, C. Restoration of sedimentary environment and geochemical features of deep marine longmaxi shale and its significance for shale gas: A case study of the dingshan area in the sichuan basin, south China. Mar. Pet. Geol. 2023, 151, 106186. [Google Scholar] [CrossRef]
  36. Yang, L.; Yang, D.; Zhang, M.; Meng, S.; Wang, S.; Su, Y.; Long, X. Application of nano-scratch technology to identify continental shale mineral composition and distribution length of bedding interfacial transition zone—A case study of Cretaceous Qingshankou formation in Gulong Depression, Songliao Basin, NE China. Geoenergy Sci. Eng. 2024, 234, 212674. [Google Scholar] [CrossRef]
  37. Yang, L.; Yang, D.; Li, Y.; Cai, J.; Jiang, X. Nanoindentation study on microscopic mineral mechanics and bedding characteristics of continental shales. Energy 2024, 312, 133614. [Google Scholar] [CrossRef]
  38. Jiang, Y.; Shi, Y.; Xu, G.; Jia, C.; Meng, Z.; Yang, X.; Zhu, H.; Ding, B. Experimental Study on Spontaneous Imbibition under Confining Pressure in Tight Sandstone Cores Based on Low-Field Nuclear Magnetic Resonance Measurements. Energy Fuels 2018, 32, 3152–3162. [Google Scholar] [CrossRef]
  39. Yang, L.; Wang, H.; Xu, H.; Guo, D.; Li, M. Experimental study on characteristics of water imbibition and ion diffusion in shale reservoirs. Geoenergy Sci. Eng. 2023, 229, 212167. [Google Scholar] [CrossRef]
  40. Yang, L.; Ge, H.; Shi, X.; Shen, Y.; Zhang, K.; Qu, X.; Cheng, Y.; Chen, H.; Yang, L. The effect of microstructure and rock mineralogy on water imbibition characteristics in tight reservoirs. J. Nat. Gas Sci. Eng. 2016, 34, 1461–1471. [Google Scholar] [CrossRef]
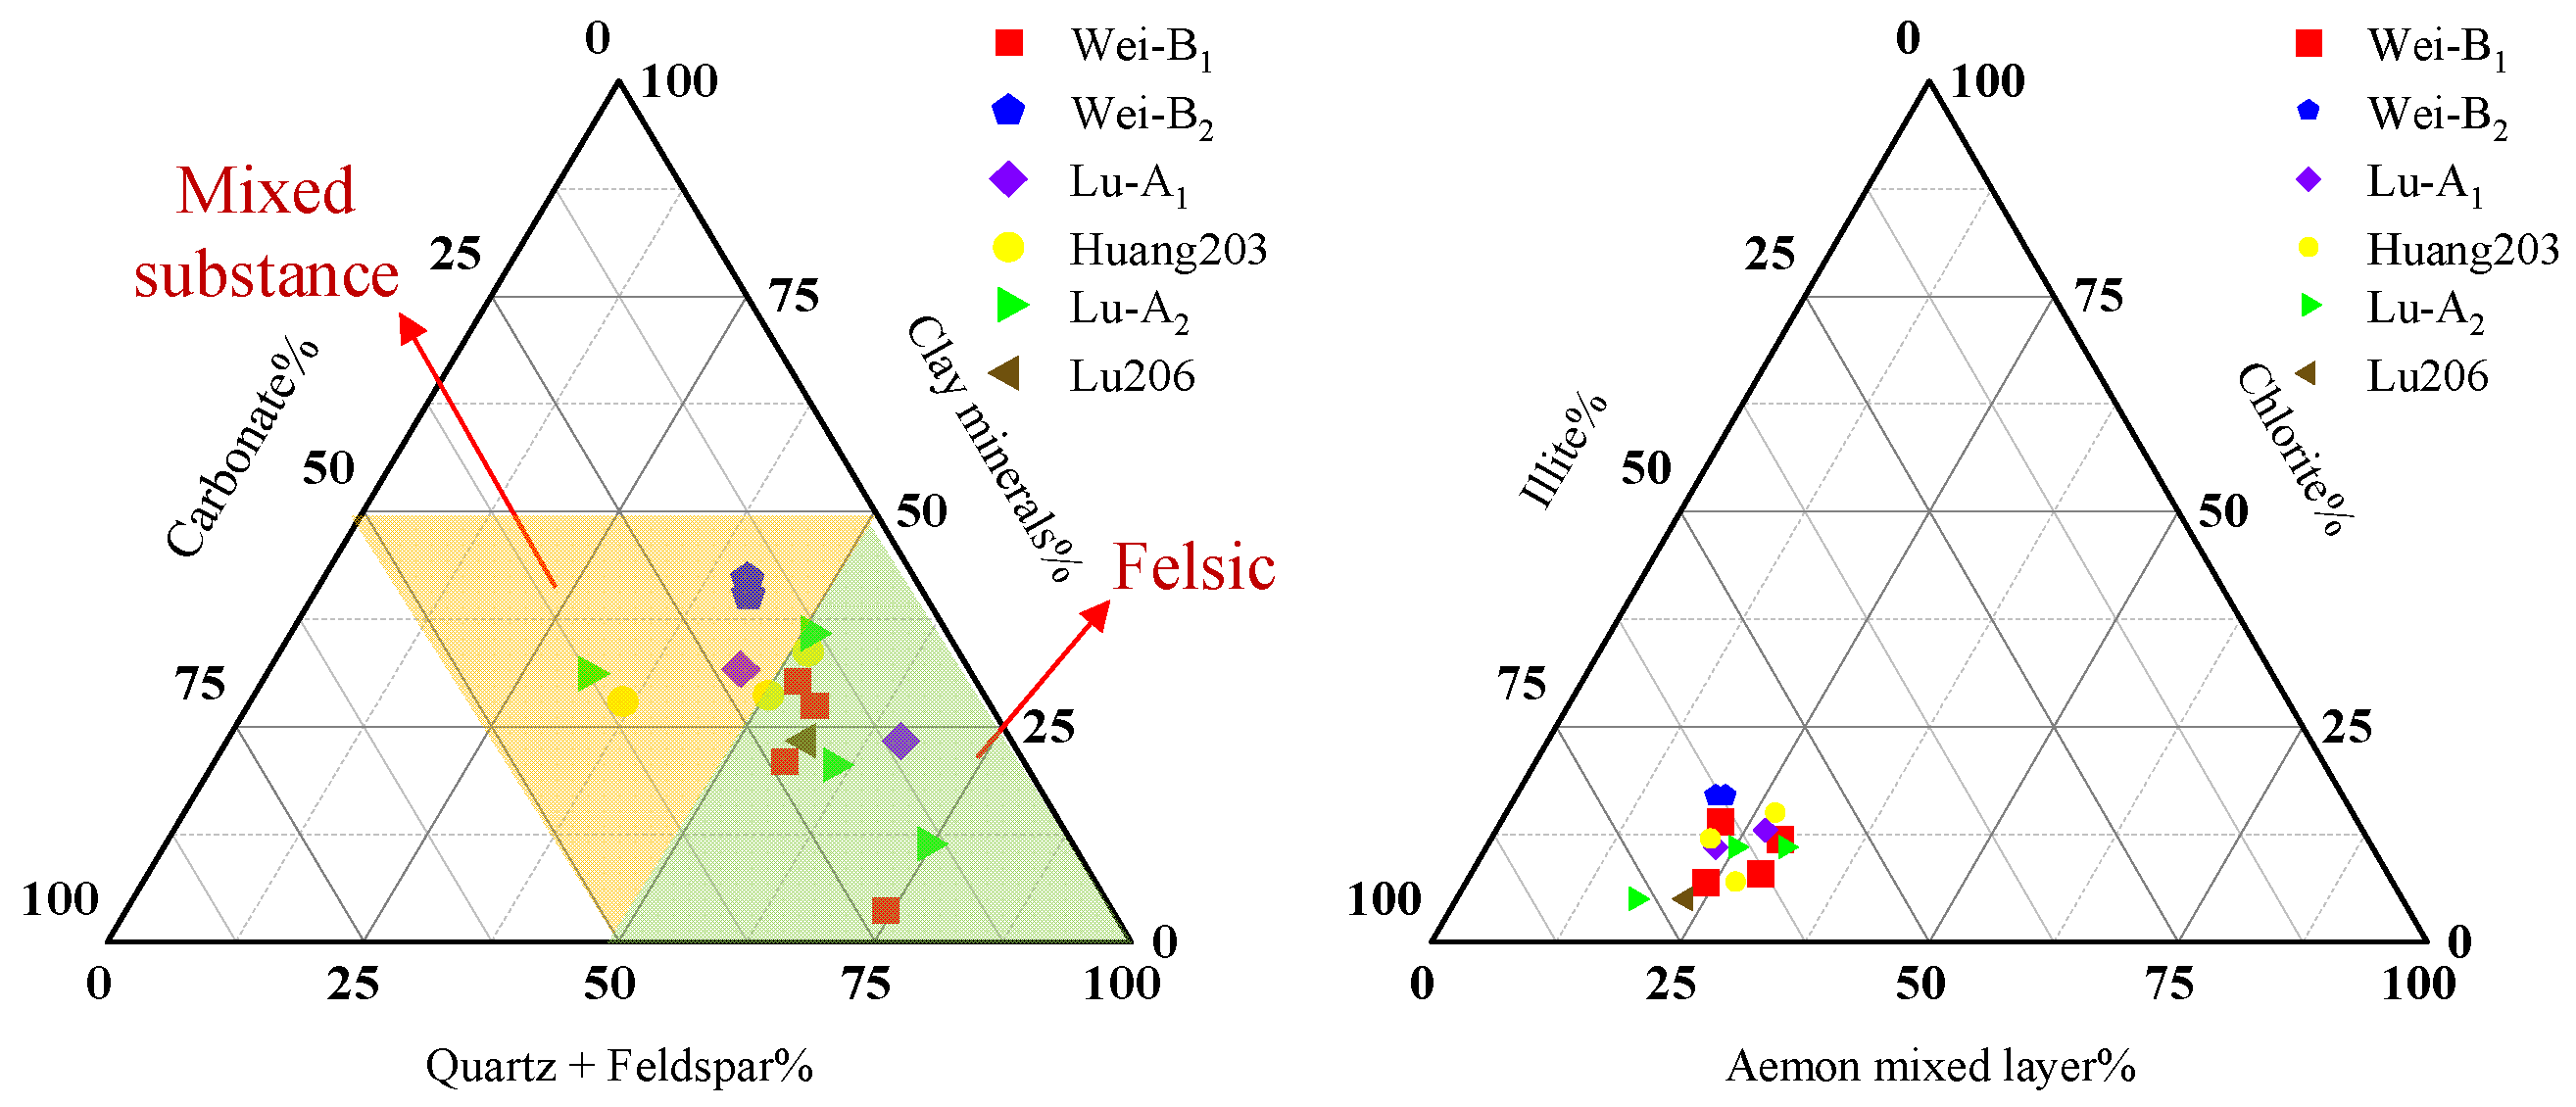
Figure 2. Ternary map of mineral/clay mineral content.
Processes 13 01832 g002
Figure 3. Test results of porosity and permeability of each sample. (a) Porosity, (b) Permeability.
Processes 13 01832 g003
Figure 5. T2 Spectra results for spontaneous imbibition: (a) core A1, (b) core A2, (c) core B1, (d) core B2.
Processes 13 01832 g005
Figure 6. Frequency distribution of T2 values: (a) core A1, (b) core A2, (c) core B1, (d) core B2.
Processes 13 01832 g006
Figure 7. Imbibed volume, T2 spectrum area, and conductivity as a function of time: (a) core A1, (b) core A2, (c) core B1, (d) core B2.
Processes 13 01832 g007
Figure 8. Crack–matrix schematic diagram. (a) Sewing mesh model, (b) schematic diagram of support cracks, (c) schematic diagram of base block seepage and absorption.
Processes 13 01832 g008
Figure 9. Production curve: (a) Wei-A, (b) Lu-B.
Processes 13 01832 g009
Figure 10. Salinity for flowback fracturing fluid: (a) Lu-A, (b) Wei-B.
Processes 13 01832 g010
Figure 11. Distribution of fracture widths: (a) Lu-A, (b) Wei-B.
Processes 13 01832 g011
Figure 12. Schematic diagram of the three-level fracture model and the relationship between cumulative water production and salt concentration. (a) Schematic diagram of the three-level fracture system, (b) Schematic diagram of the relationship between cumulative water production and salt concentration.
Processes 13 01832 g012
Figure 14. Illustration of fracture distribution: (a) Lu-A, (b) Wei-B.
Processes 13 01832 g014
Table 1. Petrophysical properties of shale core samples.
SampleDepth/mLength/cmDiameter/cmMass/gPorosity/%Permeability/10−3 μm2
Lu-A13986.1223.5125.3228.826.210.019
Lu-A23989.1821.3825.1927.465.450.012
Wei-B12705.1822.4625.0027.038.410.120
Wei-B22710.1323.4125.1129.127.890.145
Disclaimer/Publisher’s Note: The statements, opinions and data contained in all publications are solely those of the individual author(s) and contributor(s) and not of MDPI and/or the editor(s). MDPI and/or the editor(s) disclaim responsibility for any injury to people or property resulting from any ideas, methods, instructions or products referred to in the content.