
The Evaluation and Development of a Prediction Artificial Neural Network Model for Specific Volumetric Fuel Efficiency (SVFE) of a Tractor–Chisel Plow System Based on Field Operation

 ,
,
Abstract
1. Introduction
2. Materials and Methods
2.1. The Required Associated Data
2.2. Determination of SVFE Indicator
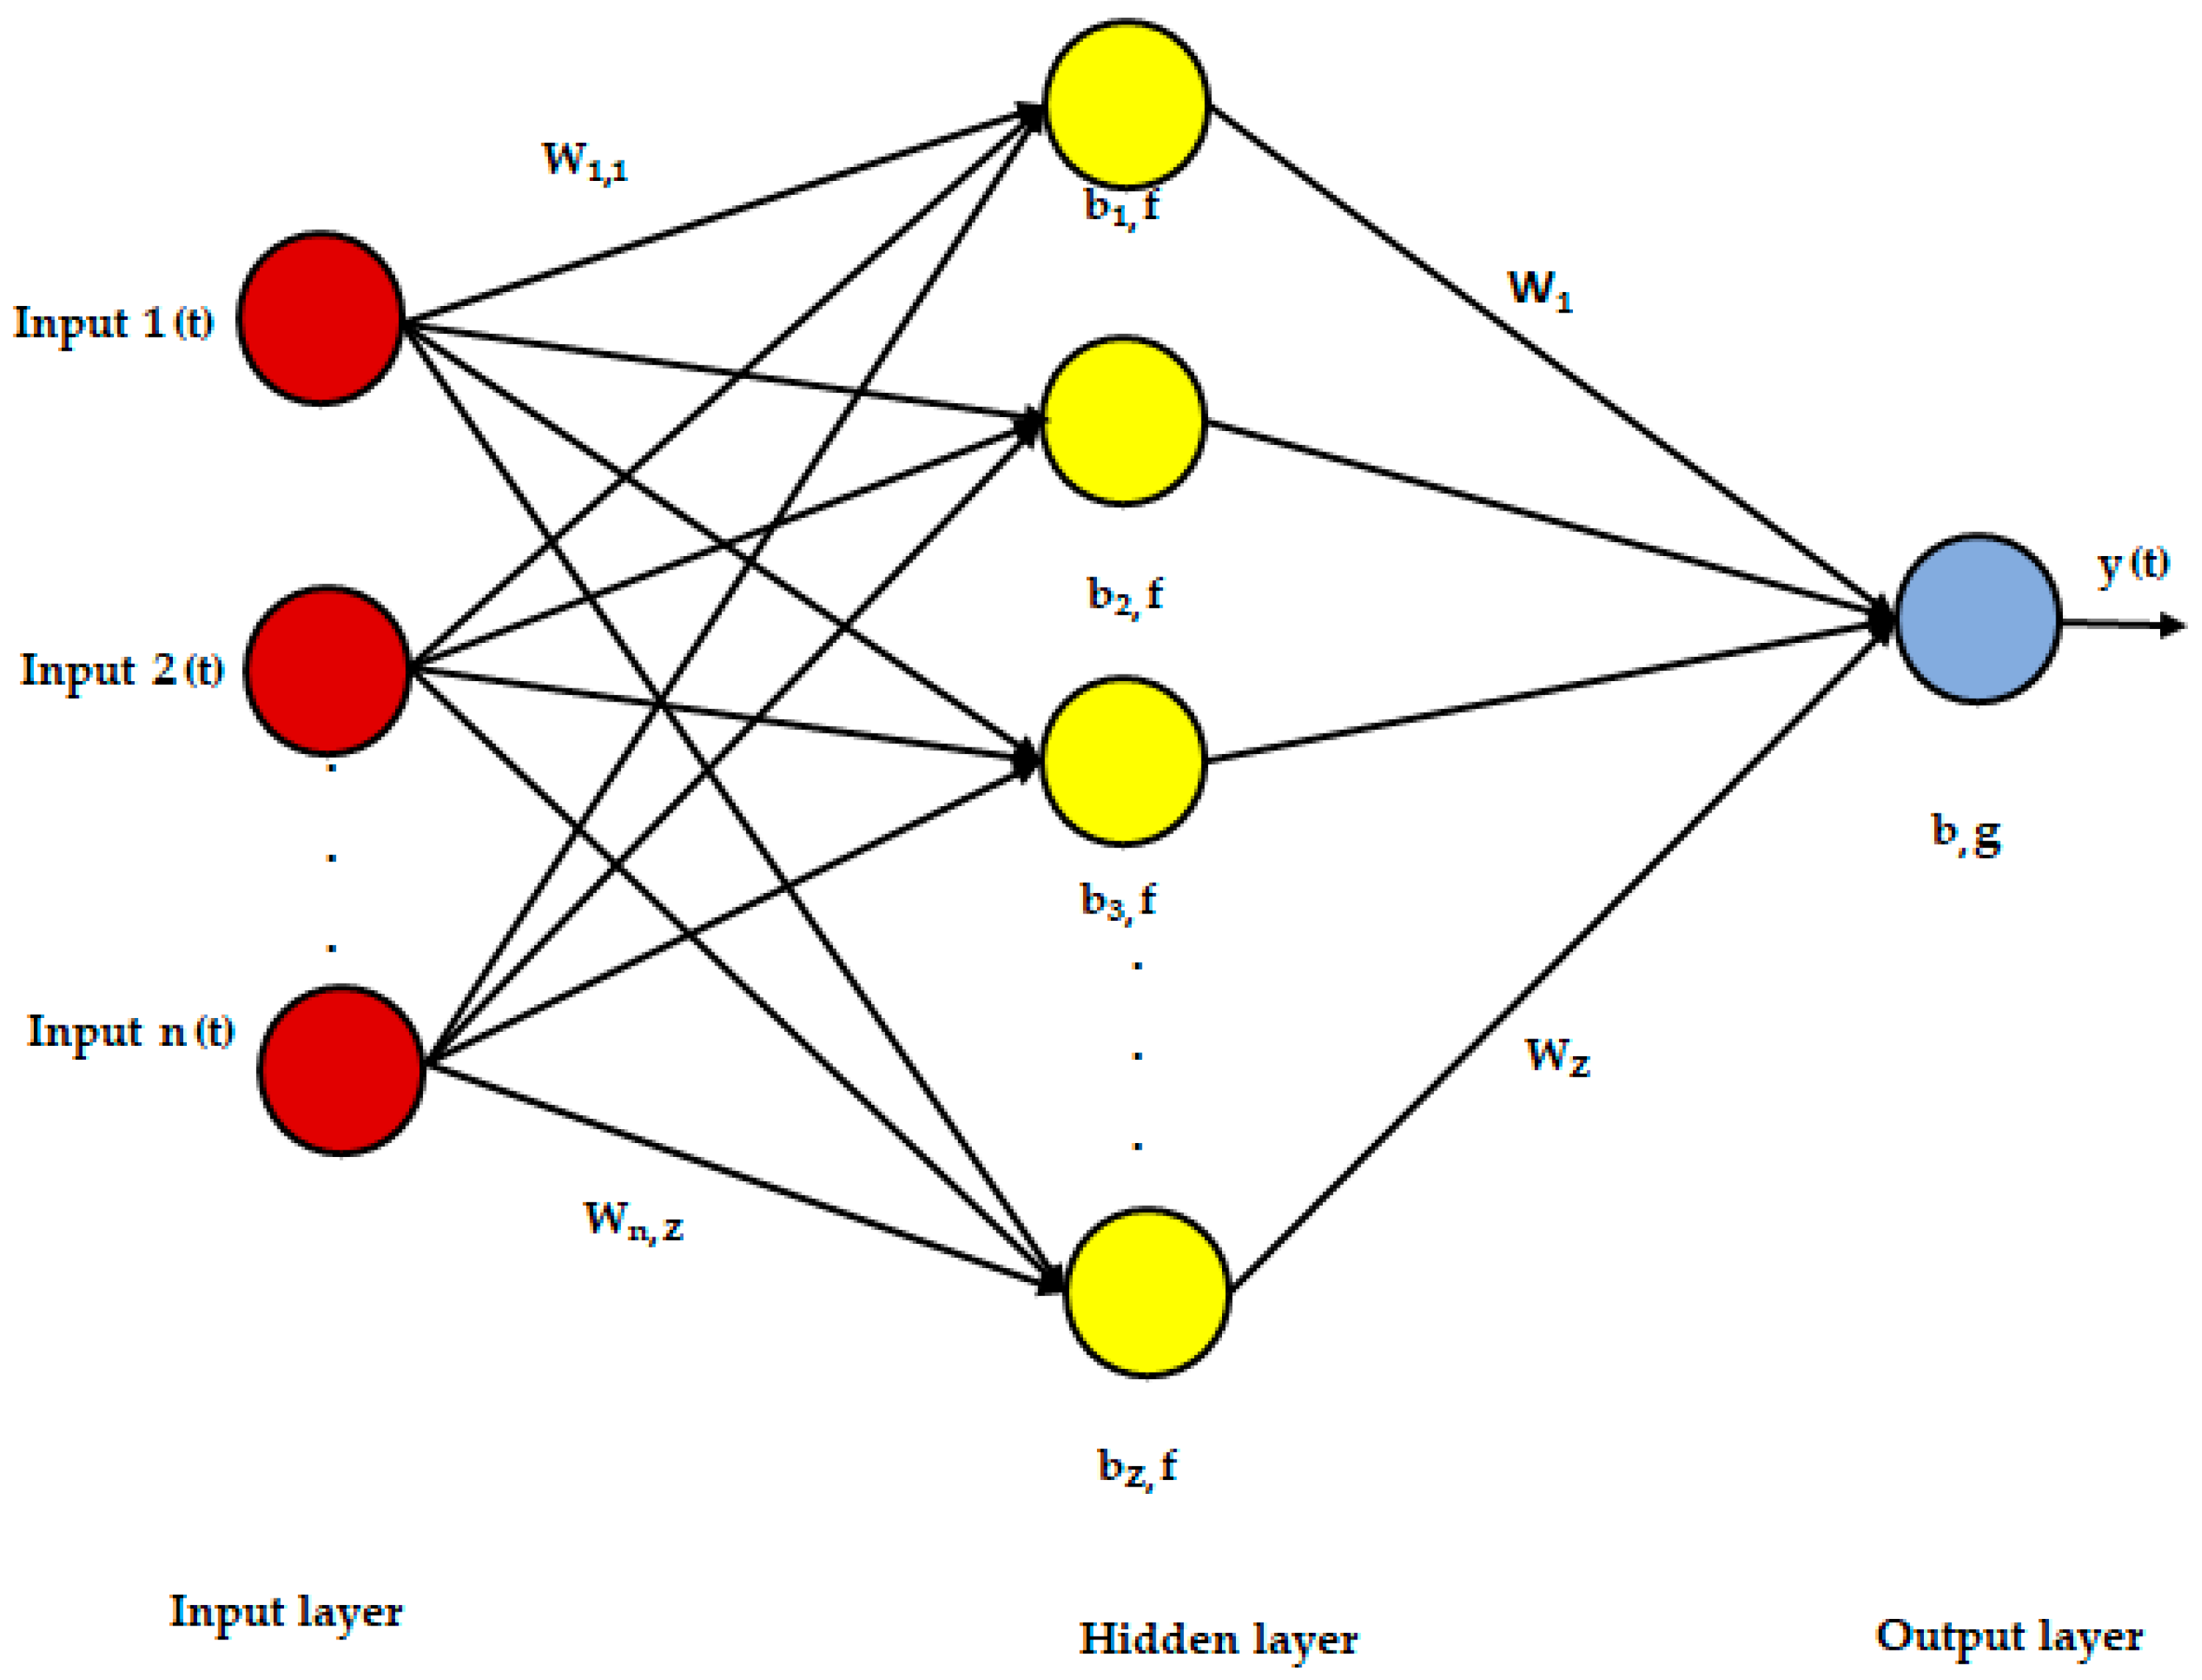
2.3. The Architecture of the Artificial Neural Network Model for SVFE Prediction
2.4. Determining the Influencing Inputs on SVFE Using Contribution Percentages
2.5. The Predictive Accuracy of the Developed ANN Model
3. Results and Discussion
3.1. Analyzing the Applied Dataset
3.2. Performance Analysis of the Developed Artificial Neural Network to Predict the SVFE Indicator
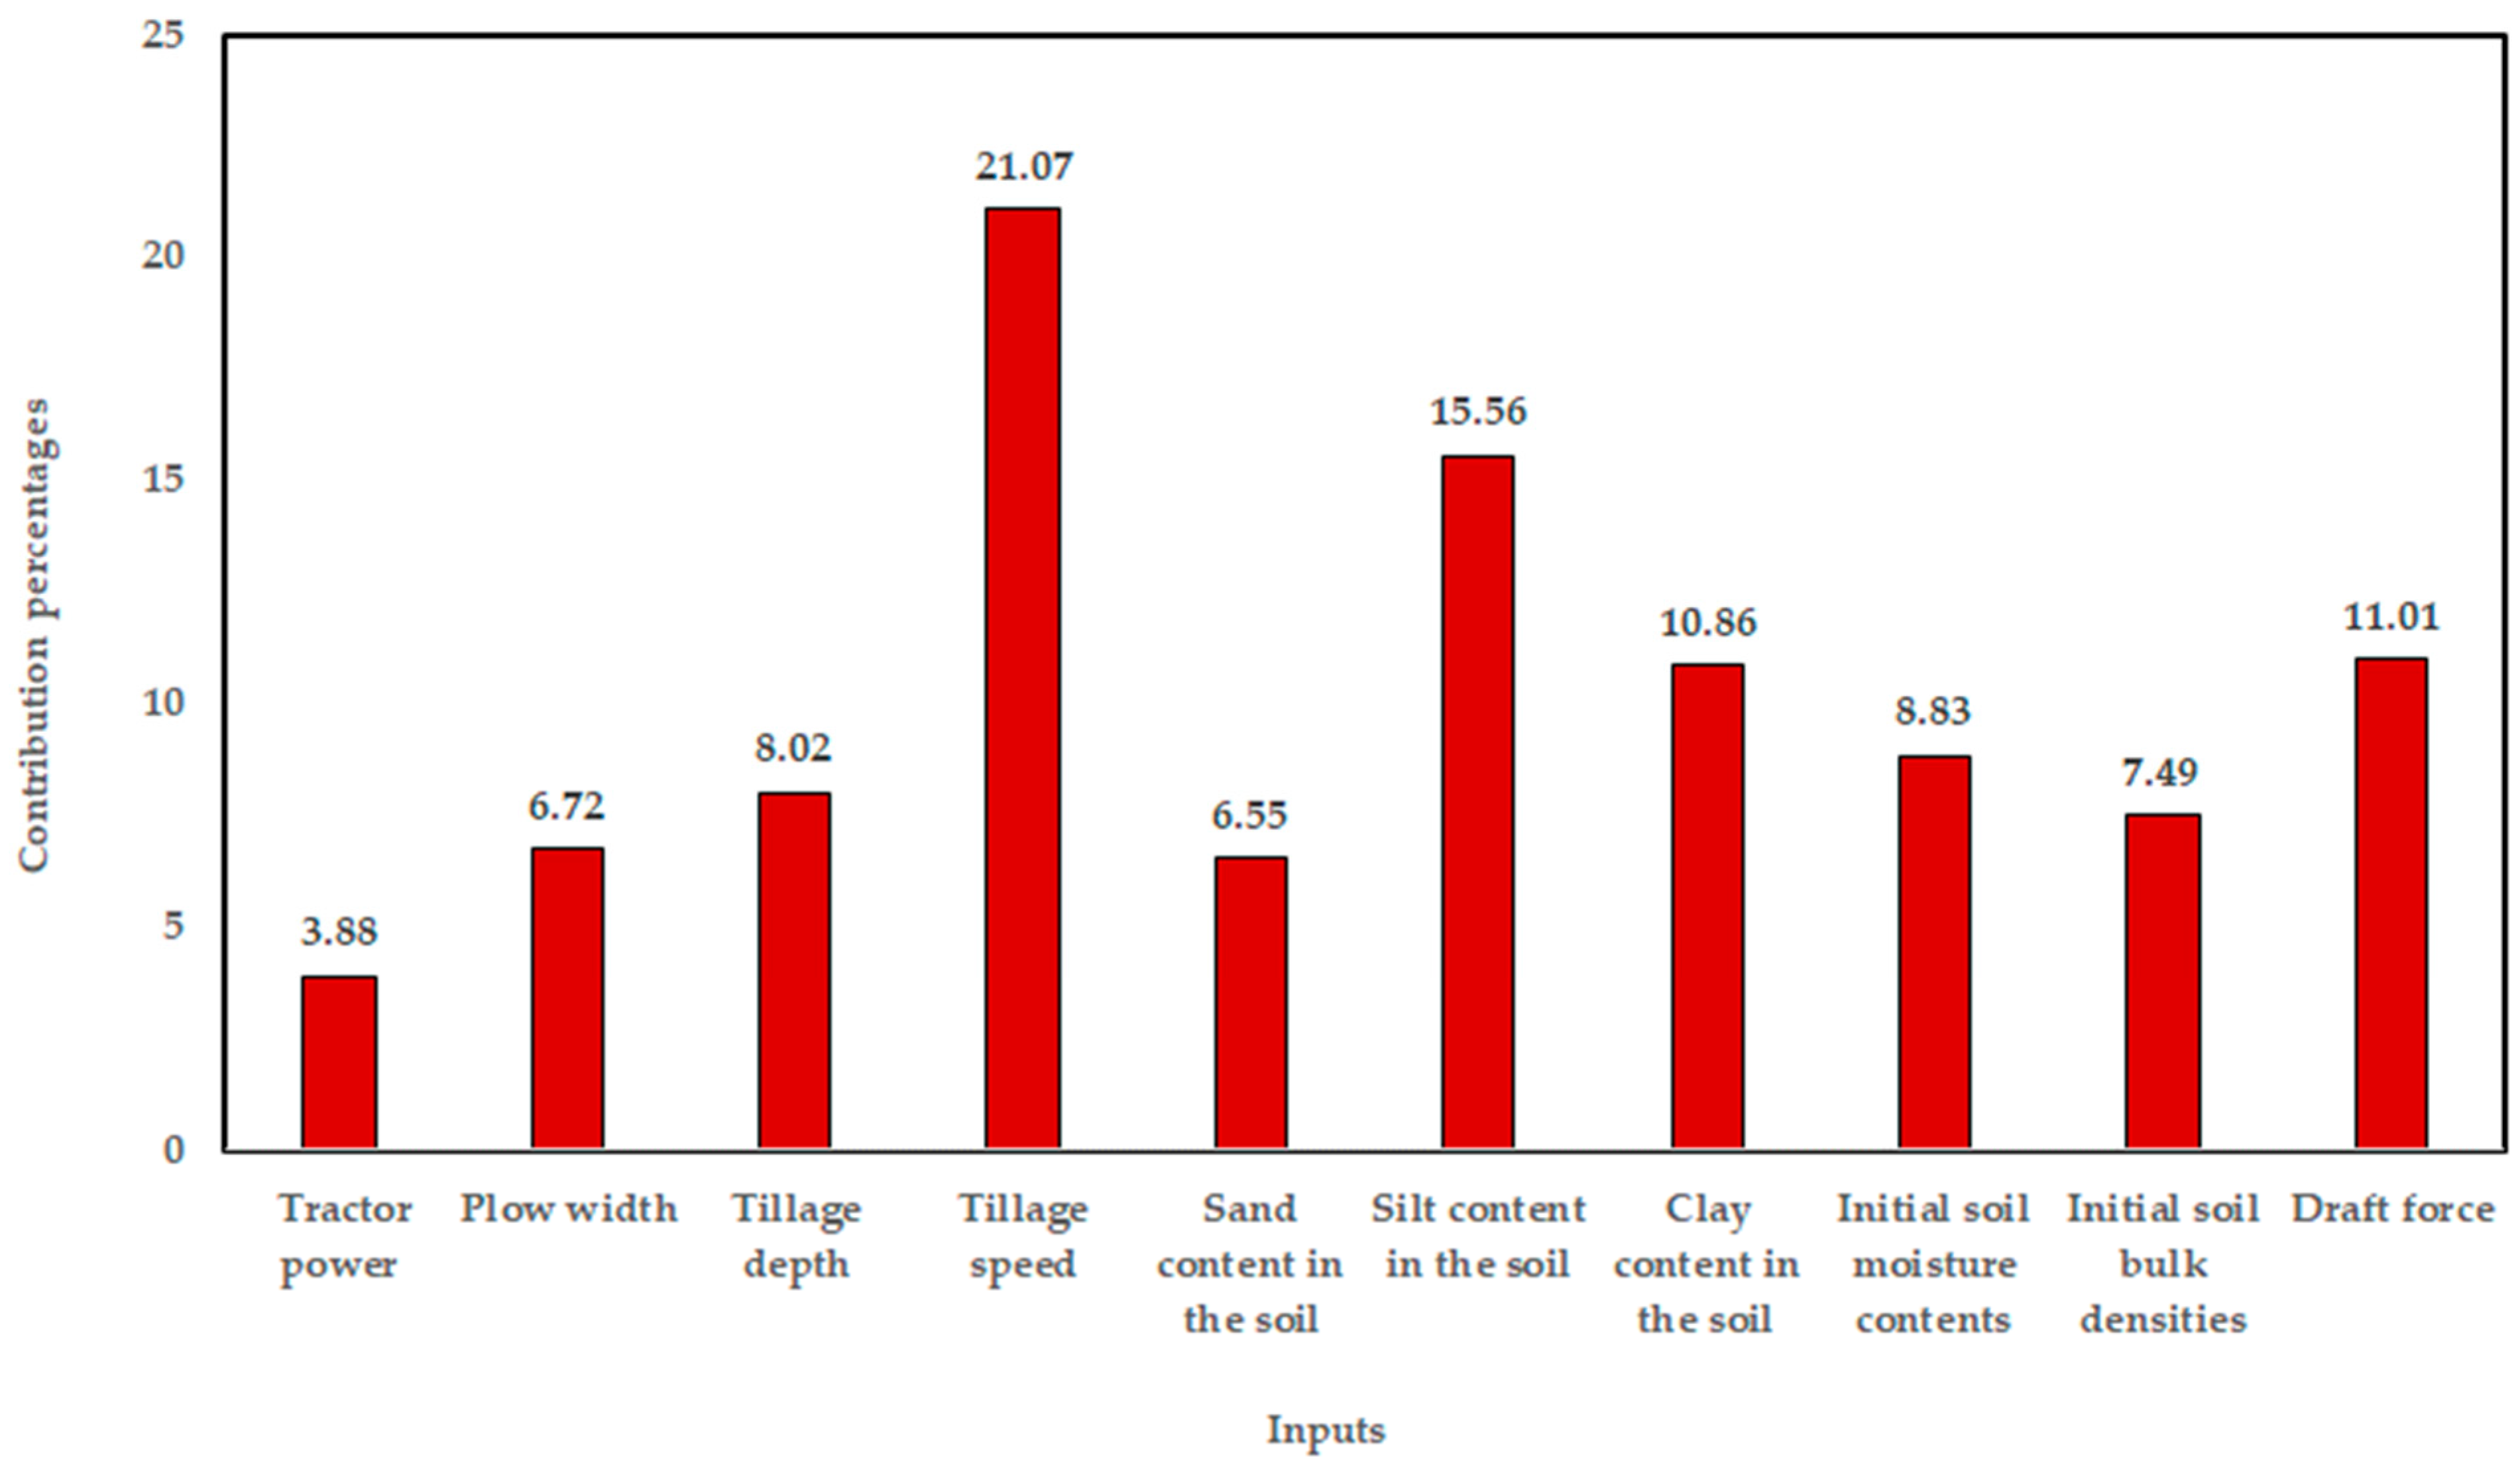
3.3. Result of Contribution Percentages
4. Conclusions
Author Contributions
Funding
Data Availability Statement
Acknowledgments
Conflicts of Interest
References
- Shafaei, S.M.; Loghavi, M.; Kamgar, S. A comparative study between mathematical models and the ANN data mining technique in draft force prediction of disk plow implement in clay loam soil. Agric. Eng. Int. CIGR J. 2018, 20, 71–79. [Google Scholar]
- Olatunji, O.M. Evaluation of plough disc performance on sandy loam soil at different soil moisture levels. Res. J. Appl. Sci. Eng. Technol. 2011, 3, 179–184. [Google Scholar]
- Oduma, O.; Ugwu, E.C.; Ehiomogue, P.; Igwe, J.E.; Ntunde, D.I.; Agu, C.S. Modelling of the effects of working width, tillage depth and operational speed on draft and power requirements of disc plough in sandy-clay soil in South-East Nigeria. Sci. Afr. 2023, 21, e01815. [Google Scholar] [CrossRef]
- Al Nuaimi, B.A.M.; Al Rijabo, S.A. Design and Manufacture of Chisel Plow Shares and Their Effect on Some Field Performance Indicators. Tikrit J. Agric. Sci. 2020, 20, 10–19. [Google Scholar] [CrossRef]
- Canakci, M.; Topakci, M.; Akinci, I.; Özmerzi, A. Energy use pattern of some field crops and vegetable production: Case study for Antalya Region, Turkey. Convers. Manag. 2005, 46, 655–666. [Google Scholar] [CrossRef]
- Tabatabaeefar, A.; Emamzadeh, H.; Varnamkhasti, M.; Rahimizadeh, R.; Karimi, M. Comparison of energy of tillage systems in wheat production. Energy 2009, 34, 41–45. [Google Scholar] [CrossRef]
- Moitzi, G.; Neugschwandtner, R.W.; Kaul, H.-P.; Wagentristl, H. Effect of tillage systems on energy input and energy efficiency for sugar beet and soybean under Pannonian climate conditions. Plant Soil. Environ. 2021, 67, 137–146. [Google Scholar] [CrossRef]
- Fischer, R.; Connor, D. Issues for cropping and agricultural science in the next 20 years. Field Crop. Res. 2018, 222, 121–142. [Google Scholar] [CrossRef]
- Akbarnia, A.; Farhani, F. Study of fuel consumption in three tillage methods. Res. Agric. Eng. 2014, 60, 142–147. [Google Scholar] [CrossRef]
- Tayel, M.Y.; Shaaban, S.M.; Mansour, H.A. Effect of Plowing Conditions on the Tractor Wheel Slippage and Fuel Consumption in Sandy Soil. Int. J. ChemTech Res. 2015, 8, 151–159. [Google Scholar]
- Liu, W.; Li, H.; Cui, Y.; Li, X. Effects of engine load and transmission gear on fuel consumption of four-wheel- drive tractors. Energies 2019, 12, 3619. [Google Scholar]
- Singh, J.; Kumar, S.; Singh, S.; Kmar, P. Study on fuel consumption and emission characteristics of diesel and biodiesel blend in a tractor engine. J. Renew. Sustain. Energy 2021, 14, 013101. [Google Scholar]
- Kim, Y.-S.; Lee, S.-D.; Baek, S.-M.; Baek, S.-Y.; Jeon, H.-H.; Lee, J.-H.; Kim, W.-S.; Shim, J.-Y.; Kim, Y.-J. Analysis of the Effect of Tillage Depth on the Working Performance of Tractor-Moldboard Plow System under Various Field Environments. Sensors 2022, 22, 2750. [Google Scholar] [CrossRef]
- Ekemube, R.A.; Atta, A.T.; Ndirika, V.I.O. Optimization of Fuel Consumption for Tractor-tilled Land Area During Harrowing Operation Using Full Factorial Experimental Design. Covenant J. Eng. Technol. (CJET) 2023, 7, 21–30. [Google Scholar]
- Nebraska Tractor Test Lab, “Tractor Test 2282: John Deere 9RT 590 Diesel”. Nebraska Tractor Tests. 3566. Available online: https://digitalcommons.unl.edu/tractormuseumlit/3566 (accessed on 26 April 2025).
- Nkakini, S.O.; Ekemube, R.A.; Igoni, A.H. Development of predictive model for fuel consumption during ploughing operation in agricultural soil. Eur. J. Eng. Technol. 2019, 7, 16–30. [Google Scholar]
- Kim, W.S.; Park, S.U.; Choi, C.H.; Kim, Y.J. Analysis of Traction Performance of Agricultural Tractor according to Cone Index during Plow Tillage. J. Drive Control 2020, 17, 133–140. [Google Scholar]
- Küçüksarıyıldız, H.; Çarman, K.; Sabancı, K. Prediction of specific fuel consumption of 60 HP 2WD tractor using artificial neural networks. Int. J. Automot. Sci. Technol. 2021, 5, 436–444. [Google Scholar] [CrossRef]
- Kara Togun, N.; Baysec, S. Prediction of Torque and Specific Fuel Consumption of a Gasoline Engine by Using Artificial Neural Networks. Appl. Energy 2010, 87, 349–355. [Google Scholar] [CrossRef]
- Kim, S.-J.; Jang, M.-K.; Hwang, S.-J.; Lee, W.S.; Nam, J.-S. Development of a Prediction Model for Specific Fuel Consumption in Rotary Tillage Based on Actual Operation. Agriculture 2024, 14, 1993. [Google Scholar] [CrossRef]
- Al-Sager, S.M.; Almady, S.S.; Marey, S.A.; Al-Hamed, S.A.; Aboukarima, A.M. Prediction of Specific Fuel Consumption of a Tractor during the Tillage Process Using an Artificial Neural Network Method. Agronomy 2024, 14, 492. [Google Scholar] [CrossRef]
- Grisso, R.D.; Kocher, M.F.; Vaughan, D.H. Predicting tractor fuel consumption. Appl. Eng. Agric. 2004, 20, 553–561. [Google Scholar] [CrossRef]
- Mwiti, F.; Gitau, A.; Mbuge, D. Evaluation of artificial neurocomputing algorithms and their metacognitive robustness in predictive modeling of fuel consumption rates during tillage. Comput. Electron. Agric. 2024, 224, 109221. [Google Scholar] [CrossRef]
- Parlak, A.; Islamoglu, Y.; Yasar, H.; Egrisogut, A. Application of Artificial Neural Network to Predict Specific Fuel Consumption and Exhaust Temperature for a Diesel Engine. Appl. Therm. Eng. 2006, 26, 824–828. [Google Scholar] [CrossRef]
- Lorenc, A. Predicting Fuel Consumption by Artificial Neural Network (ANN) Based on the Regular City Bus Lines. Sustainability 2025, 17, 1678. [Google Scholar] [CrossRef]
- Almaliki, S.; Alimardani, R.; Omid, M. Artificial neural network-based modeling of tractor performance at different field conditions. Agric. Eng. Int. CIGR J. 2016, 18, 262–274. [Google Scholar]
- Nagar, H.; Machavaram, R.; Kulkarni, P.; Soni, P. AI-based engine performance prediction cum advisory system to maximise fuel efficiency and field performance of the tractor for optimum tillage. Syst. Sci. Control Eng. 2024, 12, 2347936. [Google Scholar] [CrossRef]
- Zhang, M.; Wang, N.; Zhou, S. Research on Fuel Economy of Hydro-Mechanical Continuously Variable Transmission Rotary-Tilling Tractor. Energies 2025, 18, 1490. [Google Scholar] [CrossRef]
- Al-Najjar, S.Q.J.; Jasim, H.A. Analysis of Chisel Plough Shovel Designs Using Finite Element Methods. Iraqi J. Ind. Res. 2024, 11, 41–52. [Google Scholar] [CrossRef]
- Forgó, Z.; Tolvaly-Roșca, F.; Pásztor, J.; Kovari, A. Energy Consumption Evaluation of Active Tillage Machines Using Dynamic Modelling. Appl. Sci. 2021, 11, 6240. [Google Scholar] [CrossRef]
- Özbayer, M.M.; Güner, M. Comparison of performance characteristics of agricultural tractors. J. Agric. Fac. Gaziosmanpaşa Univ. (JAFAG) 2022, 39, 6–18. [Google Scholar]
- ASAE D497.7 MAR2011. Agricultural Machinery Management Data; ASABE: St. Joseph, MI, USA, 2011. [Google Scholar]
- RNAM Standard; RNAM Test Codes and Procedures for Farm Machinery/Economic and Social Commission for Asia and the Pacific, Regional Network for Agricultural Machinery. RNAM Technical Publications: Bangkok, Thailand, 1995.
- Aboukarima, A.M. Artificial Neural Networks Configuration for Predicting Performance of Tillage Implements Under Egyptian Conditions. Ph.D. Thesis, Agricultural Engeneering Departement, Faculty of Agriculture, Ain Shams University, Shubra Al Kheimah, Awal Shubra Al Kheimah, Al Qalyubia Governorate, Egypt, 2004. [Google Scholar]
- McCulloch, W.S.; Pitts, W.H. A logical calculus of the ideas immanent in nervous activity. Bull. Math. Biophys. 1943, 5, 115–133. [Google Scholar] [CrossRef]
- Hinton, G.E. How neural networks learn from experience. Sci. Am. 1992, 267, 144–151. [Google Scholar] [CrossRef]
- Cybenko, G. Approximation by superpositions of a sigmoidal function. Math. Control Signals Syst. 1989, 2, 303–314. [Google Scholar] [CrossRef]
- Hornik, K.; Stinchombe, M.; White, H. Multi-layer feed-forward networks are universal approximators. Neural Netw. 1989, 2, 359–366. [Google Scholar] [CrossRef]
- Muggerud, H. Feed-Forward Neural Networks and How to Explain Their Predictions. Bachelor’s Thesis, Norwegian University of Science and Technology, Trondheim, Norway, 2021. [Google Scholar]
- Koutsoukas, A.; Monaghan, K.J.; Li, X.; Huan, J. Deep-learning: Investigating deep neural networks hyper-parameters and comparison of performance to shallow methods for modeling bioactivity data. J. Cheminform. 2017, 9, 42. [Google Scholar] [CrossRef] [PubMed]
- Fogno Fotso, H.R.; Aloyem Kazé, C.V.; Kenmoe, G.D. Optimal Input Variables Disposition of Artificial Neural Networks Models for Enhancing Time Series Forecasting Accuracy. Appl. Artif. Intell. 2020, 34, 792–815. [Google Scholar] [CrossRef]
- Fazeli, H.; Soleimani, R.; Ahmadi, M.A.; Badrnezhad, R.; Mohammadi, A.H. Experimental study and modelling of ultra-fltration of refnery efuents using a hybrid intelligent approach. J. Energy 2013, 27, 3523–3537. [Google Scholar]
- Vesta Services, Inc. Qnet v2000 Shareware; Vesta Services, Inc.: Winnetka, IL, USA, 2000. [Google Scholar]
- Al-Sulaiman, M.A.; Aboukarima, A.M. An interactive application using C-sharp language for predicting cumulative infiltration rate of water in soil. Egypt. J. Agric. Res. 2017, 95, 251–268. [Google Scholar]
- Bakas, I.; Kontoleon, K.J. Performance Evaluation of Artificial Neural Networks (ANN) Predicting Heat Transfer through Masonry Walls Exposed to Fire. Appl. Sci. 2021, 11, 11435. [Google Scholar] [CrossRef]
- Altikat, S.; Celik, A.; Boydas, M.G.; Malasli, M.Z.; Altikat, A. Chisel plow characteristics impact on power-fuel consumption, stubble cover, and surface roughness using deep learning neural networks with sensitivity analysis. Sci. Rep. 2024, 14, 28804. [Google Scholar] [CrossRef]
- Chen, X.; Chen, J. Optimization of the Impeller Geometry for an Automotive Torque Converter Using Response Surface Methodology and Desirability Function. Open J. Appl. Sci. 2020, 10, 455–475. [Google Scholar] [CrossRef]
- Sammen, S.S.; Kisi, O.; Ehteram, M.; El-Shafie, A.; Al-Ansari, N.; Ghorbani, M.A.; Bhat, S.A.; Ahmed, A.N.; Shahid, S. Rainfall modeling using two different neural networks improved by metaheuristic algorithms. Environ. Sci. Eur. 2023, 35, 112. [Google Scholar] [CrossRef]
- Tsae, N.B.; Adachi, T.; Kawamura, Y. Application of artificial neural network for the prediction of copper ore grade. Minerals 2023, 13, 658. [Google Scholar] [CrossRef]
- Qazi, A.; Fayaz, H.; Wadi, A.; Raj, R.G.; Rahim, N.A.; Khan, W.A. The artificial neural network for solar radiation prediction and designing solar systems: A systematic literature review. J. Clean. Prod. 2015, 104, 1–12. [Google Scholar] [CrossRef]
- Goyal, S.K.; Samsher; Chandra, S. A study on fuel consumption and work performance of different tractors with tillage implements. Prog. Agric. 2010, 10, 270–274. [Google Scholar]
- Taiwo, A. Fuel Consumption Pattern of Some Selected Tillage Systems on the Atabadzi Soil Series of Ghana. Int. J. Res. Agric. Sci. 2015, 2, 2348–3997. [Google Scholar]
- Burgun, C.; Lacour, S.; Delacroix, A.; Descombes, G.; Doyen, V. Computing time and fuel requirements to assess efficiency of a field work from conventional laboratory tests: Application to a plowing operation. Agric. Food Sci. 2013, 22, 247–261. [Google Scholar] [CrossRef]
- Jebur, H.A.; Alsayyah, Y.A.A. The effect of soil moisture content on the energy requirement and fuel consumption of the machinery unit. Int. J. Eng. Sci. Res. Technol. 2016, 5, 261–266. [Google Scholar]
- Zheng, K.; Cheng, J.; Xia, J.; Liu, G.; Xu, L. Effects of Soil Bulk Density and Moisture Content on the Physico-Mechanical Properties of Paddy Soil in Plough Layer. Water 2021, 13, 2290. [Google Scholar] [CrossRef]
- Karparvarfard, S.H.; Rahmanian-Koushkaki, H. Development of a fuel consumption equation: Test case for a tractor chisel-ploughing in a clay loam soil. Biosyst. Eng. 2015, 130, 23–33. [Google Scholar] [CrossRef]
- Rashidi, M.; Najjarzadeh, I.; Jaberinasab, B.; Emadi, S.M.; Fayyazi, M. Effect of soil moisture content, tillage depth and operation speed on draft force of moldboard plow. Middle East J. Sci. Res. 2013, 16, 245–249. [Google Scholar]
- Kareem, K.I.; Sven, P. Effect of Ploughing Depth, Tractor Forward Speed, and Plough Types on the Fuel Consumption and Tractor Performance. Polytech. J. 2019, 9, 43–49. [Google Scholar] [CrossRef]
- Nkakini, S.O.; Ekemube, R.A. Evaluation of the Effects of Tractor Forward Speed and Tillage Depth on Fuel Consumption during Ploughing Operation. J. Newviews Eng. Technol. (JNET) 2020, 2, 60–69. [Google Scholar]
- Singh, J.; Chatha, S.S.; Sidhu, B.S. Influence of Tillage Depth and Plough Speed on Performance of Primary Tillage Tools. Asian J. Eng. Appl. Technol. 2018, 7, 138–142. [Google Scholar] [CrossRef]
- Shafaei, S.M.; Loghavi, M.; Kamgar, S. Scrutinization of overall energy efficiency of machinery in plowing process. Agric. Eng. Int. CIGR J. 2023, 25, 77–88. [Google Scholar]
- Fathollahzadeh, H.; Mobli, H.; Tabatabaie, S.M.H. Effect of Ploughing Depth an Average and Instantaneous Tractor Fuel Consumption with Three-Share Disc Plough. Int. Agrophys. 2009, 23, 399–402. [Google Scholar]
- Moitzi, G.; Wagentrist, H.; Refenner, K.; Weingartmann, H.; Piringer, G.; Boxberger, J.; Gronauer, A. Effects of Working Depth and wheel Slip on Fuel Consumption of Selected Tillage Implements. Agric. Eng. Int. CIGR J. 2014, 16, 282–290. [Google Scholar]
- Siami-Irdemoosa, E.; Dindarloo, S.R. Prediction of Fuel Consumption of Mining Dump Trucks: A Neural Networks Approach. Appl. Energy 2015, 151, 77–84. [Google Scholar] [CrossRef]
- Jalilnezhad, H.; Abbaspour-Gilandeh, Y.; Rasooli-Sharabiani, V.; Mardani, A.; Hernández-Hernández, J.L.; Montero-Valverde, J.A.; Hernández-Hernández, M. Use of a convolutional neural network for predicting fuel consumption of an agricultural tractor. Resources 2023, 12, 46. [Google Scholar] [CrossRef]
- Igoni, A.H.; Ekemube, R.A.; Nkakini, S.O. Predicting tractor fuel consumption during ridging on a sandy loam soil in a humid tropical climate. J. Eng. Technol. Res. 2019, 11, 29–40. [Google Scholar]
- Shafaei, S.M.; Loghavi, M.; Kamgar, S. Prognostication of energy indices of tractor-implement utilizing soft computing techniques. Inf. Process. Agric. 2019, 6, 132–149. [Google Scholar] [CrossRef]


| Parameters | Mean | Minimum | Maximum | Standard Deviation | CV, % | CNU, % | No. of Data Points |
|---|---|---|---|---|---|---|---|
| NTP, kW | 62.14 | 25.35 | 104.40 | 21.85 | 35.16 | 127.20 | 112 |
| PW, m | 1.79 | 1.05 | 3.10 | 0.26 | 14.70 | 114.31 | 112 |
| TD, cm | 16.08 | 10.50 | 22.00 | 2.56 | 15.95 | 71.54 | 112 |
| TS, km/h | 3.49 | 1.06 | 5.29 | 0.94 | 27.00 | 121.07 | 112 |
| Sand content, % | 34.08 | 11.38 | 55.71 | 15.05 | 44.16 | 130.06 | 112 |
| Silt content, % | 26.99 | 15.60 | 55.20 | 10.62 | 39.36 | 146.71 | 112 |
| Clay content, % | 38.89 | 19.07 | 53.20 | 8.71 | 22.39 | 87.75 | 112 |
| IMCS, db% | 20.04 | 10.42 | 28.16 | 2.91 | 14.52 | 88.54 | 112 |
| IBSD, g/cm3 | 1.33 | 1.17 | 1.62 | 0.11 | 8.42 | 34.24 | 112 |
| FC, L/h | 13.89 | 7.00 | 19.74 | 3.52 | 25.34 | 91.70 | 112 |
| Draft force, kN | 17.21 | 12.45 | 23.65 | 2.83 | 16.47 | 65.08 | 112 |
| DPP, kW | 16.9 | 3.67 | 29.52 | 5.85 | 34.60 | 152.80 | 112 |
| SVFE, kWh/L | 1.31 | 0.22 | 2.90 | 0.55 | 42.46 | 205.61 | 112 |
| Independent Variables (10 Inputs) | ||||||||||
|---|---|---|---|---|---|---|---|---|---|---|
| Tractor Power | Plow Width | Tillage Depth | Tillage Speed | Sand Content | Silt Content | Clay Content | IMCS | IBSD | Draft Force | Dependent Variable, (Output), SVFE |
| (kW) | (m) | (cm) | (km/h) | (%) | (%) | (%) | (db%) | (g/cm3) | (kN) | (kWh/L) |
| 59.66 | 1.75 | 14.91 | 4.87 | 29.81 | 17.88 | 52.31 | 22.35 | 1.40 | 19.21 | 2.90 |
| 48.47 | 1.75 | 15.00 | 4.76 | 11.38 | 40.46 | 48.16 | 19.70 | 1.24 | 18.89 | 2.83 |
| 56.67 | 1.75 | 20.00 | 4.20 | 17.70 | 53.20 | 29.10 | 15.40 | 1.52 | 23.59 | 2.71 |
| 82.03 | 1.75 | 15.00 | 5.15 | 55.71 | 15.60 | 28.69 | 22.53 | 1.21 | 18.48 | 2.55 |
| 104.40 | 1.75 | 16.00 | 4.86 | 30.92 | 24.43 | 44.65 | 18.00 | 1.28 | 20.58 | 2.35 |
| 33.56 | 1.75 | 20.00 | 4.15 | 38.80 | 16.28 | 44.92 | 18.20 | 1.58 | 23.65 | 2.13 |
| 44.74 | 1.75 | 15.00 | 3.08 | 17.25 | 40.00 | 42.75 | 21.57 | 1.62 | 15.73 | 1.92 |
| 56.67 | 1.75 | 20.00 | 3.10 | 17.70 | 53.20 | 29.10 | 15.40 | 1.51 | 20.70 | 1.86 |
| 55.93 | 1.50 | 13.00 | 2.98 | 29.81 | 17.88 | 52.31 | 18.96 | 1.39 | 13.47 | 1.25 |
| 59.66 | 1.75 | 18.60 | 4.30 | 22.80 | 31.20 | 46.00 | 17.00 | 1.48 | 22.53 | 1.48 |
| Independent Factor (Y) | Dependent Factor (X) | Intercept (a) | Slope (b) | Correlation Coefficient |
|---|---|---|---|---|
| SVFE, kWh/L | NTP, kW | 0.0052 | 0.9835 | 0.2045 |
| PW, m | 0.0681 | 1.1839 | 0.0322 | |
| TD, cm | −0.0042 | 1.3744 | −0.0197 | |
| TS, km/h | 0.4179 | −0.1108 | 0.7055 | |
| Sa,% | −0.0042 | 1.4477 | −0.1128 | |
| Si,% | 0.0048 | 1.1763 | 0.0921 | |
| Ca,% | 0.0053 | 1.0993 | 0.0835 | |
| IMCS, db% | 0.0063 | 1.1807 | 0.0328 | |
| IBSD, g/cm3 | 0.4760 | 1.3307 | 0.1350 | |
| Draft force, kN | 0.0928 | −0.2917 | 0.4744 |
| Dataset | MAE (kWh/L) | RMSE (kWh/L) | MAPE (%) | R2 |
|---|---|---|---|---|
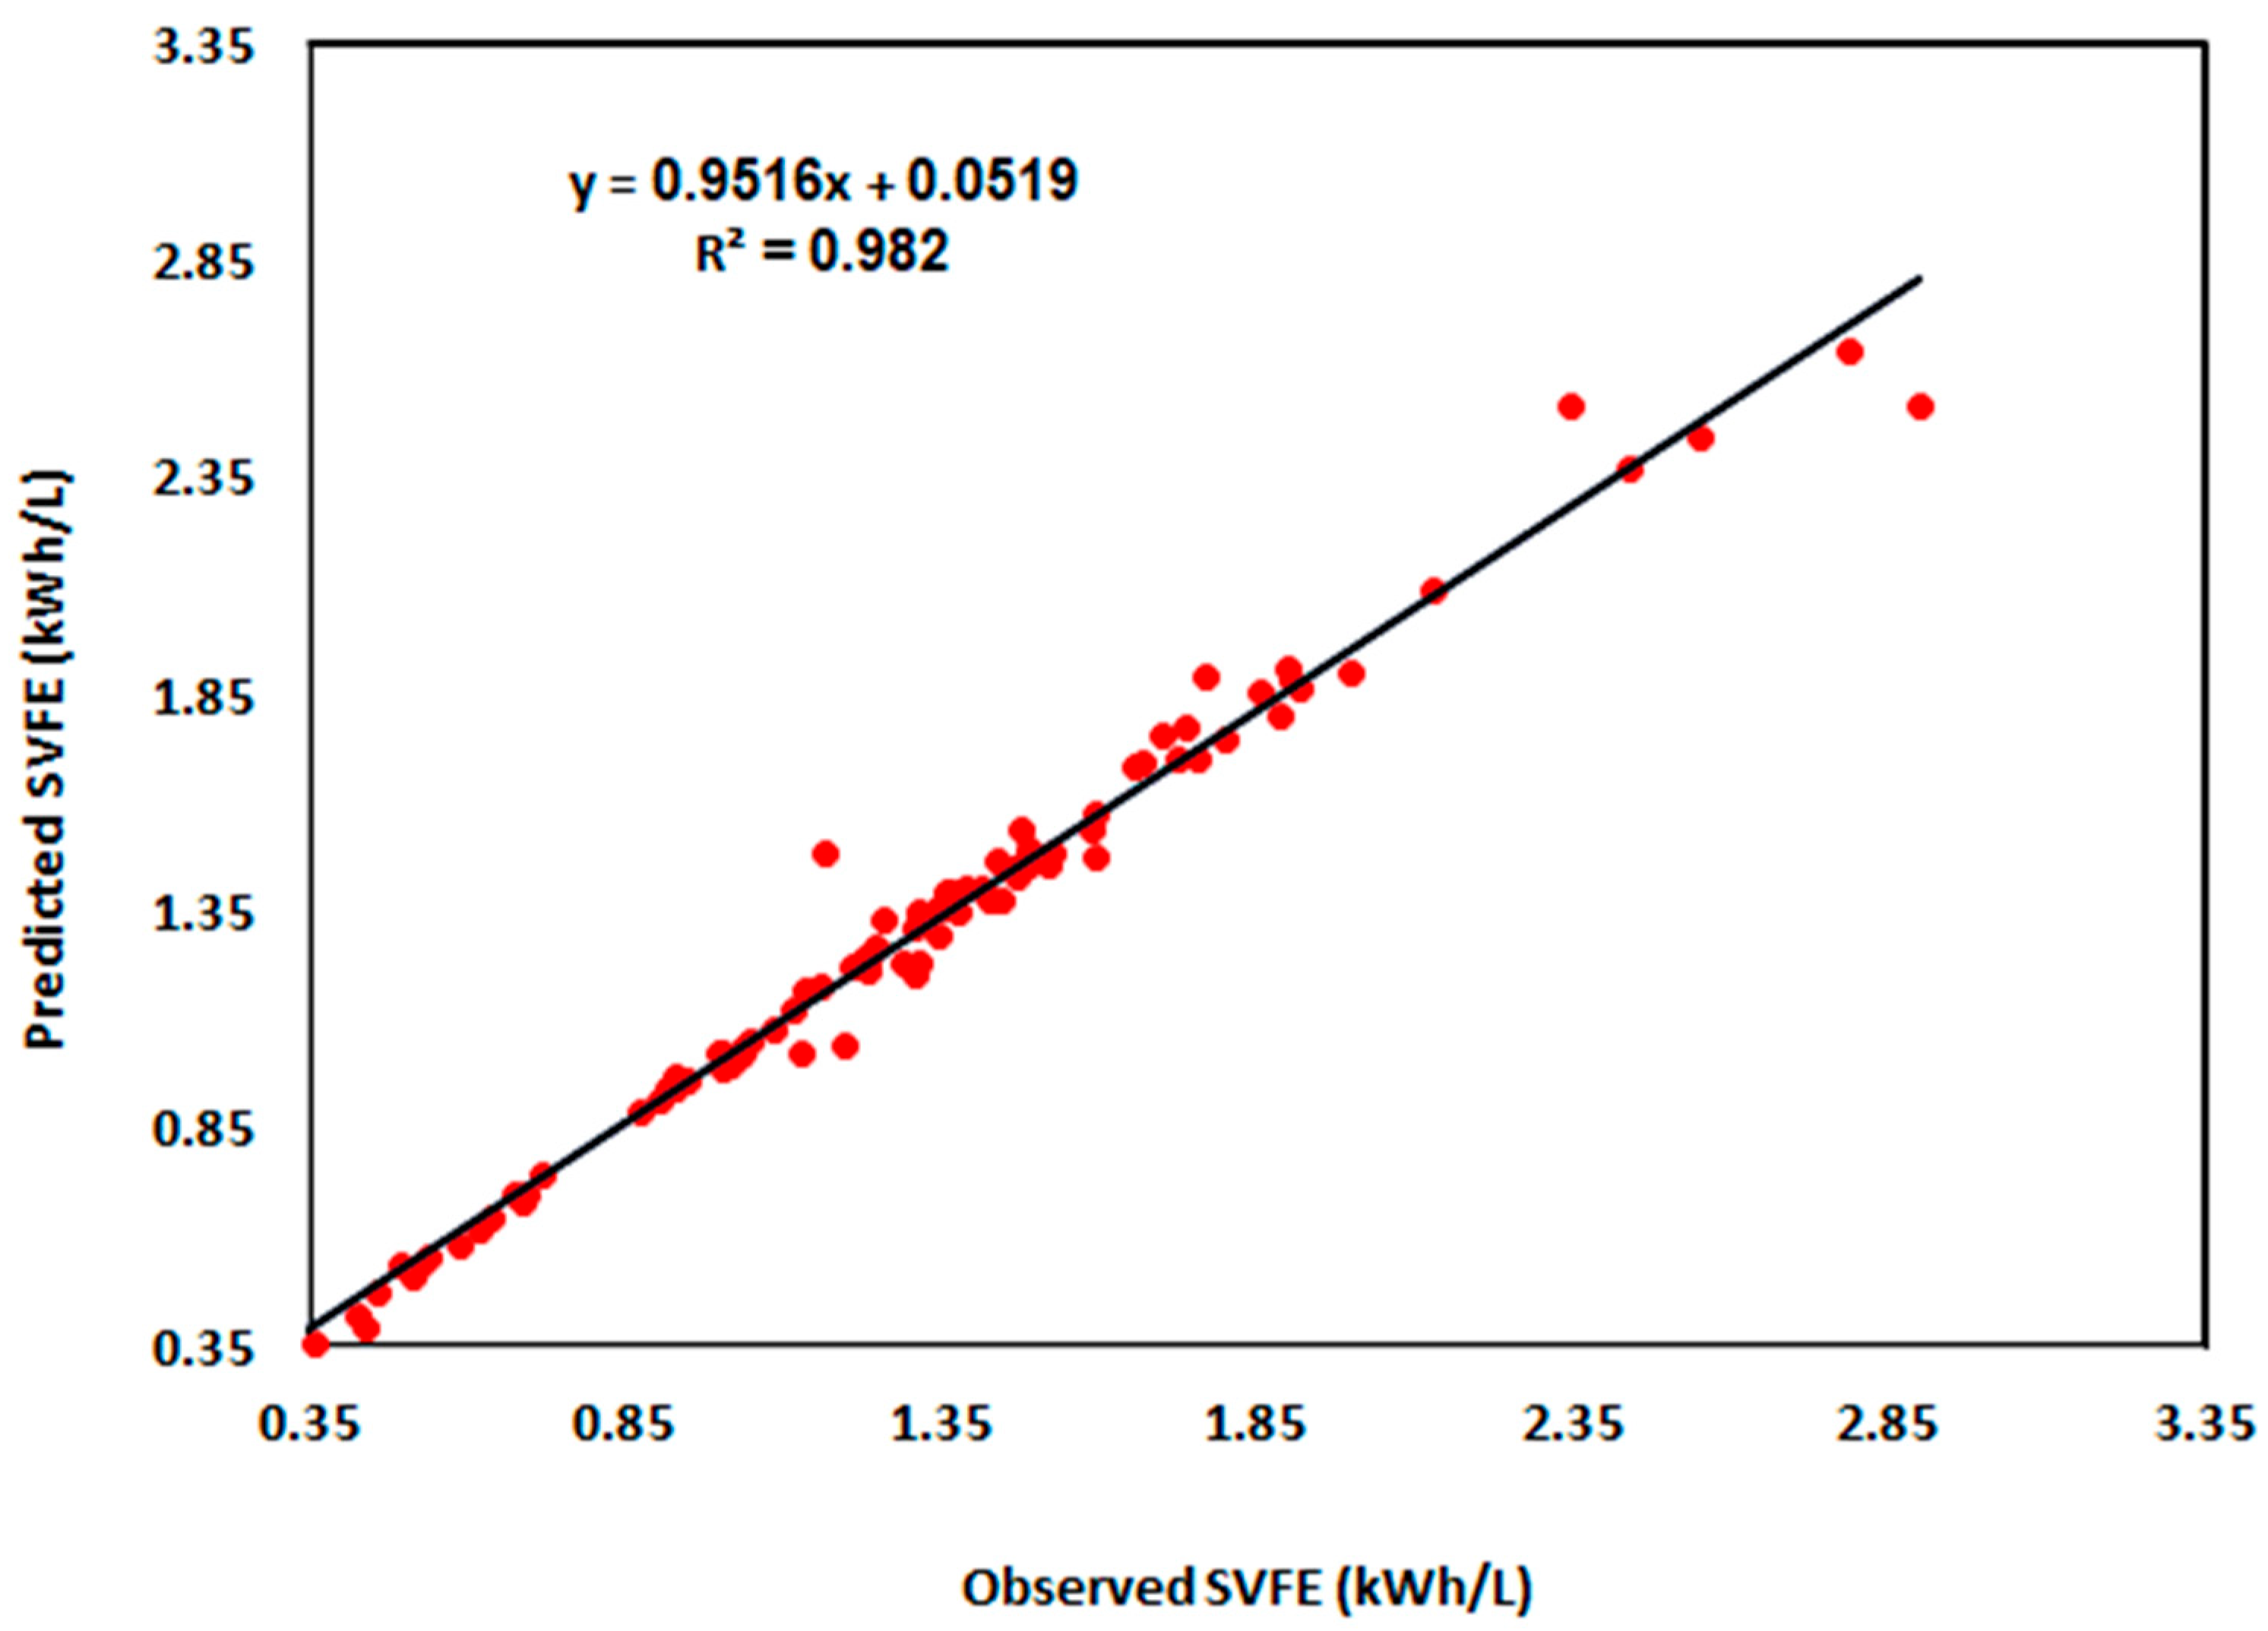
| Training | 0.043 | 0.072 | 3.056 | 0.9820 |
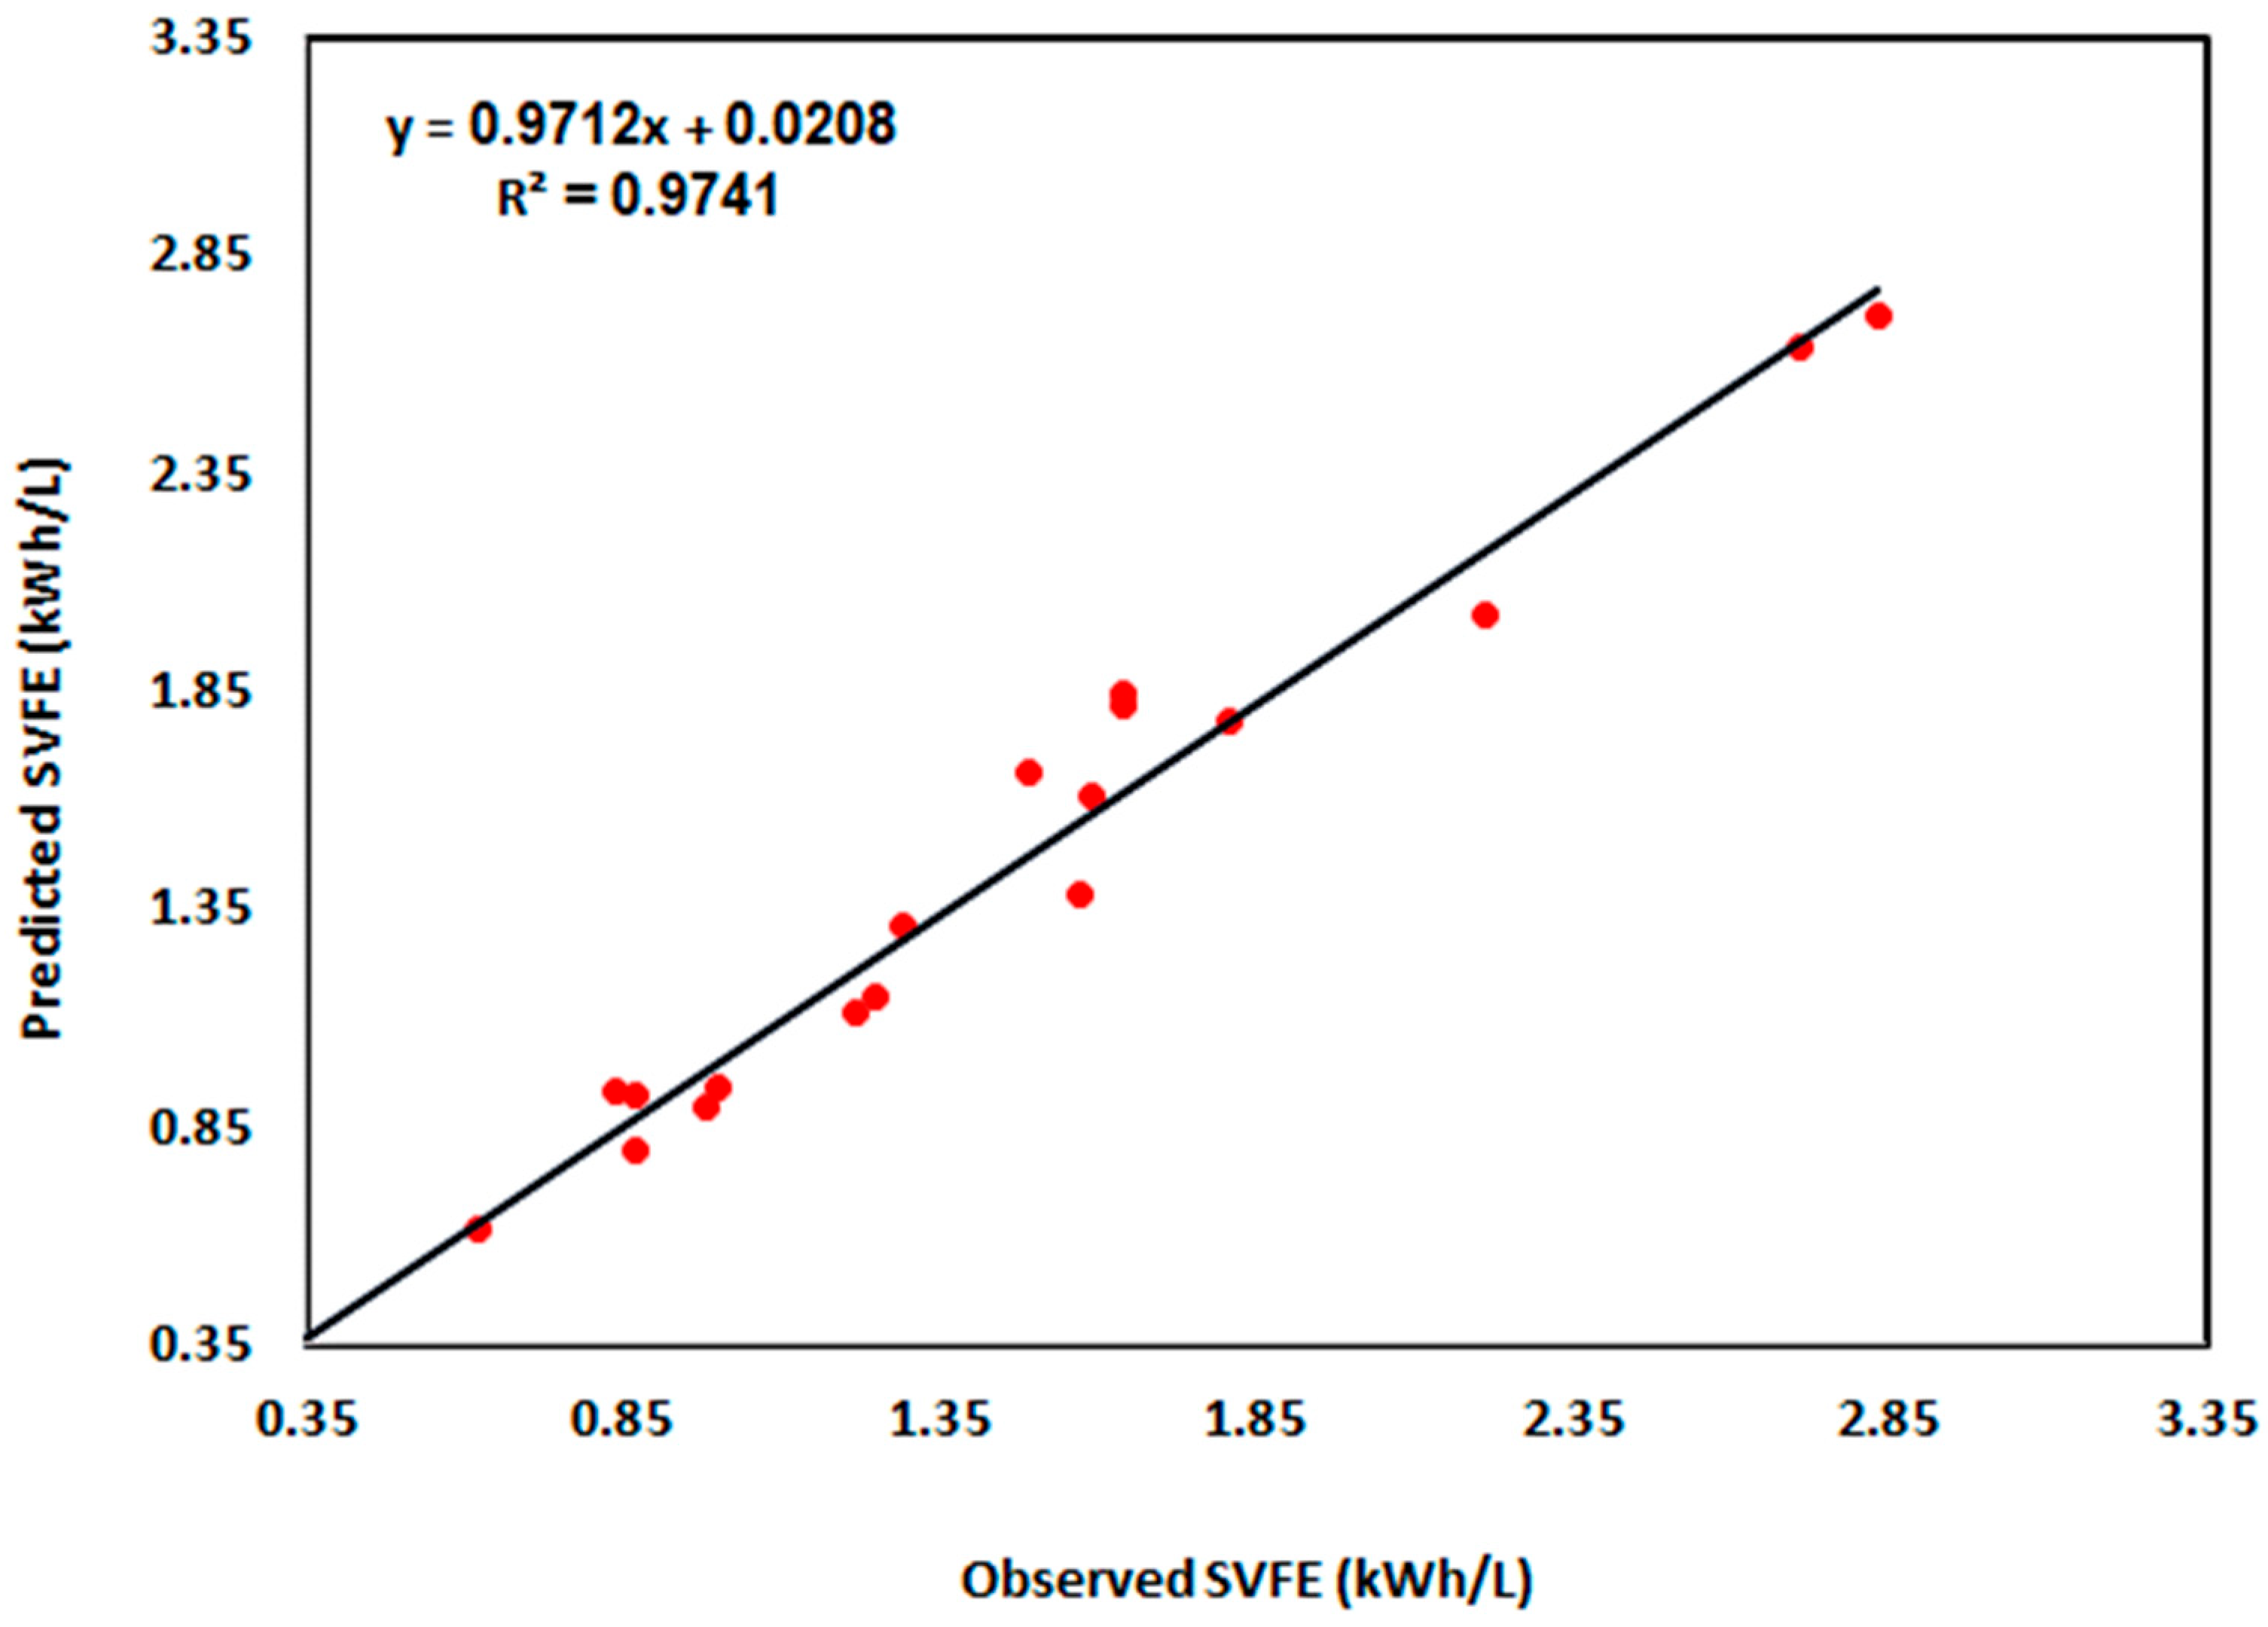
| Testing | 0.090 | 0.111 | 6.908 | 0.9741 |
Disclaimer/Publisher’s Note: The statements, opinions and data contained in all publications are solely those of the individual author(s) and contributor(s) and not of MDPI and/or the editor(s). MDPI and/or the editor(s) disclaim responsibility for any injury to people or property resulting from any ideas, methods, instructions or products referred to in the content. |
© 2025 by the authors. Licensee MDPI, Basel, Switzerland. This article is an open access article distributed under the terms and conditions of the Creative Commons Attribution (CC BY) license (https://creativecommons.org/licenses/by/4.0/).
Share and Cite
Al-Sager, S.M.; Almady, S.S.; Almasoud, W.A.; Al-Janobi, A.A.; Marey, S.A.; Al-Hamed, S.A.; Aboukarima, A.M. The Evaluation and Development of a Prediction Artificial Neural Network Model for Specific Volumetric Fuel Efficiency (SVFE) of a Tractor–Chisel Plow System Based on Field Operation. Processes 2025, 13, 1811. https://doi.org/10.3390/pr13061811
Al-Sager SM, Almady SS, Almasoud WA, Al-Janobi AA, Marey SA, Al-Hamed SA, Aboukarima AM. The Evaluation and Development of a Prediction Artificial Neural Network Model for Specific Volumetric Fuel Efficiency (SVFE) of a Tractor–Chisel Plow System Based on Field Operation. Processes. 2025; 13(6):1811. https://doi.org/10.3390/pr13061811
Chicago/Turabian StyleAl-Sager, Saleh M., Saad S. Almady, Waleed A. Almasoud, Abdulrahman A. Al-Janobi, Samy A. Marey, Saad A. Al-Hamed, and Abdulwahed M. Aboukarima. 2025. "The Evaluation and Development of a Prediction Artificial Neural Network Model for Specific Volumetric Fuel Efficiency (SVFE) of a Tractor–Chisel Plow System Based on Field Operation" Processes 13, no. 6: 1811. https://doi.org/10.3390/pr13061811
APA StyleAl-Sager, S. M., Almady, S. S., Almasoud, W. A., Al-Janobi, A. A., Marey, S. A., Al-Hamed, S. A., & Aboukarima, A. M. (2025). The Evaluation and Development of a Prediction Artificial Neural Network Model for Specific Volumetric Fuel Efficiency (SVFE) of a Tractor–Chisel Plow System Based on Field Operation. Processes, 13(6), 1811. https://doi.org/10.3390/pr13061811