Abstract
Petroleum is an indispensable energy source in modern industrial society, and maintaining the safe and stable operation of its injection and production system is of great significance. To analyze the mechanism of pipeline damage caused by corrosion and scaling in the injection production system, taking a water injection pipeline in an oil field as an example, the causes of corrosion and scaling damage were studied by detecting pipeline samples and analyzing corrosion products and various service conditions of the pipeline. The results showed that there was more scaling on the inner wall of the pipeline, and there was local corrosion in the pipeline sections that had experienced water injection, shutdown, and gas injection conditions, while there was no significant corrosion thinning in the pipeline sections that had only experienced water injection and shutdown conditions. The scale layer formed under water injection conditions is mainly composed of barium strontium sulfate (Ba0.75Sr0.25SO4), barium sulfate (BaSO4) and a small amount of silica (SiO2). The main reason for scale formation is the high content of barium ions (Ba2+) in the injected water. The corrosion products formed under gas injection conditions, including strontium ions (Sr2+) and sulfate ions (SO42−), are mainly composed of ferrous carbonate (FeCO3) and ferric oxide (Fe2O3). The pipeline corrosion product FeCO3 is mainly caused by carbon dioxide (CO2) in the medium. In addition, the high liquid content, cecal position, high Cl− (chloride ion) content, and slightly acidic environment in the pipeline also accelerate the occurrence of corrosion damage. The Fe2O3 in the corrosion products is formed when the pipeline is exposed to air after sampling, and is not the main cause of pipeline corrosion.
1. Introduction
At present and for at least the next 10 to 15 years, oil will continue to maintain its dominant position in the global energy system, and ensuring stable oil production is of profound significance for energy security [1,2]. Water injection is one of the most economical and effective measures for maintaining stable production in oil fields, and pipelines, as a common water transportation method, play a crucial role in the water injection process [3]. Although water injection technology can significantly improve the recovery rate of oil wells, it also brings some challenges and problems, one of which is the corrosion and scaling issues caused by the complex fluid composition within pipelines [4,5,6]. Corrosion and leakage of water injection pipelines will cause huge economic losses to oil fields and have serious impacts on their operations [4,5,7].
In order to effectively prevent similar accidents, reduce economic losses, and improve oilfield development efficiency, scholars in China and abroad have conducted in-depth analysis of the factors affecting the corrosion of oilfield water injection pipelines and proposed a series of effective corrosion protection measures. Lou Liangjie comprehensively investigated the water quality of sewage, corrosion monitoring data, and the composition of corrosion products. Combined with the use of corrosion inhibitors on site, they studied the causes of corrosion and proposed corresponding solutions [8]; Marí n-Cruz J conducted in-depth research on the corrosion and scale inhibition processes in cooling system media [9]; Defang Z conducted a study on a new type of composite environmentally friendly corrosion and scale inhibitor for steel surfaces in cooling water, and developed an efficient and environmentally friendly scale inhibitor that can effectively reduce corrosion and scale inhibition on steel surfaces [10]. Ying Xu synthesized polyaspartic acid/5-aminolactic acid graft copolymers and evaluated their scale and corrosion inhibition properties [11].
Previous studies have gained a certain understanding of the corrosion and scaling characteristics, influencing factors and anti-corrosion measures of water injection pipelines. However, the research mainly focuses on indoor simulation experiments, with relatively simple experimental conditions and a lack of analysis based on corrosion and scaling data under real on-site service conditions. This article analyzes the corrosion and scaling morphology, service conditions, physical and chemical properties of a water injection pipeline in a particular oilfield based on the actual situation of variable working conditions during pipeline on-site service. The reasons for the corrosion of the water injection pipeline in the well are discussed, aiming to effectively prevent similar accidents from happening again.
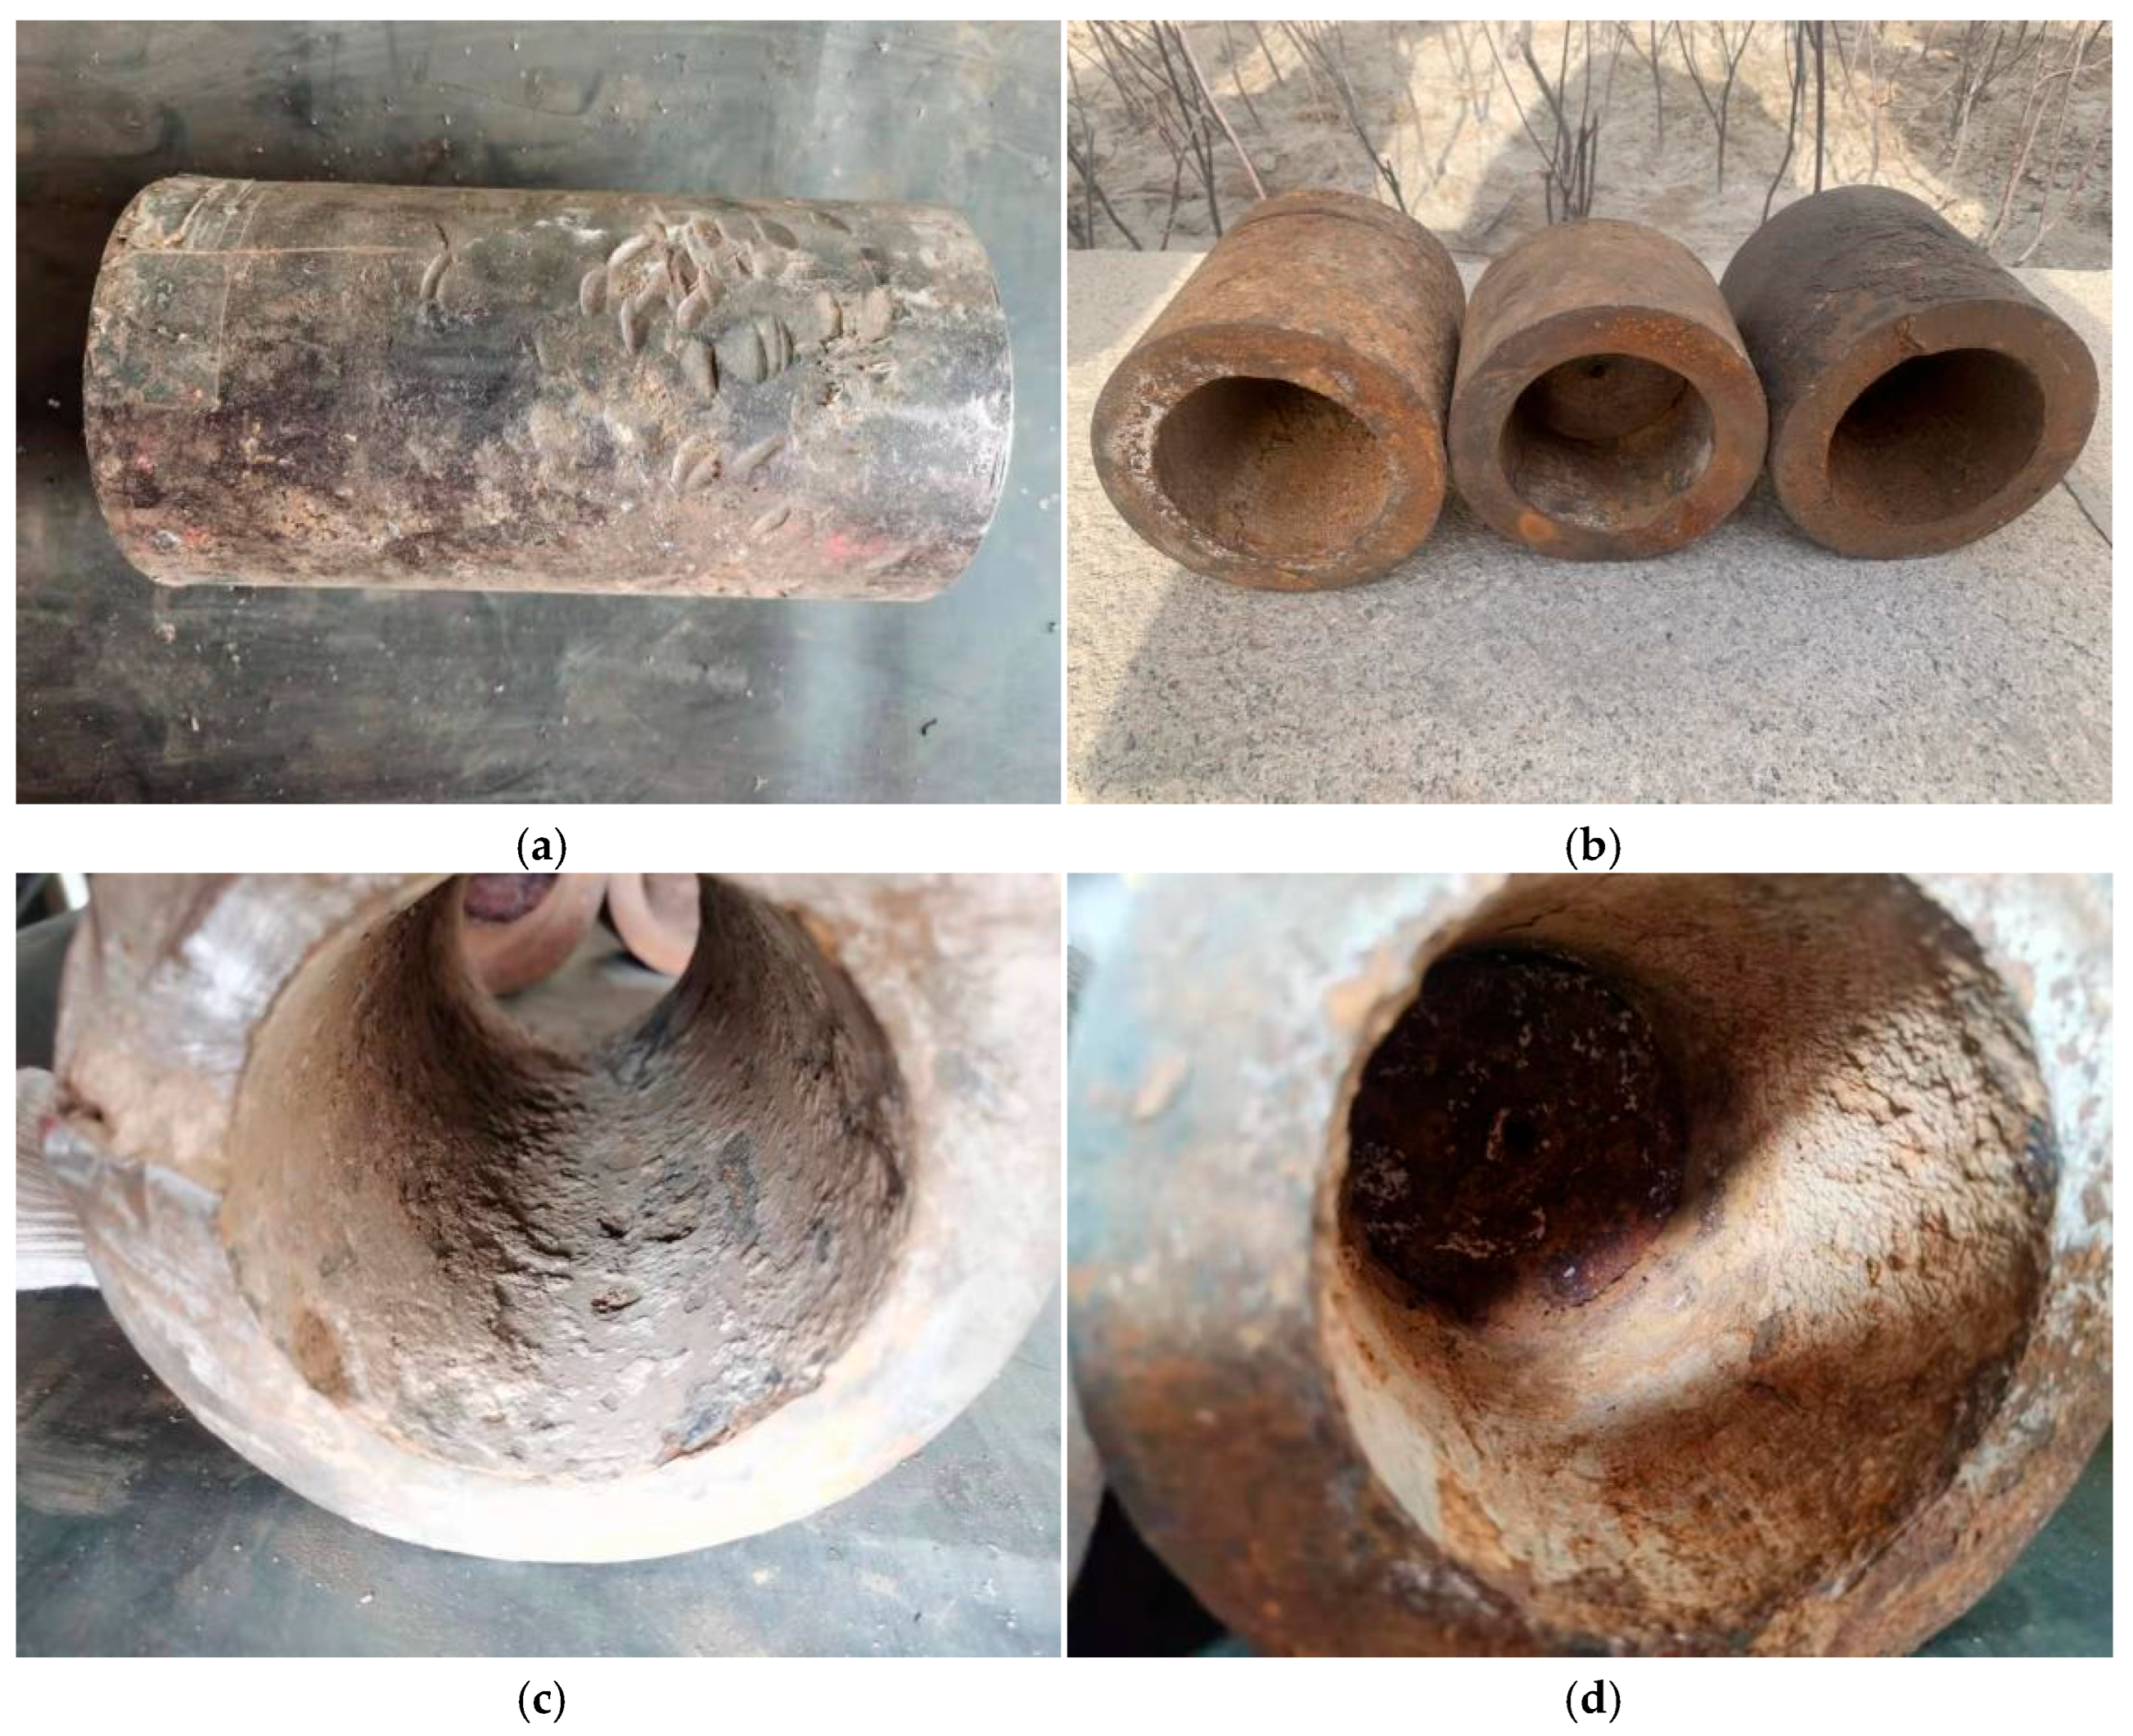
The water injection pipeline of a particular oilfield was completed and put into use in November 2001. The pipeline specification is Φ140 mm × 22 mm, made of 20# steel, with a design pressure of 40 MPa and a total length of 1.81 km. The conveying medium is sewage, and there are no internal anti-corrosion measures. The failed sample is shown in Figure 1. The sample sent for inspection this time consists of two parts. One part is the pipe section cut in January 2022 (Figure 1a), marked as Sample 1, which has undergone water injection, shutdown, and gas injection conditions, with a length of 255 mm. The other part is the pipe section cut after the pressure test in September 2020 (Figure 1b), marked as Sample 2, divided into three sections with lengths of 145 mm, 87 mm, and 127 mm, which have undergone water injection and shutdown conditions. There are damage marks on the outer surface of Sample 1, and liquid accumulation marks can be seen at the 6 o’clock position on the inner wall, with multiple corrosion pits present (Figure 1c). Sample 2 has a rust yellow outer surface and a yellow brown scale layer visible on the inner wall (Figure 1d).

Figure 1.
Macroscopic photos of the samples being tested: (a) external surface of Sample 1, (b) external surface of Sample 2, (c) internal surface of Sample 1, (d) internal surface of Sample 2.
2. Physical and Chemical Performance Testing
2.1. Geometric Dimension Measurement
The outer diameter and wall thickness of the corroded pipe sample were measured using a vernier caliper (0.02 mm) and an ultrasonic thickness gauge (0.01 mm), respectively. The schematic diagram of the measurement location is shown in Figure 2. The procedure was conducted as follows: select one section every 5 cm at equal intervals along the axial direction on the pipe sample, and measure its outer diameter separately (with three measurement positions spaced 120° apart). The results are shown in Table 1. In addition, the wall thickness was measured at four equidistant points on the circumference of each section, and the results are shown in Table 2. From Table 1 and Table 2, it can be seen that the outer diameter of the tube sample meets the requirements of GB 6479-2013 “Seamless Steel Tubes for High Pressure Boilers” for hot-rolled steel tubes [12]. Except for the corrosion pit, no significant corrosion thinning was observed in other parts.
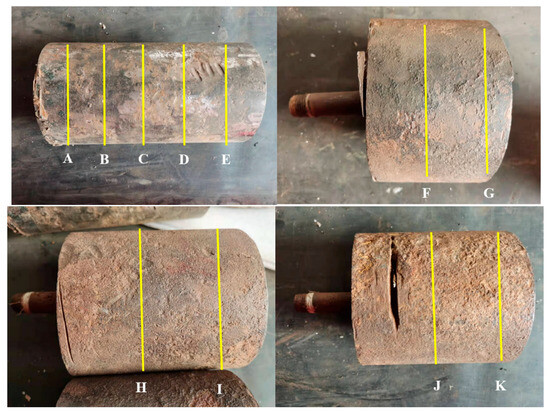
Figure 2.
Schematic diagram of the measurement positions for the outer diameter and wall thickness of the tube sample.

Table 1.
Measurement results of the outer diameter of the tube sample (unit: mm).
Table 2.
Measurement results of the wall thickness of the tube sample (unit: mm).
2.2. Chemical Composition
Chemical composition analysis samples were taken from Sample 1 and Sample 2. According to the GB/T 4336-2016 standard [13], an ARL4460 direct reading spectrometer was used for testing, and the results are shown in Table 3. According to Table 3, the chemical composition meets the requirements of GB 6479-2013 for 20# steel.
Table 3.
Analysis results of chemical composition (Wt. × 10−2).
2.3. Mechanical Performance Test
For longitudinal tensile specimens from Sample 1 and Sample 2, room temperature tensile tests were conducted according to the GB/T 228.1-2010 standard [14]. The test results are shown in Table 4. According to Table 4, the tensile performance of the pipeline meets the requirements of GB 6479-2013 for 20# steel. Longitudinal impact specimens (10 × 10 × 55 mm) were taken from Sample 1 and Sample 2. According to the GB/T 229-2020 standard [15], the specimens were subjected to Charpy impact testing using the PIT752D-2 (300J) impact testing machine (Tubular Goods Research Institute, China National Petroleum Corporation, Xi’an, China). The test results are shown in Table 5. According to Table 5, the impact performance of the pipeline is lower than the requirements of GB/T 229-2020 standard for 20# steel.
Table 4.
Room temperature tensile test results.
Table 5.
Impact test results.
2.4. Metallographic Analysis
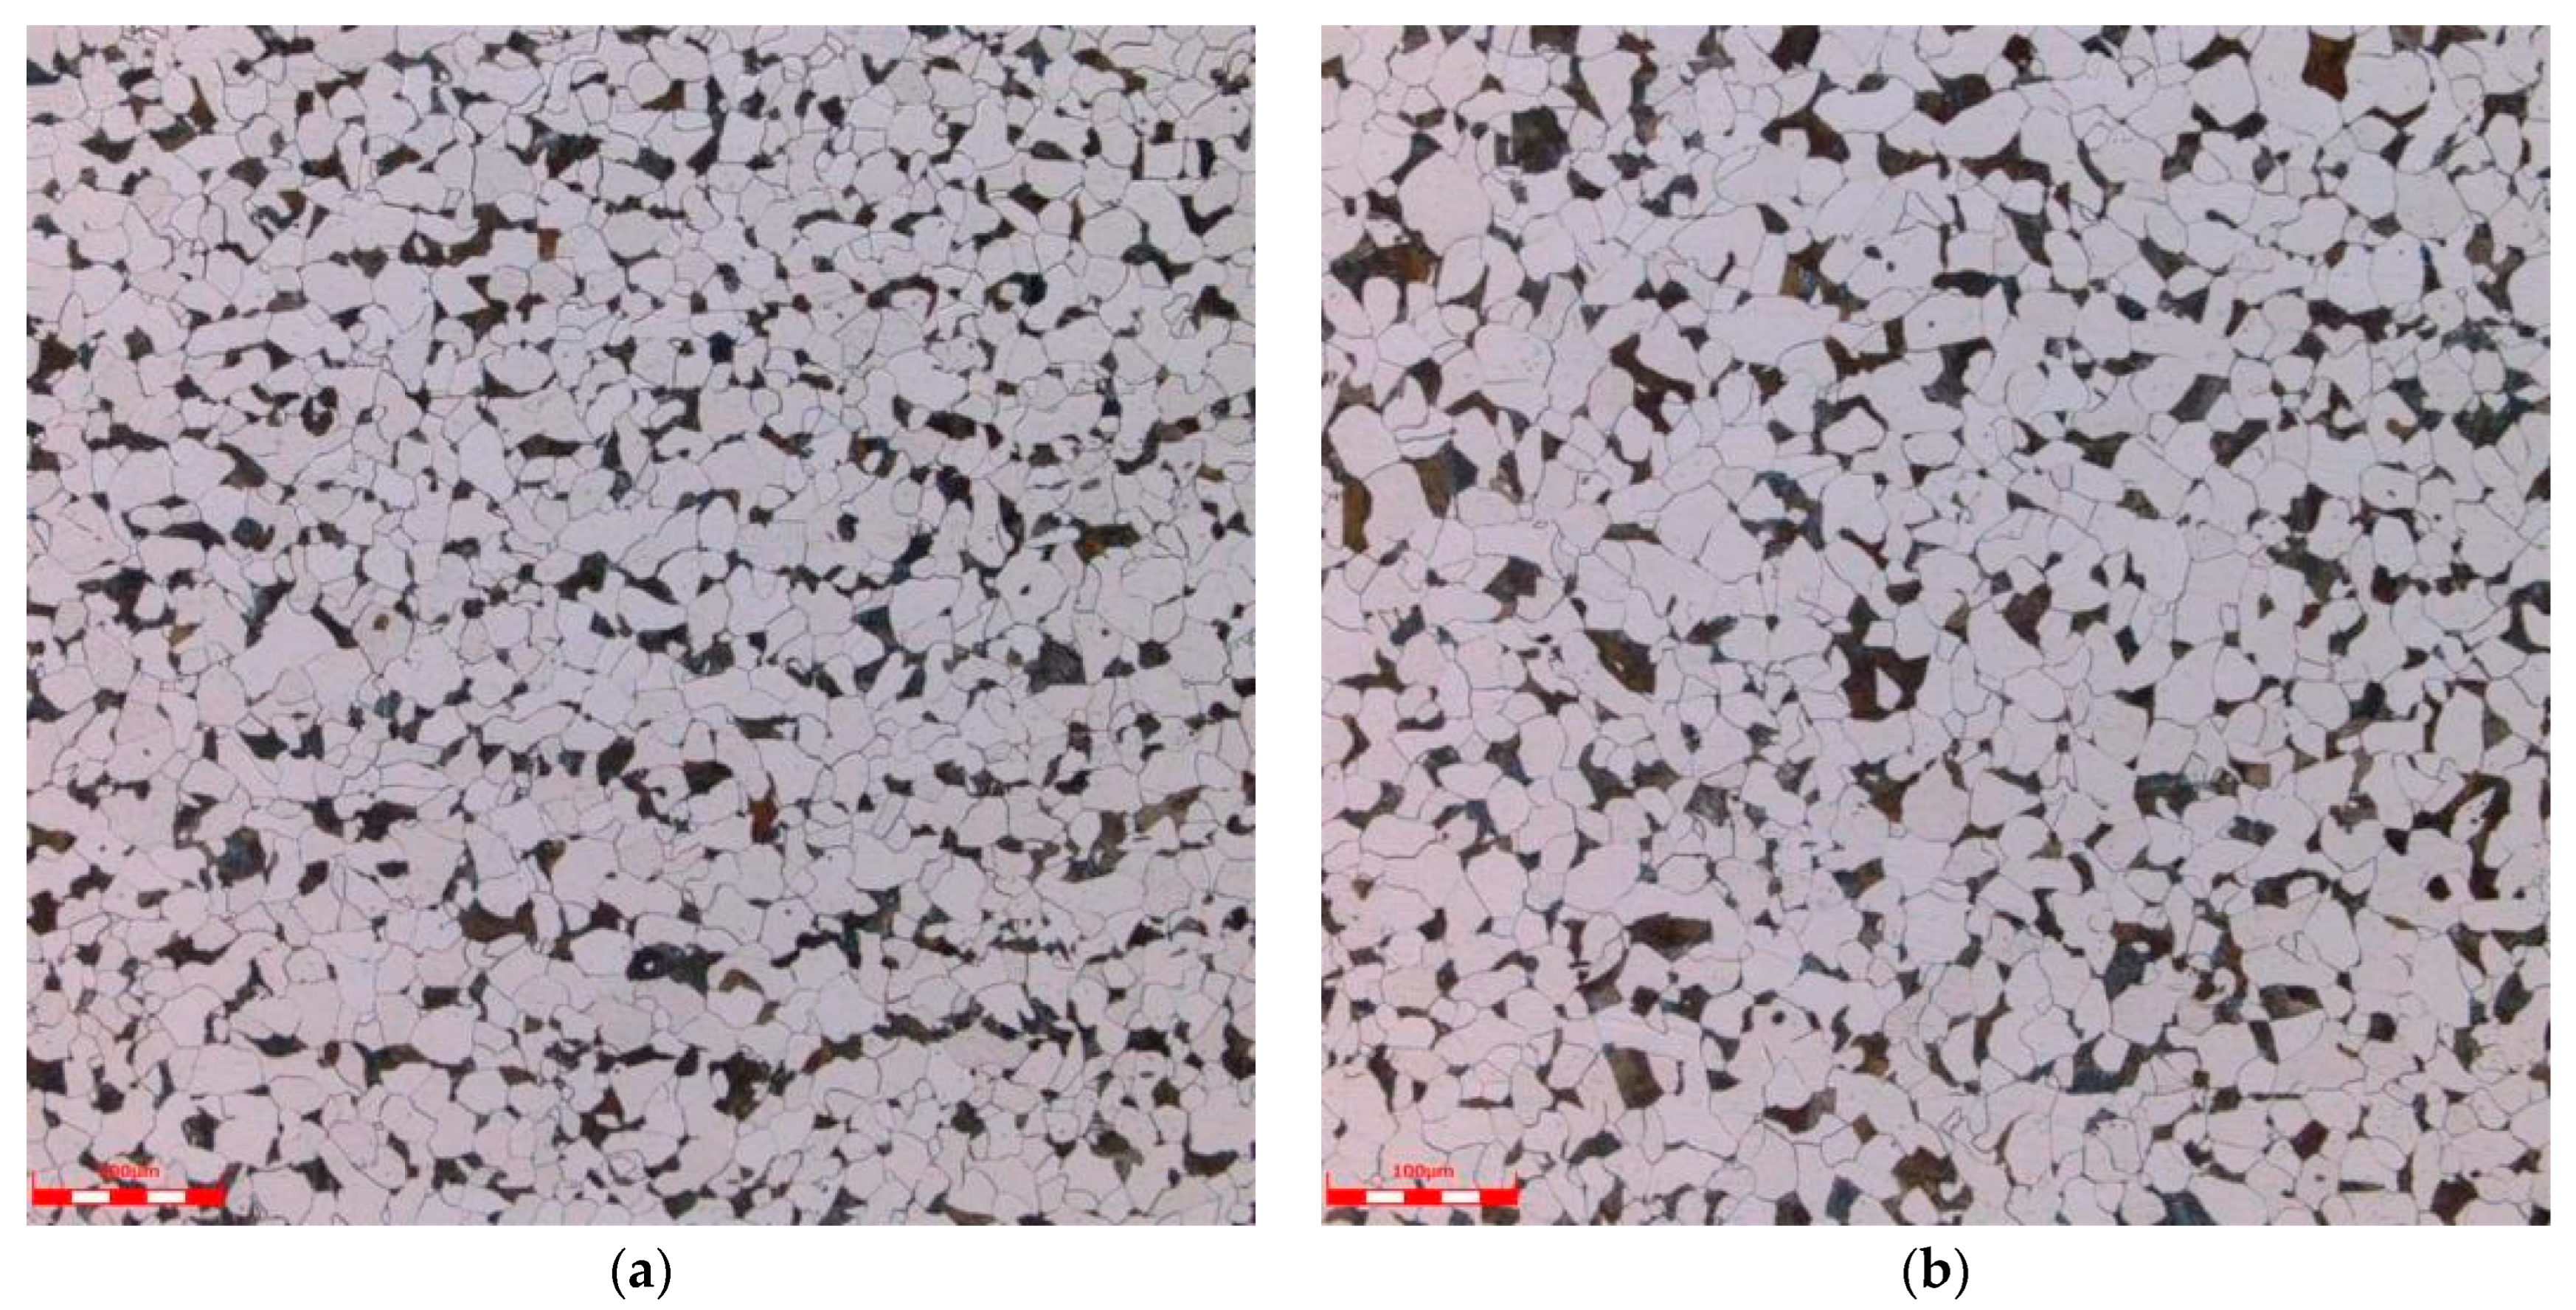
Metallographic analysis samples were taken from Sample 1 and Sample 2. According to the GB/T 13298-2015 “Method for Inspection of Metallic Microstructure” [16], GB/T 6394-2017 “Method for Determination of Average Grain Size of Metals” [17], and GB/T 10561-2023 “Method for Determination of Non-metallic Inclusion Content in Steel” [18], an OLS4100 laser confocal microscope (Tubular Goods Research Institute, China National Petroleum Corporation, Xi’an, China) was used to detect and analyze the microstructure, grain size, and non-metallic inclusions of the samples. The results are shown in Table 6, and the metallographic photos are shown in Figure 3. The metallographic analysis results show that the microstructure of the pipeline is F + P (ferrite + pearlite), and the non-metallic inclusions are A0.5, B0.5, D0.5, Sample 1 has a grain size of 7.5, while Sample 2 has a grain size of 7.0.
Table 6.
Metallographic examination results.
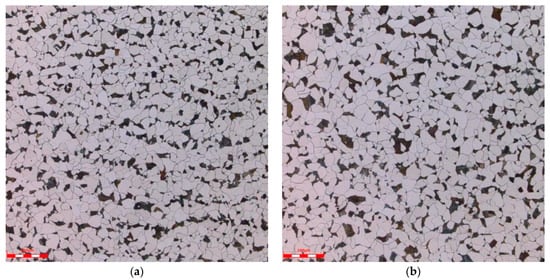
Figure 3.
Metallographic organization: (a) Sample 1, (b) Sample 2.
3. Micro Analysis
3.1. Scanning Electron Microscopy and Energy Dispersive Spectroscopy Analysis
The corrosion pit was taken from Sample 1 to test the sample, and a scanning electron microscope (SEM) and its built-in energy dispersive spectrometer (EDS) were used to analyze the corrosion morphology and corrosion product composition. Figure 4 shows SEM images of corrosion pits at different locations. At low magnification, the macroscopic morphology of the corrosion pit is shown in Figure 4a. At high magnification, it was observed that there were many corrosion product crystals visible at the bottom of the corrosion pit (region A), on the walls of the corrosion pit (region B), and outside the corrosion pit (region C). Further analysis of their composition using EDS (see Table 7) shows that the product mainly contains Fe, O, C, S, Si, Ba elements, with small amounts of Cl, K and other elements present locally.
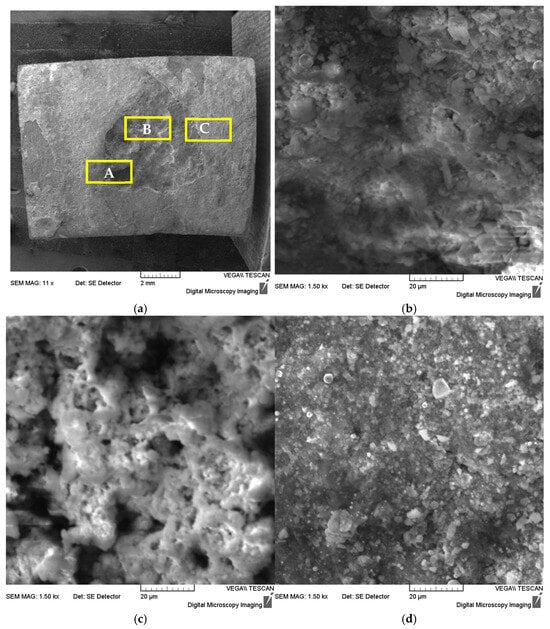
Figure 4.
SEM photographs of different locations of the corrosion pit: (a) low magnification macroscopic, (b) corrosion pit bottom-region A, (c) corrosion pit wall-region B and (d) corrosion pit outer-region C.
Table 7.
Results of EDS mapping analysis (wt.%).
3.2. XRD Phase Analysis
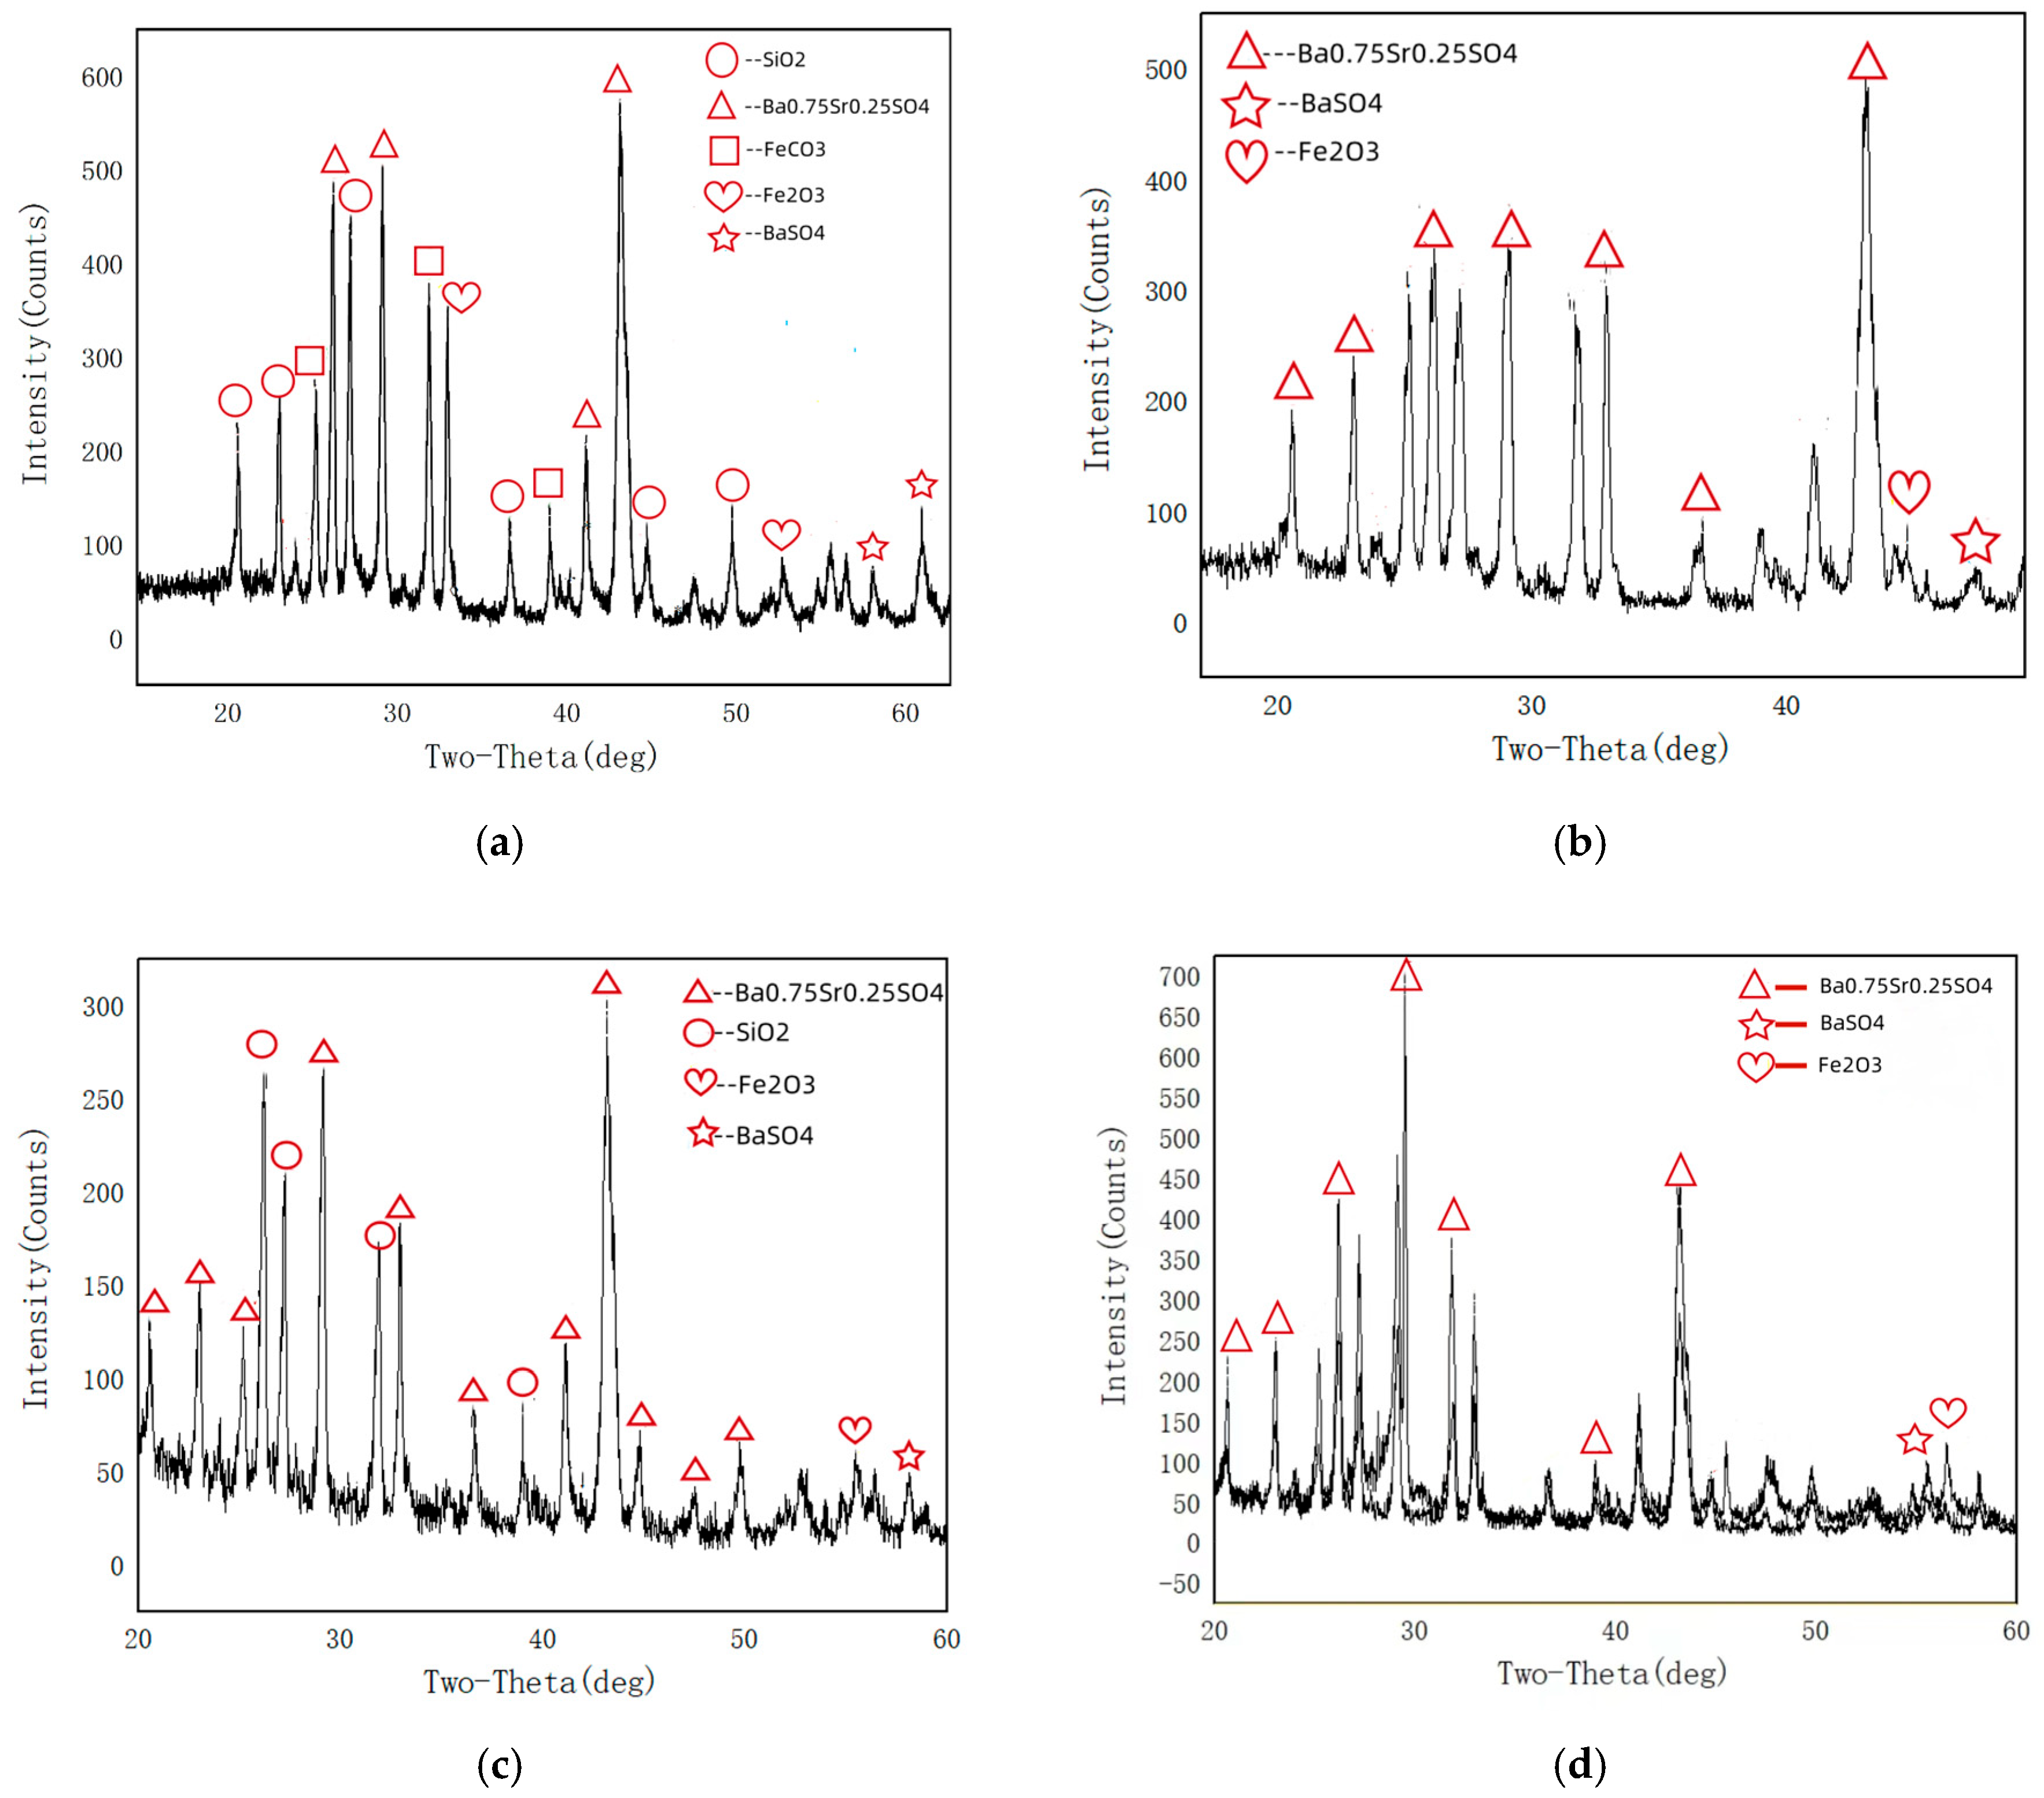
The inner wall scale samples were scraped from the top and bottom of Sample 1 and Sample 2 pipelines, and their phase composition analyzed using X-ray diffraction (XRD). The detection results are shown in Figure 5. From Figure 5, it can be seen that the phase composition of the scale sample at the bottom of Sample 1 is mainly Ba0.75Sr0.25SO4, BaSO4, Fe2O3, FeCO3 and SiO2, the phase composition of the top scale sample in Sample 1 is mainly Ba0.75Sr0.25SO4, BaSO4 and Fe2O3; the phase composition of the bottom scale sample in Sample 2 is mainly Ba0.75Sr0.25SO4, BaSO4, Fe2O3 and SiO2; the phase composition of the top scale sample in Sample 2 is mainly Ba0.75Sr0.25SO4, BaSO4 and SiO2. Among these, Ba0.75Sr0.25SO4 is a sulfate solid solution (solid solution phase) of barium (Ba) and strontium (Sr), with a crystal structure similar to that of BaSO4 and SrSO4. Because BaSO4 and SrSO4 have similar structures, they can form continuous solid solutions, such as Ba1−x Srx SO4, where x is the proportion of strontium, which is a common scaling product in oil and gas field water.
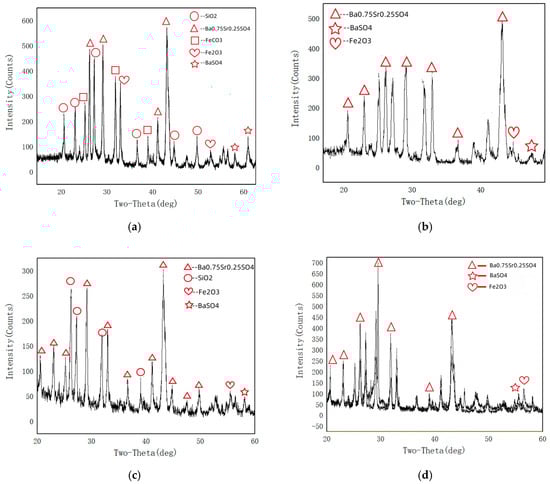
Figure 5.
XRD analysis results of the inner wall adherents of the tube samples: (a) bottom of Sample 1, (b) the top of Sample 1, (c) bottom of Sample 2, (d) top of Sample 2.
From the phase composition of the scale samples on the inner wall of the failed pipes, it can be seen that the chemical components of the scale samples on the inner wall of the pipes in Samples 1 and 2 are mainly corrosion products of sulfates, silica, and iron. Among these, sulfates are mainly barium sulfate and strontium scale, silicon dioxide is mainly deposited and attached to pipelines, and only Sample 1, which has undergone gas injection conditions, contains FeCO3 in the corrosion products of the pipeline bottom. Fe2O3 is the result of oxidation of the corrosion products on the inner wall of the pipeline after exposure to air.
4. Discussion
From the macroscopic analysis and geometric dimension measurement of the pipe sample, it can be seen that there is a lot of scaling on the inner wall of the pipeline. The pipe section that has experienced water injection, shutdown, and gas injection conditions has local corrosion in the 6 o’clock direction, while the pipe section that has only experienced water injection and shutdown conditions has not shown significant corrosion thinning. Based on these characteristics and the service history of the pipeline, the reasons for local corrosion from the aspects of pipeline material and service conditions are analyzed below.
Firstly, from the perspective of pipeline material, its chemical composition meets the requirements of GB 6479-2013 for 20# steel; The metallographic structure consists of pearlite and ferrite, with non-metallic inclusions of A0.5, B0.5, and D0.5. Sample 1 has a grain size of 7.5, sample 2 has a grain size of 7.0, and no abnormalities are found in the metallographic structure. The tensile performance meets the requirements of GB 6479-2013 for 20# steel, but the impact performance does not meet the requirements of GB 6479-2013. The impact performance has a significant impact on the anti-cracking performance of pipelines, but has no direct effect on pipeline corrosion and scaling. It can be seen that a material problem in the pipeline is not the cause of local corrosion.
Secondly, from the perspective of pipeline service conditions, the pipeline was a water injection pipeline from November 2000 to April 2018, and the transport medium was treated wastewater from the joint station. There is a scaling phenomenon on the inner wall of the pipeline section that has only experienced water injection, shutdown, and gas injection conditions. According to the XRD analysis results of the scale samples, the chemical composition of the scale samples is the same, mainly barium sulfate, strontium scale, and a small amount of silicon dioxide. Combined with the analysis results of the injected water sample (Table 8), the SO42− content in the medium is 235.7 mg/L, the Ba2+ content is 18.66 mg/L, and the Sr2+ content is 496.2 mg/L, indicating that the scale layer on the inner wall of the pipeline was formed during the water injection condition. From the morphology of the inner wall of the pipeline section that only experienced water injection and shutdown conditions, no obvious corrosion was observed. XRD analysis of the scale layer on the inner wall showed that the corrosion product was mainly Fe2O3. However, there were corrosion pits in the 6 o’clock direction of the pipeline section that experienced water injection, shutdown, and gas injection conditions. The main corrosion products on the inner wall were FeCO3 and Fe2O3. According to the analysis of the injected gas composition (Table 9), the gas contained corrosive media such as CO2 and trace amounts of hydrogen sulfide (H2S), with CO2 content of 1.332% and H2S content of 0.0003%. The operating pressure of the pipeline was about 10 MPa. The calculated CO2 partial pressure of the pipeline was about 0.1332 MPa and H2S partial pressure was about 0.03 KPa. The corrosion caused by the low H2S partial pressure can be ignored. Therefore, the pipeline section that experienced gas injection conditions was corroded mainly by CO2. The partial pressure of carbon dioxide has a direct impact on the corrosion rate of pipelines. An increase in CO2 partial pressure will lead to more CO2 dissolution, lower pH, and decrease the concentration of CO32−, thereby reducing the stability of FeCO3. Especially under high flow rate conditions of multiphase flow, the scouring effect will further damage the protective film, leading to intensified corrosion. It is generally believed that moderate corrosion will occur in pipelines when the CO2 partial pressure is between 0.021 MPa and 0.21 MPa [19,20]. In addition, a GLCC gas–liquid separator is installed at the injection gas source well site to perform simple separation of the produced raw gas. Due to the small size of the GLCC gas–liquid separation device and the large amount of plug flow in the gas source section, the gas–liquid separation effect is poor, which can lead to increased entrainment of liquid droplets in natural gas, exacerbating gas–liquid phase slip (increasing velocity difference) and result in a sustained high liquid content in the injection pipeline. High liquid holdup significantly increases the nucleation rate of FeCO3 by elevating the interfacial concentrations of Fe2+ and CO32− while reducing mass transfer efficiency. Additionally, the pipeline operates at a pressure of 10 MPa, where the high pressure markedly enhances the solubility of CO2 in the liquid phase. This promotes the hydration of CO₂ to form H₂CO₃, which subsequently dissociates into HCO3− and CO32−. The resulting increase in CO32− concentration directly raises the supersaturation (S) of FeCO3—a critical driving factor for nucleation kinetics.
Table 8.
Injection water assay results.
Table 9.
Natural gas fractions from source wells.
However, dense FeCO3 corrosion product films typically form at temperatures above 60 °C. At the pipeline operating temperature of ~40 °C, the FeCO3 film tends to be porous and poorly adherent. When combined with Cl−-induced localized attack and flow fluctuations, the high nucleation rate may translate into localized corrosion risks rather than providing protective effects. This underscores the importance of mitigating factors such as chloride ingress, optimizing flow conditions, and considering material upgrades or corrosion inhibitors to address the compromised film integrity at lower temperatures.
In addition, the pipeline with local corrosion in this section is located in the cecum section. At the cecum section of the pipeline system, fluid stagnation may lead to a local increase in the concentration of Cl− or other corrosive substances. Due to limited mass transfer, concentration batteries may form, exacerbating local corrosion. Meanwhile, the retention zone may experience pH changes due to poor material exchange, such as the accumulation of acidic substances, which further affects the corrosion process [21]. The morphology of the inner wall of the pipeline also shows traces of liquid accumulation at the bottom of the pipeline. According to the test results of the produced water from the gas source well (Table 10), the Cl− content of the produced water is 94,800 mg/L, with a pH value of 6.12. Higher Cl− content and an acidic environment will accelerate the occurrence of corrosion [22,23,24]. This is because the presence of Cl− usually accelerates the corrosion of carbon steel, especially at low pH levels. In a weakly acidic environment with a pH of 6.12, the corrosiveness of Cl− further damages the passivation film, causing the corrosion potential to shift towards a more negative direction and accelerating the anodic reaction. In this case, as the corrosion rate increases, the driving force for electrochemical corrosion also increases. The pipeline was injected with gas from September 2020 until local corrosion was discovered in January 2022, a total of 16 months of gas injection operation. The maximum depth of the pipeline corrosion pit is about 3 mm, and the maximum corrosion rate is about 2.25 mm/a, which indicates an extremely severe degree of corrosion.
Table 10.
Assay results of extracted water from gas wells.
In summary, the Sample 1 pipeline sent for inspection is located in the cecum section. Under gas injection conditions, due to poor gas–liquid separation, the pipeline contains a high amount of liquid. There is liquid accumulation at the 6 o’clock position of the pipeline, which causes local corrosion under the action of CO2 in the medium. The high Cl- content and acidic environment in the medium accelerate the occurrence of corrosion. In addition, microbiologically influenced corrosion (MIC) may also be a potential factor that accelerates corrosion, especially in the relatively static environment of the cecal section of the pipeline, which is more conducive to the growth and metabolism of microorganisms. Fe2O3 is the result of oxidation of corrosion products on the inner wall of pipelines exposed to air, and is not the main cause of pipeline corrosion. In addition, the pipeline did not adopt anti-corrosion measures such as adding corrosion and scale inhibitors or using anti-corrosion and anti-scaling coatings on the inner wall, resulting in rapid corrosion and scaling of the pipeline [25,26,27,28].
5. Conclusions
- (1)
- According to the physical and chemical performance test results of the submitted samples, the chemical composition of the pipeline meets the requirements of GB 6479-2013 for 20# steel, with a metallographic structure of ferrite + pearlite and non-metallic inclusions of A0.5, B0.5, D0.5. Sample 1 has a grain size of 7.5, sample 2 has a grain size of 7.0, and no abnormalities are found in the metallographic structure. The tensile performance meets the requirements of GB 6479-2013 for 20# steel, but the impact performance does not meet the requirements of GB 6479-2013.
- (2)
- Sample 2 has only experienced water injection and shutdown conditions, and there is no obvious corrosion on the inner wall of the pipeline. The scale layer on the inner wall was formed during the water injection period, and the high content of sulfate ions, barium, and strontium ions in the water injection medium is the reason for its scaling.
- (3)
- Sample 1 has undergone local corrosion under the action of CO2 in the medium under gas injection conditions. Fe2O3 is the result of oxidation of corrosion products on the inner wall of the pipeline after exposure to air, and is not the main cause of pipeline corrosion.
- (4)
- It is recommended to carry out process modifications such as pipe cutting and excision on the cecal section of the pipeline under gas injection conditions to reduce the risk of pipeline corrosion and perforation.
Author Contributions
Conceptualization, C.T. and Y.F.; methodology, F.L.; data curation, Z.C.; writing—original draft preparation, Y.H.; writing—review and editing, S.W. and Y.D. All authors have read and agreed to the published version of the manuscript.
Funding
National Key R&D Program Project: Research and Development of Security Technology and Equipment for National Petroleum and Natural Gas Reserve (2017YFC0805804).
Data Availability Statement
The data used to support the findings of this study are available from the corresponding author upon request.
Conflicts of Interest
Authors Chuanjiang Tan, Yan Fang, Zeliang Chang and Yongbin Hou were employed by the Tarim Oilfield Company, PetroChina. Author Fumin Li was employed by the Baoshihua Property Tarim Oilfield Regional. Author Shuai Wang was employed by the Tubular Goods Research Institute, China National Petroleum Corporation. The remaining author declares that the research was conducted in the absence of any commercial or financial relationships that could be construed as a potential conflict of interest.
References
- Gül, H.H.M.; Ercan, H.; Akınoğlu, B.; Açıkgöz, Ş. A Retrospective Assessment of Türkiye’s Recent Energy Policy in Terms of Energy Security and Climate Change Mitigation. Energies 2025, 18, 951. [Google Scholar] [CrossRef]
- Jurdziak, L.; Kawalec, W.; Kasztelewicz, Z.; Parczyk, P. Using RES Surpluses to Remove Overburden from Lignite Mines Can Improve the Nation’s Energy Security. Energies 2024, 18, 104. [Google Scholar] [CrossRef]
- Alsaleh, A.; Muggeridge, A.; Blunt, M. Why gravity improves waterflood recovery in oil-wet and mixed-wet reservoirs. Geoenergy Sci. Eng. 2024, 243, 213375. [Google Scholar] [CrossRef]
- Peng, H.; Luan, Z.; Liu, J.; Lei, Y.; Chen, J.; Deng, S.; Su, X. Corrosion behavior of X80 pipeline steel in oilfield injection water in Eastern China. Anti-Corros. Methods Mater. 2021, 68, 438–448. [Google Scholar] [CrossRef]
- Gallego, M.; San Román, J.; Bianchi, G.L.; Otegui, J.L. Influence of fluid flow in microbiological corrosion failures in oil field injector well tubing. Eng. Fail. Anal. 2021, 128, 105603. [Google Scholar] [CrossRef]
- Zhu, L.; Feng, C.; Han, L.; Lu, C.; Yuan, J.; Hang, W.; Wang, J.; Xu, X. Application Analysis of Epoxy-Coated Tubing in an Oil Field. Mater. Perform. 2020, 59, 26–30. [Google Scholar] [CrossRef]
- Sun, H.; Zhong, L.; Zhu, Y.; Zhu, J.; Li, Z.; Zhang, Z.; Zhou, Y. Assessing sulfate-reducing bacteria influence on oilfield safety: Hydrogen sulfide emission and pipeline corrosion failure. Eng. Fail. Anal. 2024, 164, 108646. [Google Scholar] [CrossRef]
- Lou, L.J.; Xu, Z.P.; Li, A.G.; Kong, X.G. Analysis of Corrosion Factors and Treatment Measures for High Mineralization Oilfield Wastewater Treatment System. Corros. Prot. 2018, 39, 892–895. [Google Scholar]
- Marín-Cruz, J.; Cabrera-Sierra, R.; Pech-Canul, M.; Gonzalez, I. EIS study on corrosion and scale processes and their inhibition in cooling system media. Electrochim. Acta 2005, 51, 1847–1854. [Google Scholar] [CrossRef]
- Defang, Z.; Wen, Q. Study on a Novel Composite Eco-Friendly Corrosion and Scale Inhibitor for Steel Surface in Simulated Cooling Water. J. Surf. Eng. Mater. Adv. Technol. 2012, 2, 137–141. [Google Scholar]
- Xu, Y.; Zhang, B.; Zhao, L.; Cui, Y. Synthesis of polyaspartic acid/5-aminoorotic acid graft copolymer and evaluation of its scale inhibition and corrosion inhibition performance. Desalination 2013, 311, 156–161. [Google Scholar] [CrossRef]
- GB 6479-2013; Seamless Steel Tubes for High Pressure Boilers. General Administration of Quality Supervision, Inspection and Quarantine of the People’s Republic of China: Beijing, China, 2014.
- GB/T 4336-2016; Carbon and Low-Alloy Steel—Determination of Multi-Element Contents—Spark Discharge Atomic Emission Spectrometric Method (Routine Method). Inspection and Quarantine of the People’s Republic of China: Beijing, China, 2016.
- GB/T 228.1-2010; Metallic Materials—Tensile Testing—Part 1: Method of Test at Room Temperature. Inspection and Quarantine of the People’s Republic of China: Beijing, China, 2011.
- GB/T 229-2020; Metallic Materials—Charpy Pendulum Impact Test Method. Inspection and Quarantine of the People’s Republic of China: Beijing, China, 2020.
- GB/T 13298-2015; Inspection Methods of Microstructure for Metals. Inspection and Quarantine of the People’s Republic of China: Beijing, China, 2015.
- GB/T 6394-2017; Determination of Estimating the Average Grain Size of Metal. Inspection and Quarantine of the People’s Republic of China: Beijing, China, 2017.
- GB/T 10561-2023; Determination of Content of Nonmetallic Inclusions in Steel—Micrographic Method Using Standard Diagrams. Inspection and Quarantine of the People’s Republic of China: Beijing, China, 2023.
- Jinchang, W. Investigation of some Porphyrin Derivatives as Inhibitors for Corrosion of N80 Steel at High Temperature and High Pressure in 3.5% NaCl solution containing carbon dioxide. Int. J. Electrochem. Sci. 2018, 13, 11961–11973. [Google Scholar]
- Bai, H.; Wang, Y.; Ma, Y.; Zhang, Q.; Zhang, N. Effect of CO2 Partial Pressure on the Corrosion Behavior of J55 Carbon Steel in 30% Crude Oil/Brine Mixture. Materials 2018, 11, 1765. [Google Scholar] [CrossRef] [PubMed]
- Sun, J.; Li, S.; He, M.; Yin, X.; Gao, X.; Yang, H. Corrosion patterns and protective measures of oilfield gathering and transportation pipelines in CO2 containing oil-water environments. Contemp. Chem. Ind. 2025, 54, 619–623. [Google Scholar]
- Sun, M.; Wang, X.; Cui, W.; Liu, H. Severe Microbial Corrosion of L245 Transportation Pipeline Triggered by Wild Sulfate Reducing Bacteria in Shale Gas Produced Water. Materials 2024, 17, 4377. [Google Scholar] [CrossRef]
- Choudhury, R.M.; Hsieh, M.; Vidic, D.R.; Dzombak, D.A. Corrosion management in power plant cooling systems using tertiary-treated municipal wastewater as makeup water. Corros. Sci. 2012, 61, 231–241. [Google Scholar] [CrossRef]
- Wang, J.; Kong, Z.; Shan, J.; Du, C.; Wang, C. Corrosion Rate Prediction of Buried Oil and Gas Pipelines: A New Deep Learning Method Based on RF and IBWO-Optimized BiLSTM-GRU Combined Model. Energies 2024, 17, 5824. [Google Scholar] [CrossRef]
- Ding, L.; Wang, H.; Gao, X. Wear Performance and Wear Prediction of Coating of Shrapnel Detector Arm for Oil and Gas Pipelines. Coatings 2025, 15, 309. [Google Scholar] [CrossRef]
- Ma, L.; Zhang, P.; Li, W.; Liu, X.; Yue, Y.; Liu, J.; Qu, H.; Cao, X.; Bian, J. Research progress on coating technology for oil and gas pipelines. J. Phys. Conf. Ser. 2025, 2971, 012006. [Google Scholar] [CrossRef]
- Yeganeh, M.; Heydarie, Y.; Shahryari, Z.; Asadi, N.; Kahkesh, H.; Ramezanalizadeh, H. Corrosion Inhibitor of API Pipeline Steels: A Review. J. Bio-Tribo-Corros. 2025, 11, 44. [Google Scholar] [CrossRef]
- Li, S.; Du, T.; Cui, G.; He, H.; Wu, P.; Li, Y. Inhibition Localized Corrosion of N80 Petroleum Pipeline Steel in NaCl-Na2S Solution Using an Imidazoline Quaternary Ammonium Salt. Processes 2024, 12, 491. [Google Scholar] [CrossRef]


Disclaimer/Publisher’s Note: The statements, opinions and data contained in all publications are solely those of the individual author(s) and contributor(s) and not of MDPI and/or the editor(s). MDPI and/or the editor(s) disclaim responsibility for any injury to people or property resulting from any ideas, methods, instructions or products referred to in the content. |
© 2025 by the authors. Licensee MDPI, Basel, Switzerland. This article is an open access article distributed under the terms and conditions of the Creative Commons Attribution (CC BY) license (https://creativecommons.org/licenses/by/4.0/).