1. Introduction
During coal seam mining, the roof of deep coal seams undergoes a complex combination of geological and mining-related stresses. This situation makes it prone to dynamic disasters, such as impact ground pressure [
1]. As mining depths continue to increase, traditional pressure relief methods like blasting, pre-hydraulic fracturing, and drilling pressure relief have shown significant drawbacks, including limited controllability and high disturbance levels [
2]. Hydraulic fracturing technology has emerged as a key solution for weakening coal seam roofs because of its precise controllability and uniform energy dissipation [
3]. This technique has been employed in some Chinese coal mines like Mengcun Coal Mine and Dongtan Coal Mine to prevent rock bursts [
4,
5]. It creates artificial fracture networks in rock formations using high-pressure fluids, effectively reducing the concentration of stress [
6]. Understanding how hydraulic fracturing behaves under different principal stress conditions and its influence on distorting the regional stress field is crucial for improving the efficiency of hydraulic fracturing in alleviating pressure from coal seam roofs.
Extensive research has been conducted to elucidate the propagation of hydraulic fractures under varying principal stress differences, based on field monitoring, experimental studies, and numerical simulations [
7]. It is generally acknowledged that hydraulic fractures primarily propagate along the maximum principal stress direction, according to microseismic monitoring and field testing [
8]. On-site research data can directly reflect the actual geological conditions and engineering responses. This method is usually costly and its monitoring accuracy is limited by the deep reservoir environment [
9]. Researchers simulate real underground strata stress states using triaxial experimental equipment to apply loads in various directions. They collect data on fracture bifurcation and turning during hydraulic fracturing experiments to analyze fracture propagation paths [
10]. Some researchers also employ numerical simulations to investigate fracture propagation mechanisms and stress field evolution for comparison with experimental and field data. They observe that fracture propagation predominantly occurs along the σH direction. However, the three-dimensional fracture network resulting from fracture development and propagation creates a stress shadow effect that influences the regional stress field [
9,
11]. However, the stress levels vary at different depths, leading to uncertainty regarding hydraulic fracture propagation under diverse stress conditions [
12]. The spatial distribution of different hydraulic fractures’ impact on the stress field regulation remains unclear.
Hydraulic fracture propagation is not only affected by the principal stress difference but also by the absolute value of the stress [
13,
14]. Deep reservoir fracturing practice found that, under the same stress difference, the fracture propagation showed significant differences in high- and low-stress environments [
15]. Compared with the low-stress environment, high stress will significantly change fracture propagation and fracture network complexity [
11,
16]. The lithology of rock varies according to stress levels. In high-stress conditions, the brittleness index of rock notably increases with rising stress levels, consequently reducing the rock’s resistance to fracture propagation [
17]. At a microscopic scale, the varying stress sensitivity of the rock’s mineral components results in increased anisotropy. Quartz particles undergo brittle fracture under high-stress conditions, leading to accelerated fracture propagation upon strain release. In contrast, clay minerals like illite exhibit plastic deformation, creating localized stress barriers that cause fractures to change direction [
18,
19]. This shows that the absolute stress value has a regulatory effect on fracture propagation independent of stress difference [
20]. To determine the effect of absolute stress values on fracture propagation during hydraulic fracturing, true triaxial hydraulic fracturing experiments need to be carried out under different stress conditions and compared with theoretical calculations. Additionally, existing numerical models mostly use static constitutive models to describe the stress field state. It is assumed that the regional stress field remains unchanged during the fracture propagation process [
21,
22]. However, the spatial distribution of hydraulic fracture networks will have a significant impact on the regional stress field, inducing regional stress field redistribution.
Based on the independently developed true triaxial hydraulic fracturing experimental system, this paper conducts hydraulic fracturing experiments on top-slab rock formations and explores the coupling mechanism between hydraulic fracture propagation and the rock formation stress field. The 3D form of the hydraulic fractures was obtained through high-resolution CT scanning technology. Combined with the evolution of the hydraulic fracture propagation stress field obtained by numerical simulation, the system revealed the initiation and propagation laws of hydraulic fractures in the ground stress field.
This paper follows a research methodology of “laboratory experiment–theoretical model–numerical simulation”.
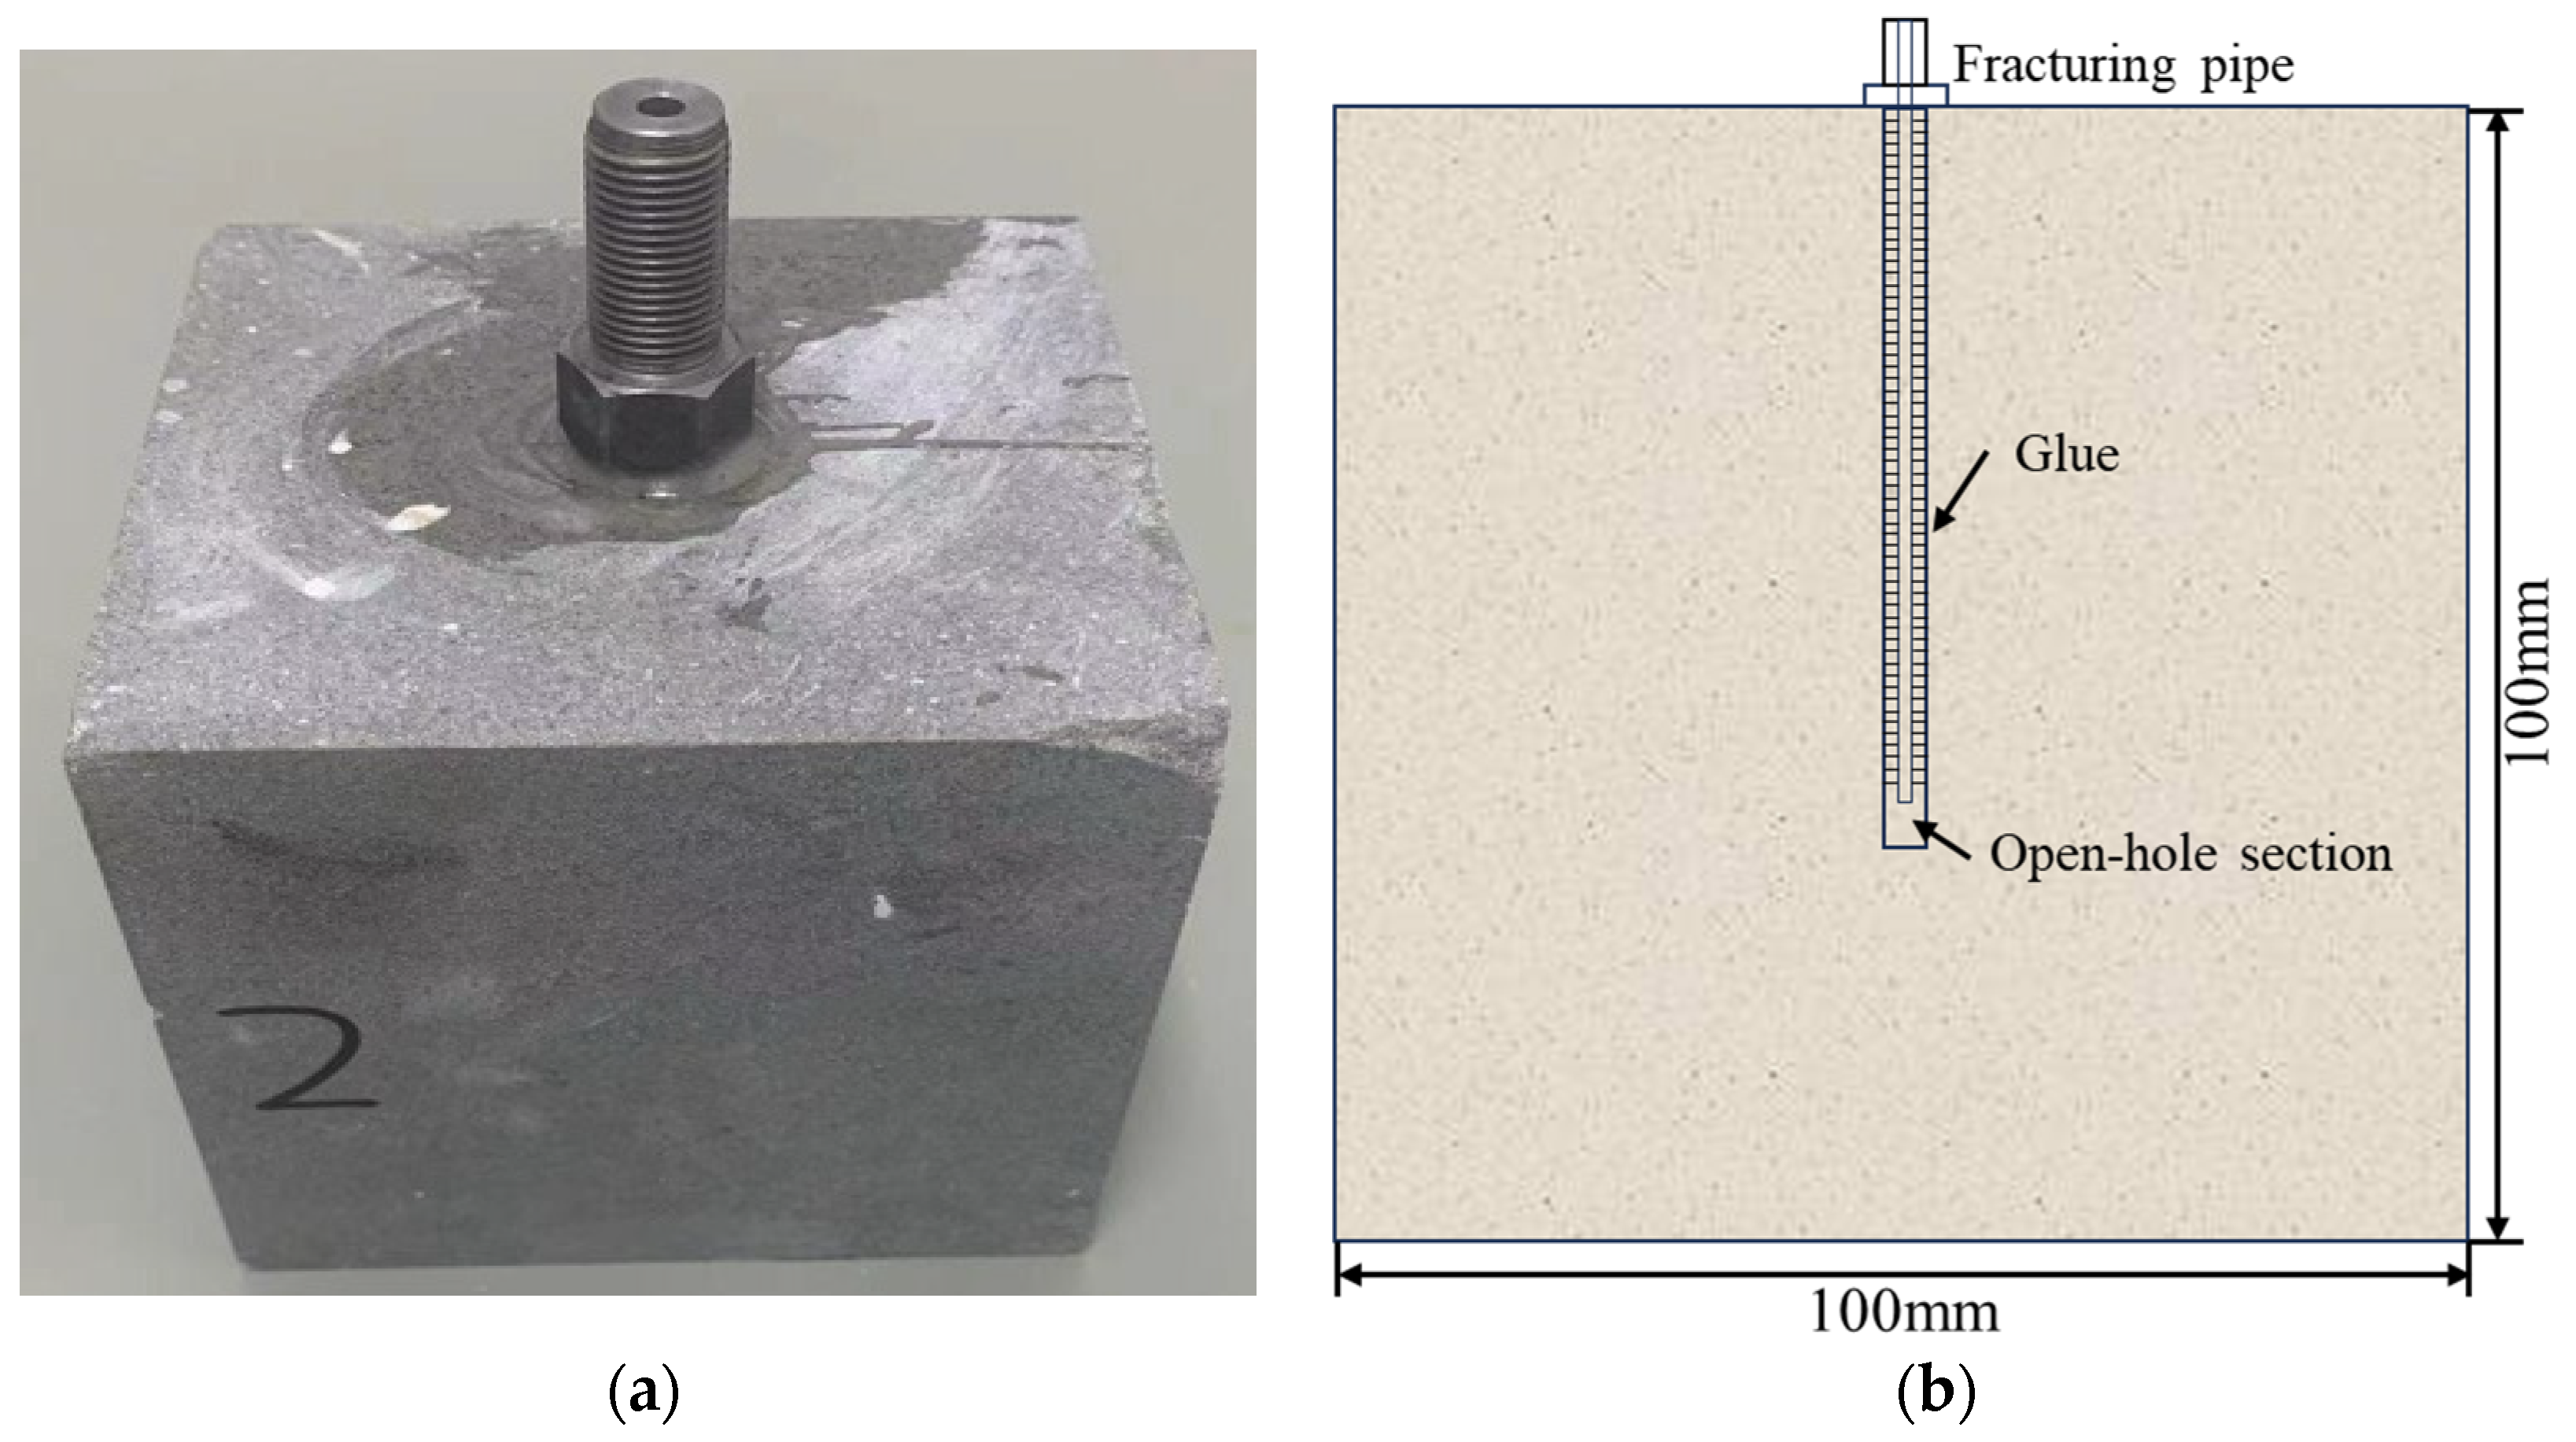
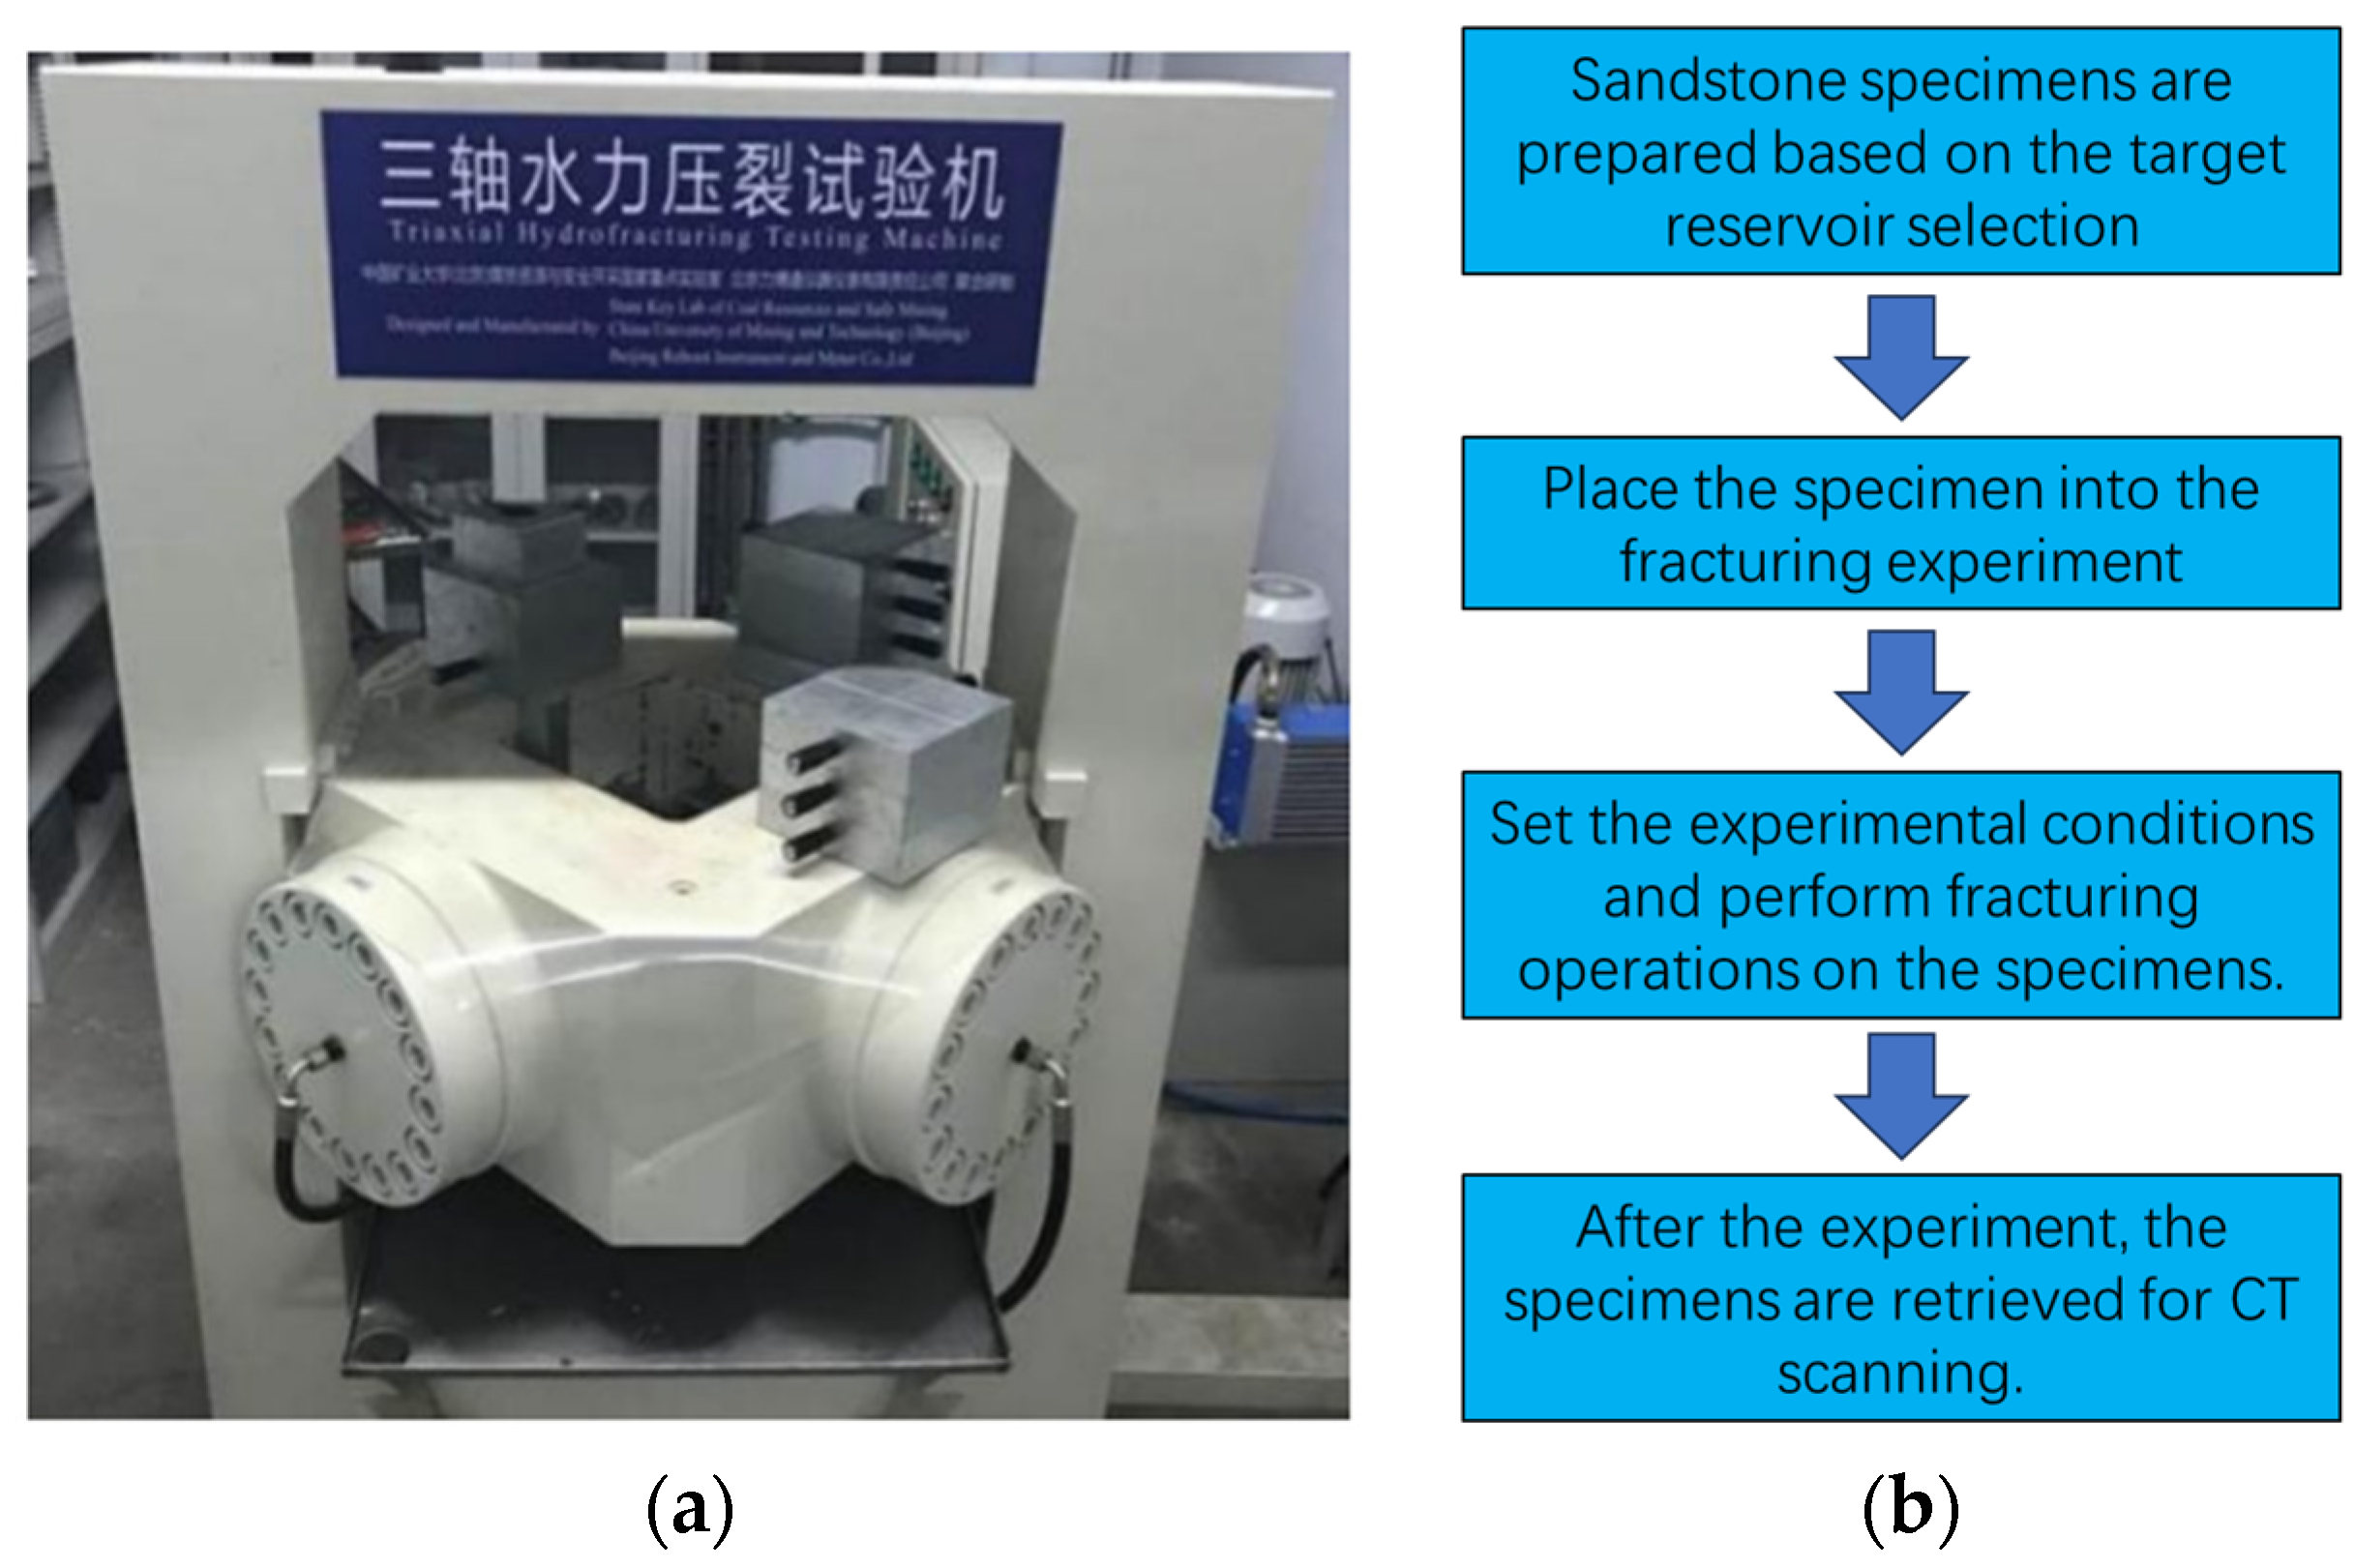
Section 2 provides an overview of the experimental procedures, encompassing sample preparation, test equipment, experimental conditions, and the reconstruction of three-dimensional hydraulic fracture morphology. In
Section 3, we examine the morphology of fracture propagation and deflection angles under varying principal stress conditions through experiments to assess the impact of principal stress on hydraulic fracturing behavior.
Section 4 delves into an analysis of the effect of stress intensity factor on fracture initiation angles using a hydraulic fracturing mechanics model, and contrasts the disparities between theoretical and experimental fracture initiation angles.
Section 5 employs a finite element numerical method to investigate the stress field variations induced by fractures. The paper concludes with a summary in
Section 6.
3. Experimental Results
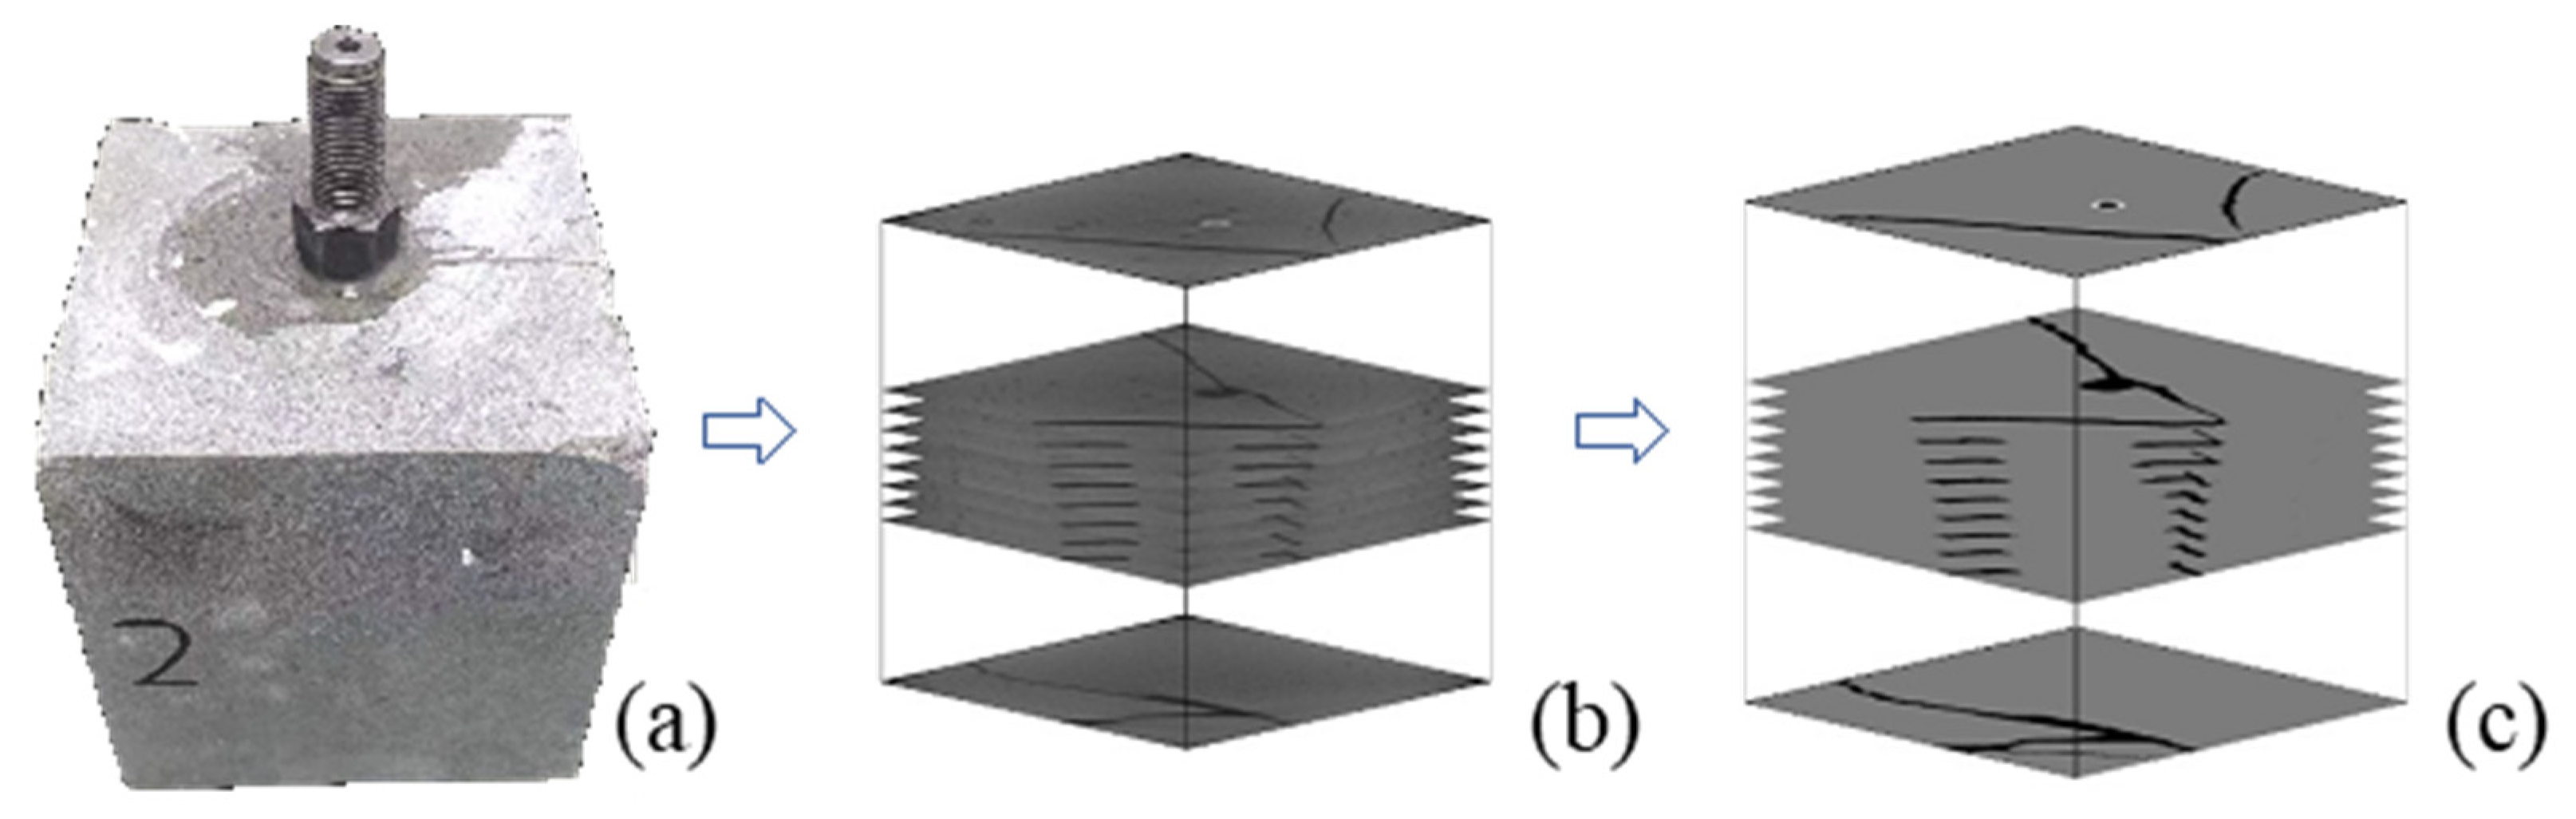
Figure 4 shows the 3D reconstruction model of the hydraulic fractures after the specimen was fractured. The maximum principal stress is defined as the x direction, the minimum principal stress is the y direction, and the vertical principal stress is the z direction. The results indicate that following the hydraulic fracturing of the specimen under three distinct conditions, hydraulic fractures originated from the open-hole section, leading to the expansion of the specimen boundary along a specific trajectory, resulting in the formation of an interwoven mesh structure of hydraulic fractures. In Case I (
Figure 4a), with a horizontal stress difference coefficient K
h of 0.44, the hydraulic fractures propagate in the direction of the maximum principal stress (σ
H) and further extend along this path, ultimately creating an almost horizontal fracture pattern. In Case II (
Figure 4b), as the horizontal stress difference coefficient K
h increases to 0.50, the hydraulic fracture initially extends towards the maximum principal stress direction upon cracking in the open-hole section. However, the fracture subsequently deviates, expanding towards the specimen boundary in the direction of the minimum principal stress, resulting in the formation of a complex and distorted fracture network within the specimen. This demonstrates the influence of both tensile and shear stress on fracture propagation. In Case III (
Figure 4c), with a horizontal principal stress coefficient (K
h) of 0.65, a single fracture emerges post hydraulic fracturing. This fracture predominantly extends in alignment with the maximum principal stress direction, albeit at an angle to the maximum primary stress direction. Notably, as the maximum horizontal principal stress reaches 38 MPa, fracture propagation is significantly governed by the maximum principal stress, leading to its continuous expansion towards the specimen boundary along the plane.
The complexity of the fracture propagation process within the specimen is evident, with the stress field being a critical factor influencing fracture advancement. In cases where the horizontal principal stress coefficient is minimal, the specimen is predominantly in a traditional triaxial state. Following the initiation of hydraulic fracture, its expansion aligns with the direction of the maximum principal stress, exhibiting minimal deviation. As the horizontal principal stress coefficient gradually rises, the hydraulic fracture undergoes deflection during propagation, leading to the formation of distorted hydraulic fractures. Notably, under significant horizontal principal stress, the influence of the remaining principal stress on fracture propagation diminishes, enabling hydraulic fractures to steadily extend along a plane at an angle to the direction of the maximum principal stress, typically without deviation in the propagation trajectory.
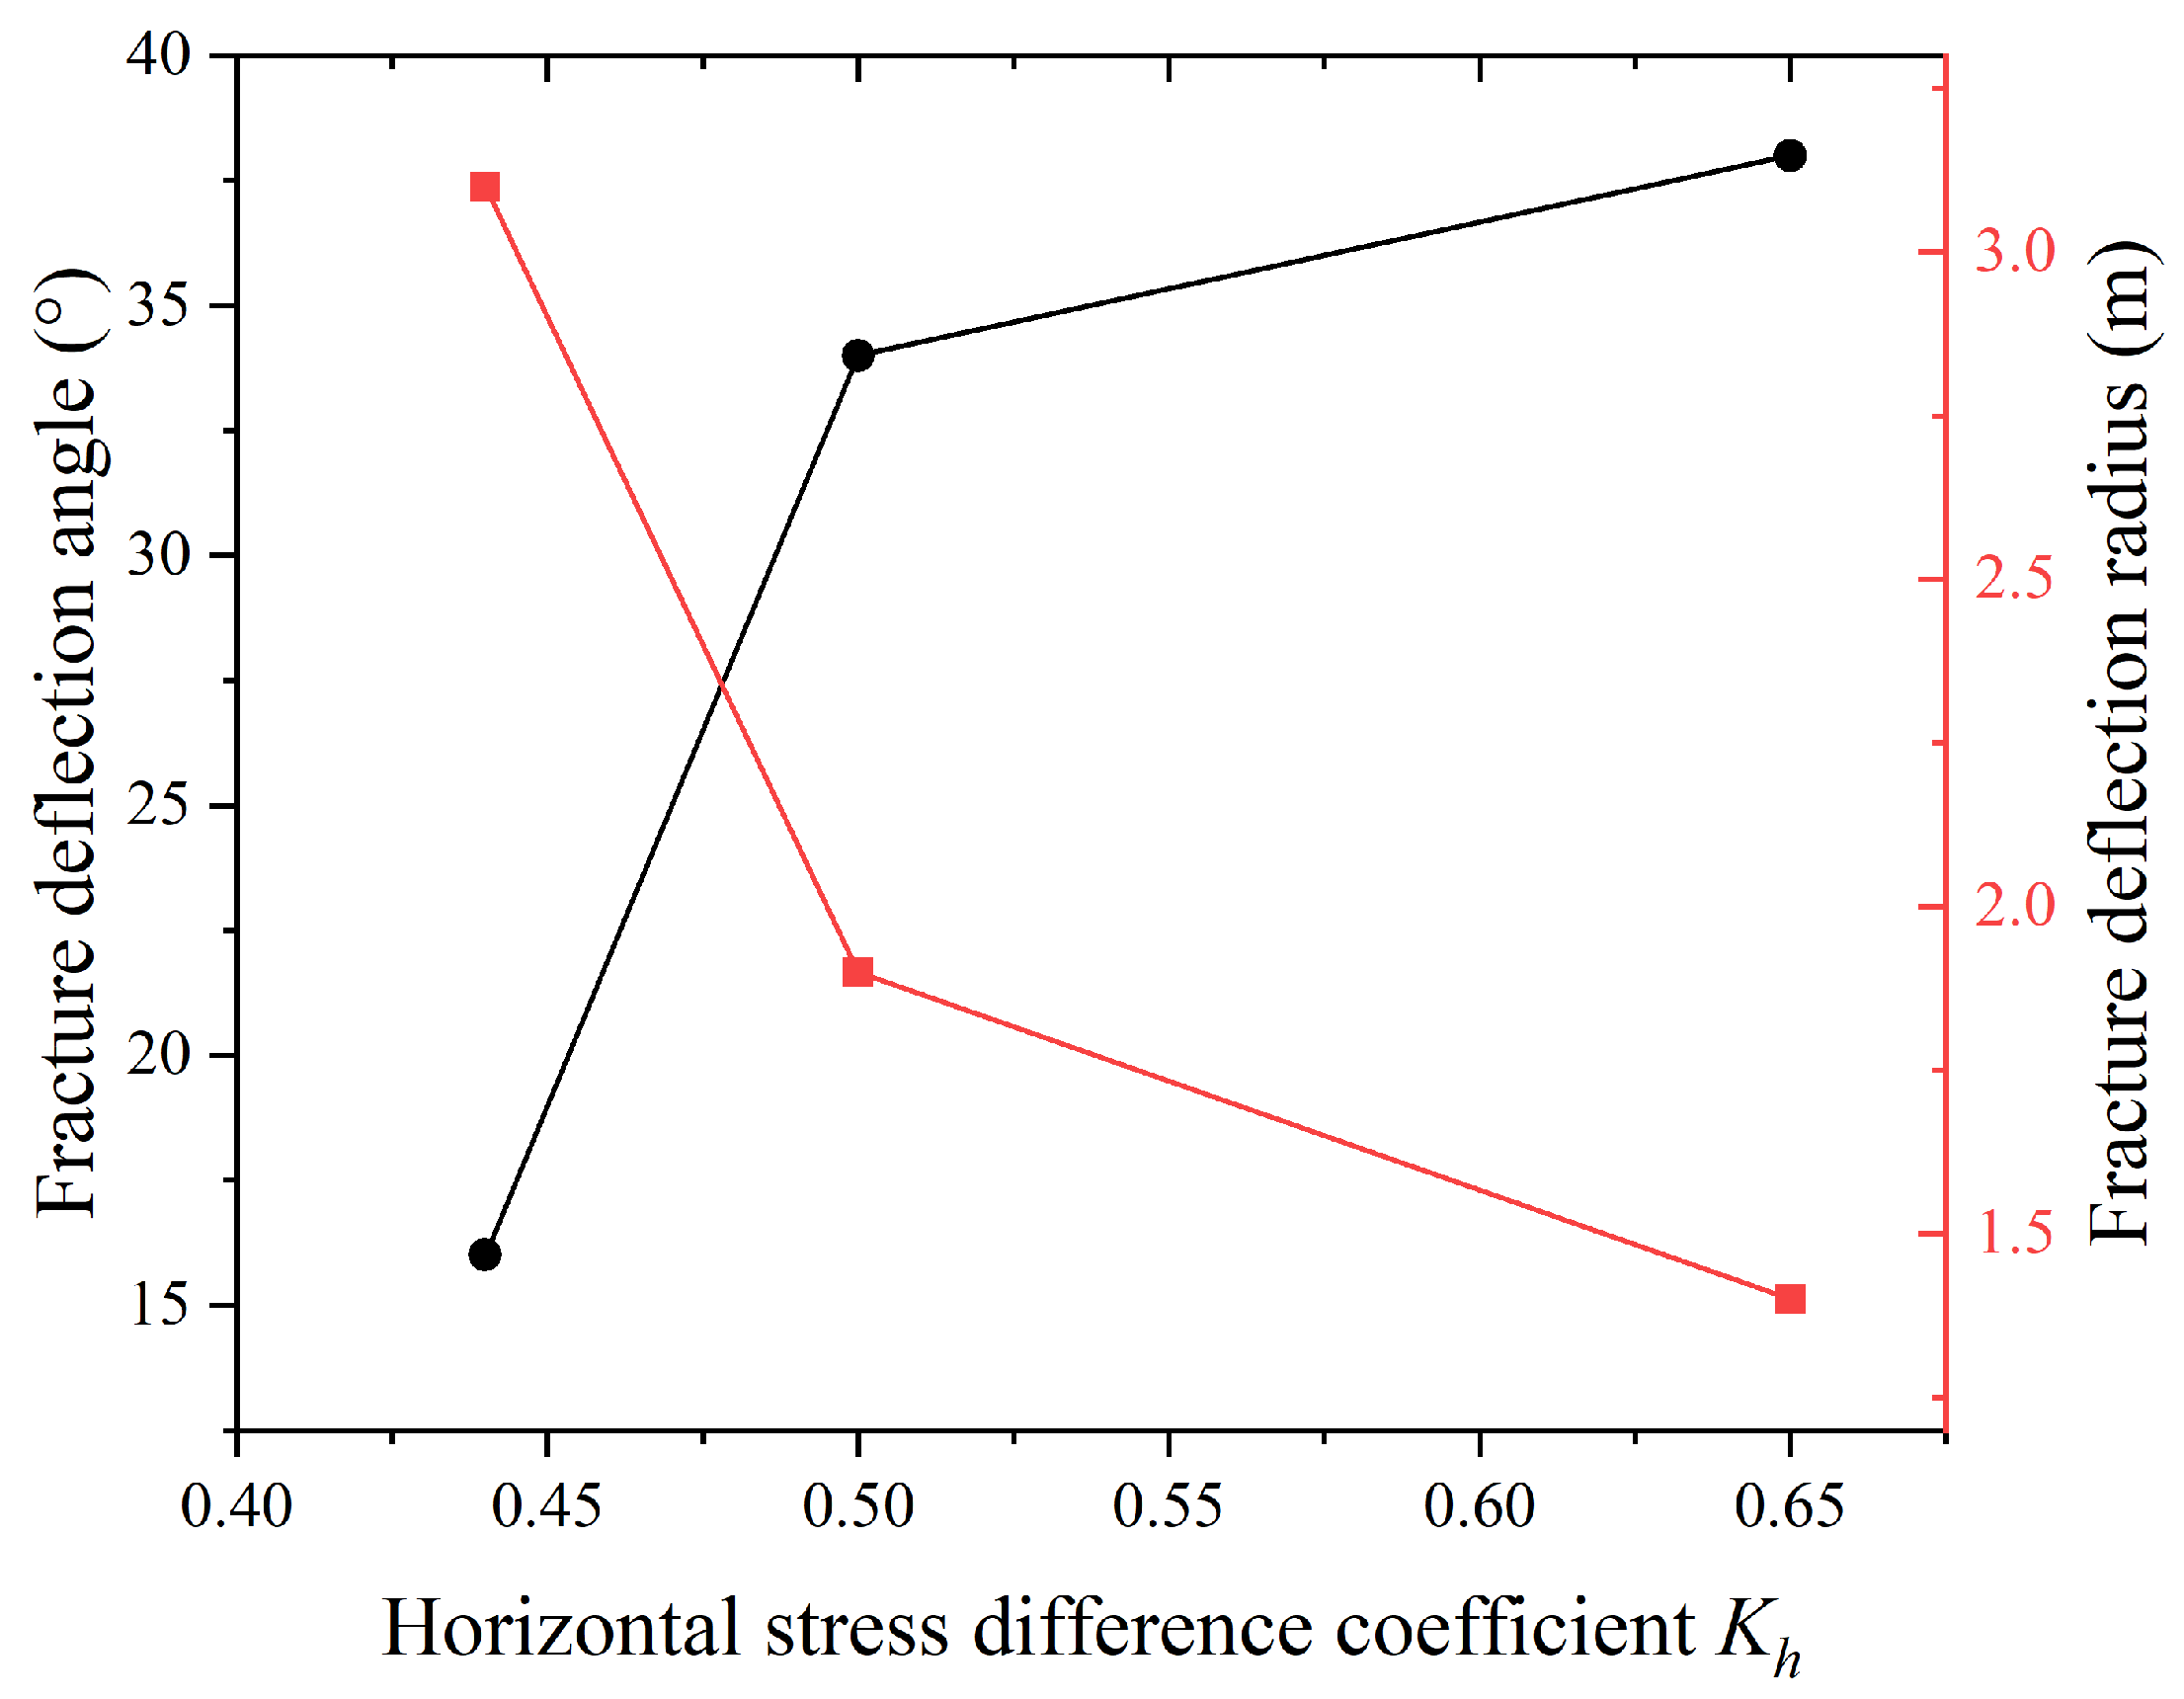
Figure 5 shows the variation in the deflection angle and deflection radius of hydraulic fractures with the horizontal principal stress difference coefficient
Kh. It can be seen that the deflection angle of the fracture increases with the increase in the stress difference coefficient because the fracture always tends to turn and expand in the direction of the maximum principal stress as the stress difference increases. It can also be seen in the 3D reconstruction of the fracture in
Figure 4a that, although the minimum horizontal principal stress
σh and the maximum horizontal principal stress
σH set by the experimental conditions are not very different, and the hydraulic fracture extends approximately linearly during the cracking stage, it still tends to deflect along the direction of the maximum principal stress
σH during the propagation process, and a relatively obvious deflection occurs overall. This is due to the anisotropy of the breaking energy in the specimen, where the lower energy in the horizontal direction causes the fracture to deflect and continue its extension horizontally. The deflection radius of hydraulic fractures decreases with the increase in the stress difference coefficient because the increase in horizontal principal stress difference makes the propagation of the fractures in the reservoir easier and the fractures are more likely to turn. Other researchers have reached similar conclusions. The findings indicate that higher values of the coefficient of horizontal principal stress difference lead to the accelerated propagation of hydraulic fractures, the increased likelihood of single-fracture formation, and a reduced fracture surface area [
23,
24]. On the other hand, with a sufficiently large horizontal stress difference coefficient, the fracture deflection angle increases, but the growth rate slows down, and the deflection radius decreases also slow down. This phenomenon occurs because, while the increased horizontal stress difference makes the fracture more prone to deflection, it concurrently diminishes the impact of other influencing factors such as vertical stress on fracture deflection.
The change in injection pressure over time during hydraulic fracturing is shown in
Figure 6. With the injection of fracturing fluid, the injection pressure gradually increases. Once the injection pressure peaks, hydraulic fractures form and propagate. Consequently, the fracturing fluid infiltrates the specimen’s interior as the hydraulic fractures penetrate it, leading to a rapid decline in injection pressure. When the horizontal principal stress difference coefficient (
Kh) is small (
Figure 6a), the injection pressure curve changes smoothly without obvious fluctuations, and the breakdown pressure is 31.29 MPa. This shows that hydraulic fracture propagation tends to stabilize when
Kh is low, which is consistent with the uniformity characteristics of rock ruptures under conventional triaxial stress states; when
Kh gradually increases (
Figure 6b), the pressure first gradually rises to 32.96 MPa, then maintains a plateau period of about 30 s, and then drops rapidly. The platform period arises from the combined influence of horizontal principal stress and vertical stress on fracture propagation. This interaction leads to the simultaneous advancement of multiple fractures, causing localized energy dissipation and ultimately resulting in the formation of the platform period. It is worth noting that when
Kh increases sufficiently (
Figure 6c), the horizontal principal stress difference will dominate the cracking and spread of the fracture. The pressure curve briefly declined after initially rising to 14 MPa (approximately 1.2 MPa) and then continued to rise with a peak pressure of 21.77 MPa. Small peaks on the pressure curve indicate the development and aggregation of fractures that gradually evolve in the specimen and cause fracture damage to the specimen.
The horizontal principal stress difference coefficient significantly impacts the breakdown pressure of the specimen. A higher stress difference coefficient results in increased stress variation within the rock, facilitating the initiation of hydraulic fractures. On the other hand, vertical stress also plays a role in the magnitude of the breakdown pressure. Although the horizontal stress difference coefficient in case II is greater than the stress difference coefficient of case I; due to the vertical stress, the breakdown pressure of case II is greater than the breakdown pressure of case I.
4. Effect of Stress Intensity Factor on Fracture Initiation Angle
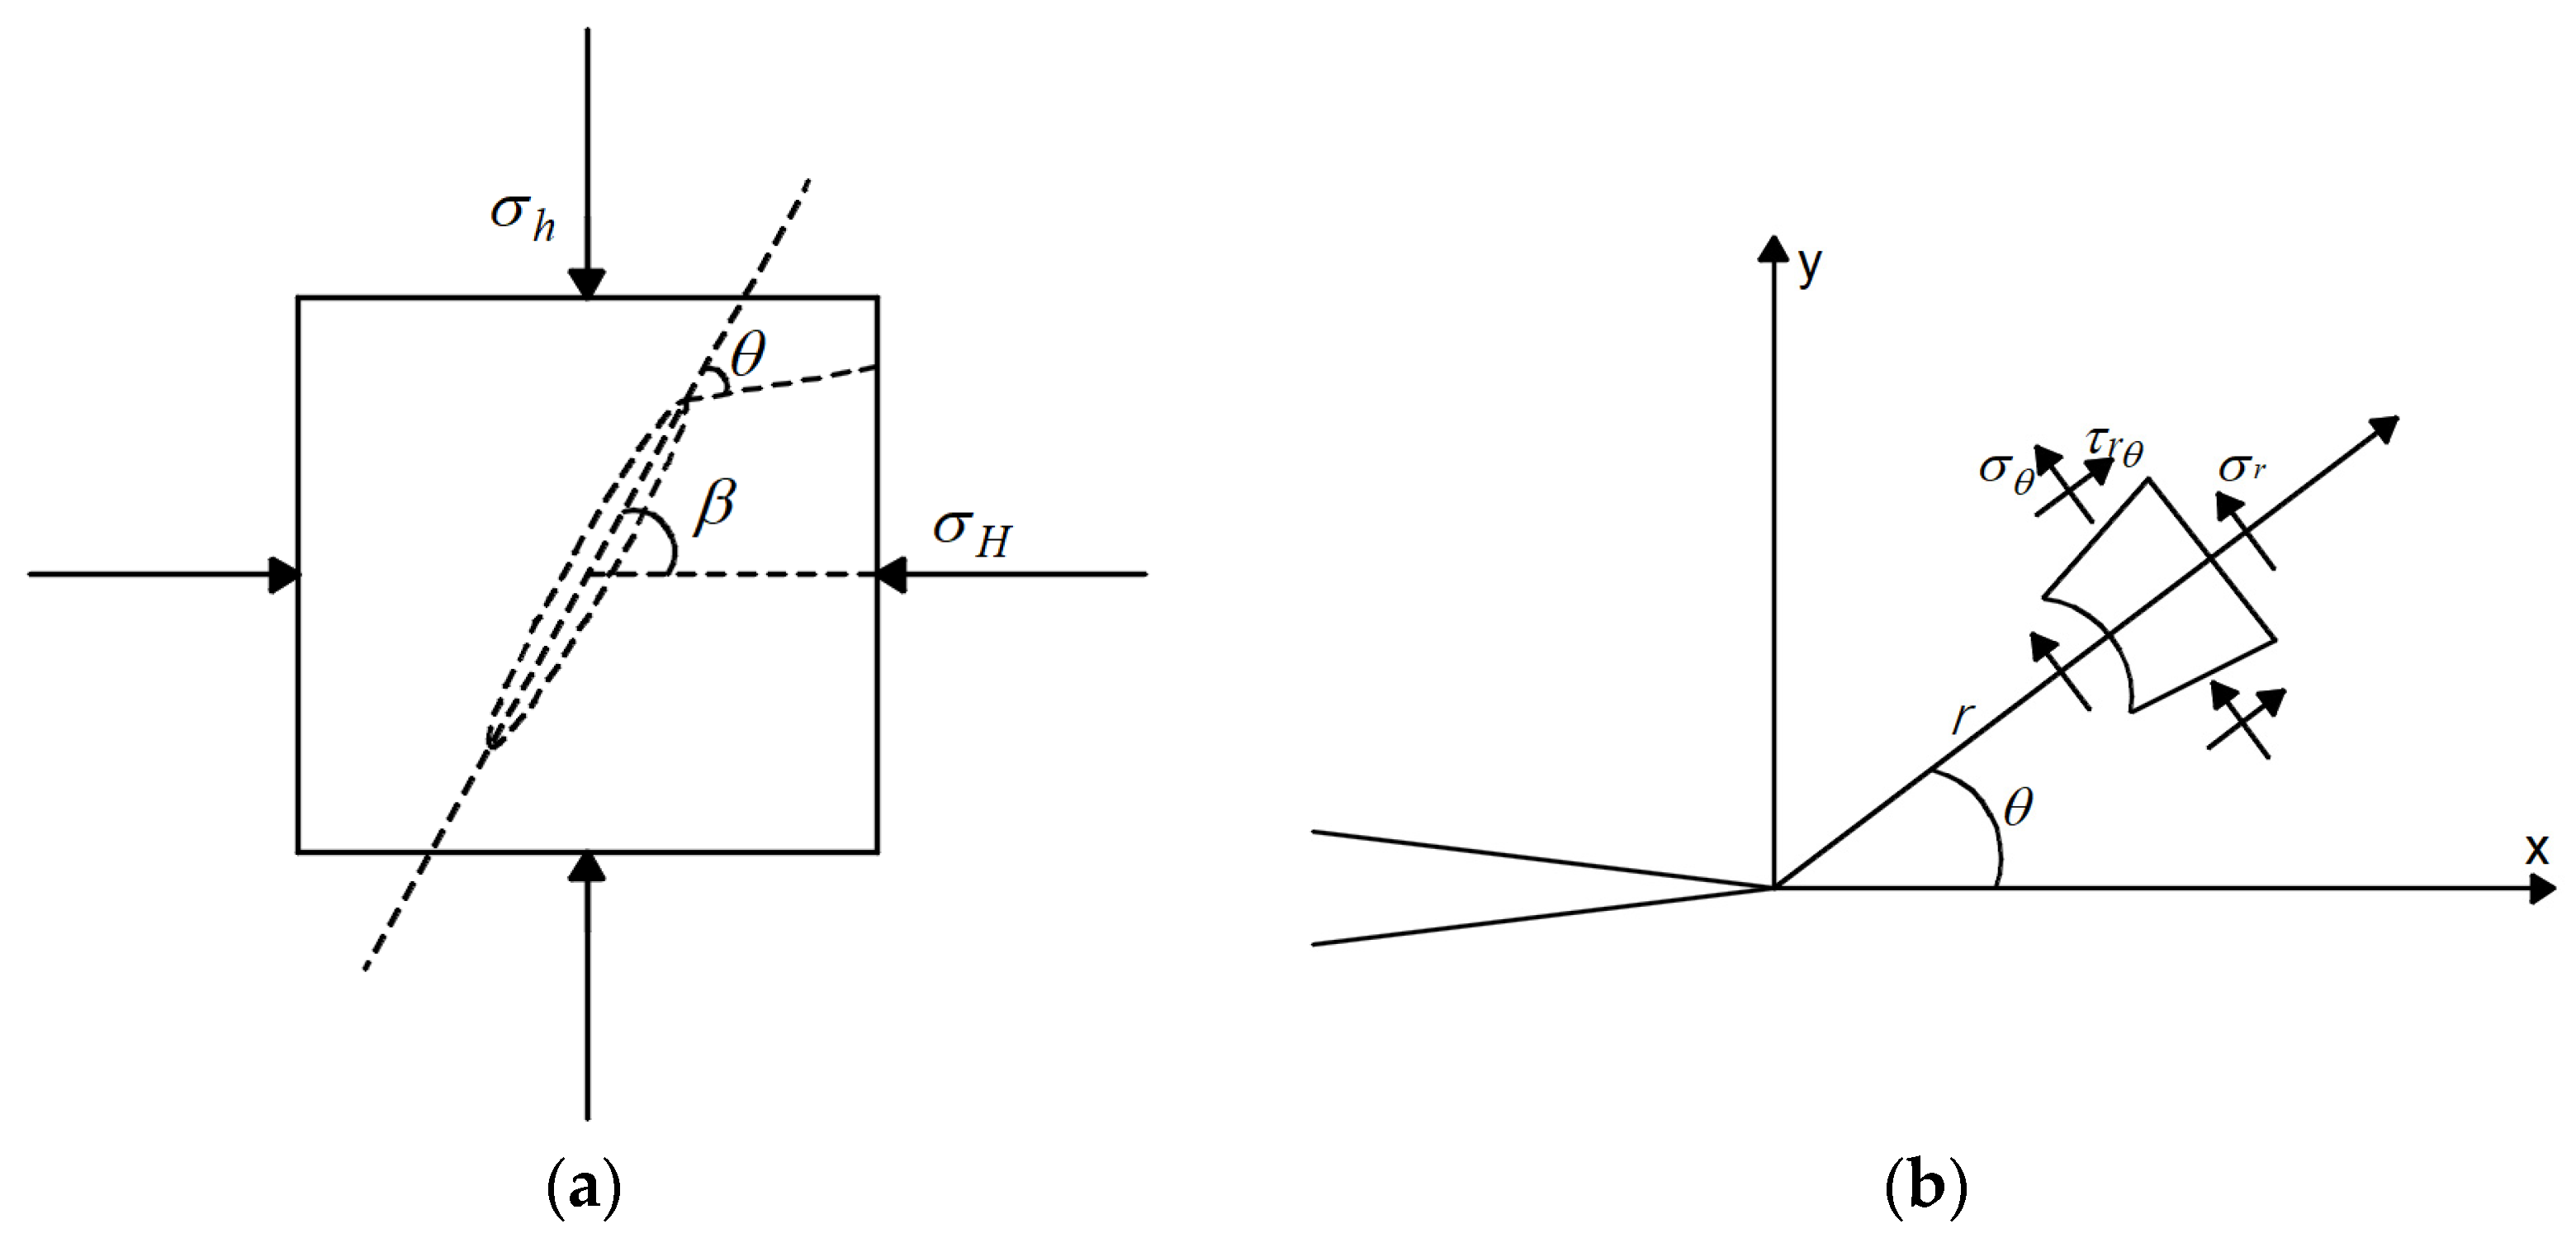
According to the theory of elastic mechanics, a hydraulic fracturing mechanical model was established as shown in
Figure 7a. The model consists of an inclined hydraulic fracture with a length of 2a, subject to the combined action of far-field stresses
and
. Here,
β is defined as the angle between the prefabricated hydraulic fracture and the horizontal direction, while
θ represents the angle between the fracture propagation direction and the principal stress direction.
The positive stress
σn and the tangential stress
τn on the hydraulic fracture face are
where
P is the injected pressure,
α1 is the Bio coefficient, and
po is the pore pressure.
The Model I and Model II stress intensity factors for hydraulic fractures in
Figure 8 are
Figure 7b shows the stress distribution at the tip of a hydraulic fracture in a linearly elastic material and a schematic diagram of variables. The expressions for the stress components at the tip of the hydraulic fracture in polar coordinates are
where
σr is the radial stress,
σθ is the circumferential stress,
τrθ is the shear stress, and
r is the radius of the hydraulic fracture propagation zone.
Suppose that hydraulic fracturing commences along the direction of the maximum circumferential tensile stress, then the initiation angle
θ of hydraulic fracturing must meet the following conditions:
According to Equations (5)–(8) the following equation can be obtained:
Based on the maximum circumferential tensile stress theory, solving Equation (9) yields the critical hydraulic fracture initiation angle
θc as follows:
Simplifying Equation (10) yields the relationship between
and
θc as follows:
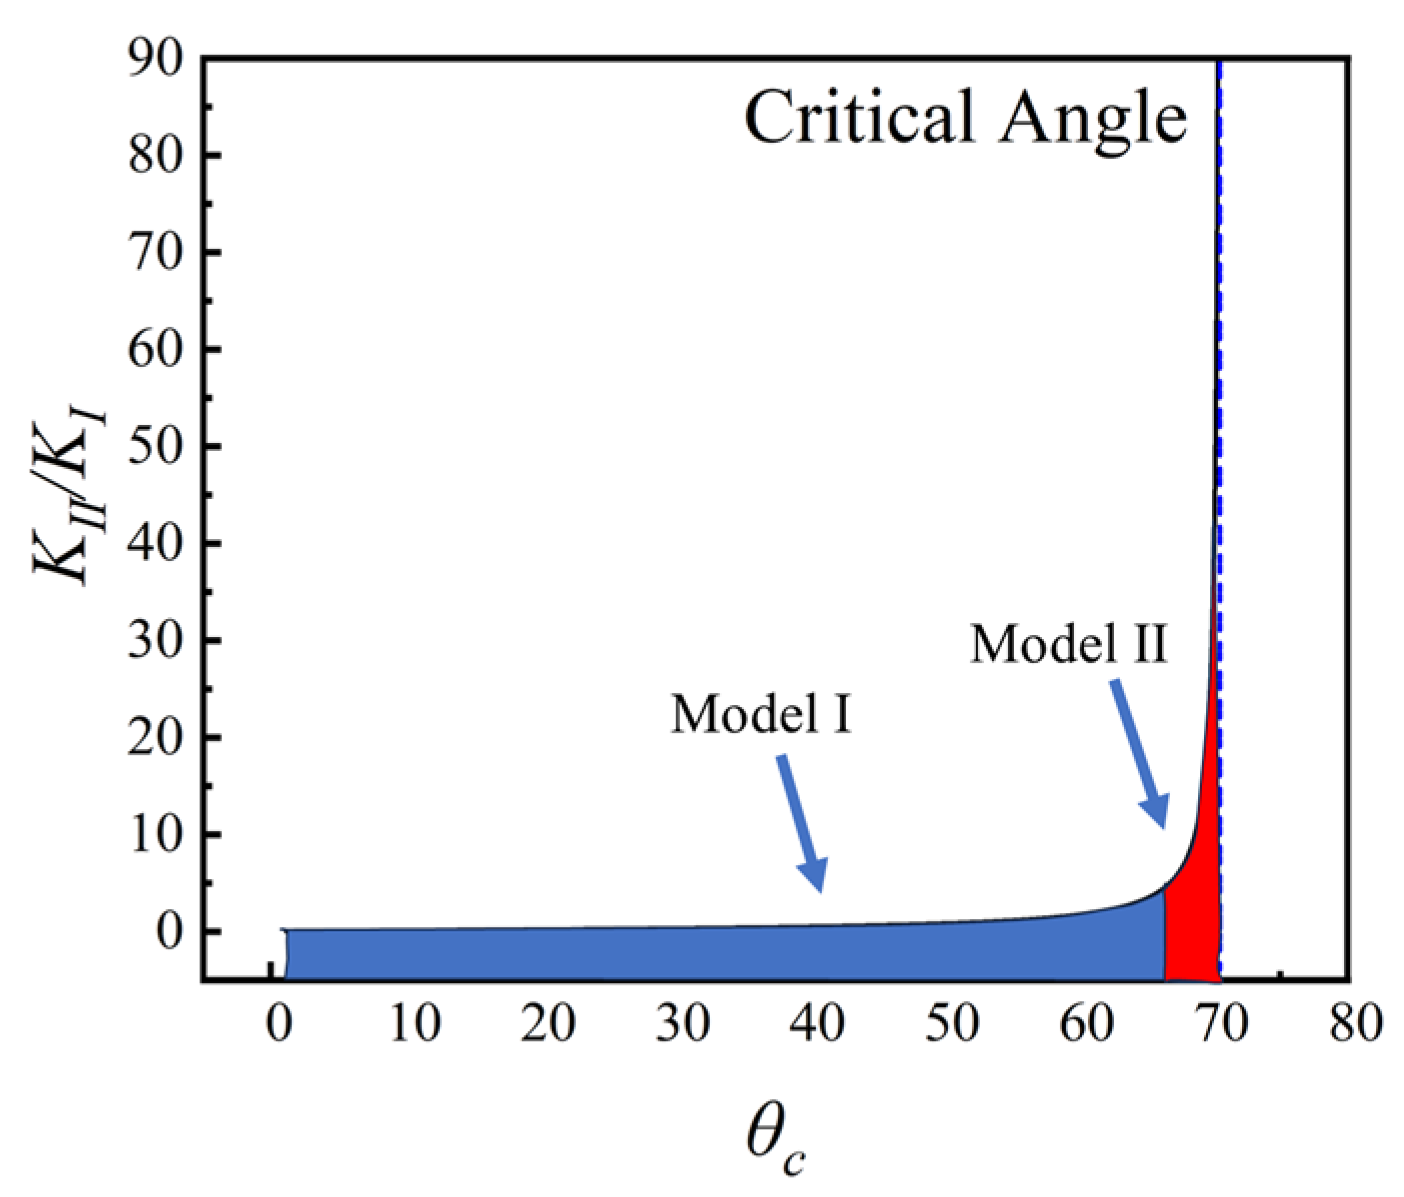
According to the theory of maximum circumferential tensile stress, fracture propagation is influenced by the highest circumferential stress component and the path it follows is influenced by the combined effect of mode I and mode II stress intensity factors. Since the fracture tip typically experiences a mixed stress state in practical loading scenarios, a comprehensive understanding of propagation behavior cannot be achieved solely through the analysis of tensile (
KI) or shear (
KII) actions. This study introduces parameters
KII/KI to identify the fracture mode during hydraulic fracture propagation. Equation (11) reveals that the ratio
KII/KI is contingent upon the critical diffusion angle,
θc, determining the prevailing crack propagation mode as either Model I or Model II failure within specific angle thresholds.
Figure 8 illustrates an escalating
KII/KI trend with increasing
θc. In the figure, the fracture propagation mode in the blue area is dominated by Model I failure, and the fracture propagation mode in the red area is dominated by Model II failure. For
θc values below 67°, predominantly Model I failure occurs, particularly evident when
θc approaches, signifying near-pure mode I failure and stable crack propagation along the principal stress axis. Conversely, when
θc surpasses 67°, a sharp decline in
KII/KI ensues, leading predominantly to Model II failure. Our investigation establishes a maximum fracture deflection angle of 38.9°, affirming that fracture initiation and propagation are governed by Model I failure.
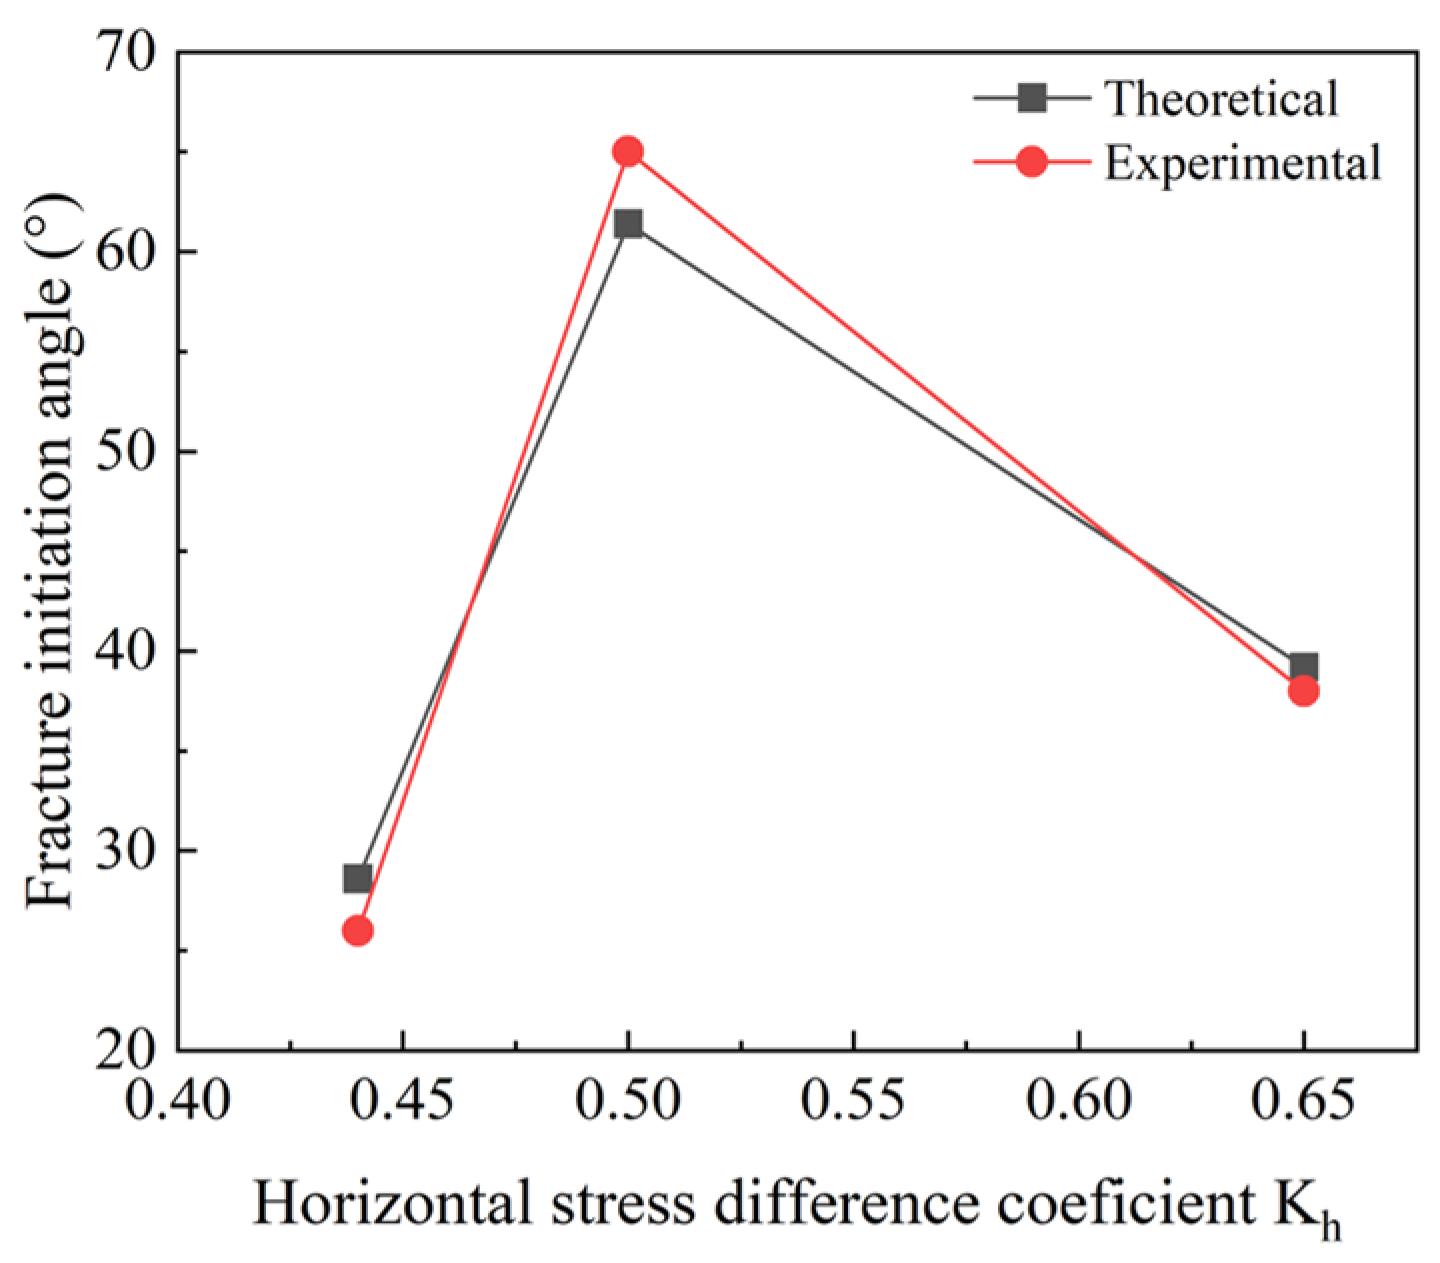
Based on this mechanical model, inputting the experimental conditions into the calculation yields the theoretical fracture initiation angle. Meanwhile, the actual fracture initiation angle measured in the experiment is presented in
Figure 9. The theoretical and experimental errors in the three cases are 5%, 7%, and 3%, respectively. The disparity between theoretical and experimental fracture initiation angles is within 10%, suggesting that the model effectively predicts the direction of fracture initiation.
5. Effects of Hydraulic Fractures on Regional Stress Field
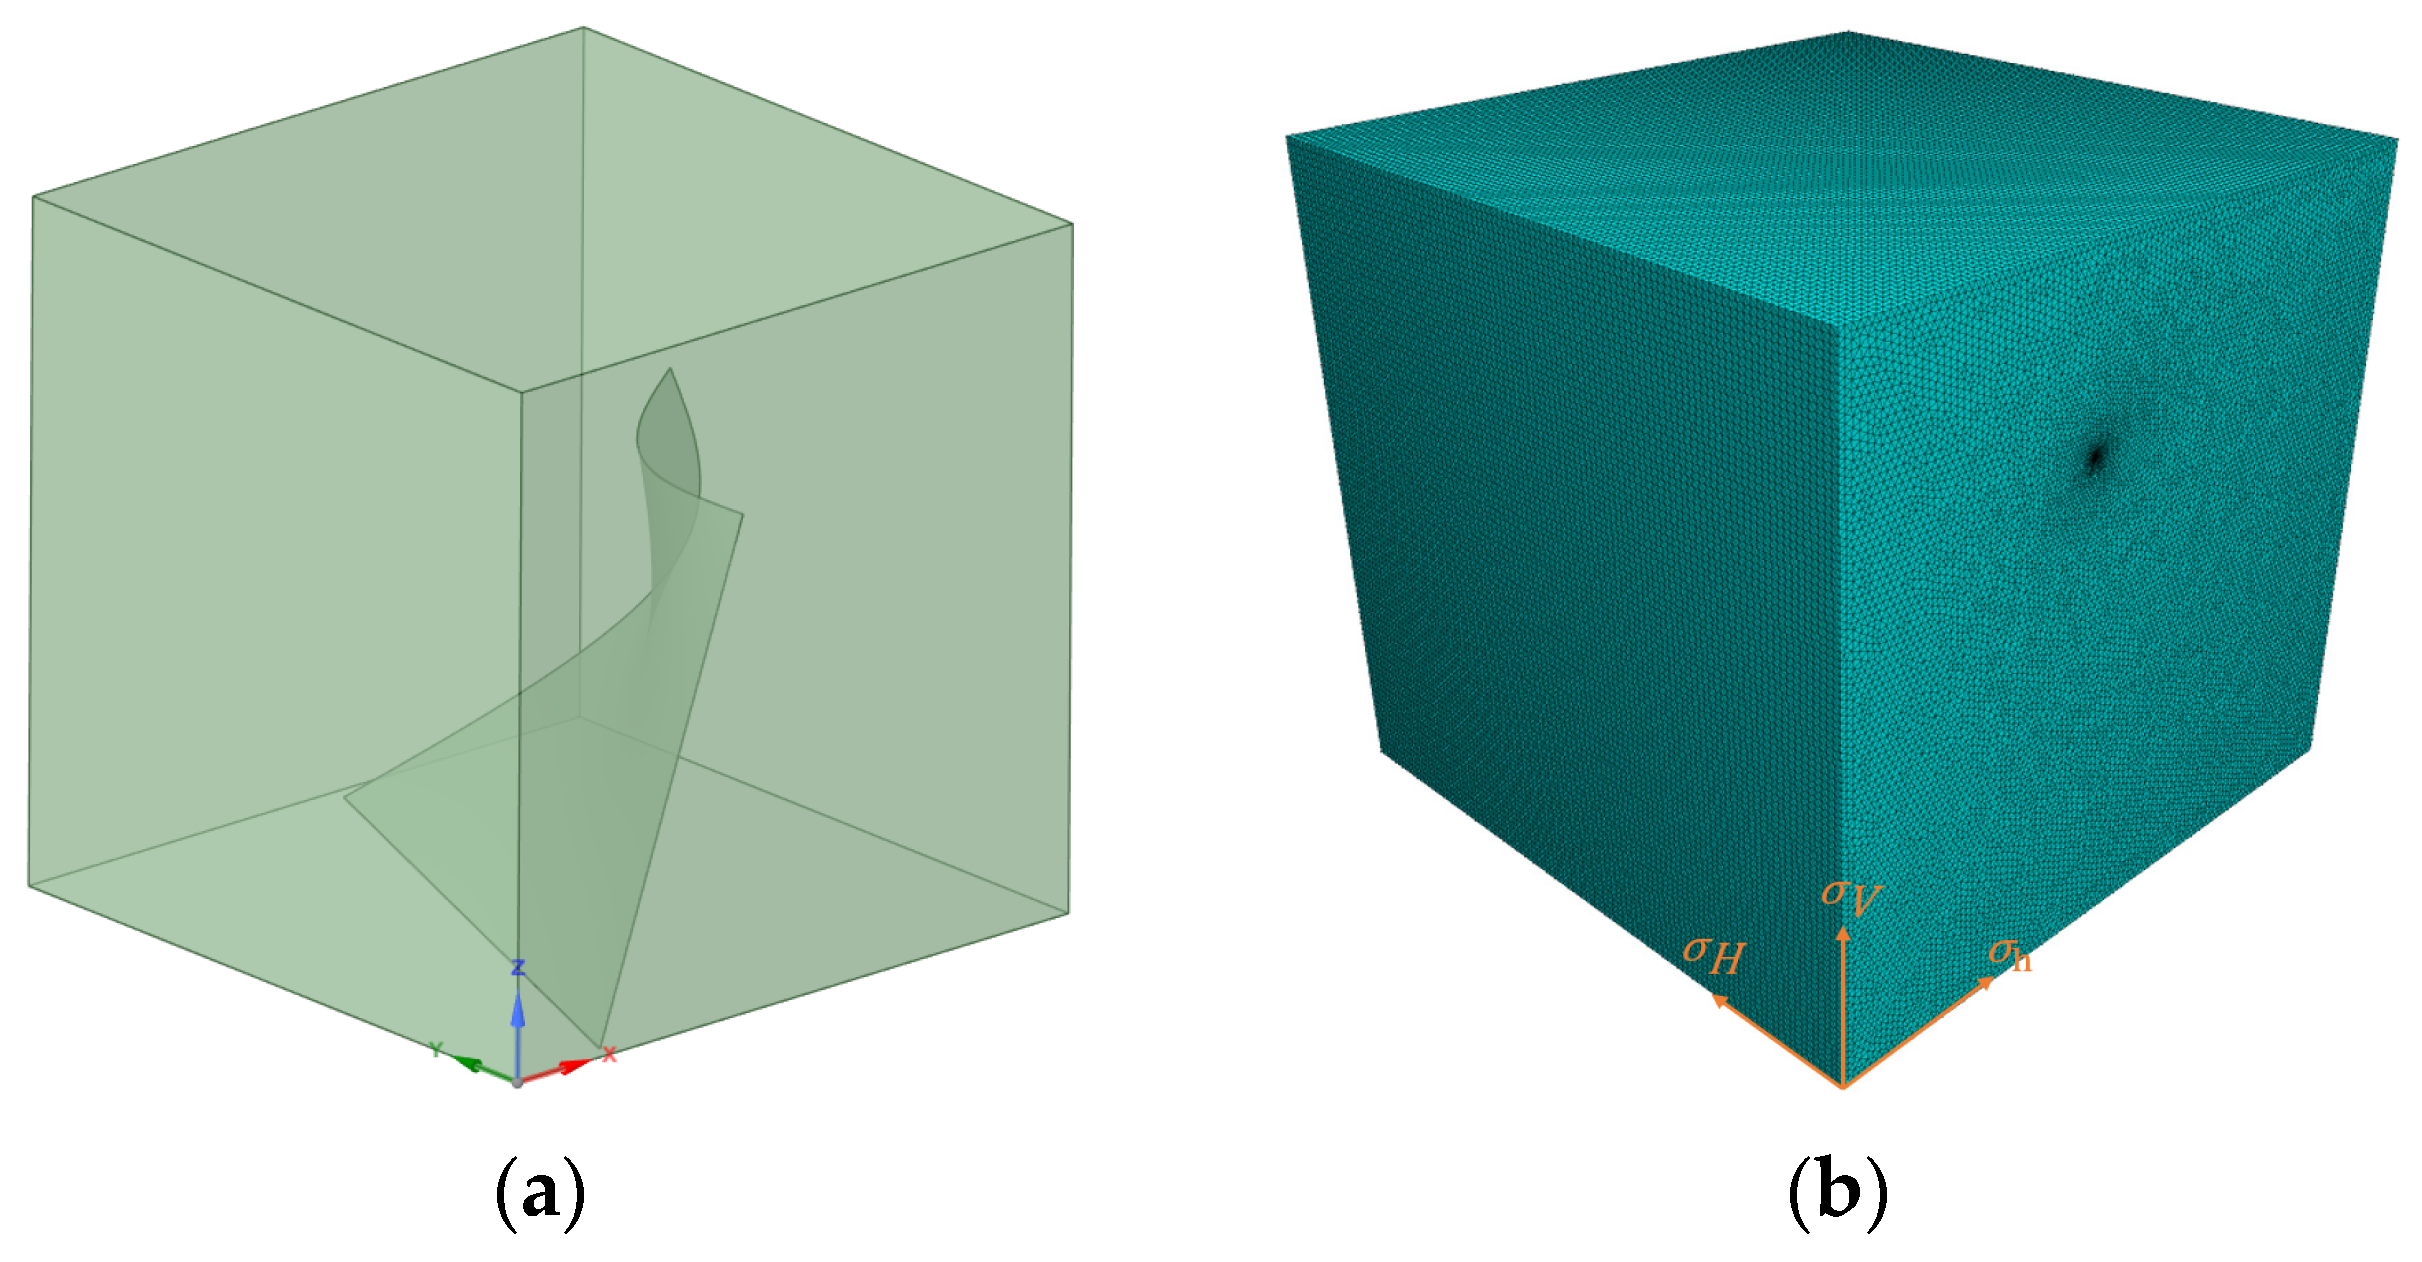
After hydraulic fracturing, the presence of fractures will significantly affect the stress field. To obtain the stress field changes caused by fractures, embedded fracture finite element models (FEMs) under identical boundary conditions were computed. Due to the relatively weak computational capacity of finite element methods for fracture propagation in hydraulic fracturing, a modeling approach embedding fractures into the geometric model was adopted. As shown in
Figure 10a, a tetrahedral mesh with a global size of 1 and a minimum size of 0.1 was created using Abaqus software, as presented in
Figure 10b. Abaqus software version number is Abaqus 2024. By constraining all degrees of freedom of the nodes on the lower surface of the numerical model and applying pressure consistent with experimental conditions to the upper surface, boundary conditions identical to the experiment were ensured. The model was imported into FLAC3D, a finite element analysis software, and analyzed using linear elastic constitutive relations under the assumption of isotropic material properties. FLAC3D software version number is FLAC3D6.0, this version has the ability to deal with large-scale models. The numerical simulations were conducted on high-performance computing (HPC) clusters featuring dual Intel Xeon Gold 6248R processors. The model consisted of 1.8 million elements, with a refined mesh structure in the critical region (fracture tip), and the mesh convergence ratio was 1 × 10
−5. The computation time for a single operational scenario was 2.8 h.
Figure 11 shows the contour plot of local 3D stress variations after fracturing. It can be observed that fractures exert a significant influence on the overall stress field. Notably, stress concentration tends to occur at the tips of hydraulic fractures near the fracture zone, while both sides of the fractures exhibit unloading states.
To quantitatively analyze the influence of different hydraulic fractures on the stress field, the 3D stress values at the mid-horizontal direction of the model (i.e., z = 50 on the y = 50 section) were extracted, as shown in
Figure 12. The dashed line represents the initial in situ stress. Since hydraulic fractures nearly penetrated the model, the overall 3D stress decreased in all cases, indicating that the presence of hydraulic fractures can effectively reduce local stress. Ignoring boundary effects, the typical near-horizontal fractures corresponding to Case I resulted in more uniform stress variations, while the near-vertical fractures of Case II caused the 3D stress to exhibit a “√”-shaped distribution. For Case III the hydraulic fracture dip angle lies between that of Case II and Case I, and the magnitude of stress change also falls between the two. However, the variation in vertical stress remains relatively uniform, without distinct extreme points. It can be seen from this that the existence of fractures causes a redistribution of stress, and the stress shifts to both sides in the direction perpendicular to the fracture surface.
6. Conclusions
This study elucidates fracture propagation behavior under various stress conditions and delineates the impact of different fracture propagation patterns on stress field regulation. This research can provide enhanced guidance for adjusting the spatial distribution of stress fields through different hydraulic fractures in field fracturing operations and establish a theoretical foundation for optimizing hydraulic fracturing parameters. The findings indicate that the horizontal principal stress difference coefficient, K∑, significantly influences hydraulic fracture initiation and propagation. A larger Kh directs fracture propagation along the maximum horizontal principal stress, resulting in a penetrating main fracture. Conversely, a smaller Kh enhances the intermediate principal stress’s inhibition on lateral propagation, causing fracture migration towards areas with a high stress gradient. CT 3D reconstruction reveals an “S” shape distortion in such cases. To predict fracture initiation direction, a model based on maximum circumferential tensile stress theory was developed. The model’s predicted fracture initiation angles align with experimental results within a 10% error margin, confirming its predictive accuracy. Regarding fracture propagation, numerical simulations demonstrate that a stress concentration zone forms at the fracture tip, with stress in the σH direction increasing by 2–3 times. Substantial stress relief occurs on either side of the fracture, with the steepest stress gradient perpendicular to the fracture plane. This causes stress to redistribute laterally, forming asymmetric stress disturbance zones. Hydraulic fracture initiation and propagation in actual formations are influenced by factors including the geostress field, the rock’s mechanical properties, and the fracturing fluid injection rate. Future research will examine the mechanisms of fracture initiation and propagation and their interactions with stress field evolution.


