Article

Study on the Influence of Network Characteristics of Artificial Main Fractures and Natural Fractures on the Effectiveness of Acid Fracturing

State Key Laboratory of Oil & Gas Reservoir Geology and Exploitation, Southwest Petroleum University, Chengdu 610500, China
*
Author to whom correspondence should be addressed.
Processes 2025, 13(6), 1710; https://doi.org/10.3390/pr13061710
Submission received: 9 April 2025 / Revised: 17 May 2025 / Accepted: 19 May 2025 / Published: 30 May 2025
(This article belongs to the Section Chemical Processes and Systems)

Abstract

Carbonate reservoirs typically develop natural fractures, which significantly impact the effectiveness of acid fracturing processes. This study integrates the two-scale continuum model (TSC) and the embedded discrete fracture model (EDFM) to develop an acid fracturing simulation program for heterogeneous carbonate reservoirs using the open-source software FMOT. Key findings include the following. Under identical acid content conditions, the higher permeability of artificial main fractures results in longer wormholes. Natural fractures intersecting with the main fracture enhance local acid filtration and promote the formation of wormhole branches; the higher the fracture density, the more branches are formed within the wormholes. The higher the permeability of the main fracture, the less significant the influence of natural fractures on wormhole morphology. These results demonstrate that optimizing the permeability of artificial main fractures and effectively utilizing natural fracture networks can significantly enhance the effectiveness of acid fracturing.

1. Introduction

Acid fracturing [1,2], as an oil and gas production-enhancement technique, typically employs a pre-pad fluid to initiate fractures in the formation, followed by acid injection to etch the fracture walls, thereby enhancing production through the formation of high-conductivity etched fractures. However, the inherent heterogeneity of the formation [3], combined with low porosity and the coexistence of natural and induced fractures, poses significant challenges to the effectiveness of this process. Therefore, a systematic investigation of the influence of fracture parameters on this process is crucial for advancing this technology.
In recent years, researchers have developed various mathematical models to investigate the acid fracturing process in depth, focusing primarily on fracture network distribution, acid–rock reaction mechanisms, and fracture conductivity [4]. Hao et al. [5] investigated the initiation and propagation of acid fracturing using large-scale triaxial fracturing equipment, whereas Ugursal et al. [6] established a fracture network model that involves the intersection of a primary fracture with symmetrically distributed natural fractures. Wang et al. [7] developed a coupled model of fracture propagation and reservoir flow using embedded discrete fractures, while Chang et al. [8] proposed a computational strategy that combines embedded discrete fracture modeling with Newton iteration to solve the two-phase flow acid fracturing problem in random fractures. The transport of acid involves both convection–diffusion mechanisms and pressure-driven fluid loss, where the acid–rock reaction [9,10,11] and acid loss [12,13] jointly determine the effective penetration distance of the acid. The two-scale continuum model (TSC) proposed by Panga et al. [14] is widely used to describe dissolution dynamics, and Liu et al. [15] demonstrated through thermodynamic analysis that the reaction heat significantly influences the size of the etched fractures. Guo et al. [16] further quantified the effects of fracture permeability and roughness, observing that excessive fluid loss can reduce fracture length [17] and accelerate the acid–rock reaction [18]. Consequently, reducing fluid loss is particularly important. Currently, the most common method involves adding fluid loss control agents to the acid to increase its viscosity [18]. In this context, Schriefer et al. [19] employed fine salt instead of fine sand as a fluid loss control agent, and Zhang et al. [20] investigated the effects of the ceramic proppant size, dosage, and injection rate on acid loss. Ugursal et al. [21] further developed a leakage model based on porous media flow to calculate fluid loss during acid injection, incorporating both hydraulic and natural fractures into the reservoir model.
Fracture conductivity is primarily governed by the acid etching pattern. Broaddus et al. [22] established dependencies among acid–rock reaction time, temperature, and formation type, while Pournik et al. [23] experimentally confirmed the influence of etching patterns on fracture conductivity through mechanical experiments. Deng et al. [24] correlated conductivity with closure stress, and both Al-Momin [25] and Asadollahpour [26] demonstrated a positive relationship between initial roughness and conductivity through experimental and numerical simulations, respectively. The etched fracture surface [27] also plays a key role in determining fracture conductivity. Through surface characterization studies, Ruffet et al. [28] and Malagon et al. [27] further emphasized the critical role of fracture topography in conductivity, while Liu et al. [29] proposed using etched surface analysis to evaluate the acid retardation effect.
Although existing research has greatly improved our understanding of acid fracturing, most numerical models still rely on two-dimensional methods and cannot accurately reflect the impact of artificial main fractures’ permeability and natural fracture networks in carbonate reservoirs on the effectiveness of acid fracturing. To overcome this limitation, we developed a three-dimensional numerical simulation program for acid fracturing based on TSC and EDFM models, aiming to systematically elucidate the intrinsic mechanisms of the influence of fracture permeability and natural fracture density on the acid fracturing process.

2. Mathematical Models

In the case we studied, traditional acid (HCl) fracturing was used. The method for the acid–rock reaction process adopts the two-scalar continuous model (TSC) [14]. Further, the material exchange between fracture and matrix uses the embedded discrete fracture network model (EDFM) [8,30]. Note that the subscripts m and f represent physical quantities belongs to matrix (m) and fracture (f), respectively. In summary, the control equation system used in this paper is as follows:
(1)
Pressure equation of acid fracturing The acid used in the acid fracturing process is assumed to be an incompressible fluid. Thus, the pressure equation for the matrix and fracture can be expressed [8,30]:
· ( K m μ m P m ) + ψ m f V p = Q m
· ( K f μ f P f ) + ψ f m V p = Q f
where K m and K f are the permeabilities of matrix and fracture ( m 2 ), respectively. μ m and μ f are the viscosity of liquid in the matrix and the fracture (Pa · s), respectively. ψ is the core function of the EDFM model, and specific calculation method can be found in Lee’s paper [31]. P m and P m are the pressure field of the matrix and the fracture to be solved (Pa), respectively.
(2)
Velocity equation of acid fracturing
Based on Darcy’s law and EDFM model, the liquid velocity of matrix and fracture are as follows [8,14,30]:
U m = K m μ m P m
U f = K f μ f P f
where U m and U f are the velocity of the matrix and the fracture (m/s), respectively.
(3)
Acid concentration equation ( H + ) of acid fracturing
Based on the TSC and EDFM model, we can derive the H + transport equation containing the material exchange between the matrix and the fracture [8,30]:
ϕ m C f , m t + · ( U m C f , m ) + ψ m f V p C f , m u p = · ( ϕ m D e , m · C f , m ) R ( C s , m ) a v , m
ϕ f C f , f t + · ( U f C f , f ) + ( ψ f m + ψ f f ) V p C f , f u p = · ( ϕ f D e , f · C f , f ) R ( C s , f ) a v , f
where ϕ m and ϕ f are the porosity of the matrix and the fracture, respectively. C f , m and C f , f the mass concentration of acid ( H + ) of the matrix and the fracture (kmol/ m 3 ), respectively. R ( C s , m ) and R ( C s , f ) are the effective dispersion tensor of the matrix and the fracture (kmol/(s · m 3 )), respectively. a v , m and a v , m are the rock interfacial areas of the matrix and the fracture ( m 2 / m 3 ).
(4)
Chemical reaction process of the self-diverting acid and rock:
We mainly discuss the acid fracturing process in carbonate reservoirs. The acid–rock reaction process is mainly the chemical reaction between H + and CaCO 3 :
2 H + + CaCO 3 ( s ) r s Ca 2 + + H 2 O + CO 2 ( g )
where r s represents the acid fracturing reaction rate. Base on Equation (4), the chemical reaction terms of Equation (3) can be expressed as follows:
R ( C s ) = k c k s k c + k s C f k s = 0.015 e x p ( 55.8201 / R ) C f 1.1997 k c = S h + 0.7 m 1 / 2 Re p 1 / 2 S c 1 / 3 D m 2 r p
where k c is the mass transfer coefficient (m/s), k s is the reaction rate constant, R is the gas constant, S h is the, m is the asymptotic Sherwood number, R e p is the ratio of the pore length to pore diameter, S c is the pore Reynolds number, and r p is the average pore radius (m).
(5)
Rock quantity updating:
Based on the TSC model, the acid–rock reaction process can change the pore quantity of rock (matrix and fracture). The updated calculation formula is as follows [14]:
ϕ M t = R ( C s , M ) a v , M α c ρ s
ϕ F t = R ( C s , F ) a v , F α c ρ s
where a c is the dissolving power of the acid. The updated calculation formula for the quantity at the poro-scale is [14]:
K i K 0 = ϕ i ϕ 0 ϕ i ( 1 ϕ 0 ) ϕ 0 ( 1 ϕ i ) 2 β
r p i r p , 0 = K i ϕ 0 K 0 ϕ i
a v i a v , 0 = ϕ i r p , 0 ϕ 0 r p , 0
D L e = α o s D e + 2 λ L U r p ϕ D T e = α o s D e + 2 λ T U r p ϕ
where the superscript i represents the quantity after reaction, and the subscript 0 represents the initial quantity at the beginning of the simulation. Further, D e represents the H + diffusion coefficient (m/s), and the subscripts L and T represent the x and y directions, respectively. λ L and λ T are 0.5 and 0.25 in this paper, which are related to the pore characteristics [14].

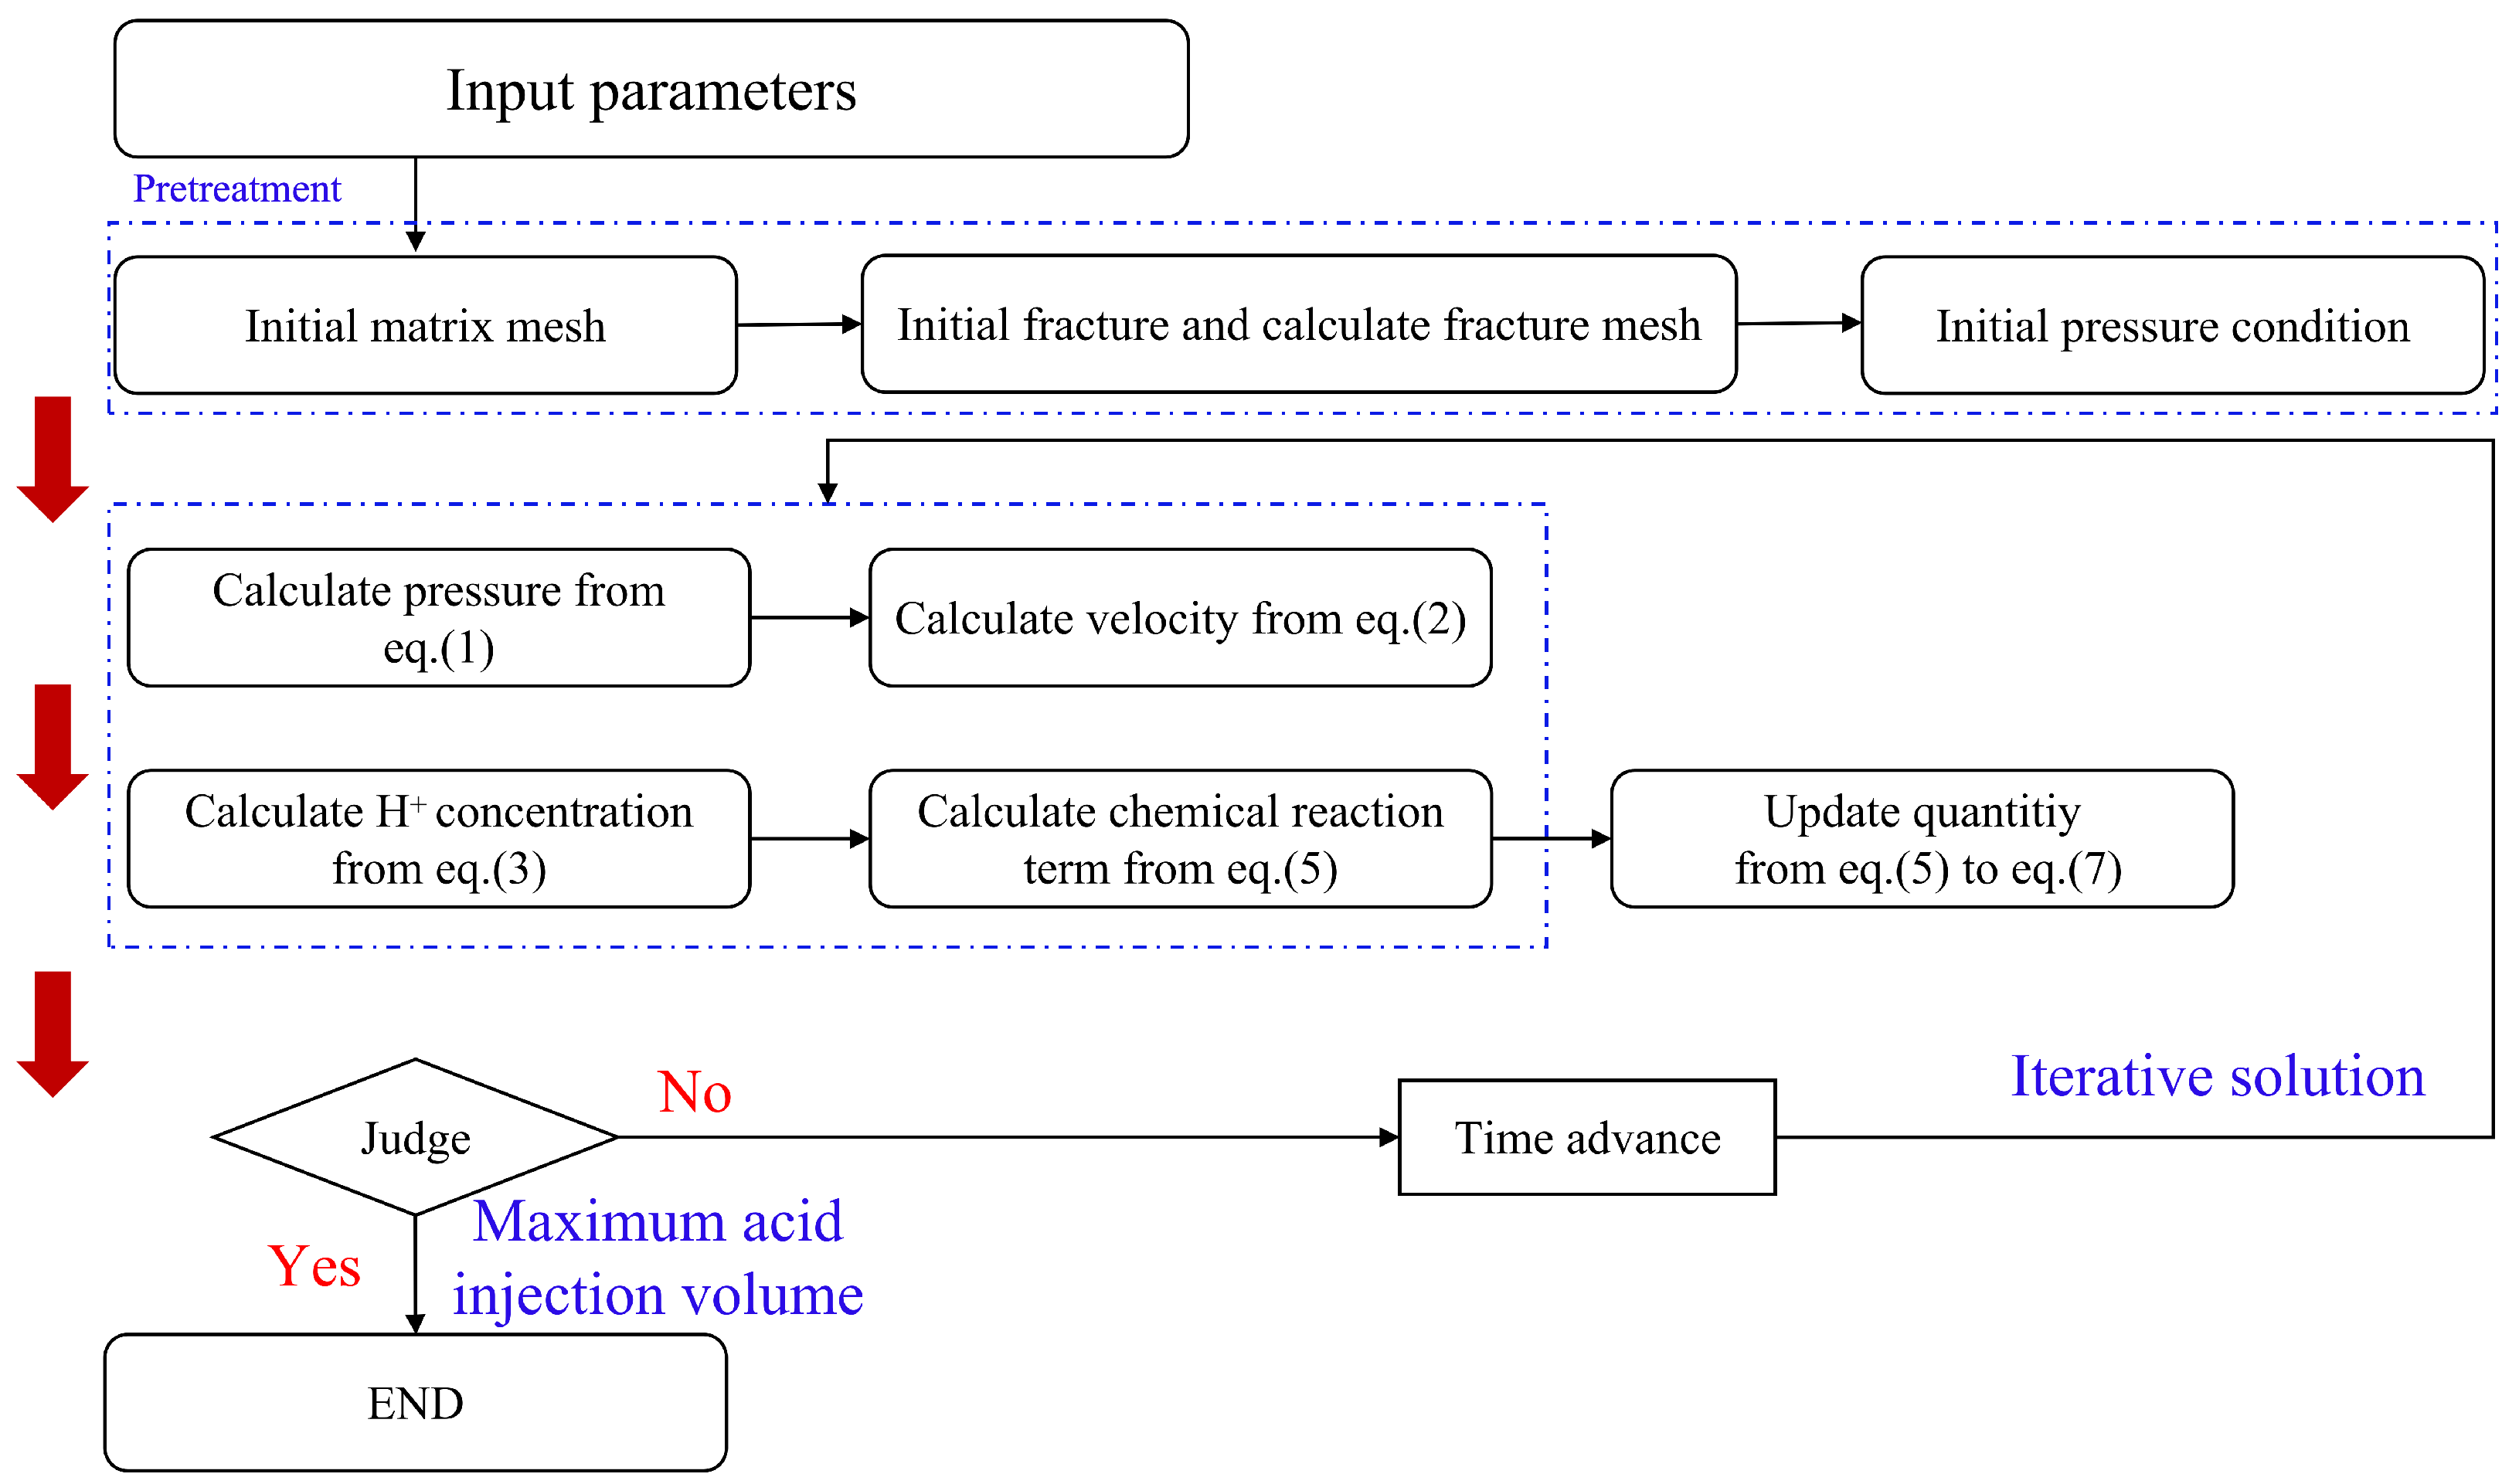
3. Numerical Methods

In this section, the discretization method and calculation strategy will be introduced. We use the FVM method to solve Equations (1)–(7) and have implemented the above equation in FMOT [8,30].

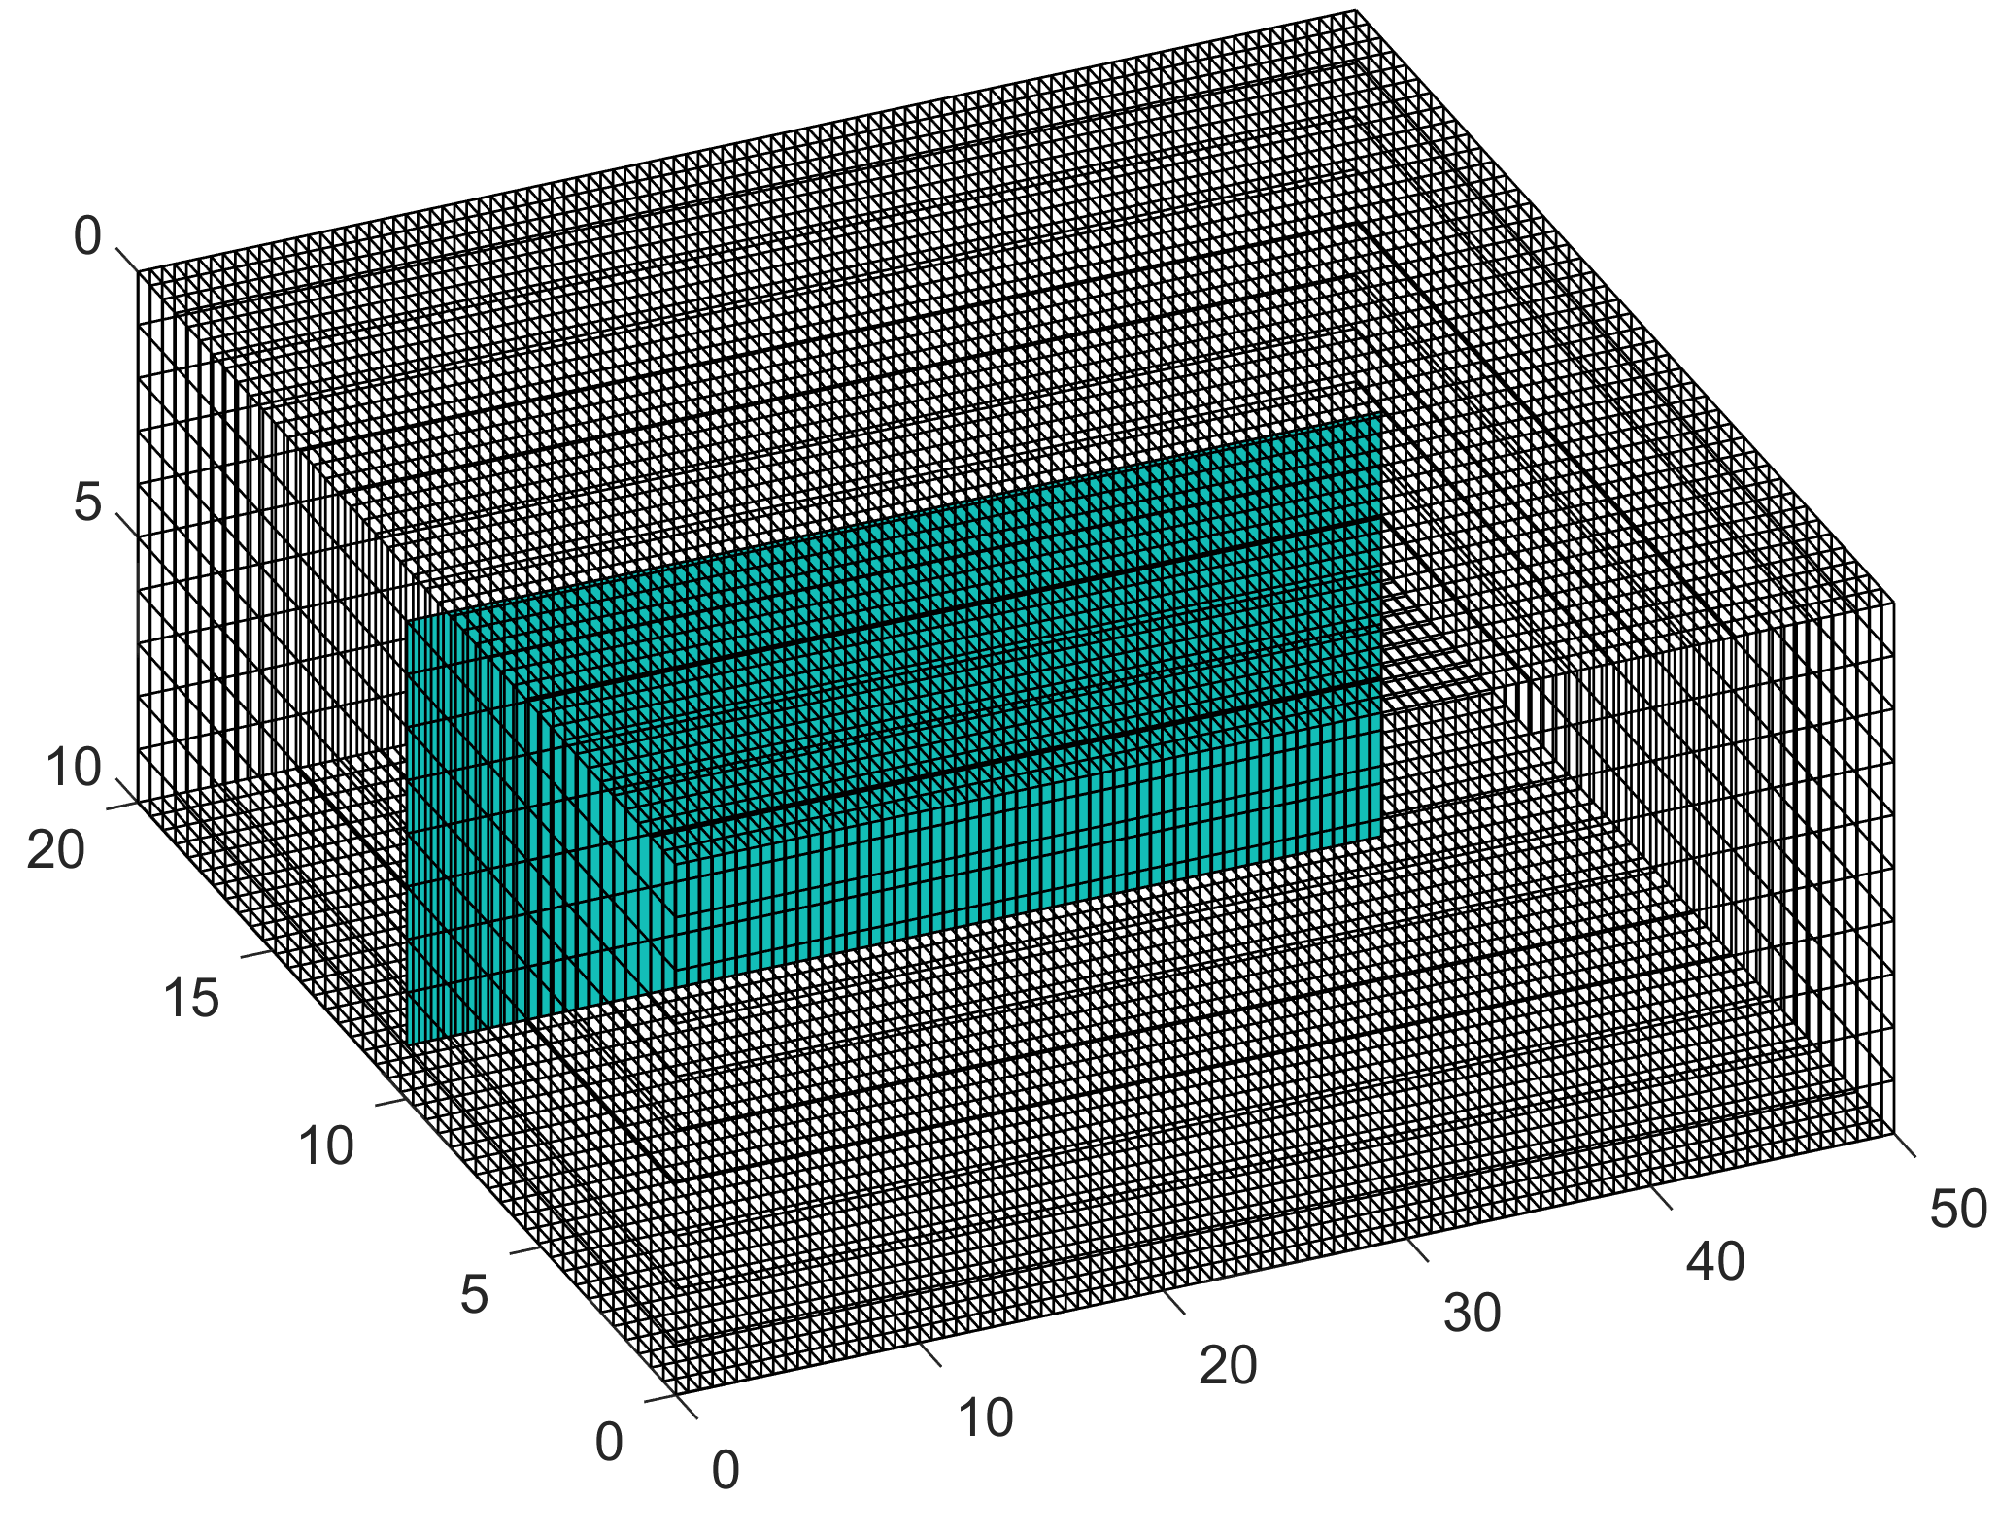
3.1. Discretization Method

In this paper, the discrete scheme of the temporal term, convective term, and Laplacian term are backward Euler, first-order upwind, and center difference, respectively. Based on the discrete scheme, the algebraic form of each equation can be derived:
(1)
Pressure Equation
A P P P , m + A N P N , m + A ψ , f P ψ , f = S u A P = f f a c e s K m , f μ m | S f | | d | + C I K m μ m A N = f f a c e s K m , f μ m | S f | | d | A ψ , f = C I K m , f μ m S u = V p Q M
A P P P , f + A N P N , f + A ψ , m P ψ , m + A f P f = S u A P = f f a c e s K f , f μ f | S f | | d | + C I K m μ m + T f A N = f f a c e s K f , f μ f | S f | | d | A ψ , m = C I K m , f μ m A f = T f S u = V p Q F
(2)
Acid concentration equation ( H + ):
A P C f , P , m t + Δ t + A N C f , N , m t + Δ t + A u p C f , P , m u p , t + Δ t + A ψ u p C f , ψ u p , t + Δ t = S u A P = V p ϕ m t + Δ t f f a c e s ϕ M , f t D e , M , f t | S f | | d | A N = Δ t f f a c e s ϕ M , f t D e , M , f t | S f | | d | A u p = Δ t f f a c e s F f t A ψ u p = Δ t ψ m f t S u = V p ϕ m t C f , P , m t + V p Δ t a v , m t k c t k s t k c t + k s t C f , P , m t
A P C f , P , f t + Δ t + A N C f , N , f t + Δ t + A u p C f , P , f u p , t + Δ t + A ψ u p C f , ψ u p , t + Δ t + A F C f , f = S u A P = V p ϕ f t + Δ t f f a c e s ϕ F , f t D e , F , f t | S f | | d | + Δ t ψ F F t A N = Δ t f f a c e s ϕ F , f t D e , F , f t | S f | | d | A u p = Δ t f f a c e s F f t A ψ u p = Δ t ψ f m t A F = Δ t ψ f f t S u = V p ϕ f t C f , P , f t + V p Δ t a v , f t k c t k s t k c t + k s t C f , P , f t

3.2. Computational Methods and Simulation Parameters

Based on the TSC and EDFM model, the specific solution process is as follows: (1) initialize and read calculation parameters; (2) initialize matrix mesh; (3) initialize fracture and calculate the fracture mesh based on the matrix mesh; (4) initialize the pressure condition; (5) calculate the pressure field of the matrix and the fracture; (6) calculate the velocity field of the matrix and the fracture; (7) calculate the H + concentration field of the matrix and the fracture; (8) calculate the chemical reaction term; (9) update the quantity; (10) judge whether the maximum acid injection volume has been reached; (11) end. The calculation process is shown in Figure 1, and the chemical parameters and boundary conditions involved in this paper are shown in Table 1.

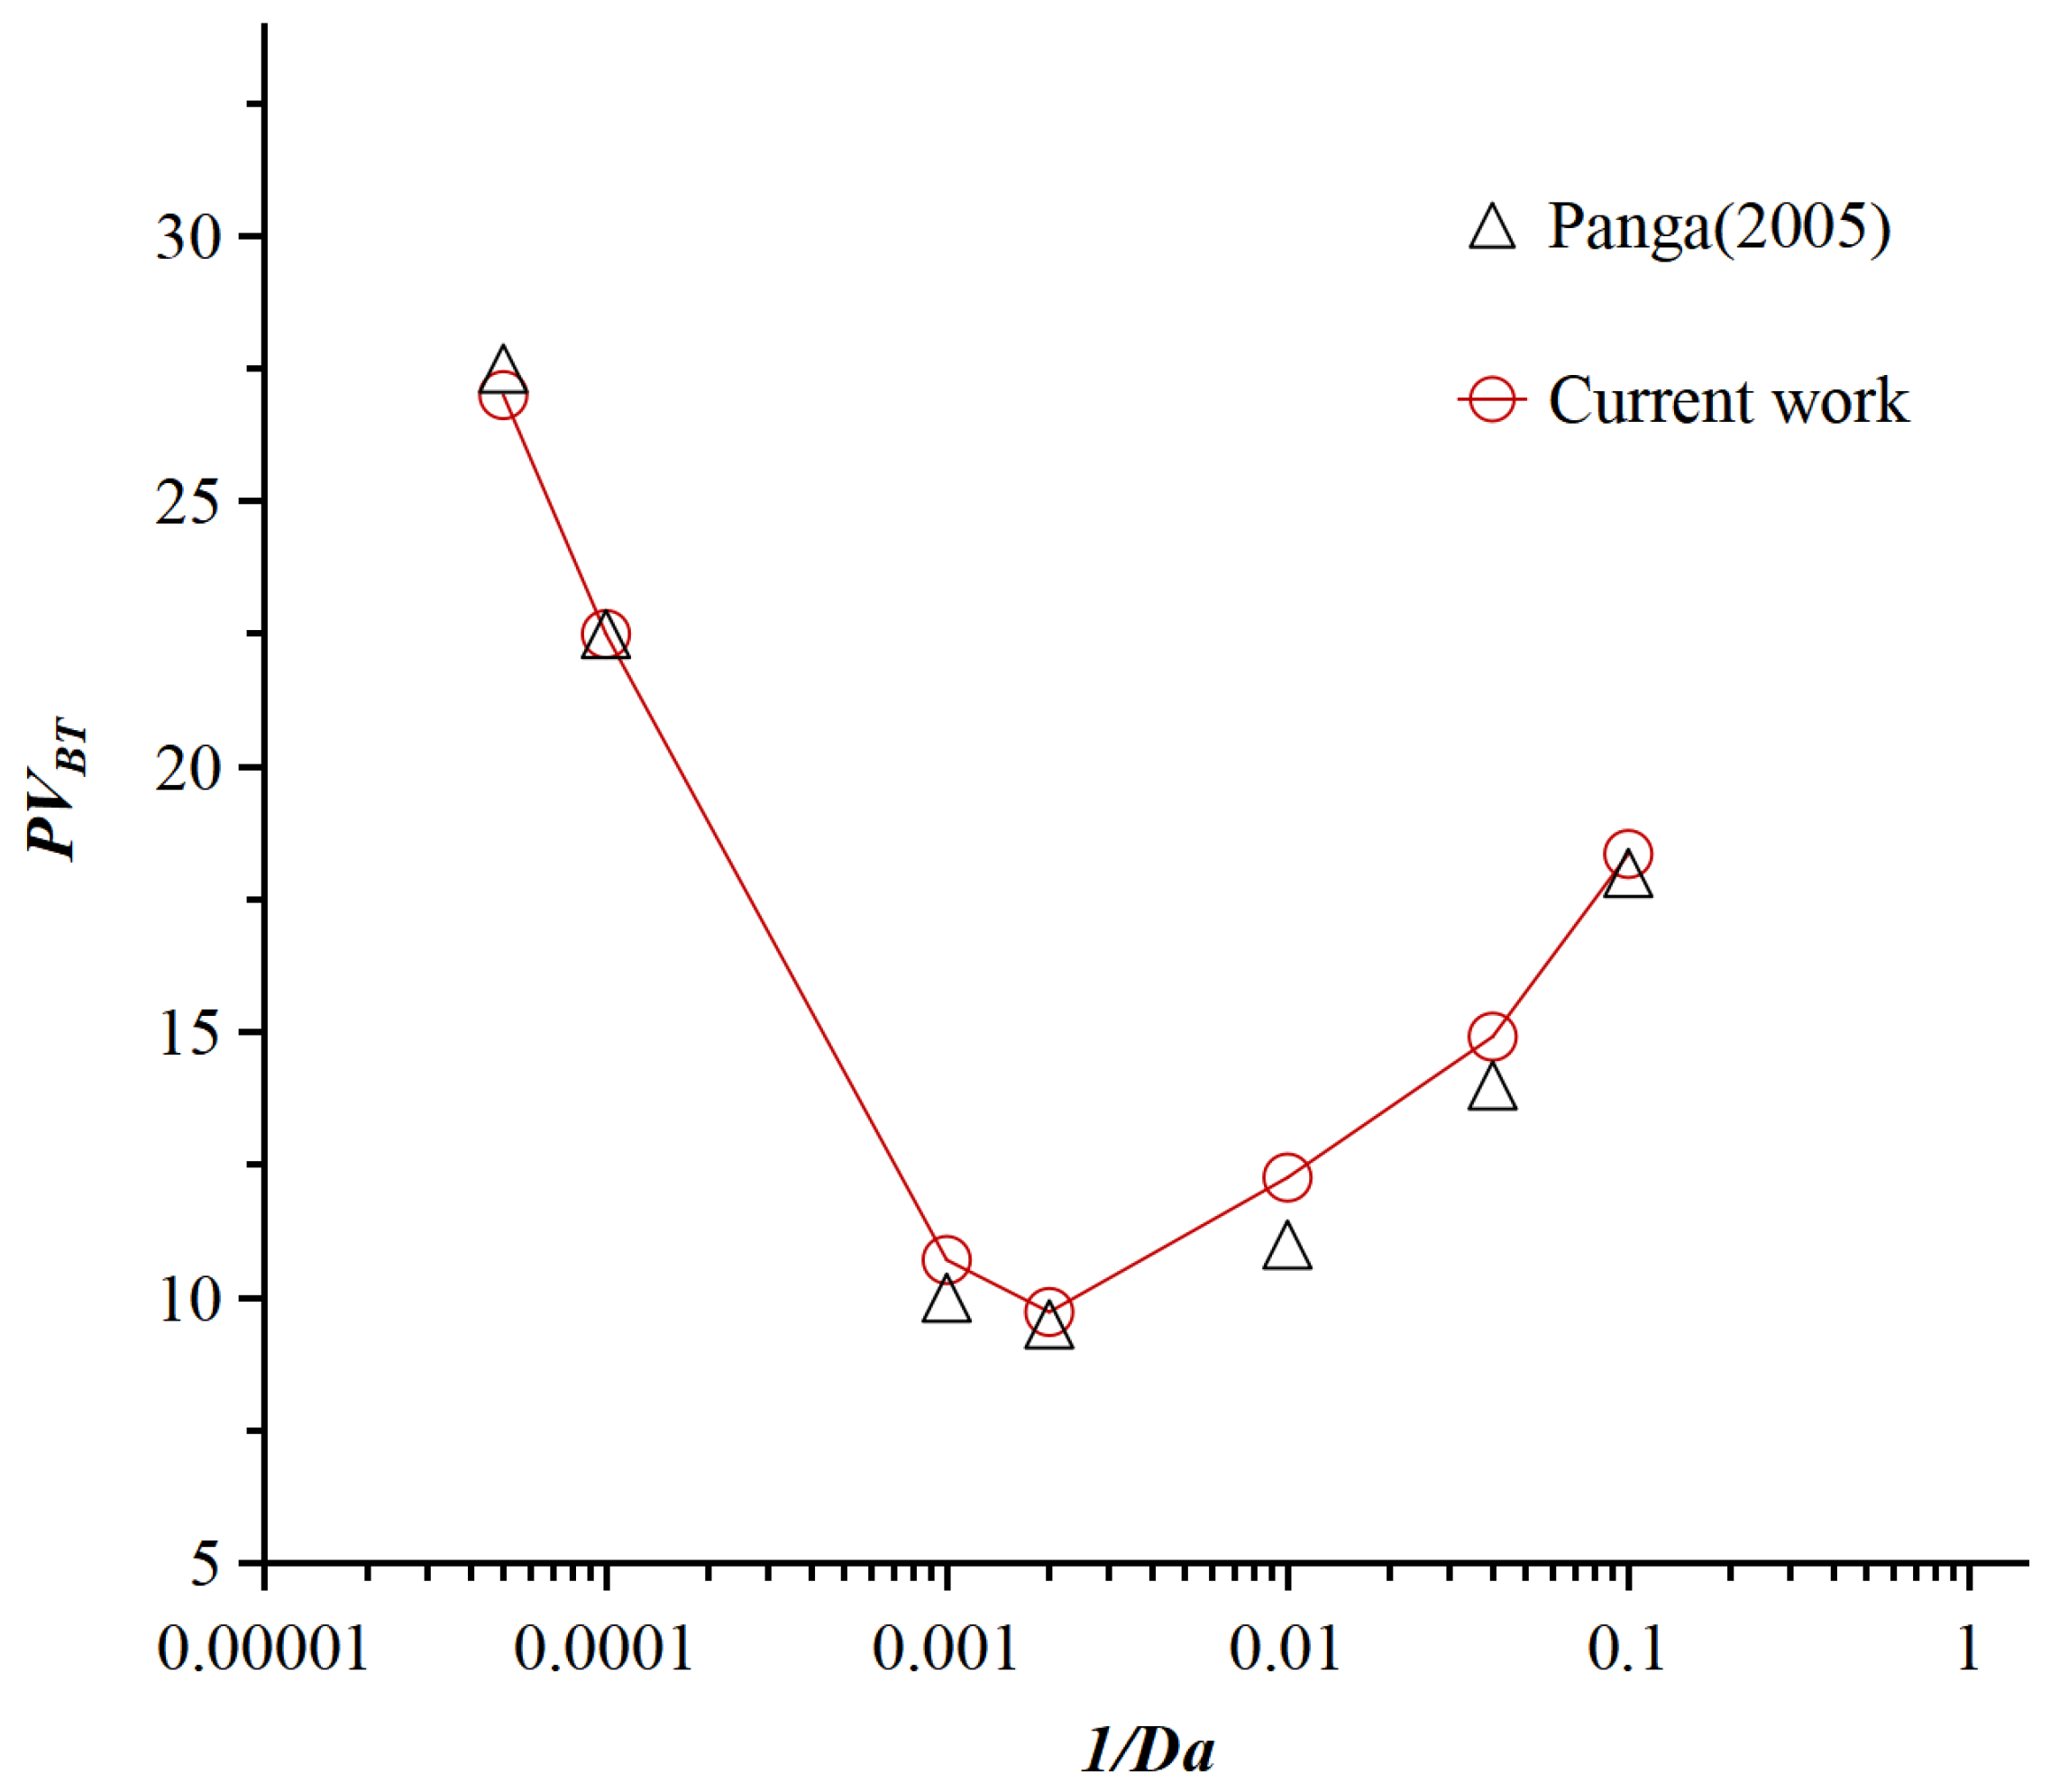
3.3. Model Validation

In this section, the computational results of the proposed model are compared with those of the dual-scale continuum model developed by Panga et al. [14]. To ensure the validity of the comparison, the same parameter settings as those used in the original model were adopted in this study. These parameters include a 2D matrix domain with a length of 0.05 m and a width of 0.02 m, along with an acid reaction rate of 0.2 cm/s. As shown in Figure 2, varying the acid injection rate leads to the formation of different wormhole morphologies, including face dissolution, conical dissolution, wormholes, ramified dissolution, and uniform dissolution. As further illustrated in Figure 3, the optimal injection rates predicted by the present model are in good agreement with the results from Panga et al., although slight discrepancies are observed at certain data points. The overall trend, however, remains consistent. The minor deviations may be attributed to pore-scale variations within the porosity range of [0.05, 0.35], which differ from the pore structure assumed in the original model. Such differences suggest that while the general behavior is well captured, local pore structure heterogeneity can influence the quantitative outcomes.

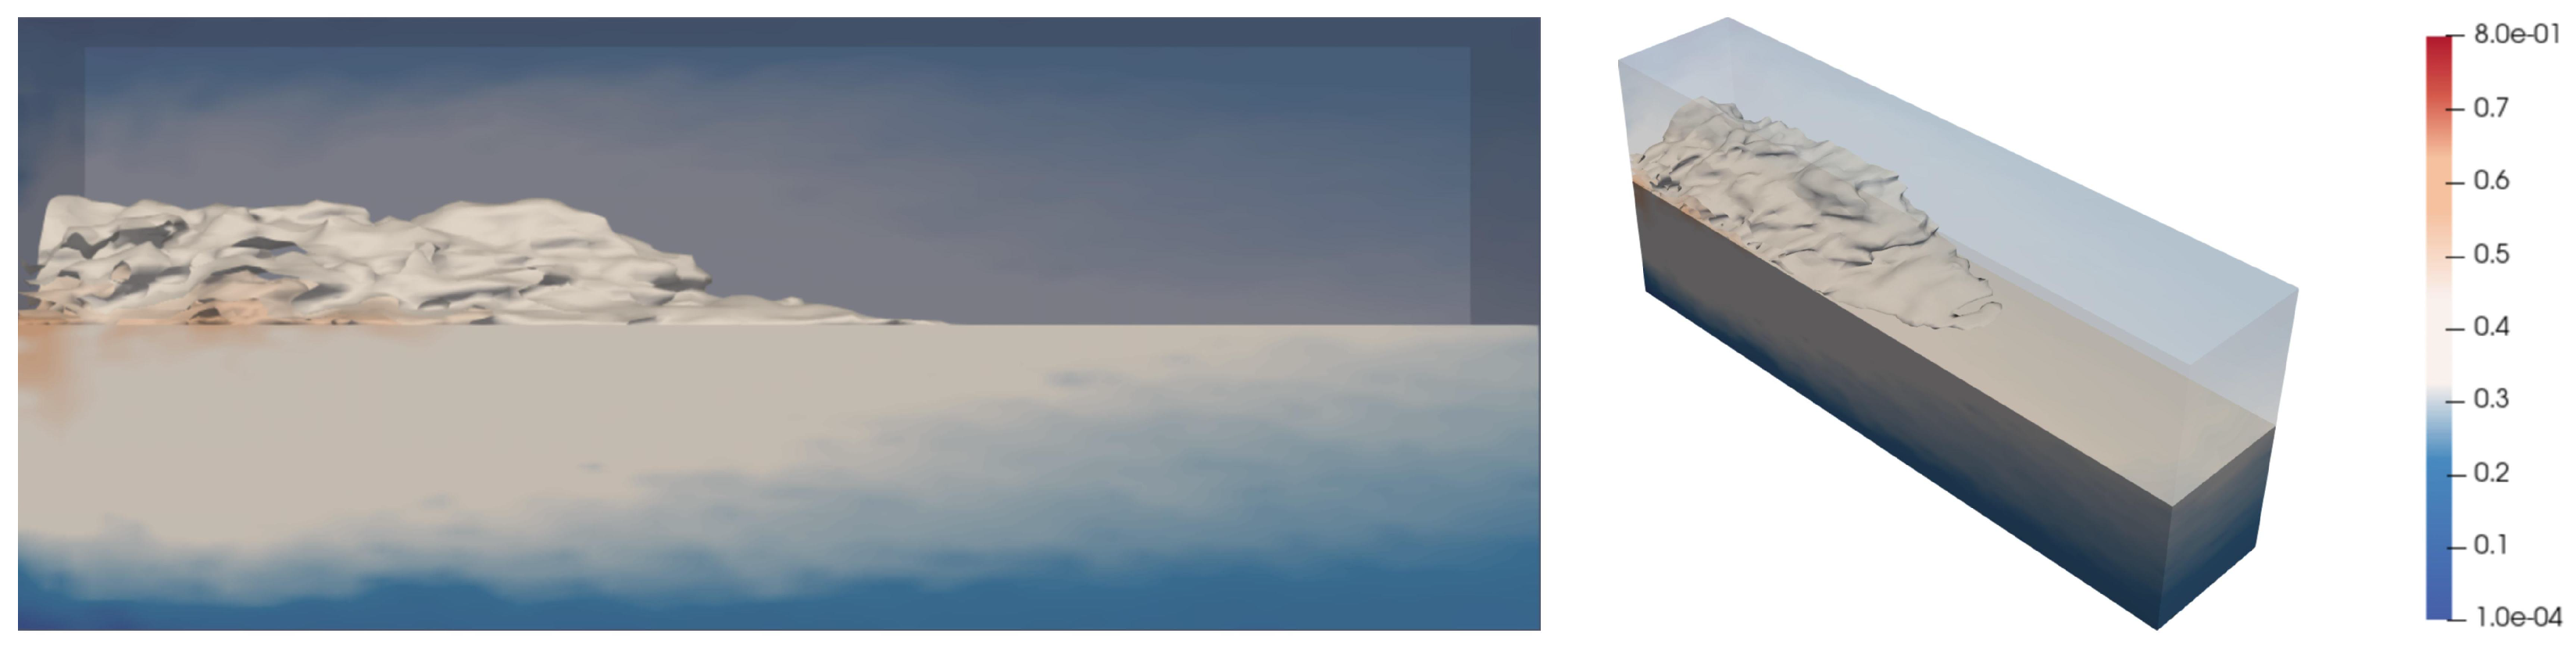
4. Results and Analysis

This section is based on the engineering practice of acid fracturing in fractured carbonate reservoirs. Based on the model proposed in Section 2, we discuss the influence of different development of natural fractures in carbonate reservoirs on the effectiveness of acidification construction.
Figure 4 shows the three-dimensional artificial main fracture model and the permeability distribution used in this section. The artificial main fracture length is 40 m, the fracture height is 10 m, and the main fracture width is the equivalent value of permeability. The equivalent calculation formula is as follows:
W f = 12 K f
Figure 5 shows the permeability distribution. It is calculated from the porosity distribution using the Carman Kozeny relationship, and the calculation formula is [32,33]:
K = 1 72 τ ϕ 3 d p 2 ( 1 ϕ ) 2 .

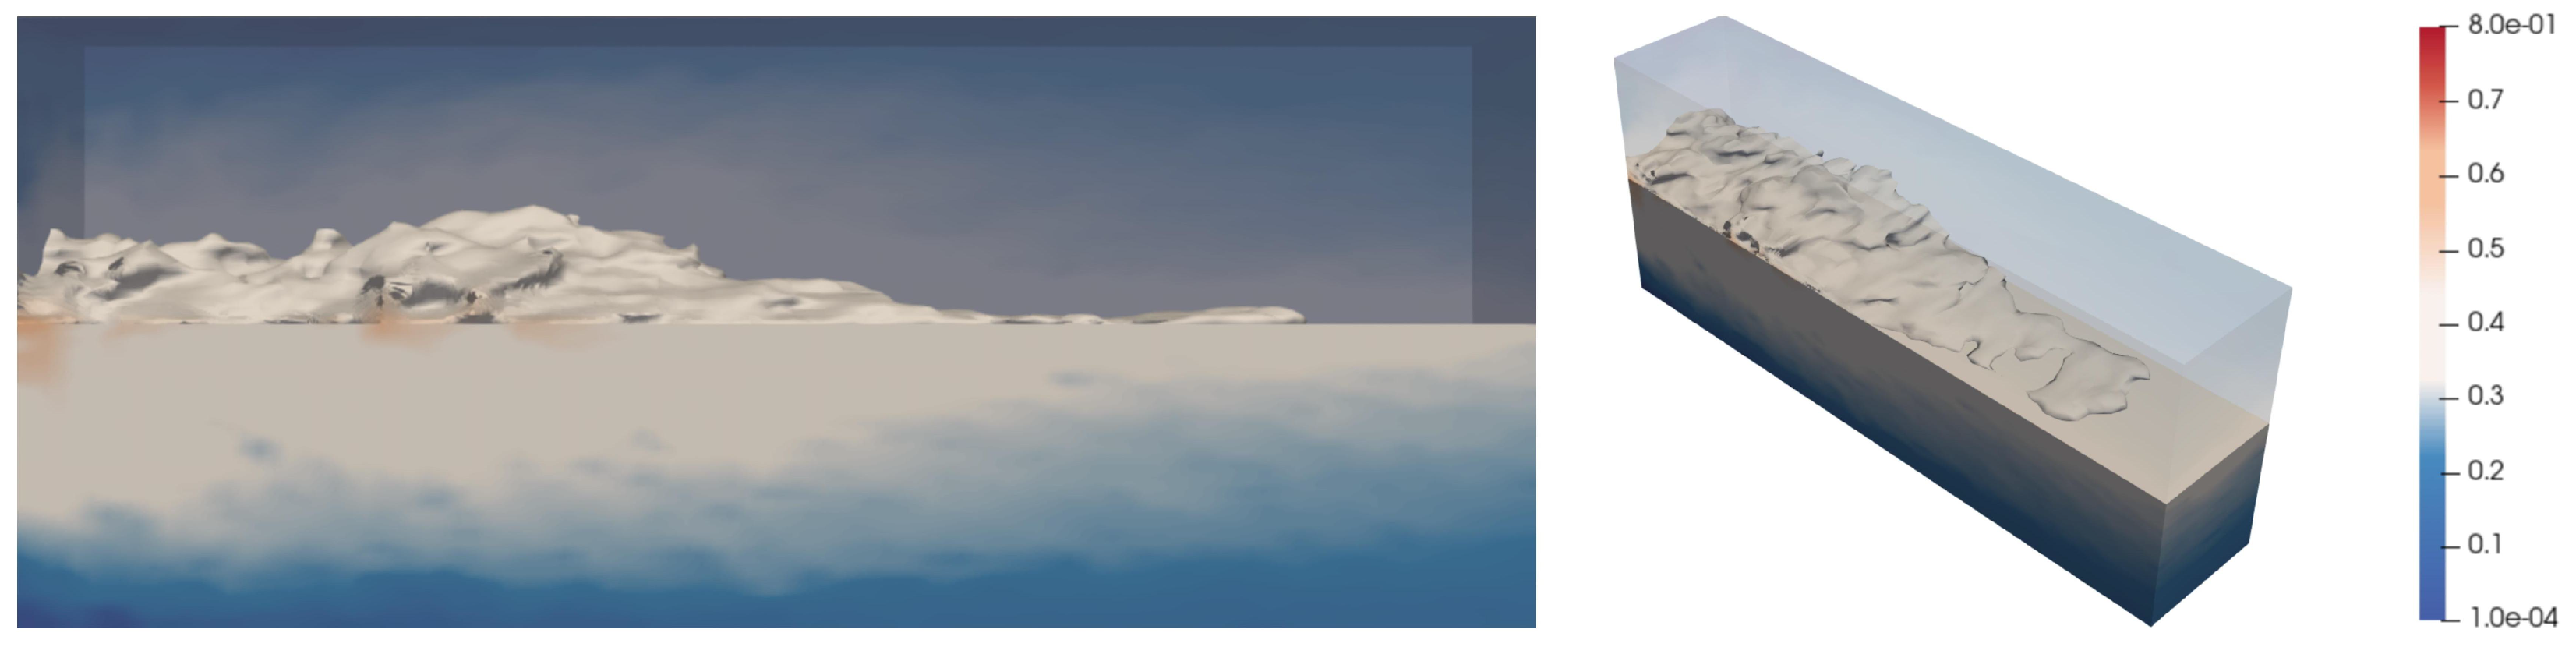
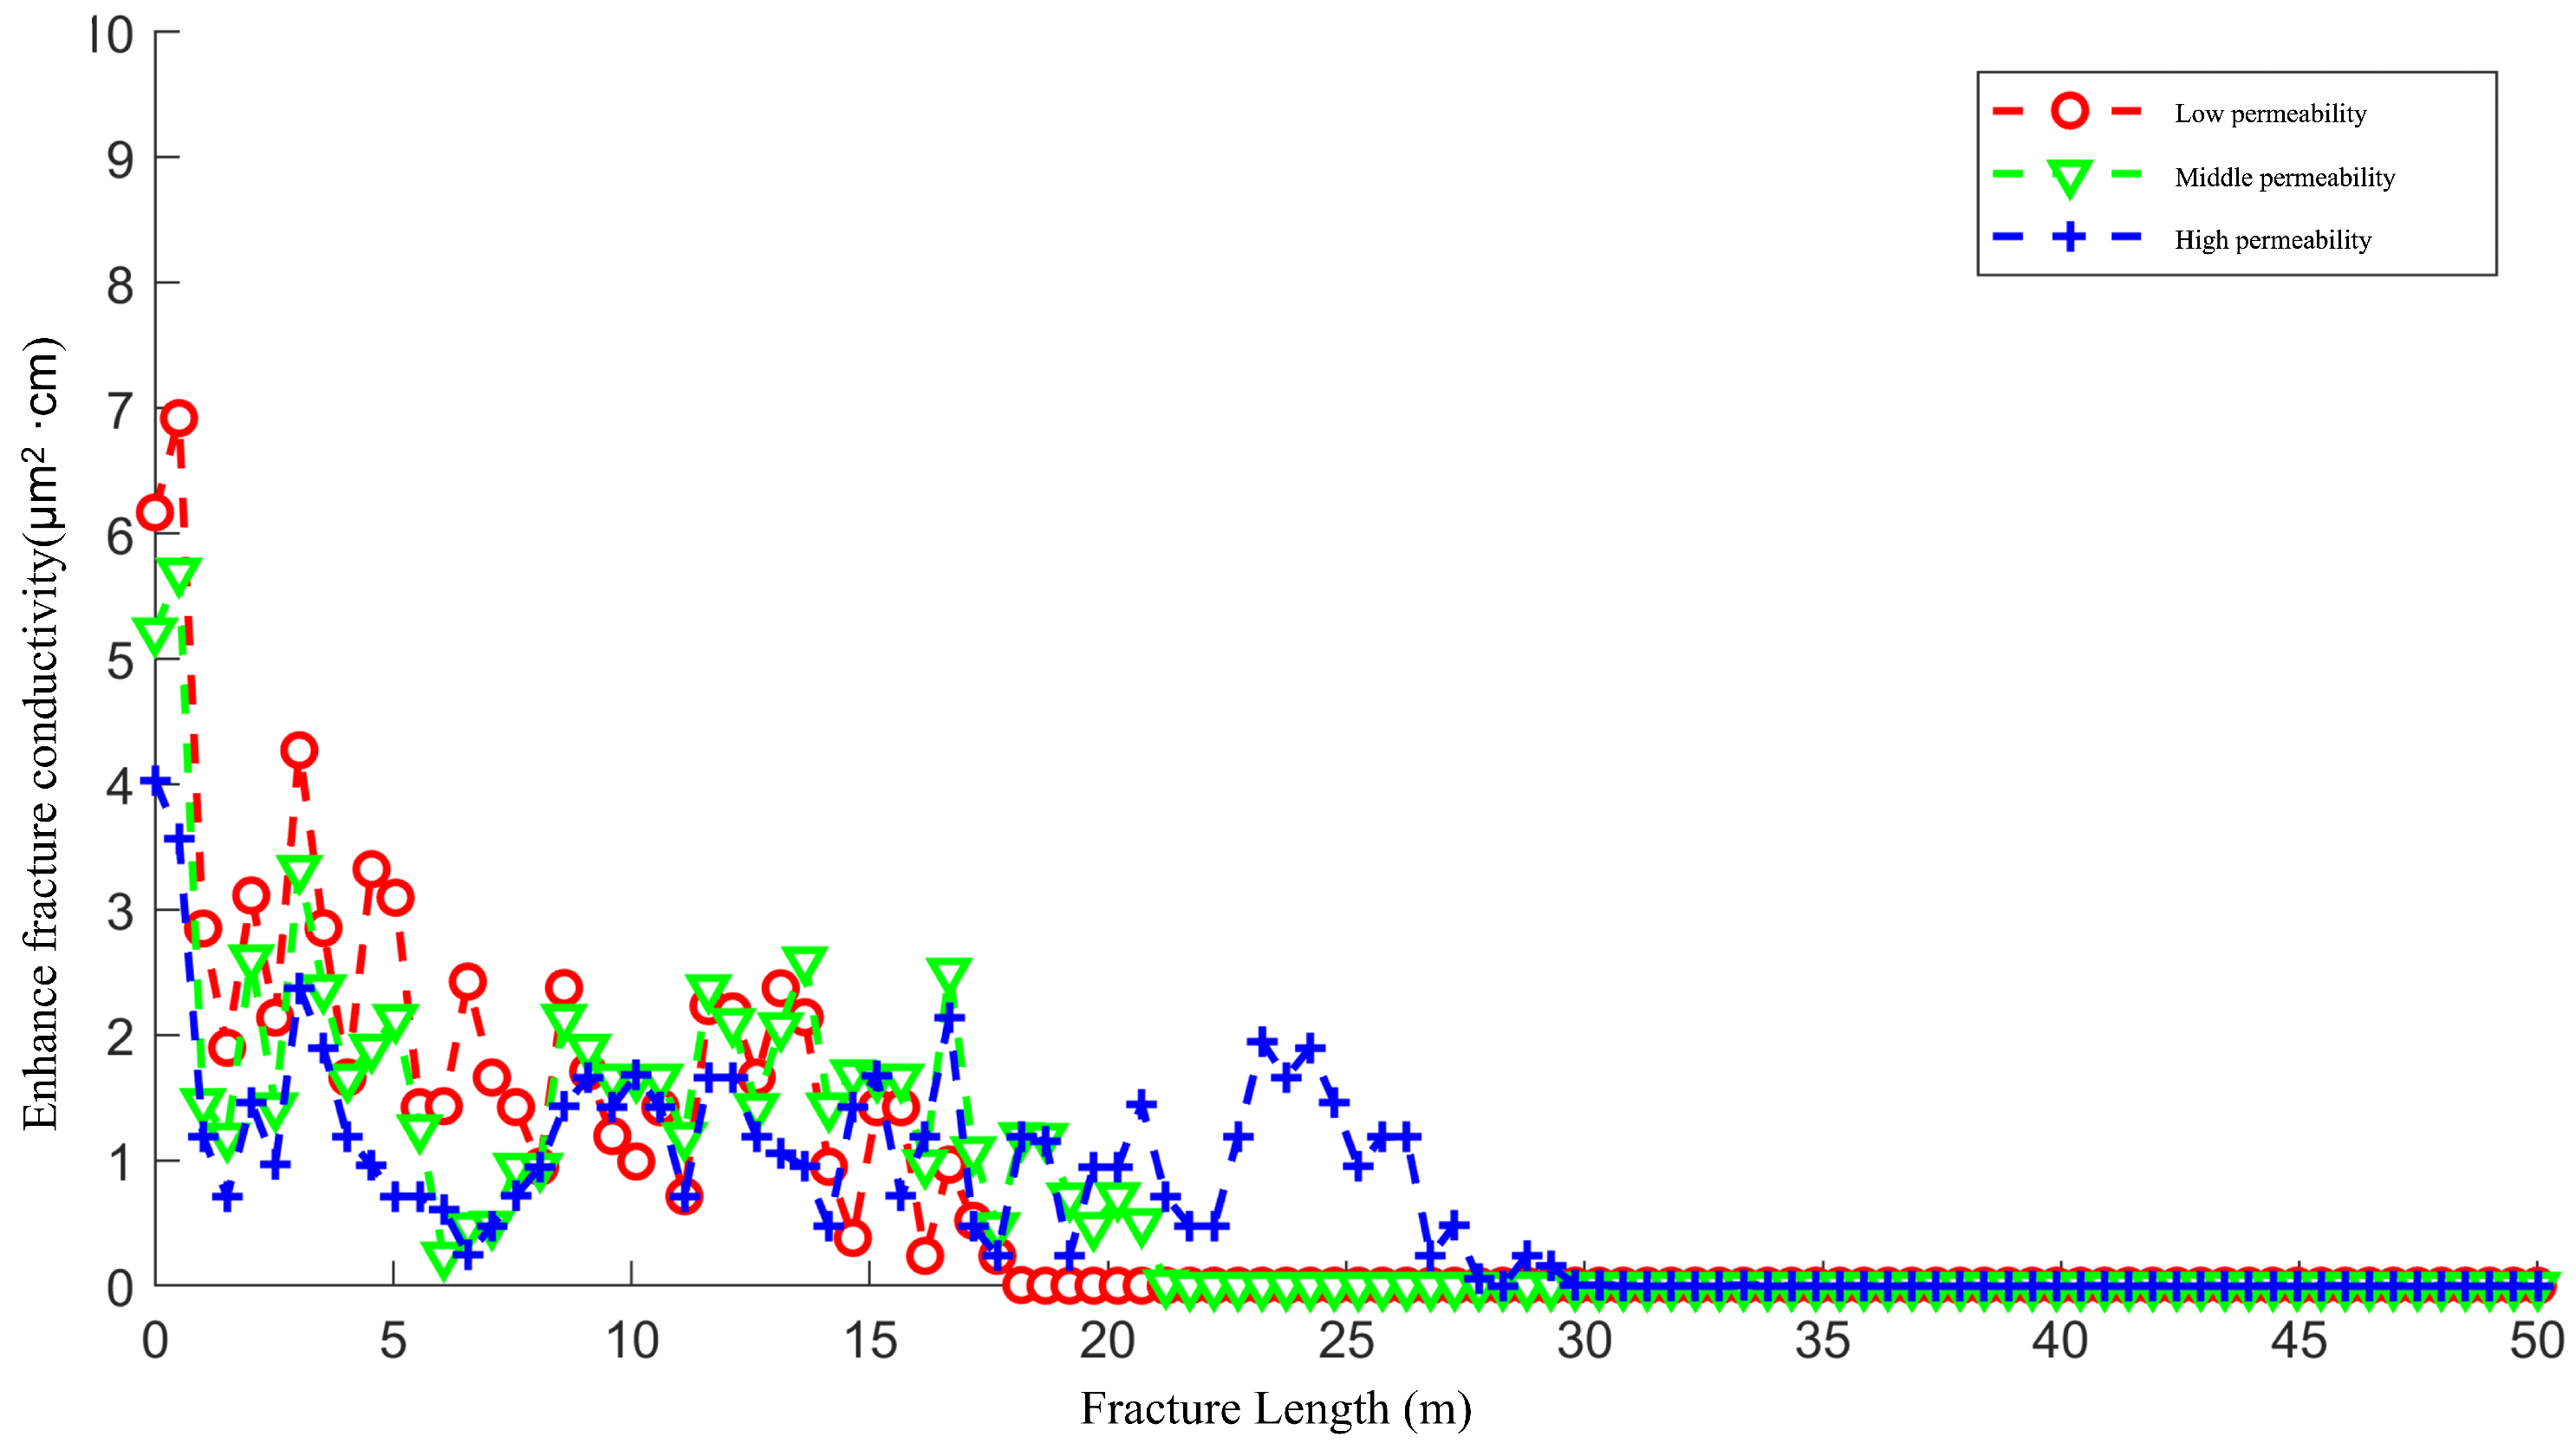
4.1. The Effect of the Permeability of Artificial Main Fractures on the Acid Fracturing Effect

Different geological formations and construction techniques can produce fractures with different closure conditions. Therefore, based on the permeability of artificial main fractures, they are divided into three types: high, medium, and low permeability. The injection rate of acid is 1 m 3 /min, and the pumping time is 1 h. The parameters of each case used in this section are shown in Table 2.
The acid flows along the main fracture toward the deeper part of the reservoir, and is filtered out towards the inner side of the matrix through the fracture wall. This filtered acid also increases the rock porosity. Therefore, the area where the permeability is increased by more than 0.2 is extracted as wormholes for acidification, as shown in Figure 6.
The wormhole formed by the acid is guided by the main fracture, and the wormhole formed extends forward along it. The lower the permeability of the main fracture, the higher the flow resistance of the acid within it, resulting in shorter wormholes formed along. In Case 1, a lower acid flow rate provides more reaction time, resulting in a wider wormhole width than Case 2 and Case 3, and the development of short wormhole branches. As the permeability of the main fracture increases, the wormholes obtained in Case 2 and Case 3 become flatter.
Figure 7, Figure 8 and Figure 9 present the scope of the acid impact (concentration ratio). In Case 1, where the permeability of the main fracture is 5D, the acid encounters significant flow resistance within the fracture. As a result, the acid filtration trend toward both sides of the fracture becomes more prominent. Notably, near the wellbore, significant acid accumulation occurs, as depicted in Figure 7. In Case 2, with the main-fracture permeability being 10D, the flow resistance inside the fracture decreases. This creates a more favorable flow path for the fracture compared to the matrix. Consequently, the acid-filtration trend toward both sides of the fracture is attenuated, as shown in Figure 8. For Case 3, when the permeability of the main fracture reaches 20D, as the flow resistance inside the fracture further diminishes, the acid distribution along the fracture becomes more uniform, and the acid accumulation near the wellbore is significantly reduced, as illustrated in Figure 9.
Figure 10 demonstrates the enhanced fracture conductivity of the three main fractures after acid fracturing. The fracture conductivity of these fractures exhibits a gradually decreasing trend from the wellbore to the fracture tips. However, the decreasing patterns vary significantly among them. For the low-permeability main fractures, due to the accumulation of acid, the fracture conductivity near the wellbore is enhanced most significantly. Subsequently, it drops sharply, and the magnitude of the drop is relatively large. As the permeability of the main fractures increases, the phenomenon of acid accumulation near the wellbore gradually weakens. The difference in fracture conductivity between the area near the wellbore and other positions of the fracture also decreases accordingly, and the magnitude of the fluctuation in fracture conductivity reduces. It can be observed that the fracture conductivity curve of the main fractures with high permeability tends to be smooth.

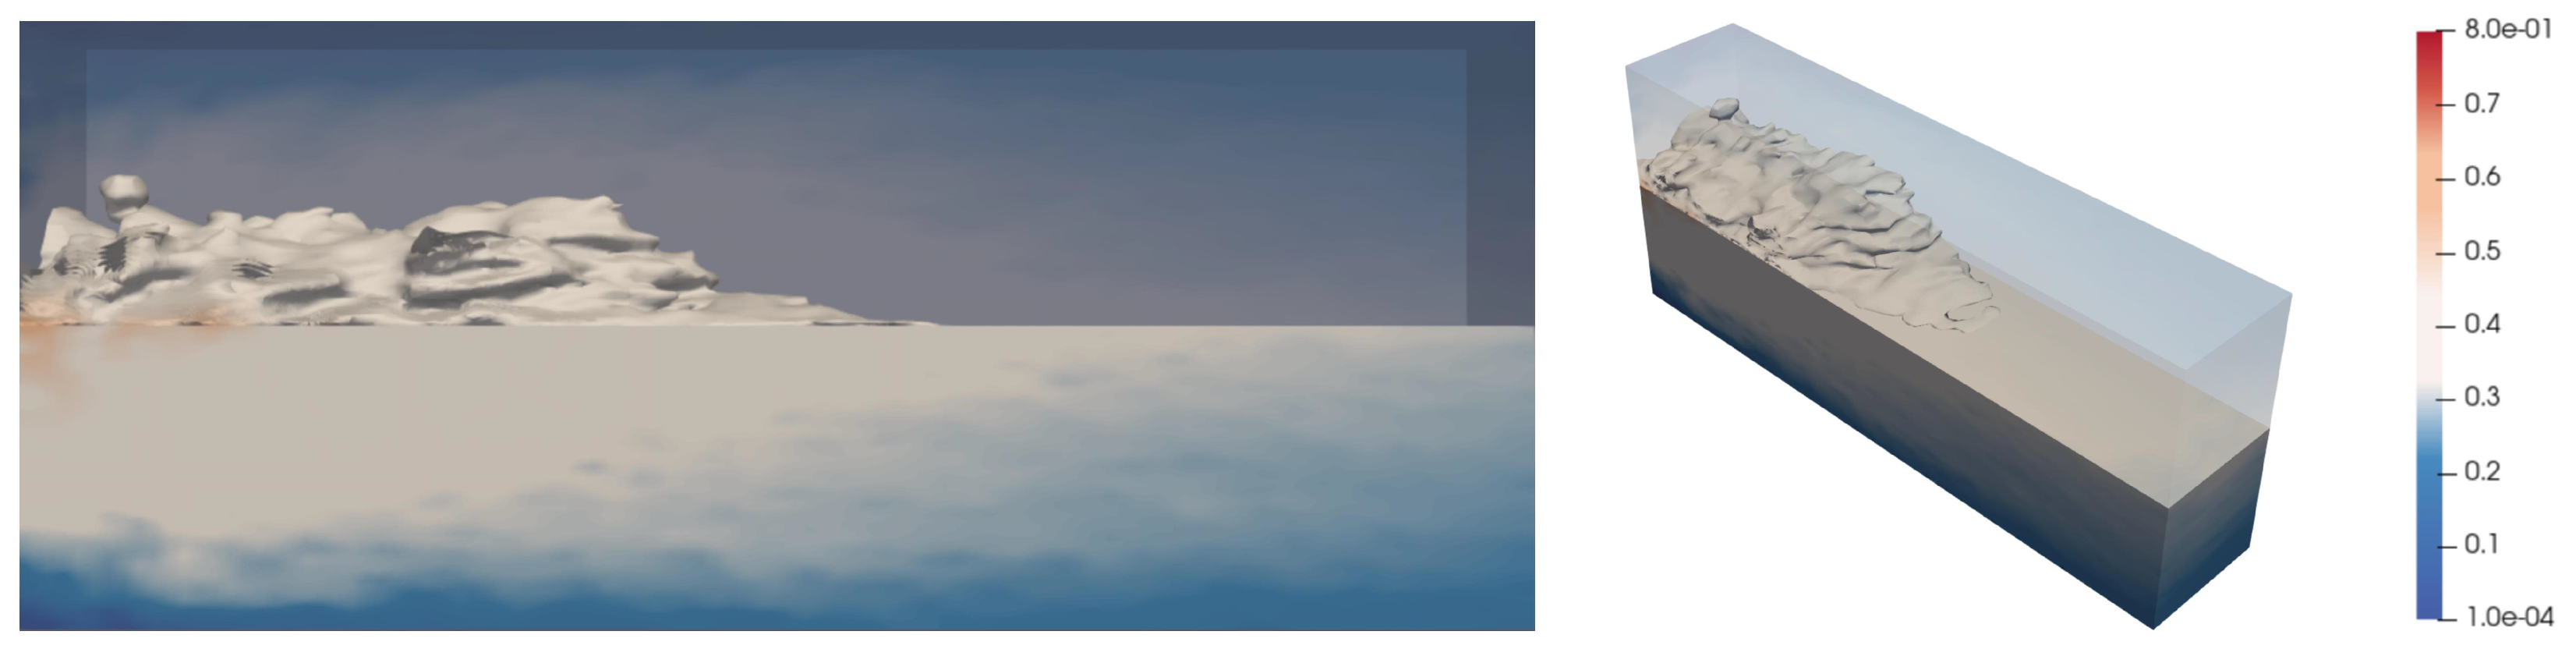
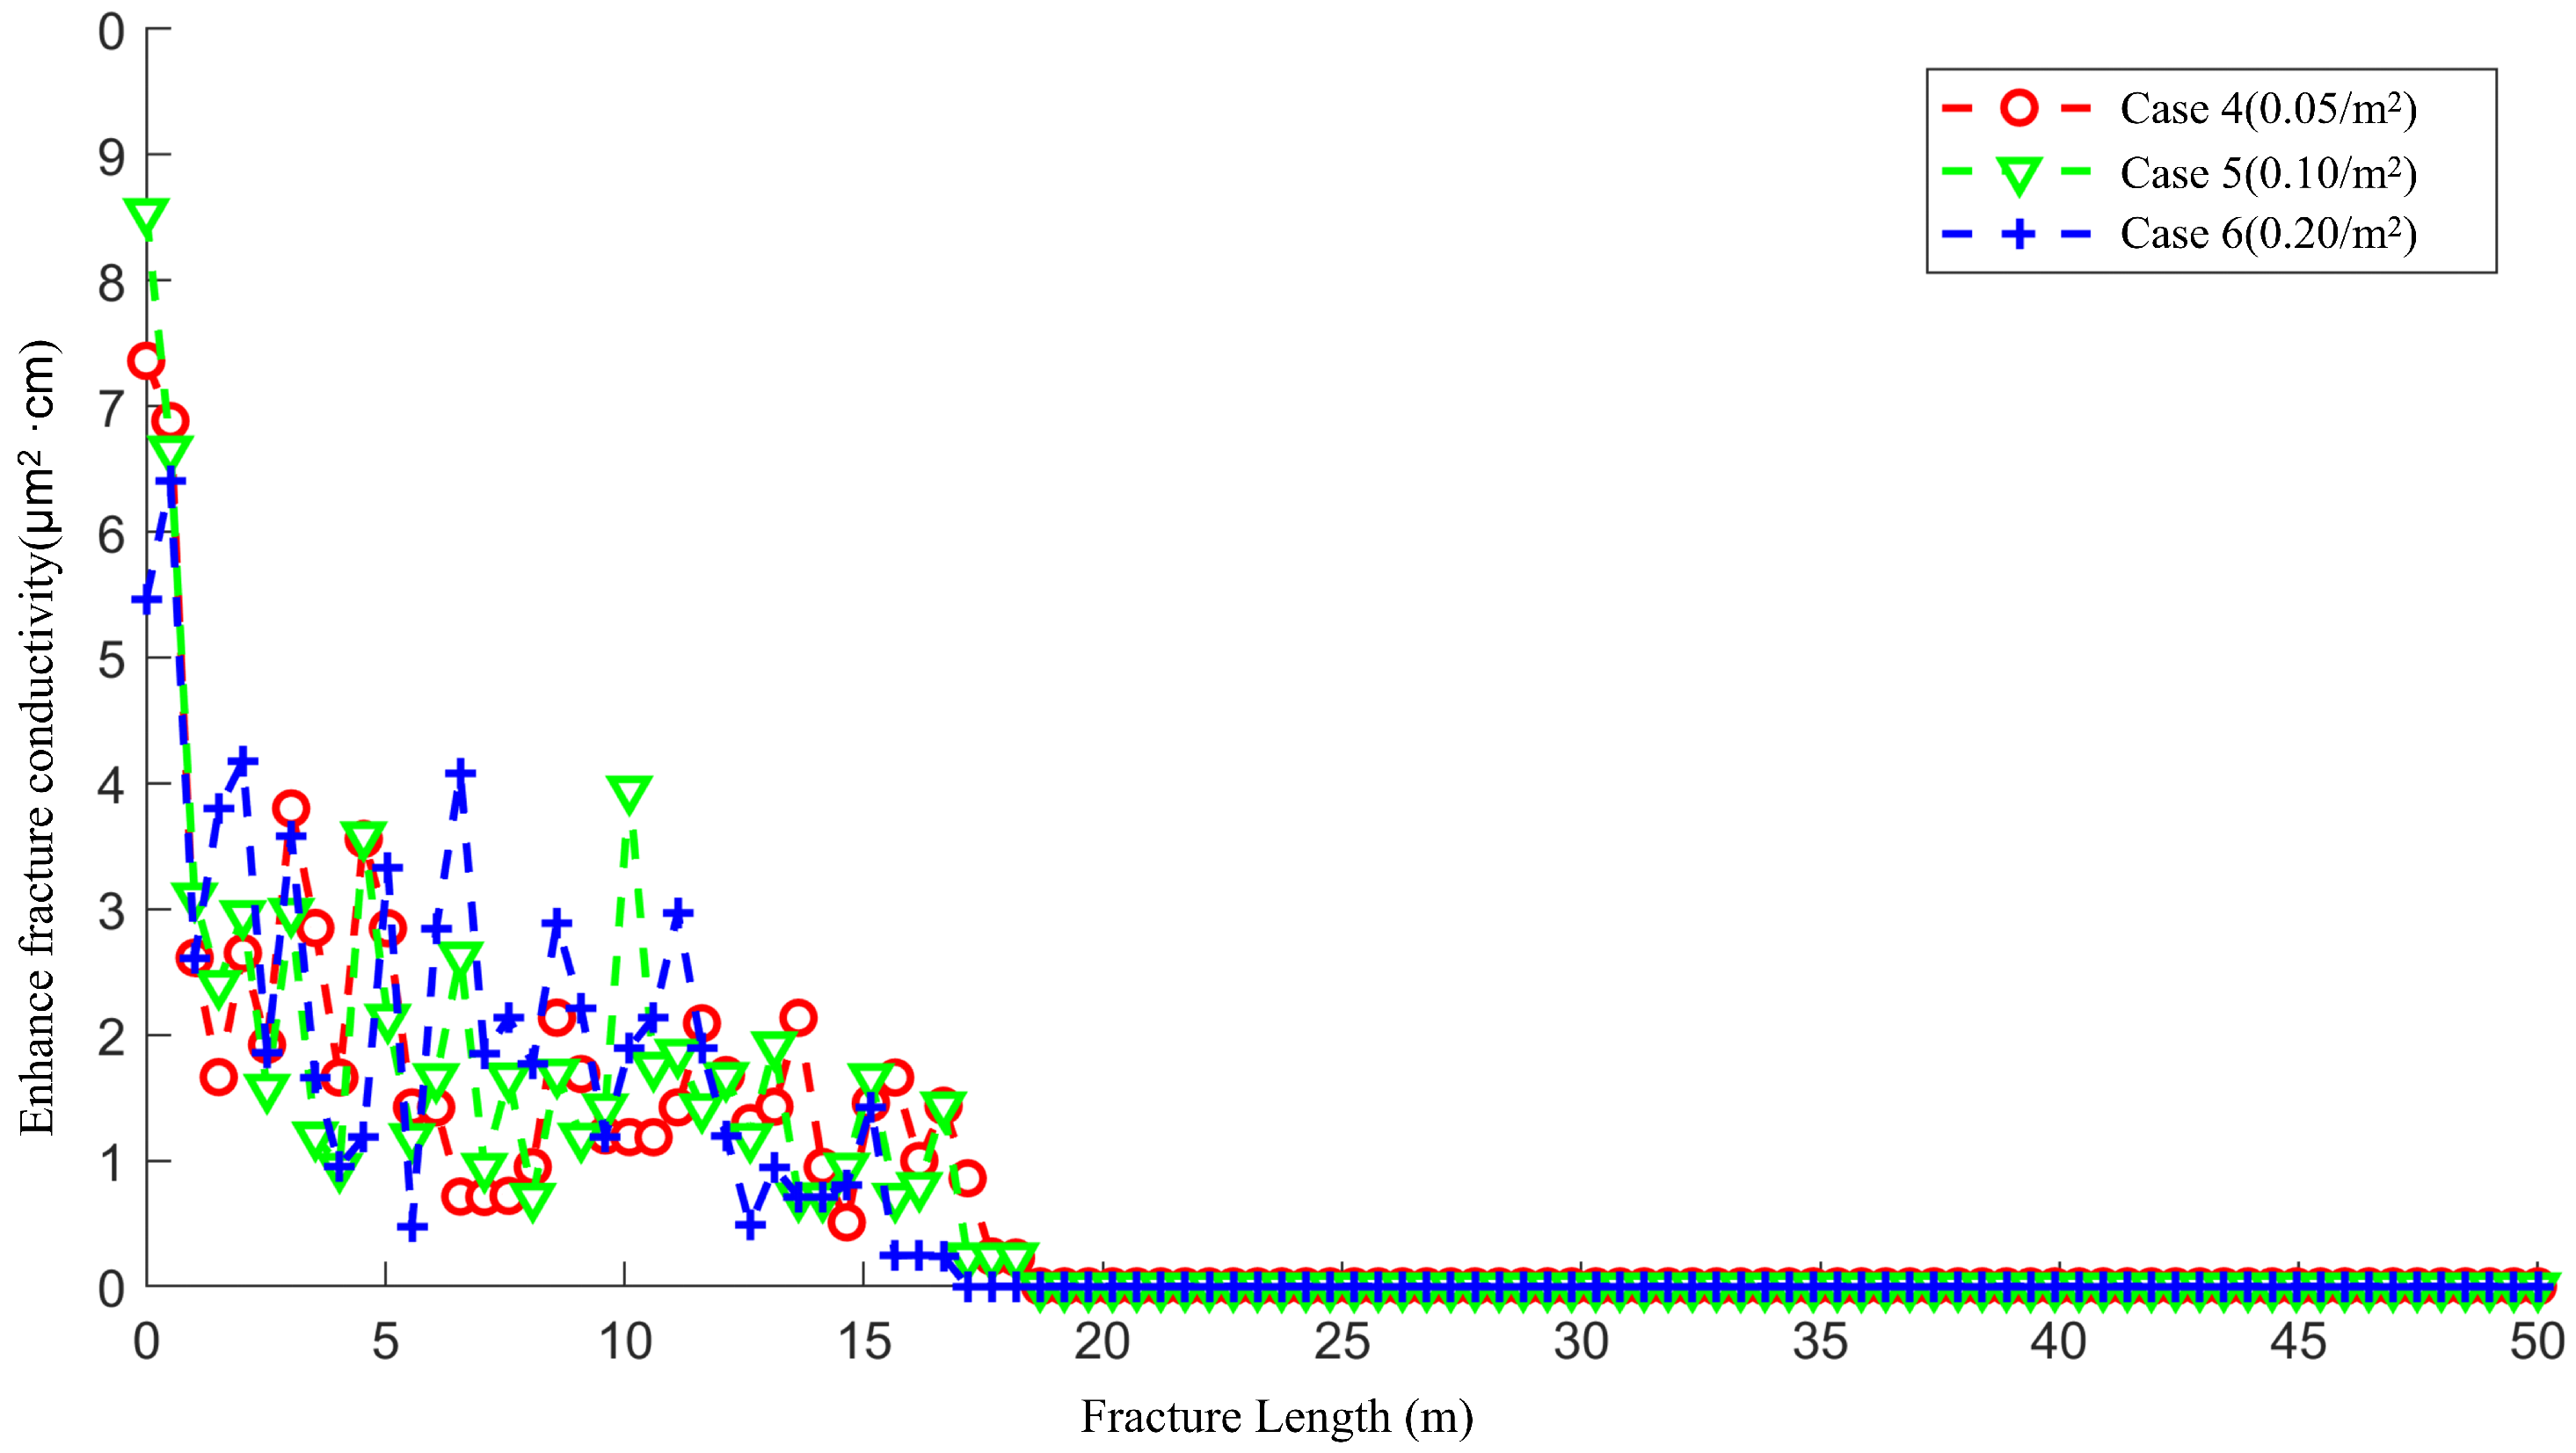
4.2. The Effect of Natural Fracture Density on the Acid Fracturing Effect of Low-Permeability Main Fractures

Under the three conditions of the permeability of the main fractures set in Section 4.1, the influence of the density of fully developed natural fractures near the main fractures on the morphology of wormholes and the effectiveness of the acidizing process is further explored. The densities of natural fractures are set to three values, 0.05/ m 2 , 0.1/ m 2 , and 0.2/ m 2 , as shown in Figure 11. The permeability of the natural fractures is 20D. In this section, the influencing law of the density of natural fractures on the low-permeability main fractures (5D) is studied first. The case settings and parameters are shown in Table 3.
Figure 12 demonstrates the wormhole morphology obtained under three different densities of natural fractures. In Case 4, the morphology of the originally developed branched wormholes is influenced by the nearby natural fractures. However, due to the low density of natural fractures, the number of natural fractures intersecting with the artificial main fracture is relatively small, and the overall morphological change is not significant, as shown in Figure 12a. In Case 5, as the density of natural fractures is further increased, the number of natural fractures communicating with the artificial main fracture grows. The acid flow is dispersed, resulting in the formation of more and finer branched wormholes on the main trunk of the wormholes, as depicted in Figure 12b. In Case 6, a large number of natural fractures communicate with the artificial main fracture, and the ability to communicate between natural fractures is also further enhanced. After the acid is diverted by the natural fractures communicating with the main fracture, it is further diverted by the natural fractures communicating with that particular natural fracture, forming a more complex morphology of wormhole branches, as shown in Figure 12c.
Figure 13, Figure 14 and Figure 15 present the scope of the acid impact (concentration ratio) under three natural fracture conditions. Since the number of natural fractures communicating with the artificial main fracture is relatively small, the lateral filtration trend of the acid has not been significantly altered by the natural fractures, as shown in Figure 13. When the density of natural fractures is 0.1/ m 2 (Case 5), the natural fractures guide the flow direction of the acid, increasing the loss of acid filtration. Moreover, the natural fractures near the wellbore cause the acid to accumulate more in the vicinity of the wellbore, as illustrated in Figure 14. When the density of natural fractures is 0.2/ m 2 , with the further increase in the number of natural fractures, the natural fractures have a significant impact on the saturation distribution of the acid. Additionally, the continuously communicating natural fractures further increase the loss of acid filtration, as depicted in Figure 15.
Figure 16 shows the enhanced fracture conductivity after acid fracturing for Case 4 to Case 6. When the density of natural fractures is 0.05/ m 2 (Case 4), since the natural fractures have a stronger ability to conduct the acid than the fractures themselves, the natural fractures near the wellbore increase the accumulation of acid in that area. As the density of natural fractures increases, the number of natural fractures communicating with the main fracture gradually rises, and the loss of acid filtration into the matrix also increases accordingly. Moreover, the increase in the amount of fluid loss reduces the length of the wormholes to a certain extent.

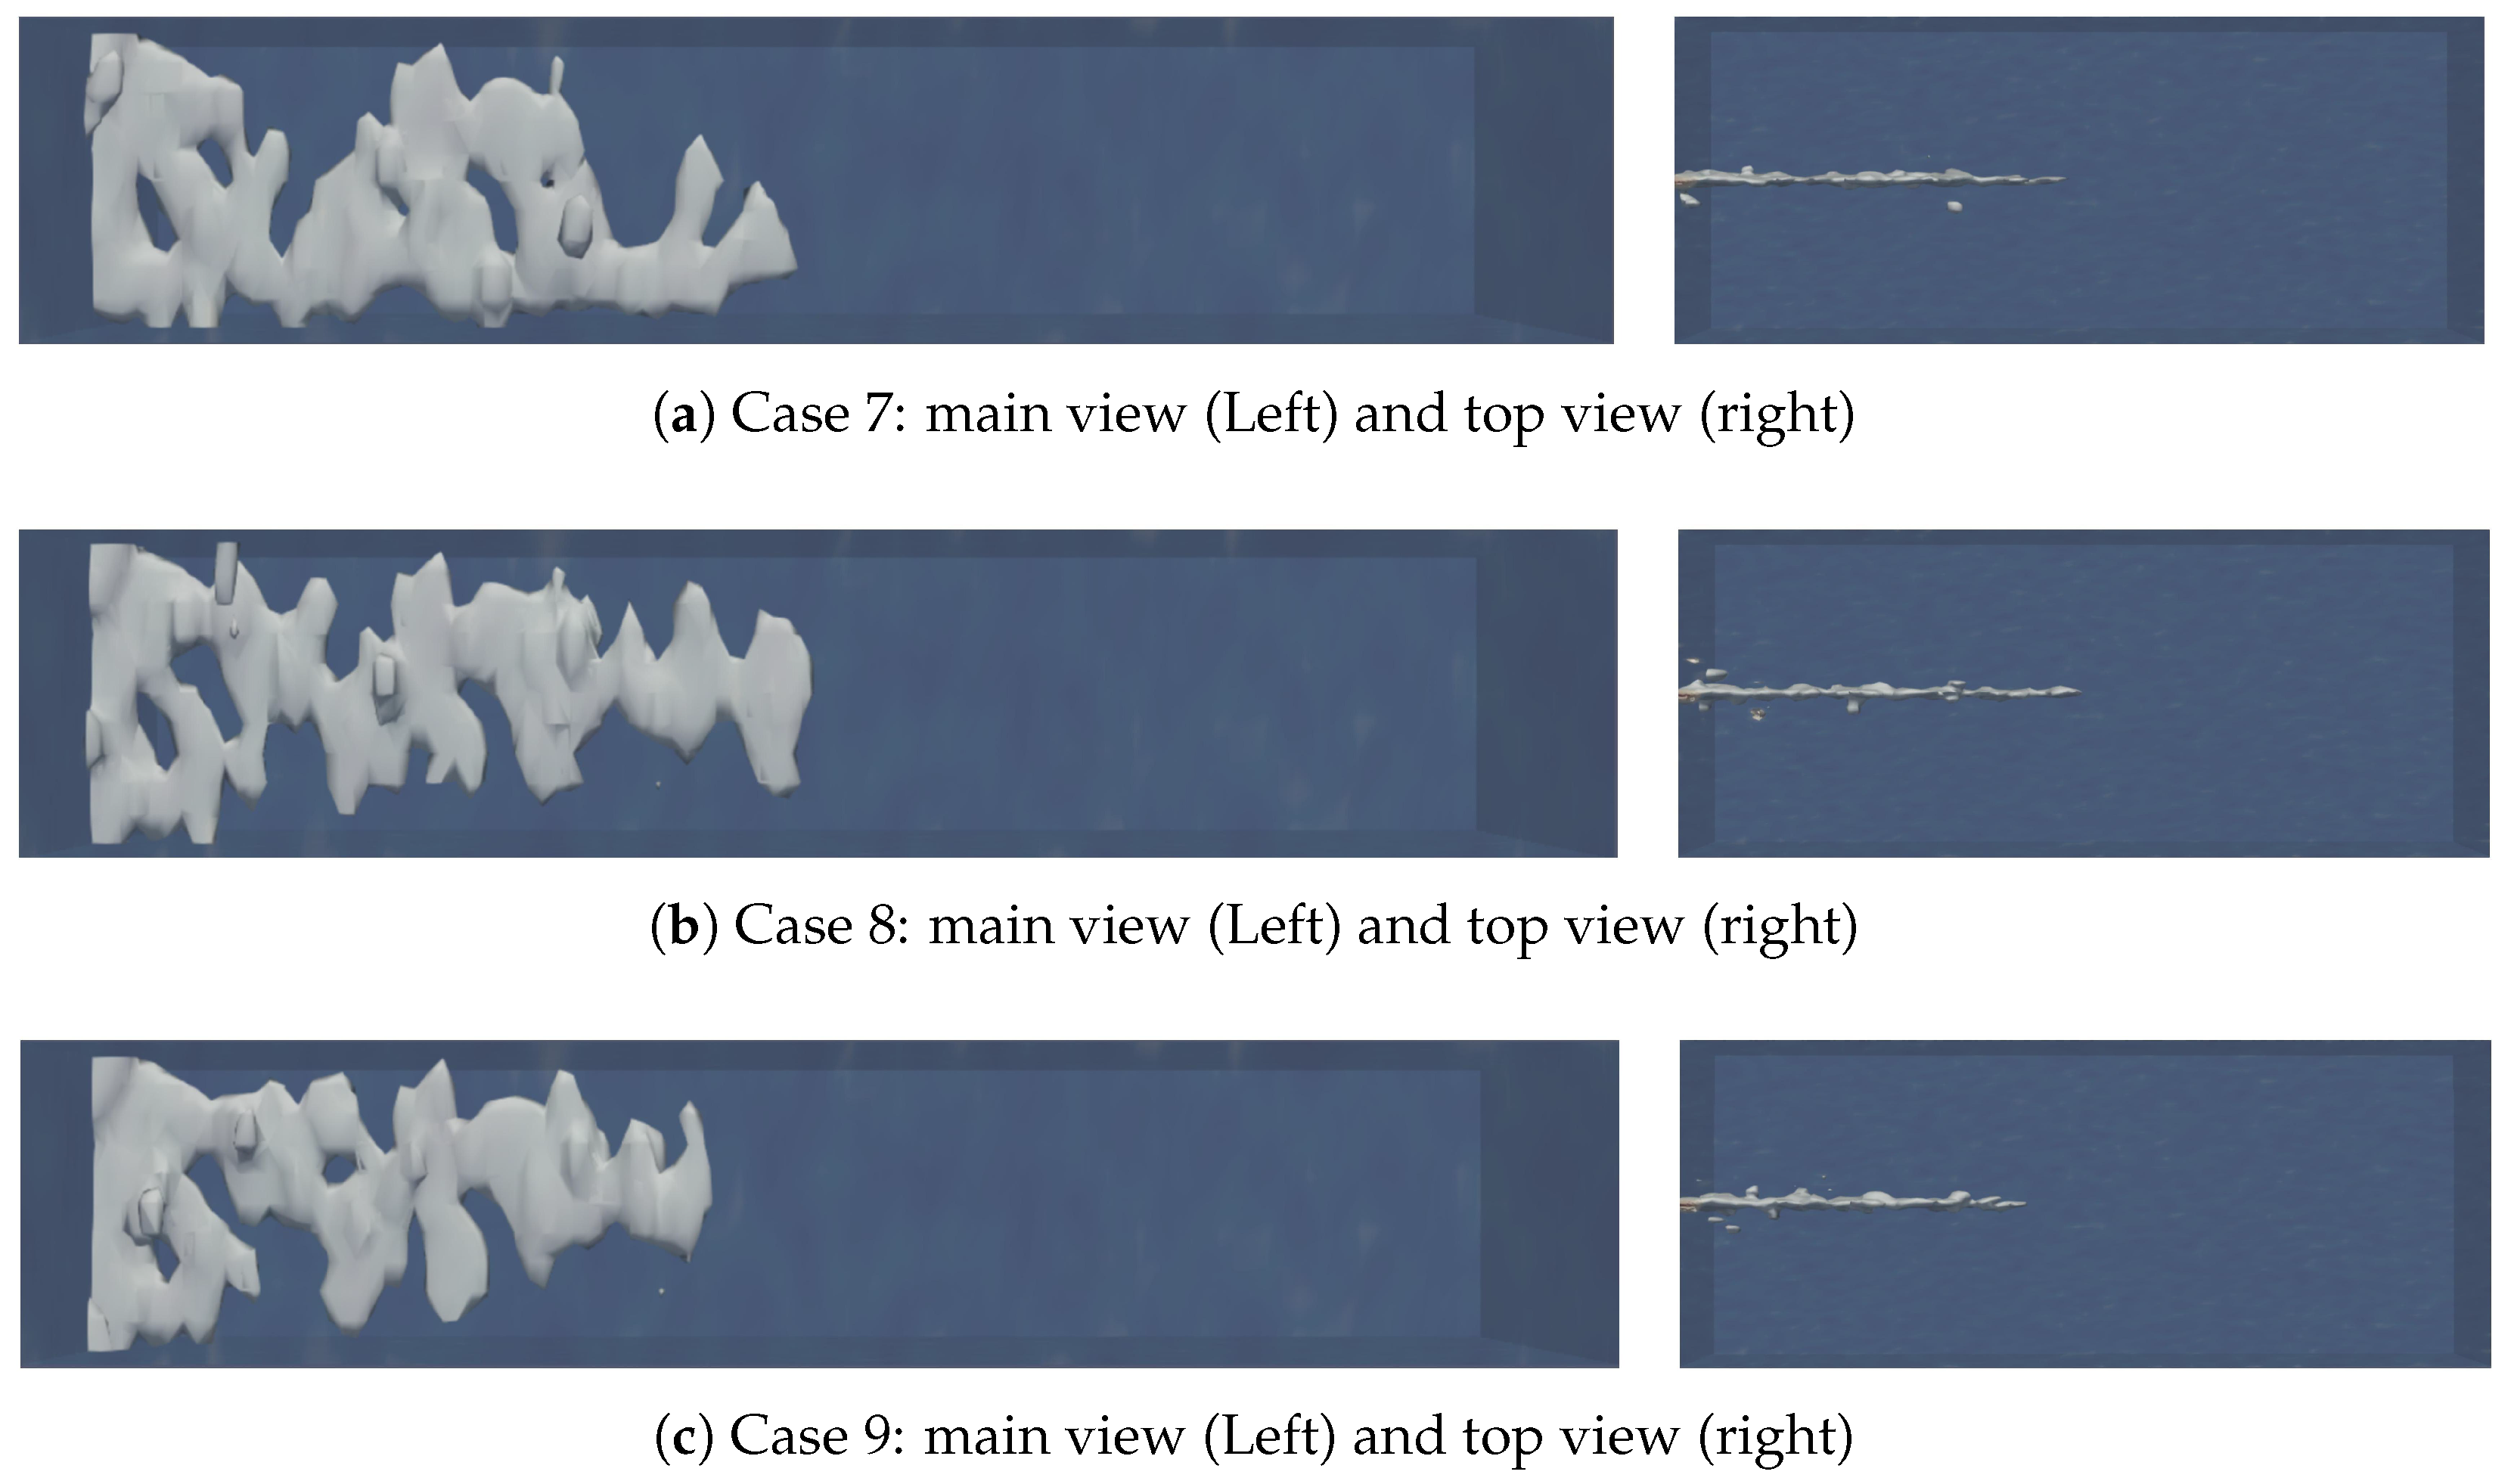
4.3. The Effect of Natural Fracture Density on the Acid Fracturing Effect of Middle-Permeability Main Fractures

This section studies the influencing law of the density of natural fractures on the medium-permeability main fractures (10D). The case settings and parameters are shown in Table 4.
Figure 17 displays the wormhole morphology obtained under three different densities of natural fractures. In Case 7, the resistance within the fracture is relatively small, and the influence of a small number of natural fractures communicating with the artificial main fracture on the flow trend of the acid is quite weak, as shown in Figure 17a. In Case 8, as the number of natural fractures increases, the natural fractures start to have an impact on the flow trend of the acid. Since the flow resistance of the acid within the artificial main fracture is smaller, at this time, the natural fractures only guide the formation of short branched wormholes on the main trunk of the wormholes, as illustrated in Figure 17b. In Case 9, with the further increase in the number of natural fractures, more branched wormholes are guided out on the main trunk of the wormholes, as depicted in Figure 17c.
Figure 18, Figure 19 and Figure 20 present the scope of the acid impact (concentration ratio) under three natural fracture conditions. When the density of natural fractures is 0.05/ m 2 (Case 7), the natural fractures do not cause obvious interference with the overall flow trend of the acid, as shown in Figure 18. When the density of natural fractures is 0.1/ m 2 (Case 8), the natural fractures near the wellbore increase the loss of acid filtration, as illustrated in Figure 19. When the density of natural fractures is 0.2/ m 2 (Case 9), the continuously communicating natural fractures significantly increase the loss of acid filtration. The increase in the amount of fluid loss makes the acid more concentrated in the first half of the fracture, as depicted in Figure 20.
Figure 21 shows the enhanced fracture conductivity after acid fracturing for Case 7 to Case 9. Unlike low-permeability fractures, when the density of natural fractures is 0.5/ m 2 (Case 7), the natural fractures communicating with the main fracture enhance the transportation capacity of the acid within the fracture. The length of the wormhole increases from 21 m to 23 m. As the number of natural fractures increases, the distribution of conductivity shows a trend similar to that in Figure 16, and the acid becomes more concentrated in the first half of the fracture. When the density of natural fractures is 0.2/ m 2 (Case 9), the length of the wormhole decreases to 20 m. Overall, the natural fractures reduce the fluctuation range of the conductivity, making the distribution of the acid in the matrix near the fracture smoother.

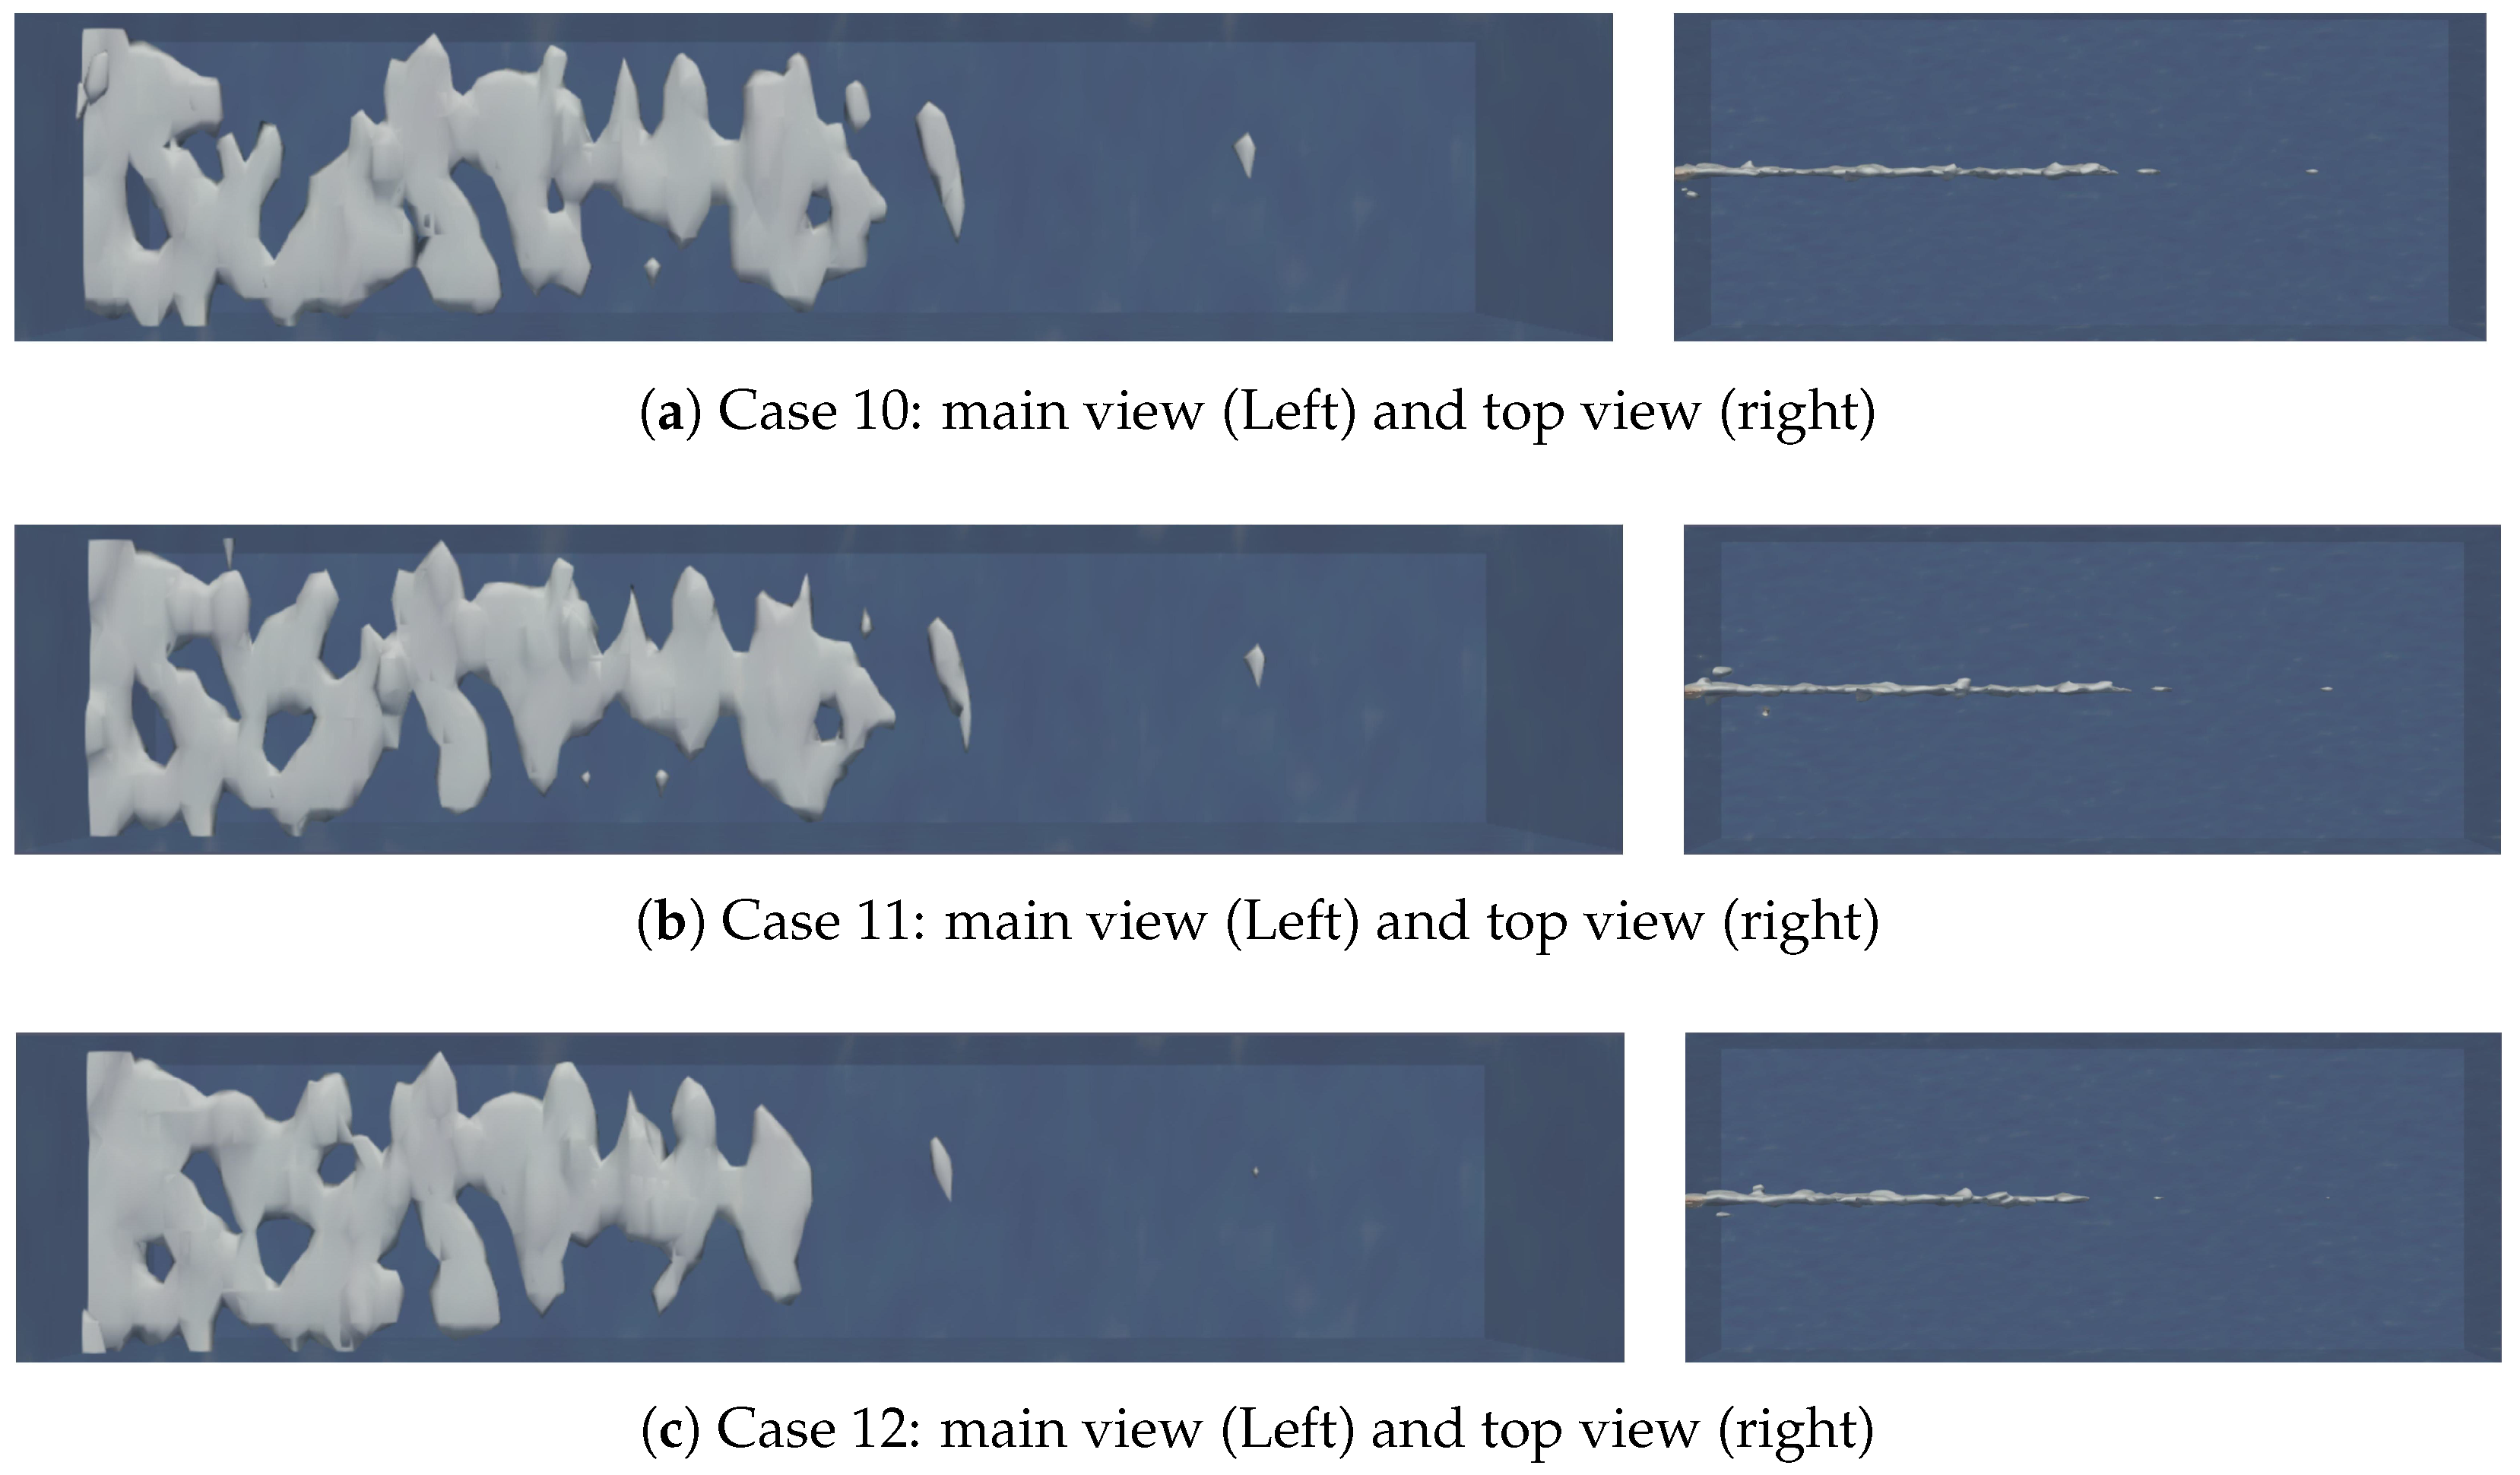
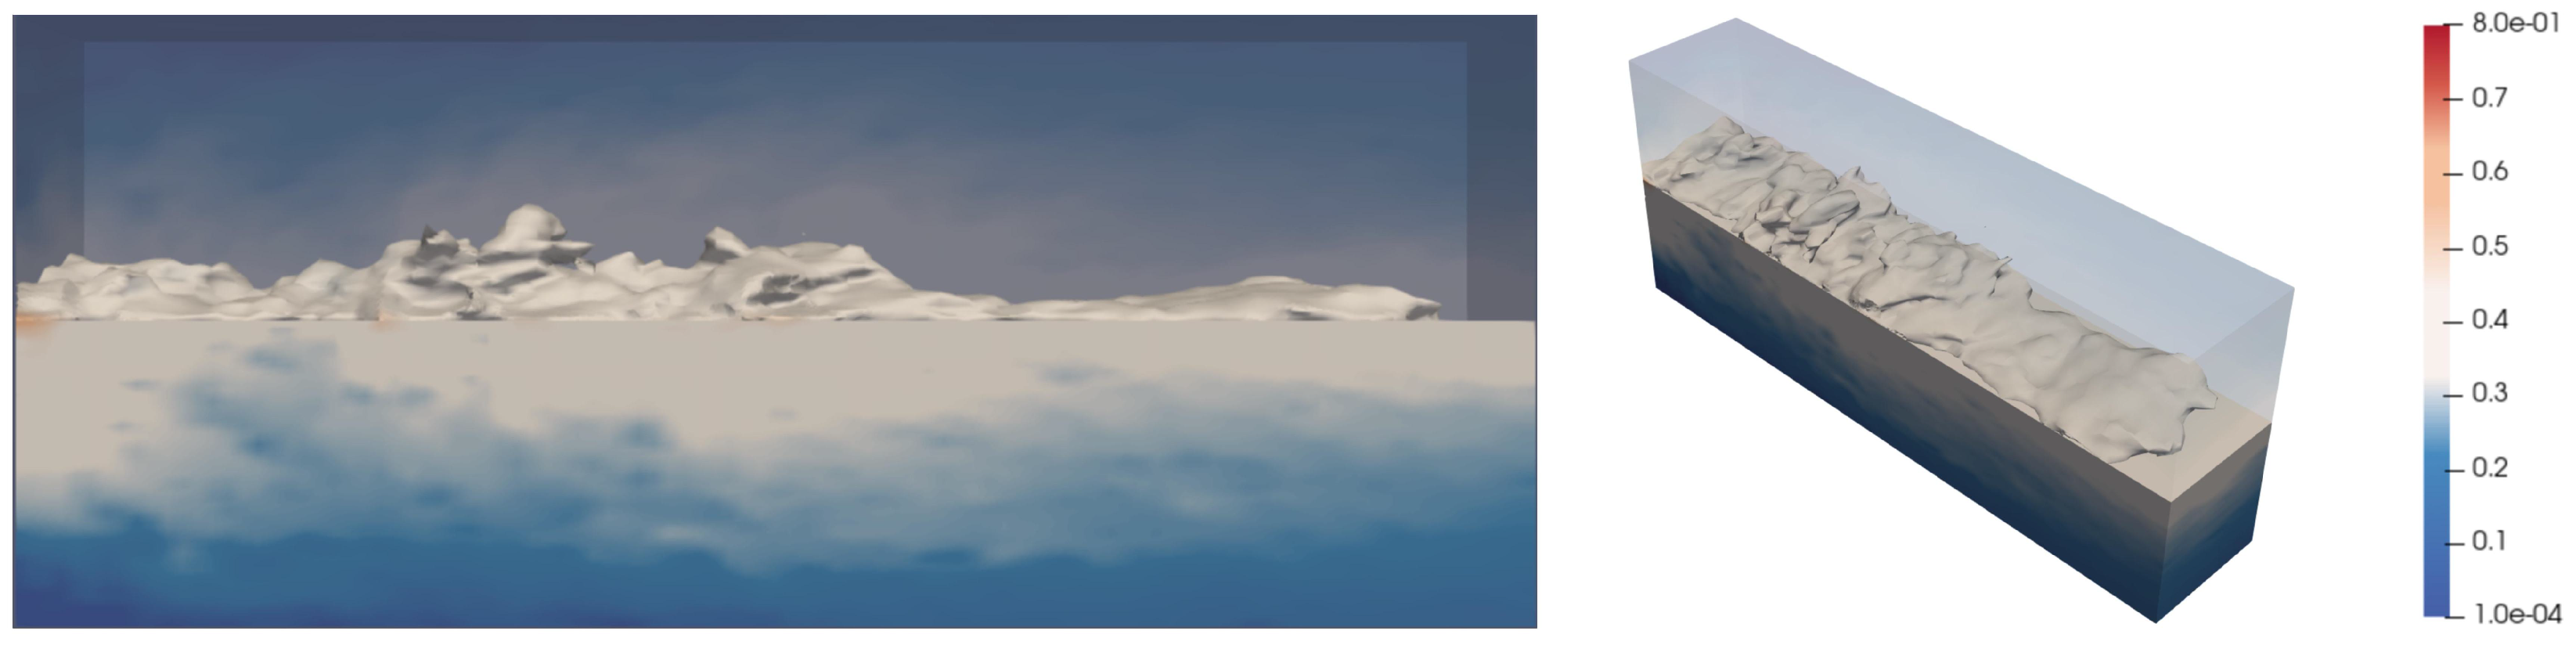
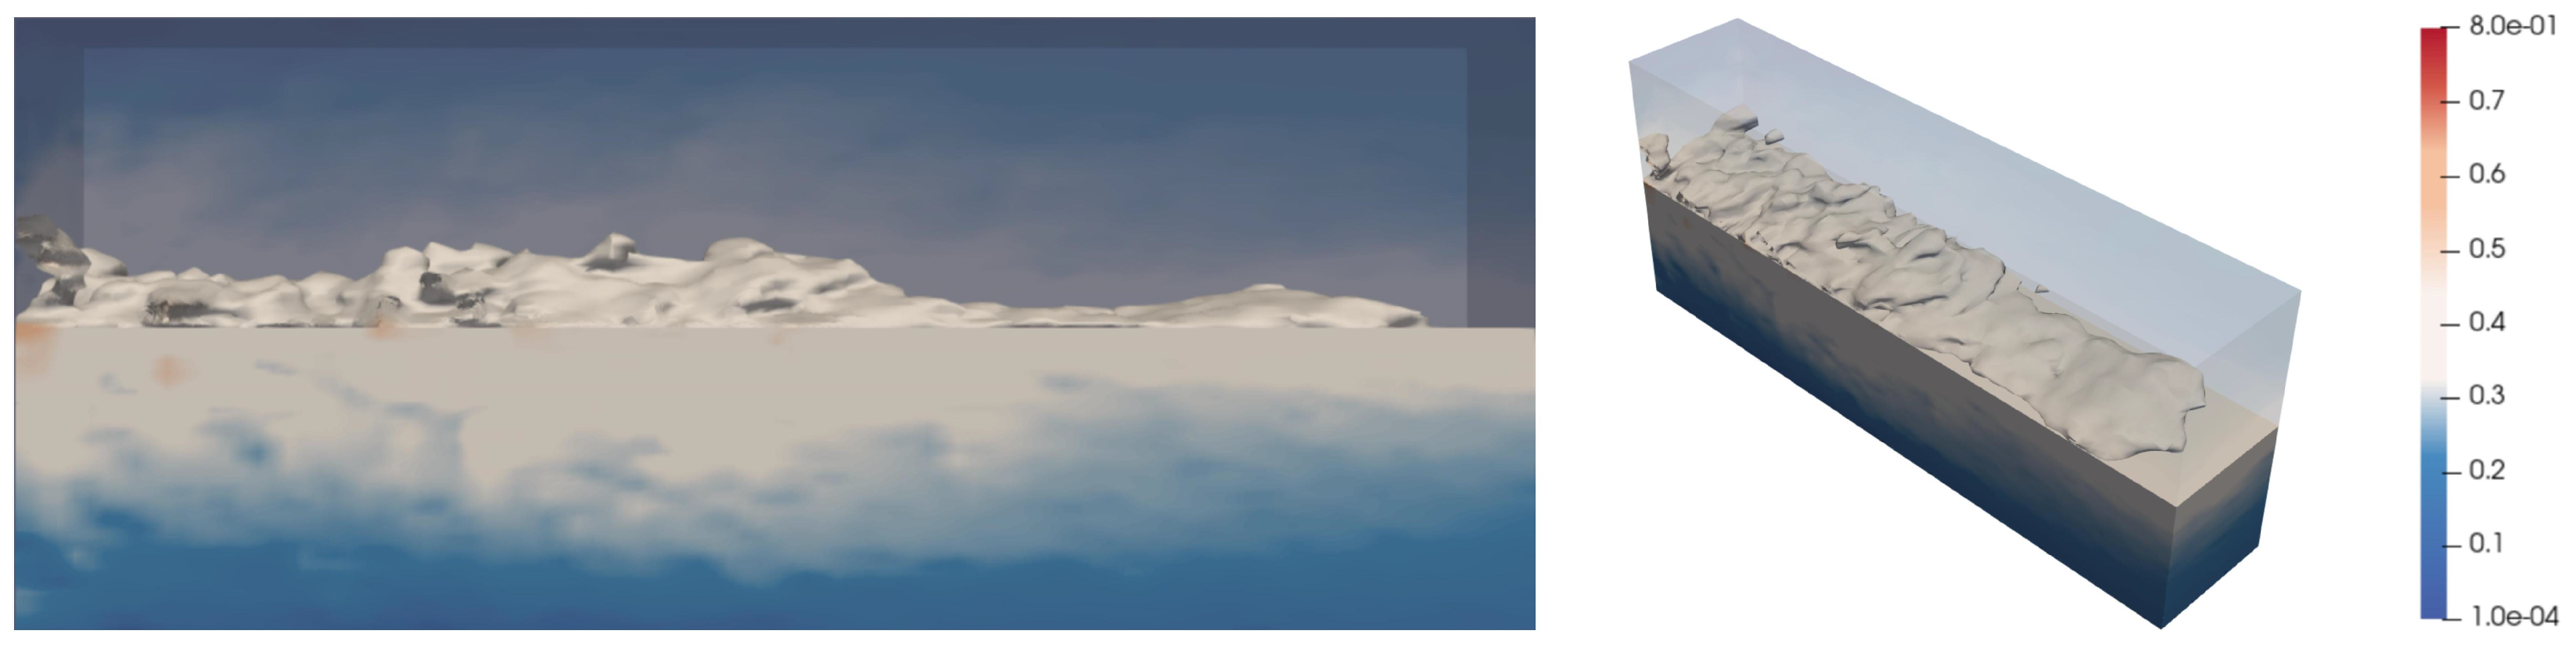
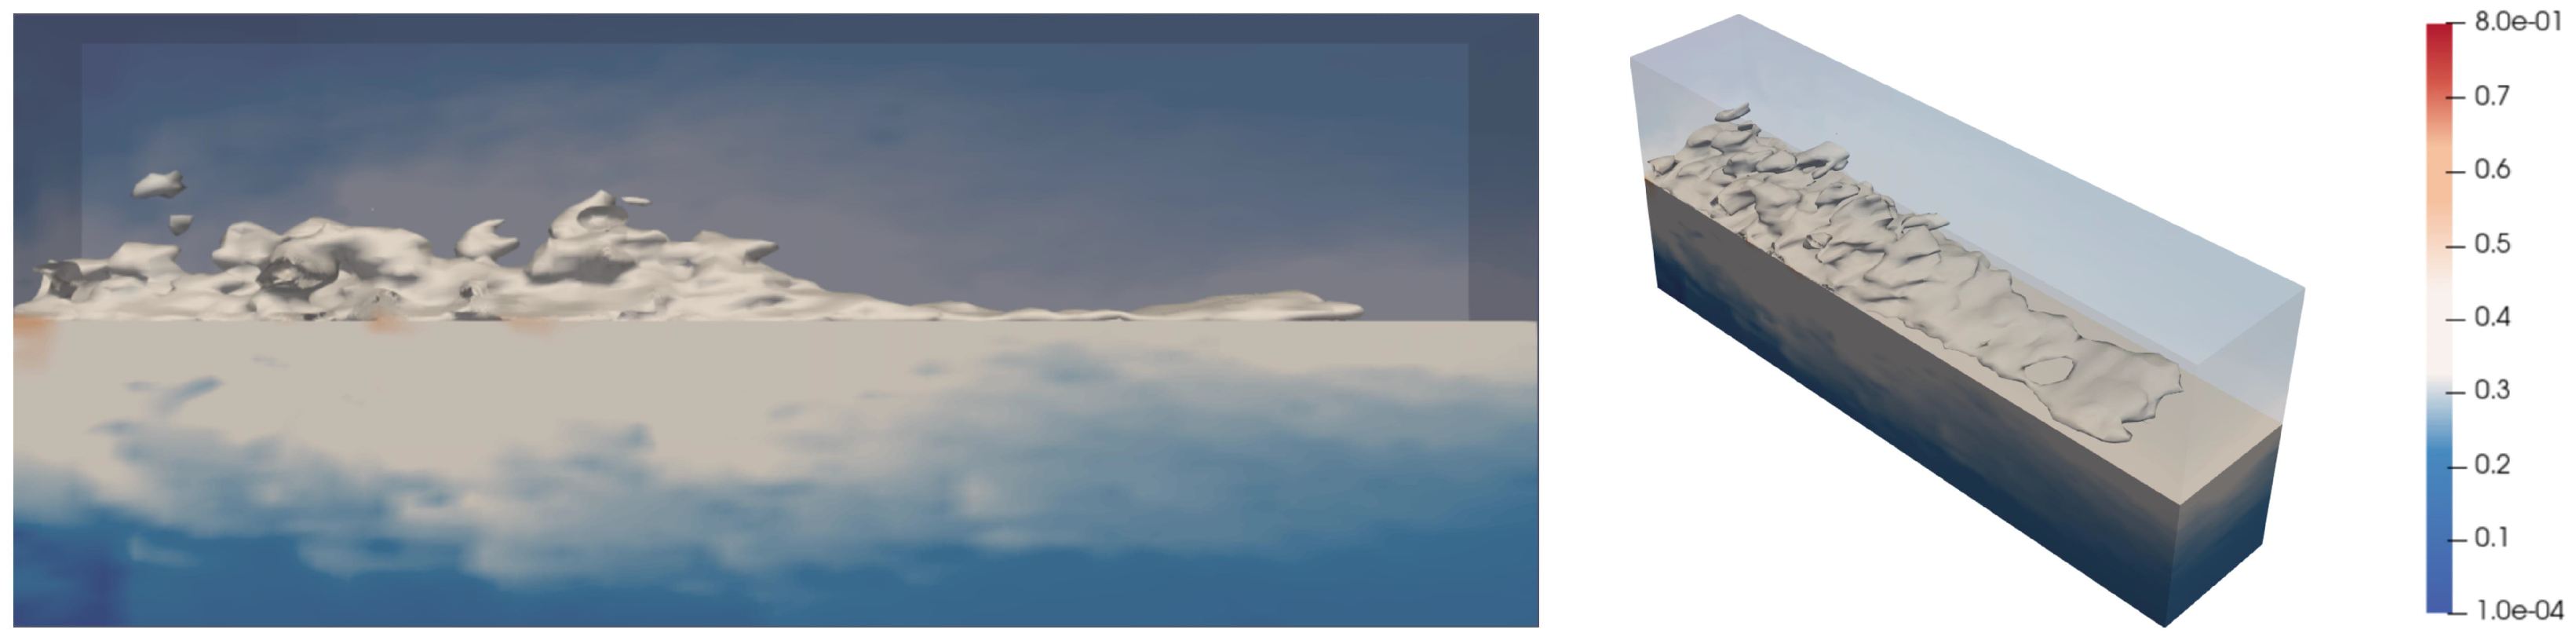
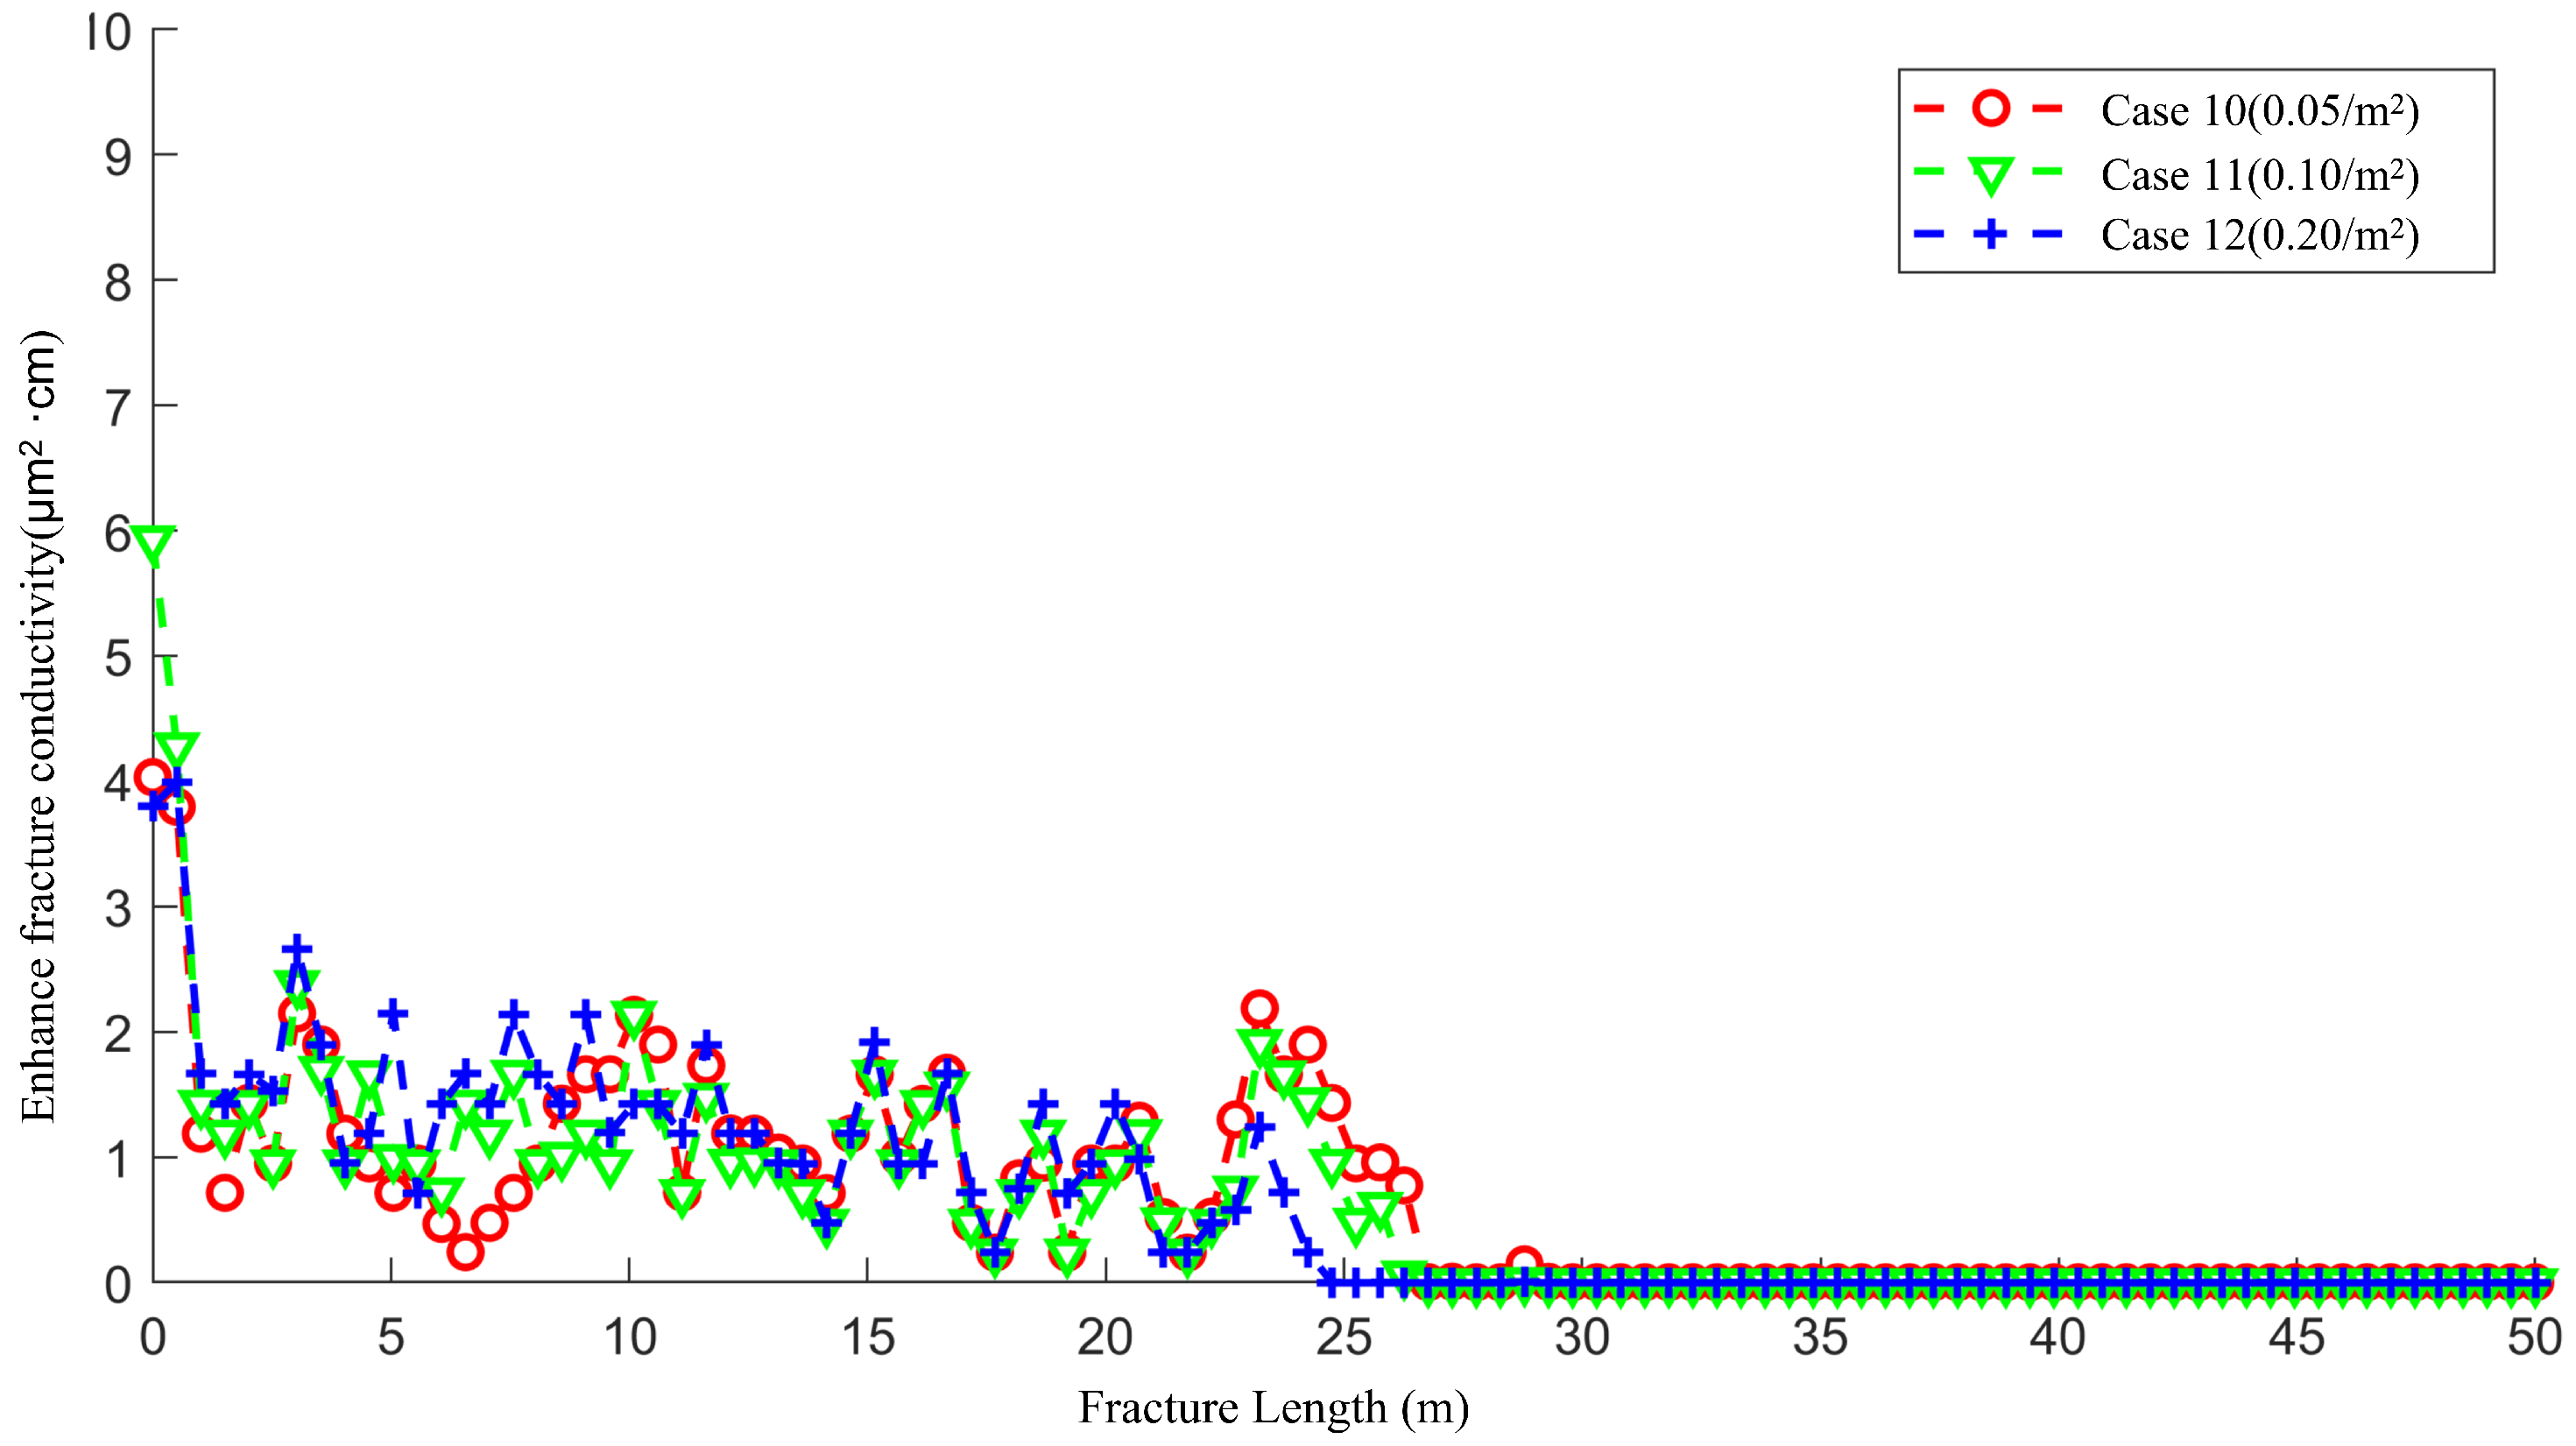
4.4. The Effect of Natural Fracture Density on the Acid Fracturing Effect of High-Permeability Main Fractures

This section studies the influence law of the density of natural fractures on high-permeability main fractures (20D). The case settings and parameters are shown in Table 5.
Figure 22 displays the wormhole morphology obtained under three different densities of natural fractures. In Case 10, the main fracture with high permeability forms a flow channel with almost absolute superiority. A small number of natural fractures have no influence on the morphology of the wormholes, and no new branched wormholes are developed, as shown in Figure 22a. In Case 11, with the further increase in the number of natural fractures, there are still no obvious branched wormholes developed on the main fracture, as depicted in Figure 22b. In Case 12, under the condition of continuous communication of natural fractures, the conductivity of the acid by the main fracture with high permeability is slightly affected. A small number of short branched wormholes are developed near the main fracture, as illustrated in Figure 22c.
Figure 23, Figure 24 and Figure 25 present the scope of the acid impact (concentration ratio) under three natural fracture conditions. When the density of natural fractures is 0.05/ m 2 (Case 10), the saturation distribution of the acid is basically consistent with that in Figure 9, as shown in Figure 23. When the density of natural fractures is 0.1/ m 2 (Case 11), there is a slight fluctuation in the distribution of the acid near the wellbore. However, the overall change is not obvious, as depicted in Figure 24. When the density of natural fractures is 0.2/ m 2 (Case 12), although the continuously communicating natural fractures do not lead to the formation of obvious branched wormholes, they do guide the acid to filter deeper into the matrix, as shown in Figure 25. Overall, the main fracture with high conductivity can significantly reduce the loss of acid filtration.
Figure 26 shows the enhanced fracture conductivity after acid fracturing for Case 10 to Case 12. When the density of natural fractures is 0.05/ m 2 (Case 10), the natural fractures have almost no impact on the fracture conductivity. Since the permeability of the natural fractures is the same as that of the main fracture, the natural fractures communicating with the main fracture will not enhance the flow ability of the acid fluid within the fracture. Therefore, the length of the wormhole is not increased. As the number of natural fractures in the matrix increases, the natural fractures communicating with the main fracture guide the acid fluid to flow into the matrix, slightly increasing the amount of fluid loss. When the density of natural fractures is 0.2/ m 2 , the length of the wormhole decreases from 27 m to 25 m.

5. Conclusions

In this work, we developed an acid fracturing simulation program based on the FMOT and discussed the interactive effects between three types of artificial main fracture permeability and three types of natural fracture network density. The main conclusions drawn are as follows.
(1)
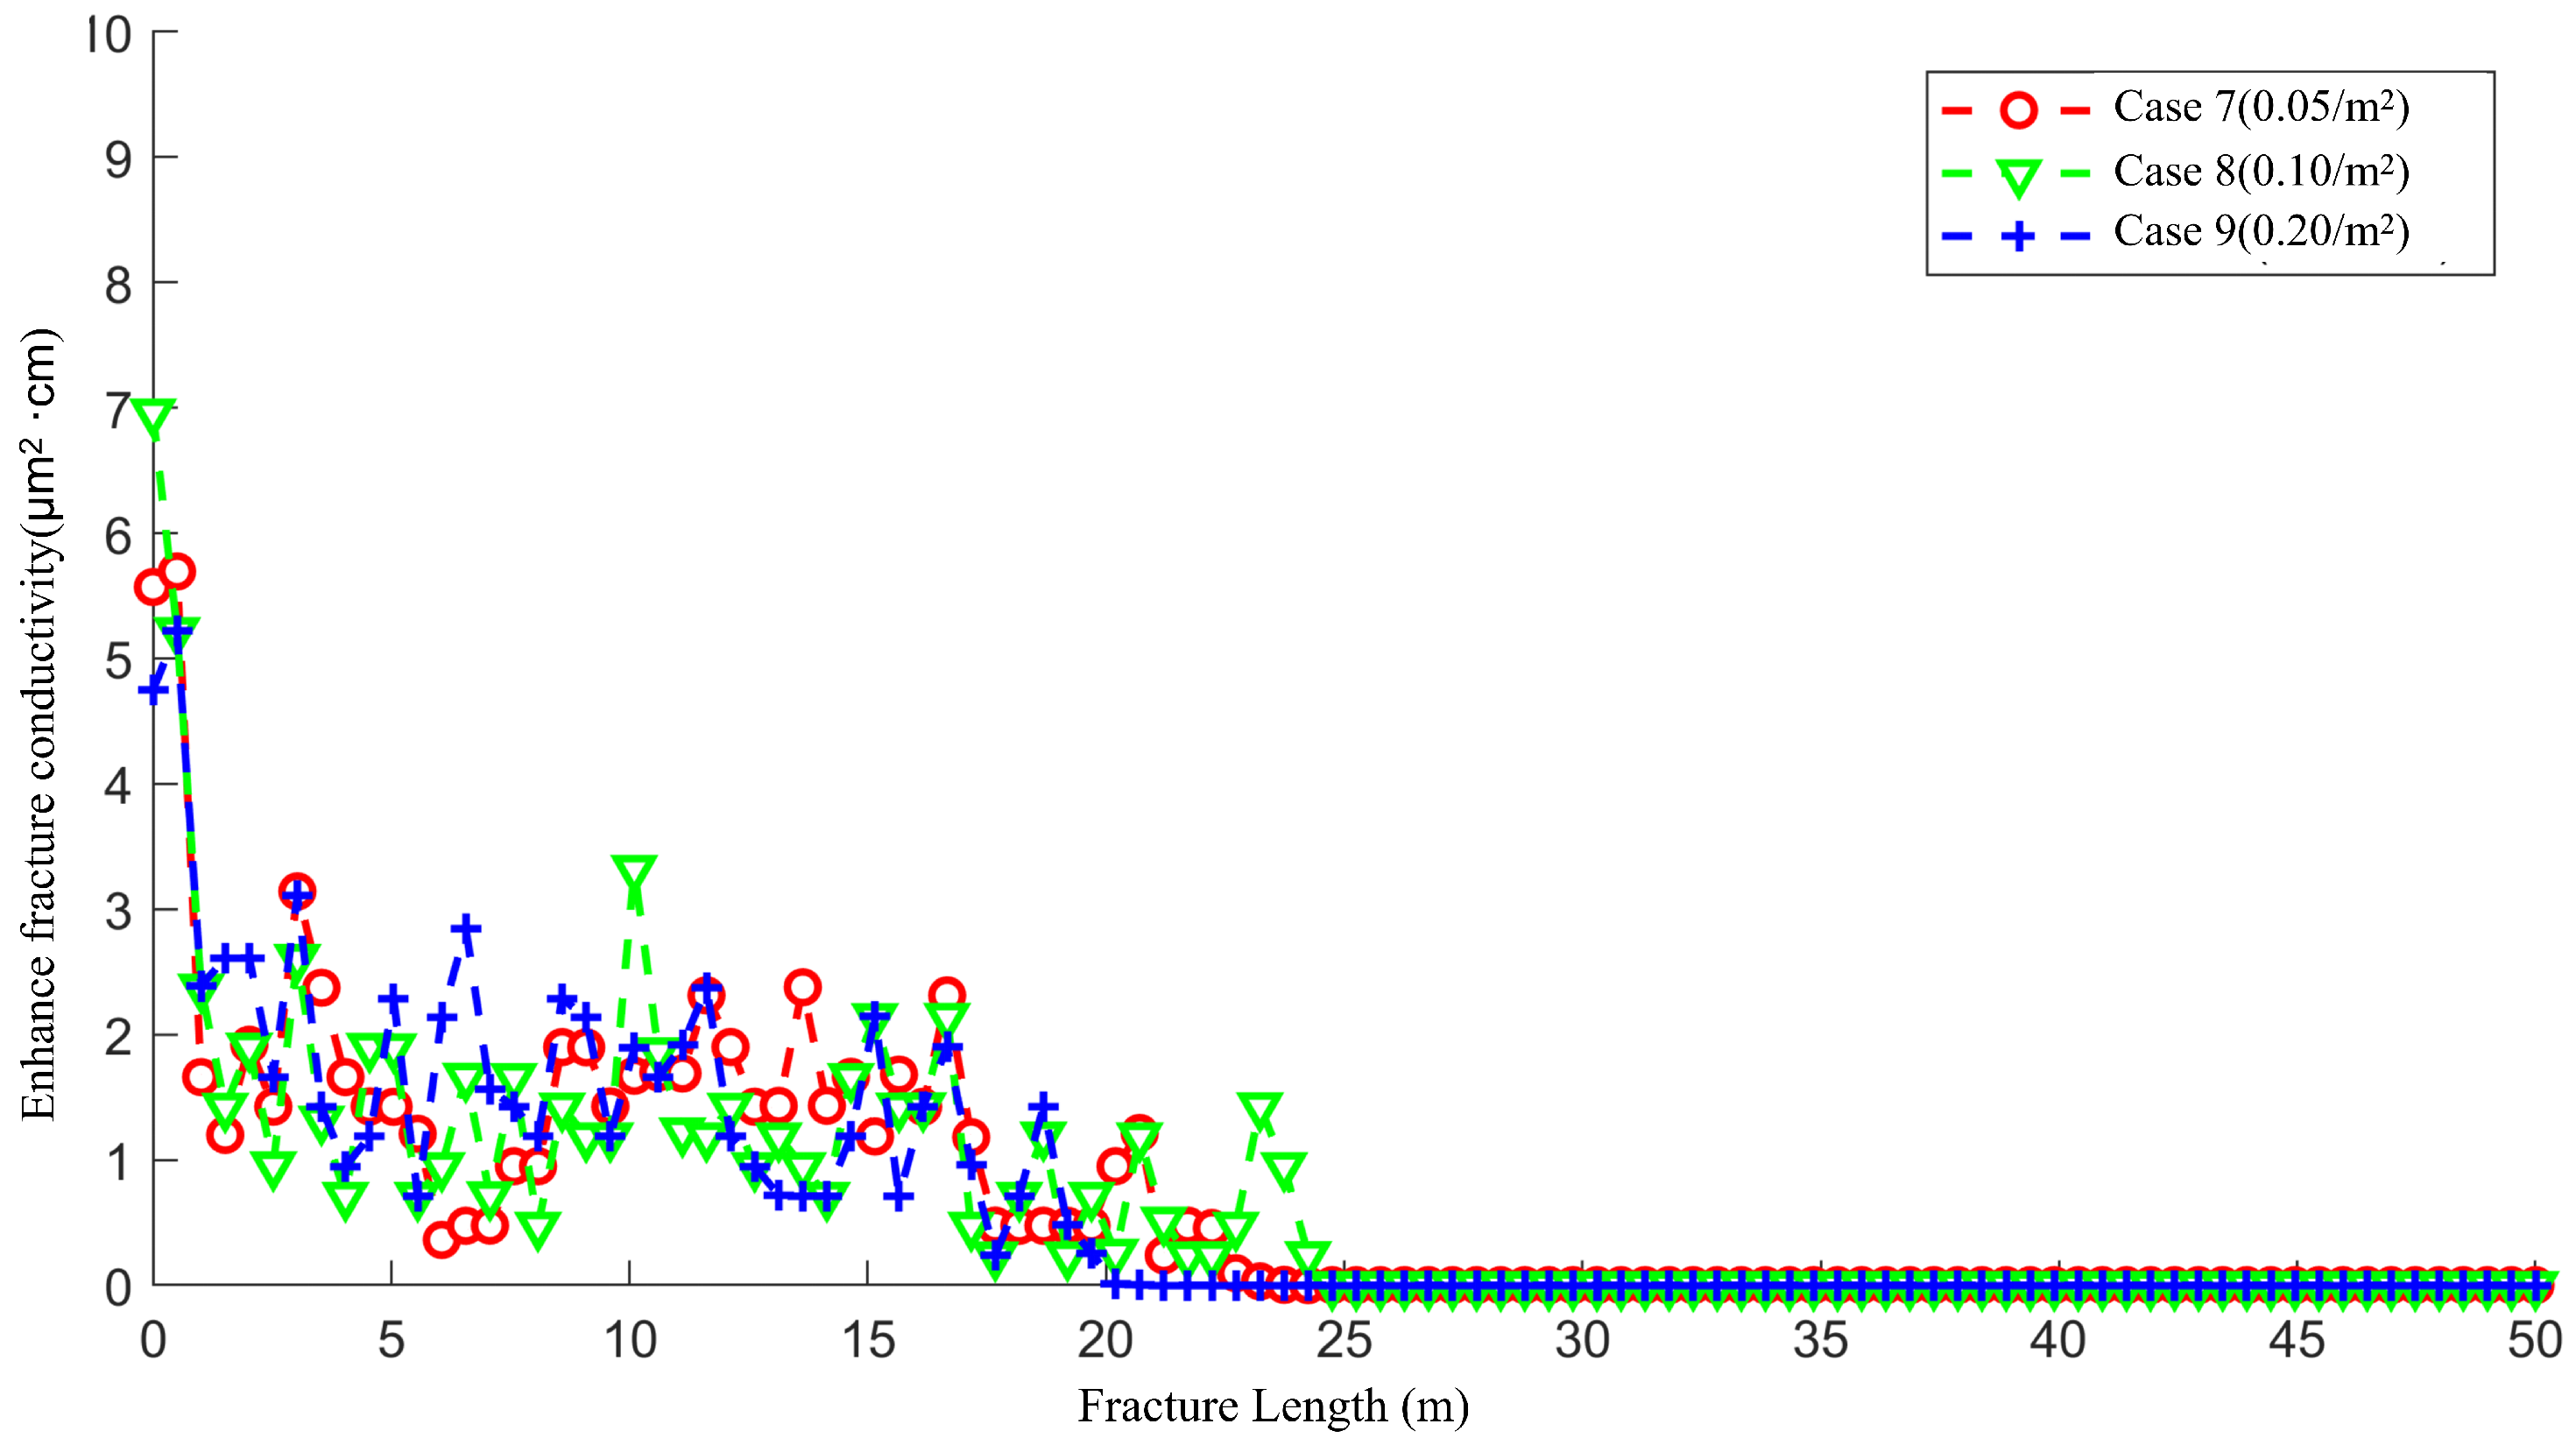
Under the same acid injection volume conditions, the higher the permeability of the artificial main fracture, the longer the length of the wormhole formed, and the less the acid leakage. Moreover, the higher the permeability of the main fracture, the less the improvement in fracture conductivity near the wellbore after acid fracturing, but the greater the improvement in average fracture conductivity.
(2)
The communication between natural fractures and artificial main fractures locally increases the filtration rate of acid into the matrix, guiding the formation of wormhole branches. However, at low natural fracture densities, there are fewer natural fractures communicating with the artificial main fracture, resulting in lateral filtration of the acid solution The trend has not been significantly altered by natural fractures, and there are fewer branches of wormholes formed.
(3)
For low-permeability main fractures, natural fractures lead to the longest and most numerous wormhole branches. As the permeability of artificial main fracture increases, the influence of natural fractures gradually decreases.

Author Contributions

Conceptualization, L.Z.; Methodology, Y.J. and L.Z.; Software, Y.J. and L.Z.; Validation, Y.J. and L.Z.; Formal analysis, Y.J. and L.Z.; Investigation, L.Z.; Resources, L.Z.; Data curation, L.Z.; Writing—original draft, L.Z.; Writing—review & editing, L.Z.; Visualization, L.Z.; Supervision, L.Z.; Project administration, L.Z.; Funding acquisition, L.Z. All authors have read and agreed to the published version of the manuscript.

Funding

This research received no external funding.

Data Availability Statement

The original contributions presented in this study are included in the article. Further inquiries can be directed to the corresponding author.

Conflicts of Interest

The authors have no conflicts to disclose.

References

  1. Aljawad, M.S.; Aljulaih, H.; Mahmoud, M.; Desouky, M. Integration of field, laboratory, and modeling aspects of acid fracturing: A comprehensive review. J. Pet. Sci. Eng. 2019, 181, 106158. [Google Scholar] [CrossRef]
  2. Lo, K.; Dean, R. Modeling of acid fracturing. SPE Prod. Eng. 1989, 4, 194–200. [Google Scholar] [CrossRef]
  3. Hewett, T. Fractal distributions of reservoir heterogeneity and their influence on fluid transport. In Proceedings of the SPE Annual Technical Conference and Exhibition, New Orleans, LA, USA, 5–8 October 1986; p. SPE-15386-MS. [Google Scholar]
  4. Li, N.; Dai, J.; Liu, P.; Luo, Z.; Zhao, L. Experimental study on influencing factors of acid-fracturing effect for carbonate reservoirs. Petroleum 2015, 1, 146–153. [Google Scholar] [CrossRef]
  5. Li, H.; Shi, Y. Triaxial experimental investigation into the characteristics of acid-etched fractures and acid fracturing. J. Pet. Sci. Eng. 2021, 202, 108431. [Google Scholar] [CrossRef]
  6. Ugursal, A.; Zhu, D.; Hill, A.D. Development of acid fracturing model for naturally fractured reservoirs. SPE Prod. Oper. 2019, 34, 735–748. [Google Scholar] [CrossRef]
  7. Wang, T.; Yang, Y.; Peng, Y.; Zhao, J.; Qi, T.; Zeng, J.; Hou, P. Simulation and evaluation for acid fracturing of carbonate reservoirs based on embedded discrete fracture model. Nat. Gas Ind. B 2021, 8, 637–649. [Google Scholar] [CrossRef]
  8. Chang, T.; Jiang, Y.; Li, Y.; Chen, X.; Kang, X.; Mo, W. Study on the effect of natural fractures and temperature on the wormhole morphology formed by two-phase acidizing in carbonate rocks. Phys. Fluids 2024, 36, 083333. [Google Scholar] [CrossRef]
  9. Guo, J.; Liu, H.; Zhu, Y.; Liu, Y. Effects of acid–rock reaction heat on fluid temperature profile in fracture during acid fracturing in carbonate reservoirs. J. Pet. Sci. Eng. 2014, 122, 31–37. [Google Scholar] [CrossRef]
  10. You, J.; Lee, K.J. Analyzing the dynamics of mineral dissolution during acid fracturing by pore-scale modeling of acid-rock interaction. SPE J. 2021, 26, 639–652. [Google Scholar] [CrossRef]
  11. Fan, Y.; Peng, H.; Chen, G.; Peng, J.; Han, H.; Qin, Y.; Wang, L.; Liu, D. Experimental study of the influences of different factors on the acid–rock reaction rate of carbonate rocks. J. Energy Storage 2023, 63, 107064. [Google Scholar] [CrossRef]
  12. Crowe, C.; Hutchinson, B.; Trittipo, B. Fluid-loss control: The key to successful acid fracturing. SPE Prod. Eng. 1989, 4, 215–220. [Google Scholar] [CrossRef]
  13. Bazin, B.; Roque, C.; Chauveteau, G.; Bouteca, M. Acid filtration in dynamic conditions to mimic fluid loss in acid fracturing. In Proceedings of the SPE European Formation Damage Conference and Exhibition, The Hague, The Netherlands, 2–3 June 1997; p. SPE-38168-MS. [Google Scholar]
  14. Panga, M.K.; Ziauddin, M.; Balakotaiah, V. Two-scale continuum model for simulation of wormholes in carbonate acidization. AIChE J. 2005, 51, 3231–3248. [Google Scholar] [CrossRef]
  15. Liu, H.; Baletabieke, B.; Wang, G.; Guo, J.; Xia, F.; Chen, Z. Influences of real-time acid–rock reaction heat on etched fracture dimensions during acid fracturing of carbonate reservoirs and field applications. Heliyon 2022, 8, e11659. [Google Scholar] [CrossRef]
  16. Guo, T.; Li, Y.; Ding, Y.; Qu, Z.; Gai, N.; Rui, Z. Evaluation of acid fracturing treatments in shale formation. Energy Fuels 2017, 31, 10479–10489. [Google Scholar] [CrossRef]
  17. Nierode, D.; Kruk, K. An evaluation of acid fluid loss additives retarded acids, and acidized fracture conductivity. In Proceedings of the Fall Meeting of the Society of Petroleum Engineers of AIME, Las Vegas, NV, USA, 30 September–3 October 1973; p. SPE-4549-MS. [Google Scholar]
  18. Nasr-El-Din, H.A.; Al-Driweesh, S.; Al-Muntasheri, G.A.; Marcinew, R.; Daniels, J.; Samuel, M. Acid fracturing HT/HP gas wells using a novel surfactant based fluid system. In Proceedings of the SPE Annual Technical Conference and Exhibition, Denver, CO, USA, 5–8 October 2003; p. SPE-84516-MS. [Google Scholar]
  19. Schriefer, F.E.; Shaw, M.S. Use of Fine Salt as a Fluid Loss Material in Acid Fracturing Stimulation Treatments. In Proceedings of the SPE Annual Fall Technical Conference and Exhibition, Houston, TX, USA, 1–3 October 1978; p. SPE-7570-MS. [Google Scholar]
  20. Zhang, L.; Mou, J.; Cheng, X.; Zhang, S. Evaluation of ceramsite loss control agent in acid fracturing of naturally fractured carbonate reservoir. Nat. Gas Ind. B 2021, 8, 302–308. [Google Scholar] [CrossRef]
  21. Ugursal, A.; Schwalbert, M.P.; Zhu, D.; Hill, A.D. Acid fracturing productivity model for naturally fractured carbonate reservoirs. In Proceedings of the SPE International Hydraulic Fracturing Technology Conference and Exhibition, Muscat, Oman, 16–18 October 2018; p. SPE-191433-18IHFT-MS. [Google Scholar]
  22. Broaddus, G.; Knox, J.; Fredrickson, S. Dynamic etching tests and their use in planning acid treatments. In Proceedings of the SPE Oklahoma City Oil and Gas Symposium/Production and Operations Symposium, Stillwater, OK, USA, 25 October 1968; p. SPE-2362-MS. [Google Scholar]
  23. Pournik, M.; Zhu, D.; Hill, A. Acid-fracture conductivity correlation development based on acid-fracture characterization. In Proceedings of the SPE European Formation Damage Conference and Exhibition, Scheveningen, The Netherlands, 27–29 May 2009; p. SPE-122333-MS. [Google Scholar]
  24. Deng, J.; Mou, J.; Hill, A.D.; Zhu, D. A new correlation of acid-fracture conductivity subject to closure stress. SPE Prod. Oper. 2012, 27, 158–169. [Google Scholar] [CrossRef]
  25. Al-Momin, A.; Zhu, D.; Hill, A. The effects of initial condition of fracture surfaces, acid spending and acid type on conductivity of acid fracture. In Proceedings of the Offshore Technology Conference Asia, Kuala Lumpur, Malaysia, 25–28 March 2014; p. OTC-24895-MS. [Google Scholar]
  26. Asadollahpour, E.; Baghbanan, A.; Hashemolhosseini, H.; Mohtarami, E. The etching and hydraulic conductivity of acidized rough fractures. J. Pet. Sci. Eng. 2018, 166, 704–717. [Google Scholar] [CrossRef]
  27. Malagon, C.; Pournik, M.; Hill, A.D. The texture of acidized fracture surfaces: Implications for acid fracture conductivity. SPE Prod. Oper. 2008, 23, 343–352. [Google Scholar] [CrossRef]
  28. Ruffet, C.; Fery, J.; Onaisi, A. Acid-fracturing treatment: A surface-topography analysis of acid-etched fractures to determine residual conductivity. SPE J. 1998, 3, 155–162. [Google Scholar] [CrossRef]
  29. Liu, P.; Li, J.; Du, J.; Liu, J.; Xiong, G.; Chen, P.; Li, Y.; Chen, X. Evaluation of acid retardation based on acid-etched fracture morphology. Geoenergy Sci. Eng. 2025, 244, 213492. [Google Scholar] [CrossRef]
  30. Chang, T.; Jiang, Y.; Zhao, H.; Chen, X.; Mo, W. Effect of two-phase viscosity difference and natural fractures on the wormhole morphology formed by two-phase acidizing with self-diverting acid in carbonate rocks. Phys. Fluids 2024, 36, 093623. [Google Scholar] [CrossRef]
  31. Moinfar, A.; Varavei, A.; Sepehrnoori, K.; Johns, R.T. Development of an efficient embedded discrete fracture model for 3D compositional reservoir simulation in fractured reservoirs. SPE J. 2014, 19, 289–303. [Google Scholar] [CrossRef]
  32. Carman, P.C. Flow of Gases Through Porous Media; Academic Press: Cambridge, MA, USA, 1956. [Google Scholar]
  33. Valdes-Parada, F.J.; Ochoa-Tapia, J.A.; Alvarez-Ramirez, J. Validity of the permeability Carman–Kozeny equation: A volume averaging approach. Phys. A Stat. Mech. Its Appl. 2009, 388, 789–798. [Google Scholar] [CrossRef]
Figure 1. Flowchat.
Figure 1. Flowchat.
Processes 13 01710 g001
Figure 2. Comparison of different dissolution modes: (Up) The current work; (Down) Panga’s work (Panga et al., 2005) [14].
Processes 13 01710 g002
Figure 3. Comparison of the pore volume of acid required to reach the breakthrough ( PV B T ).
Processes 13 01710 g003
Figure 4. The main fracture model.
Processes 13 01710 g004
Figure 5. The permeability distribution.
Processes 13 01710 g005
Figure 6. The wormhole morphology of the main fractures with different permeabilities.
Processes 13 01710 g006
Figure 7. Scope of acid impact (concentration ratio) of Case 1.
Processes 13 01710 g007
Figure 8. Scope of acid impact (concentration ratio) of Case 2.
Processes 13 01710 g008
Figure 9. Scope of acid impact (concentration ratio) of Case 3.
Processes 13 01710 g009
Figure 10. The enhanced fracture conductivity of Case 1 to Case 3 after acid fracturing.
Processes 13 01710 g010
Figure 11. Schematic diagrams of three natural fracture density models.
Processes 13 01710 g011aProcesses 13 01710 g011b
Figure 12. The wormhole morphology of Case 4 to Case 6.
Processes 13 01710 g012
Figure 13. Scope of acid impact (concentration ratio) of Case 4.
Processes 13 01710 g013
Figure 14. Scope of acid impact (concentration ratio) of Case 5.
Processes 13 01710 g014
Figure 15. Scope of acid impact (concentration ratio) of Case 6.
Processes 13 01710 g015
Figure 16. The enhanced fracture conductivity of Case 4 to Case 6 after acid fracturing.
Processes 13 01710 g016
Figure 17. The wormhole morphology of Case 7 to Case 9.
Processes 13 01710 g017
Figure 18. Scope of acid impact (concentration ratio) of Case 7.
Processes 13 01710 g018
Figure 19. Scope of acid impact (concentration ratio) of Case 8.
Processes 13 01710 g019
Figure 20. Scope of acid impact (concentration ratio) of Case 9.
Processes 13 01710 g020
Figure 21. The enhanced fracture conductivity of Case 7 to Case 9 after acid fracturing.
Processes 13 01710 g021
Figure 22. The wormhole morphology of Case 10 to Case 12.
Processes 13 01710 g022
Figure 23. Scope of acid impact (concentration ratio) of Case 10.
Processes 13 01710 g023
Figure 24. Scope of acid impact (concentration ratio) of Case 11.
Processes 13 01710 g024
Figure 25. Scope of acid impact (concentration ratio) of Case 12.
Processes 13 01710 g025
Figure 26. The enhanced fracture conductivity of Case 10 to Case 12 after acid fracturing.
Processes 13 01710 g026
Table 1. General parameters of simulation cases.
Parameter C f , i n  [kmol/m3]K ϕ m ϕ f
Value4.4178 (15 wt% HCL)Calculated0.01–0.040.90
Parameter μ w [mPa · s] a c  [kg/kmol] a v , m  [m2/m3] a v , f  [m2/m3]
Value1505000500
Table 2. The specific parameters of Case 1 to Case 3.
Specific ParametersCase 1Case 2Case 3
Main fracture permeability [D]51020
Equivalent fracture width [m]7.746 ×  10 6 1.0954 ×  10 5 1.5492 ×  10 5
Injection displacement [ m 3 / min ]1
Table 3. The specific parameters of Case 4 to Case 6.
Specific ParametersCase 4Case 5Case 6
Natural fracture density [m−2]0.050.10.2
Main fracture permeability [D]5
Injection displacement [ m 3 / min ]1
Table 4. The specific parameters of Case 7 to Case 9.
Specific ParametersCase 7Case 8Case 9
Natural fracture density [m−2]0.050.10.2
Main fracture permeability [D]10
Injection displacement [ m 3 / min ]1
Table 5. The specific parameters of Case 10 to Case 12.
Specific ParametersCase 10Case 11Case 12
Natural fracture density [m−2]0.050.10.2
Main fracture permeability [D]20
Injection displacement [ m 3 / min ]1
Disclaimer/Publisher’s Note: The statements, opinions and data contained in all publications are solely those of the individual author(s) and contributor(s) and not of MDPI and/or the editor(s). MDPI and/or the editor(s) disclaim responsibility for any injury to people or property resulting from any ideas, methods, instructions or products referred to in the content.

