Article

Investigation of the Convective Mass Transfer Characteristics in a Parallel-Plate Channel Flow Disturbed by Using a Selenoid Pulse Generator

by
Mehmet Emin Arzutuğ
1,2
1
Department of Chemical Engineering, Atatürk University, Erzurum 25240, Türkiye
2
Ener-KA Company, Ata Teknokent, Erzurum 25240, Turkey
Processes 2025, 13(6), 1700; https://doi.org/10.3390/pr13061700
Submission received: 2 May 2025 / Revised: 19 May 2025 / Accepted: 22 May 2025 / Published: 29 May 2025
(This article belongs to the Topic Advanced Heat and Mass Transfer Technologies, 2nd Edition)

Abstract

The continuous change in the entrance cross-section of a parallel-plate flow channel generally affects the mass and heat transfer on the walls of the channel. In this paper, an electrochemical parallel-plate flow channel equipped with a selenoid pulse generator has been developed to enhance the convective mass transfer on the walls of a mass transfer flow system such as an electrodeposition cell, absorption column, flow reactor, etc. A number of experimental studies have been conducted to determine the distribution of the mass transfer coefficients on the bottom wall of a parallel-plate channel for the flow conditions with/without a pulse in the research. Here, the distribution of the convective mass transfer coefficients has been determined by the electrochemical limiting diffusion current technique (ELDCT) using nickel local cathodes arranged on the bottom surface of the flow channel. The experimental results show the effects of the parameters used, which are the flow Reynolds number, opened/closed (OP/CL) ratio, and pulse number, on the distribution of mass transfer coefficients. The results have revealed that the pulse generator altered the flow structure and increased the turbulent intensity at Re < 2860 flow conditions. Within the range of Reynolds number 950 < Re < 2860, the mass transfer correlation was given as S h = 67.02 R e 0.897 O p C l 0.059 S c 1 / 3 . According to the research findings, the highest kM values were obtained at Re = 2860 with an (OP/CL) ratio of 1/2. If a parallel-plate flow reactor with a pulse generator is designed using these flow conditions, it will yield a reactor that is both more efficient and more compact than a reactor without a pulse generator.

1. Introduction

Mass or heat transfer through parallel plates and channels with square or rectangular cross-sections is frequently encountered in chemical engineering processes such as electro-organic synthesis, drying and evaporator systems, and humidification systems. It is also used in cleaning wastewater, hydraulic turbines, humidification, turbo machines, the air conditioning/ventilation systems of buildings, electroplating, plate heat exchangers, electrolysis in H2 gas generators, electrowinning, refining, etc. [1,2]. Since the usage of fluid flows in parallel-plate channels (reactors) is common in engineering systems, the determination of the distribution of the mass/heat transfer coefficient along the walls of these channels or flow reactors is important for the design of engineering systems. For the last 30 or 40 years, researchers working on mass and heat transfer processes have been particularly interested in research dealing with parallel-plate flow channels with mass transfer applications, with (and without) a chemical reaction.
An important parameter influencing mass transfer flux, besides the concentration gradient (Equation (1)), is the convective mass transfer coefficient at the interface between the wall and the liquid in the flow system. In addition, in a fluid flow system, the factors affecting the convective mass transfer coefficient (k) are related to the fluid properties and dynamic characteristics of the flowing fluid and the system geometry [3].
N A = k C A S C A
Provided that the fluid and channel geometry are fixed, if the flow regime within a channel is changed, the convective mass transfer coefficient also changes. If a flow breaker is placed in a flow channel, the flow geometry and the stack motion are affected accordingly, and the convective mass transfer coefficient also changes [3]. It is clear from the literature that the convective mass/heat transfer coefficients on the walls of parallel-plate channels (reactors) are increased with passive and active techniques. A few studies have reported in the literature that the mass transfer rate can be increased by the passive technique of placing a fixed step at the entrance zone of the channel [4,5,6,7,8,9]. Moreover, in the passive technique, a sudden expansion occurs behind the step, as a result of mounting a step to the entrance zone of a parallel plate channel with a constant cross-sectional area. After the flow separation occurs behind the step, a separation zone forms in the downstream region of the expansion. Thus, the fluid flow in the channel reconnects to the wall of the channel beyond the flow separation zone, and the boundary layer develops again. As a result, any sudden contraction or expansion of the flow cross-section area at the entrance region of the flow channel produces a separating–reattaching flow field that ensures powered turbulent flows. This abrupt change highly affects the flow characteristics adjacent to the channel wall along the channel. In addition, both the sudden contraction and expansion cause flow separation and subsequent flow merging phenomena in the low-pressure zone behind the blockage blade in the flow channel [4,10]. A significant result of flow separation is the formation and shedding of rotating fluid particles called vortices in the wake region. The periodic production of these downstream vortices is called vortex shedding [10]. Accordingly, vortexes and eddies continuously form in this region, which leads to an increase in turbulent intensity. Since the formation of vortices provides powered turbulent flow, the convective mass transfer increases in the vortex-formed regions through the walls of the parallel-plate flow channel.
The preliminary studies dealing with permanently changing the flow channel area are presented in the literature. For example, the full or partial blockage of the flow channel cross-section causes a sudden compression, while a full or partial opening of the flow channel cross-section causes a sudden expansion. These effects allow the formation of a fence or open cavity in the channel [4]. In this case, the passive-type mass transfer enhancement technique can be mentioned. Here, the crucial mechanism of mass transfer enhancement by mounting a step inside a parallel channel is to produce vortexes and eddies and to increase the turbulence intensity close to the channel walls, which can develop a mass transfer rate between the walls and the fluid. Similarly, vortex creation and mass transfer enhancement are also anticipated for a sudden contraction situation at the entrance zone of a parallel-plate channel. In flow systems, an increment in turbulence intensity increases the convective mass, heat, and momentum transfer between the fluid and the channel wall by deforming the mass, thermal, and velocity boundary layers and reducing the mass and thermal resistance [11].
Some researchers used a separating–reattaching flow configuration in the parallel-plate flow channel equipped with a step or backstep to enhance the mass transfer rate on the channel wall or electrodeposition processes [4,5,8,9]. Harinaldi has used a wall-slit jet inside the backstep parallel-plate channel to enhance mass transfer by controlling the turbulence intensity and turbulence kinetic energy of flow and altering the flow structure of the electrolyte flow [9]. Moreover, Harinaldi et al. have investigated the effects of turbulence generated by a wall recess mounted on the walls of the parallel-plate reactors that caused the contraction of the channel’s cross-sectional area on the convective mass transfer [5]. In another piece of research, Oduza et al. [4] have conducted a study to determine the effect of locating some obstructions in the shape of steps or fences inside of an electrochemical parallel-plate flow channel on local mass transfer coefficients. The researchers stated that the type, size, and position of obstructions used in the flow channel have largely affected the mass transfer rate. They have also recorded that higher fences have produced the stronger jet flow effects for a constant channel flow rate. Thus, a high fence causes higher mass transfer coefficients when it is compared with a small fence. In all the studies conducted by researchers to determine the distribution of the convective mass transfer coefficients in the parallel-plate cells, the ELDCT has been used [4,5,8,9]. In addition, it has been stated that the position of the reattachment point has been conveyed to the upstream zone of the channel [4].
Contrary to passive-type mass transfer, active-type mass transfer forms when the cross-section area at the entrance of the flow channel is changed continuously using a blockage blade, depending on the time or when a vibration is applied to the flow. In the present study using an active strategy, when the blocking blade goes down in the channel, the channel cross-section gradually contracts, and the flow accelerates. Then, the blocking blade is stopped at an appointed opening ratio. The blocking blade, which remains in this position for a certain period, suddenly opens and remains in that position for a certain period. In this case, the suddenly opened blade causes a sudden expansion, where the flow in the channel slows down. In other words, the flow constantly accelerates and slows down. When the two strategies are compared, in the passive strategy case although vortices form in a specific and fixed place beyond the sudden expansion point at a constant channel flow, in the active strategy case the vortices form in a wider region due to the change in the flow rate in the channel, and the size of these vortices can also change [9]. Generally, examples of changing the channel cross-sectional area electronically or mechanically can be encountered in the turbo systems of petroleum engines and flow systems. The frequency of changing the channel cross-sectional area drastically affects the fundamental flow characteristics and the performance of fluid machinery and heat transfer devices. Thus, it finds wide applications in many technical areas like chemical, mechanical, civil, aeronautical, and environmental engineering [4,5,8].
The number of mass transfer studies on flow separation using an active technique within parallel flow channels is limited in the literature. In a study carried out by Harinaldi [8] in order to improve the convective mass transfer characteristics, the fluid flow was exposed to an acoustic excitation by locating a loudspeaker at the entrance of the electrochemical parallel-plate flow cell, where the cross-section of the flow channel was expanded suddenly. The researchers used active and passive techniques to determine the distribution of the local convective mass transfer coefficients within the parallel-plate flow channel using ELDCT and locating local Ni electrodes in line at the bottom surface of the flow channel. In an experimental heat transfer study carried out by generating vibrations, one of the active techniques, the natural heat transfer occurring on a vibrating cylinder immersed in a tank full of water has been examined. It was observed that the natural heat transfer rate from the surface of a cylinder to a fluid under vibrating conditions is over 500% greater than that observed under non-vibrating conditions [12]. Researchers who studied the increment in the mass or heat transfer by using a sudden contraction with sudden expansion, turbulence promotor, rotating disc electrode technique have reached the following result: mass/heat transfer increased with an increasing Re number. Moreover, the researchers recorded that handling the acoustic excitation or turbulence promotors has a strong effect on enhancing the convective mass transfer coefficients in the case of a flow with a high Re number. However, the research results show that maximum convective mass transfer coefficients decreased with increasing Re numbers [1,2,6,7]. The researchers reported that the mass transfer coefficients increased with an increase in velocity, the side of the plate, and thickness of the plate and decreased with an increase in the distance of the plate from the entrance of the test section [1].
In this study, it is aimed to provide a higher mass transfer between the fluid and channel wall by actively affecting the flow by placing a blade connected to a pulse generator at the inlet section of the channel in parallel-plate channels (reactors) in a way that the method has not been used before in the literature. The use of pulse generators in mass transfer applications by integrating them into flow systems represents an innovative approach. However, several challenges have emerged with this system. Firstly, the primary challenge is designing and fabricating a pulse generator that can operate effectively in liquid and be integrated into the flow channel. Secondly, once the solenoid operates for an extended period, a heating issue arises due to the high current consumption. Addressing this issue is crucial for maintaining the continuity of the system. In the present study, all the problems mentioned above were solved. The results of this study will shed light on the design of more efficient parallel-plate gas–liquid absorbers, parallel flow electrolyzers, plate heat exchangers, and mass/heat transfer systems.

2. Materials and Methods

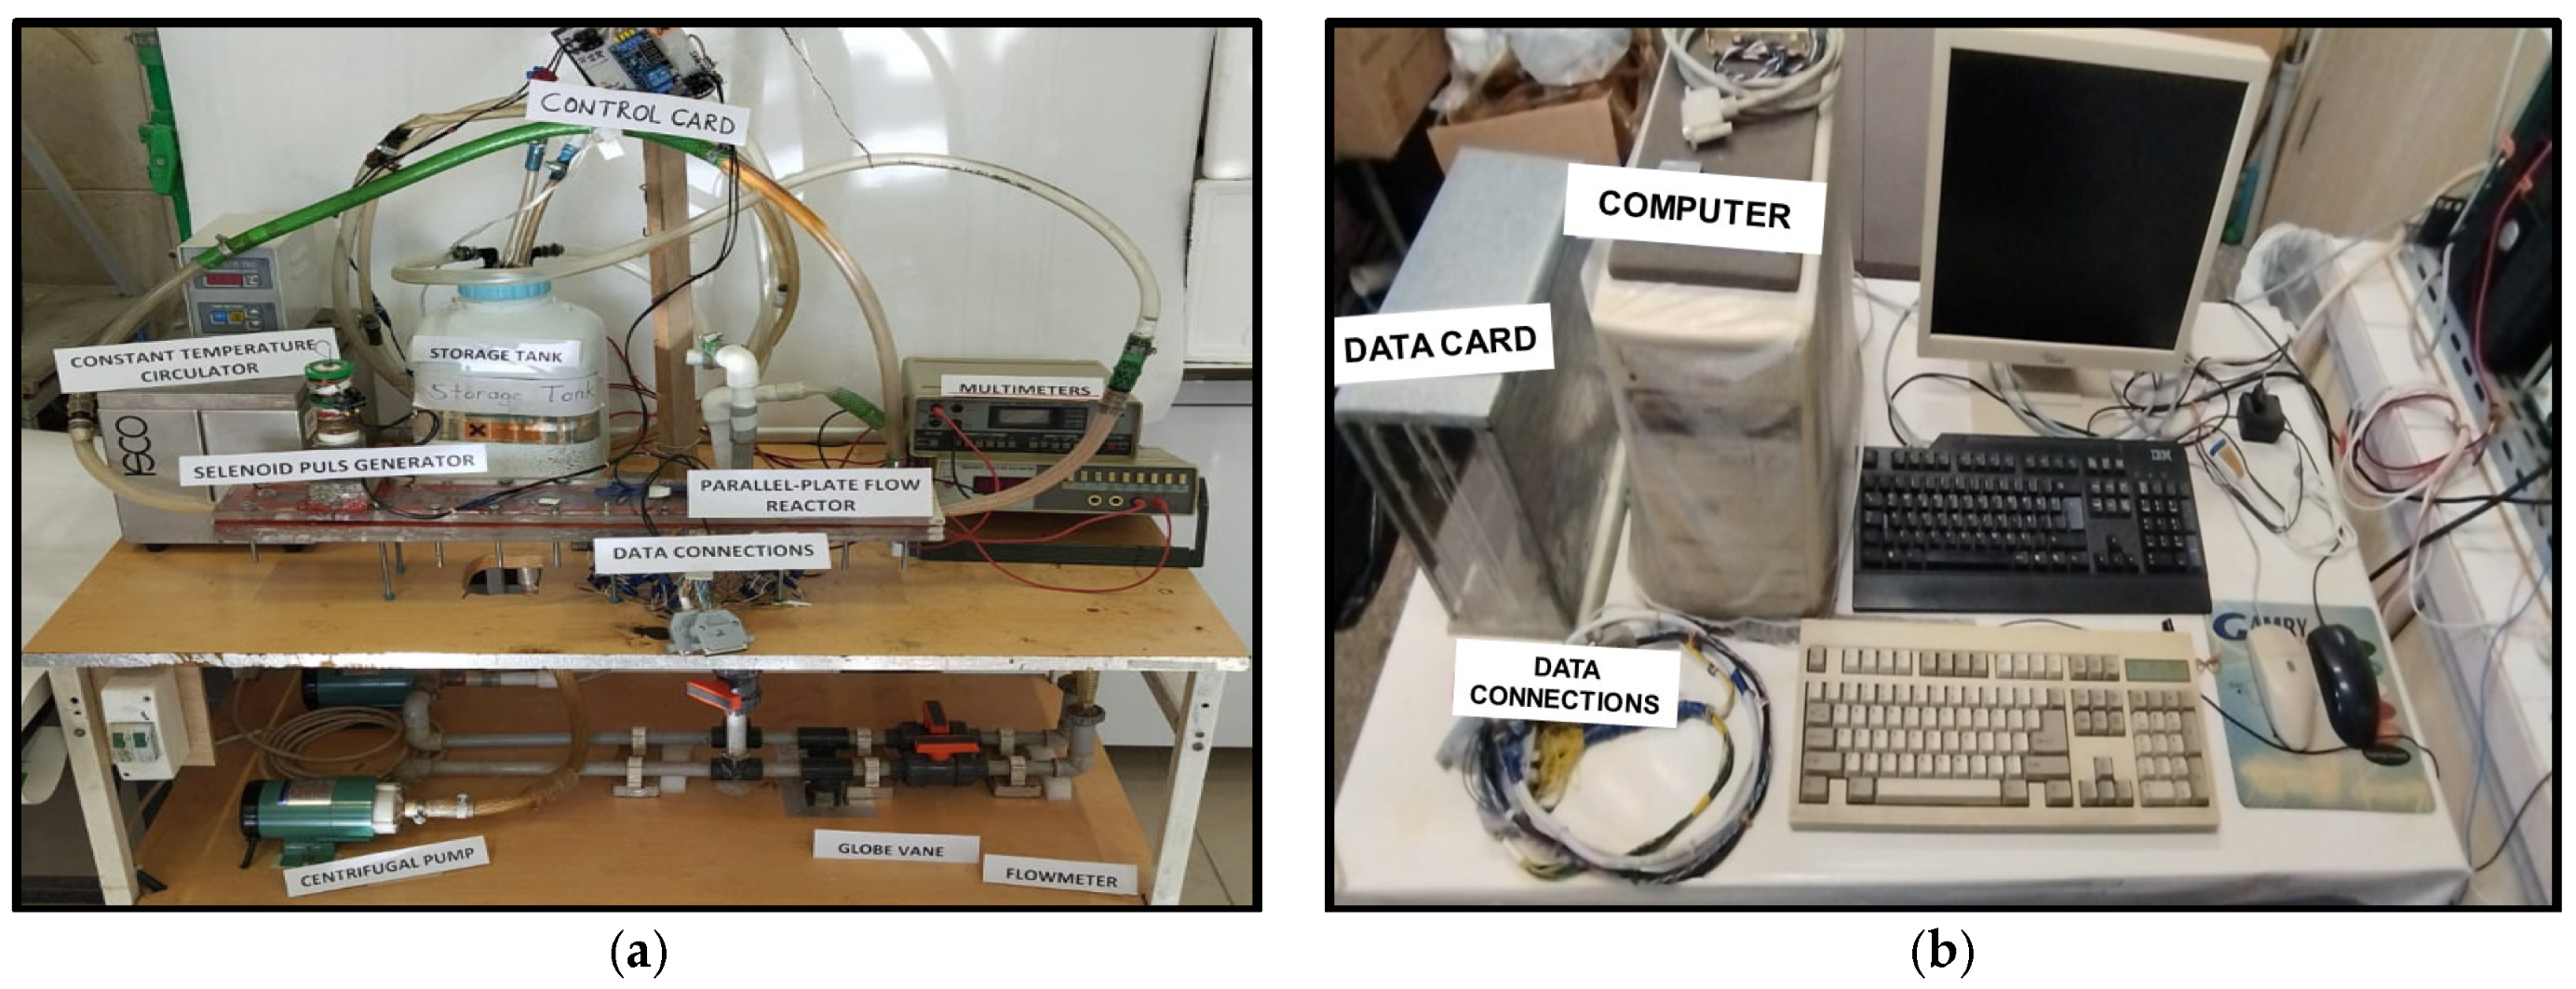
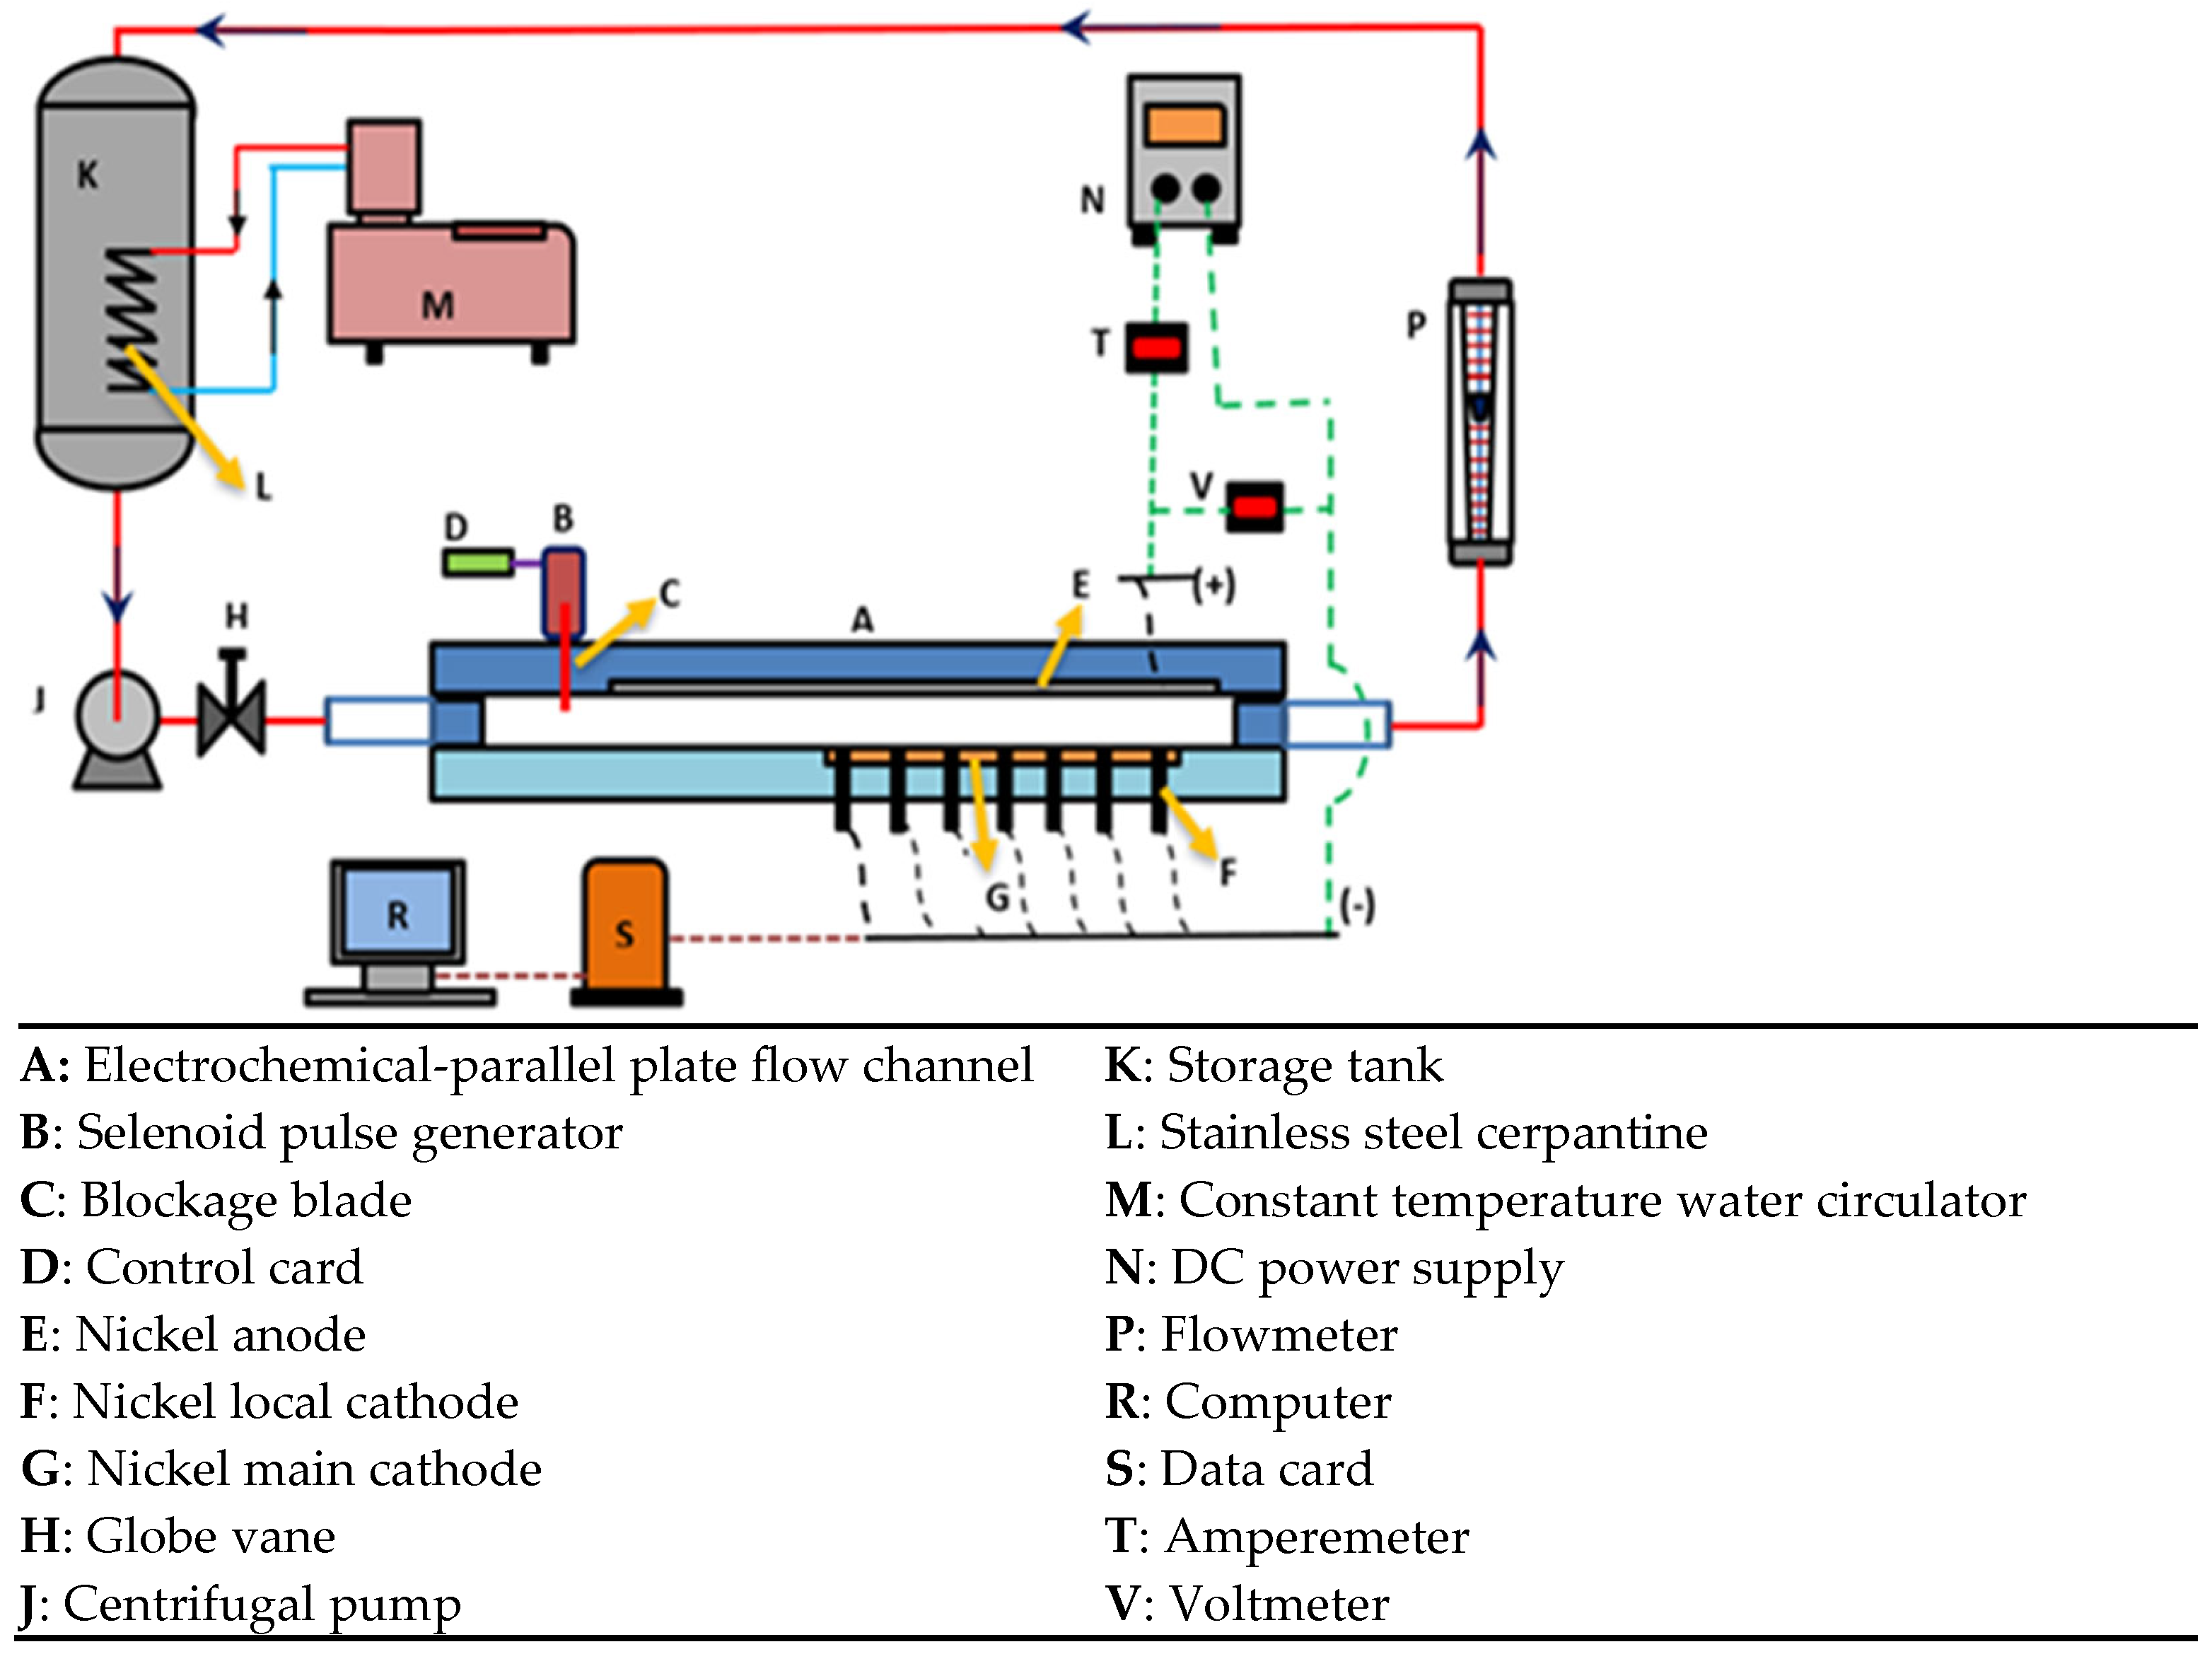
2.1. Experimental Set-Up

The photographs of the experimental set-up and PC-controlled data card measurement system and DC power supply (GwInstek, Shangai, China) unit are shown in Figure 1a,b. As can be seen, there is an electrochemical parallel-plate flow channel equipped with a selenoid pulse generator controlled with a control card. Moreover, the schematic diagram of the experimental set-up and all the components of the experimental flow system are shown in detail in Figure 2. In the experimental system, a PC-controlled PCL 818-HG data card (Advantech, Chongqing, China) was used to measure separately the current passing from the local cathodes. The measured current value for each local electrode is the moving average of 20 measurements, which are taken in 40 s. Moreover, a multimeter (Keithley, Cleveland, OH, USA) has been used to measure the voltage between the main cathode and anode. Voltage measurements were made to ensure whether the system was operating under limiting current conditions.
The experimental system is a closed and electrolyte-loop system. It has been designed to enable to electrolyte flow from a storage tank to a parallel-plate flow cell and to return to the storage tank again (Figure 1 and Figure 2).

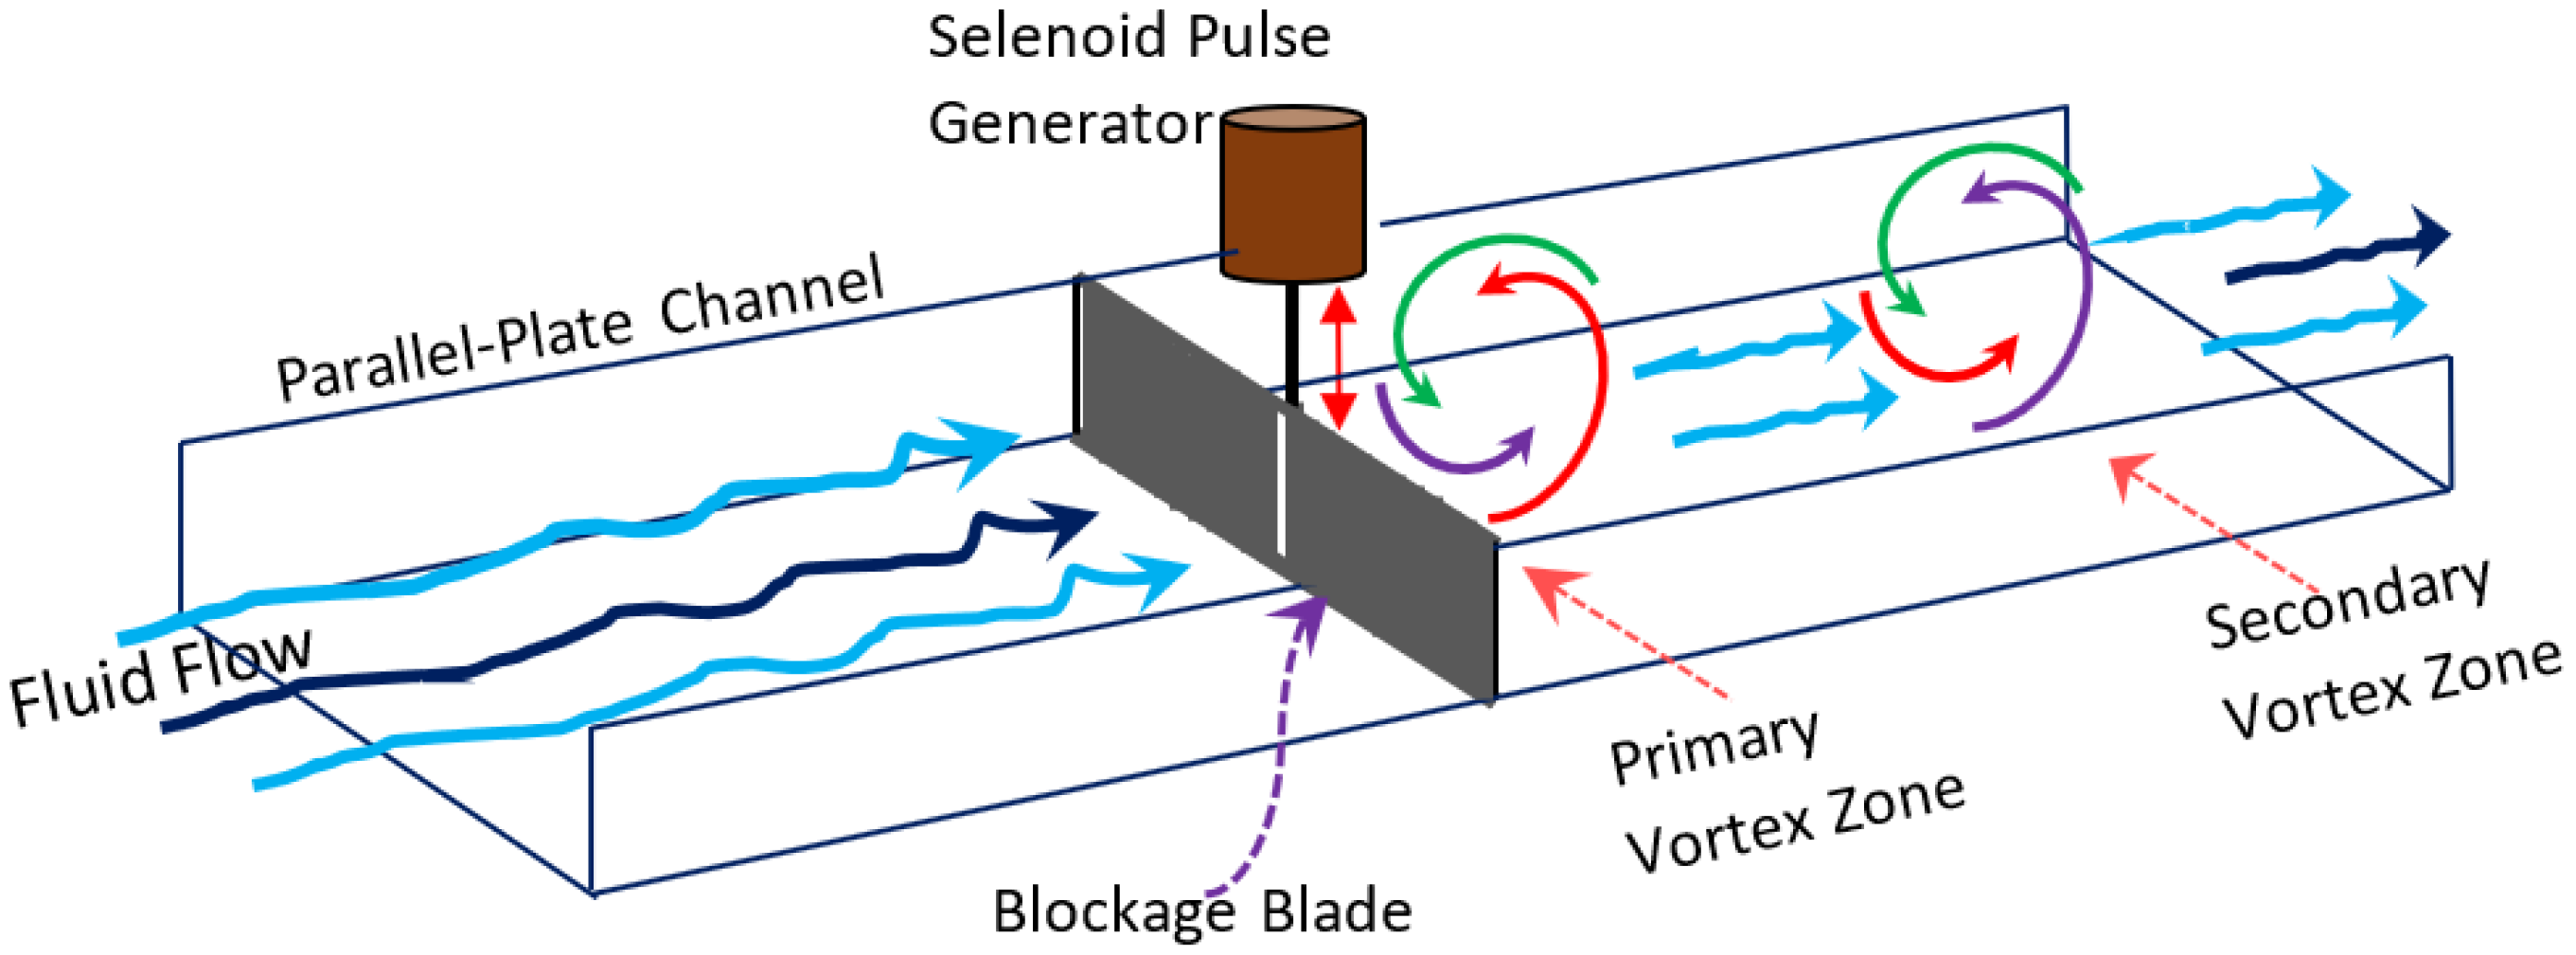
2.2. Selenoid Pulse Generator and Its Location in the Channel

Moreover, a blockage blade controlled by a solenoid pulse generator with a control card has been placed at the entrance section of the channel, which is 7 cm away from the channel entrance and 20.4 cm away from the test zone. Here, a blockage blade has been positioned perpendicular to the flow in the channel. Thus, it goes down completely to close the flow channel and goes up completely to open the flow channel (Figure 3 and Figure 4b). The height and width of the blockage blade are taken, respectively, as 1 cm and 4 cm in the experimental system.

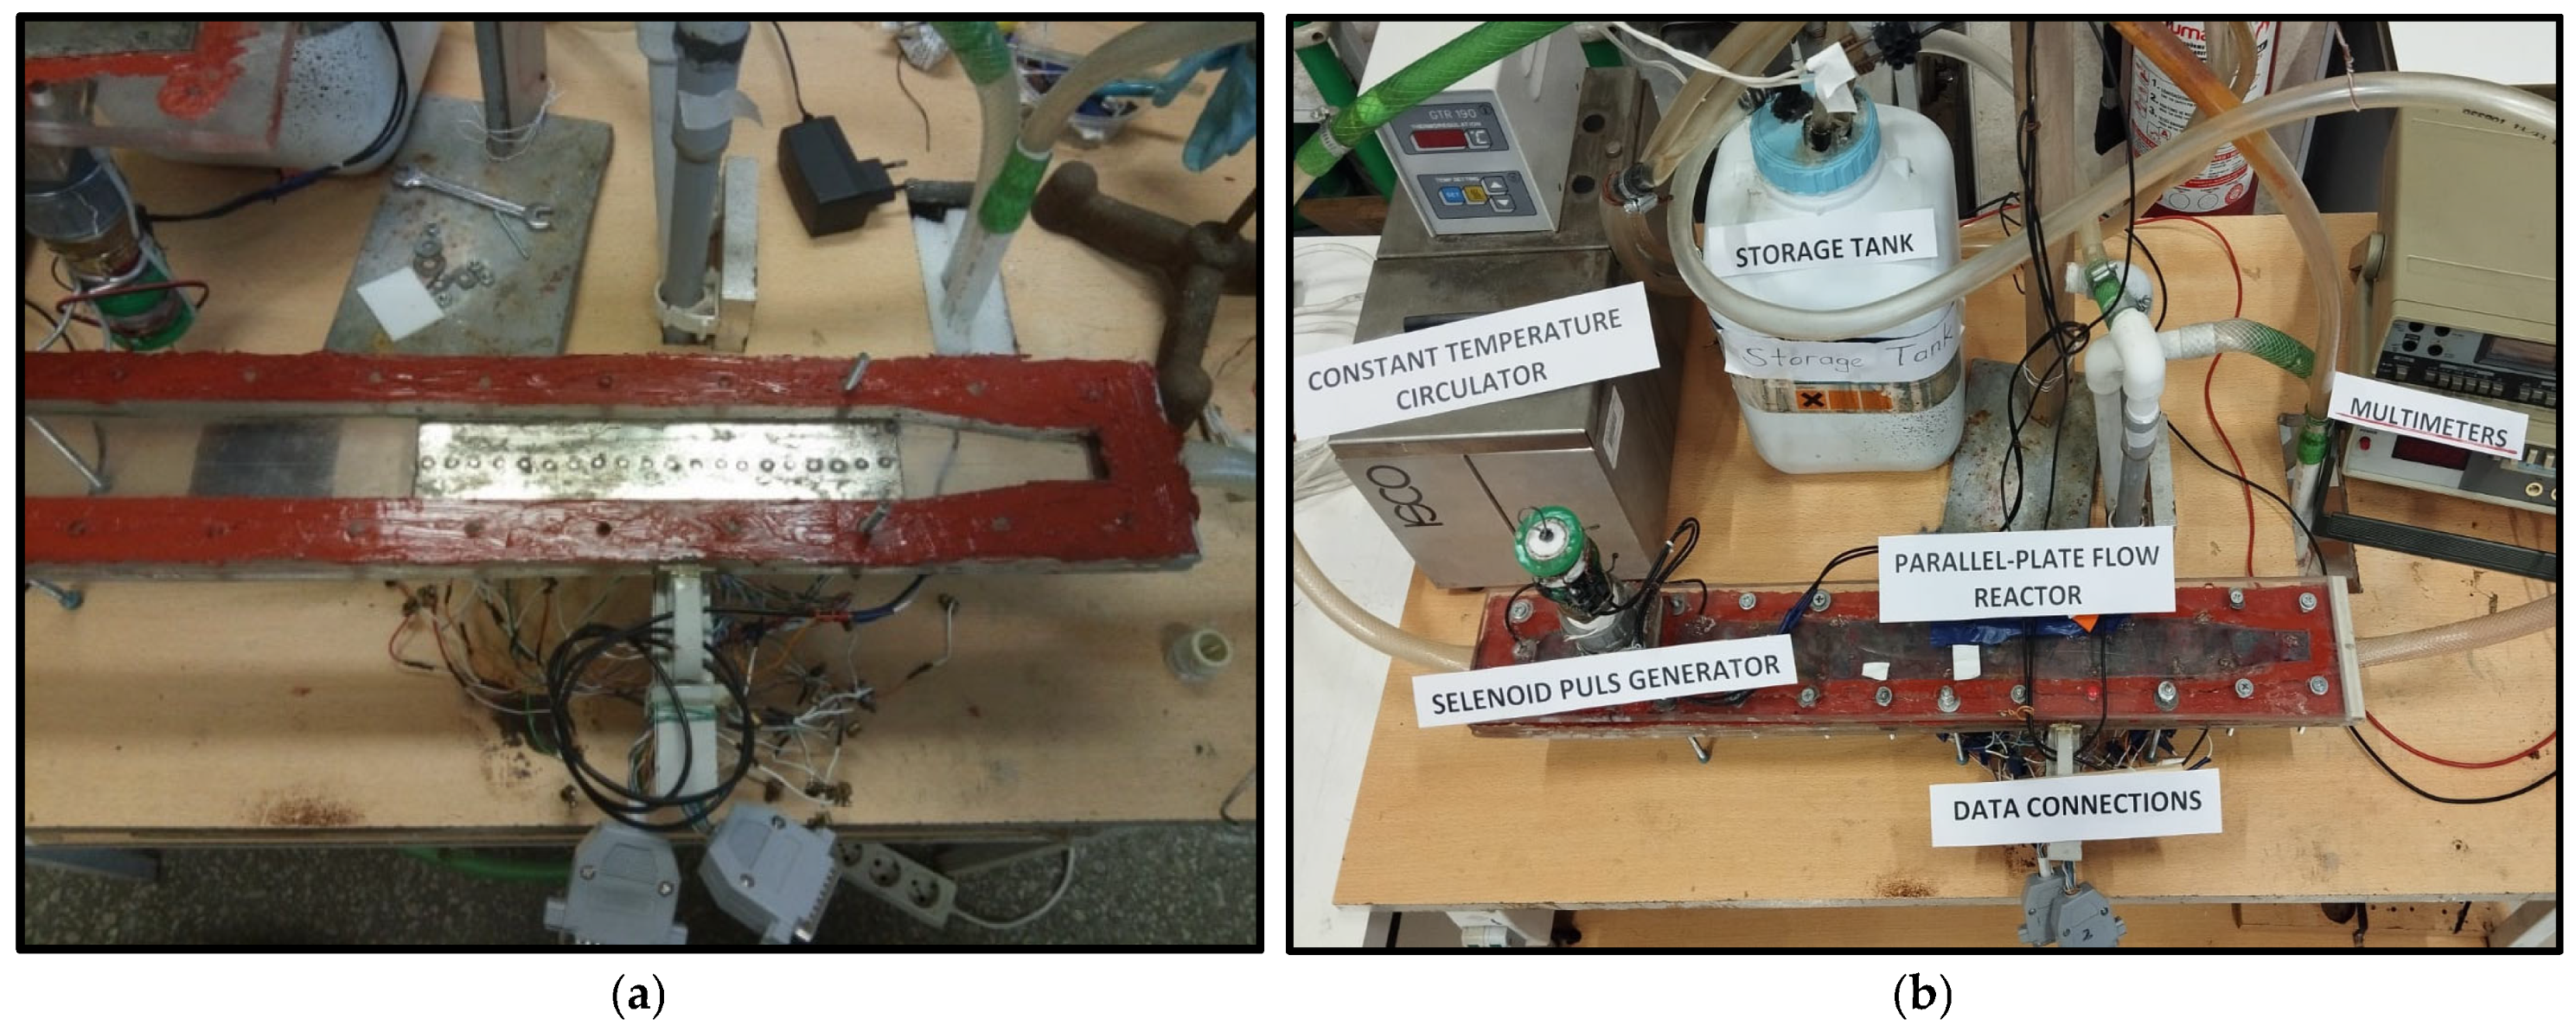
2.3. Parallel-Plate Flow Channel

As shown in Figure 4a, a flow cell with a rectangular cross-section was composed of plexiglass parallel plates, and the inside of the parallel-plate flow channel was 500 mm long, 40 mm wide, and 10 mm high. A nickel anode plate, 4 cm × 40 cm, was mounted inside the upper surface of the cell. A nickel-main cathode with dimensions of 4 cm × 20 cm was mounted on the bottom surface of the cell. Moreover, 20 local cathodes with a 2 mm diameter were located in holes drilled as 2.1 mm in diameter on the main cathode and insulated with epoxy resin. Here, the local cathodes were placed in the holes drilled over the surface of the main cathode in a way that the top surfaces of the local electrodes had the same level as the main cathode surface, using epoxy resin to prevent the degradation of the concentration boundary layer and ensure its continuity. The test zone was composed of the main cathode and 20 local cathodes (Figure 4a,b).
The test zone was placed in an area 27.5 cm away from the channel entrance and close to the channel exit to better monitor the flow-disruptive effects of the solenoid pulse generator. The local cathodes, anode, and the main cathode were made from 99.95% nickel supplied by the Goodfellow Company in Wrexham, UK. Mass transfer experiments were performed on this electrochemical flow cell with parallel-plate electrodes. Before the experimental measurements, all the precautions reported by Berger and Ziai were taken [13,14], and the active areas of the local cathodes were determined using the Cottrell equation [15]. The flow in the parallel-plate flow cell was provided using a centrifugal pump (Iwaki, Tokyo, Japan), and the volumetric flow rates were adjusted to the value giving the desired Re numbers in the channel using a flowmeter (Yokogawa, Tokyo, Japan) with a globe valve. The fluid supplied from the storage tank was pumped firstly to the flowmeter and then to the parallel-plate flow channel. Subsequently, the fluid was returned to the storage tank equipped with a serpentine and connected to a constant-temperature water circulator to provide continuous temperature conditions in the channel. Hence, the electrolyte temperature could be kept stable at 23 ± 0.5 °C by using a water bath with a circulator (Cole-parmer, Chicago, IL, USA).

2.4. Parameters and Levels Used in the Study

In the present study, the flow Reynolds number (Re), pulse numbers, and the channel opening ratio depending on the cross-sectional area of the flow channel have been chosen as parameters that affect mass transfer coefficients (Table 1). The Re number is calculated considering the channel hydraulic diameter, Dh = 1.6 cm. The channel opening ratio expresses the ratio of the channel cross-sectional area left open by the selenoid blade to the cross-sectional area when the channel is fully open. Here, the pulse number parameter shows the opening or closing numbers of the channel in 60 s.
The open and closed residence times of the parallel-plate flow channel controlled by the selenoid pulse generator and the dimensionless opening times are given in Table 2 below. According to the experimental design, the limiting current data were measured for each Reynolds number given in Table 1 at the open residence times of the channel specified in Table 2.
As is understood from Table 2, if the control card is programmed to provide the (OP/CL) = (0.5/1) ratio shown in Mode-1, the selenoid pulse generator first keeps the channel open for 0.5 s by pulling the blocking blade up and then closes it for 1s. Thus, the channel remains open for only 0.5 s during the total process of 1.5 s.
After ensuring that the blocking blade continuously opens and closes the flow in the channel, the limiting current values were measured by a PC-controlled data card during the flow conditions. Thus, the limiting current values were measured for all (OP/CL) ratios in Mode-1 and Mode-2 as shown in Table 2. Local limiting current values (ILC) were measured by 20 nickel electrodes with a diameter of 2 mm in the current measurement zone within the channel. Then, local convective mass transfer coefficients (k) were calculated by substituting these measured ILC values into Equation (4). Thus, the distribution of convective local mass transfer coefficients (k) was determined along the test zone in the flow channel. The limiting current values at each local cathode were taken using the Genie package program with the data card. The current value measured at each electrode represents the moving average of 20 pieces of data taken within 40 s. The active surface areas for each local electrode were calculated separately using experimentally measured current and time values according to the Cottrell equation [14,16]. The distance between each two local electrodes was adjusted to 1.0 cm, and 20 local electrodes were located in the holes on the main cathode. The dimensionless distances of the electrodes (z/H) arranged on the bottom surface of the channel have been determined in the range of 0.5–19.5.

2.5. Measurement Technique and Test Bench

Convective mass transfer coefficients have been determined using the ELDCT. The ELDCT has been used in several studies, and detailed information can be found in [4,5,6,8,9,16,17,18,19,20,21]. This technique is based on a diffusion-controlled reaction at the electrode surface. The cathode reaction of ferricyanide ion is given in Equation (2) and the reaction of ferrocyanide ion is given Equation (3). One of the most popular advantages of this technique is that, since the redox reactions occur at the anode and cathode, the ferricyanide concentration in the electrolyte does not change [18,19].
F e ( C N ) 6 3 + e   y i e l d s F e C N 6 4
F e ( C N ) 6 4 e   y i e l d s F e C N 6 3
Here, local mass transfer coefficients (k) have been calculated using Equation (4). Moreover, Equation (5) was used for the calculation of average mass transfer coefficients (kM) in the test zone with a length of L [22,23].
k = I L C n F A C
where ILC is the limiting current (ampere), A is the active surface area of local cathodes (m2), n is the number of the transferred electrons (n = 1 for the ferri-ferrocyanide redox reactions) in the electrochemical reaction, F is the Faraday constant (96,487 C mol−1), and C is the concentration of ferricyanide in the electrolyte (mol m−3). The average of the mass transfer coefficient (kM) values obtained versus the (z/H) values has been calculated using Equation (5) for each Re value [22].
k M = 1 L 0 L k d x = k d x d x
So that the concentration boundary layer, which develops on the main cathode, can develop without any interruption, the local electrodes are placed on the main cathode at the same level as the main cathode. This configuration allows limiting current measurements to be taken at local cathodes without interrupting and distorting the boundary layer formed on the local and main cathode. In this case, the distribution of the local mass transfer coefficients not only shows the mass transfer coefficient behavior on the surface but also its real value. The electrolyte used in the mass transfer measurement is a mixture of 5 mol m−3 potassium ferricyanide, 20 mol m−3 potassium ferrocyanide, and 500 mol m−3 potassium carbonate, which is a supporting electrolyte. All chemicals used is extra pure grade and Merck brend (Merck, West Point, PA, USA). The physical properties of the electrolyte are given in Table 3 [24].
The voltage values corresponding to limiting current values have been obtained experimentally at stagnant fluid conditions (Figure 5a) and flow conditions (Figure 5b) as 0.65 V and 0.75 V, respectively.
These values were measured using a DC power supply, a voltmeter, and an amperemeter, to ensure the most accurate results. These voltage values were determined as those corresponding to the midpoint of the plateaus in the graphs. The voltage–current data for flow conditions were graphed in 3 different Re values: the highest, the medium, and the lowest Re chosen in all Re values (Figure 5b).

2.6. Uncertainty Analysis

The error analysis of the experimental measurements for the present study is realized using a sensitive method called uncertainty analysis, defined by Kline and McClintoc, at a 95% confidence level [25,26]. Errors have been determined using the lowest counts and sensitivities of the measuring apparatuses used in the present study. The detailed error analysis for the present study is given in Table 4. For the given experimental conditions, the maximum uncertainty (WRe) is calculated as 6.4% in the Reynolds number, in the convective mass transfer coefficients (Wk) 5.7%, and in the Sherwood number as (WSh) 10.5% for Reynolds numbers less than 2860.

3. Results and Discussion

3.1. Effect of the Flow Re Number on the Distribution of Mass Transfer Coefficients

In experiments conducted under both no-pulse and fully developed flow conditions, maintaining a constant temperature of 23 °C in a parallel-plate channel, the convective local mass transfer coefficients (k) at various Reynolds numbers were plotted versus the dimensionless electrode distance values (z/H) (Figure 6). The local k values showed a wavy distribution, with a decrease towards the lower flow regions of the channel. The observed reduction in the mass transfer coefficient distribution along the flow direction within the channel is attributed to the increasing mass transfer resistance that arises from the development of the boundary layer over the lower plate of the channel. However, fluctuations in the convective mass transfer values can be attributed to changes in the channel’s cross-sectional area and to the challenges in sufficiently eliminating the roughness from the channel walls. Additionally, it was observed that the mass transfer coefficients measured along the channel increased with rising flow Reynolds (Re) numbers (Figure 6). In the graphs of Figure 6, the local mass transfer coefficients (k) corresponding to each (z/H) value were calculated using Equation (4), where (z/H) represents the dimensionless distance along the test zone, from the entrance to the end.
When analyzing the graphs under pulsed and non-pulsed flow conditions from experiments conducted at various (OP/CL) values, it was found that the distribution of convective mass transfer coefficients was higher in the pulsed flow condition compared to that of the non-pulsed flow condition. A study by Harinaldi [8] investigated the effect of acoustic excitation frequency on the rate of convective mass transfer, revealing that acoustic excitation frequency influences mass transfer similarly to pulsed flow, as observed in the present research. When the results of both active mass transfer enhancement techniques were compared, it was found that mass transfer distributions under pulsed flow conditions were higher than those reported by Harinaldi [8].
Here, the fluctuations in the convective mass transfer values can be attributed to vortex formations in the flow channel. Specifically, both the generated pulse flow and acoustic excitation have induced the formation of vortices, leading to increased convective mass transfer rates on the channel walls. The peak mass transfer coefficients observed in the ranges, where (z/H) are (10–15) and (2–5) for all the studied (OP/CL) ratios, indicate the formation of secondary vortices in the advanced regions of the channel after the initial primary vortex produced at the channel entrance. Although the calculated Reynolds number suggests that the flow is laminar, notable jumps in mass transfer coefficients have been observed in the vortex-formed regions as the vortex formations observed in the flow have turbulent flow characteristics.
In Figure 6a, for all Re values in the case of no pulsed flow, a mass transfer coefficient distribution is observed in the measurement region, decreasing exponentially from the channel inlet to the outlet. Although small increases are observed in the distributions of mass transfer coefficients in Figure 6a due to the increase in Re for no pulsed flows, significant increases are observed in the distributions of k due to the increase in Re for pulsed flows. The percentage increase in peak k values with an increase in Re from 950 to 2860 for no pulsed flow, where the value of (z/H) is 0, is given in Table 5 given below. In addition, the percentage increase in peak k values with an increase in Re from 950 to 2860 for pulsed flows having different (OP/CL) ratios, in the range of (z/H) 10–15, is given in Table 5 below.
From the graphs shown in Figure 6b,f, obtained at various opened-to-closed (OP/CL) ratios, it has been observed that the increase in Reynolds number (Re) significantly influences the distribution of the mass transfer coefficient (k). This effect is particularly evident when the (OP/CL) ratio is (5/1) (Figure 6c and Table 5). This behavior can be explained by noting that as the opened-to-closed time (OP/CL) ratio increases, the opening residence time gradually lengthens. In contrast, the closed residence time remains constant at one second.
As a result, we can obtain two key outcomes: first, a flow with a higher kinetic energy is established in the channel, and second, strong vortices are generated. Thus, the channel is reopened without giving these vortices sufficient time to fade, ensuring the cycle continues.

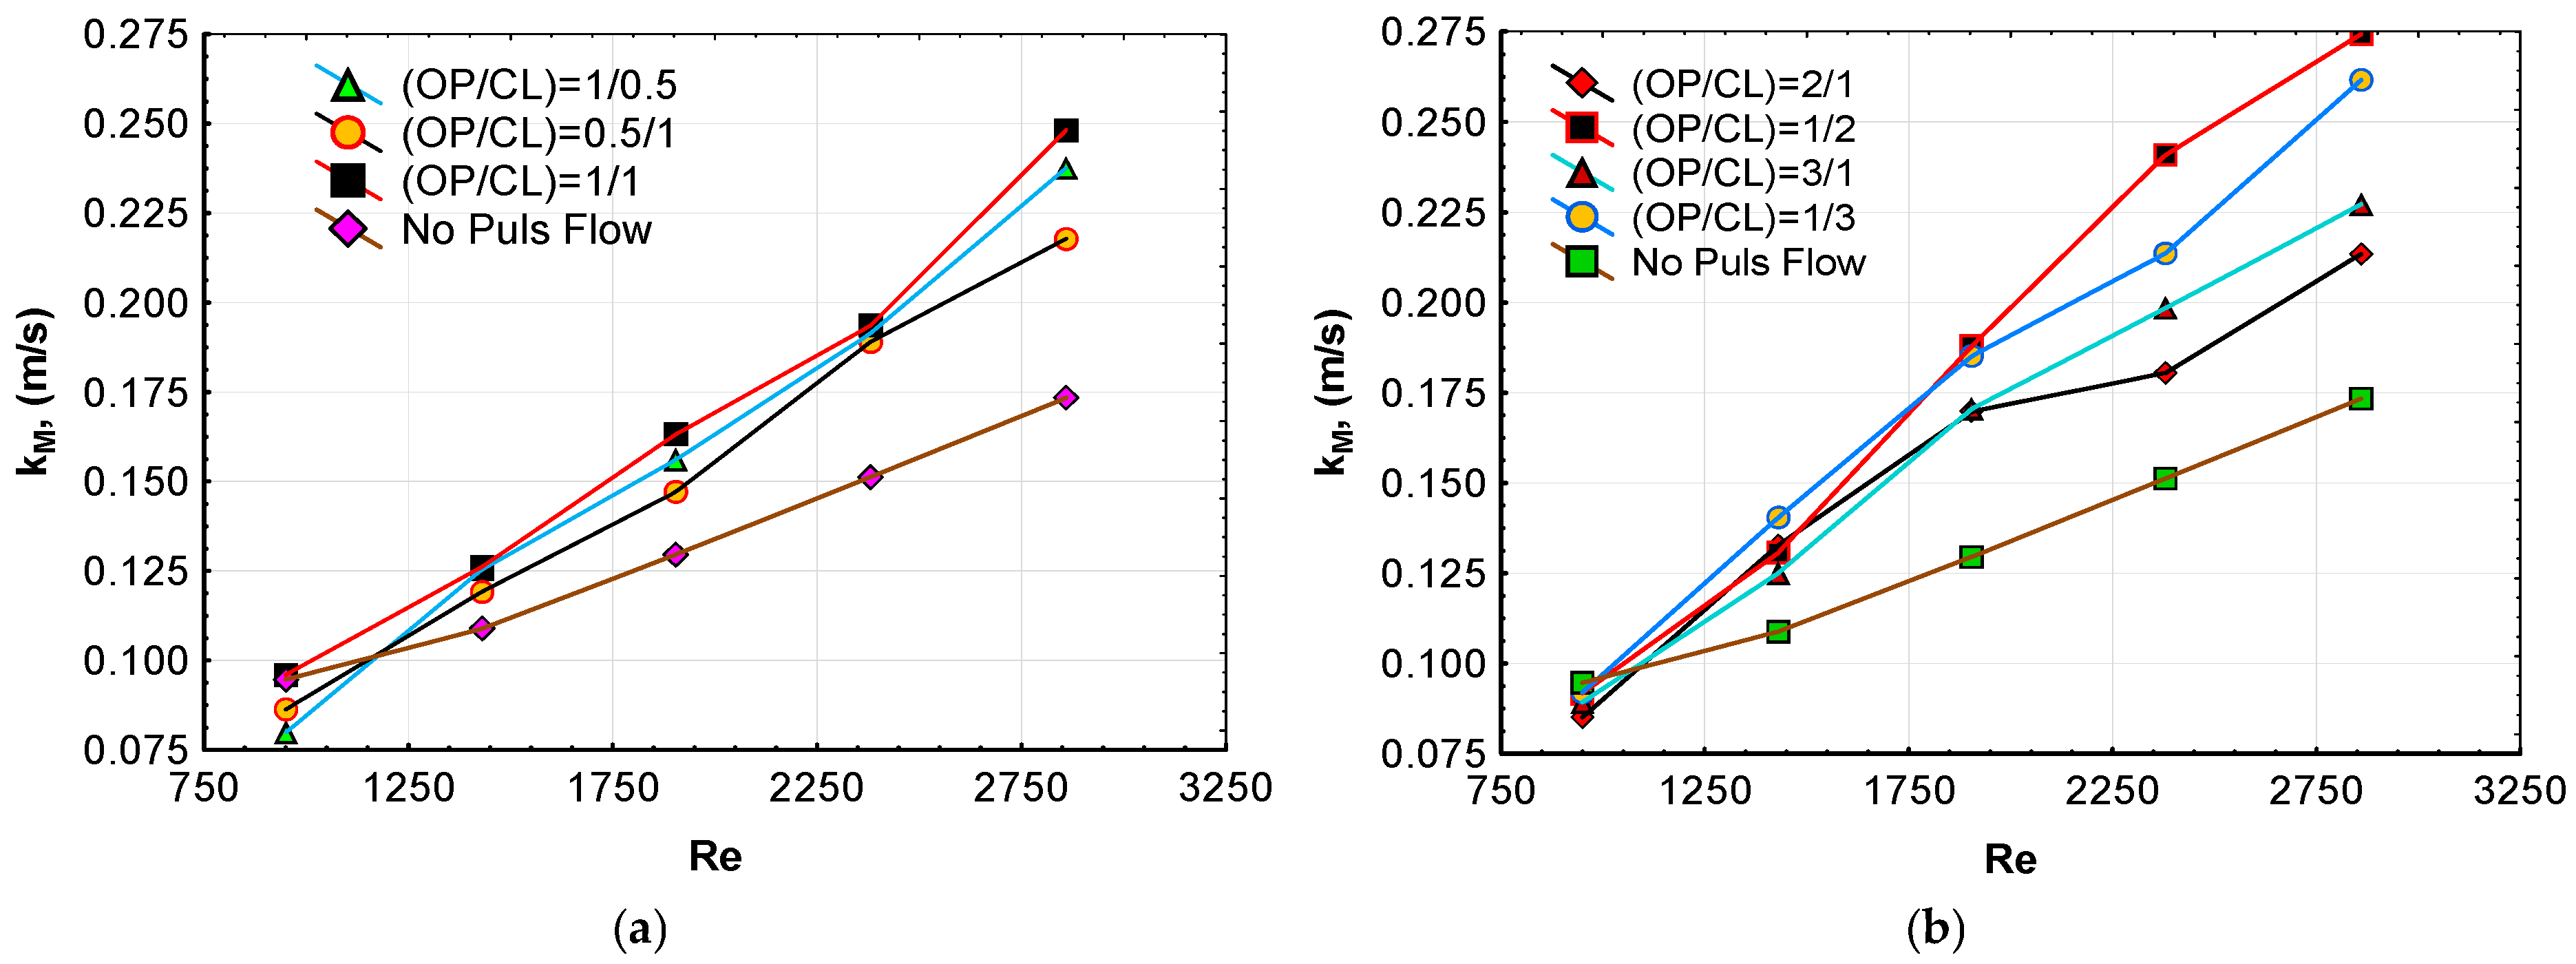
3.2. Effect of the (OP/CL) Ratio on the Distribution of Mass Transfer Coefficients

The blocking blade goes up and down momentarily. However, since the fluid flow rate fed to the channel by the pump is kept constant, and the cross-section of the channel narrows as the blocking blade descends, the flow gradually accelerates, and the flow stops when the channel is closed. On the other hand, as a result of the flow separation caused by the narrowing, primary and secondary vortexes are seen in the lower flow region of the separation place (Figure 7). Although the flow in the channel is in a laminar regime, the increment in the turbulent intensity created by the flow acceleration and vortices caused by the narrowing increases the mass transfer coefficient on the channel wall by deforming the boundary layer. Moreover, a weak vortex formation is also observed with the flow separation phenomenon in the fluid that undergoes sudden expansion due to the sudden opening of the closed channel. Therefore, a slight increase in mass transfer coefficients is observed due to the triggering of the formation of vortices. However, this increase is not as much as in the sudden contraction.
In the literature, it is stated by some researchers that firstly a flow separation occurs in the situation of fluid flow exiting the gap or in the situation of the flow produced in the nozzle. Secondly, a shear layer forms, and a recirculation region forms under the shear layer, which leads to the breaking down of large-scale vortices into smaller vortices. Moreover, it is stated that a shear layer develops on the channel wall, and flow reattaches at the downstream region of the duct, after a new boundary layer is formed along the channel [27,28,29]. In the present study, the blocking blade used both causes a sudden expansion and a sudden contraction. In this case, the same phenomena mentioned in the literature are also observed in the current study.
Here, the obtained mass transfer coefficient results for the channel flow with two pulse modes are compared. The operating modes are given in Table 2, comparatively. According to Table 2, since the open residence time of the channel is continuously increased in Mode-1, flow convergence can be expected somewhere in the downstream region of the separation point. However, since the closed residence time of the channel continuously increases in Mode-2, the formation of secondary recirculation zones is expected in the downstream region of the separation point.
The average of the local mass transfer coefficients (kM) corresponding to each (z/H) value for different Re numbers was calculated using Equation (5). These calculated average mass transfer coefficients (kM) have been graphed versus the Re number (Figure 8) for the pulsed and no pulsed flows with different (OP/CL) ratios shown in Table 6. Figure 8a shows kM distributions in the flows of (OP/CL) = (0.5/1), (1/0.5) and (1/1). When (OP/CL) is (0.5/1), the channel remains open for 0.5 s and closed for 1 s. Conversely, a different trend can be observed for the case of (OP/CL) = (1/0.5). In both operating modes, 40 pulses are generated for one operation minute in the channel (60 s divided by 1.5 s equals 40 pulses). In other words, flow separation occurs 40 times at the channel entrance in 1 min. When distributions of the mass transfer coefficients for the above-mentioned three ratios are compared (Figure 8a), it is seen that the highest mass transfer coefficient distribution can be obtained for a (OP/CL) = (1/1) ratio and all the Re values studied. Subsequently, in the case where (OP/CL) equals (1/0.5), it is understood that the distribution is higher than that of (0.5/1). This situation can be explained as follows: The number of pulses for a (1/1) situation is 30, and the number of pulses for (1/0.5) and (0.5/1) situations is 40. Although there was less flow separation in the (1/1) situation depending on the number of pulses, the channel remaining open for 1 s and closed 1 s allowed the production of stronger vortexes compared to (OP/CL) ratios of (1/0.5) and (0.5/1). In addition, the distribution of the mass transfer coefficients is lower in the (OP/CL) = (0.5/1) situation than that of the (1/0.5). This situation can be attributed to two main factors: First, the open residence time of the channel in operating Mode-1 is shorter than that of the value in Mode-2. Second, the flow rate in the channel is insufficient, which leads to a lack of severe vortex formation.
In Figure 8b, the kM distributions for the (1/2), (2/1), (1/3), and (3/1) ratios are compared. The figure indicates that the highest mass transfer coefficients are recorded for the (OP/CL) ratio of (1/3) up to Re = 1905. Close distributions of the mass transfer coefficients were observed for the other ratios. However, when the Re number is higher than 1905, the distributions of the mass transfer coefficients show a variation from high to low values for the (1/2), (1/3), (3/1), and (2/1) ratios. In the (1/3) situation in the flow range up to Re = 1905, the closed residence time of the channel is three times more than the open residence time of the channel (Figure 8b). At this point, since the blocking blade narrows the cross-sectional area as it descends, the flow accelerates, and flow separation occurs. Thus, the mass transfer coefficients have higher values due to the powered primary and secondary vortexes formed in the downstream region of the flow separation point. Even though the channel is closed, the effects of primary and secondary vortexes continue up to 3 s. In the (3/1) flow case, the channel remains open for 3 s, resulting in lower mass transfer coefficients compared to the (1/3) ratio. This phenomenon can be attributed to the longer time. In such a case, the channel remains open longer in the (3/1) than that of the (1/3), which prevents the formation of sufficiently strong vortexes. Hence, the flow shows an open channel character, and sufficient strong vortexes cannot be produced. In Figure 8b, as the Reynolds number (Re) increases (indicating a higher flow rate), and as the blocking blade gradually narrows the channel’s cross-sectional area in the region where Re > 1905, more acceleration and flow separation are observed compared to regions where Re < 1905. The higher distribution of mass transfer coefficients in this region can be attributed to the formation of primary, secondary, and even tertiary vortices in the further zone of the channel, resulting from flow separation.
In Figure 8c, the kM distributions have been compared according to four ratios: (OP/CL) values of (4/1), (1/4), (5/1), and (1/5). In this figure, the highest mass transfer coefficients up to Re = 2100 were shown for the (OP/CL) = (1/5), while the second highest was for the (1/4). However, both (OP/CL) ratios exhibited a very close distribution in the region where Re changes in the range of 2150–2550. Within the entire Reynolds range studied, the distributions of the third and fourth highest mass transfer coefficients were obtained for the (5/1) and for the (4/1), respectively. The lowest distribution of mass transfer coefficients was obtained for the non-pulsed flow within the Reynolds number range of 1450 to 3250. The higher mass transfer coefficient distributions found in the (1/4) and (1/5) ratios, compared to the (4/1) and (5/1), can be explained as follows: As the open residence time of the channel increases, fewer and less intense vortices form. This behavior resembles that of an open channel, which has no pulsed generator, as the channel’s open residence time increases.
In Figure 8d, kM distributions are compared for various (OP/CL) of (1/0.5), (1/1), (1/2), (1/3), (1/4), and (1/5). In the figure, the highest mass transfer coefficients at Reynolds numbers up to 1905 were recorded for the (OP/CL) of (1/5). Moreover, the highest values of k were found in the (OP/CL) of (1/2) for Re numbers higher than 1905. Conversely, the lowest mass transfer coefficients were seen for the (OP/CL) of (1/0.5). This behavior can be explained as follows: as the close residence time in the channel increases, stronger and more pronounced vortices develop at lower Re numbers, up to where the Re is 1905. In the faster flow region, where the Re number exceeds 1905, the (1/2) one leads to the formation of even stronger vortices.

3.3. The Effect of Pulse Number on the Distribution of the Mass Transfer Coefficients

In the mass transfer studies carried out in two different modes, the pulse number has been defined as the number of times that the blocking blade opens and closes the channel in a specific time interval, and an attempt was made to determine the effect of the number of pulses on the distribution of the mass transfer coefficient. Every pulse movement has a disruptive effect on the flow and boundary layer and causes flow separation. Therefore, the effect of pulse number on the distribution of the mass transfer coefficient had to be determined by taking into account the number of pulses occurring within the 60 s period (Table 6).
In Figure 9, the graph drawn considering the average mass transfer coefficient (kM) values versus the number of pulses at Re = 2860 shows that in a Mode-2-type flow, the highest value of k was achieved as 0.274 m/s for 20 pulses, and in a Mode-1-type flow the highest value of k was achieved as 0.248 m/s for 30 pulses. Notably, the Mode-2 type flow exhibited a higher distribution of mass transfer coefficients compared to the Mode-1 type flow in the range of 10 to 45 pulses. The difference can be attributed to the flow separation occurring within the flow channel in the Mode-2-type flow, which generates stronger vortices than those produced in the Mode-1-type flow. Here, the Re value of 2860 was chosen and used in Figure 10 because it was the highest value reached under the experimental conditions. KM values are averages of local mass transfer values corresponding to the constant pulse numbers, which are calculated for the (OP/CL) ratios used.
In the current study, the mass transfer coefficients obtained for pulsed flow conditions and non-pulsed conditions have been compared with each other. The distribution of the highest (peak) mass transfer coefficients versus Re under non-pulsed and pulsed conditions is presented in Figure 10. Since the highest mass transfer coefficients were obtained at an (OP/CL) of (1/2), this distribution was compared with the distribution of the no pulsed flow. The distribution of mass transfer coefficients for pulsed flow in the (OP/CL) = (1/2) situation was compared to that of no pulsed flow, and the increment ratios were determined by taking the increase in Reynolds (Re) numbers into account. According to Figure 10, at an Re number of 950, the mass transfer coefficient for the (OP/CL) = (1/2) overlaps with that of no pulsed flow. It was found that, when compared to non-pulsed flow, the distribution of mass transfer coefficients for pulsed flow at (OP/CL) = (1/2) increased with rising Re numbers, specifically by 120% at a Re of 1430, 145% at 1905, 159% at 2380, and 158% at 2860. On the other hand, mass transfer coefficients obtained under flow and stagnant conditions have been compared with each other in the literature. However, Harinaldi et al. reported that the peak (maximum) mass transfer coefficients at an Re value of 2856 increased by 25.5% compared to the no-flow condition [5,30]. So, the increment in the peak mass transfer coefficient compared with that of Harinaldi’s study was found as follows: it was 159% at a Re of 2860 for the present study, and it was 25.5% at a Re of 2856 for Harinaldi’s study. So, the results of the present study have accommodated those of the literature [5,30].
Moreover, a comparison similar to that conducted by Harinaldi was performed. It was found that the convective mass transfer coefficients obtained under pulsed flow conditions at an Re value of 2860 were approximately 14 times greater than those measured under stagnant electrolyte conditions. Here, since the convective mass transfer coefficients are calculated using the limiting current values, the comparison is based on these values. According to Figure 4, the limiting current values measured under the flow conditions were 14 times higher than those measured in a stagnant electrolyte.
In studies conducted by Oduza et al. [4], Harinaldi et al. [5], and Harinaldi [8,9], which aimed to enhance mass transfer in parallel-plate flow reactors, low mass transfer coefficients were observed due to the use of passive techniques. However, these studies are pioneering efforts and are commendable for providing valuable insights for future researchers.

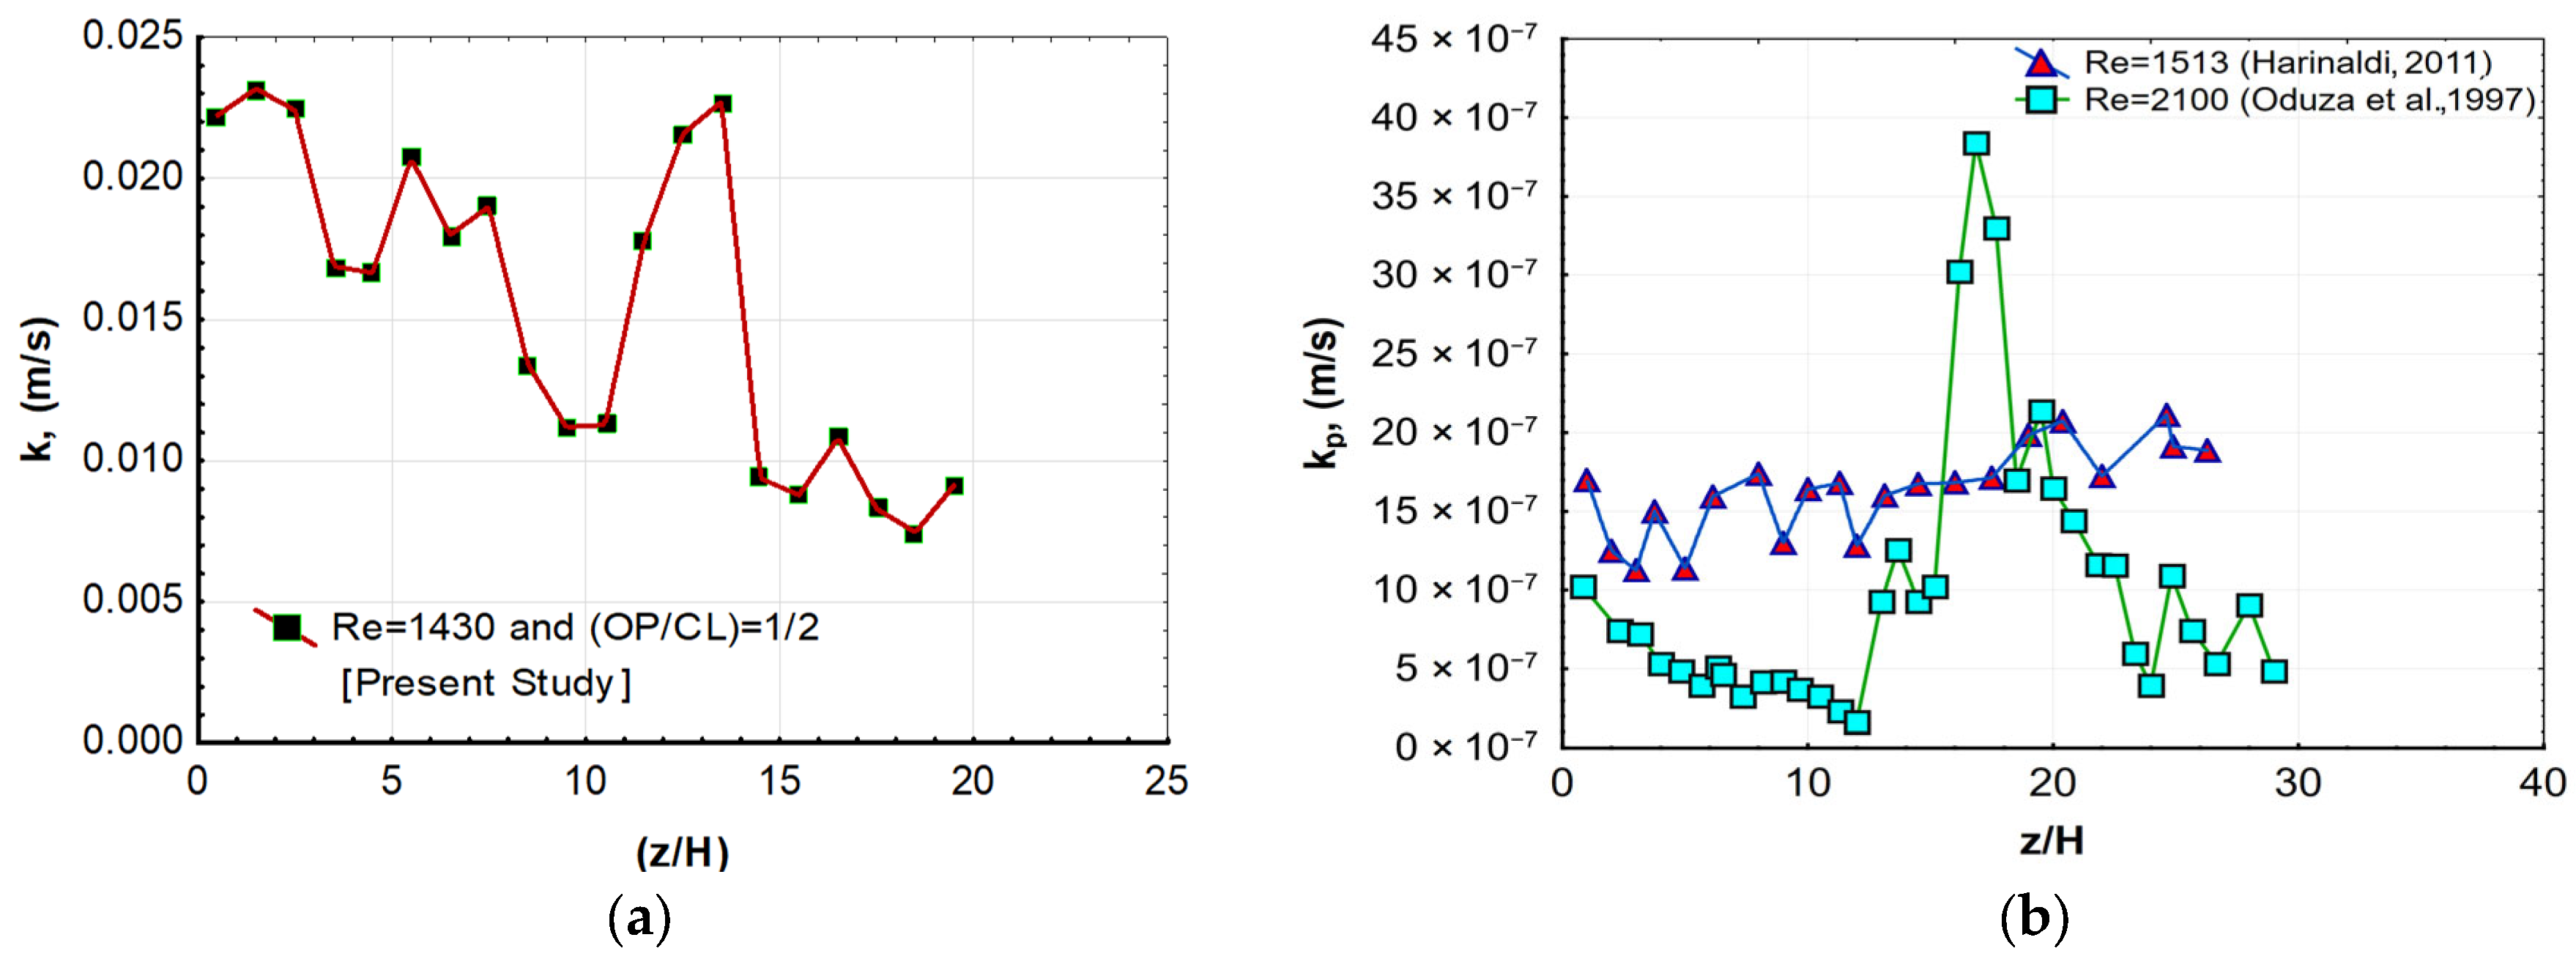
3.4. The Comparison of the Peak Mass Transfer Coefficient Values (kp) with the Literature Data

According to Figure 11a,b, the values of the peak convective mass transfer coefficient (kp) through the channel in the present study are 11,500 times higher than those of Harinaldi. Here, kp represents the peak (max) convective mass transfer coefficient.
When making comparisons between the two studies, the following points should be taken into account. Both studies utilized a parallel flow channel with an identical geometry and employed the ELDCT measurement technique. However, the current study implemented an active mass transfer increment technique, allowing for the continuous production of both sudden contractions and sudden expansions. In contrast, Harinaldi’s configuration consists solely of a sudden expansion with a slit jet, which is known as a passive mass transfer increment technique. As a result, the experimental system in the current study generates a more intense turbulent flow compared to Harinaldi’s experimental set-up [9].

3.5. The Turbulent Kinetic Energy Level for Channel Flow

The mean turbulent kinetic energy values measured at (z/H) = 0, where the blockage blade is located, versus the channel opening ratio values, have been graphed in Figure 12 for different Re numbers. Here, the mean turbulent kinetic energy values were calculated depending on the velocity values observed at various opening ratio settings [31]. In addition, the channel opening ratios represent the ratio of the cross-sectional area of the open channel to the cross-sectional area of the fully opened channel. In the figure, at a channel opening ratio of 0.25, a maximum of a 9.3 times increase in turbulent kinetic energy level was observed depending on the change in Re number from 950 to 2860. However, the maximum turbulent kinetic energy level was lower than 0.15 m2/s2 because of vortex formation in laminar flow conditions where Re values were lower than 2300. In the flow conditions of the transition region, where Re values were higher than 2300, the maximum kinetic energy values were 0.22 m2/s2 at Re = 2380 and 0.32 m2/s2 at Re = 2860. Moreover, it has been determined that these two kinetic energy values corresponding to Re values of 2380 and 2860 have increased by 1.6 times and 2.3 times, respectively, due to the strong turbulence formed in the flow, compared to the case where Re is 1905.
In the present study, we compared the maximum kinetic energy values measured versus the streamwise perpendicular axis at x = 0 for a channel Reynolds number (Re) of 1430 and an aperture ratio of 0.25 (Figure 12a) with those from Harinaldi’s study, where the measurements were taken at x = 0, Re = 1513, and a dimensionless speed value (Vr) of 1 (Figure 12b). While 0.08 m2/s2 was the maximum kinetic energy in the present study, the maximum kinetic energy value measured in the study of Harinaldi was 2.86.10−3 m2/s2 [9]. Based on these results, the flow kinetic energy measured in the case of sudden expansion–contraction using the active technique in the present study is approximately 27 times greater than the kinetic energy measured in Harinaldi’s study, which involved only sudden expansion using a slit jet at the entrance of a parallel-plate flow channel (Figure 12b). Considering that the channel cross-sectional area (1 cm × 4 cm), the measurement technique and the channel geometry were the same in both studies, the difference can be explained by forming a stronger vortex due to the pulse generator used in the current study.

3.6. Sherwood Correlation

Here, the value of the correlation coefficient (r2) is found to be 0.98 for Equation (6). The local Sherwood numbers based on the hydraulic diameter (DH) of the channel are plotted as a function of the Re and (x/DH) in Figure 13.
S h = k D D A B = 67.02 R e 0.897 O p C l 0.059 S c 1 / 3
In Figure 13a, log [Sh Sc−0.33] values at different (OP/CL) ratios are plotted versus log(Re) values for the present study. As a result of the research conducted to compare the results of the present study with literature data, no study was found in which the flow was disturbed using a blocking blade controlled by a pulse generator.
However, the results of the present study have been compared with the results of the studies whose channel geometries are similar, by Oduza et al. [4] as well as by Harinaldi [9]. In the study conducted by Oduza et al. [5], log[Sh Sc−0.33] values were plotted versus log(Re) values in a channel narrowed by a 7.5 mm high fence (Figure 13b). Moreover, in research conducted by Harinaldi [9] (see Figure 13b), log[Sh Sc−0.33] values have been plotted versus log(Rejet) values in the channel, a channel equipped with a 5 mm high step and a slit injection port of 1 mm. It can be seen from Figure 13a,b that, almost in the same Re range, the log[Sh Sc−0.33] values are higher for the present study than those reported by Harinaldi et al. and Oduza et al. Furthermore, it is clear from these figures that the graphs of the present study are quite compatible with that of Oduza et al. in the same Re range. In conclusion, the findings of the present study exhibit a similar distribution to those of Oduza et al. [4].

4. Conclusions

In the study conducted by Oduza et al. [4], log[Sh Sc−0.33)] values were plotted versus log(Re) values in a channel narrowed by a 7.5 mm high fence (Figure 13b). In the situation of the passive strategies used, the modification of the interface of a mass/heat transfer system is made using some materials with a different geometry inserted where mass/heat transfer has occurred. These materials increase turbulence in the flow, while they reduce the kinetic energy of the flow. Thus, in the case of passive strategies, the amount of transferred mass/heat is limited. However, contrary to passive strategies, as an external power source, a selenoid is used on top of the flow channel in active strategies. Since an external power source is used, the amount of mass/heat transferred is higher than the amount achieved in passive techniques.
The effects of the flow Re number, the (OP/CL) ratio, and the pulse number on the convective mass transfer coefficient distribution (k) in the parallel-plate flow channel were investigated at tconstant flow rate conditions. The conclusions are listed as follows:
(1)
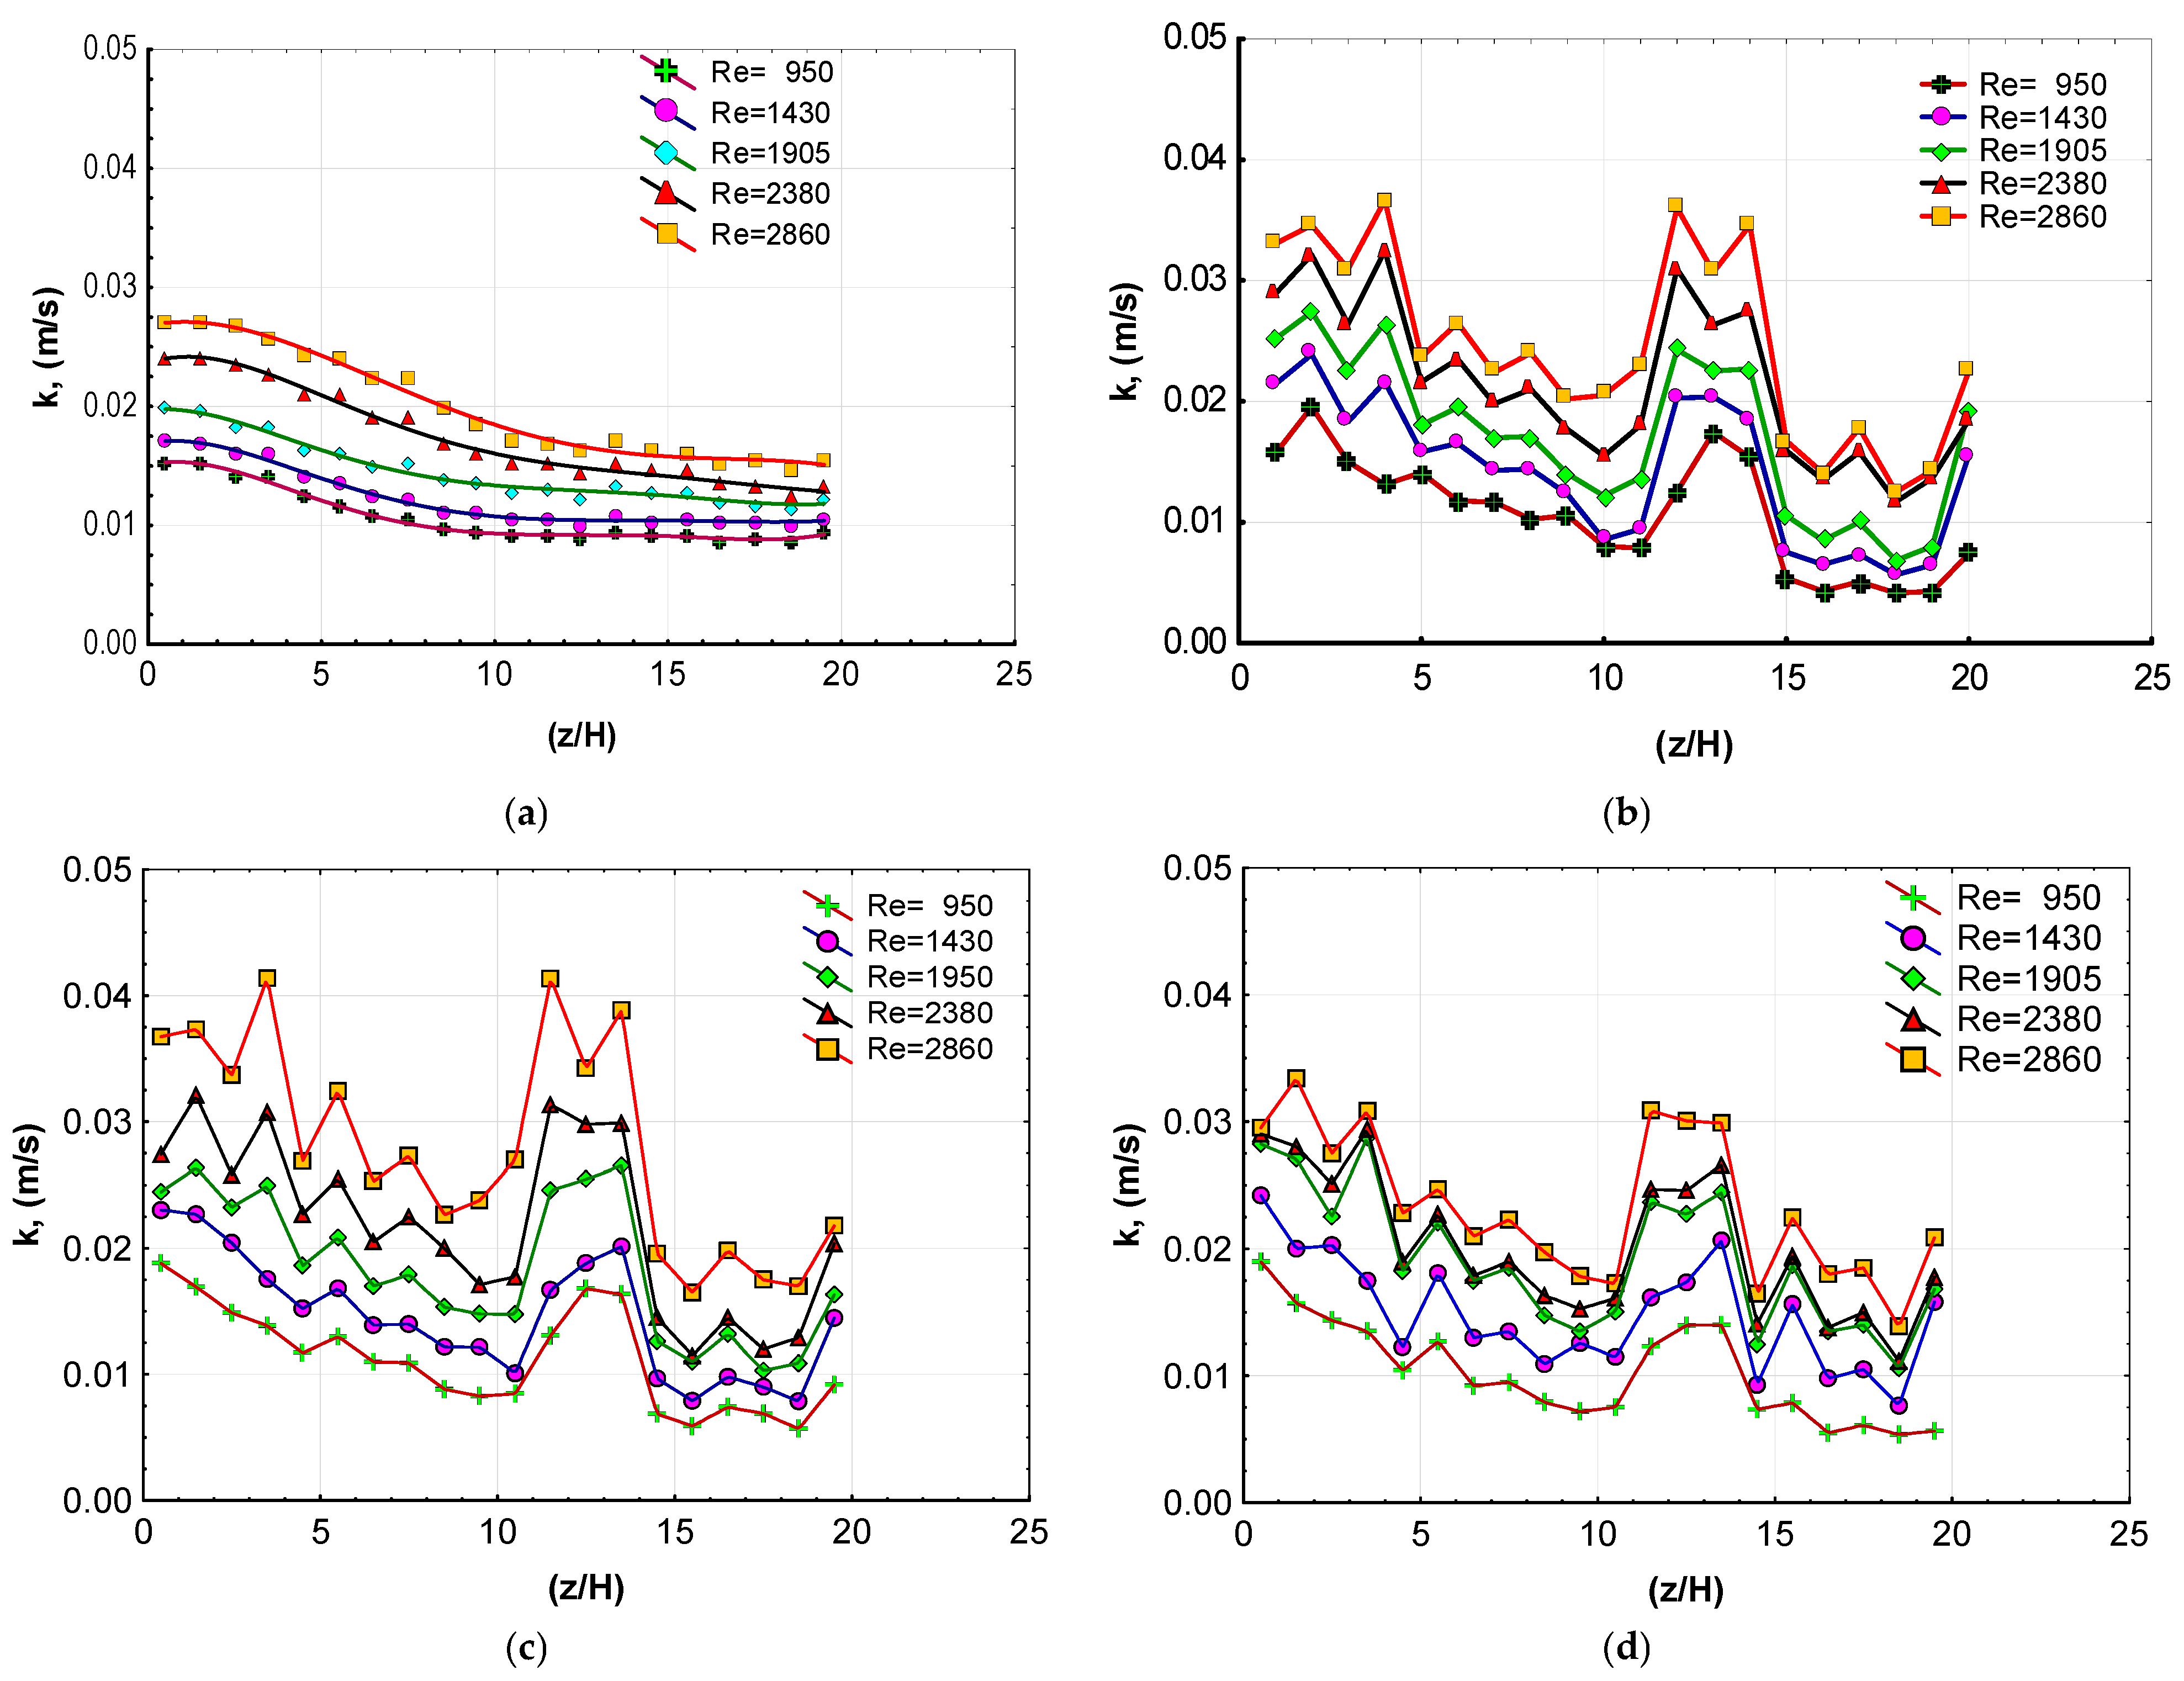
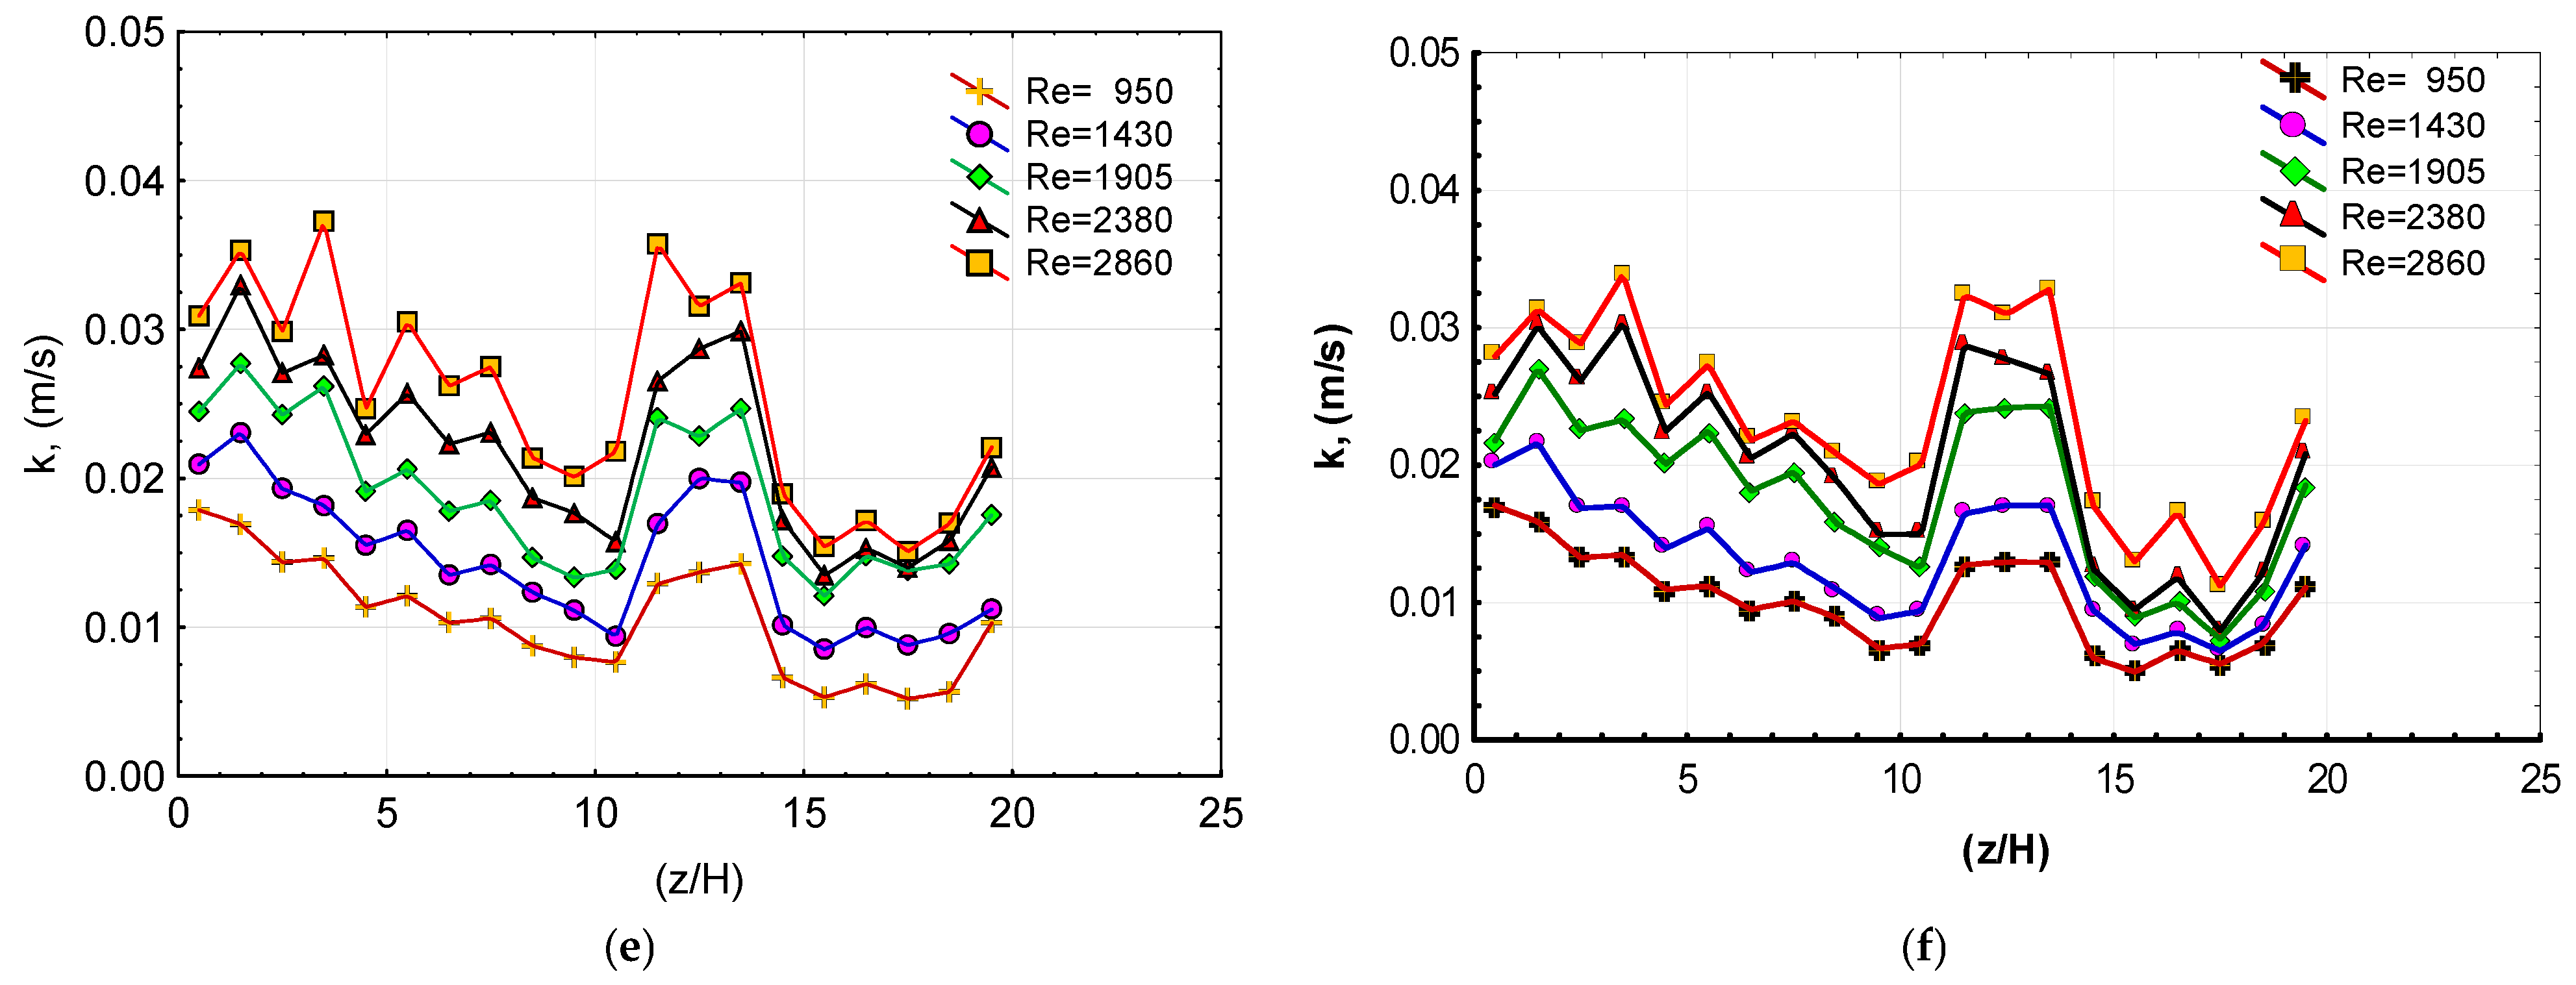
An attempt was made to determine the effect of Re by considering the Mode-1 values in Table 6. The highest k distribution was obtained at Re = 2860 at the (1/1) situation. It was found that the distributions of k versus (z/H) increased as the Re values were increased from 950 to 2860;
(2)
The effect of the second parameter, the (OP/CL) ratio, was evaluated on the mass transfer coefficient (k) across the entire range of Reynolds numbers studied. The results indicated that the highest mass transfer coefficients, up to Re = 1905, were achieved at an (OP/CL) of (1/5). In contrast, for Reynolds values greater than 1905, the highest mass transfer coefficients were attained at an (OP/CL) of (1/2). Conversely, the lowest mass transfer coefficients were recorded for an (OP/CL) of (1/0.5) across the entire range of Re numbers;
(3)
Additionally, an investigation into the effect of the pulse number on mass transfer coefficients at Re = 2860 revealed that the Mode-2 flow produced higher average mass transfer coefficient (kM) values compared to Mode-1 within the 10–45 pulse range;
(4)
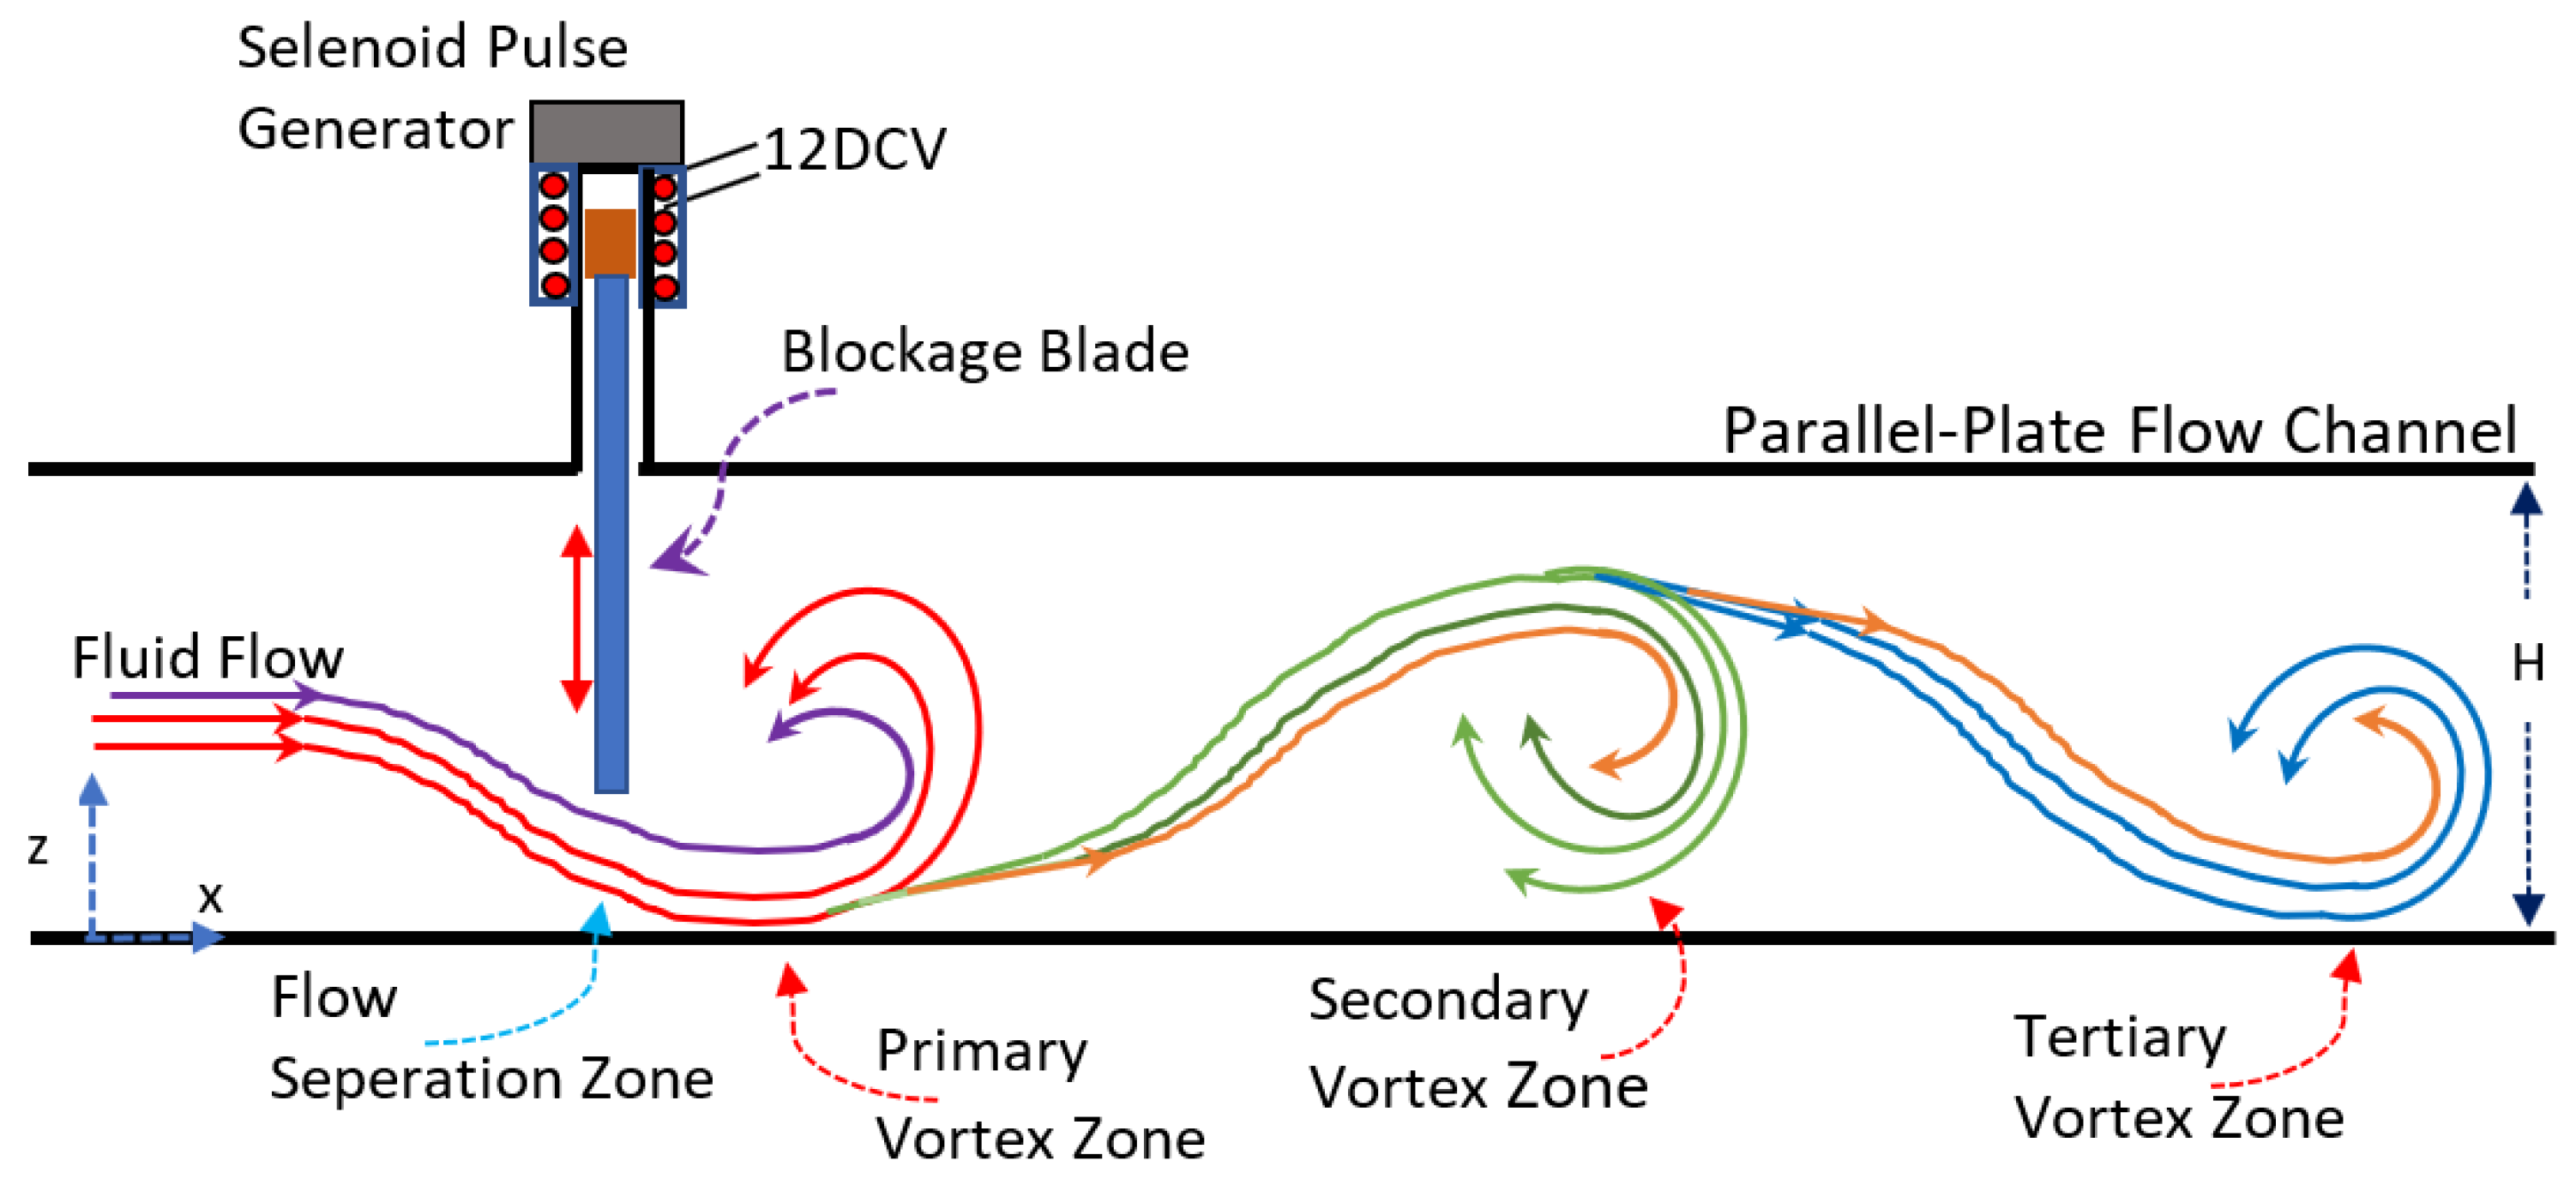
Inserting one or more selenoid pulse generators in a parallel-plate flow channel (reactor) has increased the convective mass transfer rate significantly. Although only the laminar flow conditions have been supplied in the parallel-plate flow channel, the convective mass transfer rate has increased because of vortices produced by a selenoid pulse generator;
(5)
It was concluded that the flow kinetic energy measured using an active technique in the present study was approximately 27 times greater than that recorded in Harinaldi’s study [9], which utilized a passive technique;
(6)
In the literature [5], it has been observed that the convective peak mass transfer coefficients increased by 25.5% for a Reynolds value of 2856 compared to the no-flow condition. In the present study, for a Reynolds number of 2860, the mass transfer coefficients for the pulsed flow with (OP/CL) equals (1/2) increased by 159% compared to the no pulsed flow.
Based on the experimental data obtained, it was concluded that utilizing the selenoid pulse generator in a parallel-plate flow reactor would enable the development of more effective and compact mass transfer equipment.

Funding

This research was carried out in the scope of the “Electronic Flow Control System for Providing Heat Economy in Gas and Liquid Fuel Fed Boilers” Project with the number MAR-P14, supported by Ata-Technokent. Moreover, this study is supported financially by the Ener-KA Engineering Company located in the Ata-Technokent Campus. The author would like to express thanks for their financial support. EnerKA company IBAN number as follows: TR40 0001 2001 6770 0032 0000 24.

Data Availability Statement

The data presented in this study are available on request from the corresponding author. (IA patent application will be made in the future).

Acknowledgments

During the preparation of this manuscript/study, the author did not use an artificial intelligence program for any purposes. The author has reviewed and edited the output and takes full responsibility for the content of this publication.

Conflicts of Interest

Author Mehmet Emin Arzutuğ is the founder of the Ener-KA Company. Ener-KA En-gineering Company has role in the design of the study; in the collection, analyses, or interpretation of data; in the writing of the manuscript; or in the decision to publish the results.

Abbreviations

The following abbreviations are used in this manuscript:
ELDCTElectrochemical limiting diffusion current technique
OP/CLOpen/closed ratio
z/HDimensionless distance along the channel
HThe channel height, m
zLength of measurement area in flow direction, (m)
LLength of test zone
DCDirect Current
PCPersonal computer
kLocal convective mass transfer coefficient, (m/s)
kpPeak convective mass transfer coefficient, (m/s)
kMMean convective mass transfer coefficient, (m/s)
ILCThe limiting current, A
AElectrode active surface area, m2
nNumber of transferred electrons in redox reaction
FFaraday coefficient, 96,487 C mol−1
CBulk concentration of ferricyanide in the electrolyte, (mol m−3)

References

  1. Seetharama Rajua, D.S.; Gangadharb, M.; Nageswara Raoa, V.; Chitti Babua, N.; Raoa, P.J. Mass Transfer with Equilateral Triangular Plate as Turbulence Promoter in Circular Pipe. Int. J. Mod. Eng. Res. (IJMER) 2012, 2, 3281–3288. [Google Scholar]
  2. Turgut, O.; Khastar, F.; Gültekin, A.M. Dikdörtgen Kesitli Kanallarda Laminer Akış ve Isı Transferinin Sayısal Olarak İncelenmesi. Suleyman Demirel Univ. J. Nat. Appl. Sci. 2014, 18, 22–29. [Google Scholar]
  3. Geankoplis, C.J. Principles of Unsteady-state and convective mass transfer. In Transport Processes and Unit Operations, 3rd ed.; Prentice-Hall International Inc.: Englewood Cliffs, NJ, USA, 1993; pp. 432–475. [Google Scholar]
  4. Oduoza, C.F.; Wragg, A.A.; Patrick, M.A. The effects of a variety of wall obstructions on local mass transfer in a parallel plate electrochemical flow cell. J. Chem. Eng. 1997, 68, 145. [Google Scholar] [CrossRef]
  5. Harinaldi, H.; Rhakasywi, D.; Akrom, H. Characteristics of convective mass transfer under influence of turbulence control with wall-recess in a parallel plate electrochemical flow cell. Technol. World 2012, 3, 25–30. [Google Scholar]
  6. Ibrahim, M.H.; Najim, S.T. Determination of Mass Transfer Coefficient for Copper Electrodeposition by Limiting Current Technique. Al-Nahrain J. Eng. Sci. 2012, 20, 666–672. [Google Scholar]
  7. Frias-Ferrer, A.; Gonzalez-Garcia, J.; Saez, V.; Ponce de Leo´n, C.; Walsh, F.C. The Effects of Manifold Flow on Mass Transport in Electrochemical Filter-Press Reactors. AIChE J. 2008, 54, 811–823. [Google Scholar] [CrossRef]
  8. Harinaldi, H. Control of turbulent mass transfer in backward-facing step flow using acoustic excitation. J. Mek. 2011, 32, 86–95. [Google Scholar]
  9. Harinaldi, H. On the Hydrodynamics Turbulent Control of Mass Transfer in Electrodeposition Process. Int. J. Mech. Mechatron. Eng. 2011, 11, 1–8. [Google Scholar]
  10. Çengel, Y.A.; Cımbala, J.M. External fluids: Resistance and buoyancy. In Fluid Mechanics, 1st ed.; Engin, T., Ed.; Guven Publishing: İzmir, Türkiye, 2008; pp. 569–580. [Google Scholar]
  11. Arzutug, M.E. Design of a CPU Heat Sink with Minichannel-Fins & Its Thermal Analysis. Pol. J. Chem. Technol. 2023, 25, 89–100. [Google Scholar] [CrossRef]
  12. Cheng, C.H.; Chen, H.N.; Aung, W. Experimental Study of the effect of transverse oscillation on convection heat transfer from a circular cylinder. J. Heat Transf. 1997, 119, 474–482. [Google Scholar] [CrossRef]
  13. Berger, F.P.; Ziai, A. Optimisation of experimental conditions for electrochemical mass transfer measurements. Chem. Eng. Res. Des. 1983, 61, 377–382. [Google Scholar]
  14. Rieger, P.H. Electrochemistry; Chapman & Hall: New York, NY, USA, 1994; pp. 152–156. [Google Scholar] [CrossRef]
  15. Venkatraman, M.; Van Zee, J.W. Effect of a net on the limiting current distribution in a parallel plate electrochemical reactor: Part II: Combined effects. J. Appl. Electrochem. 2009, 39, 1437–1442. [Google Scholar] [CrossRef]
  16. Arzutug, M.E.; Yapıcı, S. Electrochemical Mass Transfer in Impinging Swirl Jets. Ind. Eng. Chem. Res. 2009, 48, 1593–1602. [Google Scholar] [CrossRef]
  17. Selman, R.J.; Tobias, C.W. Mass transfer measurements by the limiting current technique. Adv. Chem. Eng. 1978, 10, 211. [Google Scholar] [CrossRef]
  18. Öztürk, A.E. Determination of Selected Physicochemical Properties of Some Electrolytes Used in Ionic Mass Transfer Measurements. Ph.D. Thesis, Ataturk University, Institute of Science and Technology, Erzurum, Türkiye, 1996; pp. 12–13. [Google Scholar]
  19. Szanto, D.A.; Cleghorn, S.; Ponce-de-Leon, C.; Walsh, F.C. The Limiting Current for Reduction of Ferricyanide Ion at Nickel: The Importance of Experimental Conditions. AIChE J. 2008, 54, 802–810. [Google Scholar] [CrossRef]
  20. Zhang, W.; Stone, H.A.; Sherwood, J.D. Mass Transfer at a microelectrode in channel flow. J. Phys. Chem. 1996, 100, 9462–9464. [Google Scholar] [CrossRef]
  21. Quiroz, M.A.; Martínez Huitle, U.A.; Martínez Huitle, C.A. Mass Transfer Measurements in A Parallel Disk Cell Using the Limiting Current Technique. J. Mex. Chem. Soc. 2005, 49, 279–283. [Google Scholar]
  22. Kessler, D.P.; Greenkorn, R.A. Essentials: Averages. In Momentum Heat and Mass Transfer Fundamentals; Marcel Dekker Inc.: New York, NY, USA, 1999; pp. 33–57. [Google Scholar]
  23. Convective Mass Transfer. FDE312-Part-II. University of Anbar, Collage of Engineering, Petrochemical Engineering—Stage-2. 2020. Available online: https://www.yumpu.com/en/document/view/50591540/convective-mass-transfer (accessed on 2 May 2025).
  24. Eroglu, E.; Yapici, S.; Şara, O.N. Some Transport Properties of Potassium Ferri/Ferro-Cyanide Solutions in a Wide Range of Schmidt Numbers. J. Chem. Eng. Data 2011, 56, 3312–3317. [Google Scholar] [CrossRef]
  25. Genceli, O. Deneysel bulguların analizi. In Ölçme Tekniği (Boyut, Basınç, Akış ve Sıcaklık ölçümleri); Birsen Yayınevi: İstanbul, Türkiye, 2005; pp. 23–29. [Google Scholar]
  26. Kline, S.J.; McClintock, F.A. Describing Uncertain ties in Single-Sample Experiments. Mech. Eng. 1953, 75, 3–8. [Google Scholar]
  27. Sethuraman, V.; Khan, S.A. Base pressure control using micro-jets in supersonic flow regimes. Int. J. Aviat. Aeronaut. Aerosp. 2018, 5, 1–24. [Google Scholar] [CrossRef]
  28. Chen, L.; Asai, K.; Nonomura, T.; Xi, G.; Liu, T. A review of backward-facing step (BFS) flow mechanisms, Heat transfer and Control. Therm. Sci. Eng. Prog. 2018, 6, 194–216. [Google Scholar] [CrossRef]
  29. Sethuraman, V.; Rajendran, P.; Khan, S.A. Base and Wall Pressure Control using Cavities and Ribs in Suddenly Expanded Flows—An Overview. J. Adv. Res. Fluid Mech. Therm. Sci. 2020, 66, 120–134. [Google Scholar]
  30. Tagg, D.J.; Patrick, M.A.; Wragg, A.A. Heat and mass transfer downstream of abrupt nozzle expansions in turbulent flow. Trans. Inst. Chem. Eng. 1979, 57, 176–181. [Google Scholar]
  31. Yu, M.; Guo, Q.; Tang, Z.; Li, B.; Yuan, X. Turbulent kinetic energy transport in high-speed turbulence subject to wall disturbances. Int. J. Heat Fluid Flow 2024, 106, 1–14. [Google Scholar] [CrossRef]
Figure 1. (a) Detailed photographs of electrochemical parallel-plate flow system with pulse generator, (b) PC-controlled data card measurement system and DC power supply unit.
Processes 13 01700 g001
Figure 2. The schematic diagram of the experimental set-up.
Processes 13 01700 g002
Figure 3. The schematic view of Parallel-Plate Channel with Blockage Blade.
Processes 13 01700 g003
Figure 4. (a) Photograph of local cathodes and main cathode inside of the Parallel-Plate Flow Cell and Electrical Connections of electrodes. (b) The outer appearance of the Parallel-Plate Flow Cell.
Processes 13 01700 g004
Figure 5. Limiting current values: (a) At stagnant electrolyte conditions (VLC = 0.65 V). (b) At different flow conditions (VLC = 0.75 V).
Processes 13 01700 g005
Figure 6. The distributions of the convective mass transfer coefficient versus dimensionless axial distance in a parallel-plate channel, at pulse flow conditions with different (OP/CL) ratios, and no pulsed flow conditions. (a) No pulsed flow; (b) (OP/CL) = (0.5/1); (c) (OP/CL) = (1/1); (d) (OP/CL) = (2/1); (e) (OP/CL) = (3/1); (f) (OP/CL) = (5/1).
Processes 13 01700 g006aProcesses 13 01700 g006b
Figure 7. The flow separation with a Blocking Blade in the Parallel-Plate Flow Channel, and the formation of Primary, Secondary, and Tertiary Vortex Zones downstream of the Flow Separation Zone [27,28,29].
Processes 13 01700 g007
Figure 8. Comparison of distributions of the average mass transfer coefficients (kM) obtained versus the Re value for different (OP/CL) ratios along the channel. (a) (OP/CL) = (1/0.5), (0.5/1), (1/1); (b) (OP/CL) = (2/1), (1/2), (3/1), (1/3); (c) (OP/CL) = (4/1), (1/4), (5/1), (1/5); (d) (OP/CL) = (1/0.5), (1/1), (1/2), (1/3), (1/4), (1/5).
Processes 13 01700 g008aProcesses 13 01700 g008b
Figure 9. Comparison of distributions of the average mass transfer coefficients (kM) versus pulse number for Mode-1 and Mode-2, at Re = 2860.
Processes 13 01700 g009
Figure 10. Comparison of distributions of the peak convective mass transfer coefficients at (OP/CL) = (1/2) and no-pulse flow conditions.
Processes 13 01700 g010
Figure 11. Comparison of peak convective mass transfer coefficient distribution for (a) present study through dimensionless axial distance in parallel plate channel with those of (b) Oduza et al. [4] and Harinaldi [9].
Processes 13 01700 g011
Figure 12. Mean turbulent kinetic energy, (m2/s2). (a) Present study; (b) Harinaldi’s study [9].
Processes 13 01700 g012
Figure 13. Log[Shmax Sc−0.33] versus log[Re] graphs. (a) Present study; (b) studies by Oduza et al. [4] and Harinaldi [9].
Processes 13 01700 g013
Table 1. The values of parameters used in the research.
Parameters
Reynolds Number9501430190523802860
(OP/CL) ratiosMode-10.5/11/12/13/14/15/1
Mode-21/0.51/11/21/31/41/5
Pulse numbers in 60 s453020151210
Table 2. The open and closed residence times of the parallel-plate flow channel for both modes.
Residence Times for Each (OP/CL) Ratios
Mode-1OP/CL0.5/11/12/13/14/15/1
Open residence time, (s)0.512345
Closed residence time, (s)111111
Mode-2OP/CL1/0.51/11/21/31/41/5
Open residence time, (s)111111
Closed residence time, (s)0.512345
Table 3. Physical properties of the electrolyte (23 °C) [24] and the channel used in the present work.
PropertyValueUnit
Density, ρ1025.9kg/m3
Viscosity, µ866.3kg/ms
Concentration of ferricyanide5mol/m3
Schmidth number1583
Channel cross-sectional area4 × 10−4m2
The height of blockage blade1 × 10−2m
Micro-electrode area7.07 × 10−6m2
Table 4. The average possible errors for the experimental parameters.
S. No. Uncertainty EquationUncertainty %
1 R e = D h V ρ μ W R e = [ W V V 2 + W V υ 2 + W D h D h 2 ] 6.4
2 k = I L i m . C u r r . z F A C W k = [ W I I 2 + W E E 2 + W C C 2 ] 5.7
3 S h = k D h D A B W S h = [ W k k 2 + W D h D h 2 ] 10.5
Table 5. The percentage of increment ratio in the peak k values (%).
OP/CLPercentage of Increment Ratio of
the Peak k Values (%)
No pulsed flow-179
Pulsed flow0.5/1206
1/1244
2/1222
3/1252
5/1260
Table 6. Pulse numbers corresponding to (OP/CL) ratios.
(OP/CL) ratiosMode-10.5/11/12/13/14/15/1
Mode-21/0.51/11/21/31/41/5
Pulse numbers in 60 s.453020151210
Disclaimer/Publisher’s Note: The statements, opinions and data contained in all publications are solely those of the individual author(s) and contributor(s) and not of MDPI and/or the editor(s). MDPI and/or the editor(s) disclaim responsibility for any injury to people or property resulting from any ideas, methods, instructions or products referred to in the content.

