1. Introduction
Liquefied natural gas (LNG), predominantly composed of methane, is a high-quality clean energy source. However, the unique characteristics of LNG often lead to a variety of accidents during its storage process. As LNG evaporates and changes phase, it may undergo layering and rolling under certain conditions, generating Boil-Off Gas (BOG). Boil-Off Gas (BOG) typically exists at around −162 °C (−260 °F). Due to the natural heat leak from the environment into the storage tank, even with highly efficient insulation, a small amount of LNG will absorb heat and transition from its liquid state to a gaseous state. At this time, the pressure inside the tank will rapidly increase. Once the insulation layer of the tank is damaged, the LNG inside will be heated and vaporized. If the pressure exceeds the design pressure of the tank, the tank will deform, cracks will appear, and LNG will leak. After the tank leaks, LNG absorbs heat from the surrounding air and vaporizes. If the concentration of the vapor cloud is within the explosive limit, a vapor cloud explosion is highly likely to occur. If LNG leaks and forms a liquid pool on the ground, it is prone to pool fires in case of fire. Using computational fluid dynamics software such as FLUENT can accurately simulate these processes and couple them with fluid flow, thereby more realistically reflecting the physical phenomena at the fire scene. We can simulate and analyze the diffusion of liquefied natural gas during flow and leakage using FLUENT. This helps optimize the design of storage tanks and enables us to take early safety measures that can reduce the risk of accidents.
Liquefied natural gas (LNG) is a flammable liquefied gas that is stored and transported under high-pressure and low-temperature conditions. It is characterized by being colorless, odorless, low in sulfur, and low in nitrogen. As a new type of green energy, it can effectively reduce the emissions of sulfides and nitrides during combustion [
1]. With the adjustment of the national energy structure and the promotion of the “dual carbon” target strategy, the proportion of natural gas in clean energy consumption has increased. Consequently, the scale and quantity of LNG storage tank construction are also on the rise [
2]. Along with the increase in global natural gas consumption, the frequency of major LNG fire and explosion accidents has risen as well [
3].
When an LNG storage tank continues to leak and burn, the fire hazards manifest in two primary aspects: the leaked liquid forms a pool fire that continuously heats the tank, potentially causing overpressure failure and rupture of the storage tank, and the thermal radiation hazards of the pool fire to the surrounding environment [
4]. If LNG storage tanks fail and rupture due to long-term external thermal radiation, more serious consequences, such as boiling liquid expanding vapor explosions, may occur [
5].
To enhance the safety measures of LNG storage stations, reduce the impact range of pool fire accidents, and lower the probability of pool fire domino accidents, Dong Jingya [
6] conducted research on the diffusion of LNG leaks and the domino effect of pool fires. Song Jiangfeng [
7] explored the thermal radiation response of large crude oil storage tanks to maximize their safety. In response to safety accidents caused by LNG tank leaks, Wang Kun [
8] simulated accident conditions, quantitatively analyzed the thermal radiation impact range of fires following LNG leaks, and determined the minimum safe distance between LNG tanks and surrounding facilities. Wang Peng et al. [
9] studied the impact range of flame height, maximum temperature, and tank thermal radiation when a safety valve fire occurs in an LNG storage tank. Within a certain range, a safety valve fire will not damage the concrete outer surface of the tank.
To avoid fire impacts, Shi Junhua et al. [
10] used the Mudan model to analyze the combustion characteristics of tank fires and identify the optimal extinguishing locations for tank fire rescue, selecting the best emergency drill plans. To gain a deeper understanding of the impact of thermal radiation on storage tanks, Sangeun R and Gihun S [
11] conducted relevant research on heat transfer convection in LNG storage tanks and found that the contact surface heat transfer rate is related to the solid–liquid contact area. Ma Qingchun et al. [
12] used FDS fire simulation software to simulate changes in heat release rate, flame center temperature, and thermal radiation intensity of a fire source under strong winds, obtaining the degree of disaster impact of thermal radiation on ordinary personnel, firefighters, and adjacent downwind storage tanks. Jiang Yongsheng [
13] established a refined ANSYS fluent2020 finite element analysis model for LNG storage tanks, conducted a numerical analysis of wall lining temperature, and provided references and inspiration for LNG storage tank engineering design. Xiang Li et al. [
14] established their “leakage combustion” coupled development model and studied the influence characteristics of the leakage phase, tank filling rate, and leakage aperture on the evolution process of such leakage accidents, offering scientific support for emergency response to LNG leakage accidents.
In fire simulations, objects may deform due to thermal expansion or mechanical motion. FLUENT’s dynamic and deformable mesh technology can handle these dynamic changes, ensuring the accuracy and stability of the simulation. FLUENT is capable of simultaneously simulating heat transfer and fluid dynamics processes, which is crucial for fire simulations. In fire scenarios, heat is transferred through conduction, convection, and radiation. The severity of the three main fire and explosion accidents caused by LNG tank leaks is closely related to environmental conditions and the nature of the leakage point source [
15]. Zhang Yangjie [
16] studied the diffusion and vapor cloud explosion development laws of LNG receiving station leakage under different wind speed conditions. Tian Chenxia [
17] analyzed the thermal radiation situation at the storage tanks inside the station and obtained the influence law of tank fires under different working conditions, providing conditions for the damage assessment and repair of tank side and tank top platform facilities. The research results of E Dongmei [
18] on the critical injury distance of different personnel under the action of tank full liquid level pool fire can provide a practical reference for the safety evaluation of tank areas or oil depots. Liu Ye et al. [
19] analyzed the temperature field under uniform fire conditions using a full containment tank as the basic model to provide a reference for determining the minimum safe distance between storage tanks under fire conditions. In practical engineering, the safety storage of storage tanks can be improved by increasing the thickness of the tanks, and the minimum safety distance between adjacent tanks must be met to prevent the occurrence of a domino effect between tanks. For accident analysis, Du Xuhong et al. [
20] introduced the LOPA analysis method to evaluate complex accident scenarios with multiple IE (initial events) causing single accident consequences, providing strong reliability for industrial safety design.
2. Heat Leakage Principle of Tank Structure
During the storage process, large-scale LNG storage tanks are often threatened by fire. Once a fire occurs, it may cause huge losses to life and property. Therefore, it is of great significance to study the impact of fire radiation conditions on storage tanks. According to practical production experience, the main forms of fire in the tank area include solid combustible material fires caused by lightning strikes, pool fires caused by storage tank leaks, equipment fires caused by short circuits or failures of electrical equipment, and the spread of wildfires around the tank area.
The general form of the thermal conductivity differential equation can be expressed in Cartesian coordinates, spherical coordinates, spherical coordinates, and for one-dimensional steady-state problems with general variable cross-sections.
x—parallel to the direction of heat transfer, m;
A(x)—factor related to the thermal conductivity area, m2;
S—source term, W/m3;
—for thermal conductivity coefficient, W/(m·K);
T—temperature, K.
The convective heat transfer from the wall of a large low-temperature storage tank to the surrounding environment belongs to forced convection heat transfer. Therefore, the convective heat transfer coefficient outside the low-temperature storage tank
should be expressed as follows:
of which
—thermal conductivity of air, W/(m·K);
—diameter of storage tank, m;
—air viscosity, m2/s;
wind speed, m/s;
—Reynolds number;
, —experimental constant value.
In fact, due to the combined effect of solar radiation and ambient air temperature on the outer surface of the storage tank, there is an additional value in the external air temperature of the storage tank caused by solar radiation
. Therefore, the comprehensive heat transfer temperature of the external air of the low-temperature storage tank is as follows:
—absorption coefficient of solar radiation on the surface of low-temperature storage tanks, dimensionless;
—the intensity of solar radiation received by the outer surface of the low-temperature storage tank, W/m2;
—the comprehensive heat transfer temperature of the air outside the low-temperature storage tank, K.
Before calculating the internal convective heat transfer coefficient of the low-temperature storage tank, it is necessary to determine the flow state of the fluid inside the tank. The calculation method is as follows:
—Nusselt number;
—the Prandtl constant;
—Grashof number;
—fluid expansion coefficient, 1/K;
—fluid density, kg/m3;
—feature length, m;
—temperature difference, K;
—fluid viscosity, kg/(m·s);
—fluid thermal conductivity, W/(m·K);
—fluid specific heat capacity at constant pressure, J/(kg·K);
, —experimental constant value.
The calculation method for the external radiative heat transfer coefficient
of a low-temperature storage tank is as follows:
—blackness of low-temperature storage tank wall, dimensionless;
—blackbody radiation constant, W/(m2·K4)
—monthly average air temperature in the coldest month, K;
—the average temperature of the outer wall of the low-temperature storage tank, K.
The diameter of the cylinder is the diameter of the pool fire. When there is a certain wind speed, the cylinder will tilt, forming an angle with the vertical direction. The calculation principle is given by the following formula (10):
It can be simplified as follows:
—thermal radiation intensity, kW/m2;
—view factor, dimensionless;
—fire area, m2;
—storage tank exposed to fire radiation area, m2;
—spectral wavelength radiation intensity;
—wavelength, m;
—flame surface radiation force, kW/m2.
During the specific application, the data of thermal radiation intensity can be used for calculation. The thermal radiation heat transfer can be expressed in the form of Newton’s cooling formula as follows:
And the following can be known:
The calculation method for the external radiative heat transfer coefficient of the low-temperature storage tank is as follows:
The total heat transfer coefficient K of the storage tank is as follows:
Therefore, by combining Equations (1) to (6) and Equation (12) and substituting them into Equation (14), the total heat transfer coefficient K of the storage tank under fire radiation conditions can be obtained.
3. Experimental Investigation on Evaporation Characteristics Under Fire Conditions
Given the highly flammable and explosive physicochemical properties of LNG, conducting experimental research on the evaporation characteristics of LNG storage tanks in a laboratory setting poses an extremely high risk. Improper handling can readily lead to personnel poisoning and fatalities, as well as laboratory explosions and fires, resulting in irreparable damage to life and property. In contrast, liquid nitrogen, with a temperature of −196 °C under normal atmospheric pressure, is non-toxic, odorless, non-flammable, and non-corrosive, making it an ideal medium for conducting experiments related to cryogenic liquids in a laboratory environment. It is commonly employed as a safer analog to LNG.
Hence, this study employs liquid nitrogen as the working fluid to experimentally investigate the vaporization characteristic curves of liquid nitrogen, thereby providing a reference and basis for the numerical simulation of LNG evaporation under fire radiation conditions.
3.1. Feasibility Analysis of Replacing LNG with Liquid Nitrogen in the Experiment
To justify the scientific validity of using liquid nitrogen instead of LNG in the laboratory, the study has conducted calculations and comparisons of their heat transfer properties.
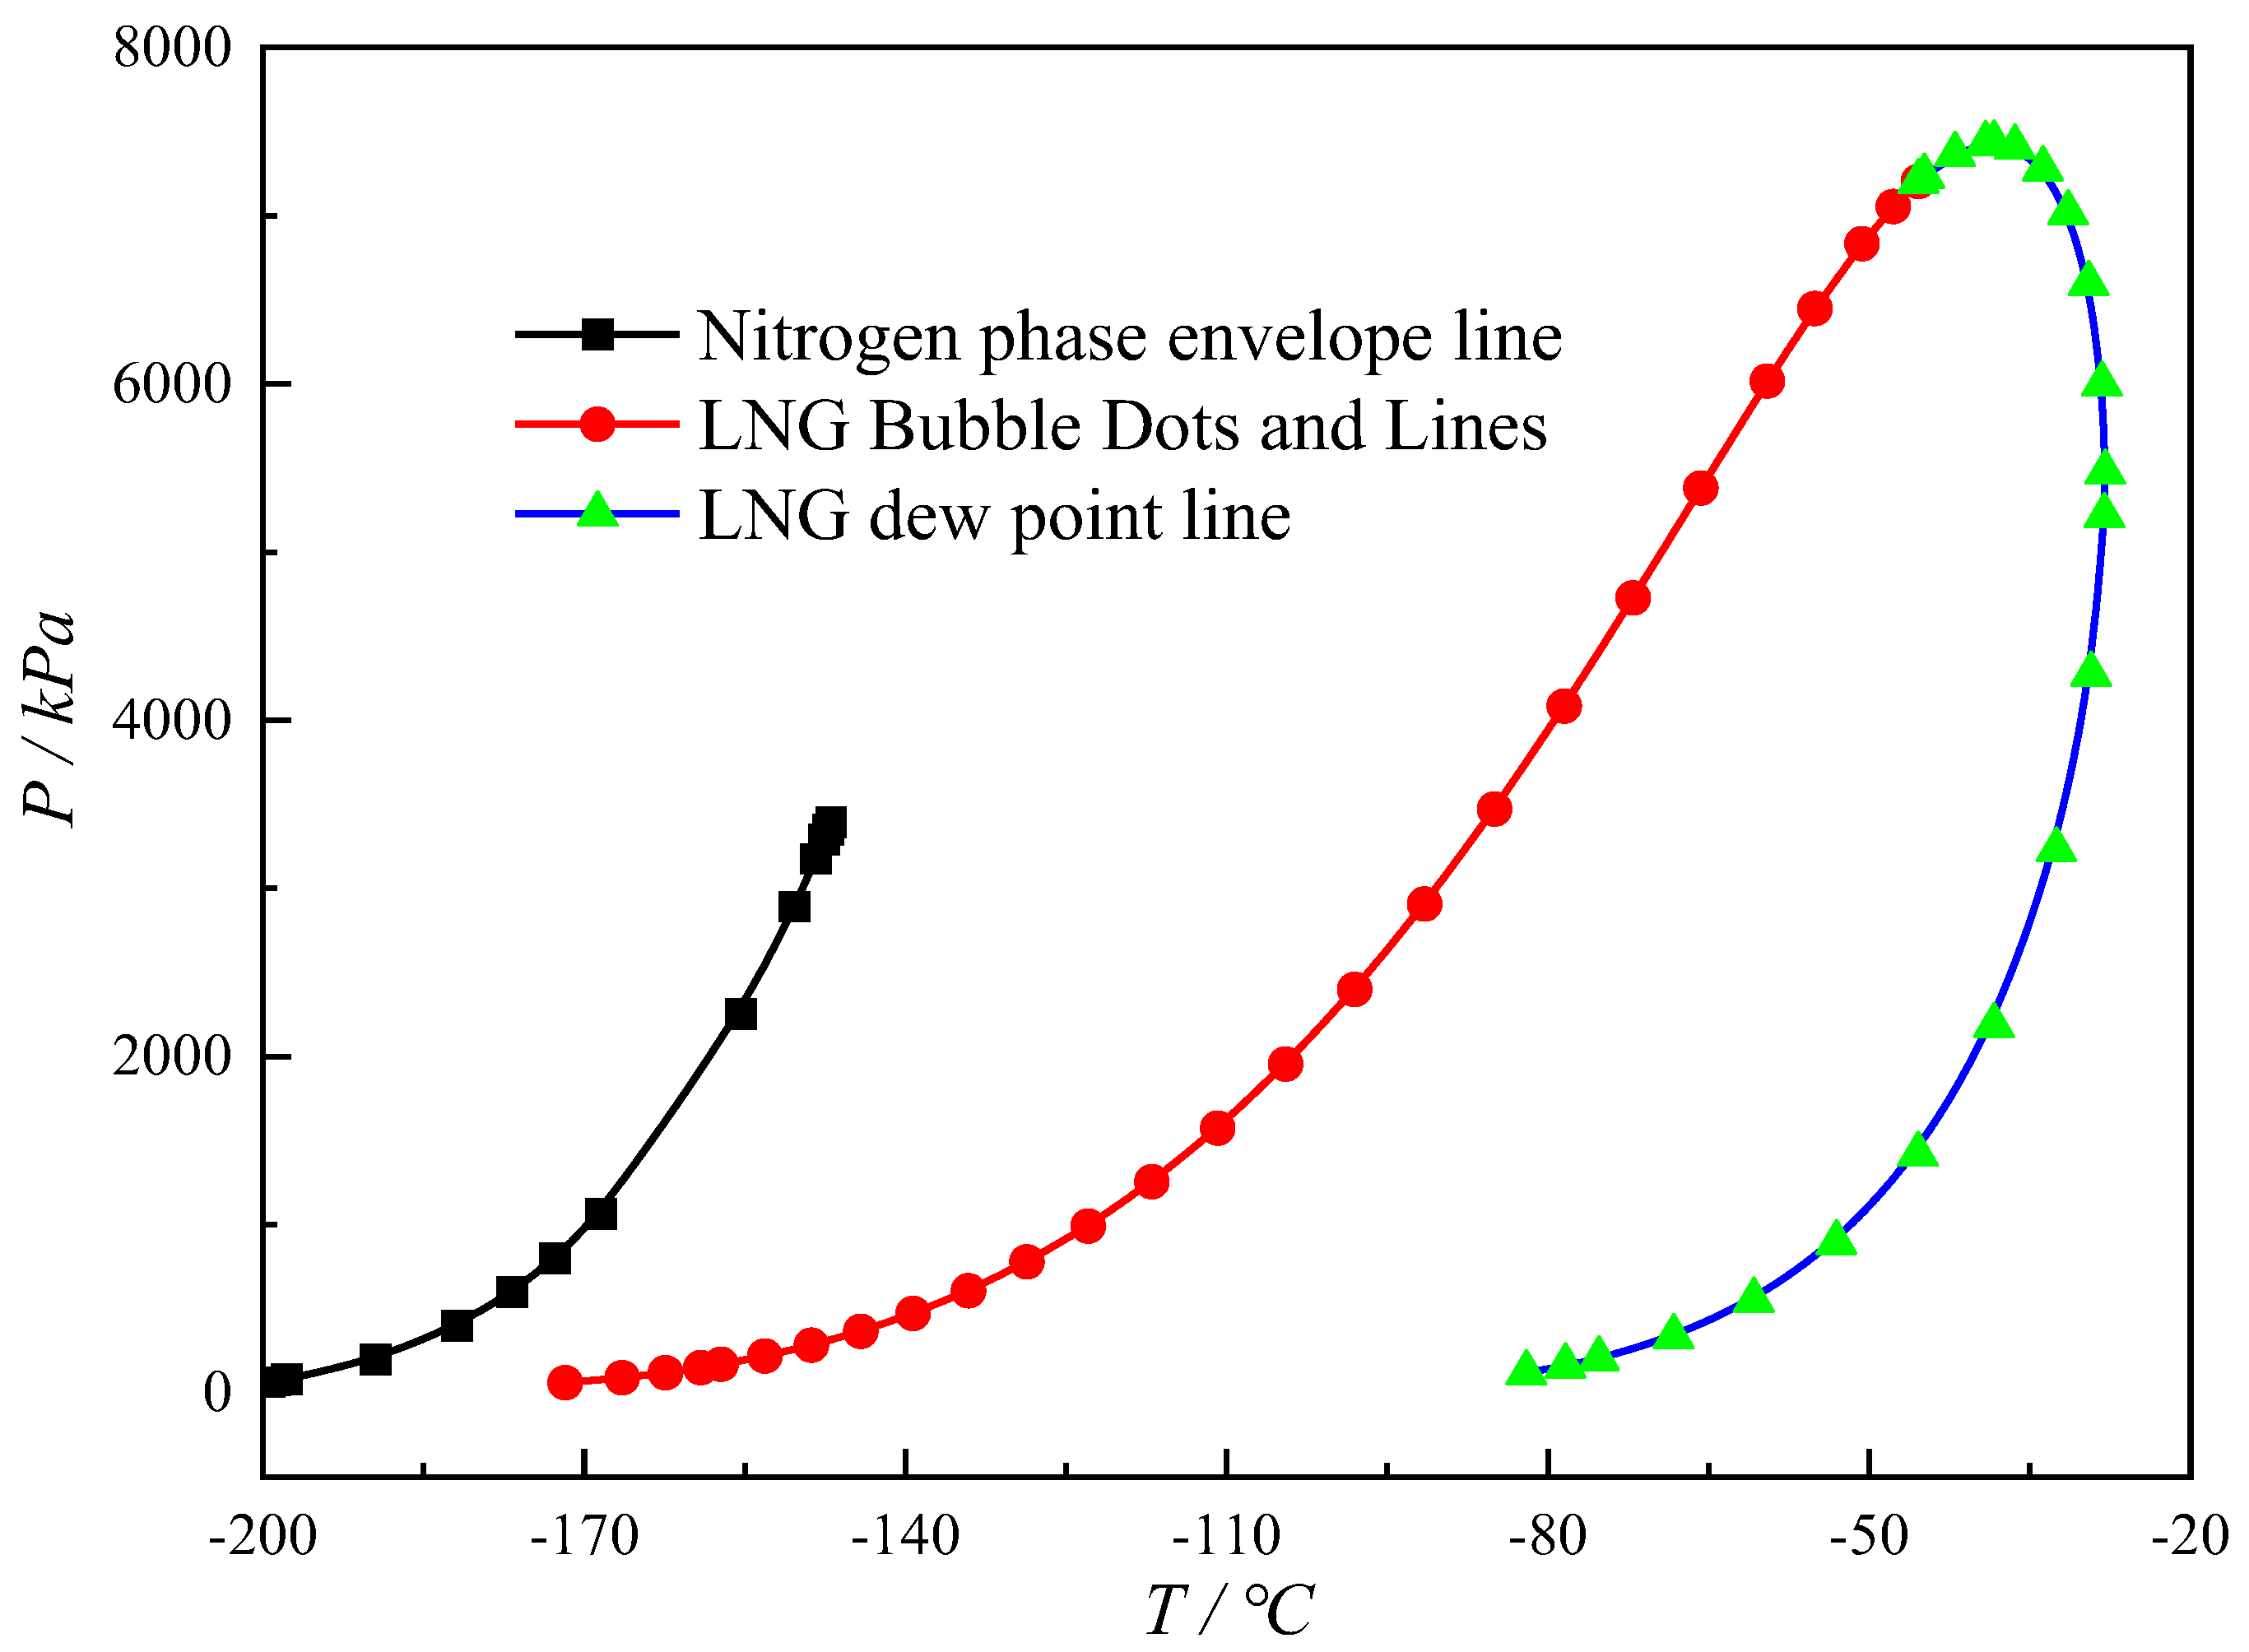
As shown in
Figure 1 and
Figure 2, the phase envelopes of natural gas and nitrogen, as well as the heat transfer curves for nitrogen and natural gas as the experimental working fluids, are presented.
Figure 1 and
Figure 2 were generated using HYSYS V.14 software, a widely utilized process simulation tool in the field of chemical engineering. HYSYS offers a comprehensive suite of thermodynamic models and utilities for calculating the physical properties and phase behavior of substances. The phase envelope diagrams were created using the Peng–Robinson equation as the thermodynamic model to compute the fluid’s phase behavior. This involved inputting essential fluid properties, such as composition and pressure, and calculating phase equilibrium data at various temperatures and pressures. Additionally, HYSYS can provide temperature and enthalpy data under different working conditions, which can be used to construct corresponding plots.
It can be observed from the figures that although liquid nitrogen requires more heat for vaporization into nitrogen gas than LNG does for vaporization into natural gas, the bubble point lines and heat transfer curves of both are quite similar. This indicates that the heat transfer mechanisms and patterns of liquid nitrogen and LNG are consistent, and thus, liquid nitrogen can meet the requirements for evaporation characteristic studies. Therefore, it is reasonable and feasible to use liquid nitrogen as a substitute for LNG in laboratory experimental research.
3.2. Build Experimental Setup
In order to study the influence of fire radiation conditions on the evaporation characteristics of liquid nitrogen storage tanks, this paper uses thin-walled open containers (barrels) as liquid nitrogen storage tanks, electric heaters as stable fire radiation sources, and precise mass scales to accurately measure system mass changes, improving experimental efficiency and accuracy.
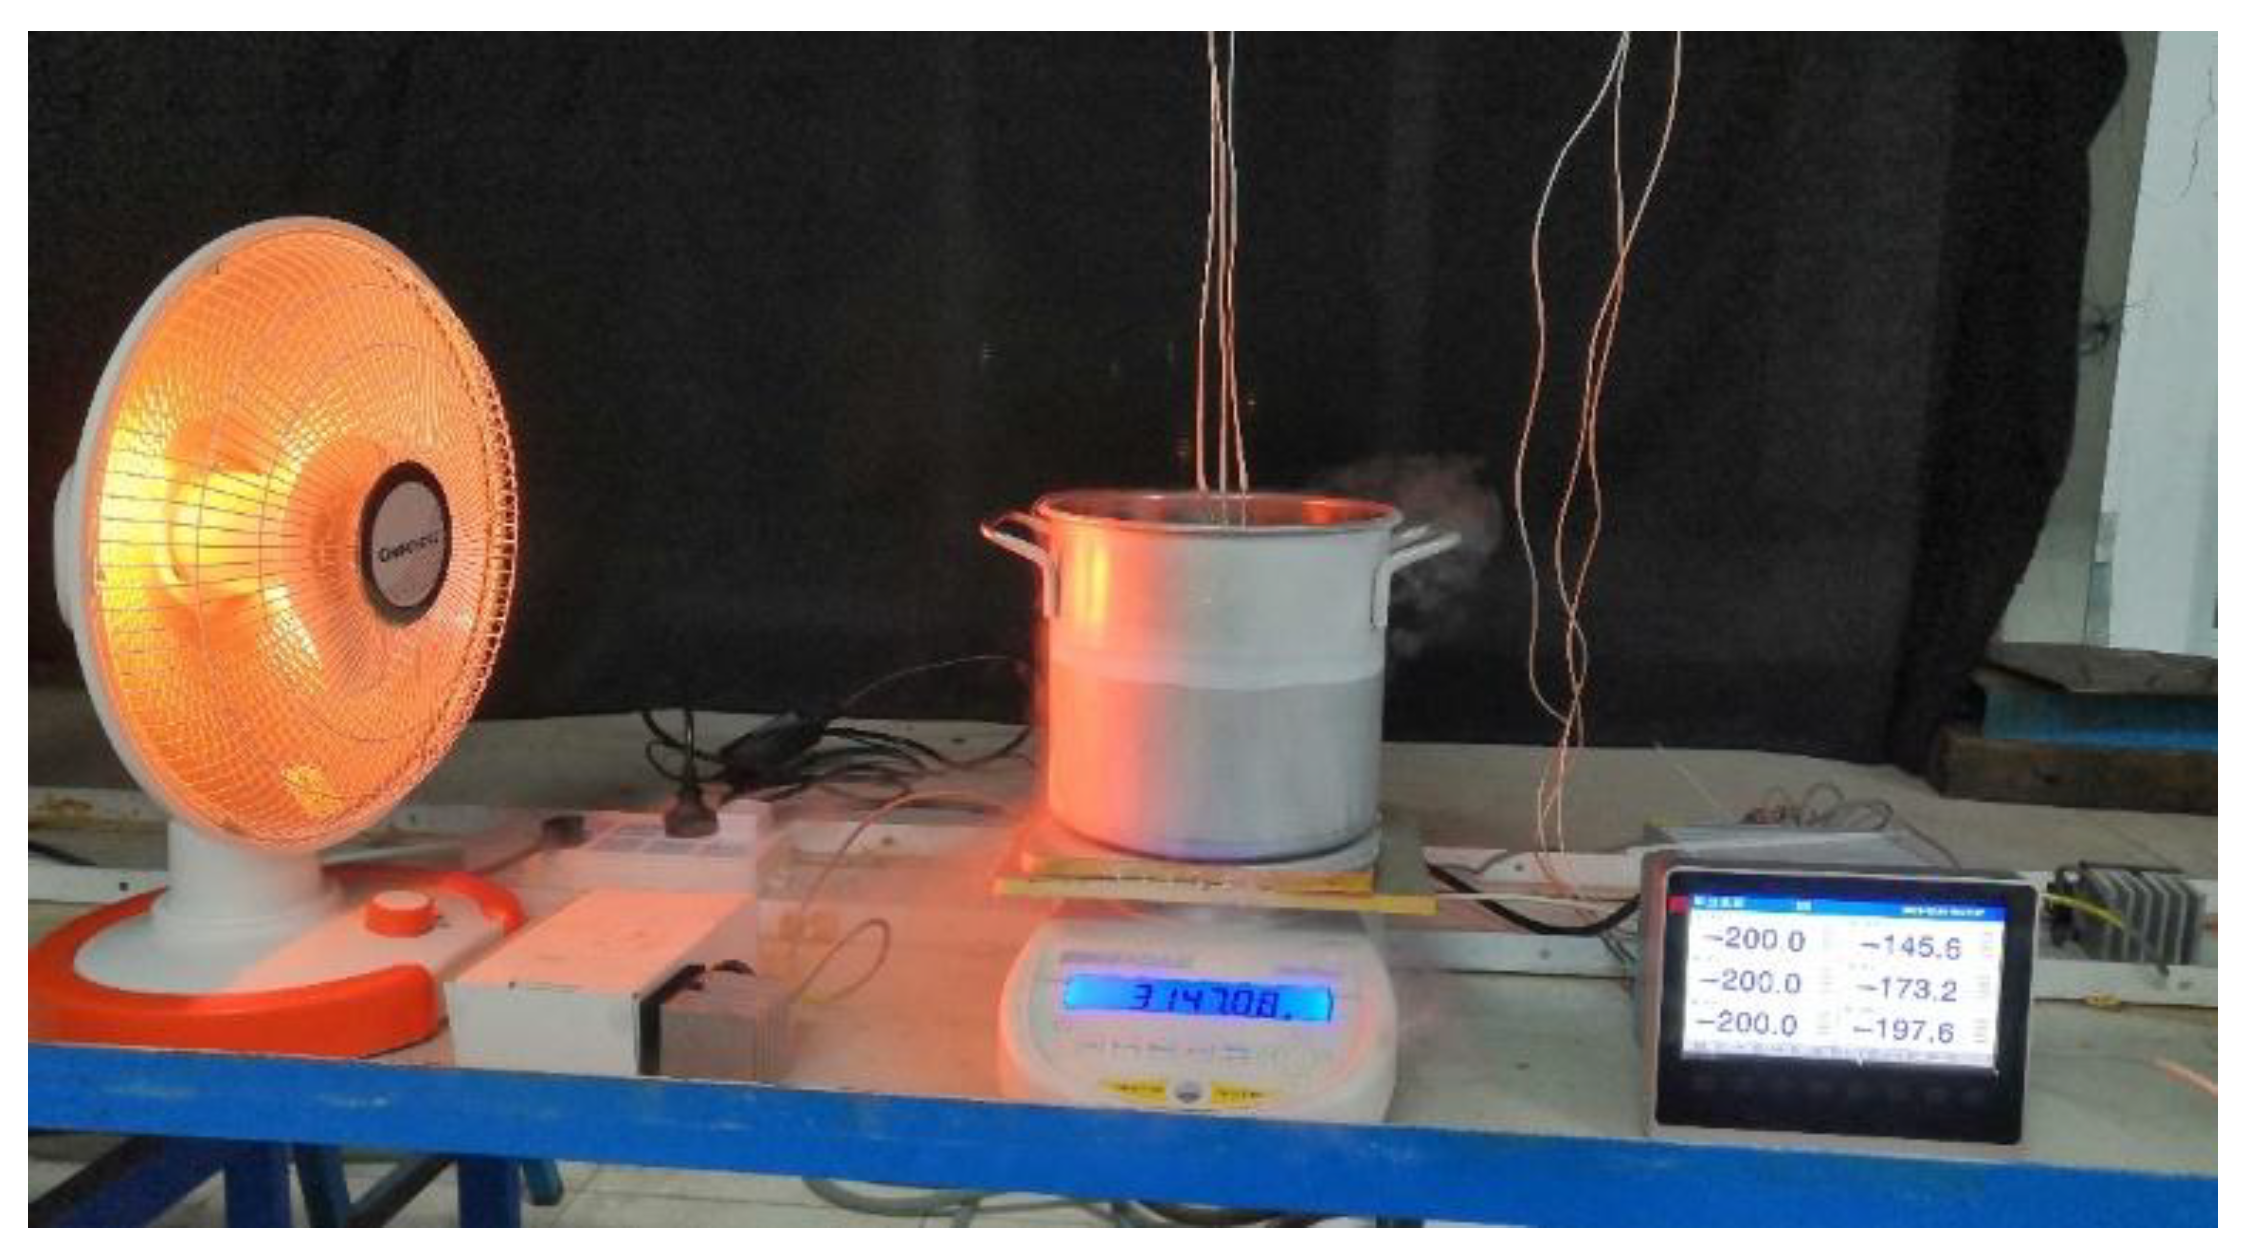
Figure 3 shows the physical image of the liquid nitrogen evaporation test system, which includes the following main equipment: electric heater (radiation source), thermal radiation sensor, liquid nitrogen tank, mass scale, paperless recorder, PT100 thermistor, and laptop. Among them, the liquid nitrogen tank selected in the experiment has a diameter of 20 cm, a height of 20 cm, and is made of stainless steel with a wall thickness of 0.2 cm; the maximum power of the selected electric heater (radiation source) is 990 W. In this study, the thermal radiation sensor employed is the TS-30 type radiative heat flux sensor manufactured by Captec, Lille, France. It is used to measure the radiative heat flux transmitted from the electric heater (radiation source) to the front surface of the liquid nitrogen container. Weighing is the most commonly used, direct, and reliable method for investigating the evaporation characteristics of cryogenic storage tanks. During the experiment, an NBL-6202e-type mass scale was utilized to measure the weight. Data were collected and recorded in real time every 30 s via a laptop computer.
The experimental setup shown was used to conduct the fire radiation tests for liquid nitrogen storage tanks, and a total of six sets of experiments were performed. During the experiments, the mass scale and laptop were first powered on, connected, and calibrated, and the mass scale was zeroed. Subsequently, the thermal radiation sensor, paperless recorder, and three PT100 thermistors were properly arranged and tested for accuracy. The electric heater (radiation source) was positioned at a specific location, and data collection was initiated. Finally, a certain amount of liquid nitrogen was swiftly poured into the liquid nitrogen container, which was then quickly placed on the mass scale. The moment this was performed was recorded as the start time of the experiment, and the experiment commenced.
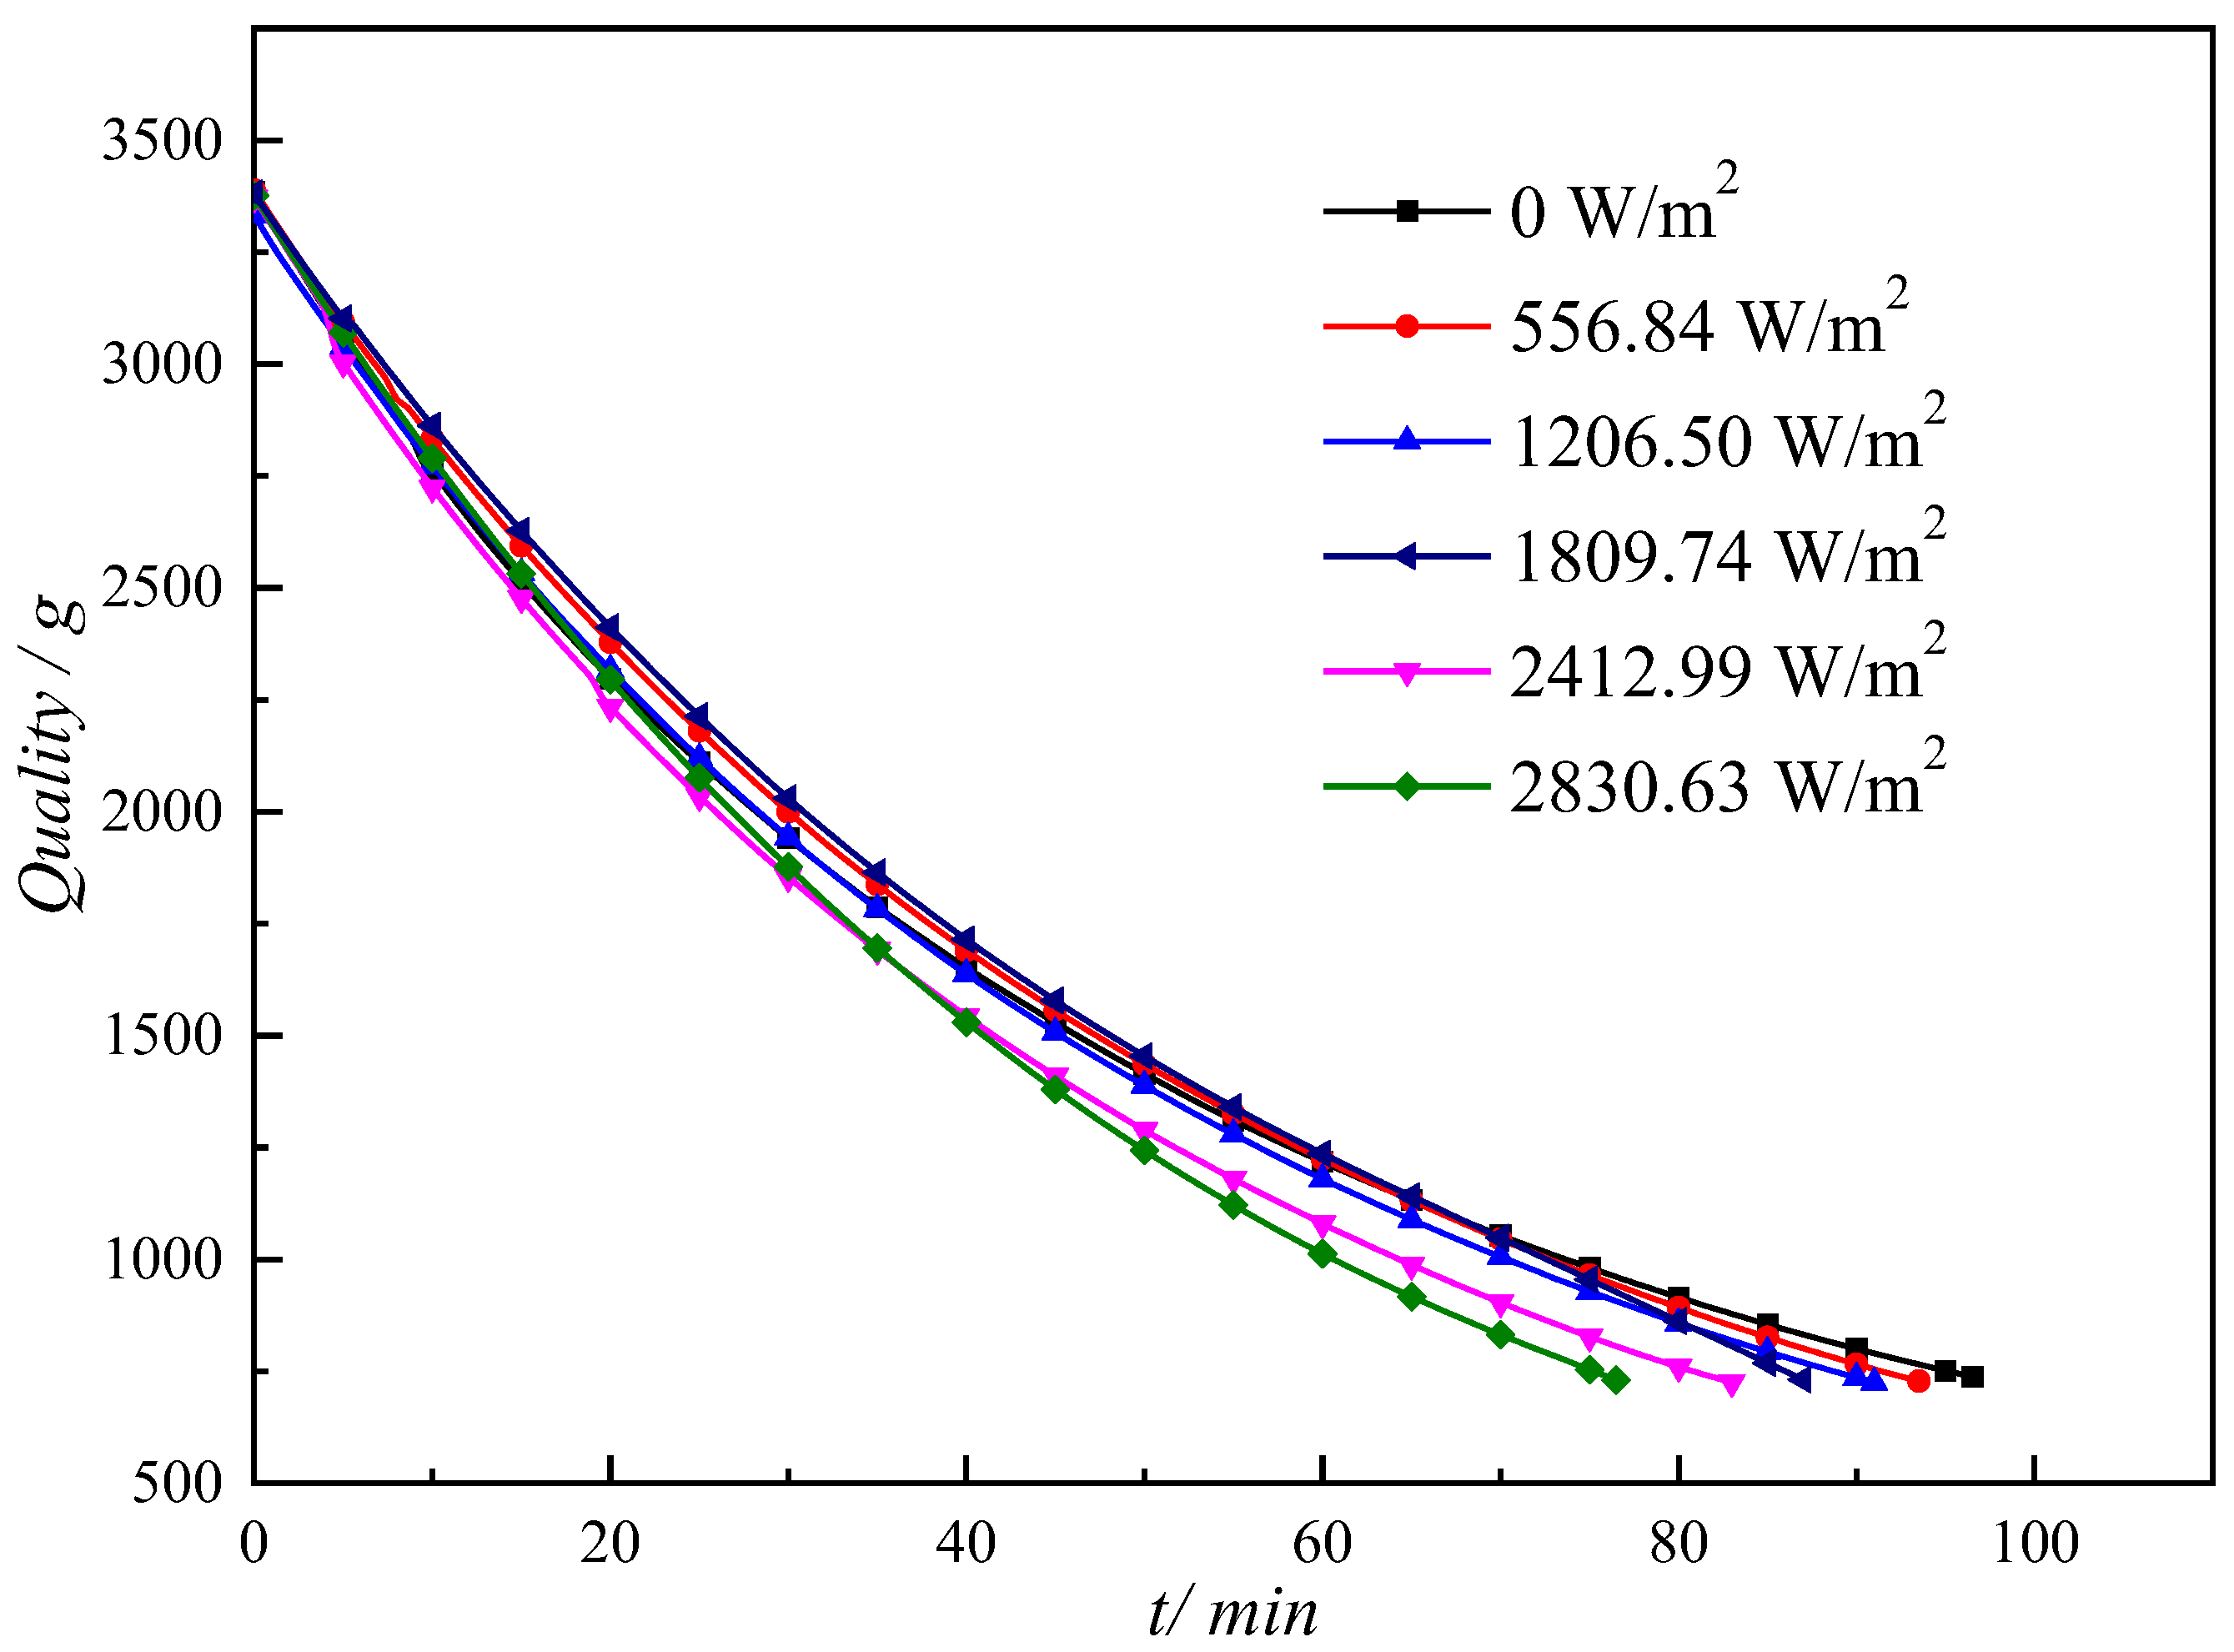
During the experiments, the distance between the electric heater and the liquid nitrogen container was adjusted to achieve different levels of radiation flux, which were 0, 556.84, 1206.50, 1809.74, 2412.99, and 2830.63 W/m2, respectively. The ambient temperature in the laboratory was maintained at a stable 12 °C.
3.3. Analysis of Quality Changes Under Radiation Conditions
To present a relatively complete process of change within a relatively short period of time,
Figure 4 shows the surface of the liquid nitrogen tank at 5, 11, and 20 min during the process with a radiation dose of 1206.50 W/m
2.
During the vaporization of liquid nitrogen, the temperature is relatively low, causing the water vapor in the air surrounding the liquid nitrogen container to sublime and form frost on most of the container’s surface area. The liquid nitrogen tank is subjected to radiation from one side only, and the frost on the side facing the radiation source melts more quickly than that on the opposite side. This indicates that, under the influence of fire radiation, the amount of environmental heat entering the liquid nitrogen container significantly increases and is unevenly distributed across the container’s surface.
Figure 5 illustrates the mass variation of the experimental system with time under the influence of radiation. The termination of the experiment is marked by the complete evaporation of liquid nitrogen, that is, when the liquid quantity inside the liquid nitrogen container reaches zero. As can be seen from the figure, under different radiation conditions, the overall mass reduction trend of the liquid nitrogen evaporation system is consistent, which means that as time progresses, the rate of mass decrease gradually slows down. The reasons for the deceleration of mass reduction include (1) the increasing accumulation of frost on the surface of the liquid nitrogen container, which diminishes the accuracy of the measurement outcomes, and (2) the surrounding temperature field of the liquid nitrogen container cooling to a certain extent, thereby slowing the rate at which environmental heat enters the container.
Table 1 shows the time required for liquid nitrogen evaporation tests under different radiation conditions.
As indicated in
Table 1, during the initial stage of an external fire near the storage tank when the thermal radiation is relatively low, promptly extinguishing the fire or reducing the amount of radiation transmitted to the tank surface can effectively slow down the evaporation rate of the liquid inside the tank. This, in turn, buys more time to implement measures to ensure the safe storage of cryogenic tanks.
5. Numerical Analysis of LNG Storage Tanks and Establishment of Storage Tanks
In China, the liquefied natural gas (LNG) storage tank industry is experiencing rapid development. The technology of large low-temperature LNG storage tanks has become mature, with characteristics of large capacity, efficient insulation, and safety and reliability. Compared to membrane tanks, single-capacity tanks, and double-capacity tanks, full-capacity storage tanks have higher safety. Therefore, the current application of full containment tanks is more widespread.
5.1. Grid Division and Quality Inspection in Computational Domain
Conducting experiments directly on real storage tanks is costly, risky, and time-consuming. In contrast, using FLUENT for simulation allows us to conduct virtual experiments on a computer, which is safer, more economical, and more efficient. Through simulation, we can predict the evaporation rate of LNG, evaluate the pros and cons of different design schemes, optimize tank operations, and ensure safety. FLUENT is a highly powerful engineering simulation software that can be used to simulate fluid flow (such as liquids and gases) and heat transfer phenomena. To simplify the problem, instead of considering the actual three-dimensional shape of the storage tank, we imagine it as a rectangular plane. This rectangle represents the top view of the storage tank in FLUENT, and it serves as the computational domain for our simulation. Choosing a two-dimensional model over a three-dimensional one significantly reduces the computational load, allowing the simulation to be completed more quickly. To more accurately describe the state of the liquid within the tank, we further divide the rectangular tank into many small rectangular cells, with each cell representing a mesh element. The smaller and denser these mesh elements are, the more precise our description of the fluid becomes, leading to more accurate simulation results, albeit at the cost of increased computational effort. FLUENT calculates parameters such as the temperature, pressure, and velocity of LNG in each mesh element, thereby providing a comprehensive picture of LNG evaporation within the entire storage tank.
The dimensions of the bottom inlet pipe, outlet pipe, pump well, monitoring device, and other equipment within the LNG storage tank are relatively small compared to the overall size of the tank, and these components are fully submerged in the fluid. Consequently, the amount of environmental heat that enters through these internal pieces of equipment is minimal. As a result, their impact on the evaporation characteristics of the LNG within the tank is negligible and can be disregarded. Given this, the simulation in this article omits the presence of these internal components and simplifies the full-scale 160,000 cubic meter LNG storage tank into a two-dimensional model, as depicted in
Figure 9. The computational domain for the numerical simulation measures 80 m in diameter and 35.4 m in height. Additionally, there is a BOG vent situated at the center of the top of the storage tank, with a diameter of 0.4 m and a height of 1.0 m
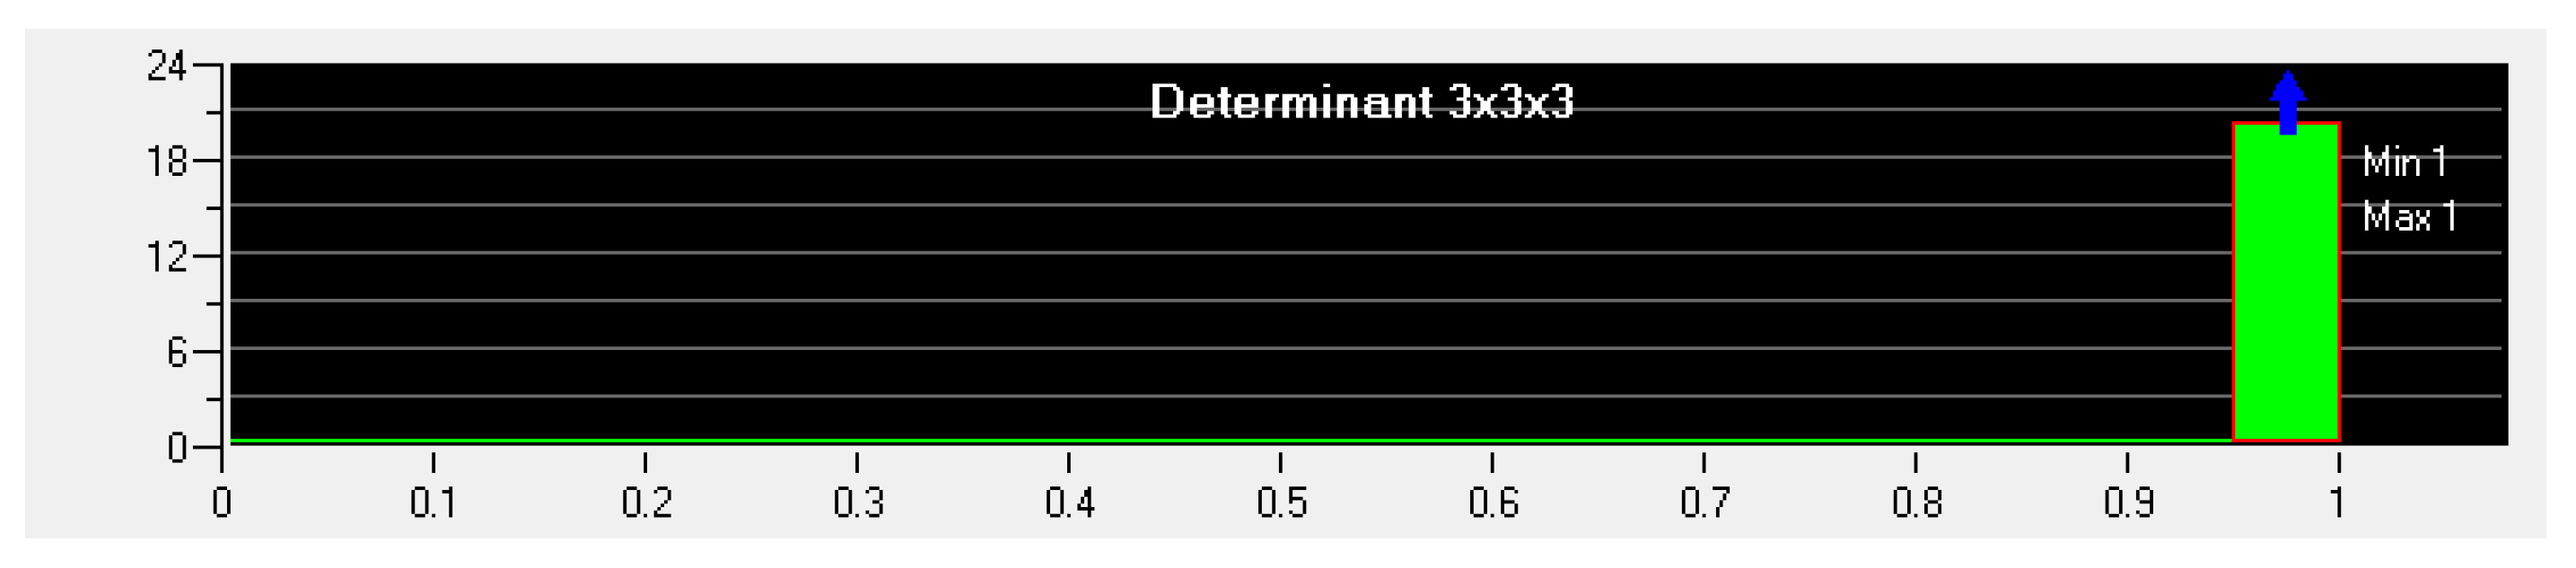
The partitioning of computational domain grids is a pivotal step in numerical simulation analysis. The quality of the grids directly influences the outcomes of the simulation. High-quality grids are often capable of significantly reducing simulation time while enhancing both computational efficiency and accuracy. Given the axisymmetric nature of the storage tank’s calculation domain depicted in
Figure 10, a two-dimensional structured grid is generated using half of the calculation domain. This grid is composed of quadrilateral elements, which offer high resolution and excellent convergence properties.
Figure 11 illustrates the outcomes of the grid quality inspection, assessed under the Jacobian determinant criteria in ICEM (ANSYS ICEM CFD). As depicted, the Jacobian determinant values of the grid range from 0.95 to 1.0, which is indicative of superior grid quality.
When conducting grid quality inspections using FLUENT, the orthogonal quality values range from 0 to 1, with values closer to 0 indicating lower quality. Similarly, the orthogonal skewness values range from 0 to 1, where values closer to 1 signify lower quality. The inspection results reveal that the minimum orthogonal quality of the grid is 1.0, the maximum orthogonal skewness is 4.62376 × 10⁻¹¹, and the maximum aspect ratio is 4.12311. These metrics collectively indicate that the grid quality is exceptionally high.
5.2. Grid Independence Test
The density of the grid plays a crucial role in influencing the outcomes of numerical calculations. For the simulation results to be meaningful, it is essential that as the number of grids continues to increase, the changes in the calculation results become minimal. However, it is not the case that the higher the number of grids, the better. An excessive number of grids can lead to increased CPU usage and longer computation times. After conducting multiple comparative simulations, it was determined that a 30 h timeframe may be sufficient to observe whether the system stabilizes or reaches equilibrium. Therefore, a 30 h period was adopted as the reference time for the mesh independence test.
In this study, a simulated evaporation time of 30 h was employed as a benchmark for numerically calculating the BOG outlet flow rate. Independence tests were carried out using five distinct grid counts: 6760, 8500, 10,525, 17,040, and 26,632 grids. As depicted in
Figure 12, the transient mass flow rate at the BOG outlet exhibits significant variation in the initial phase due to differences in grid size. However, after 18 h of simulation, the results converge to nearly identical values. For instance, the difference in BOG transient mass flow rate between the 10,525 and 17,040 grid counts is less than 0.61%.
Figure 13 provides a comparison of the CPU computation time required for simulating a 30 h evaporation period in LNG storage tanks.
Following the aforementioned comparisons, the grid configuration with 10,525 grids emerged as the optimal choice, offering a shorter CPU computation time while maintaining high accuracy in the calculation results. Consequently, this grid configuration was selected for use in the study.
5.3. Numerical Simulation Study on LNG Tank Evaporation Under Fire Radiation Conditions
In actual production scenarios, fire frequently poses one of the most significant threats to production safety. To investigate the impact of fire radiation on the evaporation characteristics of liquid within large LNG storage tanks, this paper modified the heat transfer mode on the side wall of a 160,000 cubic meter LNG storage tank from convective heat transfer to heat flux density heat transfer during numerical simulations. The simulated parameter table under various radiation levels is presented in
Table 3. The initial liquid level height was set at 30 m, while the total heat transfer coefficient and calculation method at the top and bottom of the tank remained consistent.
5.4. Simulation Results
Figure 14 shows the temperature distribution of LNG storage tanks at different radiation levels for 30 h.
As depicted in the figure, as external fire radiation intensifies, the maximum temperature of the upper gas space within the storage tank progressively rises, and the temperature field gradually shifts from a uniform stratification to a more disordered stratification. This transformation occurs because increased external radiation allows more ambient heat to enter the storage tank. Consequently, the rate of liquid evaporation at the gas-liquid interface accelerates, generating a larger volume of gas that disrupts the previously stable temperature field.
Taking external radiation as the independent variable, the stable BOG mass flow rate, along with the upper gas temperature and pressure data of the storage tank, have been systematically organized and are presented in
Figure 15.
Fitting the curves in the above figure separately yields the following:
(1) BOG quality flow rate . The goodness of fit is R2 = 0.998;
(2) The upper gas temperature inside the storage tank . The goodness of fit is R2 = 0.99047;
(3) Gas phase space pressure inside the storage tank . The goodness of fit is R2 = 0.99703.
As illustrated above, the stable BOG mass flow rate within the tank increases sharply and linearly with the rise in external environmental radiation. Concurrently, the temperature and pressure of the gas phase space inside the tank also rise, albeit with a gradually decreasing growth rate. Therefore, to mitigate the impact of external fire radiation on the evaporation characteristics within the storage tank, effective control measures in the early stages of a fire and enhanced response speed of the tank’s safety valve are crucial for ensuring the safe storage of the tank.
6. Conclusions and Recommendations
The results indicate that as the radiation dose increases, the time required for liquid nitrogen evaporation becomes progressively shorter. Promptly extinguishing external fires around the storage tank or reducing the radiation dose transmitted to the tank surface can effectively ensure the safe storage of cryogenic tanks.
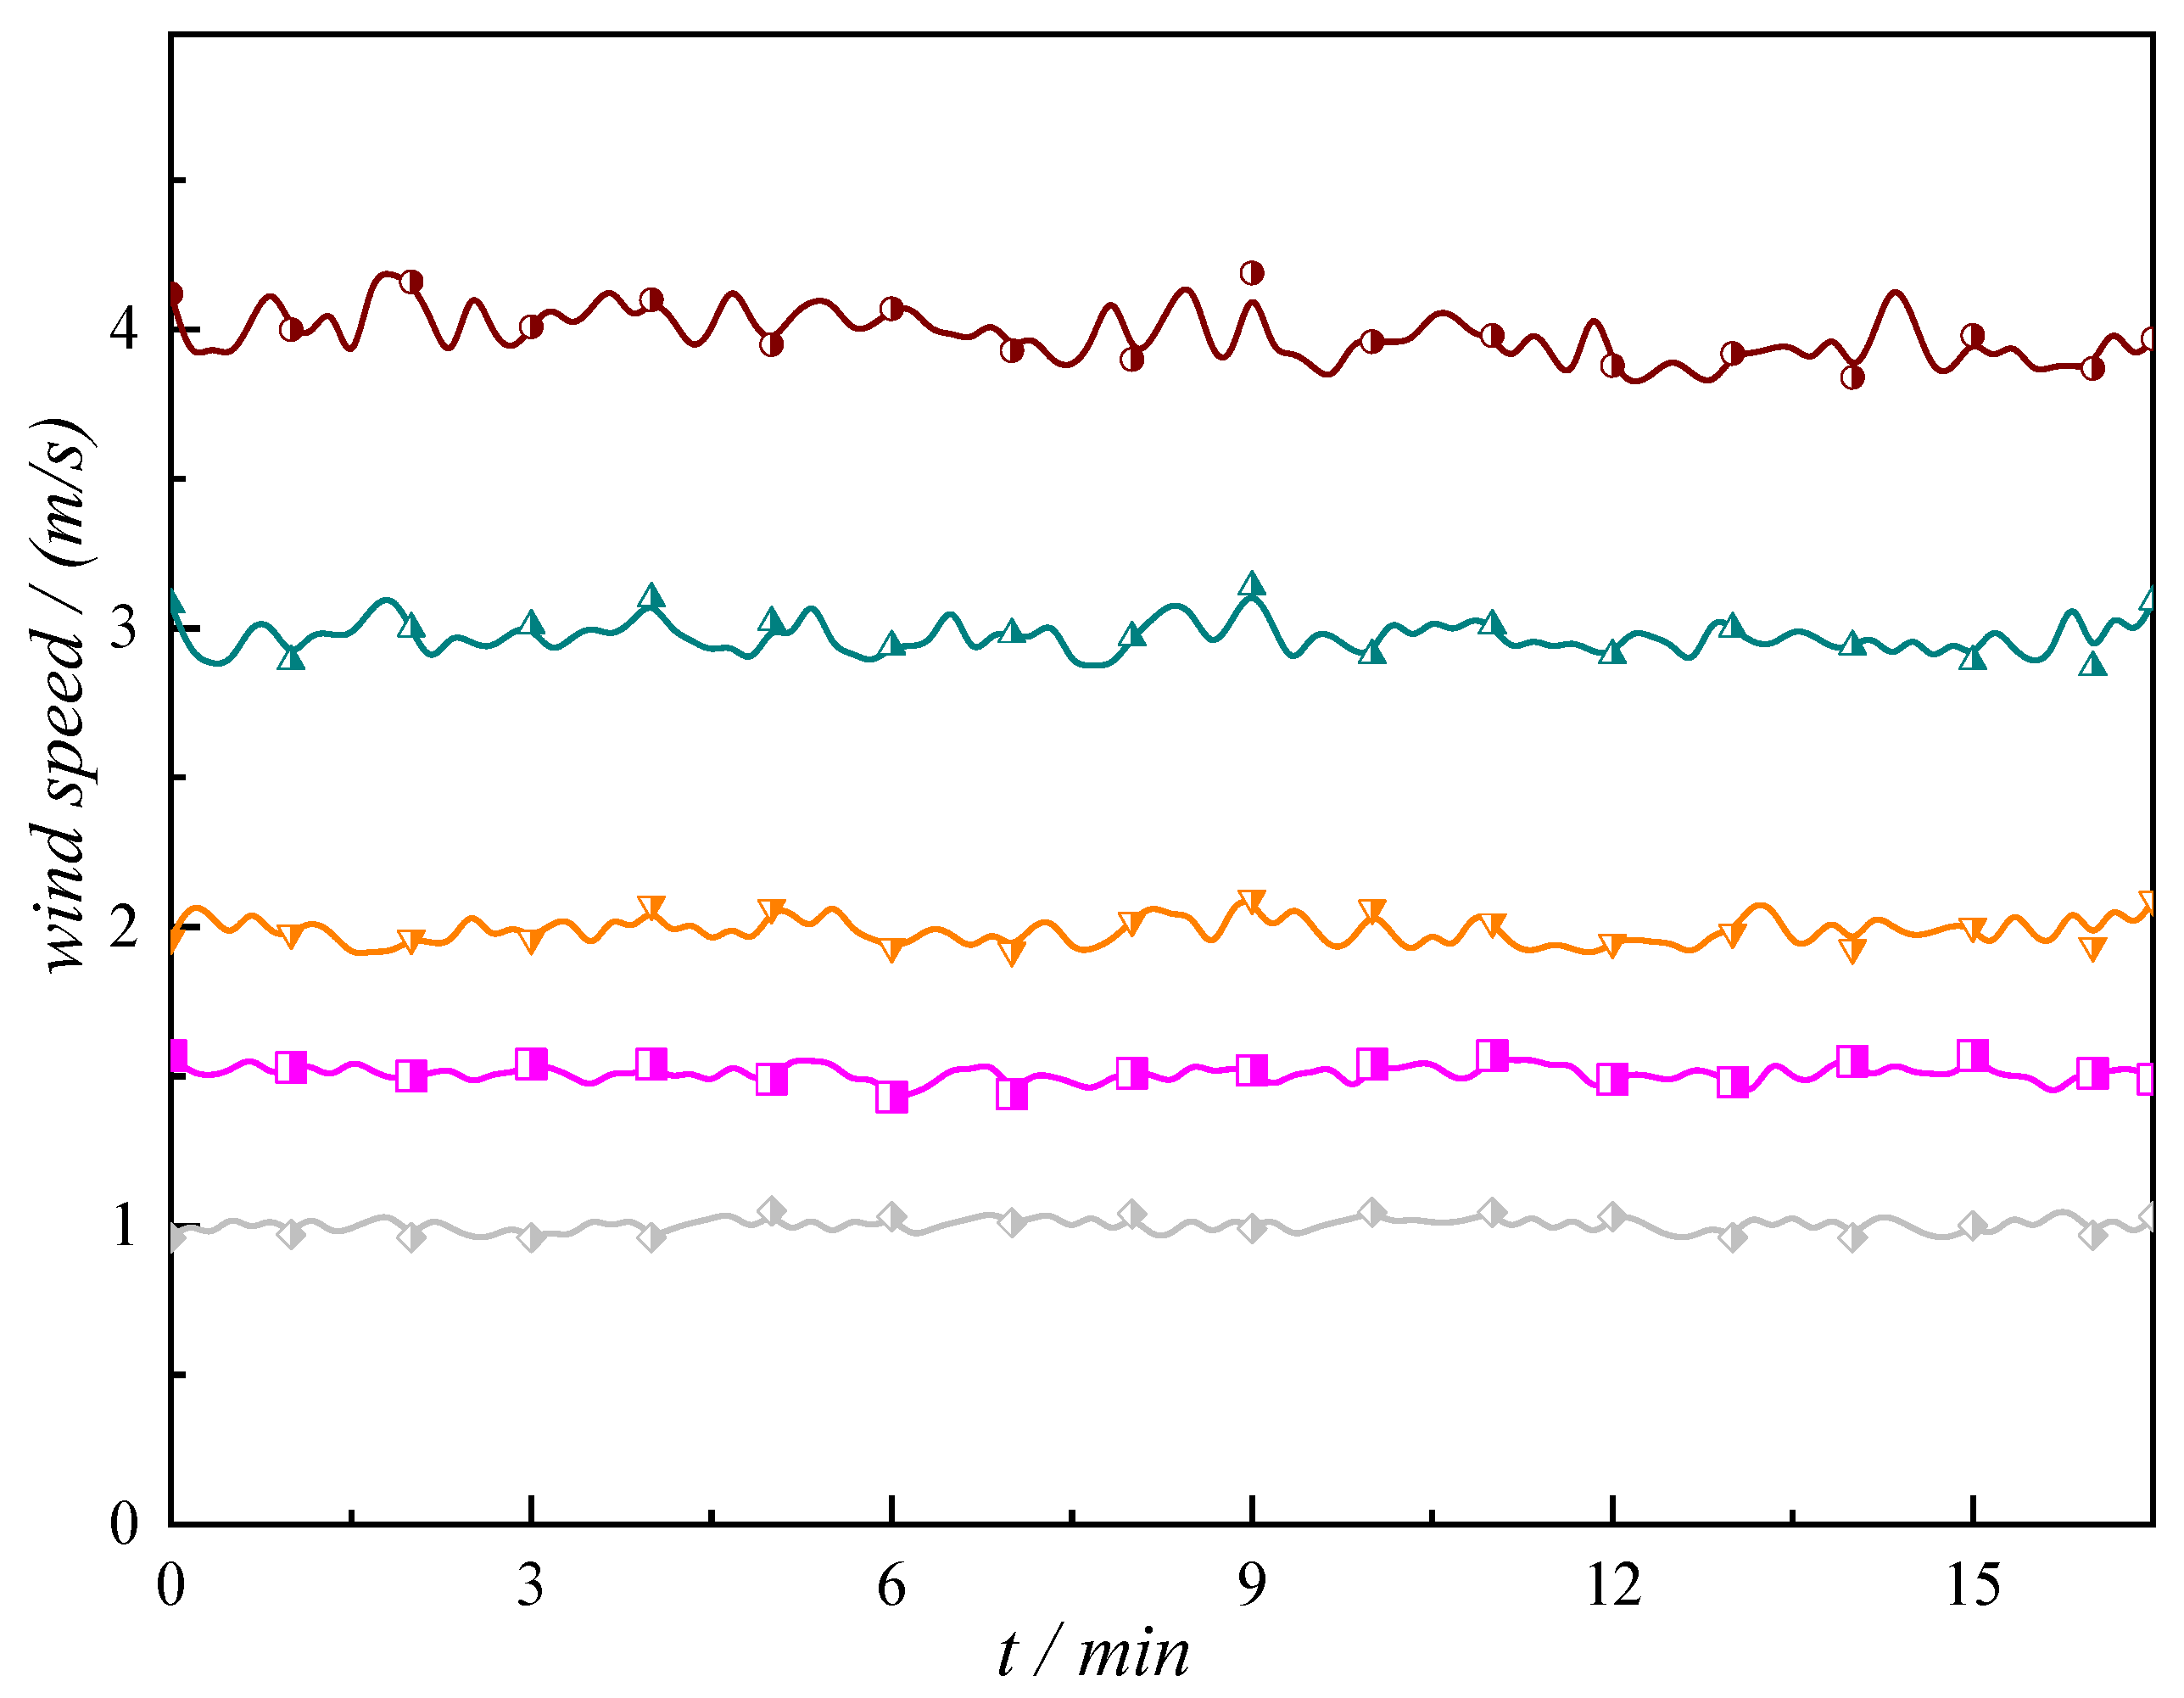
Within a certain critical wind speed threshold, as the wind speed increases, the evaporation rate of liquid nitrogen accelerates. It is crucial to prevent overpressure faults caused by the failure of the tank’s safety valve. Timely measures such as pressure relief and recooling processes should be implemented to discharge gases from within the tank, thereby ensuring the safe storage of cryogenic liquids.
As the external environmental radiation dose escalates, the mass flow rate of BOG (Boil-Off Gas) within the tank, once stabilized, increases sharply in a linear manner. Concurrently, the temperature and pressure in the tank’s vapor space also rise, albeit with a gradually decreasing rate of increase.
Therefore, to mitigate the impact of external fire radiation on the evaporation characteristics within the tank, effective control of the fire in its initial stages and enhanced response speed of the tank’s safety valve are essential for safeguarding the storage safety of the tank.


