1. Introduction
In recent years, the anaerobic ammonium oxidation (Anammox) technology based on autotrophic nitrogen removal principles has garnered widespread attention due to its revolutionary energy-saving and consumption-reducing characteristics. This technology enables direct conversion of ammonium and nitrite within a single-stage reactor through the synergistic action of ammonia-oxidizing bacteria (AOB) and anaerobic ammonia-oxidizing bacteria (AnAOB). Compared to traditional processes, it reduces aeration demand by 60% and eliminates the need for external carbon source addition [
1], positioning it as a key solution for addressing high energy consumption and carbon emissions in high-ammonia wastewater treatment. However, the ubiquitous presence of organic matter in real wastewater poses a critical challenge to system stability, hindering its widespread application. Studies indicate that organic compounds trigger substrate competition between heterotrophic denitrifiers and autotrophic microbial consortia, leading to suppressed AnAOB activity or even functional collapse. In high-ammonia wastewater treatment scenarios, continuous input of small-molecule organics such as sodium acetate may disrupt microbial community equilibrium, causing fluctuations in nitrogen removal efficiency or even system failure [
2].
The completely autotrophic nitrogen removal over nitrite (CANON) process, as a core representative of third-generation biological nitrogen removal technologies, traces its development to the early 21st century [
3]. In engineering applications of CANON, the destabilizing effects of excessive small-molecule organics remain a central challenge. Current research predominantly focuses on microbial dormancy or activity recovery under specific storage conditions, while studies on post-collapse recovery strategies following inhibitory shocks remain limited [
4]. The functional recovery mechanisms of collapsed systems, serving as emergency safeguards in engineering practices, still exhibit significant theoretical and operational knowledge gaps [
5]. Existing investigations have addressed recovery from salinity, strong alkali, and metal ion inhibition in Anammox systems, yet strategies for system recovery after small-molecule organic-induced collapse are scarcely explored [
6]. Peng et al. demonstrated that acetic acid (critical concentration: 270 mg/L) induces more severe Anammox system collapse compared to propionic acid. Through phased regulation of influent carbon-to-nitrogen ratio and hydraulic retention time (HRT) under anaerobic operational conditions (280 mg/L NH
4+-N and 370 mg/L NO
2−-N), nitrogen removal efficiency (TNRE > 80%) could be restored, with
Chloroflexi becoming the dominant phylum (relative abundance: 57%) while
Planctomycetes failed to fully recover [
5]. Nevertheless, the recovery characteristics of CANON biofilm systems following composite shocks from varying degrees of high ammonia and small-molecule organics remain poorly elucidated.
Analysis of existing recovery strategy studies reveals that dynamic regulation of process parameters demonstrates significant advantages in cost-effectiveness and operational efficiency. Although exogenous microbial inoculation or chemical additives (e.g., hydrazine, hydroxylamine, ferrous ions) can accelerate recovery processes, their economic costs and secondary pollution risks limit large-scale applications [
7]. In contrast, optimizing core parameters such as substrate ratio, nitrogen loading rate, and HRT enables activity recovery while maintaining system homeostasis. Notably, precise identification of inhibition sources and multi-strategy integration are critical for enhancing recovery efficiency. For instance, systems subjected to small-molecule organic stress require combined in situ recovery (terminating organic input) and progressive load regulation to re-establish functional microbial dominance in phased stages.
Machine learning, as one of the fastest-growing interdisciplinary fields, serves as a low-cost computational method for processing extensive nonlinear data and establishing mathematical models. It has been widely applied across domains including manufacturing, education, healthcare, physical sciences, and wastewater treatment data modeling [
8]. Wang et al. compared multiple machine learning algorithms to predict anaerobic digestion performance (e.g., methane production, biogas yield) and identify critical operational parameters, testing prediction accuracy across regression and classification models [
9]. Yang et al. developed an Extreme Gradient Boosting (XGBoost) model to predict Total Nitrogen Removal Efficiency (TNRE) in Anammox systems treating iron oxide red wastewater, achieving 98% prediction accuracy in practical applications [
10]. When addressing complex nonlinear relationships among variables and microbial population dynamics in biological nitrogen removal systems, machine learning can analyze and predict key variables through mathematical modeling, providing actionable insights for system commissioning and stable operation.
In this study, four parallel CANON biofilm reactors (R0, R100, R300, R500) were established under high-ammonia influent conditions (1000 ± 50 mg N/L). Diverging from traditional gradual COD dosing strategies, this configuration was specifically designed to simulate industrial transient organic shock scenarios and systematically reveal the recovery characteristics of CANON systems following acute acetate inhibition. Sodium acetate solutions with concentrations of 0, 100, 300, and 500 mg/L were continuously dosed into respective reactors. Using R0 and R100 as controls, this work investigates the recovery of Anammox biofilm systems after collapse induced by sustained sodium acetate stress at medium-high concentrations (300 and 500 mg/L). A recovery protocol was designed to gradually increase the Total Nitrogen Removal Rate (TNRR) of collapsed systems. High-throughput sequencing was employed to elucidate microbial community succession patterns during recovery, revealing restoration mechanisms of biofilm systems post inhibition at different sodium acetate concentrations. These findings provide theoretical foundations and strategic references for rapid recovery of analogous processes. Furthermore, two machine learning models (Support Vector Regression (SVR) and XGBoost) were developed to compare their predictive performance differences for nitrogen removal metrics (TNRE, TNRR) during the recovery phase of Anammox biofilm systems.
2. Materials and Methods
2.1. Experimental Setup and Inoculated Sludge
Four reactors (70 mm internal diameter × 700 mm height) with individual effective volumes of 2.5 L were employed. Each reactor was externally wrapped with heating jackets connected to temperature controllers to maintain the internal liquid phase at 30 ± 1 °C. Feedwater was delivered via peristaltic pumps (BT100L, Leici, Shanghai, China) through bottom inlets, while effluent exited from top outlets. A reflux port was installed below the effluent outlet of each reactor, enabling partial liquid recirculation from the opposite bottom side using mid-level peristaltic pumps (positioned at 1/2 reactor height). Sodium acetate solutions at varying concentrations were injected through bottom ports after mixing with recirculated streams. All reactors contained bottom-mounted aeration diffusers connected to individual flowmeters for precise airflow regulation (0.5–3.0 L/min). The biofilm sludge used in this experiment was inoculated from a large-scale partial nitritation-anammox (PN/A) plant treating high-ammonia wastewater (500 kgN/day) in Guangdong Province, China. This facility has been stably operated for nearly 4 years [
11].
After inoculation, reactor start-up was initiated using synthetic wastewater configured for CANON operation. The synthetic wastewater consisted of NH
4Cl, NaHCO
3, KH
2PO
4 0.05 g/L, CaCl
2 0.3 g/L, MgSO
4·7H
2O 0.3 g/L, FeSO
4·7H
2O 0.00625 g/L, and 1.25 mL/L of trace elements solution. Phosphorus served as a critical nutrient to support microbial metabolism. The trace element solution, formulated based on prior experimental studies and production applications, is comprehensively documented in
Table 1, including its detailed composition and concentration parameters [
10,
11]. Sodium bicarbonate was used to adjust the pH value of influent water to 7.9 ± 0.2.
2.2. Experimental Design and Operational Protocol
The four parallel reactors were operated through five consecutive phases. Phase I (Days 1–55) represented the start-up period. Phase II (Days 56–92) involved stable reactor operation. During Phase III (Days 93–108), sodium acetate solutions with concentrations of 0, 100, 300, and 500 mg/L were continuously dosed into reactors R0, R100, R300, and R500, respectively. Sodium acetate addition was terminated on Day 109. Considering the economic constraints of practical applications [
11], Phase IV and V (the exact time depends on different reactors) adopted in situ recovery strategies through operational parameter optimization. In Phase IV, all reactors were switched to an anaerobic low-load operation mode, with influent NH
4+-N and NO
2−-N concentrations set at 100 mg/L to evaluate intrinsic Anammox activity. Reactors R0 and R100 underwent nitrogen loading rate (NLR) escalation based on performance, while the R300 and R500 are prioritized to replace the residual high concentrations of NH
4+-N and NO
2−-N and reduce the NLR of the system for recovery. In Phase V, according to the actual performance recovery of each reactor, the influent water of R0, R100, R300, and R500 was successively switched to a lower influent NH
4+-N concentration (160–200 mg N/L), and the reactor was operated again according to the CANON mode, and its subsequent recovery was carried out by adjusting the influent NH
4+-N concentration, regulating the influent flow rate and aeration rate (50–100 mL/min) for its subsequent recovery.
2.3. Analytical Method
Daily water samples were collected from influent tanks and reactor effluent ports. After filtration through 0.45 μm membranes, samples were either immediately analyzed or preserved at 4 °C. Pollutant concentrations were systematically measured following the Standard Methods for the Examination of Water and Wastewater (2024 edition) published by the American Public Health Association (APHA) [
12]. NH
4+-N was quantified via Nessler’s reagent spectrophotometry: samples reacted with Nessler’s reagent to form reddish-brown complexes, with absorbance measured at 420 nm. The concentration of NO
2−-N was determined using the N-(1-naphthyl) ethylenediamine spectrophotometric method. Under acidic conditions, NO
2−-N reacts to form a purple-red azo dye, which was quantitatively analyzed by measuring its absorbance at 540 nm. NO
3−-N analysis employed ultraviolet spectrophotometry, utilizing characteristic absorption peaks at 220 nm with 275 nm absorbance correction to eliminate organic interference (UV-5200PC, YuanXi, Shanghai, China). The pH was measured by a pH meter (PHS-3C, Leici, Shanghai, China).
2.4. Calculation Method
The ammonium removal efficiency (ARE), TN removal efficiency (TNRE), NLR (Nitrogen loading rate), and TNRR (TN removal rate) concentration were calculated according to Equations (1)–(4):
where the subscript
inf and
eff represent the influent and effluent in the reactors in this study.
2.5. Analysis of Microbial Community Structure
Biofilm samples were collected from identical locations across of all reactors using flame-sterilized scalpels and forceps to ensure aseptic conditions then immediately cryopreserved at −20 °C of collection to prevent post-sampling microbial activity shifts. During the recovery phases (Phase IV and V), the renamed designations for R0, R100, R300, and R500 were H0_45, H100_60, H300 (H300_1, H300_2), and H500 (H500_1, H500_2), respectively. All sequencing services were contracted to Shanghai Personal Biotechnology Co., Ltd. (Shanghai, China), with detailed procedures as follows:
Total DNA was extracted from sludge samples using a DNA extraction kit, and the DNA solution was stored at −20 °C. DNA concentration was measured by ultraviolet spectrophotometry at wavelengths of 260 nm and 280 nm. The V4 region of bacterial 16S rRNA genes was amplified via PCR using forward primer 515F (5′-GTGYCAGCMGCCGCGGTAA-3′) and reverse primer 806R (5′-GGACTACNVGGTWTCTAAT-3′). Post-amplification, amplicons were pooled in equimolar concentrations, purified, and subjected to paired-end sequencing (250 bp) on an Illumina NovaSeq platform. Raw sequencing data were stored in FASTQ format. Data processing was performed using QIIME2 (version 2022.11). The DADA2 plugin was employed for quality control, noise filtering, sequence merging, and chimera removal. Feature sequences were integrated into an amplicon sequence variant (ASV) table, with singletons (ASVs with ≤1 read) filtered out. Taxonomic classification of ASVs was conducted using the SILVA database (v138). All sequencing datasets generated in this study are publicly available via the NCBI Sequence Read Archive under BioProject accession number PRJNA1258194.
2.6. Modeling and Development of Machine Learning Models
This study employed two mainstream regression algorithms (SVR and XGBoost) within a machine learning theoretical framework to construct data-driven predictive models. Comparative analysis of model performance was conducted for different nitrogen removal metrics (TNRE, TNRR). Input features were standardized using the StandardScaler module from scikit-learn. The normalized dataset was split into two subsets: 70% for machine learning model training and 30% for final model testing. Model predictive accuracy and quantitative performance were evaluated via coefficient of determination (R
2) and root mean square error (RMSE), calculated using Equations (5) and (6), respectively. R
2 reflects the goodness-of-fit, indicating the proportion of dependent variable variance explainable by the model, with values ranging from 0 to 1. A value closer to 1 denotes superior fitting performance [
13]. RMSE quantifies prediction errors, where lower values indicate smaller model prediction deviations and enhanced performance.
where the
n is total number of data points in the training or test set;
represents the actual value of TNRE or TNRR in the system;
represents the predicted value of TNRE or TNRR in the system;
represents the average of all the actual values of TNRE or TNRR.
3. Results and Discussion
3.1. Recovery Analysis of Nitrogen Removal Performance of System
Under high-ammonia conditions, four parallel Anammox biofilm systems were successfully initiated by gradually increasing influent flow velocity with corresponding aeration rate adjustments, achieving stable operation with influent ammonia of 1000 ± 50 mg N/L. The average Total Nitrogen Removal Rate (TNRR) and Efficiency (TNRE) reached 0.494 kg N/(m3·d) and 82.05%, respectively. Sodium acetate solutions at concentrations of 0, 100, 300, and 500 mg COD/L (prepared in 0.5 L amber bottles with deionized water) were continuously dosed into R0, R100, R300, and R500 via dedicated pumps through bottom influent ports. The corresponding organic loading rates (OLRs) were 0, 0.0144, 0.0432, and 0.0720 kg/(m3·d), while all reactors maintained a nitrogen loading rate (NLR) of 0.6725 kg N/(m3·d).
By Day 15 of sodium acetate dosing, R300 and R500 exhibited severe performance deterioration, with TNRR/TNRE declining to 0.1020 kg N/(m3·d)/15.42% and 0.0719 kg N/(m3·d)/10.87%, respectively. In contrast, R100 showed improved performance: TNRR increased from 0.5103 kg N/(m3·d) (Phase II: Days 72–92) to 0.5995 kg N/(m3·d), and TNRE rose from 81.35% to 90.61%. Due to catastrophic failure in R300 and R500, recovery protocols were uniformly implemented.
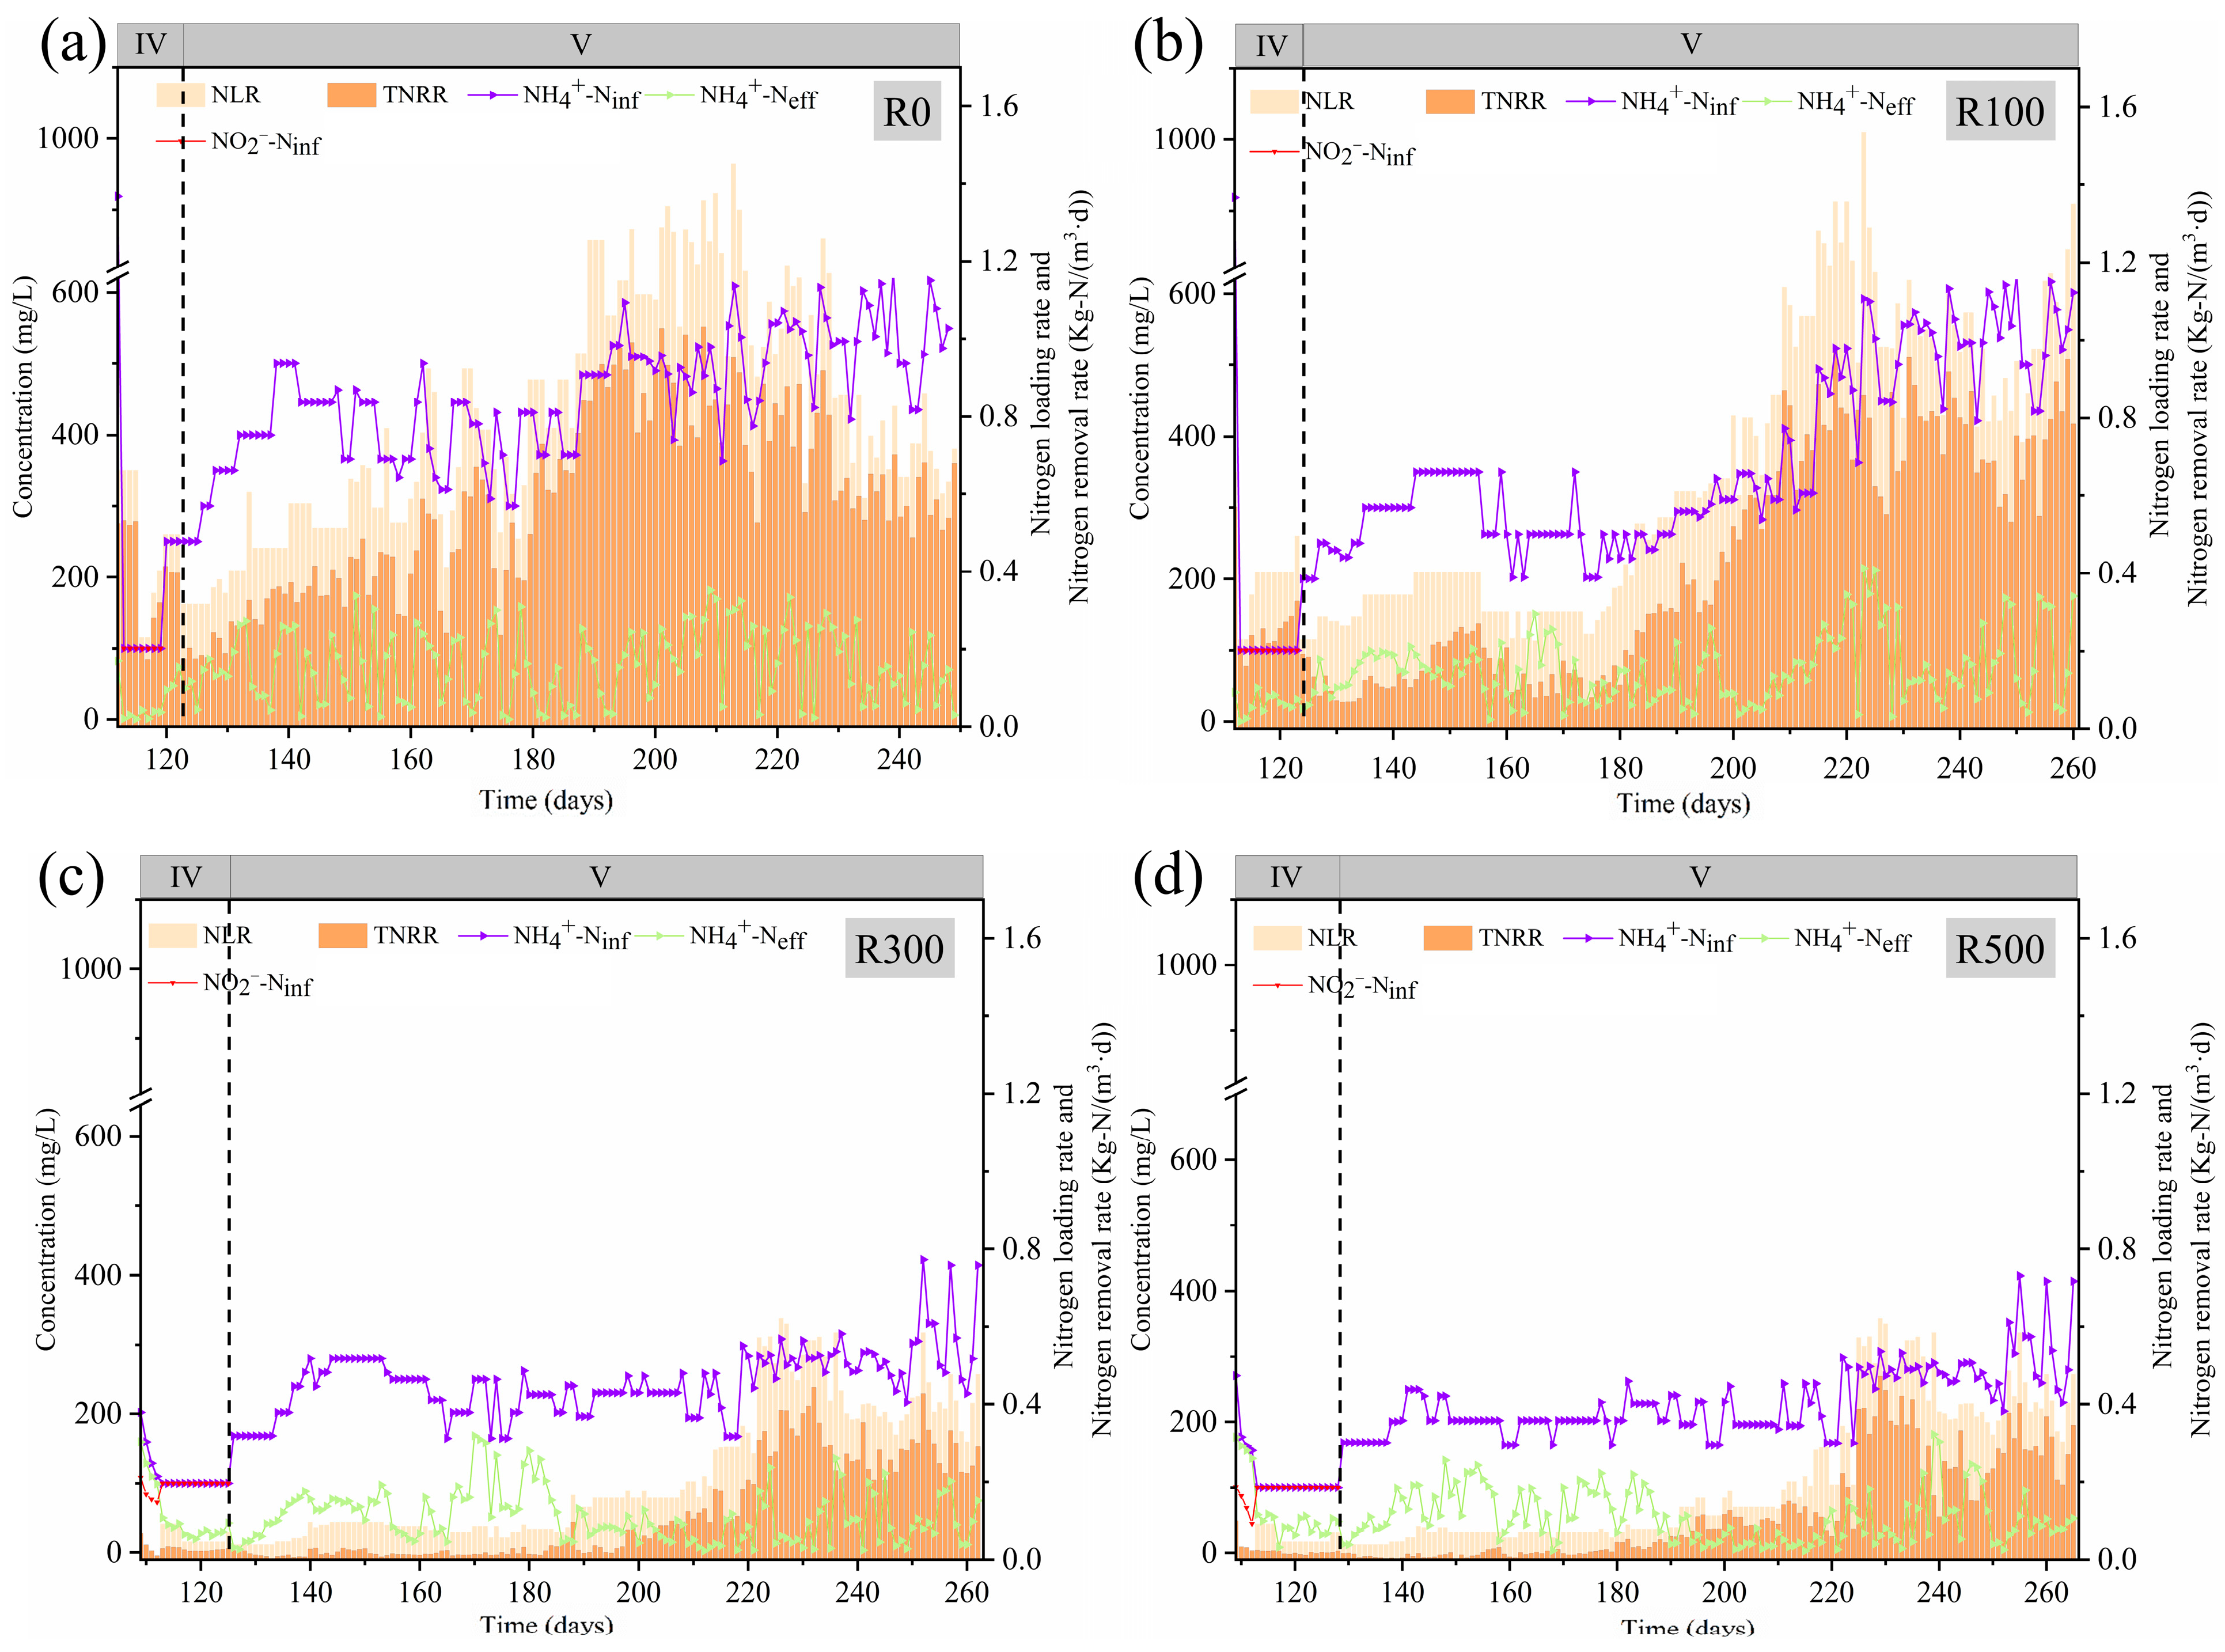
During Phase IV and V, NLR, TNRR, NH
4+-N
iff and NH
4+-N
eff concentrations are shown in
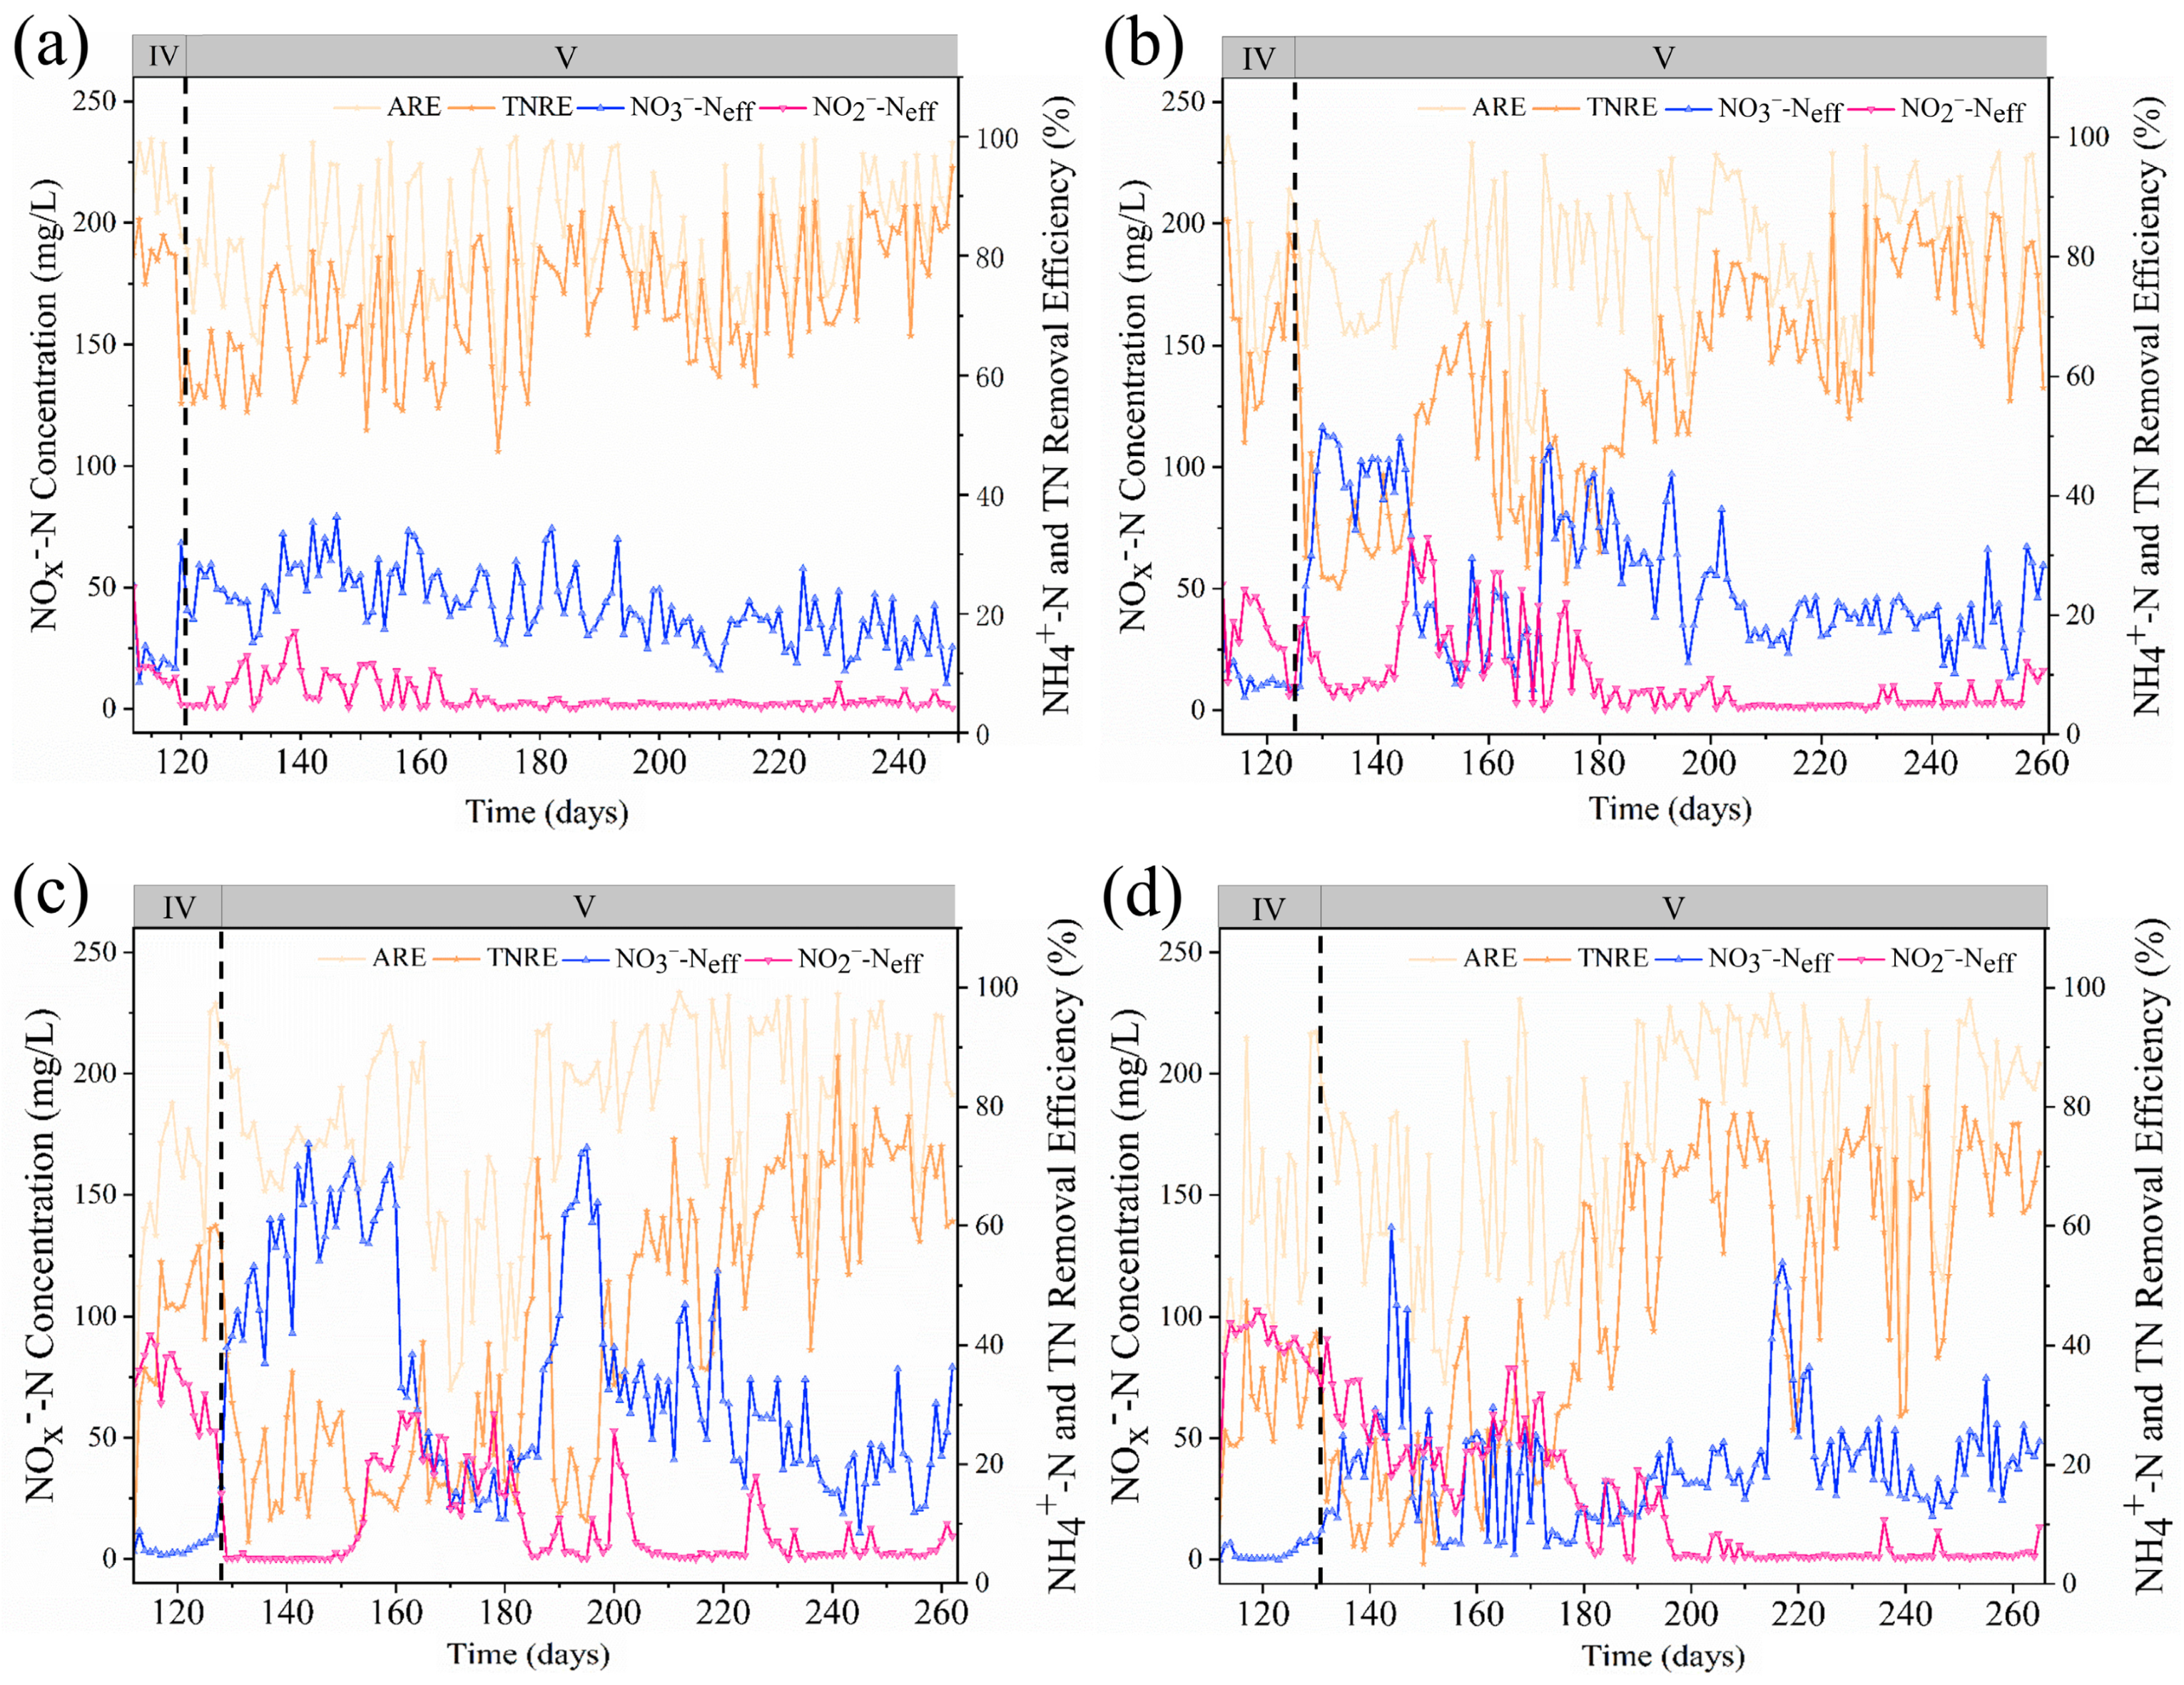
Figure 1, while effluent NO
2−-N, NO
3−-N, ammonia removal efficiency (ARE), and TNRE are presented in
Figure 2. In Phase IV, R0 and R100 under low NLR (0.231 kg N/(m
3·d)) demonstrated robust activity, maintaining NH
4+-N
eff and NO
2−-N
eff below 20 mg/L. During the initial two days, R0 achieved ARE/TNRE of 96.49%/80.74%, while R100 reached 97.92%/69.62%. Subsequent NLR escalation to 0.495 kg N/(m
3·d) via flow velocity adjustment enabled rapid recovery. Both reactors resumed CANON-mode operation after only 7 (R0) and 11 days (R100), validating their recovery capacity (Phase V). Conversely, R300 and R500 exhibited sustained high effluent NO
2−-N (74.99 and 92.74 mg/L) with minimal NO
3−-N production (4.07 and 2.43 mg/L), indicating AnAOB functional impairment. After 16 days of anaerobic operation without significant recovery, both reactors were switched back to CANON mode at reduced NLR (0.231 kg N/(m
3·d)) to align with practical operational constraints.
Phase V results demonstrated that R0 and R100 achieved average TNRR values of 0.414 and 0.329 kg N/(m3·d) after 40 and 60 days of CANON-mode operation, respectively. Compared to R0, R100 exhibited significant fluctuations in effluent NO3−-N concentration, which twice exceeded 100 mg N/L due to transient over-aeration. These deviations were mitigated by enhancing free ammonia (FA) inhibition through alkalinity adjustments. Similar phenomena occurred in R300 and R500, with identical recovery strategies proving effective.
For R300 and R500, TNRR gradually increased to >0.281 and 0.275 kg N/(m
3·d) by Day 100 of recovery (Day 220 of total operation; see
Figure 1 and
Figure 2), accompanied by TNRE recovery to 57.98% and 58.86%, respectively. These findings indicate that collapsed Anammox biofilm systems (R300, R500) can self-recover after sodium acetate cessation. Although high sodium acetate concentrations induced severe AnAOB inhibition, such inhibition was reversible. Post inhibitor removal, AnAOB activity recovered within 60–100 days, with recovery duration positively correlated with initial acetate concentration. This aligns with Yang et al.’s observations under anaerobic conditions [
6] and corroborates Tian et al.’s report of 120-day recovery after methanol-induced inhibition [
14].
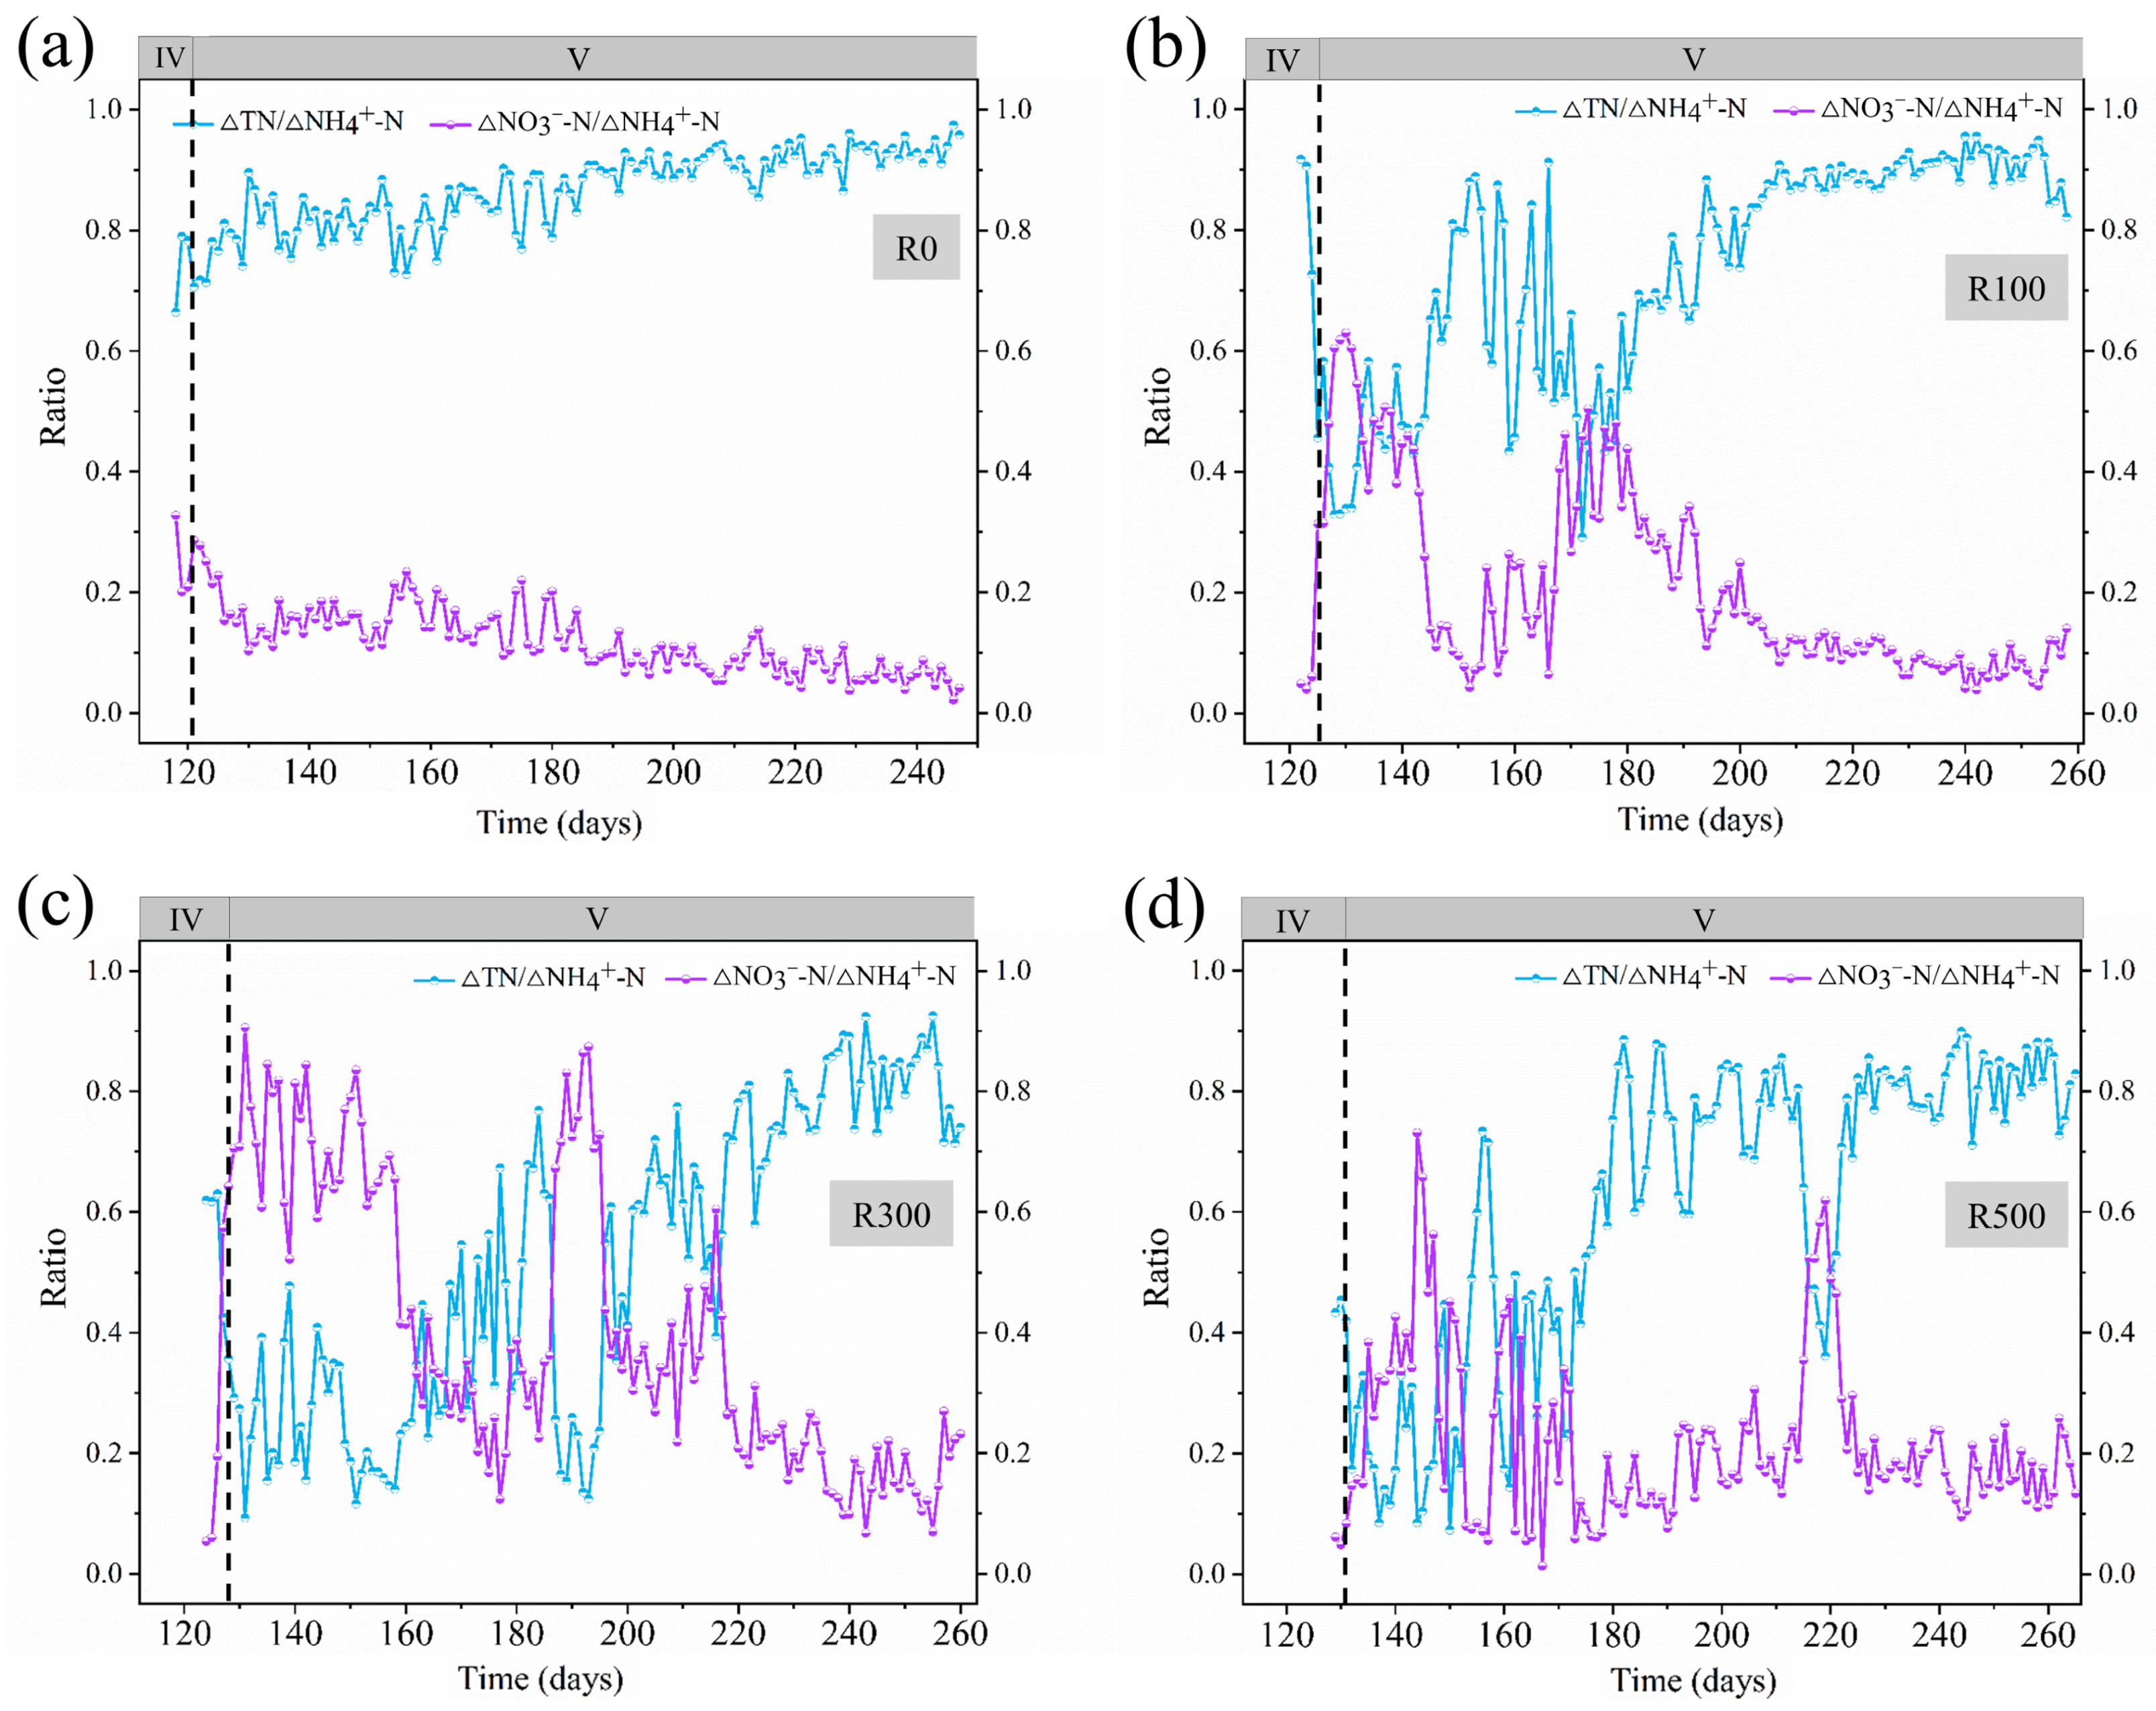
3.2. Reaction Stoichiometric Ratio Analysis in System Recovery Phase
In the macroscopic analysis of anammox system operations, stoichiometric reaction analysis is widely adopted to evaluate the nitrogen removal characteristics of microorganisms within the reactor. This methodology was initially proposed by Strous et al. [
15] and subsequently refined across different process configurations [
16]. In this study, under the assumption of neglecting microbial assimilation and attributing the generated nitrogen gas (N
2) entirely to total nitrogen removal [
17], the two characteristic stoichiometric ratios of the anammox process in the CANON system—ΔTN/ΔNH
4+-N and ΔNO
3−-N/ΔNH
4+-N—were calculated as 0.88 and 0.11, respectively. The close alignment of these ratios with theoretical values, derived from effluent data analysis, further confirms the dominant contribution of the anammox process to system-wide nitrogen removal [
18]. The reaction stoichiometric analysis of the system recovery phase are shown in
Figure 3. In R0, the ΔTN/ΔNH
4+-N and ΔNO
3−-N/ΔNH
4+-N ratios remained stable throughout recovery, gradually approaching theoretical values in later phases, though ΔNO
3−-N/ΔNH
4+-N ratios persistently fell below theoretical levels.
In R100, R300, and R500, both ratios exhibited marked fluctuations, consistent with observed effluent NO3−-N variability. This indicates that sodium acetate exposure predisposed systems to complete nitrification, necessitating stringent aeration control during recovery. For R100 during Days 100–160 of CANON-mode operation, average ΔTN/ΔNH4+-N and ΔNO3−-N/ΔNH4+-N ratios were 0.904 and 0.086, respectively, confirming Anammox as the dominant nitrogen removal pathway.
Conversely, R300 and R500 failed to approach theoretical stoichiometric ratios even after 120 days of CANON-mode recovery, suggesting coexistence of complete nitrification-denitrification pathways. Higher sodium acetate exposure (R500 > R300) prolonged recovery duration, emphasizing the need for immediate intervention during high-concentration acetate shocks to minimize time costs.
3.3. Microbial Community Structure Analysis in System Recovery Phase
3.3.1. Microbial Richness and Diversity Analysis
A total of six samples (initial inoculum and time-series samples from four reactors) were analyzed, yielding 676,566 high-quality sequences and 3644 operational taxonomic units (OTUs). Alpha diversity indices (Chao1, Observed_species, Shannon, and Simpson) are summarized in
Table 2. Chao1 and Observed_species indices reflect community richness, while Shannon and Simpson indices represent community diversity [
19,
20].
Throughout the recovery period, all Alpha diversity indices (Chao1, Observed_species, Shannon, Simpson) for H300_1, H300_2, H500_1, and H500_2 gradually increased with recovery time, indicating partial restoration of microbial richness and diversity after inhibition removal. However, these indices remained consistently lower than those of H0_45 and H100_60, demonstrating that high-concentration sodium acetate-induced system collapse caused persistent damage to biofilm community richness and diversity, with incomplete recovery within the experimental timeframe.
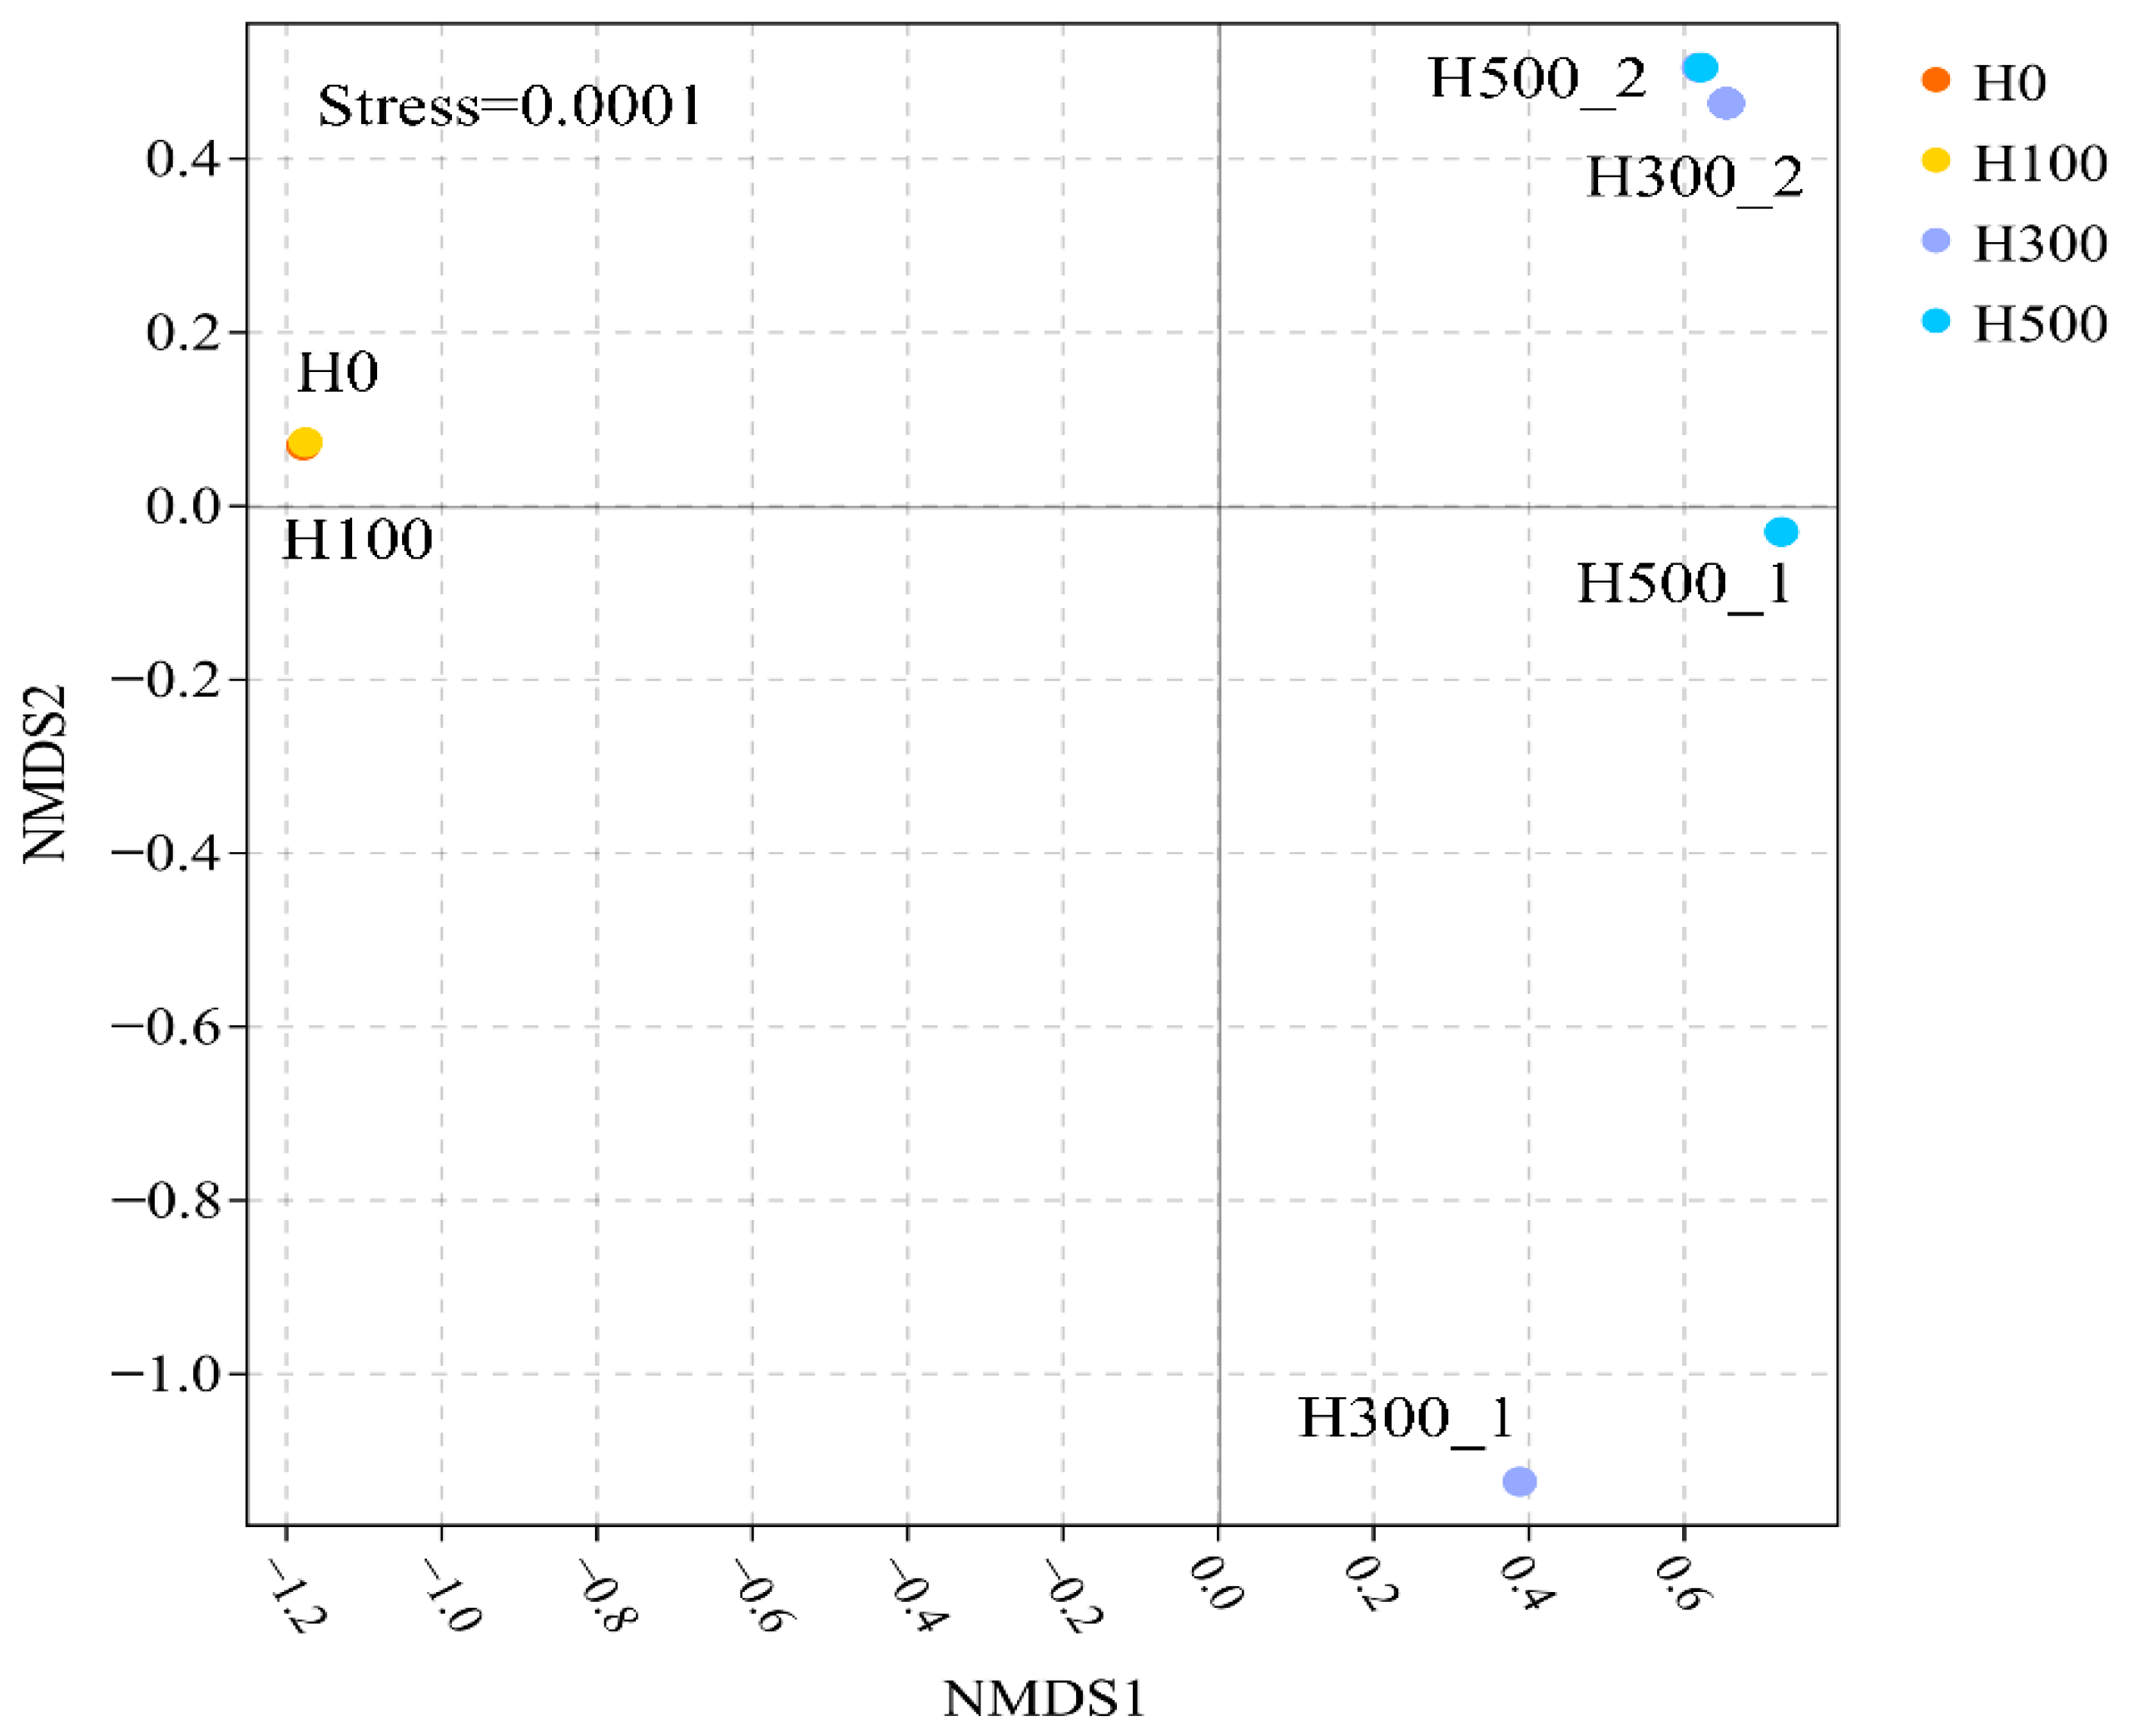
Non-metric multidimensional scaling (NMDS) analysis was performed to assess beta-diversity differences among communities during recovery (
Figure 4, Stress = 0.0001). H0_45 and H100_60 clustered closely, suggesting minimal community divergence. In contrast, H300_1/H300_2 and H500_1/H500_2 exhibited significant spatial separation, indicating distinct microbial community structures in R300 and R500 at different recovery phases (Day 60 vs. Day 120) [
21]. The divergent trajectories of R300/R500 communities (H300_2 and H500_2) further corroborated the delayed TNRE recovery observed between Days 100–120 (57.98–58.86%).
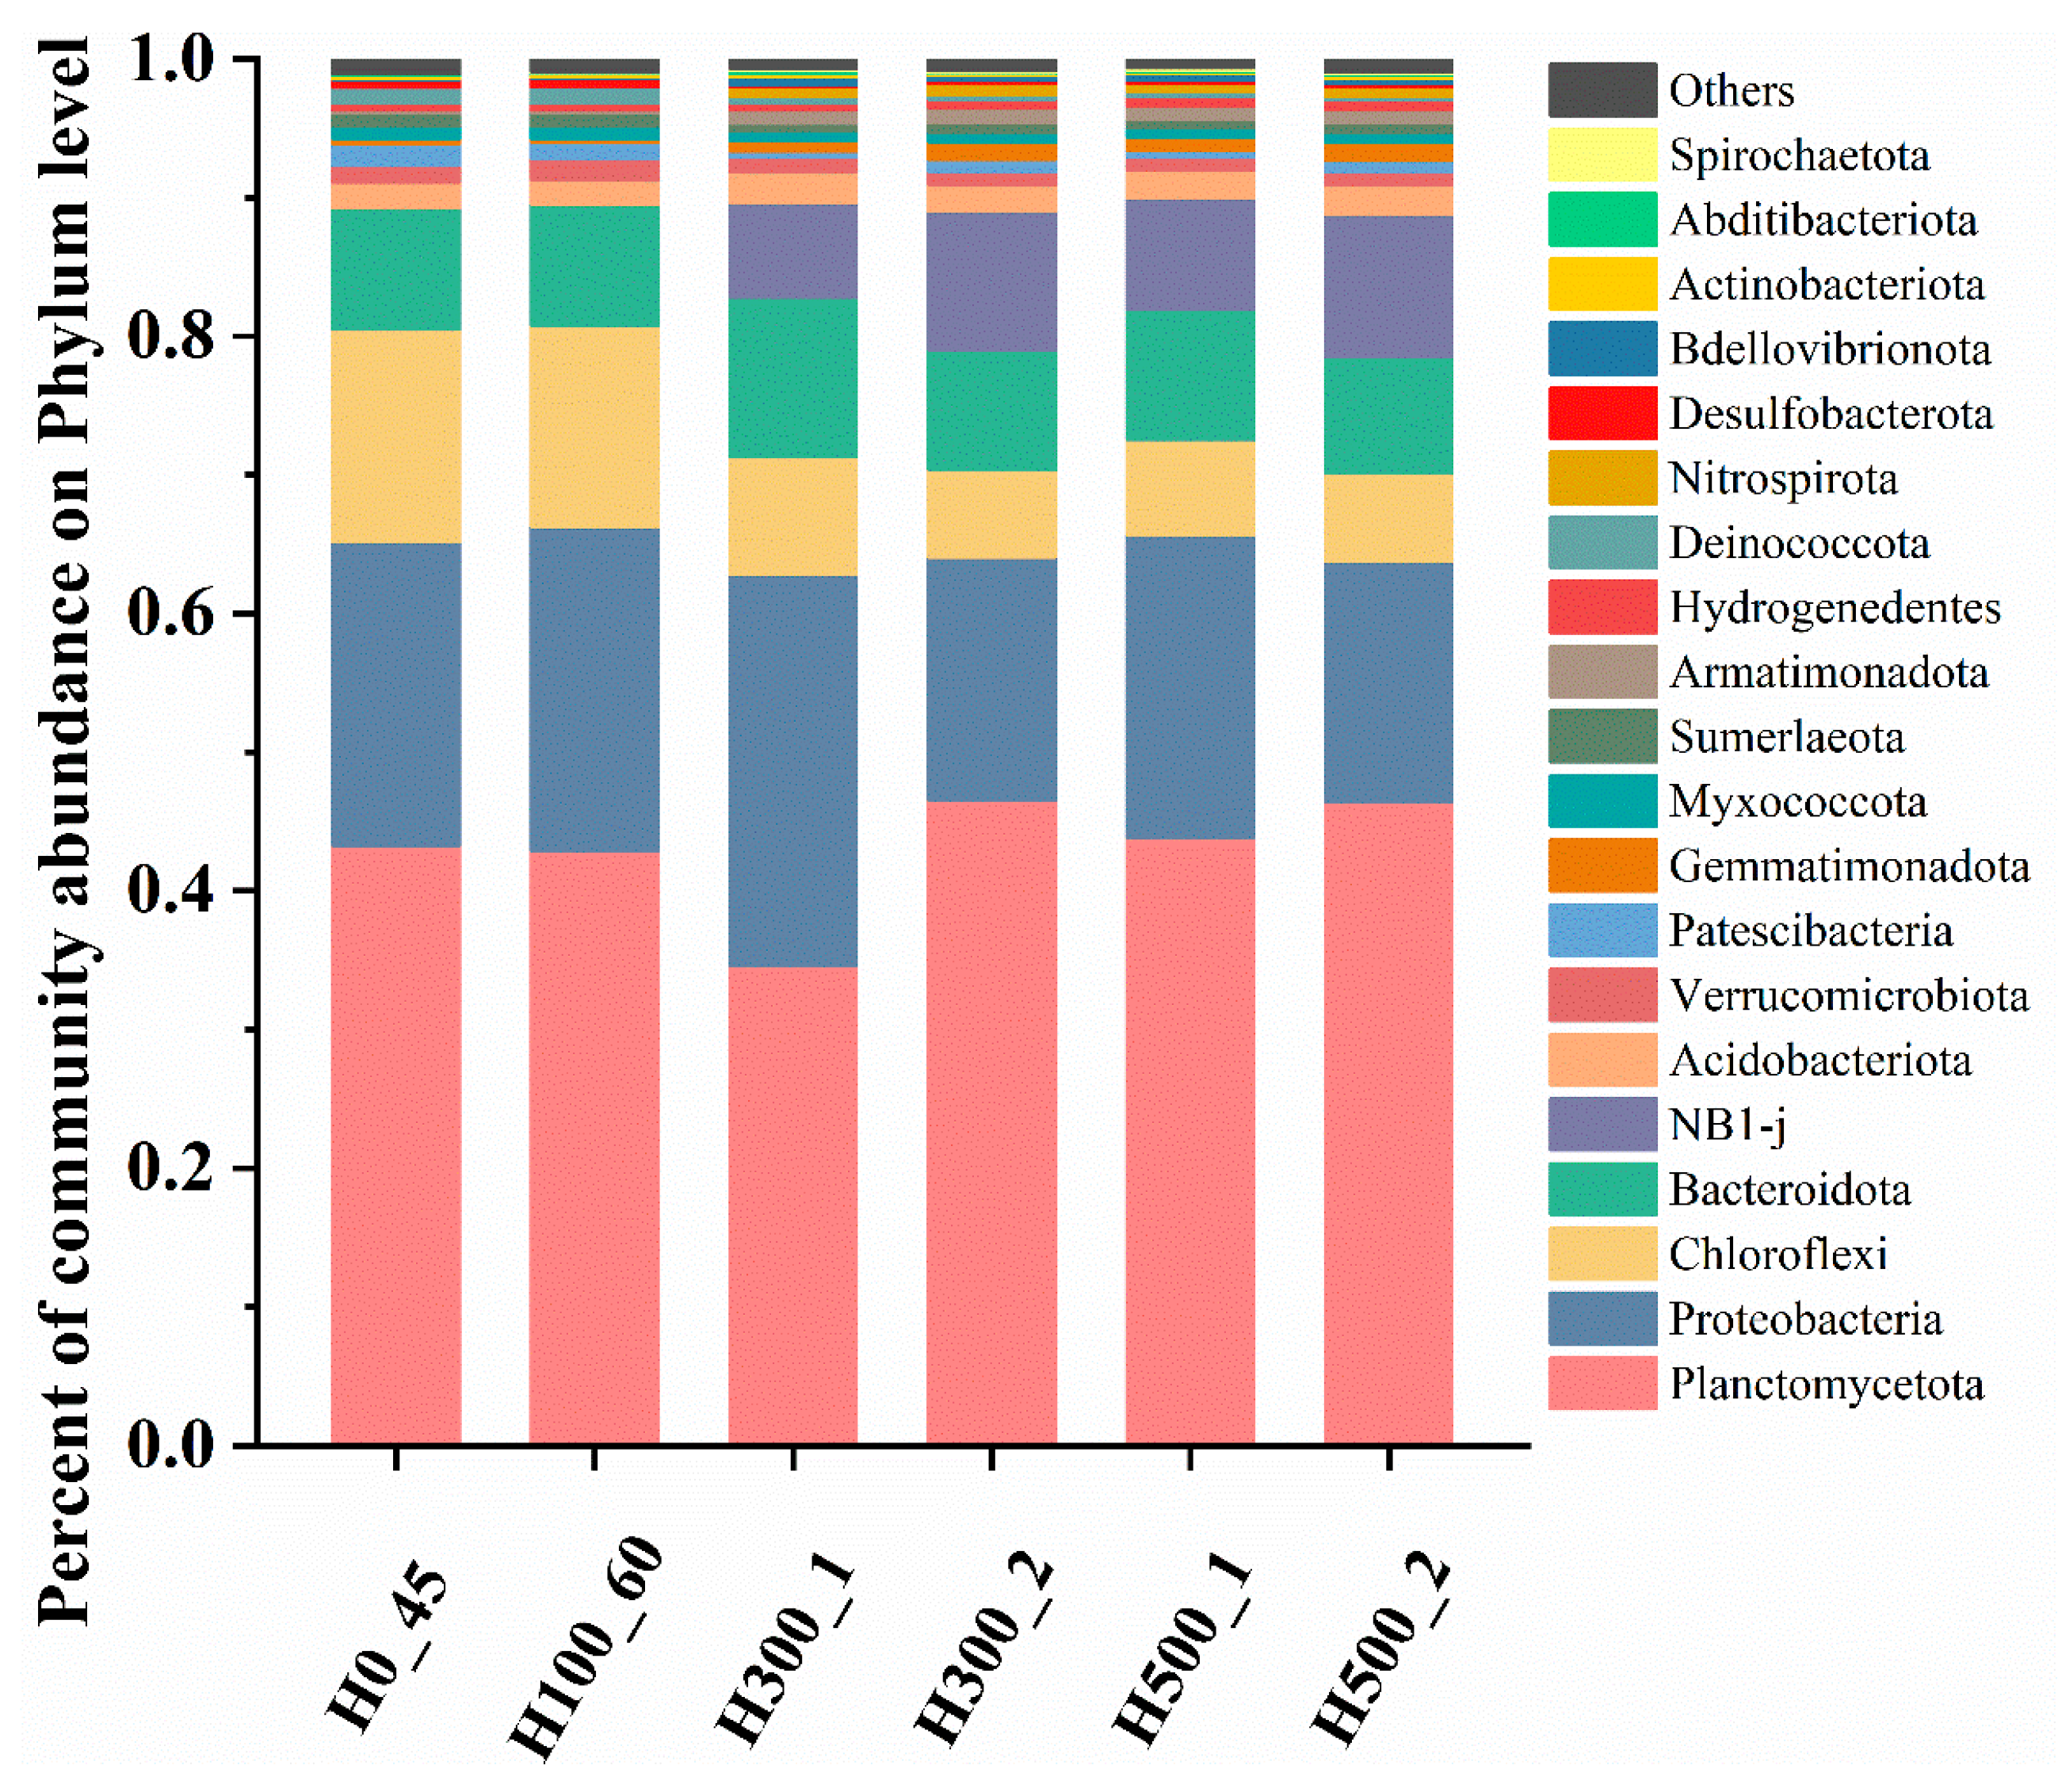
3.3.2. Microbial Community Composition Analysis
A total of 40 phyla were detected across six samples, with 9 phyla exhibiting relative abundances > 1% (
Figure 5). In R0 and R100, the dominant phyla were
Planctomycetota,
Proteobacteria,
Bacteroidota, and
Chloroflexi.
Planctomycetota encompasses all known AnAOB, including
Candidatus_Brocadia and
Candidatus_Kuenenia [
22], serving as core functional taxa in Anammox systems by directly mediating the anaerobic oxidation of ammonium and nitrite.
Proteobacteria includes diverse nitrogen-cycling genera such as
Nitrosomonas (key ammonia oxidizers) [
23] and heterotrophic denitrifiers (
Thauera,
Limnobacter,
Pseudomonas) [
24,
25].
Planctomycetota relative abundances in H0_45 and H100_60 were comparable (58.34% vs. 56.72%). In contrast, H300_1/H300_2 and H500_1/H500_2 exhibited gradual increases, reaching 46.47% and 46.34% by Day 120, respectively. This recovery trajectory aligned with restored nitrogen removal performance. Conversely,
Proteobacteria abundances displayed an inverse trend. Notably,
NB1-j proliferated significantly in R300 and R500 during recovery. Previous studies indicate strong co-occurrence relationships between
NB1-j and microalgae (e.g.,
Bacillariophyta,
Pyrenomonadales) [
26]. All four reactors were uniformly equipped with identical and rigorous light-blocking measures, including wrapping with heating tape and affixing opaque aluminum foil. However, due to differences in their physical placement, reactors R300 and R500 experienced unintended exposure to direct sunlight. We hypothesize that inadequate light-shielding measures during recovery may have triggered algal proliferation, indirectly promoting
NB1-j enrichment.
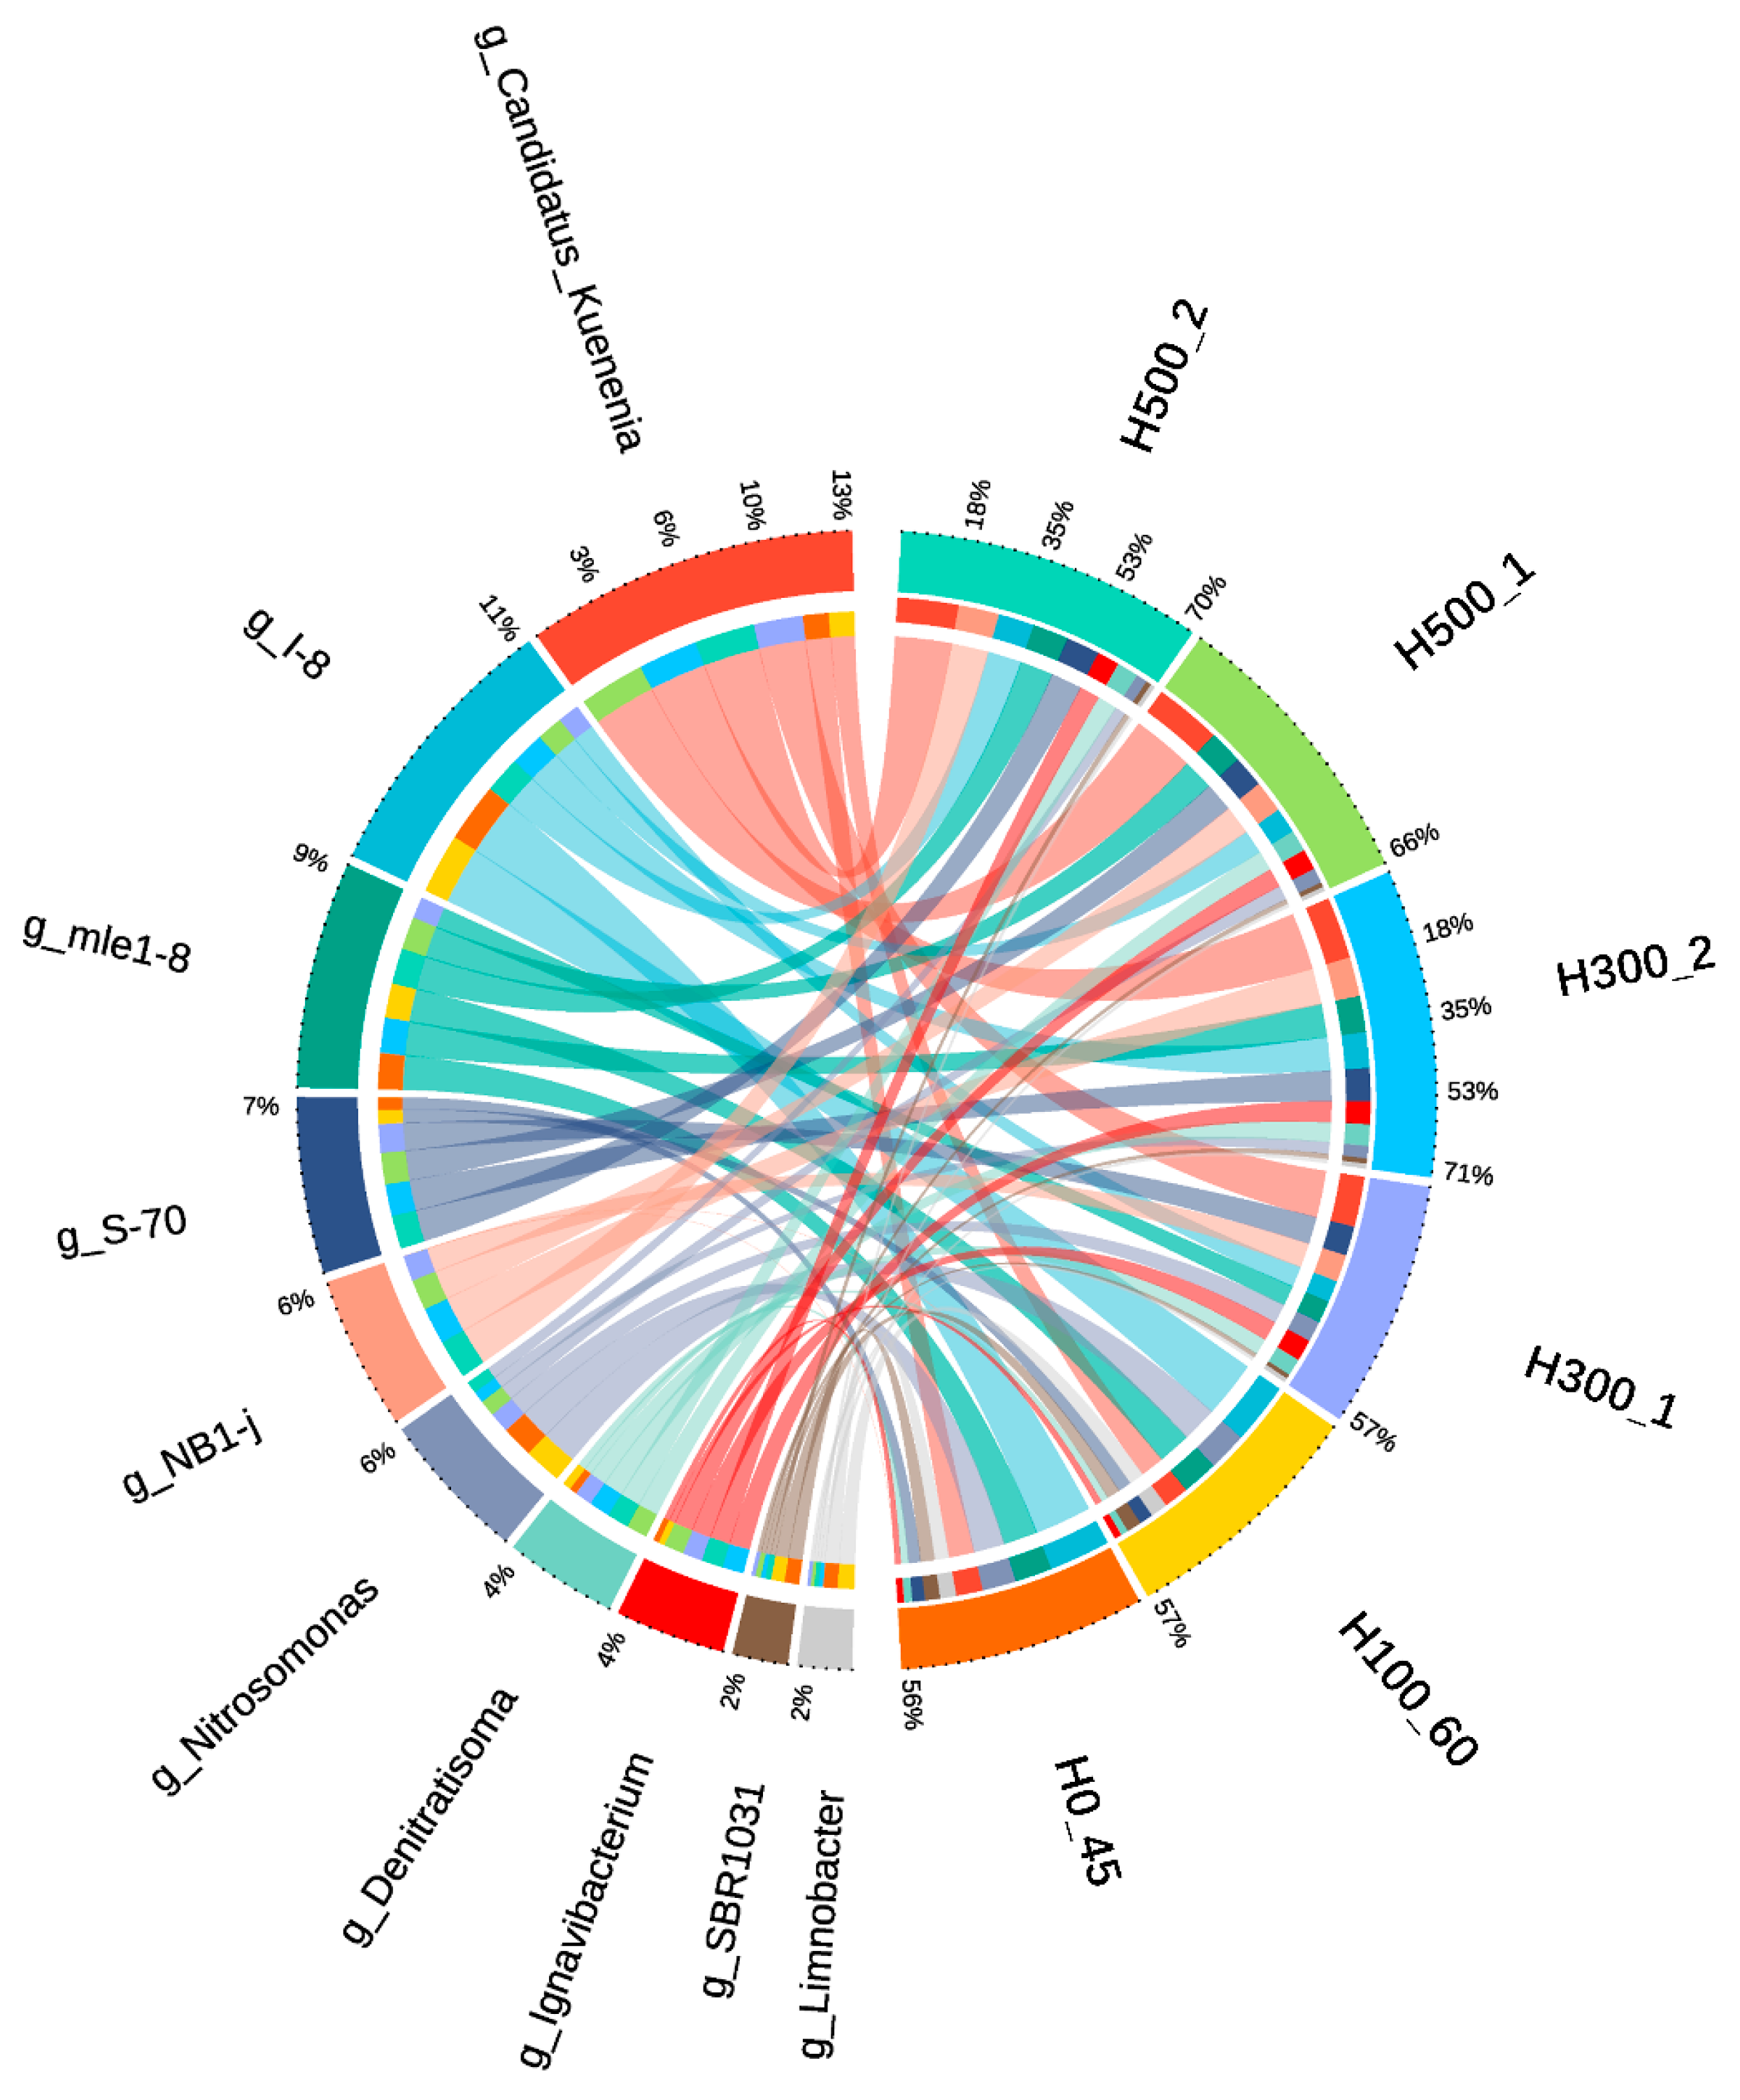
Genus-level analysis of the top 10 taxa (
Figure 6) revealed
Candidatus_Kuenenia as the sole Anammox functional genus across all samples. Combined with phylum-level data, 16S rDNA sequencing confirmed
Candidatus_Kuenenia and
Nitrosomonas as the primary drivers of nitrogen removal in CANON biofilm systems. In H300_2 and H500_2,
Nitrosomonas abundances recovered to 3.30% and 3.07%, respectively, consistent with late-phase TNRR and TNRE recovery trends. Other denitrifiers (
Limnobacter,
Denitratisoma) also showed elevated abundances, with
Denitratisoma reaching 4.64% (H300_2) and 5.69% (H500_2). These findings demonstrate that collapsed systems can be resuscitated post inhibition through operational parameter adjustments (NH
4+-N
inf concentration, flow velocity, aeration rate). However, experimental results confirm incomplete functional recovery, with recovery duration positively correlated with initial sodium acetate exposure intensity.
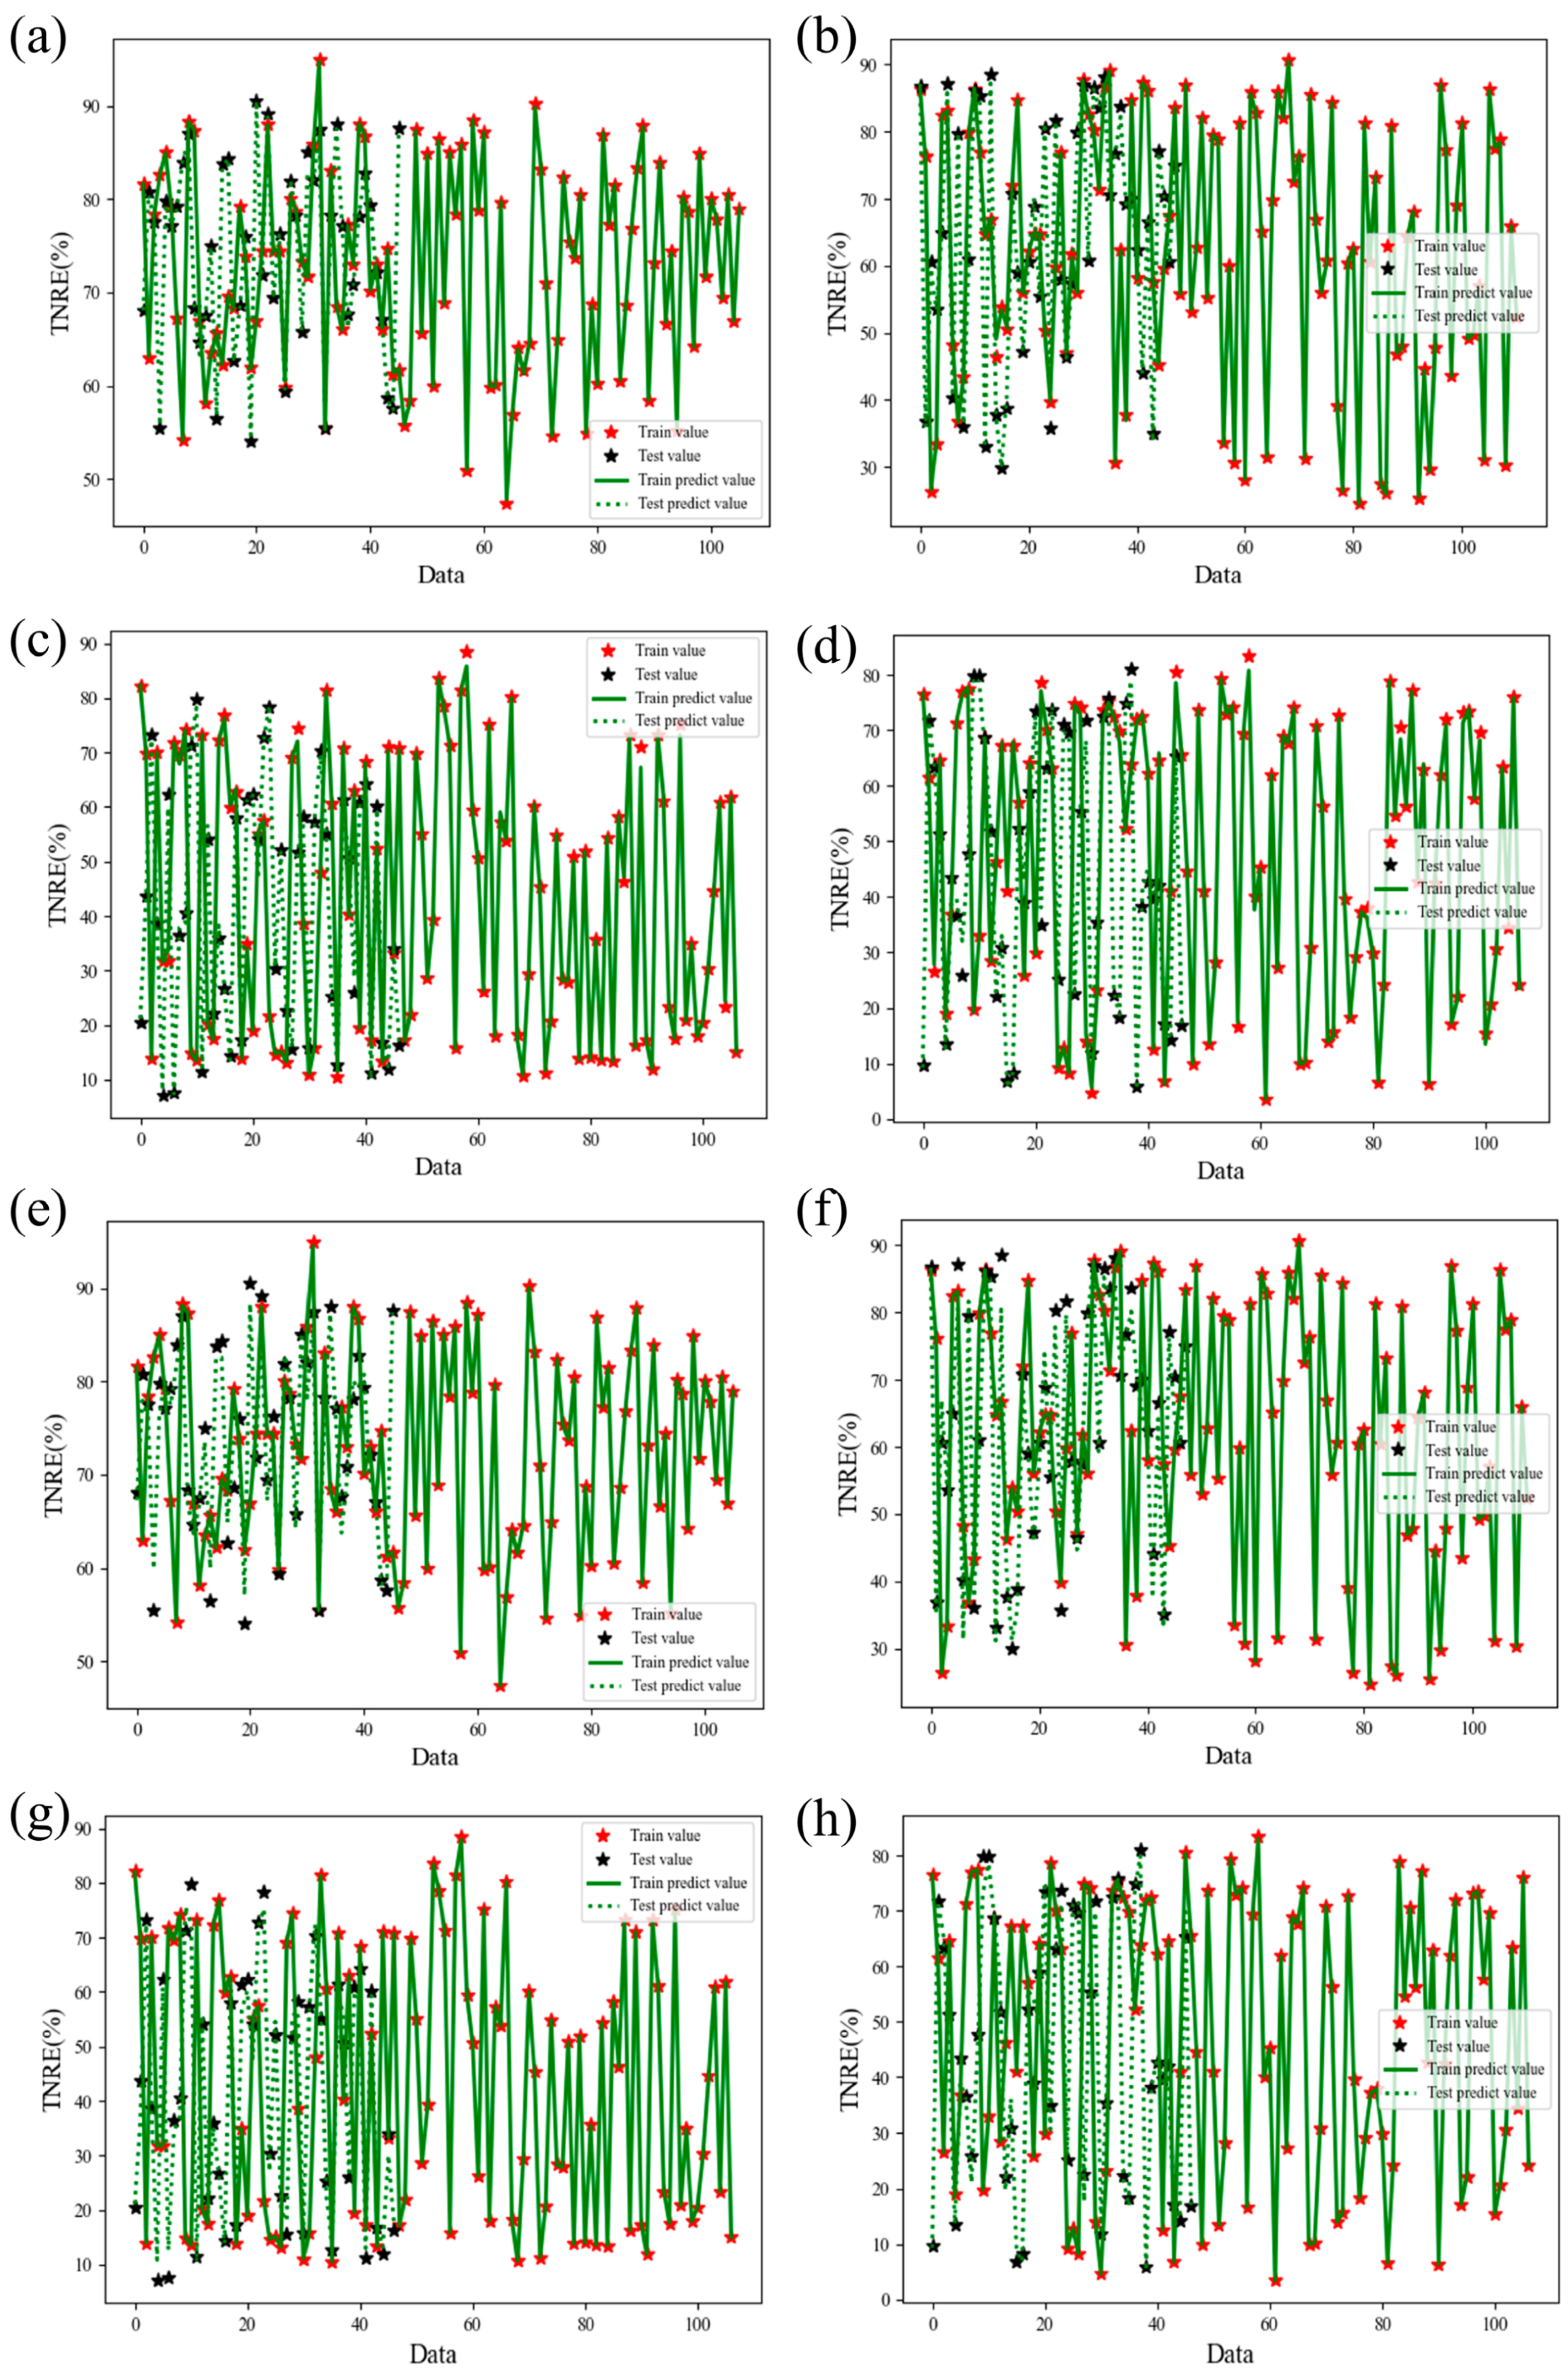
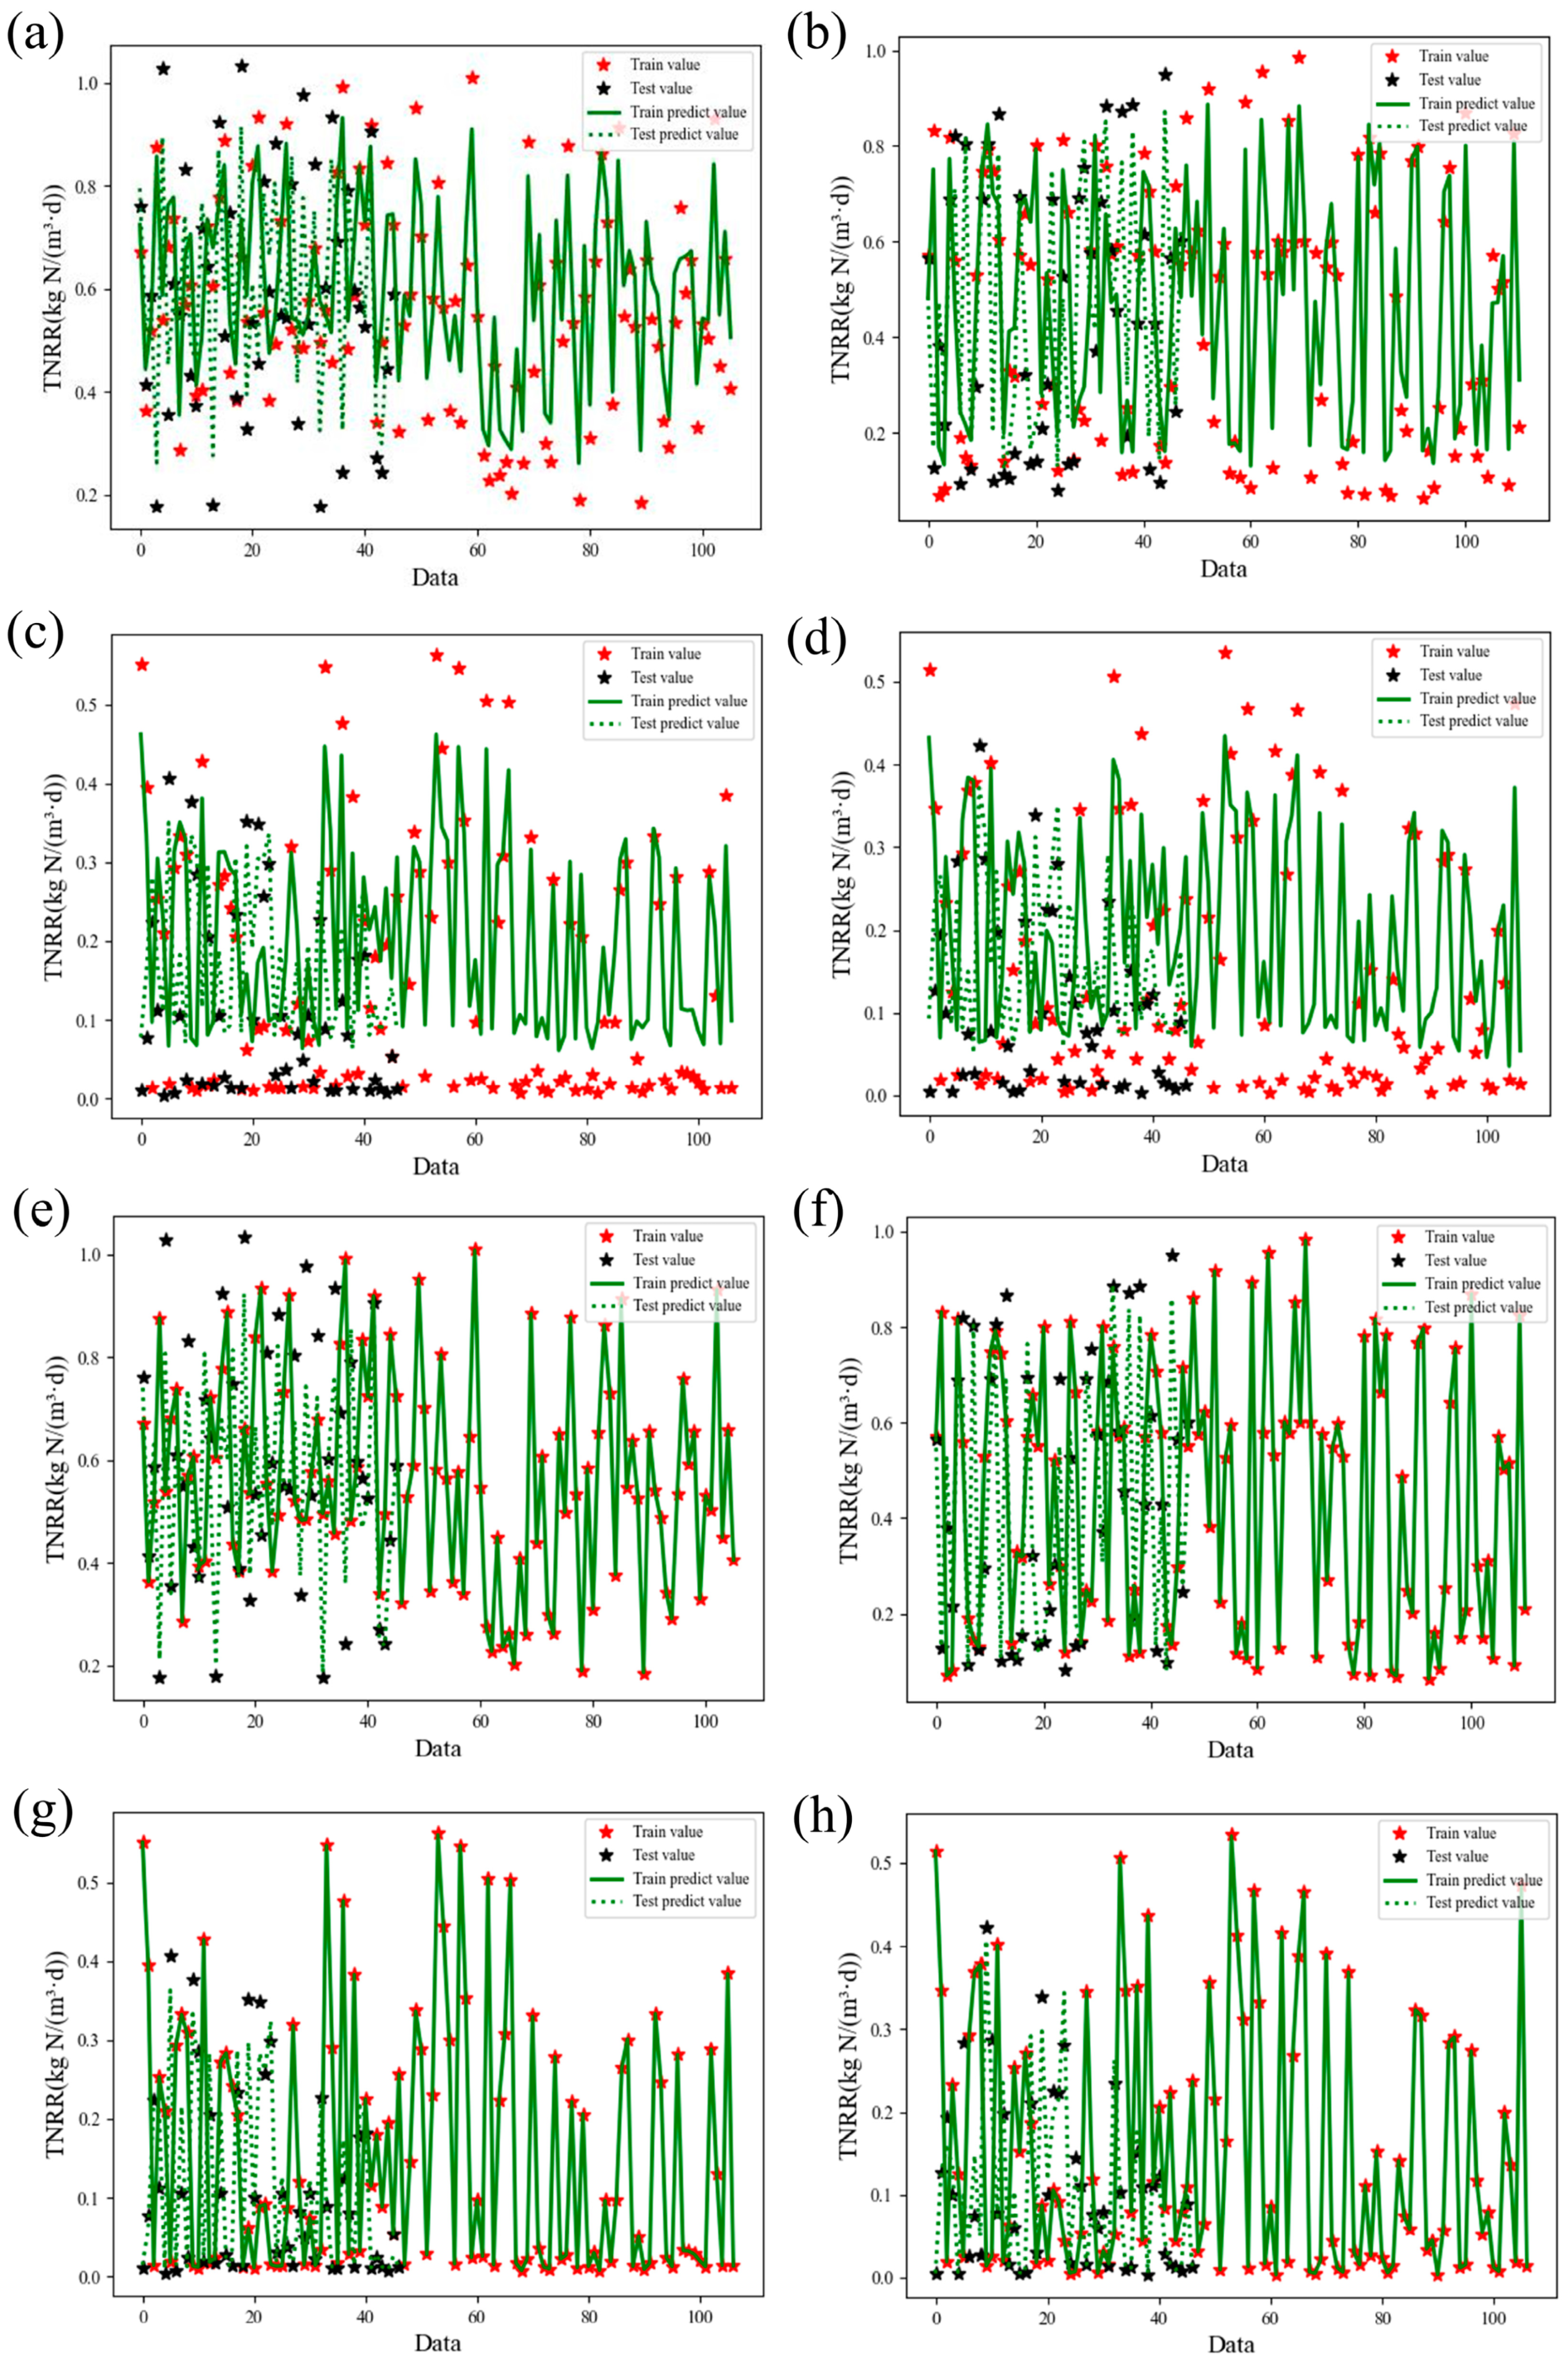
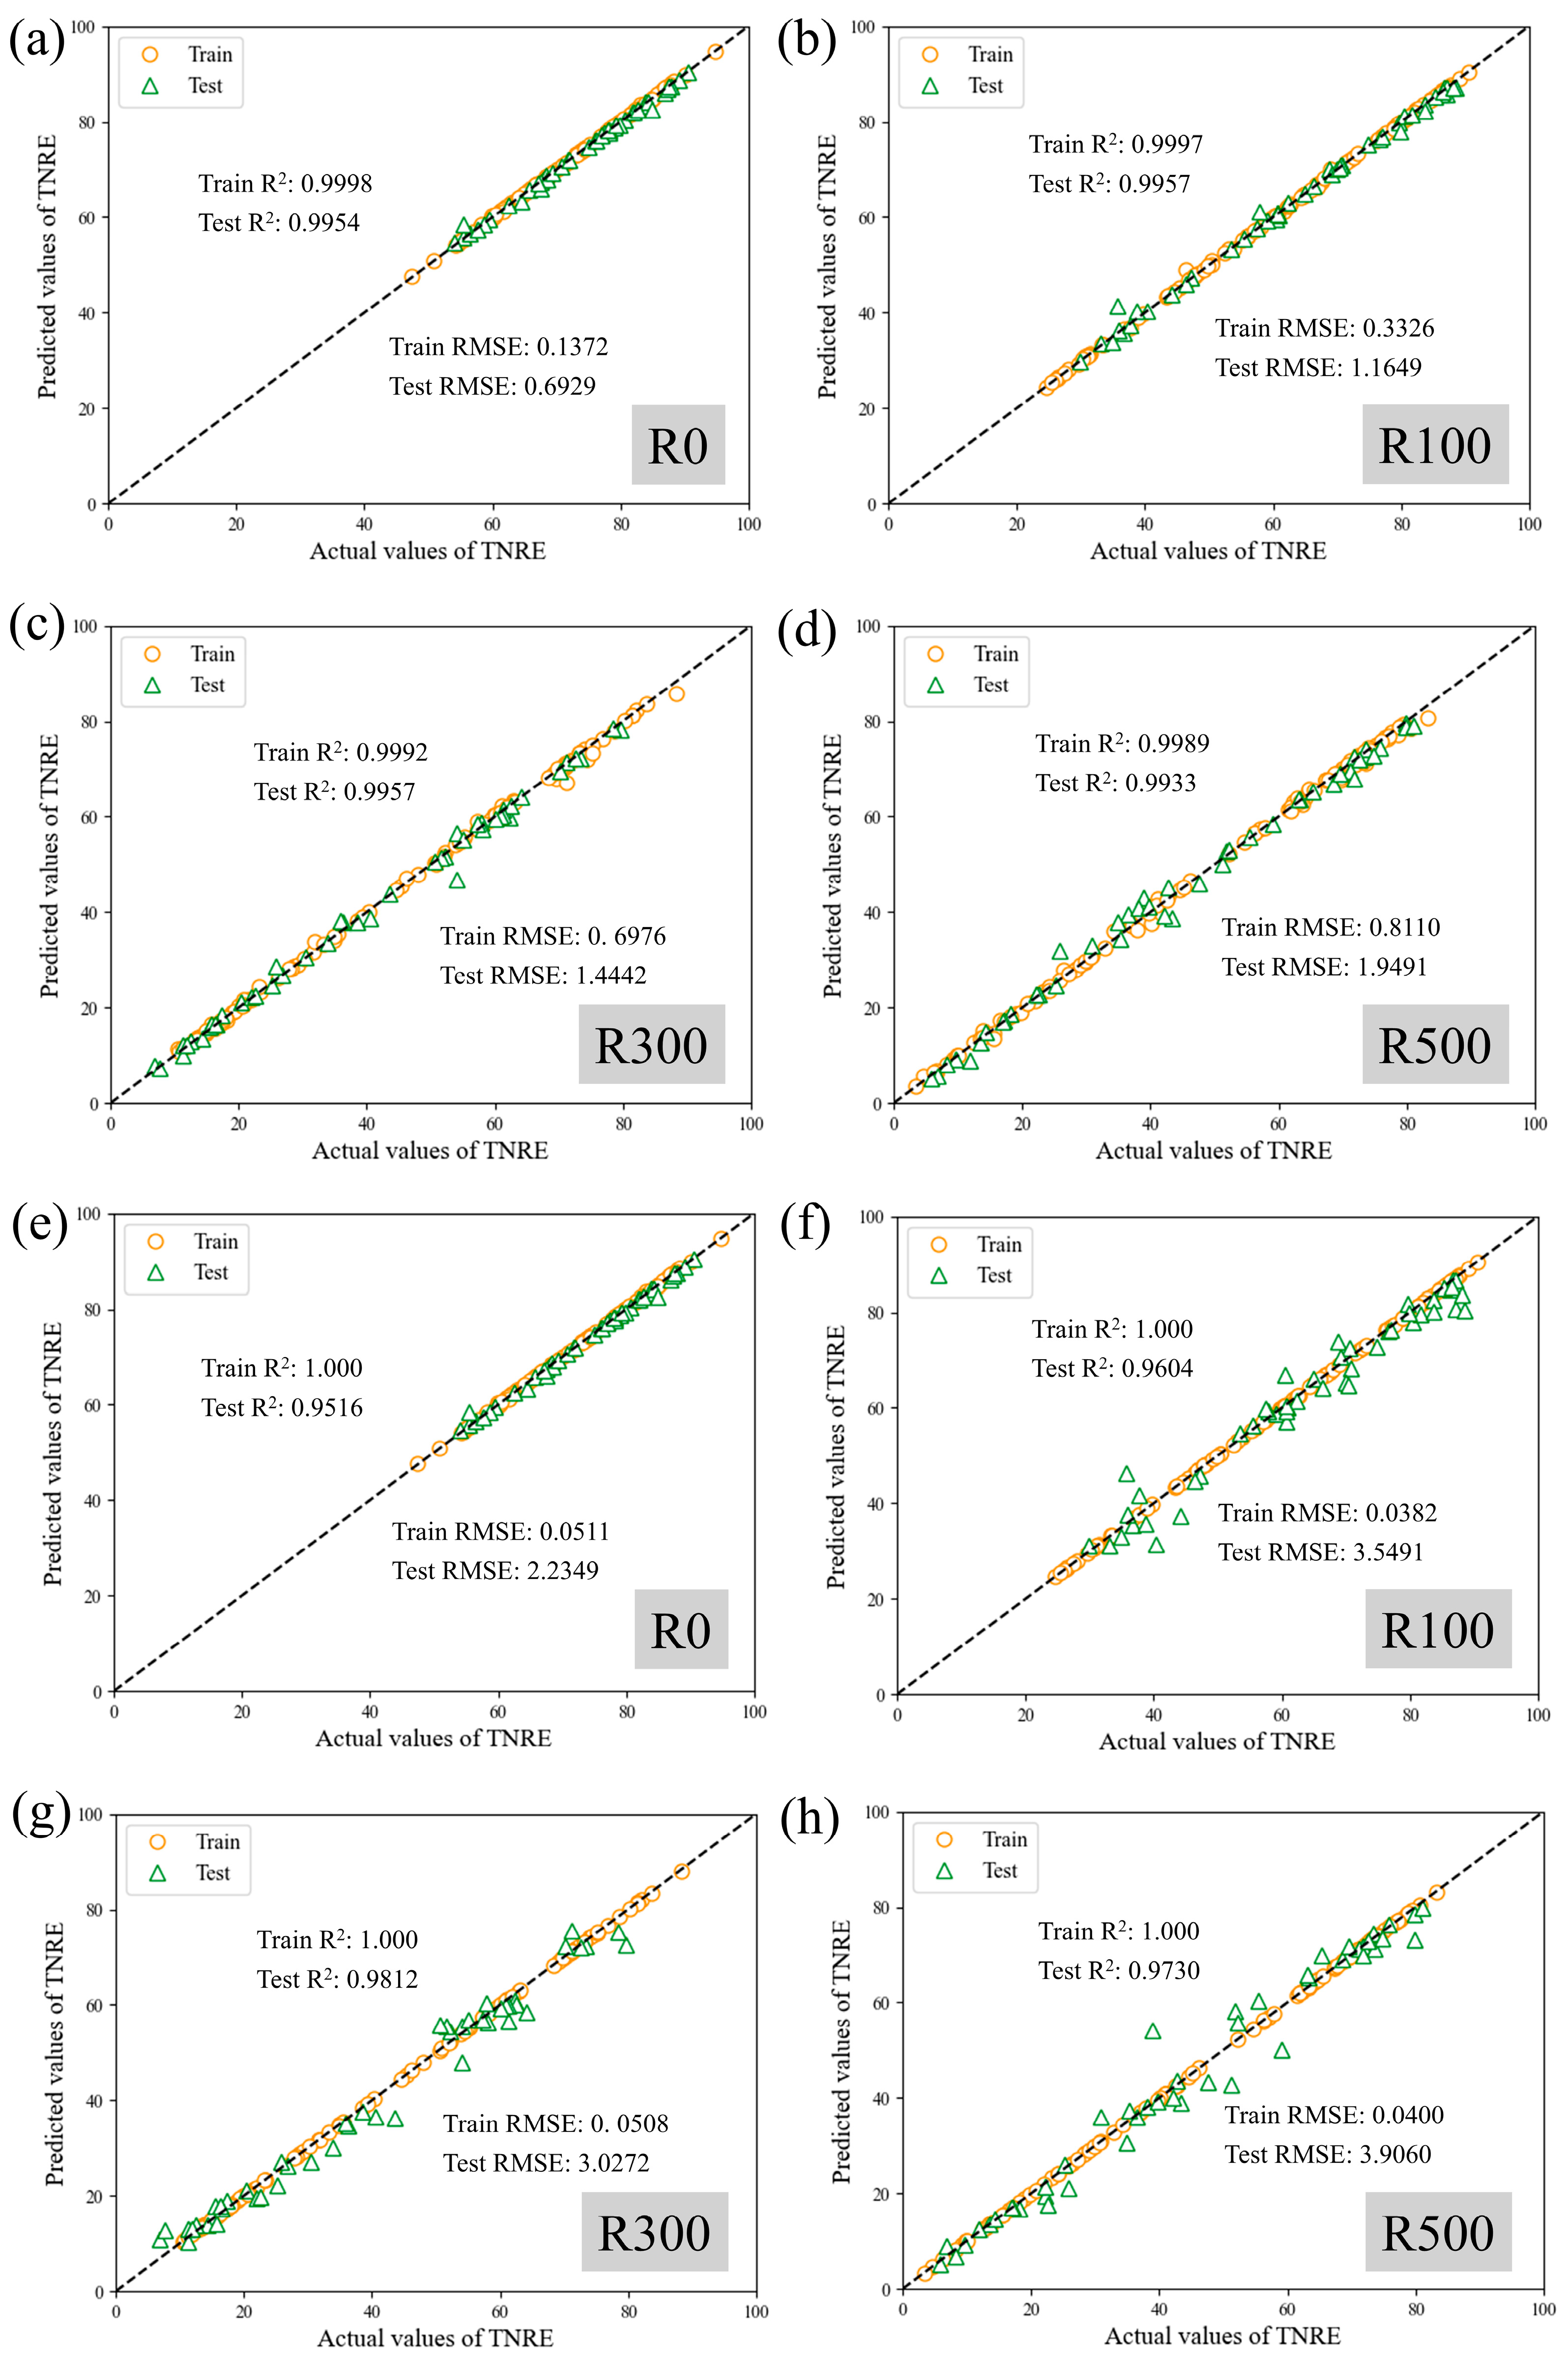
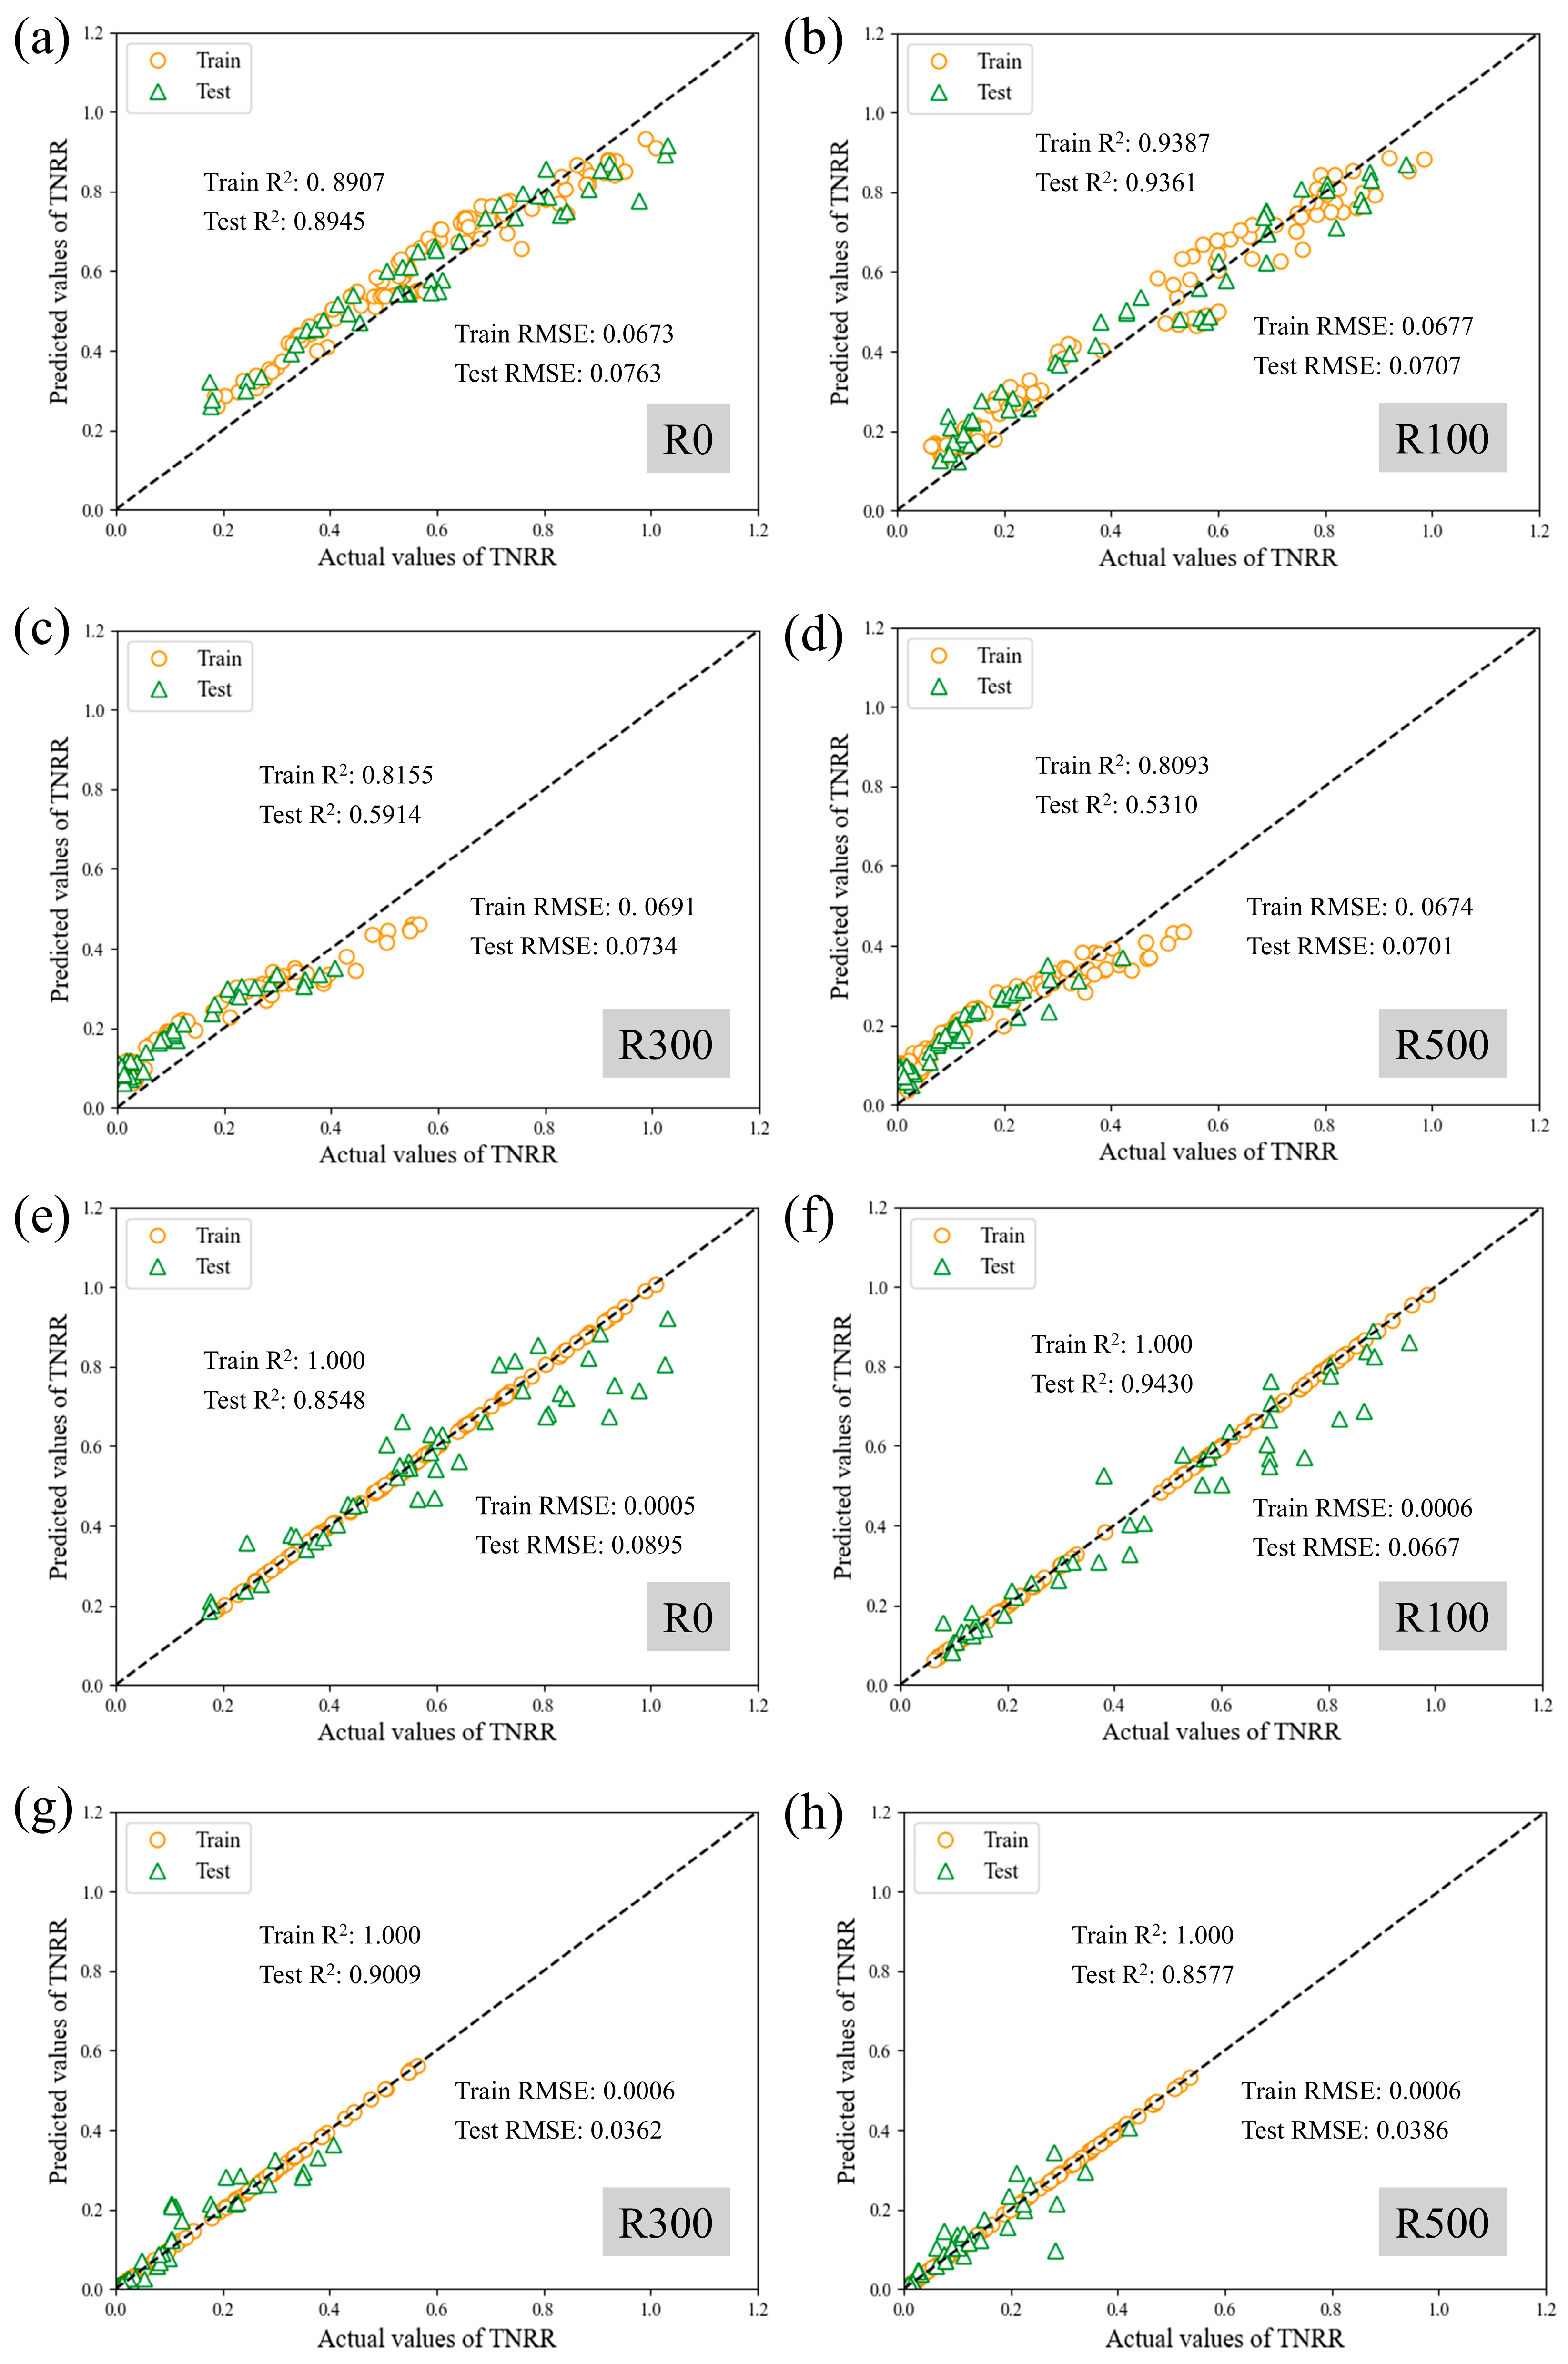
3.4. Machine Learning Model Prediction for System Performance in Recovery Phase
To analyze and predict nitrogen removal performance dynamics during Anammox biofilm system recovery, this study employed Support Vector Regression (SVR) and XGBoost models using 12 operational features. Prediction performance for TNRE and TNRR is illustrated in
Figure 7 and
Figure 8, evaluated via coefficient of determination (R
2) and root mean square error (RMSE). Comparative plots of predicted versus measured TNRE and TNRR are provided in
Figure A1 and
Figure A2. For machine learning algorithms, R
2 values approaching 1.000 indicate superior model fitting, while lower RMSE values denote enhanced predictive accuracy. For TNRE prediction, SVR achieved R
2 values closer to 1.000 and lower Test RMSE than XGBoost, demonstrating superior precision. For TNRR prediction, XGBoost exhibited R
2 values approaching 1.000 and lower Test RMSE than SVR, indicating higher accuracy in biofilm system TNRR forecasting. Detailed prediction results for both models are summarized in
Table 3.
Analysis of XGBoost feature importance revealed distinct predictors for TNRE and TNRR recovery patterns. For TNRE prediction, the ΔTN/ΔNH4+-N ratio dominated feature contributions across reactors (R100: 88.99%, R300: 93%, R500: 92%), demonstrating exceptional consistency (>88%) in nitrogen substrate stoichiometric ratio as the key recovery driver. Conversely, HRT emerged as the primary predictor for TNRR, particularly in R300 (72% contribution) and R500 (55%), which strongly underscores the pivotal role of operational strategy adjustments in restoring CANON biofilm system performance.
This study demonstrates that model-specific selection (SVR for TNRE vs. XGBoost for TNRR) can replace traditional time-consuming and costly experimental approaches (e.g., long-term continuous-flow reactor trials), providing an efficient predictive framework to assess the impacts of sustained medium-high sodium acetate dosing on Anammox biofilm processes.
4. Conclusions
This study elucidates the recovery characteristics of Anammox biofilm systems under medium-high sodium acetate stress through dynamic regulation strategies and establishes machine learning predictive models. The main conclusions are as follows:
(1) Validation of Recovery Strategy Effectiveness: gradient load regulation enables functional recovery across varying sodium acetate inhibition intensities. For low-concentration groups (R0, R100), TNRE recovered to >80% within 40–60 days via NLR optimization (0.216 → 0.495 kg N/(m3·d)) and aeration rate adjustments (50–200 mL/min). High-concentration groups (R300, R500) achieved TNRE recovery to 57.98–58.86% over 100–120 days through residual NH4+-N and NO2−-N replacement and HRT control, with recovery duration positively correlated with acetate concentration.
(2) Nitrogen Removal Pathways and Microbial Synergy: stoichiometric analysis revealed reconstructed Anammox dominance in R100 (ΔTN/ΔNH4+-N = 0.882), approaching CANON theoretical values. Significant ΔNO3−-N/ΔNH4+-N ratio fluctuations in R300 and R500 necessitated precise aeration control to suppress nitrification competition. Microbial succession showed Candidatus_Kuenenia abundance recovery to 16.06% (R300) and 15.85% (R500), synchronized with TNRE improvement. Denitratisoma predominance (4.64–5.69%) exceeded R0 and R100 levels.
(3) Predictive Model Development: based on 12 operational parameters (NH4+-N, NO2−-N, NO3−-N, COD concentrations, HRT, etc.), the XGBoost model demonstrated superior TNRR prediction accuracy, while SVR excelled in TNRE forecasting. This provides a real-time regulation tool for engineering recovery. The findings offer a theory-technology integrated solution for early warning and recovery strategies in high-ammonia-organic compound wastewater treatment processes.


