2. Materials and Methods
2.1. Analysis of Behavioral Risk Assessment Index System Based on BN
This paper investigates the key factors influencing worker safety behavior in nuclear power plants (NPPs) under construction. We categorized, synthesized, and integrated safety-related data to construct a Bayesian network (BN) model. A BN is a mathematical framework commonly used to represent probabilistic dependencies among random variables. It can be defined as follows:
In the formula, Xi represents the i-th node. When the prior probability of the nodes and the conditional probabilities of each node are known, the joint probability of all nodes can be calculated.
This paper analyzes employee injury and fatality incidents reported internally by the China Nuclear Engineering Group between 2015 and 2024. Drawing on this dataset, a Bayesian network model was developed to assess behavioral risks among workers in nuclear power plants (NPPs) under construction, as illustrated in
Figure 1.
To determine the model parameters, a two-stage approach was adopted. First, structured data from incident reports were analyzed to extract relevant behavioral factors, environmental contexts, and accident outcomes. Causal relationships among these variables were identified using co-occurrence frequencies and time-sequenced incident chains. These data-driven correlations informed the initial structure of the Bayesian network (BN) and provided quantitative inputs for many conditional probability tables (CPTs), particularly for intermediate and leaf nodes with sufficient data records.
Second, for nodes with limited or unavailable empirical data, such as prior probabilities of root causes or rare conditional scenarios, expert elicitation was employed to supplement the model. A panel of ten senior experts was convened, each with over 15 years of experience in nuclear construction safety, representing areas such as structural design, field operations, and regulatory oversight. The Delphi method guided two rounds of independent assessments, during which experts evaluated the importance and interdependencies of uncertain variables. Their responses were normalized and averaged to generate probability estimates for the corresponding CPT entries.
To mitigate subjectivity and enhance model robustness, the following measures were implemented: (i) standardized guidance materials ensured consistent interpretation of variables; (ii) logical coherence of expert inputs was cross-verified; and (iii) extreme outlier scores were smoothed using statistical adjustment techniques. A final expert validation session was conducted to confirm the model’s structural logic and its practical applicability to real-world scenarios.
This dual-source methodology, integrating empirical construction data with structured expert input, ensures that the resulting BN model is both data-driven and operationally relevant, enabling accurate analysis of behavioral risk dynamics in the context of nuclear power plant construction.
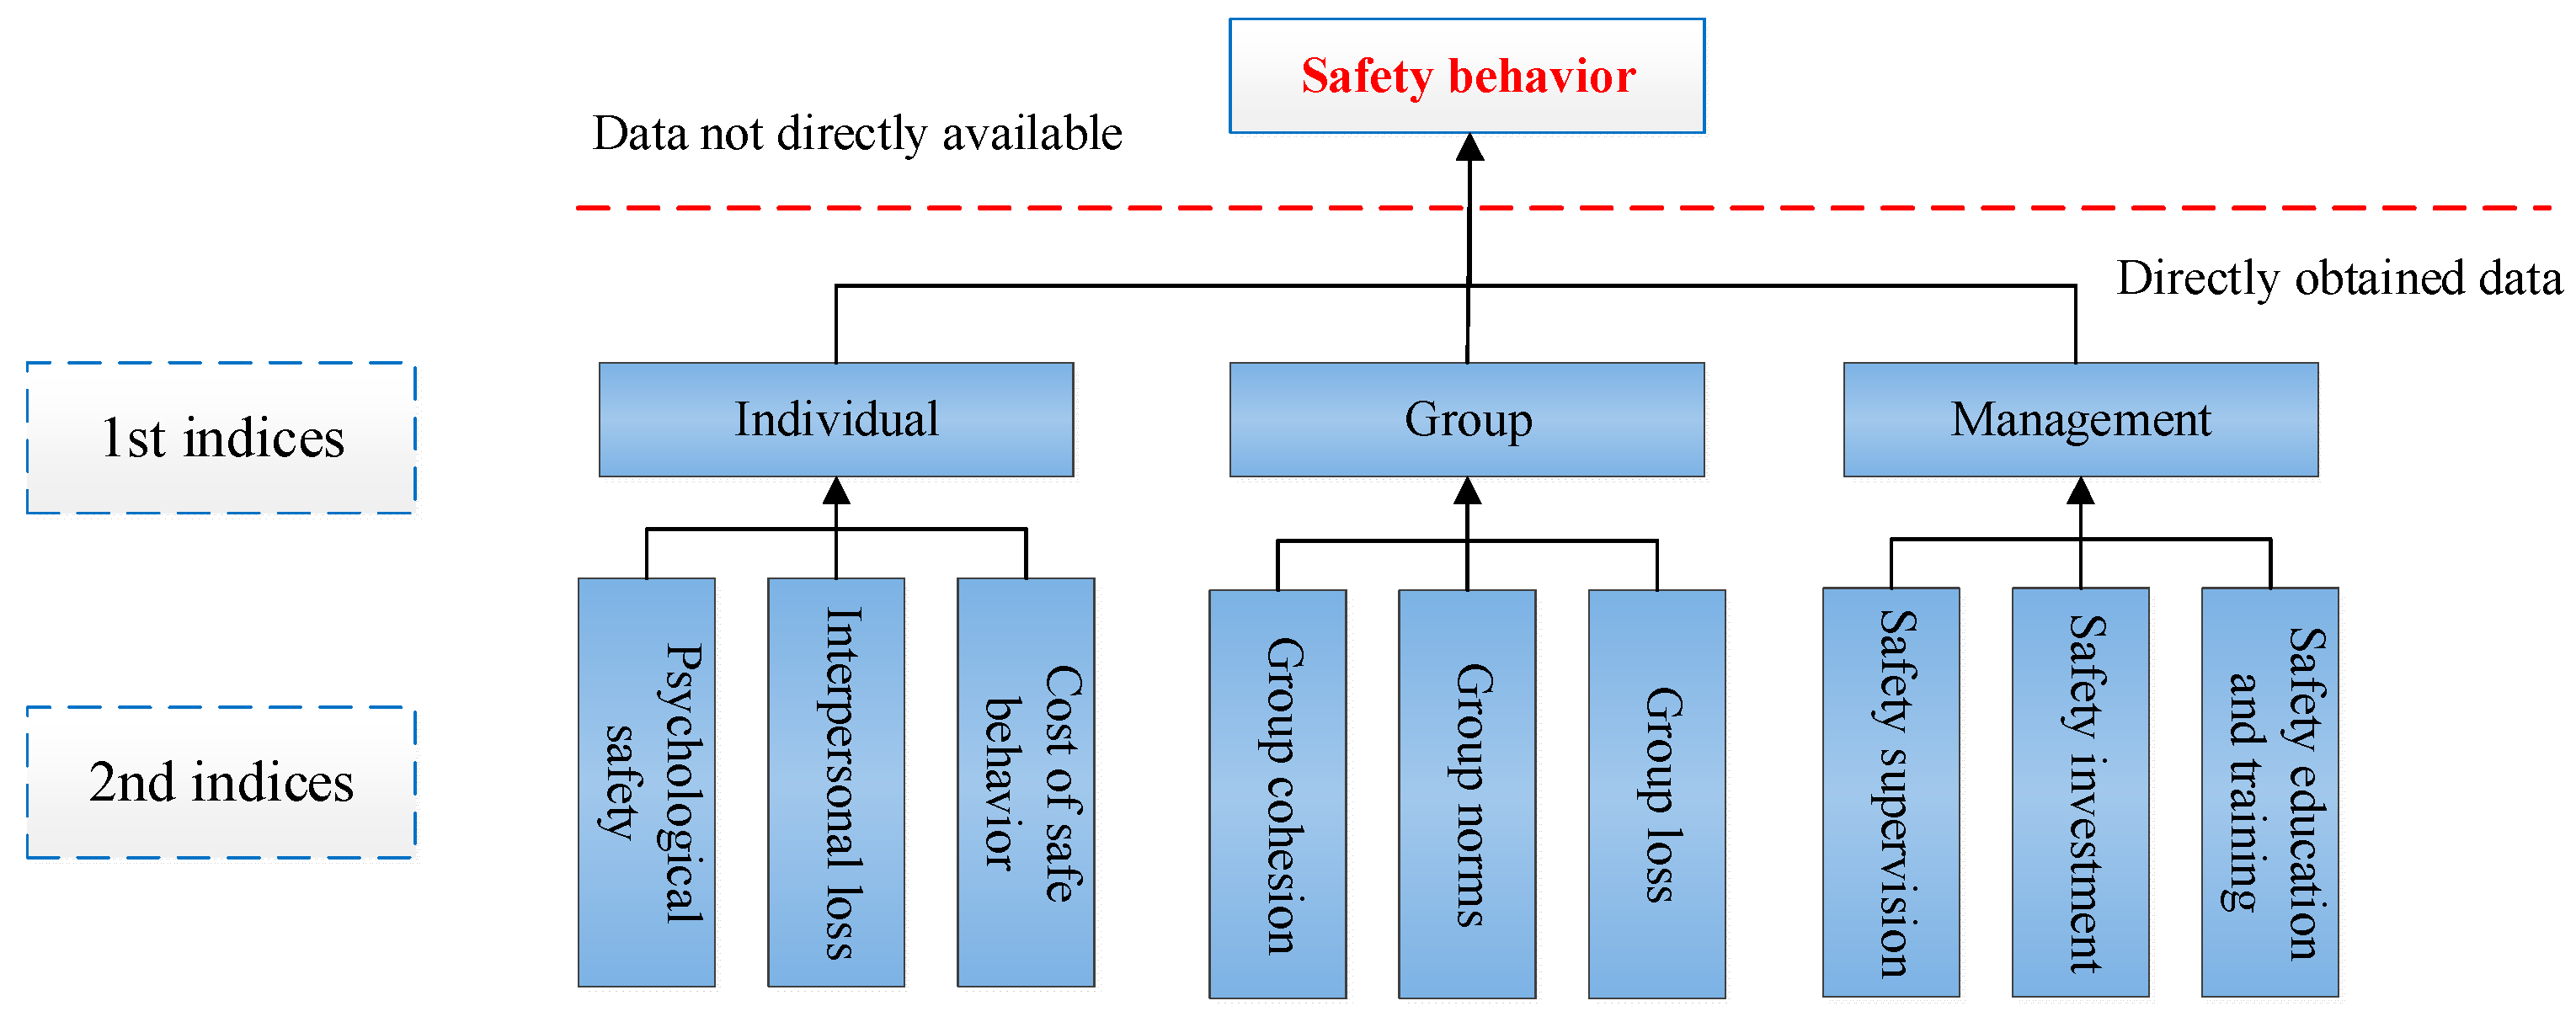
The key indicators selected for constructing the Bayesian network nodes are summarized in
Table 1. These variables were identified based on their frequency in incident reports and expert evaluation of behavioral relevance.
To obtain objective and reasonable indicator scoring results, a data preprocessing method was applied, proceeding from parent nodes to child nodes. The target node Z has n primary network nodes A, B, …, N, with scores K1, K2, …, Kn. The score of Z is expressed as follows:
For a primary network node A, if A has m secondary network nodes A1, A2, …, Am, the score of the primary network node A is expressed as follows:
The specific data obtained through the calculation are shown in
Table 2.
2.2. Game Simulation Analysis of Individual and Group Behaviors
2.2.1. Analysis of Evolutional Rules of Individual and Group Safety Behavior
The psychological force field theory posits that human behavior arises from the interaction between an individual’s internal psychological field, shaped by personal needs, and the external force field, determined by environmental influences. Consequently, individual behavior can be viewed as a dynamic interplay or “game” between internal psychological drivers and the behavioral tendencies of the group to which the individual belongs.
The choice of individual behavior is strongly influenced by the perceived sense of psychological safety within the group. When individuals feel psychologically safe, they are more inclined to collaborate with the group and continuously adjust their actions to align with collective behavioral norms. This, in turn, reinforces group cohesion and helps unify behavioral standards. Over time, the accumulation and convergence of individual behaviors according to shared patterns leads to the formation of coherent group behavior.
However, when individuals possess greater self-confidence and perceive that their personal gains outweigh those associated with group conformity, their behaviors tend to diverge from group norms. In such cases, personal objectives take precedence, and individual actions may disrupt group cohesion. This can reduce group size or even lead to group fragmentation and the emergence of new subgroups.
Figure 2 illustrates the evolution model of individual and group behaviors based on the psychological force field theory. On the left side of the diagram, environmental and managerial factors shape group behavior and generate an implicit group-level force field that encourages individuals to conform. On the right side, an individual’s psychological safety, shaped by personal traits and goal-oriented motivations, affects their perception of the benefits of aligning with group behavior. These two opposing forces interact to influence the individual’s behavioral decisions. The bidirectional arrows indicate mutual influence: while group norms shape individual actions, deviations at the individual level can, in turn, alter group norms or lead to group fragmentation.
Individuals are inherently members of one or more social groups. When an individual’s opinions deviate from the majority within a group, they often experience social pressure. To avoid isolation, individuals may compromise on their own viewpoints and conform to the group’s dominant stance. In this context, an individual’s behavior can be conceptualized as a strategic interaction with the group. Each individual continuously evaluates the relative benefits of aligning with or diverging from group behavior and chooses the strategy that maximizes personal gain.
2.2.2. Game Theory Model
Based on the elements of group dynamics and game theory, the following assumptions were first made.
- (1)
In the game process, the group and individuals are two parties. Each party has two strategies: safe and unsafe behaviors.
- (2)
The effect of the group on individuals is mainly reflected in the interaction between various elements in the group dynamics and their influence on individuals. When individuals and the group adopt safe behaviors, the individual’s benefit is a sense of psychological security, p. The benefits for the group members are the changes in various elements in the group dynamics, mainly including group cohesion, n, and group standard consistency, g. Both group cohesion, n, and group standard consistency, g, increase with the increase in the probability of group safety behavior (denoted as x).
- (3)
When the individual behaviors are inconsistent with the group behaviors, the individual suffers from interpersonal loss, denoted as l. However, after the adoption of unsafe behaviors, accidents may occur. The proportion of the occurrence of accidents and the caused loss are denoted as f and s, respectively.
- (4)
Everyone in a group is independent and chooses a safe behavior or unsafe behavior strategy at the same time. In this study, c denotes the extra cost when the individual chooses safe behaviors; the individual does not need to pay the cost when choosing unsafe behaviors. The gain coefficient is denoted as r.
In this study, individual behavior was modeled using a dual-strategy framework, namely the choice between safe and unsafe behavior. This formulation reflects the prevailing behavioral orientations typically observed in high-risk construction settings, where decisions tend to polarize under pressure. To facilitate tractable modeling of group–individual interactions, the framework adopts consistent behavioral parameters and deterministic payoff values across agents. This approach helps clarify the core dynamic relationships and supports the analysis of behavioral evolution.
Based on the above assumptions, the payoff matrix of both sides of the game was obtained, as listed in
Table 3.
In this study, the probability when the group chooses safe behaviors is denoted as x, the probability when the group chooses unsafe behaviors is denoted as 1 − x, the probability when individuals choose safe behaviors is denoted as y, and the probability when the individual chooses unsafe behaviors is denoted as 1 − y. Both x and y are functions of time t.
According to
Table 3, the expected benefits of individuals choosing safe behaviors, u1, can be calculated as follows:
The expected benefits of individuals choosing unsafe behaviors, u2, can be calculated as follows:
Therefore, the average expected benefits of individuals choosing safe and unsafe behaviors can be calculated as follows:
The rate of change in the proportion of individuals choosing safe behaviors over time is represented by
dy/
dt. The replication dynamic equation for individuals choosing safe behaviors can be written as follows:
Similarly, the average expected benefit when the group chooses safe and unsafe behaviors can be calculated as follows:
The replication dynamic equation for the group choosing safe behaviors can be written as follows:
Equations (7) and (11) constitute a replication dynamic system, and 5 local equilibrium points of the system, (0, 0), (0, 1), (1, 0), (1, 1), ((0.15c + l)/(0.36p + 0.3c + 0.34fs), and (0.4n + 0.16g − rc)/(0.8n + 0.32g − 0.15c + 0.34fs)), can be acquired, which each correspond to an evolutionary game equilibrium. The evolution stability strategy of the system can be obtained by the local stability of its corresponding Jacobian matrix at an equilibrium point. The Jacobian matrix J, Determinant Det(J), and Trace Tr(J) of the system can be written as follows:
By substituting the local equilibrium points into the above matrices, the sign of the Determinant Det(J) and Trace Tr(J) can be determined. If the Determinant Det(J) of the matrix corresponding to the equilibrium point is greater than 0, and the Trace Tr(J) of the matrix is less than 0, it can be regarded as an evolutionary stable strategy. If the Trace Tr(J) equals 0, it is a saddle point.
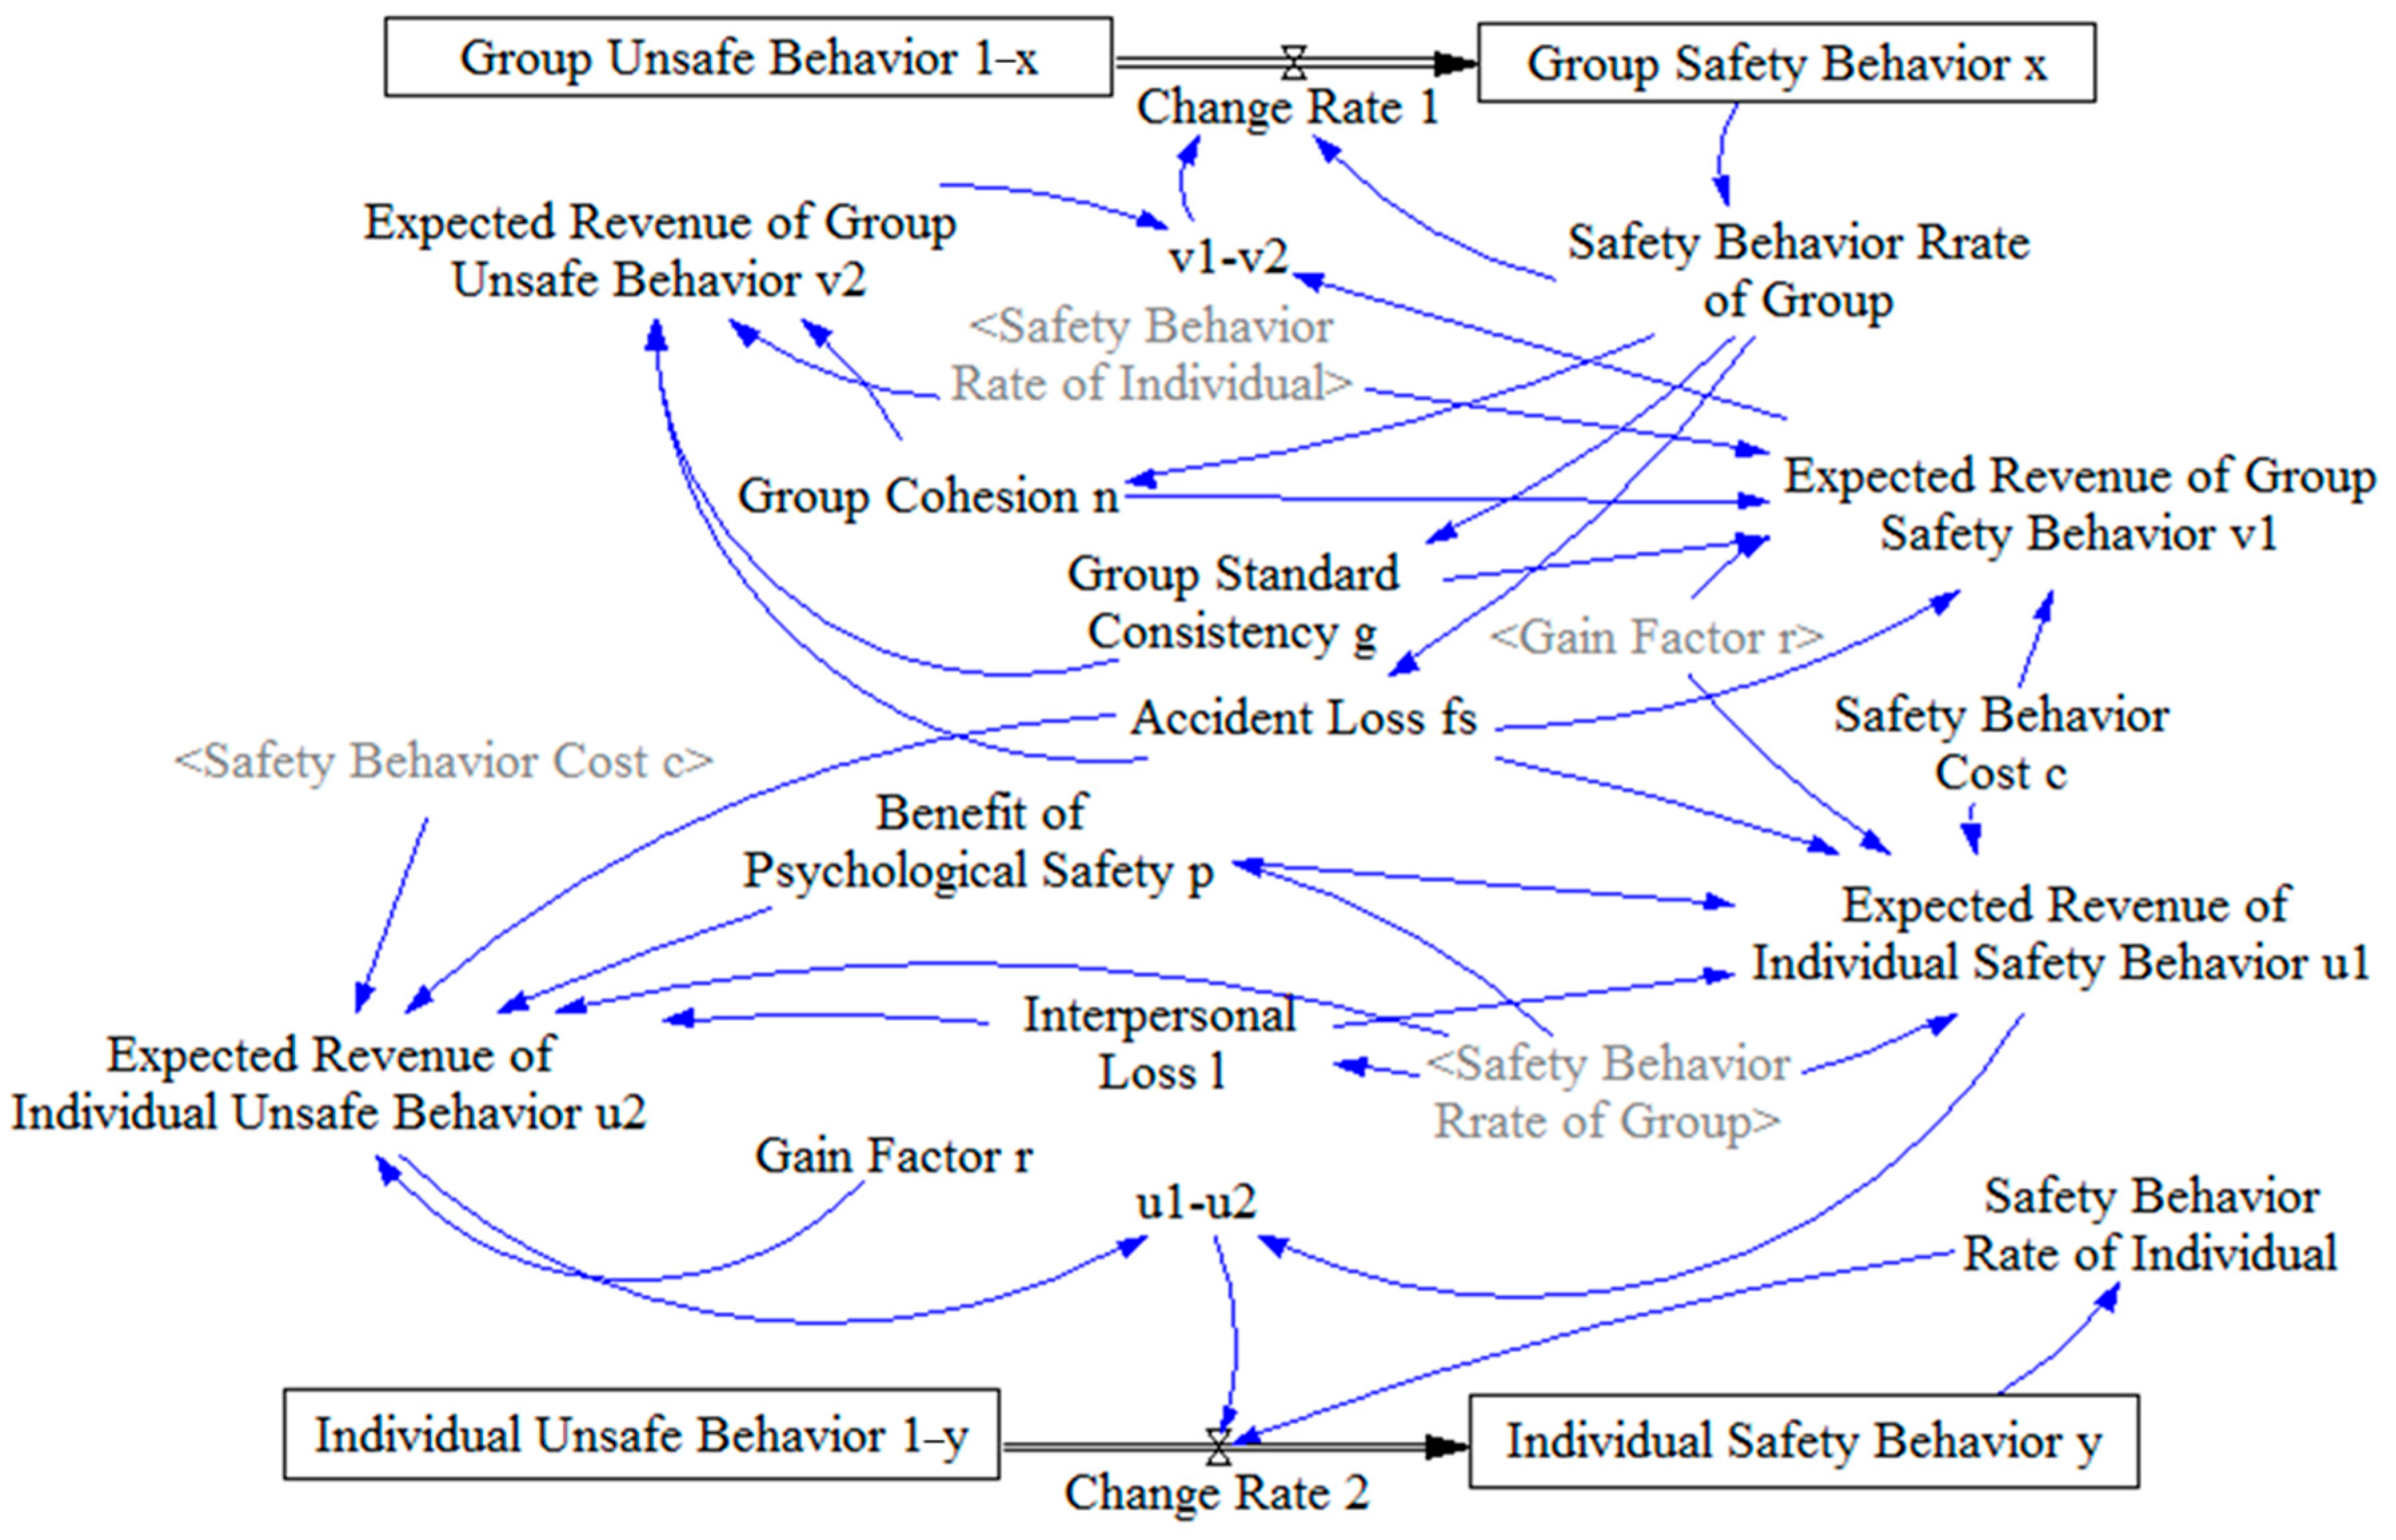
2.3. Establishment and Simulation Analysis of SD Model Under Dynamic Structure
The system dynamics (SD) model constructed in this study consists of 4 state variables, 2 rate variables, 13 auxiliary variables, and 2 external variables. As shown in
Figure 3, the core state variables represent the proportions of individual and group safe and unsafe behaviors. The rate variables (Change Rate 1 and Change Rate 2) define the behavioral transition speeds for groups and individuals, respectively. Auxiliary variables, such as psychological safety, group cohesion, gain factor, and expected payoffs, serve as intermediaries that reflect causal relationships and feedback mechanisms within the system. These relationships are quantified through Equations (3) to (12). External variables, including safety behavior cost and accident loss, act as exogenous influences that shape individual decision making. This model captures the dynamic interplay between group-level influence and individual behavioral choices over time and provides a basis for analyzing the threshold effects and behavior stabilization patterns observed in the simulation.
3. Results
3.1. Establishment of SD Model Under Dynamic Structure
According to evolutionary game theory, whether individuals within a group adjust their strategies in response to cost–benefit changes depends primarily on two factors. The first is the number of reference individuals available for imitation; this reflects a behavioral threshold. A higher threshold indicates that individuals find more behavioral patterns to emulate. The second factor is the net gain resulting from successful imitation; greater expected benefits increase both the motivation to imitate and the likelihood of behavioral change.
As the number of individuals engaging in group-level safe behavior increases, the perceived benefit of adopting safe behaviors also rises. This is due to the influence of group dynamic elements, which make individuals more inclined to conform to group safety norms. Accordingly, this study explored the evolution of individual and group safety behavior under various group-state conditions. Special attention was given to identifying the threshold values that prompt behavioral shifts among individuals.
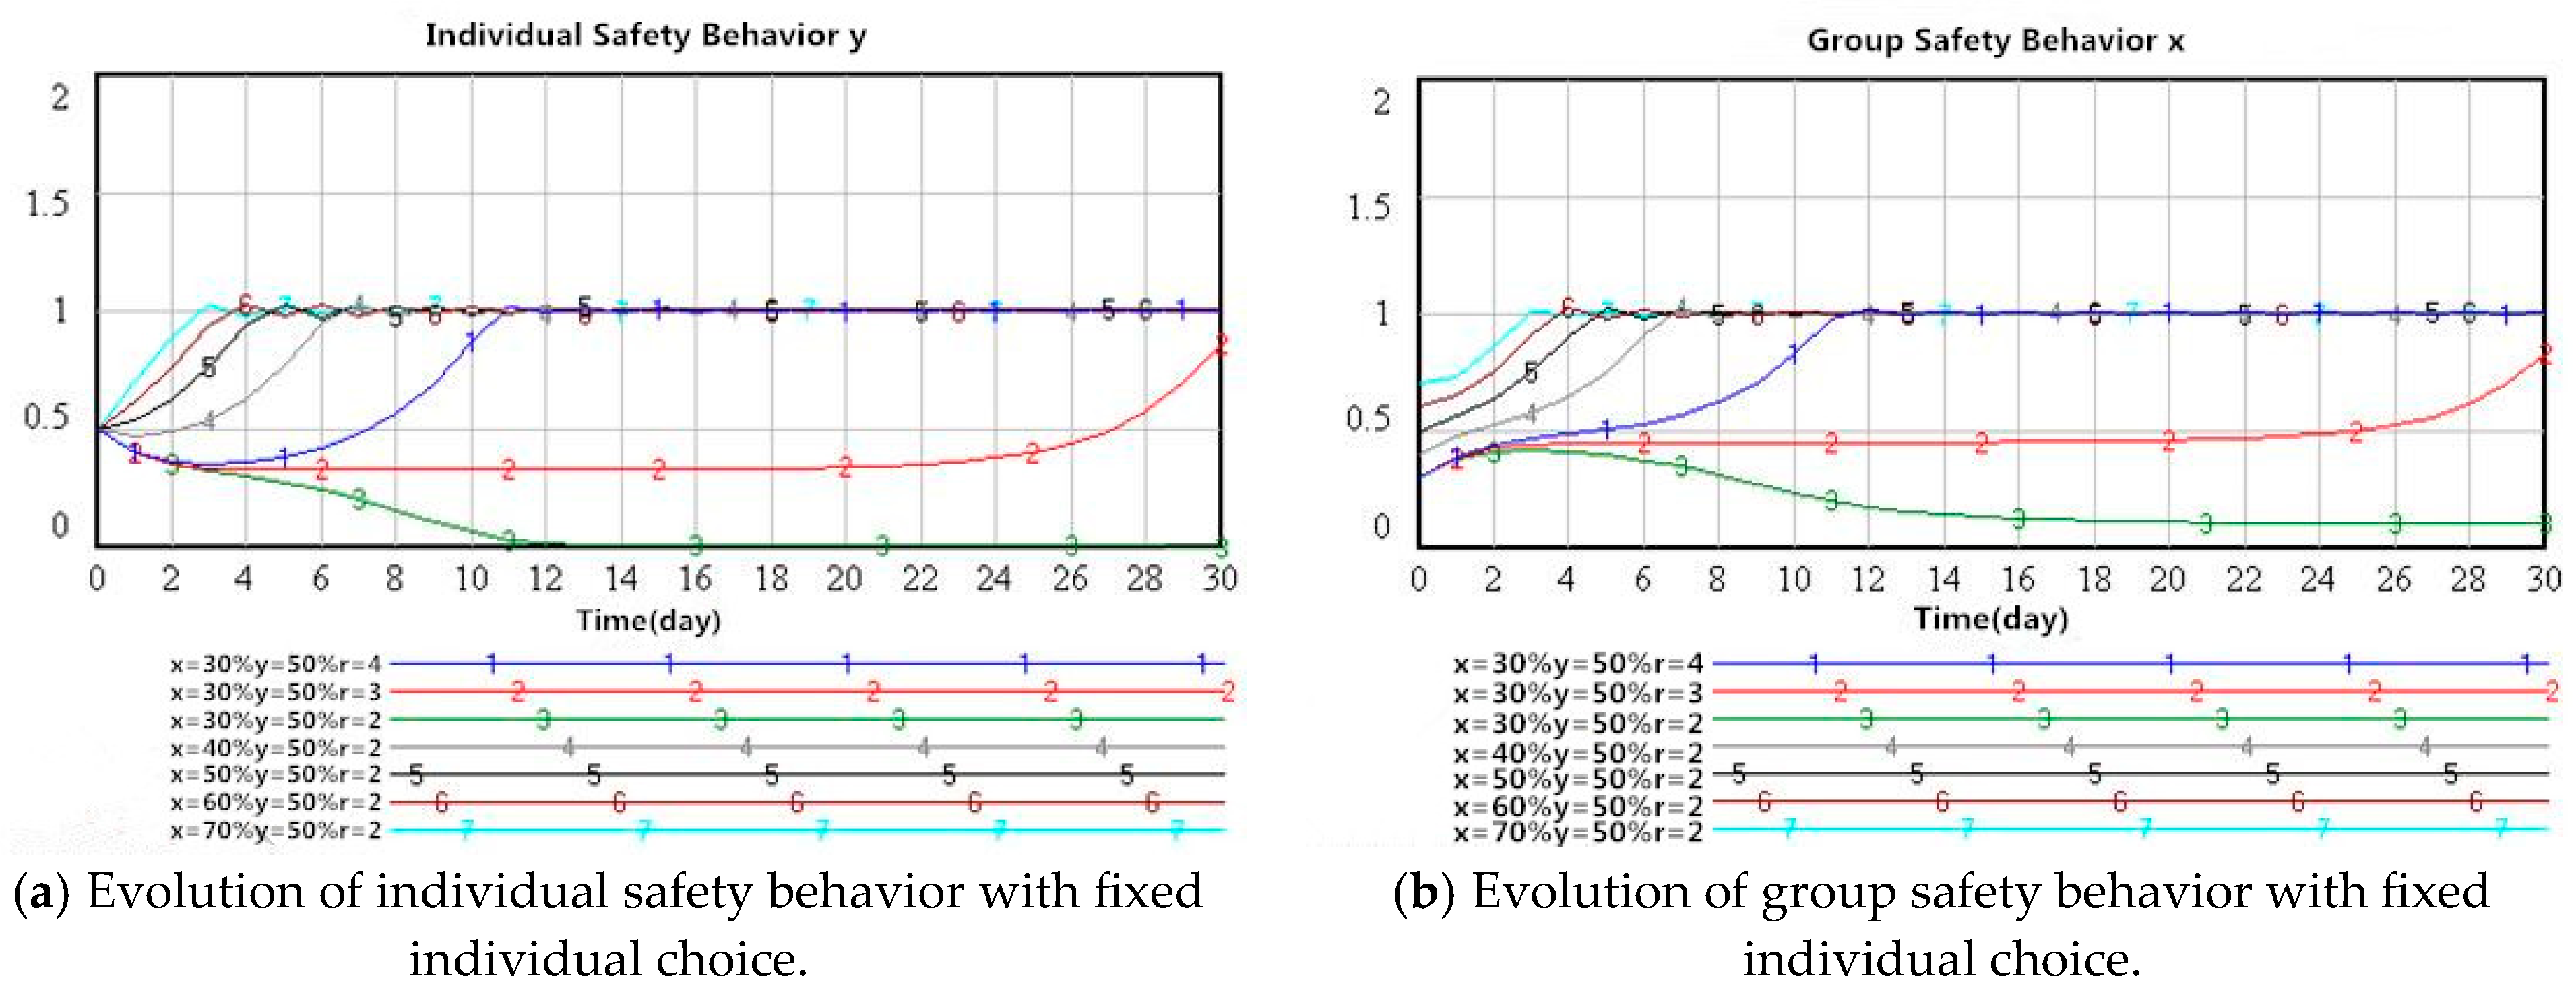
This study assumed that the probability of individuals selecting safe behaviors, denoted as y, was 50%, and the initial probabilities of group safety behavior, x, were 30%, 40%, 50%, 60%, and 70%, respectively. The evolutionary rules of individual and group safety behavior were observed, as shown in
Figure 4. In the figure, the horizontal axis represents the simulation time, and the vertical axis indicates the behavioral probability. Each curve corresponds to a different combination of x and the individual gain coefficient r, with the parameter settings labeled below the graphs.
It can be observed in
Figure 4 that when the probability of individuals selecting safe behaviors (y) was 50%, both individual and group behaviors evolved in a consistent direction. The evolution of individual behavior was influenced by the group’s initial safety behavior probability (x). In groups with a high initial safety behavior probability (x > 50%), individuals received higher payoffs when choosing safe behaviors and were, therefore, more likely to adopt them (Lines 5–7 in
Figure 4). In contrast, in groups with moderate or low initial safety behavior probabilities (40% < x < 50%), individuals initially tended to choose unsafe behaviors (Lines 4 and 5 in
Figure 4). However, as the simulation progressed, the payoff from unsafe behaviors became lower than that from safe behaviors, prompting individuals to gradually shift toward choosing safe behaviors. Nevertheless, the rate of transition to safety behavior in these groups was slower than that observed in groups with higher initial safety probabilities.
When the group’s initial safety behavior probability was below 30%, the payoff from unsafe behaviors exceeded that from safe behaviors, leading individuals to prefer unsafe strategies (Line 3 in
Figure 4). The value of 30% thus emerged as a critical behavioral threshold in the simulation. When less than 30% of the group members engaged in safe behaviors, the expected utility of aligning with the group diminished. Under these conditions, individuals perceived greater short-term benefits in deviating from weak group norms. As a result, group influence was weakened, and risk-oriented incentives dominated, pushing the behavioral dynamic toward unsafe outcomes. This 30% threshold represents a tipping point, below which group cohesion failed to stabilize behavior, and the overall trend shifted away from collective safety adherence.
It can also be seen in Lines 1–3 in
Figure 3 that the larger the cost gain coefficient r (indicating greater economic benefits when individuals choose safe behaviors), the lower the threshold of group safety behavior probability that individuals are willing to accept. Therefore, under the same level of individual quality, for groups with relatively low safety behavior probabilities, leaders can promote both individual and group adoption of safety behavior by increasing incentives, specifically, by raising the gain coefficient r.
In practice, individuals are heterogeneous and display varying levels of quality and behavioral characteristics. Due to differences in personal traits and goals, employees adopt distinct behavior strategies and exhibit varying propensities toward safety behavior. In the game process, such individual differences lead to diverse influences on group behavior. To investigate this, the probability of group safety behavior (x) was held constant, and interactions between individuals with varying probabilities of selecting safe behaviors and a group with a fixed safety level were simulated. The results are shown in
Figure 5.
It can also be observed in Lines 3–6 in
Figure 5 that when the probability of group safety behavior was 50%, and the probability of individual safety behavior, determined by individual quality, was below 30%, group behaviors tended to shift toward unsafe actions. Conversely, when the individual safety behavior probability exceeded 40%, both individual and group behaviors gradually evolved toward safer outcomes as the game progressed. Moreover, the higher the individual’s initial safety behavior probability, the stronger its influence on overall group behavior. From Lines 1–3, it is also evident that when the probability of group safety behavior exceeded 50%, a higher gain coefficient r corresponded to a lower threshold of acceptable group safety behavior probability for individuals, making both parties more inclined to adopt safety strategies.
Based on group and individual conditions, the threshold values for safety behavior probabilities were identified. These can serve as practical references for managers when making personnel adjustments, helping to reasonably assign individuals and promote the self-organizing evolution of safety behavior within teams. This insight underscores the importance of group leaders and safety managers taking proactive measures. External incentives, such as increasing the gain coefficient for safety behavior, can encourage both groups and individuals to adopt safer practices. Accordingly, managers should consider implementing behavioral interventions or introducing reference groups to rapidly elevate the proportion of safe behaviors within the group and enhance individual safety awareness.
3.2. Case Application
The proposed methodology was piloted in a large-scale nuclear power construction project characterized by high safety demands and complex on-site risks. With over 20,000 workers and numerous construction teams operating simultaneously across dispersed risk zones, the project site presents both the rigorous standards of nuclear operations and the dynamic hazards typical of large construction enterprises. To meet these challenges, a safety supervision grid system was established across multiple critical areas, requiring constant personnel presence for monitoring and inspection.
To support real-time risk control, a dedicated behavioral risk management platform was deployed. This platform enabled continuous tracking of safety behavior across the workforce and identified potential hazards throughout the construction area. In January 2024, the platform began operational use on site, integrating the behavioral risk modeling framework developed in this research.
Figure 6 and
Figure 7 present a comparative analysis of violation incidents before and after implementation. The data reveal a consistent decline in the monthly number of employee violations throughout the year following the platform’s introduction. Compared to the same months of the previous year, the reduction ranged from 7.28% to a maximum of 10.39%. This trend suggests that the integrated model and monitoring system contributed to enhanced behavioral compliance and safety awareness on site, demonstrating the practical effectiveness of the proposed approach in a high-risk, real-world setting.
4. Discussion
This study provides valuable insights into the safety behavior of employees in nuclear power plants (NPPs) under construction, particularly with regard to the interaction between individual decision making and group dynamics. The simulation results indicate that group-level safety behavior exerted a significant influence on individual strategic choices. When the proportion of safe behaviors within a group surpassed a certain threshold, individuals were more likely to conform to collective norms, thereby enhancing overall behavioral consistency. This finding highlights the critical role of group cohesion and psychological safety in shaping safety-related behavioral outcomes.
The observed threshold effects further emphasize the need to maintain a baseline level of safety behavior to sustain positive group dynamics. These outcomes are consistent with foundational concepts in game theory and system dynamics, reinforcing the validity of the integrated modeling approach. Compared with earlier research, this study adopts a unified framework that combines Bayesian networks (BNs), game theory, and system dynamics (SD), enabling a more comprehensive view of behavioral risk evolution in complex construction environments. Unlike traditional predictive models, such as AI classifiers or deep neural networks, the BN–Game–SD model emphasizes explainability and captures causal interactions and feedback mechanisms that are often overlooked in purely data-driven approaches.
Rather than relying on static risk indicators, this approach captures behavioral change over time, offering a dynamic perspective better suited to high-risk construction contexts. BNs allow for probabilistic reasoning under uncertainty, game theory models strategic interactions, and SD reveals systemic feedback patterns. Together, these methods provide a more holistic understanding of how safe behaviors emerge, interact, and evolve in practice. The insights derived from this study may also be extended to other high-risk industries. By identifying behavioral thresholds and risk transmission pathways, the model offers practical value for safety planning and decision making.
Several limitations deserve attention. The Bayesian network relies partially on historical incident reports and expert judgment, which may introduce subjective bias and limit generalizability. To address this, future work will incorporate more empirical data from automated on-site monitoring systems and refine parameter estimation through expert-assisted calibration. This will enhance the robustness and adaptability of the model’s causal structure. Additionally, future research will introduce formal statistical inference methods, such as significance testing and confidence intervals, to systematically evaluate the reliability of intervention results across different application contexts. Sensitivity analysis will also be performed to assess the impact of key parameter variations on simulation outcomes, thereby improving transparency and predictive credibility.
Furthermore, individual behaviors in the current game-theoretic model are represented through a dual-strategy framework, “safe” versus “unsafe”, with deterministic payoffs. While this setup facilitates the modeling of key dynamics between group influence and personal decisions, it does not fully reflect the heterogeneity and uncertainty often present in real-world settings. Future efforts will explore agent-based extensions and probabilistic payoff mechanisms to improve behavioral realism and model flexibility.
Beyond nuclear power construction, the integrated BN–Game–SD modeling approach holds promise for broader applications in safety-critical domains. Industries such as chemical processing, aerospace assembly, large-scale infrastructure construction, and offshore oil platforms often involve complex worker interactions, high accident sensitivity, and dynamic behavioral patterns under risk pressure. The framework presented in this study can be adapted to model behavioral risks in these settings, especially where group norms and decision feedback loops strongly influence individual safety choices.
Future research could also integrate this modeling system into real-time decision support tools. By linking the model to live monitoring platforms, such as wearable sensors, on-site surveillance systems, or smart safety helmets, managers can identify emerging behavior risks early and adjust interventions accordingly. Additionally, combining this approach with digital twin technologies may enable proactive simulations and scenario testing in virtual construction environments before implementation on site.
Finally, interdisciplinary collaboration among behavioral psychology, data science, and safety engineering will be essential to expand the explanatory power and practical relevance of the model. As emerging AI technologies advance real-time perception and adaptive learning, future safety management systems may incorporate AI-enhanced BN–Game–SD models that autonomously evolve with the working environment.


