Abstract
Arsenic and heavy metal contamination in water presents serious environmental and public health challenges, requiring effective treatment technologies. Titanium dioxide (TiO2) nanoparticles offer promising adsorption potential due to their high surface area, mesoporosity, and chemical stability. This study investigates the removal of As(V), Cd(II), Cu(II), and Pb(II) by TiO2 under environmentally relevant conditions (pH 3 and 7), commonly encountered in industrial and natural waters. TiO2 was characterized using SEM, XRD, FTIR, BET, and pHpzc analysis, confirming a mesoporous structure with mixed anatase/rutile phases. Adsorption followed Elovich kinetics, with the Langmuir model providing the best fit to the isotherm data. At pH 3, adsorption capacities (qm) were of the following order: Pb(II) 30.80 mg g−1 > Cd(II) 10.02 mg g−1 > As(V) 8.45 mg g−1 > Cu(II) 2.73 mg g−1; at pH 7, they were as follows: Cd(II) 26.75 mg g−1 > Pb(II) 26.20 mg g−1 > As(V) 8.50 mg g−1 > Cu(II) 5.05 mg g−1. These results highlight a pH-dependent mechanism involving both chemisorption and physisorption. Principal Component Analysis (PCA) revealed that physicochemical properties, particularly electronegativity, significantly influenced removal efficiency. TiO2 showed high, selective, and pH-responsive adsorption properties, supporting its use in sustainable water treatment. Future work should address nanoparticle recovery, regeneration, and performance under continuous flow conditions.
1. Introduction
Arsenic and heavy metal contamination of water and wastewater represents a significant global challenge, threatening both environmental and public health. These pollutants, originating from natural geochemical processes, industrial discharges, mining activities, and agricultural runoff, persist in the environment, bioaccumulate within ecosystems, and pose severe risks to human well-being. Arsenic, classified as a Group 1 carcinogen by the International Agency for Research on Cancer (IARC) [1], and heavy metals, such as cadmium (Cd), copper (Cu), and lead (Pb), have been linked to neurotoxicity, carcinogenicity, organ damage, and developmental disorders [2]. Cd primarily targets the kidneys, inducing oxidative stress and mitochondrial dysfunction, leading to apoptosis and potential carcinogenic outcomes [3,4]. Cu, though essential in trace amounts, becomes toxic when accumulated, contributing to oxidative damage, neurodegeneration, and reproductive impairment [5,6]. Inorganic arsenic exposure has been linked to a wide spectrum of adverse effects, including skin lesions (e.g., hyperkeratosis and melanosis), cardiovascular disease, diabetes, nephrotoxicity, neurotoxicity, and reproductive dysfunction [4,7]. Pb is particularly hazardous to children, as it impairs cognitive development and also causes damage to the liver, kidneys, and reproductive system [8,9,10]. Given their severe health impacts and widespread occurrence, the efficient removal of these contaminants from water sources is essential to safeguarding both human and environmental health.
Accordingly, regulatory frameworks have been established to address this need by setting strict limits on permissible concentrations, tailored to specific water types and intended uses. For instance, the World Health Organization (WHO) has set provisional guideline values for drinking water, with limits for arsenic, cadmium, lead, and copper ranging from 0.003 to 2 mg L−1 [11]. Similarly, discharge limits for these metals in industrial wastewater have been restricted to levels between 0.002 and 0.5 mg L−1 [12]. These stringent standards necessitate the implementation of effective water treatment strategies to achieve the required low concentrations, thereby mitigating harmful impacts and promoting sustainable water management practices.
Among the available methods [13,14,15], including chemical precipitation, membrane filtration, and ion exchange, adsorption has emerged as one of the most widely used and promising techniques for the removal of heavy metals and metalloids from water. Its key advantages include simplicity of operation, high removal efficiency even at low concentrations, minimal generation of secondary waste, and adaptability to various environmental conditions [16,17]. Moreover, adsorption allows for easy regeneration and reuse of materials, making it an attractive option for sustainable water treatment [18,19,20,21,22,23].
Numerous adsorbents, such as zeolites, metal oxides, clays, functionalized polymers, and activated carbons, have been extensively studied and validated for their effectiveness in removing heavy metal ions. Among the various adsorbents, nanomaterials have attracted significant attention as advanced solutions for water and wastewater treatment due to their exceptional properties [18,19,20,24,25,26]. In particular, metal oxide-based nanomaterials are increasingly recognized as promising candidates for the removal of arsenic and heavy metals, offering significant advantages over traditional materials like activated carbon, clays, and zeolites [22,27].
Titanium dioxide (TiO2) nanoparticles stand out among metal oxide nanomaterials due to their distinct physicochemical characteristics. TiO2 is chemically stable, is nontoxic, and exhibits a high surface area and strong affinity for a wide range of contaminants, including arsenic and heavy metals, making it especially effective under diverse environmental conditions [28,29,30]. Its surface properties can also be easily tailored to enhance adsorption efficiency through functionalization or by combining it with other materials, making it well suited for use in complex water matrices such as acidic industrial effluents or natural waters with high ionic strength [31,32,33,34].
TiO2’s potential for removing both arsenic and heavy metals has been extensively reported on. For instance, Nazari et al. [35] demonstrated the high efficiency of TiO2 in removing arsenic from groundwater, even in the presence of competing anions such as phosphate and silicate, both common in natural waters. Similarly, several studies have shown the effectiveness of TiO2-based materials in removing heavy metals such as Pb(II), Cd(II), and Cu(II) from both drinking water and wastewater [29,36,37]. More recently, studies have reported enhanced performance of TiO2 when used in composite forms, such as TiO2-supported biochar and TiO2–graphene composites, which have shown enhanced adsorption of Pb(II) and Cd(II) from wastewater due to increased surface area and greater availability of functional groups [37,38]. In addition, TiO2 has been successfully integrated into hybrid filtration systems for simultaneous removal of multiple heavy metals from wastewater [39].
Despite these advances, most existing studies have investigated the removal of either arsenic or heavy metals from water and under narrow operational conditions. As a result, a unified understanding of TiO2’s interactions with chemically distinct contaminants under environmentally relevant scenarios remains limited. One particularly underexplored aspect is the influence of pH, a critical parameter in real-world water treatment applications. Although the adsorption of individual contaminants has been examined, few studies have evaluated both arsenic and heavy metals under directly comparable conditions. Moreover, the application of multivariate statistical tools to correlate adsorption efficiency with contaminant-specific physicochemical properties remains rare.
To address these knowledge gaps, the present study systematically investigates the adsorption performance of TiO2 for both arsenic and selected heavy metals (Cd, Cu, Pb) under two representative pH conditions (3 and 7), simulating acidic and near-neutral environments commonly encountered in industrial and natural water systems. TiO2 was thoroughly characterized using SEM, XRD, FTIR, BET, and point of zero charge (pHpzc) analysis. Adsorption performance was evaluated through kinetic and equilibrium studies, supported by appropriate mathematical models. Kinetic data were analyzed using the pseudo-first-order, pseudo-second-order, Elovich, and Weber–Morris models, while equilibrium data were interpreted using the Langmuir, Freundlich, Temkin, and Dubinin–Radushkevich isotherms. A key area of novelty of this work is the application of Principal Component Analysis (PCA)—a robust multivariate technique for dimensionality reduction and pattern recognition—in the context of adsorption. PCA was employed not only to classify the adsorption behaviors of arsenic and various heavy metals but also to explore correlations between their physicochemical properties (e.g., ionic radius, electronegativity), operational parameters (such as initial concentration and pH), and removal efficiency. This integrative, multivariate approach provides valuable new insights into the key factors that govern adsorption mechanisms on TiO2. To the best of our knowledge, this is the first study to correlate the adsorption behavior of both arsenic and heavy metals on TiO2 under identical, systematically controlled experimental conditions using PCA. The findings contribute to a deeper understanding of TiO2’s selective interactions and support the development of pH-responsive, efficient adsorbents for sustainable water treatment applications.
2. Materials and Methods
2.1. Materials and Chemicals
Titanium dioxide, investigated as an adsorbent in this study, was purchased in nanopowder form (Degussa P25) and used as such, without any subsequent modifications. Stock solutions of As(V), Cd(II), Cu(II), and Pb(II), with concentrations of 100 mg L−1, were prepared using AAS standards of the respective analytes and were subsequently diluted to the experimentally defined concentration levels. All chemicals used in this research were of analytical grade and supplied by Merck KGaA (Darmstadt, Germany). Ultrapure deionized water, with a resistivity not lower than 17.5 MΩ·cm at 25 °C, was obtained using a Labconco Water Purification System. To eliminate potential contaminants and prevent adsorption of As(V) and the selected M(II) species onto the glassware walls, all glassware was rinsed with 5% HNO3 prior to the start of the experiments.
2.2. Adsorbent Characterization
The point of zero charge (pHpzc) of TiO2 was determined using the mass titration method, as described by [40]. The procedure involved the following steps: (1) preparation of 0.01 M NaNO3; (2) dividing the solution into three parts and adjusting the pH to 3, 7, and 11 using ccHNO3 and 1 M NaOH; (3) measuring 5 mL of the corresponding NaNO3 solution and adding TiO2 to achieve mass ratios of 1%, 5%, 10%, 15%, and 20%; (4) stirring the prepared suspensions for 24 h; and (5) filtering the suspensions through 0.22 µm filters and measuring the final pH values. The pHpzc was determined as the converging pH value from the pH vs. sample mass curves.
Surface properties of TiO2 were analyzed using the Autosorb iQ Surface Area Analyzer (Quantachrome Instruments, Boynton Beach, FL, USA). Prior to analysis, the material was degassed under vacuum at 105 °C, followed by nitrogen adsorption–desorption isotherm measurements at 77 K. Data were processed using ASiQwin 2.2 software, and we applied or performed the following: (1) the multi-point Brunauer–Emmett–Teller (BET) model to determine the specific surface area; (2) the Barrett–Joyner–Halenda (BJH) model for mesopore volume; (3) the Horvath–Kawazoe (HK) model for micropore volume; (4) total pore volume (TPV) calculation; and (5) average pore radius (APR) calculation.
Morphological, particle size, and shape analyses were conducted using scanning electron microscopy (SEM) (JEOL JSM-6460LV, JEOL Ltd., Tokyo, Japan) at a magnification of 2000×.
Fourier Transform Infrared Spectroscopy (FTIR) (Thermo-Nicolet Nexus 670, Thermo Fischer Scientific Inc., Waltham, MA, USA) was used to identify the functional groups on the TiO2 surface. The sample was prepared using the KBr technique, and spectral data were collected in the range of 4000–400 cm−1 in diffuse reflectance mode, with a resolution of 4 cm−1. Data processing was performed using OMNIC software (OMNIC 6.2, Thermo Fischer Scientific Inc., Massachusetts, USA).
The crystalline properties of the material were determined using an X-ray diffractometer with CuKα radiation (Rigaku MiniFlex 600,Rigaku Holdings Corporation, Tokyo, Japan). The diffractogram, measured in the range of 5° < 2θ < 80° with a step size of 0.03°, was analyzed using HighScore 3.0.5 Plus software (PANalytical B.V., Almelo, The Netherlands). Crystalline phases were identified using reference cards from the Crystallography Open Database (COD).
2.3. Adsorption Experiments
All adsorption experiments were conducted in batch mode using synthetic matrices, following the general procedure described below. A defined mass of TiO2 was weighed into glass vials or Erlenmeyer flasks, depending on the required volume, followed by the addition of an appropriate volume of background solution, specifically deionized water. To ensure accurate and reliable results, the solid-to-liquid phase ratios were adjusted to maintain adsorbate removal efficiencies within the 20–80% range under equilibrium conditions, when possible. However, this condition was not met during the investigation of Pb(II) adsorption kinetics and at certain points while constructing adsorption isotherms, due to the exceptionally high adsorption intensities under the given experimental conditions. Immediately prior to weighing, the pH of the background solutions was adjusted to either 3 or 7 using 0.1 or 0.01 M HNO3 or NaOH, as required. Stock solutions of As(V), Cd(II), Cu(II), or Pb(II) were then spiked into the systems in volumes necessary to achieve the initial concentrations defined in Table 1. The vessels containing these adsorption systems were continuously stirred at 180 rpm and 25 °C, for time intervals specified in the experimental design. Afterwards, the contents of the vessels were filtered through 0.22 µm filters, and the filtrates were acidified with one drop of concentrated HNO3. The residual concentrations of As(V) or M(II) were subsequently analyzed using the ICP-MS technique, following the US EPA Method 6020B [41].

Table 1.
Experimental conditions applied for determining adsorption kinetics and isotherms.
To eliminate the potential contributions of undesirable processes (primarily precipitation and adsorption onto the vessel walls) to the observed removal levels, and to isolate values resulting solely from the adsorption activity of TiO2, control samples were included in each experimental series. These controls were prepared identically to the experimental samples, except for the omission of the adsorbent. The initial concentrations of As(V) and M(II) in the series containing TiO2 were calculated based on the concentrations detected in these control samples. In order to monitor analytical and measurement uncertainty, all analyses were performed in triplicate, and the relative standard deviations generally did not exceed 5% (error bars in the graphs represent the determined standard deviation).
The amounts of As(V) and M(II) adsorbed were calculated using the mass balance Equation (1), while their removal efficiencies were determined using Equation (2).
where qt and qe are the amount of adsorbate adsorbed per unit mass of adsorbent at a given time (t, h) and at equilibrium (mg g−1); C0, Ct, and Ce are the initial, time-dependent, and equilibrium concentrations of the adsorbate in the liquid phase (mg L−1); V is the volume of the background solution (L); m is the mass of the adsorbent (g); REt and REe are the removal efficiency of the adsorbate at a given time and at equilibrium (%).
qt (or qe) = (C0 − Ct (or Ce))V/m
REt (or REe) = (C0 − Ct (or Ce)) × 100/C0
2.4. Adsorption Kinetics and Isotherm Modeling
The modeling of adsorption kinetics was carried out to determine the removal rates of As(V) and M(II), identify the limiting steps, and gain insights into the mechanisms and reaction pathways responsible for the adsorption processes. For this purpose, four kinetic models were used: pseudo-first-order (PFO), pseudo-second-order (PSO), Elovich, and Weber–Morris.
The nonlinear forms of these functions, their specific parameters, and the fundamental assumptions typically associated with them are presented in Table 2 [42,43,44,45].
Table 2.
Equations of the applied adsorption kinetic models, with their respective parameters and basic assumptions.
To determine the affinity and maximum adsorption capacity of TiO2 for As(V) and M(II), as well as to better understand the mechanism of adsorbate transfer from the liquid to the solid phase, the experimental data used for the construction of adsorption isotherms (obtained in the adsorption experiments under equilibrium conditions) were analyzed using four models: Freundlich, Langmuir, Dubinin–Radushkevich, and Temkin.
The nonlinear forms of these functions, their specific parameters, and the fundamental assumptions typically associated with them, are specified in Table 3 [46,47,48,49].
Table 3.
Equations of the employed adsorption isotherm models, with their respective parameters and basic assumptions.
2.5. Statistical Analysis
Principal Component Analysis (PCA) was performed to identify key factors influencing As(V) and M(II) removal efficiencies by TiO2. Variables in the dataset included the mean REe values obtained from triplicate adsorption experiments (adsorption isotherms), experimental conditions (C0 and pH), and physicochemical properties of the four adsorbates (oxidation state, ionic radius, hydrated ionic radius, electronegativity, hydration energy, hydrolysis constant, solubility product constant, standard reduction potential, and electron affinity). PAST 5.2.1 software was used to perform the PCA.
3. Results and Discussion
3.1. Adsorbent Characterization
3.1.1. Point of Zero Charge
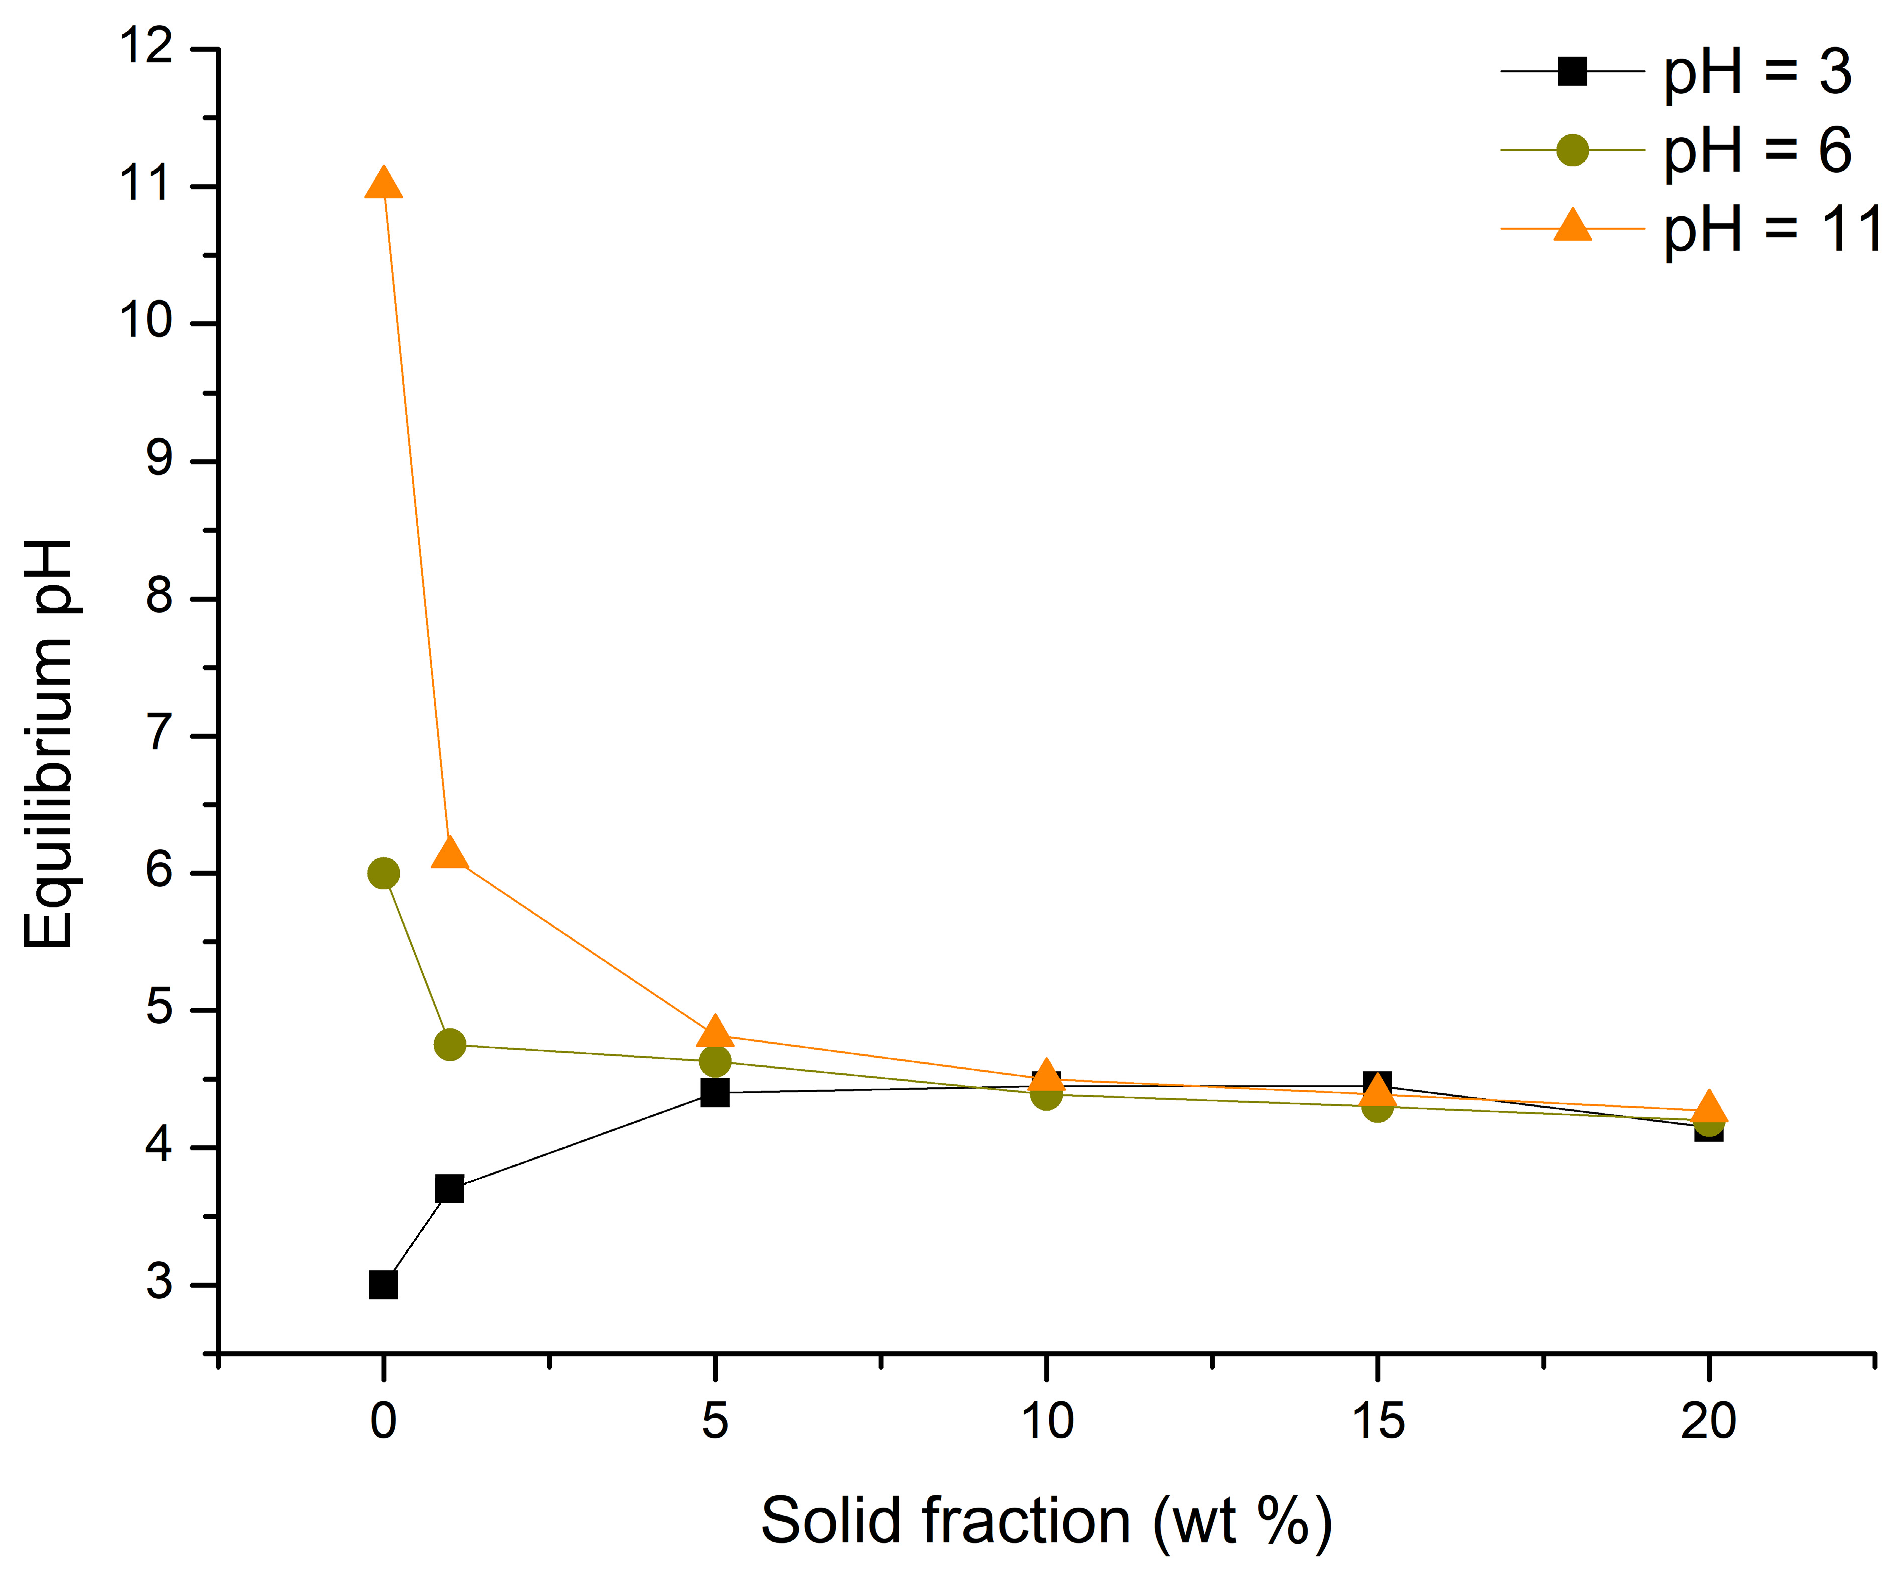
The results obtained for the pHpzc of TiO2 are shown in Figure 1. The pHpzc, considered as the pH at which all three equilibrium pH values are approximately the same, was found to be 4.34 ± 0.12. Based on this, it can be concluded that the surface of TiO2 will be positively charged at pH values lower than 4.34 ± 0.12 and negatively charged at levels above this threshold.
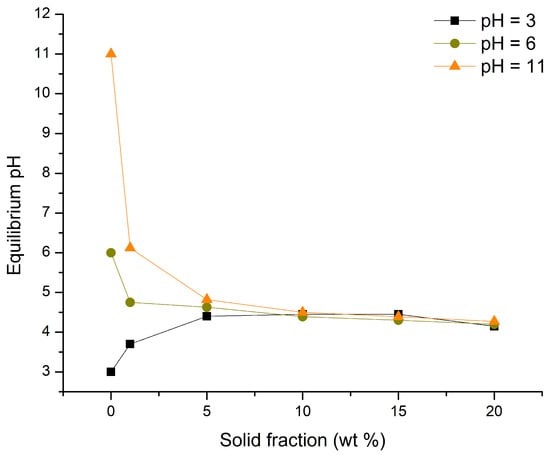
Figure 1.
pHpzc of TiO2.
3.1.2. BET
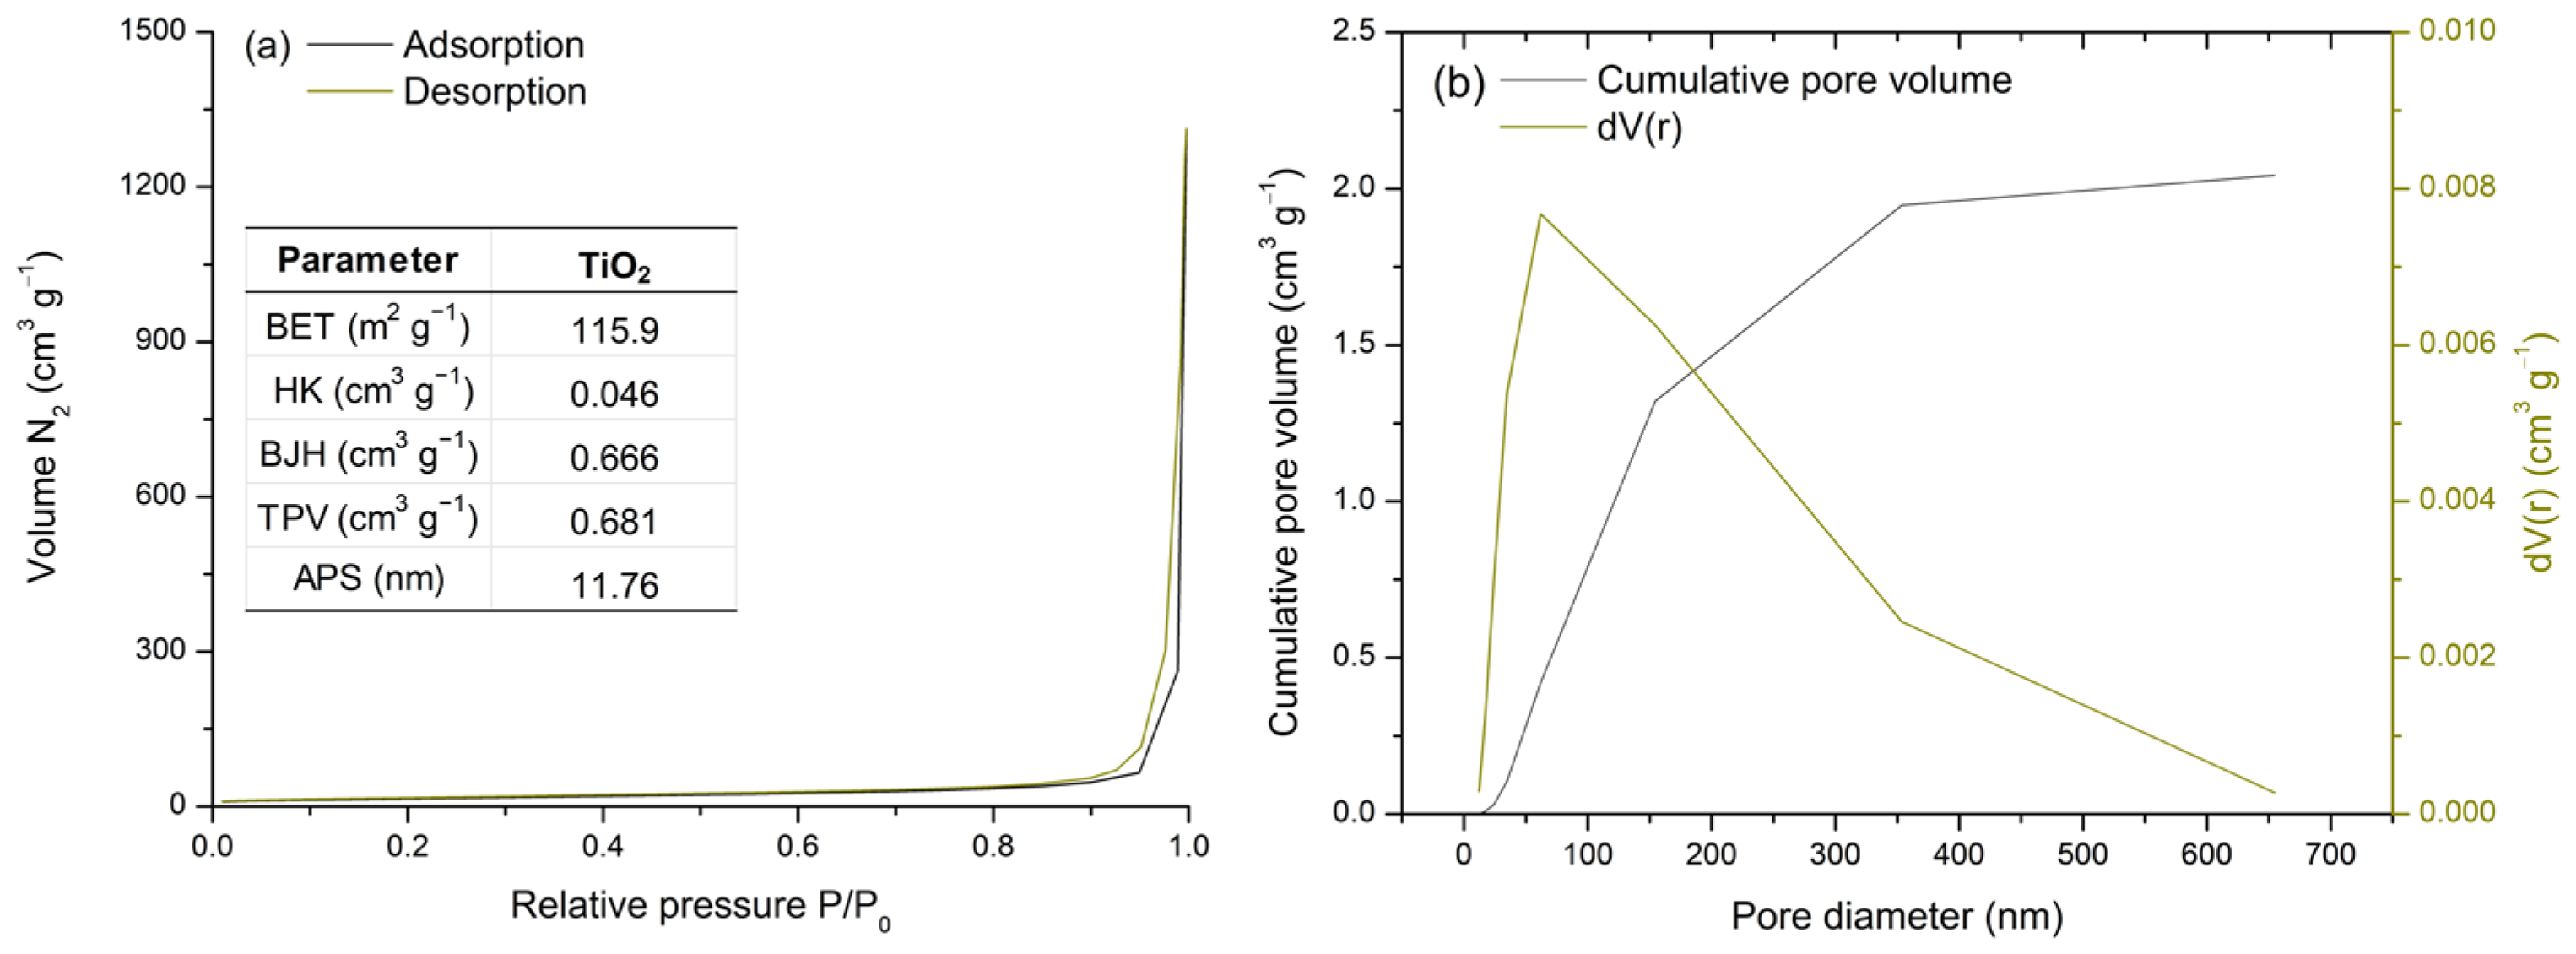
The surface properties of TiO2 were analyzed using a N2 adsorption–desorption isotherm at 77 K (Figure 2a). Commercial TiO2 is classified as a mesoporous material [50,51,52]. The obtained isotherm corresponds to type IV, which describes mono- and multilayer gas adsorption on mesopore walls, followed by pore (capillary) condensation. The steep and narrow hysteresis loop is classified as type H1, indicating the presence of ink-bottle pores [53].
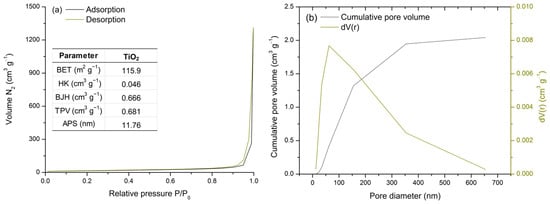
Figure 2.
BET analysis: N2 adsorption–desorption isotherm and TiO2 porosity and surface area parameters (a) and pore size distribution (b).
Moreover, the data shown in the table incorporated in Figure 2a support the isotherm classification. A relatively high specific surface area (115.9 m2 g−1) was observed [53], while the total pore volume (0.681 cm3 g−1) was primarily influenced by the mesopore volume (0.666 cm3 g−1) [53]. Furthermore, the average pore diameter of 11.76 nm confirms the mesoporosity of TiO2 [53].
Figure 2b presents the pore size distribution analysis by comparing the cumulative pore volume and differential pore volume curves. Most pores are observed within the 10–100 nm range, as indicated by the peak in the dV(r) curve, followed by an exponential increase in cumulative pore volume. Thus, TiO2 is confirmed to be a mesoporous material with a high surface area, both of which are essential for metal adsorption processes.
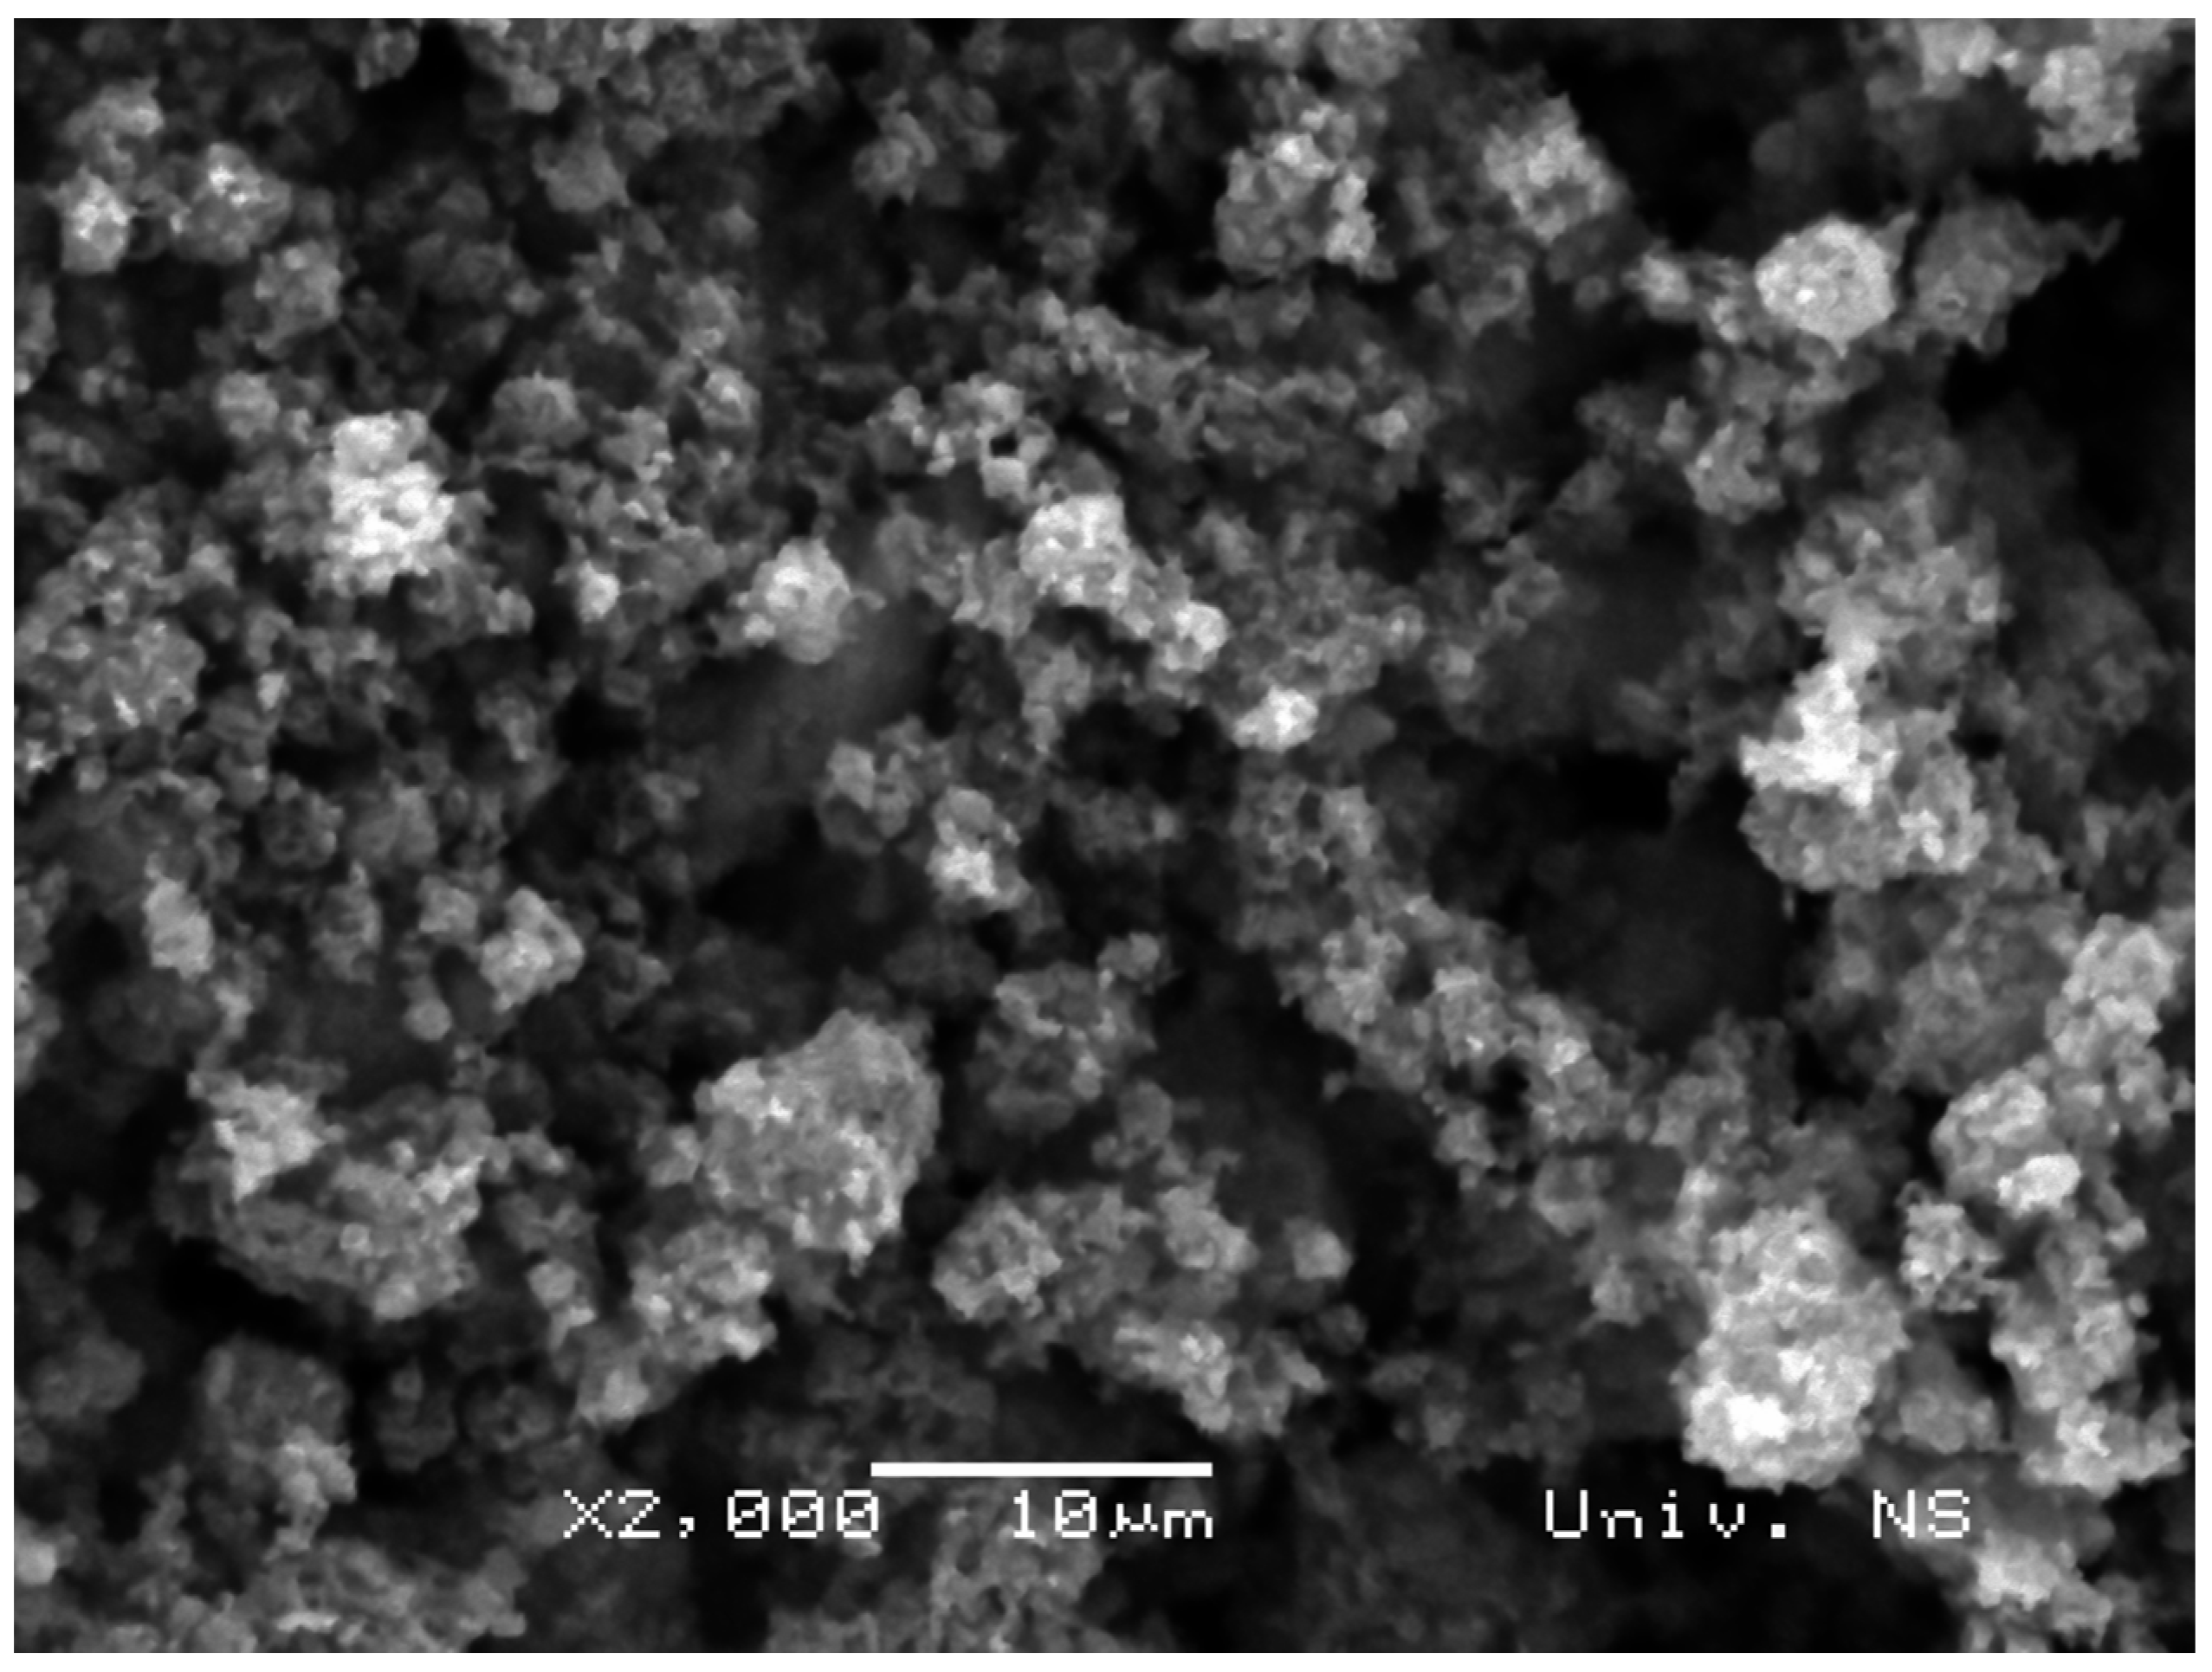
3.1.3. SEM
The surface morphology of TiO2 is shown in Figure 3. It is well established in the literature that TiO2 typically exhibits a sphere-like structure [54,55,56]. Similarly, the TiO2 used in this study is confirmed to be in powder form with a uniform distribution of agglomerated, sphere-like particles. This sphere-like morphology contributes to a high surface area to volume ratio, as confirmed by BET analysis (Figure 2), thus allowing a greater number of adsorption-active sites. The combination of high surface area, mesoporosity and favorable morphology supports effective interaction between TiO2 and target pollutants in aqueous systems.

Figure 3.
SEM micrograph of TiO2.
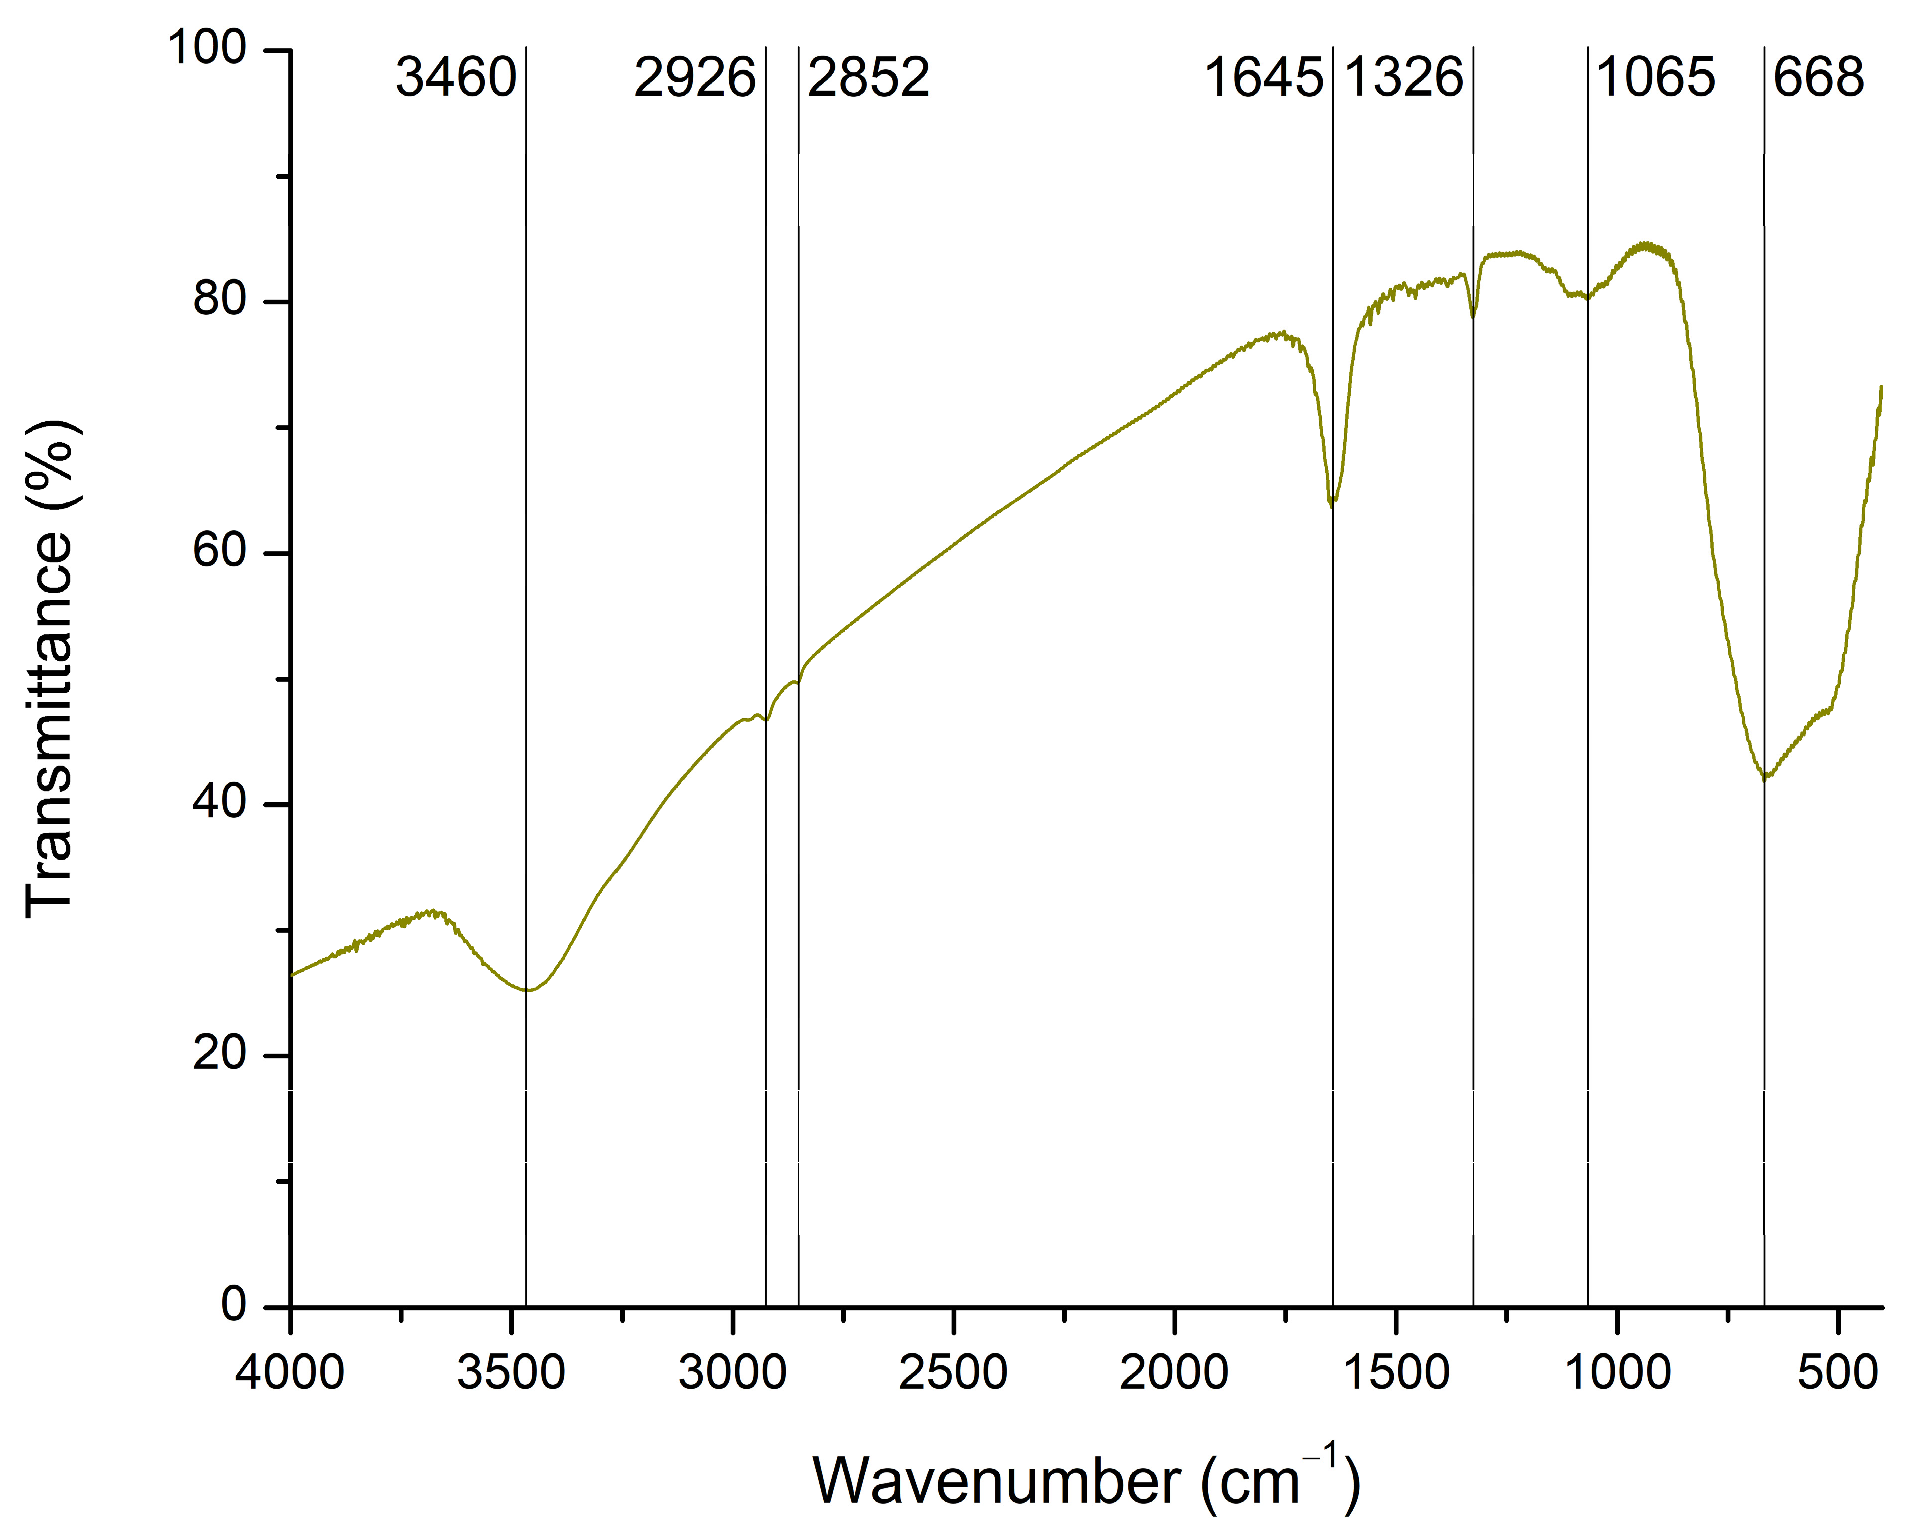
3.1.4. FTIR
FTIR spectroscopy was used to identify the possible functional groups present on the surface of TiO2. The collected spectrum is shown in Figure 4. Characteristic absorption bands corresponding to the stretching and bending vibrations of hydroxyl groups (3460 and 1645 cm−1) are associated with adsorbed water molecules [55,56,57]. Peaks detected at 2926 and 2852 cm−1 represent Ti–OH bonds [46]. A recent review paper attributed the absorption range from 1300 to 1000 cm−1 to O–Ti–O vibrations [58]. Accordingly, the peaks at 1326 and 1065 cm−1 correspond to Ti–O bonds. In addition, the broad and high-intensity peak at 668 cm−1 is associated with Ti–O–Ti vibrations [55,56,59].
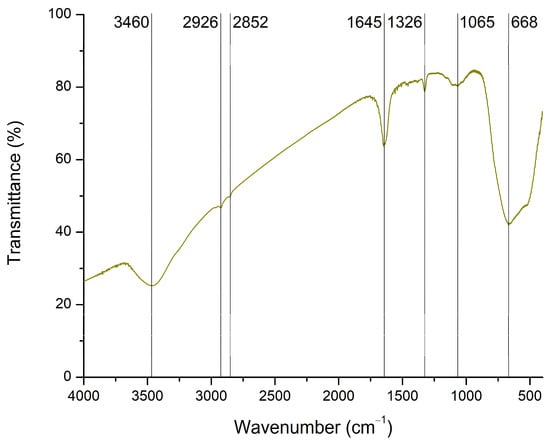
Figure 4.
FTIR spectrum of TiO2.
3.1.5. XRD
The structural analysis of TiO2 was conducted via X-ray diffraction, and the obtained data are shown in Figure 5. The diffraction patterns correspond to two TiO2 phases: anatase (COD 00-900-9086) and rutile (00-900-4142). The crystal planes of anatase matched the following 2θ angles: 25.28° (101), 36.95° (103), 37.97° (004), 38.48° (112), 47.96° (200), 53.93° (105), 55.04° (211), 62.63° (204), 68.87° (116), 70.13° (220), and 75.05° (215). The corresponding rutile crystal planes are as follows: 27.38° (110), 35.99° (101), 41.21° (111), 53.93° (211), 62.63° (002), and 68.87° (301). The results indicate that TiO2 consists of 88.9% anatase and 11.1% rutile phase. Similar findings have been reported in the literature [50,54,55,56,57,59].
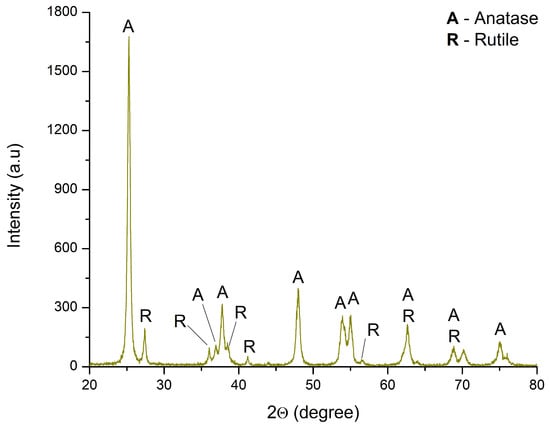
Figure 5.
XRD diffractogram of TiO2.
3.2. Influence of Contact Time and Investigation of Adsorption Kinetics
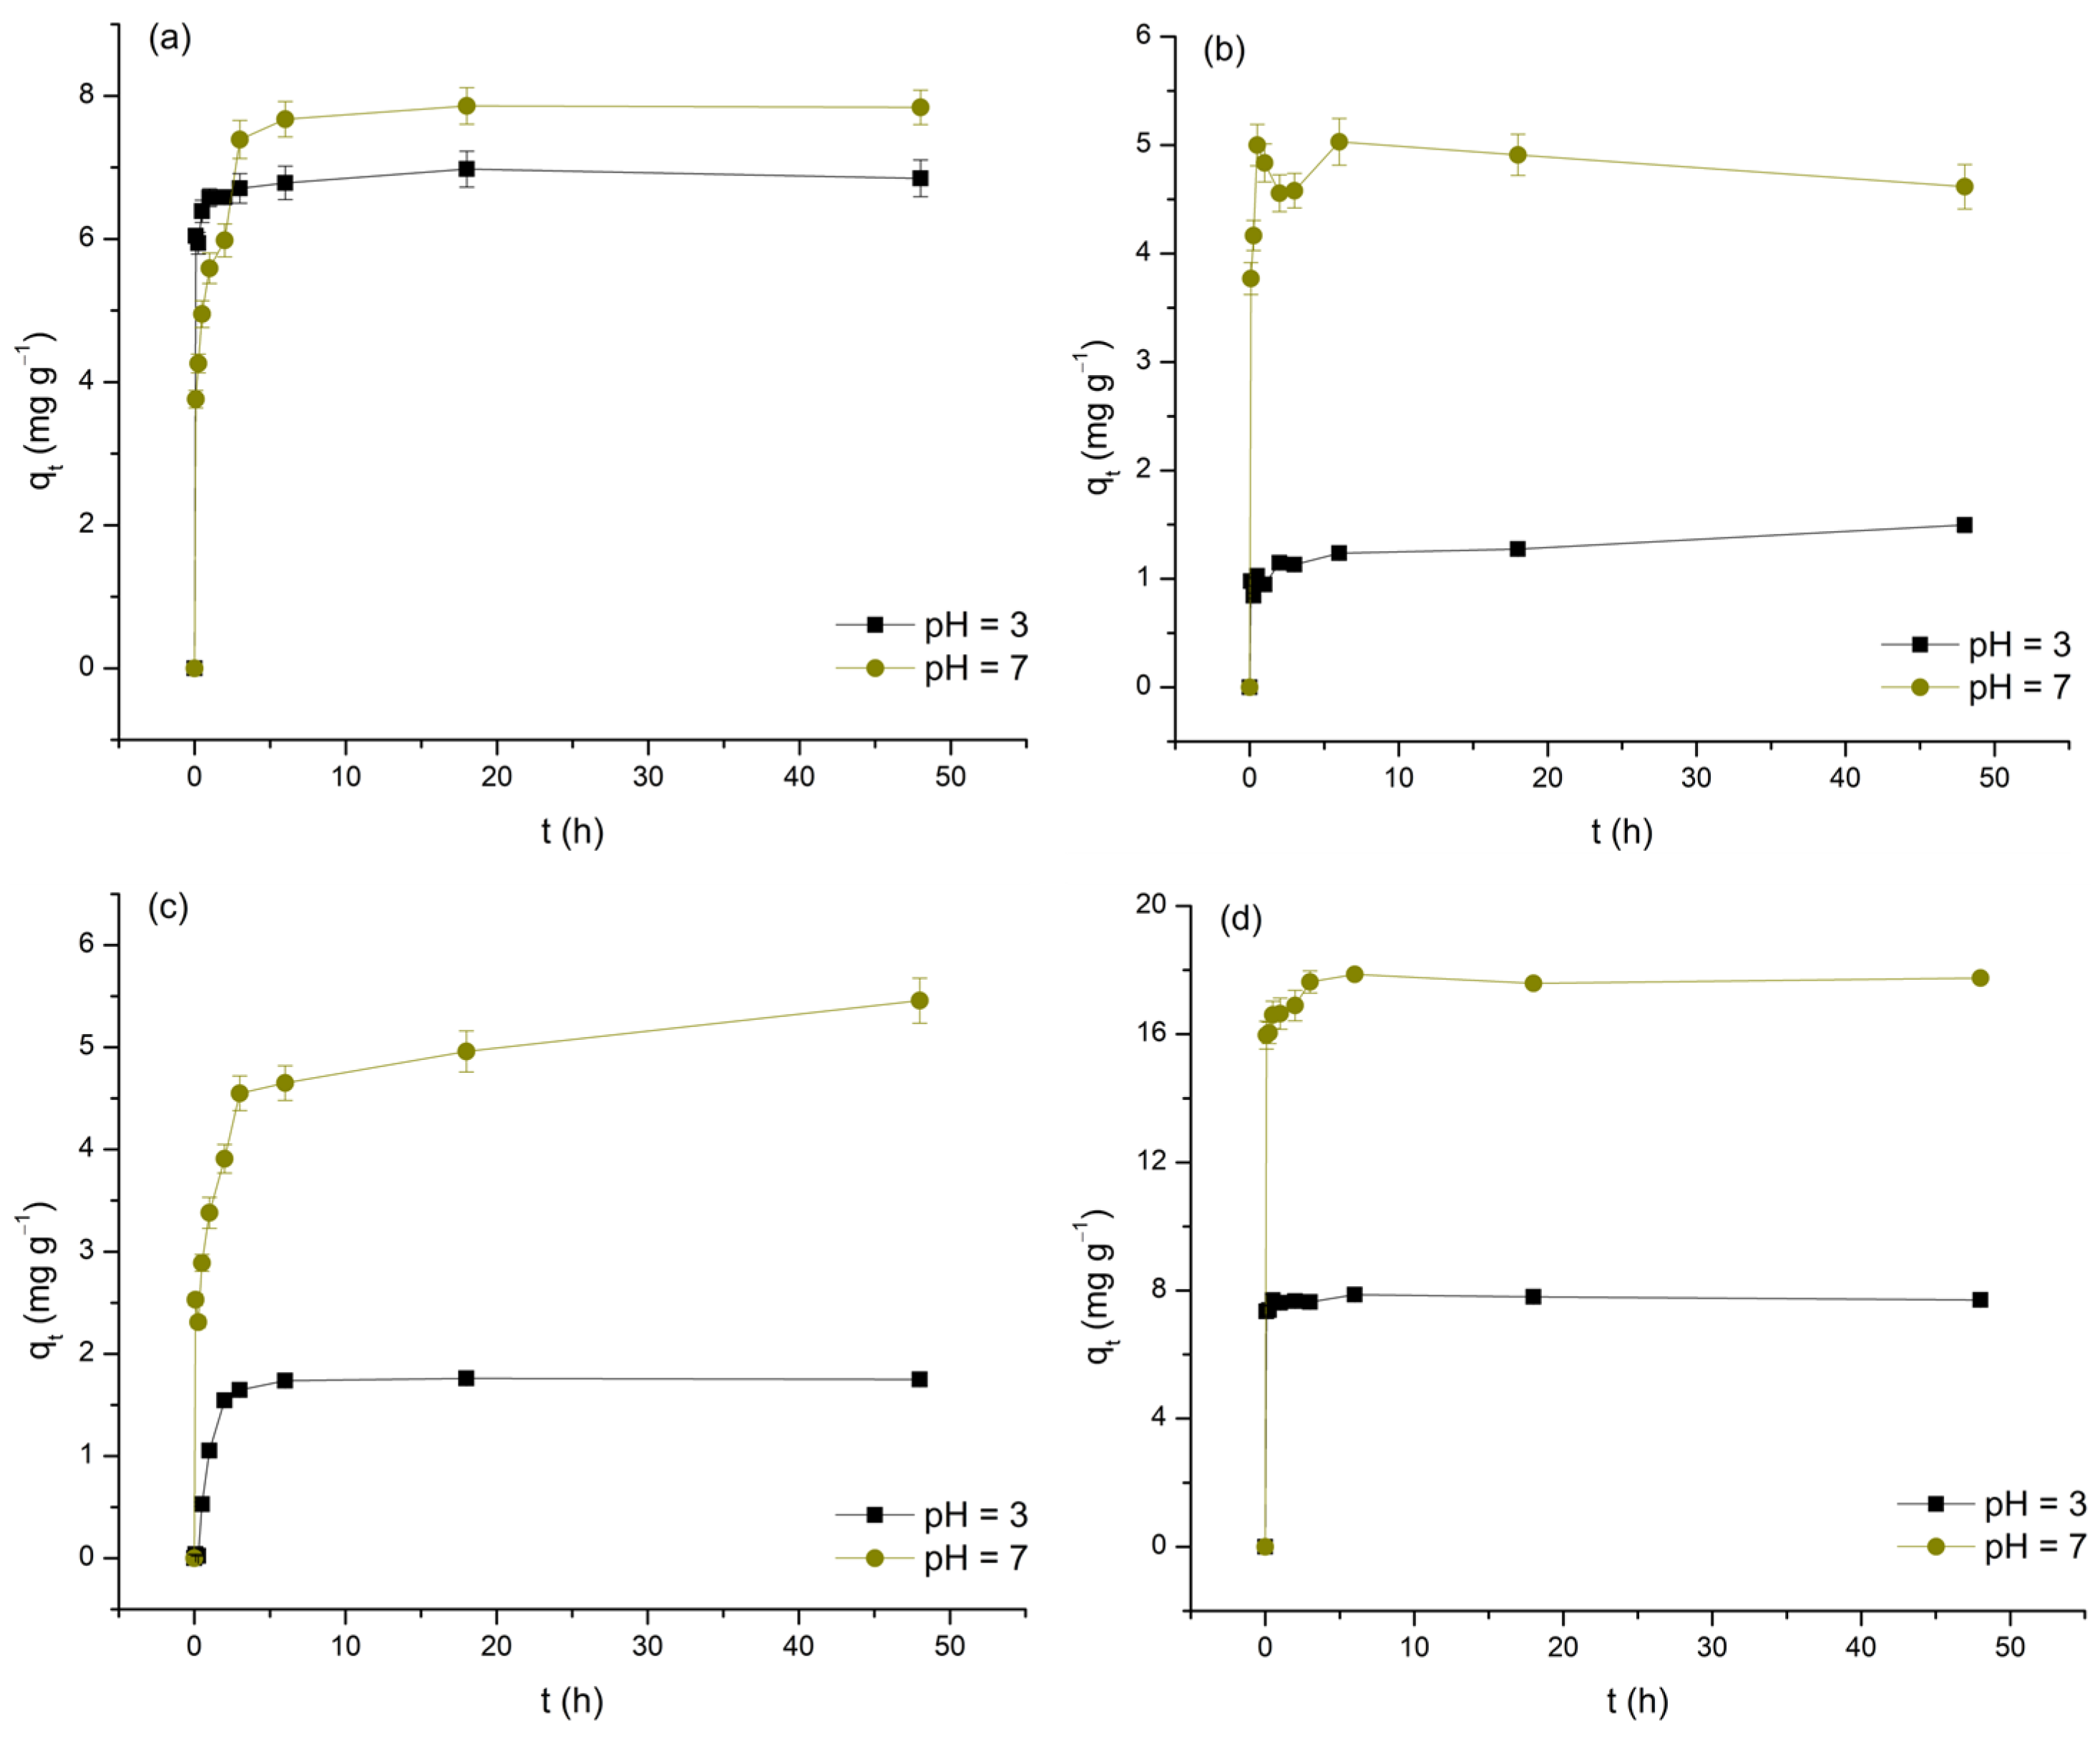
The impact of contact time on the removal of As(V) and selected M(II) by TiO2, expressed as a function of qt over t, is shown in Figure 6. To ensure consistency when identifying t associated with the occurrence of equilibrium periods, the following criterion was introduced: adsorption equilibrium is considered to be established if the change in qt with further increases in t does not exceed ±10% of the presumed limiting value.
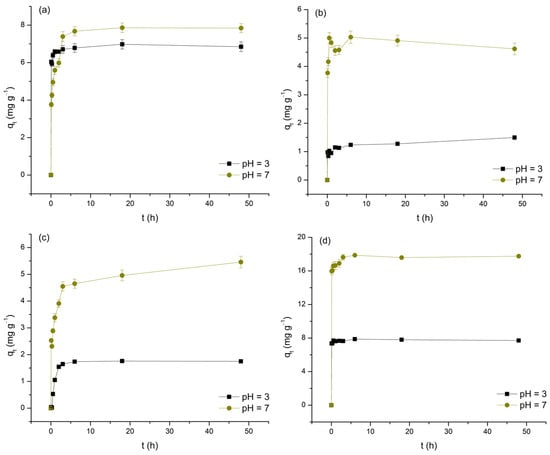
Figure 6.
Adsorption of As(V) (a), Cd(II) (b), Cu(II) (c), and Pb(II) (d) on TiO2 as a function of contact time at pH 3 and 7.
As clearly observed in the data, the increase in t, to varying degrees, positively affects the levels of As(V) and M(II) removal. Furthermore, by dividing the investigated time intervals into distinct segments, it is concluded that, with the exception of the Cu(II)/pH 3 system, the initial 5 min phase exhibits the highest adsorption rates (11.72 to 191.65 mg min−1) and the highest contributions to the average equilibrium qt values (48.89 to 96.21%). This finding supports the hypothesis that physisorption predominantly contributes to the examined processes, likely due to the development of appropriate attractive forces between As(V) and M(II) and the initially large number of available adsorption sites on the TiO2 surface. Based on the aforementioned criterion, it follows that, depending on the type of adsorbate and the pH of the medium, equilibrium is reached within a period of 5 min to 6 h. It should be emphasized that, in the case of the Cd/pH 3 and Cu/pH 7 systems, the deviation of the last points (48 h) compared to the preceding ones by more than 10% in terms of qt raises questions about the completeness of adsorption equilibrium (despite this uncertainty, in determining the adsorption isotherms, t was fixed at 24 h). The determined equilibrium times, with the exception of the Pb/pH 3 system, ≥30 min, indicate a reduction in the initial intensity of physisorption, likely caused by the decrease in concentration gradients and changes in the surface charge state of TiO2 due to continuous saturation with As(V) and M(II) ions. These observations also suggest the potential contribution of other, less dominant adsorption mechanisms, such as appropriate forms of surface complexation. The recorded differences in equilibrium t are a consequence of the dependence of this parameter on the physicochemical properties of the examined adsorbates, as well as the compatibility of their charges with those displayed by TiO2 under the conditions of the medium (further discussion on this topic will be provided in Section 3.5.). Finally, by examining the average equilibrium qt values (Table 4), the first information about the affinity of TiO2 towards As(V) and M(II) is obtained, demonstrating the following trends: Pb(II) > As(V) > Cu(II) > Cd(II) and pH 7 > pH 3 (the observed trends should not be considered absolutely reliable, given that the experimental systems were not designed based on the principle of maintaining identical m/V ratios and C0).
Table 4.
Average values of the parameters qt and REt for analyzed adsorption systems, calculated from equilibrium-range data.
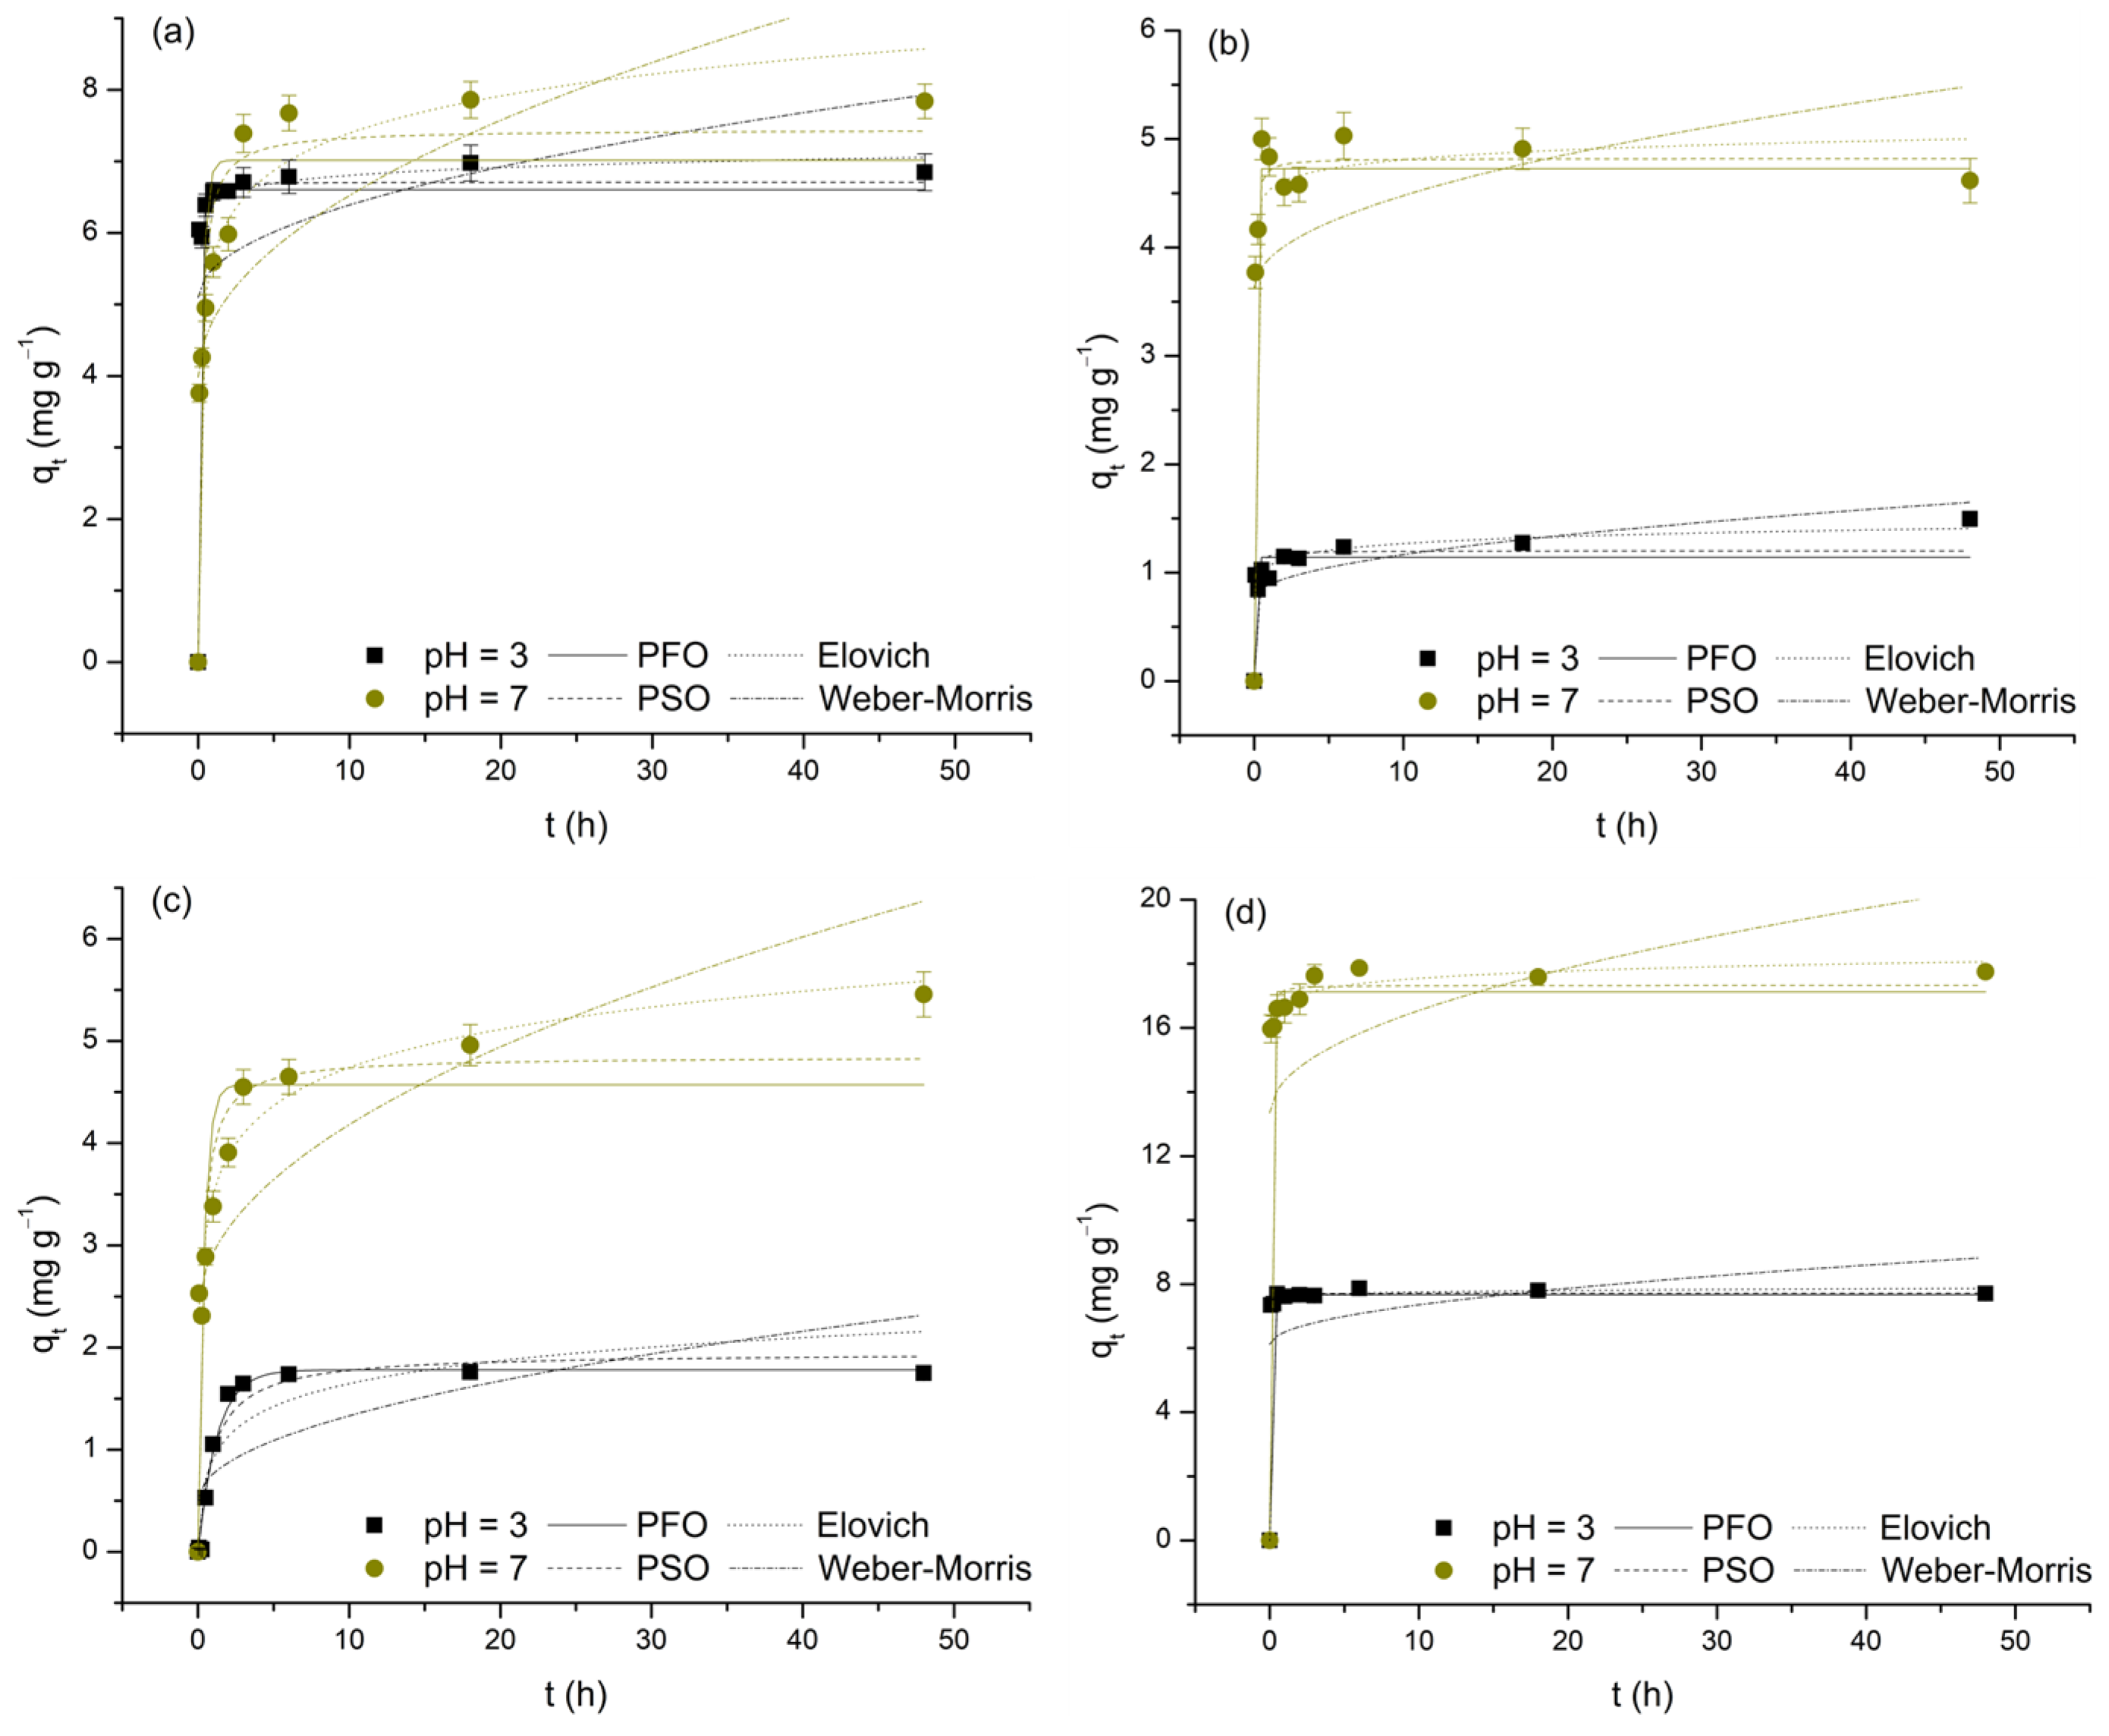
The adsorption kinetics of As(V) and M(II) on TiO2 were investigated by analyzing the qt vs. t dependence using nonlinear forms of the pseudo-first-order, pseudo-second-order, Elovich, and Weber–Morris models (Figure 7). The obtained values for the characteristic parameters and validity indicators of the applied functions are presented in Table 5. Before proceeding with their interpretation, it is important to highlight that these values should be taken with some caution, as the analyzed datasets do not meet the criterion that the majority of points should not be too close to or included within the equilibrium state. In such cases, model specificity is lost, and the risk of unreliable estimation of kinetic parameters becomes significant [60,61].
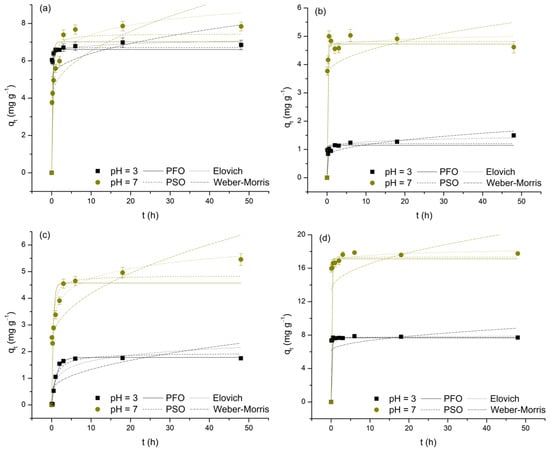
Figure 7.
Nonlinear regressions of applied kinetic models for the adsorption of As(V) (a), Cd(II) (b), Cu(II) (c), and Pb(II) (d) on TiO2 at pH 3 and 7.
Table 5.
Parameters of the pseudo-first-order, pseudo-second-order, Elovich, and Weber–Morris kinetic models for the adsorption of selected M(II) and As(V) on TiO2.
For this reason, with the exception of the Weber–Morris model (R2: 0.011–0.548, χ2: 0.160–2.573; low χ2, but also low R2, values indicate that this model, although successful in predicting experimentally obtained data, does not adequately describe their variability), it follows that all three remaining functions can be considered suitable for interpreting the investigated adsorption processes (R2: 0.763–0.998, χ2: 0.010–1.838). Therefore, it is only reasonable to assume that the adsorption kinetics of the observed systems are not controlled by intraparticle diffusion but are primarily the result of the rate at which the appropriate surface interactions are established, as evidenced by the relatively short times required to reach equilibrium. Although not ideal for direct comparison, the validity parameters of the applied reaction models provide grounds for partial generalization, i.e., concluding that the adsorption processes of interest are best described by the Elovich equation (deviations from this rule occur only in the case of the Cd(II)/pH 7 and, to a greater extent, Cu(II)/pH 3 systems; these deviations may be a result of the previously mentioned lack of model specificity or may stem from changes in the adsorption mechanisms influenced by the pH of the medium). Thus, based on the assumptions of the prioritized model, it appears that the involvement of chemisorption, occurring on the heterogeneous TiO2 surface through the progressive increase in activation energy caused by the reduction in the number of highly active adsorption sites over time, cannot be neglected. However, it is important to refrain from drawing conclusions regarding the dominance of physisorption or chemisorption. Observing the values of the α parameter, as experimental data suggest, it is evident that the initial adsorption rate, regardless of pH, is highest in systems where Pb(II) serves as the adsorbate (9.85 × 1043 and 3.76 × 10²¹ mg g−1 h−1) and, conversely, the lowest in systems characterized by the presence of Cu(II) (5.05 and 3.58 × 10² mg g−1 h−1; for the sake of comparison, the α values, except for the Cu(II)/pH 3 system, are drastically higher compared to the corresponding h values of the pseudo-second-order model). Regarding the β parameter, an indicator of the level of surface energy heterogeneity, the change in pH results in a loss of the observed consistency, as selected adsorbates form completely different relationships (Pb(II) > Cd(II) > As(V) > Cu(II)—pH 3 and Cd(II) > Pb(II) > Cu(II) > As(V)—pH 7). However, a subsequent trend is recorded: pH 3 > pH 7. All this indicates that the behavior of the examined adsorption systems is the result of the simultaneous interaction of two key factors: on the one hand, the type and distribution of adsorption sites on the TiO2 surface, and on the other, the specific properties of As(V) and the selected M(II) (e.g., electronegativity, ionic radius, hydration energy, etc.). Finally, it is important to note that the α and β values should not be considered reliable, which is particularly noticeable in the case of α, which is most likely overestimated by the model and therefore lacks physical significance.
3.3. Influence of Initial Concentration and Investigation of Adsorption Isotherms
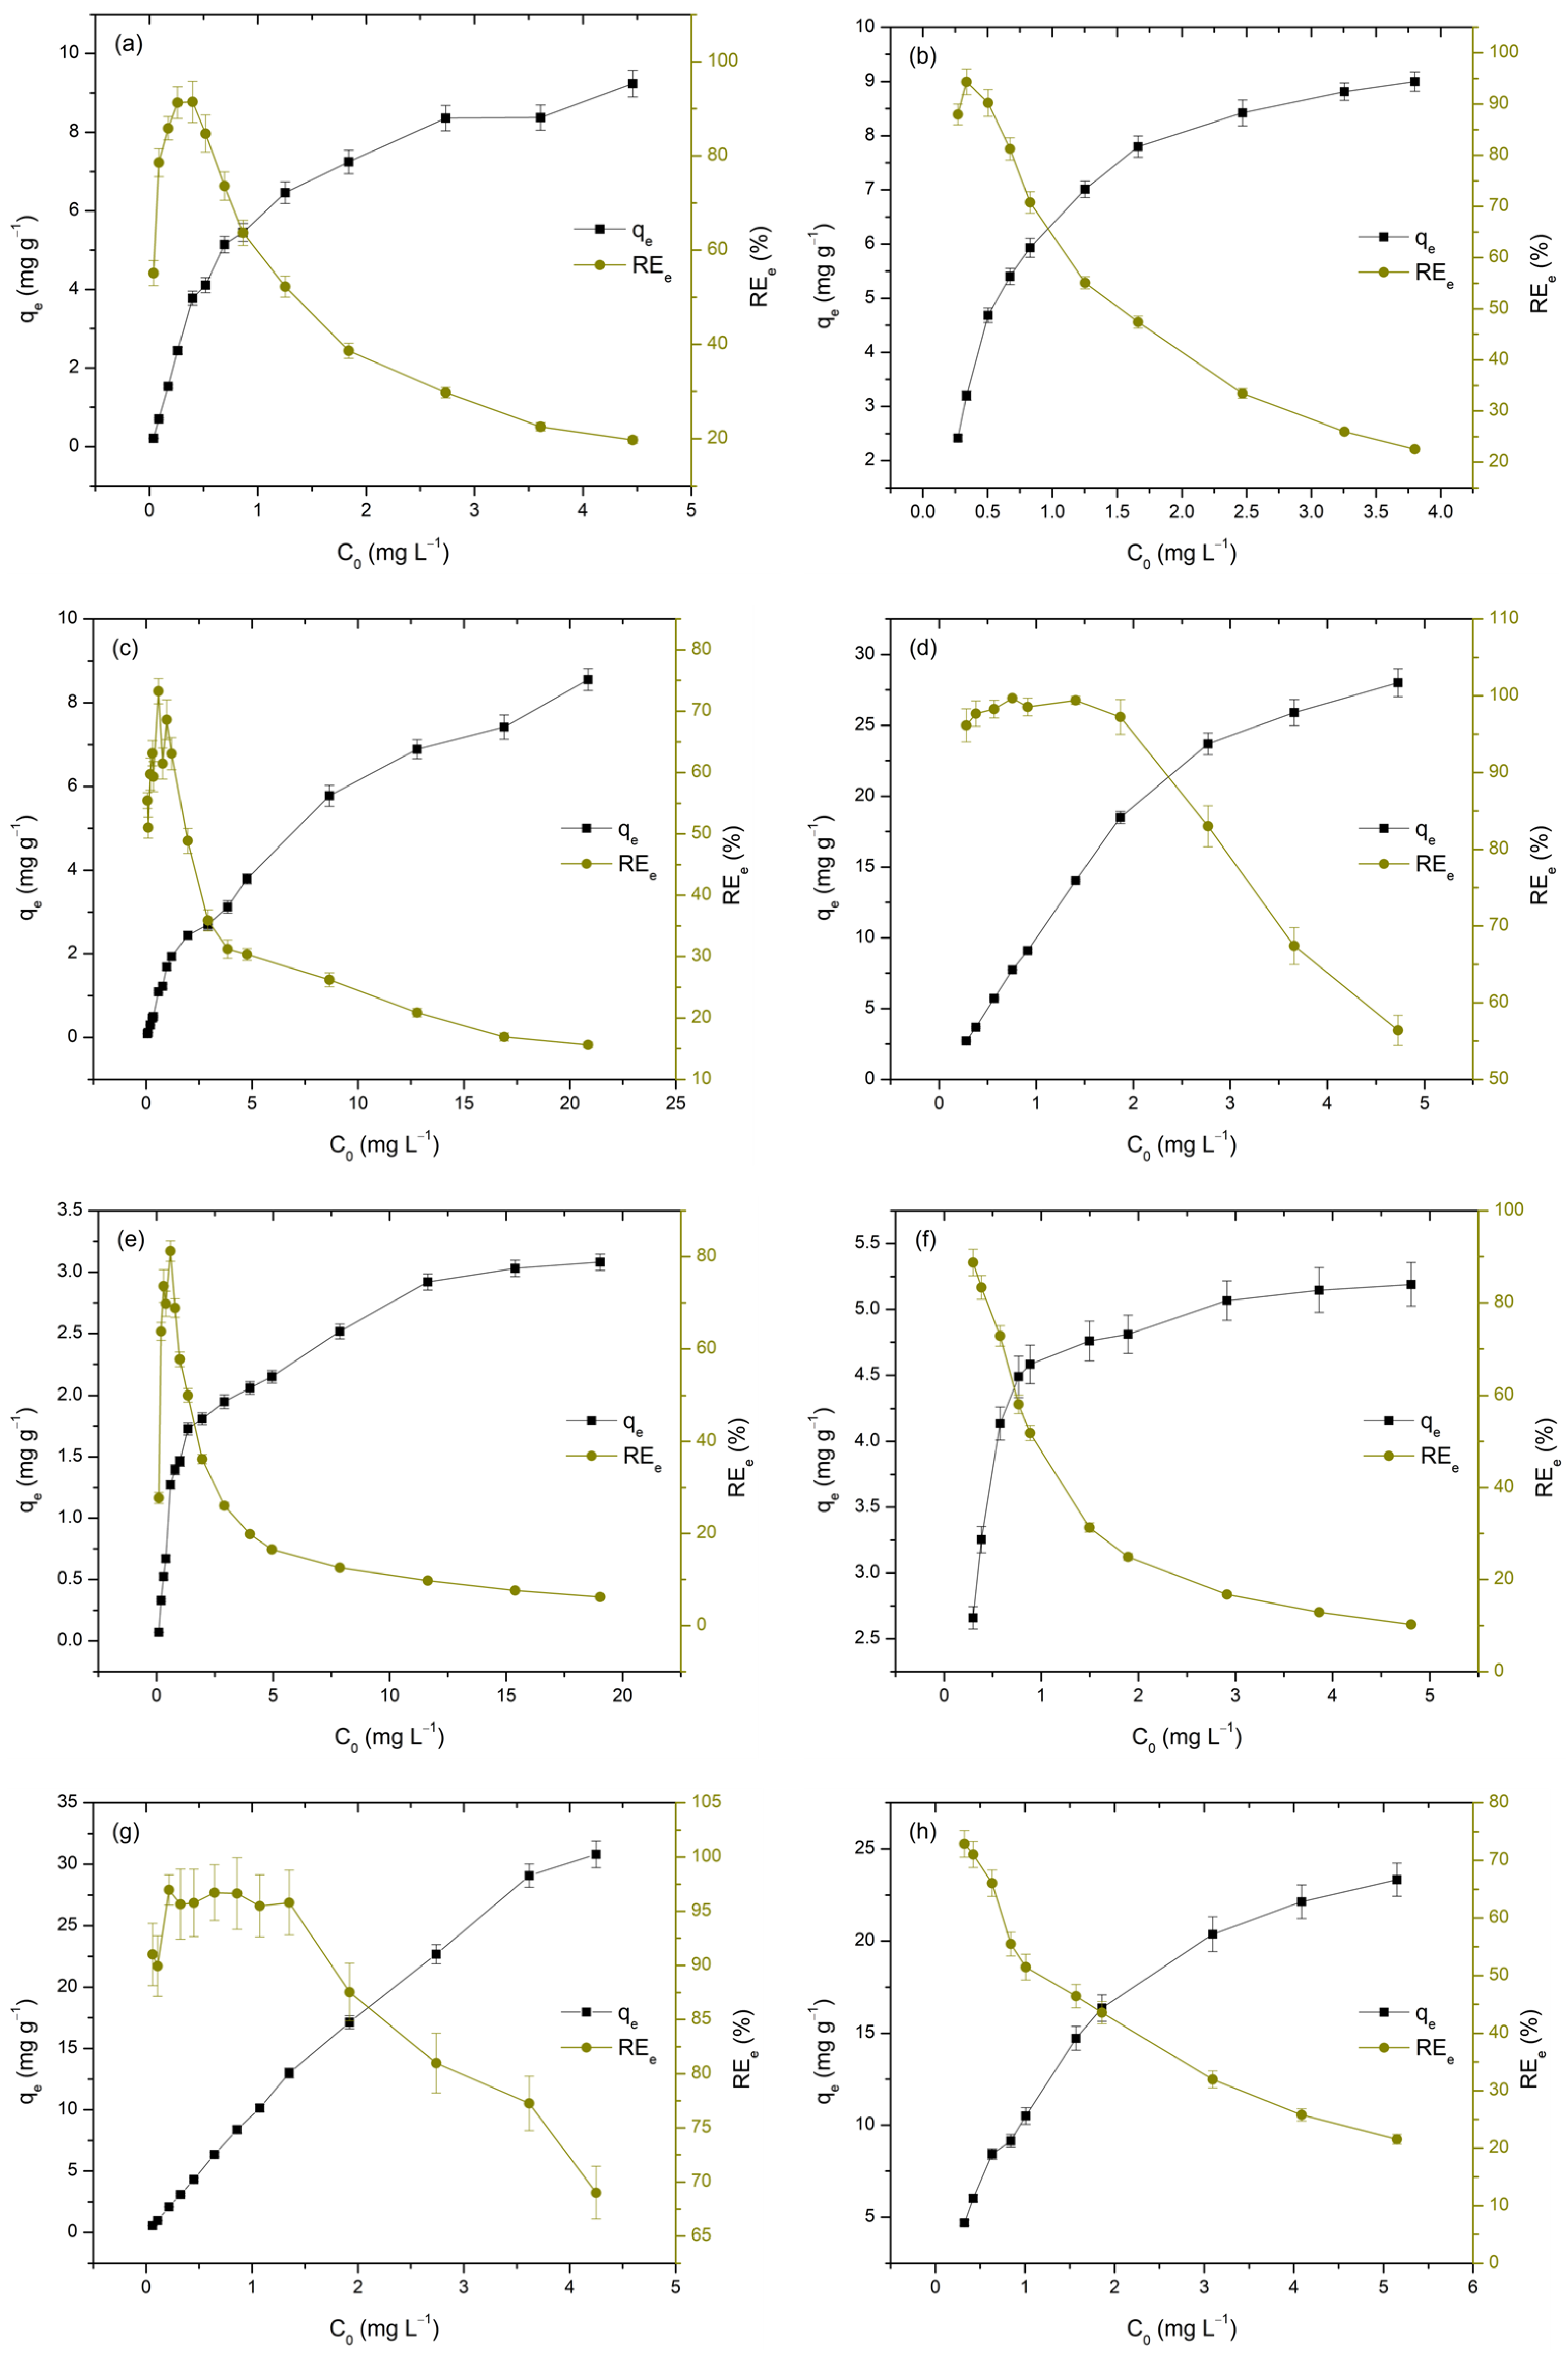
The initial concentration of metal ions is a key factor influencing the adsorption process, as it directly affects both the qe and REe. To better understand this influence on the adsorption performance of TiO2, the initial concentrations of M(II) and As(V) were varied within the range of 50 to 5000 µgL−1 at pH 3 and from 300 to 5000 µgL−1 at pH 7. The obtained results are presented in Figure 8 and Table 6.
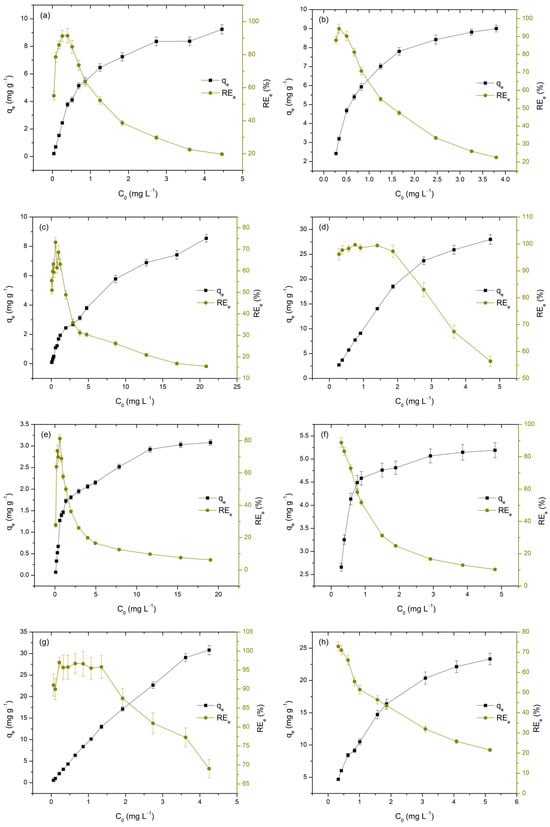
Figure 8.
Adsorption of As(V), Cd(II), Cu(II), and Pb(II) on TiO2 as a function of initial concentration at pH 3 and 7. Each subfigure presents one adsorbate at a single pH level: As(V) at pH 3 (a) and pH 7 (b); Cd(II) at pH 3 (c) and pH 7 (d); Cu(II) at pH 3 (e) and pH 7 (f); and Pb(II) at pH 3 (g) and pH 7 (h).
Table 6.
Influence of initial concentration on the qe and REe values for the investigated adsorption systems.
It is evident that increasing the concentration of the analyzed metals in the liquid phase leads to a rise in qe, while simultaneously causing a decrease in REe values, as illustrated in Figure 9 and Table 7. The observed increase in adsorption capacity (qe) with higher initial metal concentrations (Ct) is attributed to the enhanced concentration gradient, which provides a stronger driving force for mass transfer, thereby facilitating adsorption. This trend has been consistently reported in studies where higher initial metal concentrations resulted in increased adsorption capacities, due to the greater availability of metal ions for interaction with the adsorbent surface [62]. Conversely, the decrease in removal efficiency with increasing C0 can be attributed to the gradual saturation of the TiO2 surface, which has a limited number of active sites. As these sites become occupied, the adsorbent’s ability to remove additional metal ions diminishes, resulting in lower removal efficiencies [35]. This behavior is particularly relevant at high initial concentrations, where the limited availability of adsorption sites leads to reduced removal performance [30,63,64].
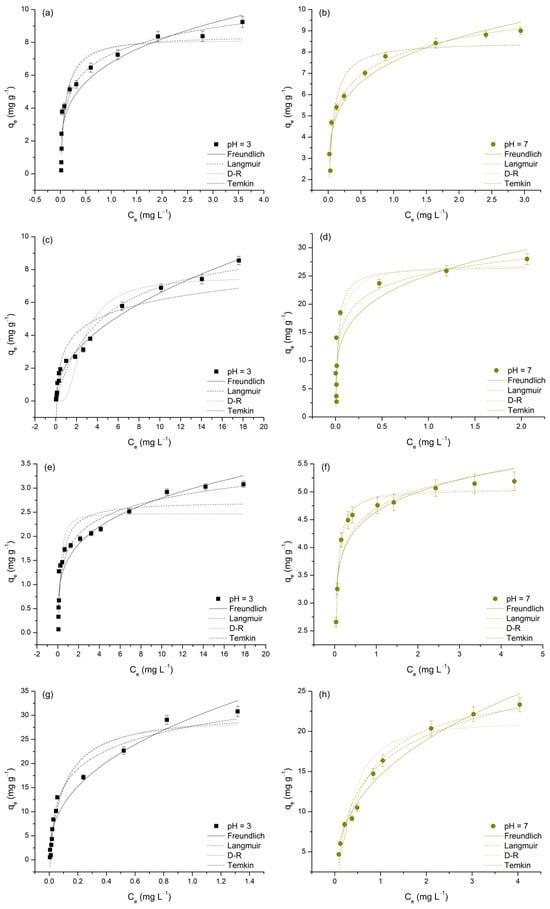
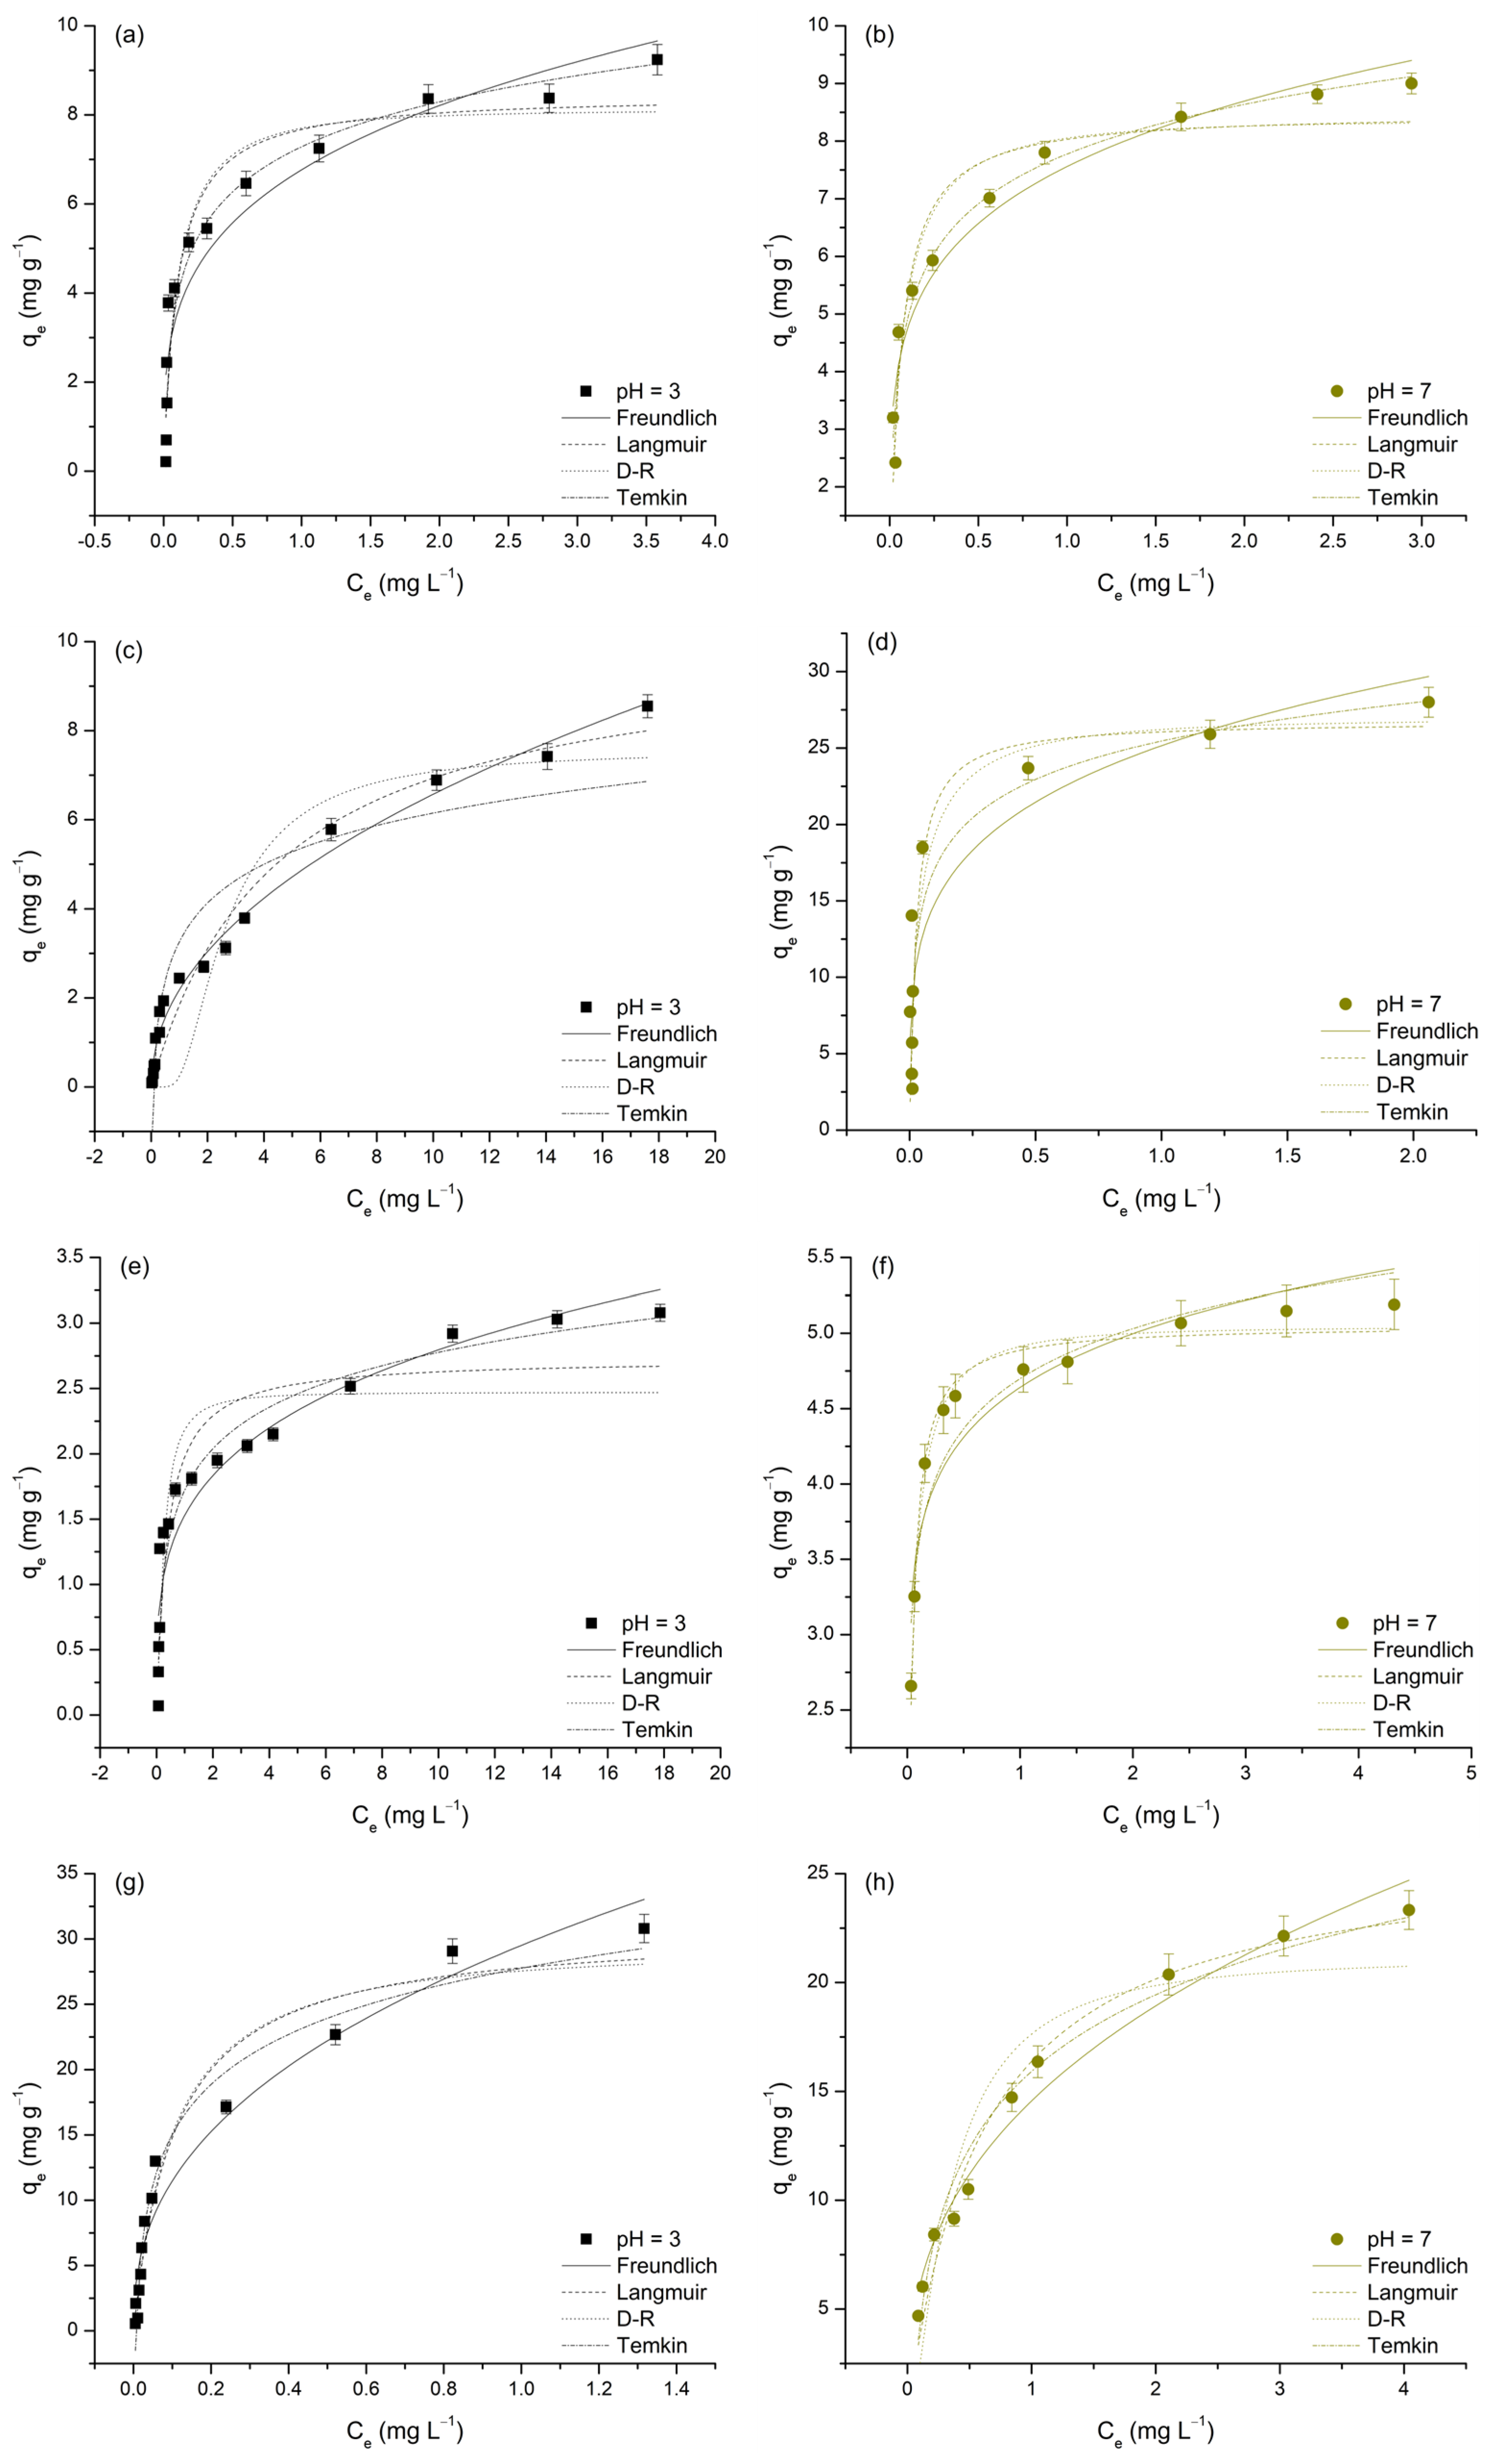
Figure 9.
Nonlinear regressions of applied isotherm models for the adsorption of As(V), Cd(II), Cu(II), and Pb(II) on TiO2 at pH 3 and 7. Each subfigure presents one adsorbate at a single pH level: As(V) at pH 3 (a) and pH 7 (b); Cd(II) at pH 3 (c) and pH 7 (d); Cu(II) at pH 3 (e) and pH 7 (f); and Pb(II) at pH 3 (g) and pH 7 (h).
Table 7.
Parameters of the Freundlich, Langmuir, Dubinin–Radushkevich, and Temkin isotherm models for the adsorption of selected M(II) and As(V) on TiO2.
To gain a deeper understanding of the adsorption behavior of M(II) and As(V) on TiO2, and to evaluate its adsorption affinities and capacities for these metals, the experimental data were further analyzed using four commonly applied isotherm models: Freundlich, Langmuir, Dubinin–Radushkevich (D–R), and Temkin (Figure 9). The parameters obtained from these models are presented in Table 7.
The adsorption data were well represented by all four isotherm models, as indicated by the high R2 values (0.802–0.985) and relatively low χ2 values, suggesting a good fit in most cases. According to Simonin [61], models with R2 > 0.85 can be considered to show a good fit and are generally reliable for predicting adsorption behavior. Among the applied models, the Langmuir model generally provided the best fit, with R2 values above 0.90 for most metals, except for Cu(II) at pH 3 (R2 = 0.879) and Cd(II) at pH 7 (R2 = 0.819), where the fit was slightly weaker. The Freundlich model showed particularly good performance for Cd(II) at pH 3 (R2 = 0.985) and Pb(II) at pH 7 (R2 = 0.975), indicating its suitability under these conditions. The Temkin model best described the adsorption of Pb(II) at pH 7 (R2 = 0.975) and As(V) at pH 3 (R2 = 0.949), highlighting the relevance of adsorbate–adsorbent interactions in these cases. Conversely, the D–R model exhibited lower R2 values in some instances, particularly for Cd(II) at pH 7 (R2 = 0.825) and Cu(II) at pH 3 (R2 = 0.830). Although the D–R model provided a good fit for Cu(II) at pH 7 (R2 = 0.981), its overall performance was generally weaker than that of the Langmuir and Freundlich models (Table 7). The following sections will provide an in-depth discussion of each applied model in relation to the adsorption behavior of the studied metals.
The Freundlich model describes adsorption on heterogeneous surfaces, where the Freundlich constant (KF) indicates adsorption capacity and the adsorption intensity parameter (n) reflects surface heterogeneity and binding strength [31,65]. The variation in KF values across investigated metals and pH levels can provide insights into adsorption efficiency. However, a direct comparison of KF values is not possible due to their different units, which stems from the nonlinearity of the adsorption isotherms. Instead, a qualitative assessment of the relative adsorption affinity among different metal ions can be made based on the observed trends. At pH 3, the order of KF values was as follows: Pb(II) > As(V) > Cd(II) > Cu(II) (Table 7). This trend indicates that Pb(II) exhibited the highest affinity toward TiO2, likely due to its larger ionic radius and strong electrostatic interactions. As(V) also showed significant adsorption, which can be attributed to the specific interactions between arsenate species and surface functional groups of TiO2 [66].
At pH 7, the KF values follow a different trend: Cd(II) > Pb(II) > As(V) > Cu(II). This shift suggests that Cd(II) adsorption increased significantly at neutral pH, likely due to reduced proton competition and more pronounced surface-related interactions, such as electrostatic and/or complexation effects. Meanwhile, Pb(II) still exhibited a relatively high KF value, although lower than at pH 3, while As(V) adsorption remained relatively stable across both pH levels, likely due to the ability of arsenate species to interact with the TiO2 surface through ligand exchange mechanisms, even under neutral conditions [66]. In contrast, Cu(II) consistently displayed the lowest KF values across both pH levels, indicating a weaker affinity for TiO2 [63].
The adsorption intensity parameter, n, remained below 1 for all metals, confirming a favorable adsorption process. Lower n values were observed for As(V) (0.28 at pH 3, 0.20 at pH 7) and Cu(II) (0.26 at pH 3, 0.11 at pH 7), indicating stronger binding interactions and a highly heterogeneous adsorption surface. For Cd(II) (0.48, 0.23) and Pb(II) (0.41, 0.38), the adsorption process is still favorable, but the lower heterogeneity may indicate more uniform binding sites for these ions.
The Langmuir model assumes monolayer adsorption on a homogenous surface, characterized by qm (maximum adsorption capacity) and KL (Langmuir constant related to binding strength) [65]. At pH 3, the order of qm values was as follows: Pb(II) > Cd(II) > As(V) > Cu(II) (2.73 mg·g−1). The high adsorption capacity of Pb(II) is consistent with the Freundlich model results, reinforcing its strong affinity for TiO2. Cd(II) and As(V) also exhibited notable adsorption capacities, whereas Cu(II) had the lowest qm value, indicating weak interaction with the adsorbent surface. The highest uptake for Pb(II), followed by Cd(II) and Cu(II), using composites synthesized from titanium dioxide and carbon spheres (TNT/CS) were reported by Ade et al. [67], which is in agreement with our work.
At pH 7, the order of qm values changed to Cd(II) > Pb(II) > As(V) > Cu(II). The substantial increase in Cd(II) adsorption at pH 7 aligns with the Freundlich trend, confirming that its adsorption is highly pH-dependent. Similarly, Cu(II) adsorption also improved, suggesting that, at higher pH, the adsorption of Cu(II) becomes more pronounced. This observation was also reported by Chen et al. [68], who investigated metal adsorption on titanium dioxide-based nanomaterials and found that increasing pH enhanced Cu(II) uptake due to reduced proton competition and increased availability of negatively charged surface sites. In contrast, Pb(II) adsorption capacity showed a slight decrease at pH 7 compared to pH 3, which was also consistent with the Freundlich model. Despite this moderate reduction, Pb(II) still demonstrated a strong adsorption capacity, indicating its significant affinity for TiO2 under both acidic and neutral conditions [69,70].
The Langmuir constant (KL), which represents the binding affinity of the adsorbate, showed distinct trends across the investigated pH levels. At pH 3, As(V) (9.82 L mg−1) and Pb(II) (9.26 L mg−1) had the highest KL values, indicating strong adsorption affinity, while Cd(II) (0.22 L mg−1) exhibited the weakest binding. This suggests that Pb(II) and As(V) interact more effectively with TiO2 under acidic conditions. At pH 7, a substantial increase in KL was observed for Cd(II) (37.64 L mg−1) and Cu(II) (29.61 L mg−1), suggesting that their adsorption became more favorable at neutral pH likely due to enhanced electrostatic and/or complexation interactions. In contrast, the KL value for Pb(II) (1.67 L mg−1) sharply decreased, while As(V) maintained a relatively high KL (16.96 L mg−1), indicating its continued affinity for TiO2 across both pH levels. The separation factor (RL, where 0 < RL < 1) confirmed favorable adsorption conditions for all metal ions, with lower RL values at pH 7 suggesting enhanced adsorption under neutral conditions. A similar observation was reported in another similar study [71].
The Dubinin–Radushkevich (D-R) isotherm model, which describes adsorption through a pore-filling mechanism rather than monolayer adsorption, provided theoretical saturation capacities (qd) [72]. Pb(II) exhibited the highest qd (29.11 mg g−1 at pH 3 and 21.13 mg g−1 at pH 7), confirming its strong adsorption affinity, as also indicated by the Langmuir and Freundlich models. In contrast, Cu(II) showed the lowest qd (2.47–5.04 mg g−1), suggesting weak adsorption (Table 7). Cd(II) and As(V) (7.56–26.94 mg g−1) displayed pH-dependent adsorption, particularly Cd(II), which exhibited a significant increase at pH 7, likely due to stronger surface interactions. The mean free energy (Ed), which determines the nature of the adsorption mechanism, ranged from 0.65 to 7.47 kJ/mol, indicating that adsorption was predominantly physisorption-driven (Ed < 8 kJ/mol). According to the D-R model, adsorption processes with Ed < 8 kJ/mol are classified as physisorption, while values exceeding this threshold indicate chemisorption [31]. The Ed values confirmed that all metal ions were primarily adsorbed via physisorption, except for Cd(II), which had an Ed value of 7.32 kJ/mol, approaching the chemisorption threshold, suggesting additional interactions. The R2 values for the D-R model were generally lower than those of the Langmuir and Freundlich models, indicating that pore filling may not fully explain adsorption for all metal ions. However, for Cu(II) at pH 7 (R2 = 0.981), the strong model fit suggests that surface porosity played a significant role in its adsorption behavior.
The Temkin isotherm model, which accounts for indirect adsorbate-adsorbent interactions and assumes a linear decrease in adsorption energy with increasing surface coverage, provided further insights into the thermodynamic behavior of the adsorption process [72]. In this model, the equilibrium binding constant (KT) reflects the strength of the adsorbate–adsorbent interaction, while the binding energy constant (bt) is directly related to the heat of adsorption and thus indicative of the thermodynamic nature of the process. As shown in Table 7, both KT and bt values exhibited clear pH-dependent trends. Pb(II) exhibited the highest KT at pH 3 (1.52 × 10² L g−1), indicating strong affinity under acidic conditions; however, this value declined significantly at pH 7 (23.07 L g−1), suggesting reduced interaction strength at higher pH.
In contrast, Cd(II) and Cu(II) displayed higher KT values at pH 7, aligning with Langmuir and Freundlich trends that indicated improved adsorption at neutral pH due to enhanced electrostatic and/or complexation interactions. Notably, all bt values were positive, indicating that the calculated enthalpy changes (ΔHads) are negative. This confirms that the adsorption processes are exothermic in nature, meaning they release energy and may become less favorable at elevated temperatures.
The exothermic nature of the process is particularly evident for Cu(II) at pH 7, which exhibited the highest bt value (5.18 kJ mol−1), corresponding to the most negative enthalpy change and indicating strong adsorbate-adsorbent interactions. Conversely, lower bt values observed for Pb(II) and As(V), especially under acidic conditions, suggest weaker adsorption interactions. These findings are consistent with the results of the Langmuir and Freundlich models, which showed that Pb(II) and As(V) adsorb more effectively under acidic conditions, while Cd(II) and Cu(II) adsorption is favored at neutral pH.
Overall, the Temkin model complements the results from other isotherm models by emphasizing the thermodynamic nature of adsorption and highlighting the role of pH in modulating interaction strength. The variations in KT and bt underscore the complex interplay between electrostatic attraction, surface complexation, and thermodynamic driving forces in controlling the adsorption of metal ions onto TiO2.
3.4. Principal Component Analysis
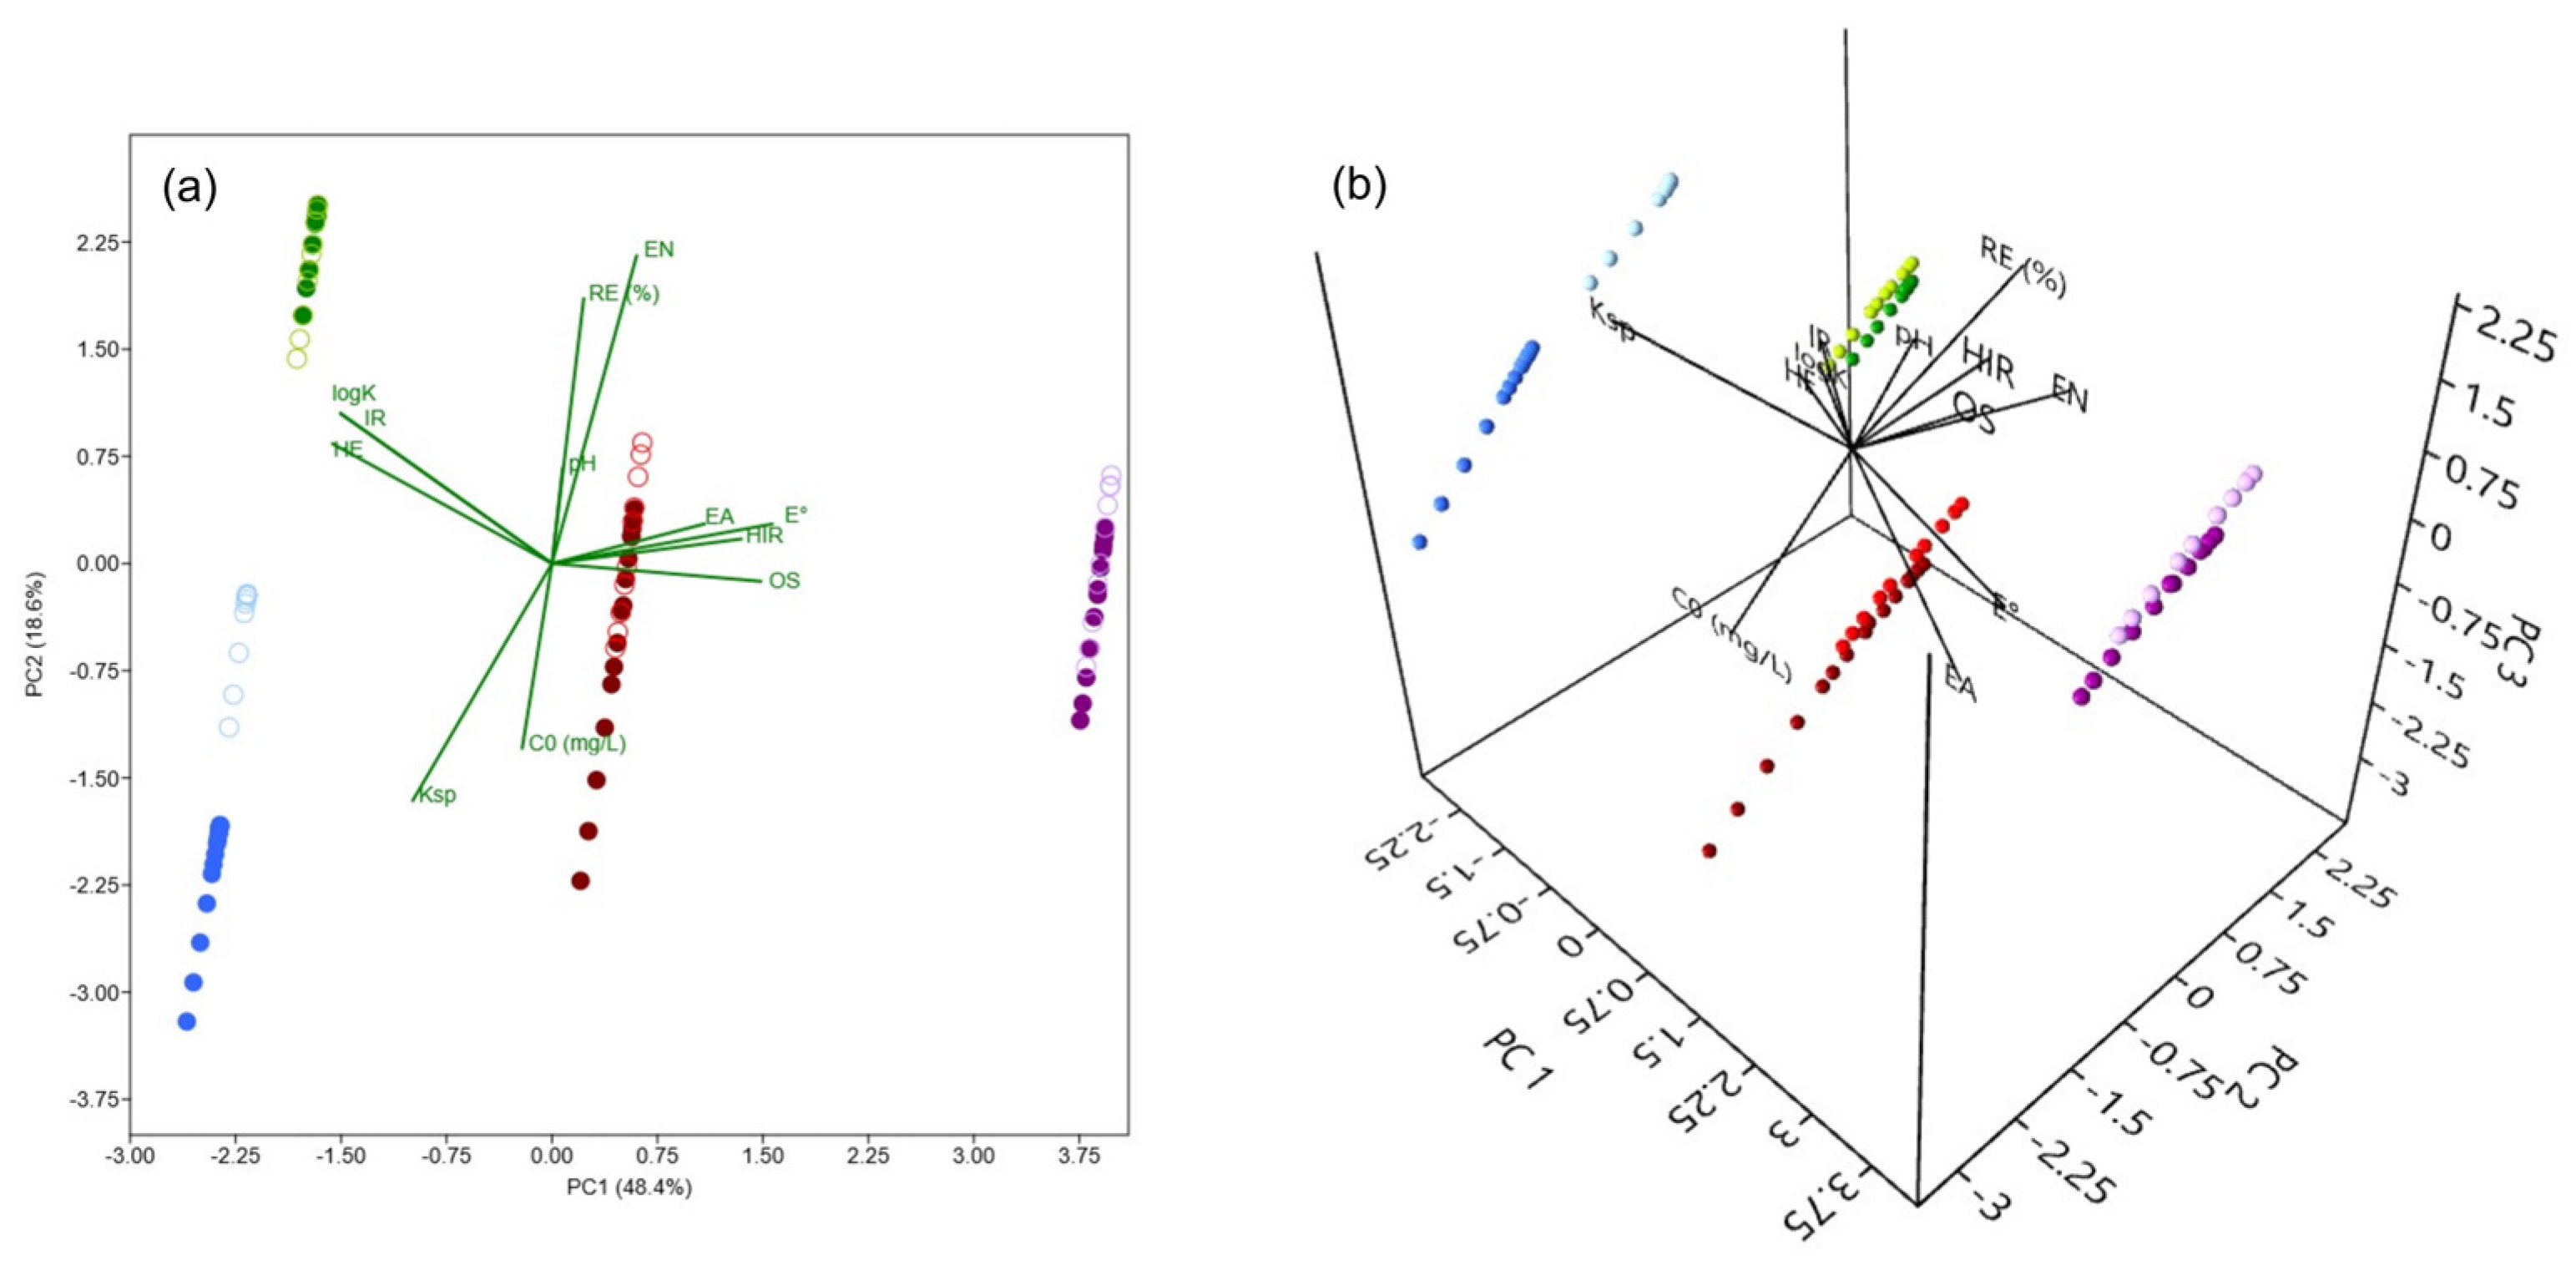
A PCA was conducted to investigate the influence of experimental conditions (C0 and pH), along with the properties of As(V) and M(II) (oxidation state—OS, ionic radius (pm)—IR, hydrated ionic radius (pm)—HIR, electronegativity (Pauling)—EN, hydration energy (kJ mol−1)—HE, hydrolysis constant—logK, solubility product constant—Ksp, standard reduction potential (V)—E°, and electron affinity (eV)—EA; Table 8) on the recorded REe values [73,74,75]. Figure 10 presents a PCA biplot, offering a visual representation of the correlations between these variables. The first two principal components, PC1 and PC2, explain 67% of the total variance (48.4% and 18.6%, respectively; Figure 10a), providing insight into the primary factors governing the removal of As(V) and M(II) under varying conditions. Incorporating the third principal component, PC3 (Figure 10b), which accounts for an additional 13.1% of the total variance, increases the cumulative explained variance to 80.1%, offering further insight into the influence of certain variables.
Table 8.
Overview of the physicochemical properties of As(V) and M(II) relevant to adsorption processes.
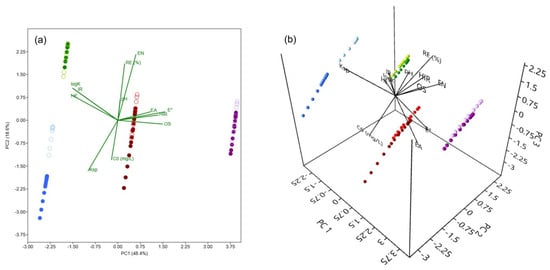
Figure 10.
Biplots of PCA for PC1 × PC2 (a) and PC1 × PC2 × PC3 (b), representing the influence of experimental conditions (C0 and pH) and the properties of As(V) and M(II) (OS—oxidation state, IR—ionic radius, HIR—hydrated ionic radius, EN—electronegativity, HE—hydration energy, logK—hydrolysis constant, Ksp—solubility product constant, E°—standard reduction potential, and EA—electron affinity) on the recorded REe values. Colors correspond to adsorbates: purple—As(V), blue—Cd(II), red—Cu(II), and green—Pb(II), with shade intensity indicating the pH (dark for pH 3, light for pH 7).
The PCA biplot clearly shows a strong correlation between the uptake of selected adsorbates and the experimental conditions, with REe positively correlating with the pH of the background solution. This can be attributed to the contribution of pH in promoting favorable electrostatic conditions within the systems of interest, as well as to the decrease in the solubility of the investigated species (primarily Cu(II) and Pb(II)), both of which typically have a positive effect on the achieved removals. This finding is consistent with the negative correlation observed between REe and Ksp. In the case of Cd(II), the PC1 × PC2 biplot shows a clear clustering of data points corresponding to different pH conditions, whereas such separation is not evident in the three other cases. However, by incorporating a third principal component, a distinction based on pH becomes observable for As(V), Cu(II), and Pb(II) as well. This suggests that, to varying extents, pH influences the removal of both As(V) and M(II) by the investigated adsorbent. A negative correlation between REe and C0 was also observed, indicating possible saturation of the TiO2 at higher concentrations. Finally, REe shows a strong association with EN, suggesting that adsorbates with a greater tendency to gain electrons exhibit a higher affinity for adsorption onto TiO2.
Distinct clustering of adsorbates is evident in the biplot, with As(V) (purple) positioned at the far right, clearly separated from Cd(II) (blue), Cu(II) (red), and Pb(II) (green), suggesting fundamentally different removal mechanisms. This separation aligns with the high E° of As(V), which may reflect its strong tendency to engage in surface complexation, i.e., ligand exchange with TiO2, in contrast to the predominantly electrostatic interactions governing the M(II) cationic species. In contrast, Pb(II) aligns with HE and logK, indicating that hydration and hydrolysis effects play a significant role in its removal. The central position is occupied by Cu(II), reflecting a moderate influence from multiple variables. Meanwhile, Cd(II), located at the far left, likely reflects its high solubility but still exhibits relatively high adsorption, possibly due to other factors.
Overall, PCA reveals that As(V) and M(II) removal is governed by a combination of solution chemistry (C0 and pH) and intrinsic adsorbates properties, with distinct trends observed for different elements. The clustering patterns suggest that treatment strategies should be tailored to the specific characteristics of each adsorbate and environmental conditions.
3.5. Adsorption Mechanisms
Since all adsorption experiments covered in this study were conducted at two pH values, 3 and 7, interpreting the effects of potentially involved adsorption mechanisms should be approached by considering the impact of the given environmental parameter, both on the electric state of the TiO2 surface and on the forms in which As(V) and M(II) are present.
Namely, based on the fact that the pHpzc for TiO2 is 4.34 ± 0.12, it is clear that under the monitored experimental conditions, both possible scenarios regarding the surface charge of the adsorbent are realized: at pH 3, the surface is predominantly positive (pH < pHpzc), while at pH 7, it is predominantly negative (pH > pHpzc). The reason for this lies in the interactions occurring between the amphoteric active sites of TiO2, formed through its hydroxylation by water molecules, and the aqueous protons, which consequently result in protonation and deprotonation reactions, as shown by Equations (3) and (4) [76,77,78]
where TiOH, TiOH2+, and TiO– represent neutral, protonated, and ionized hydroxyl groups on the TiO2 surface.
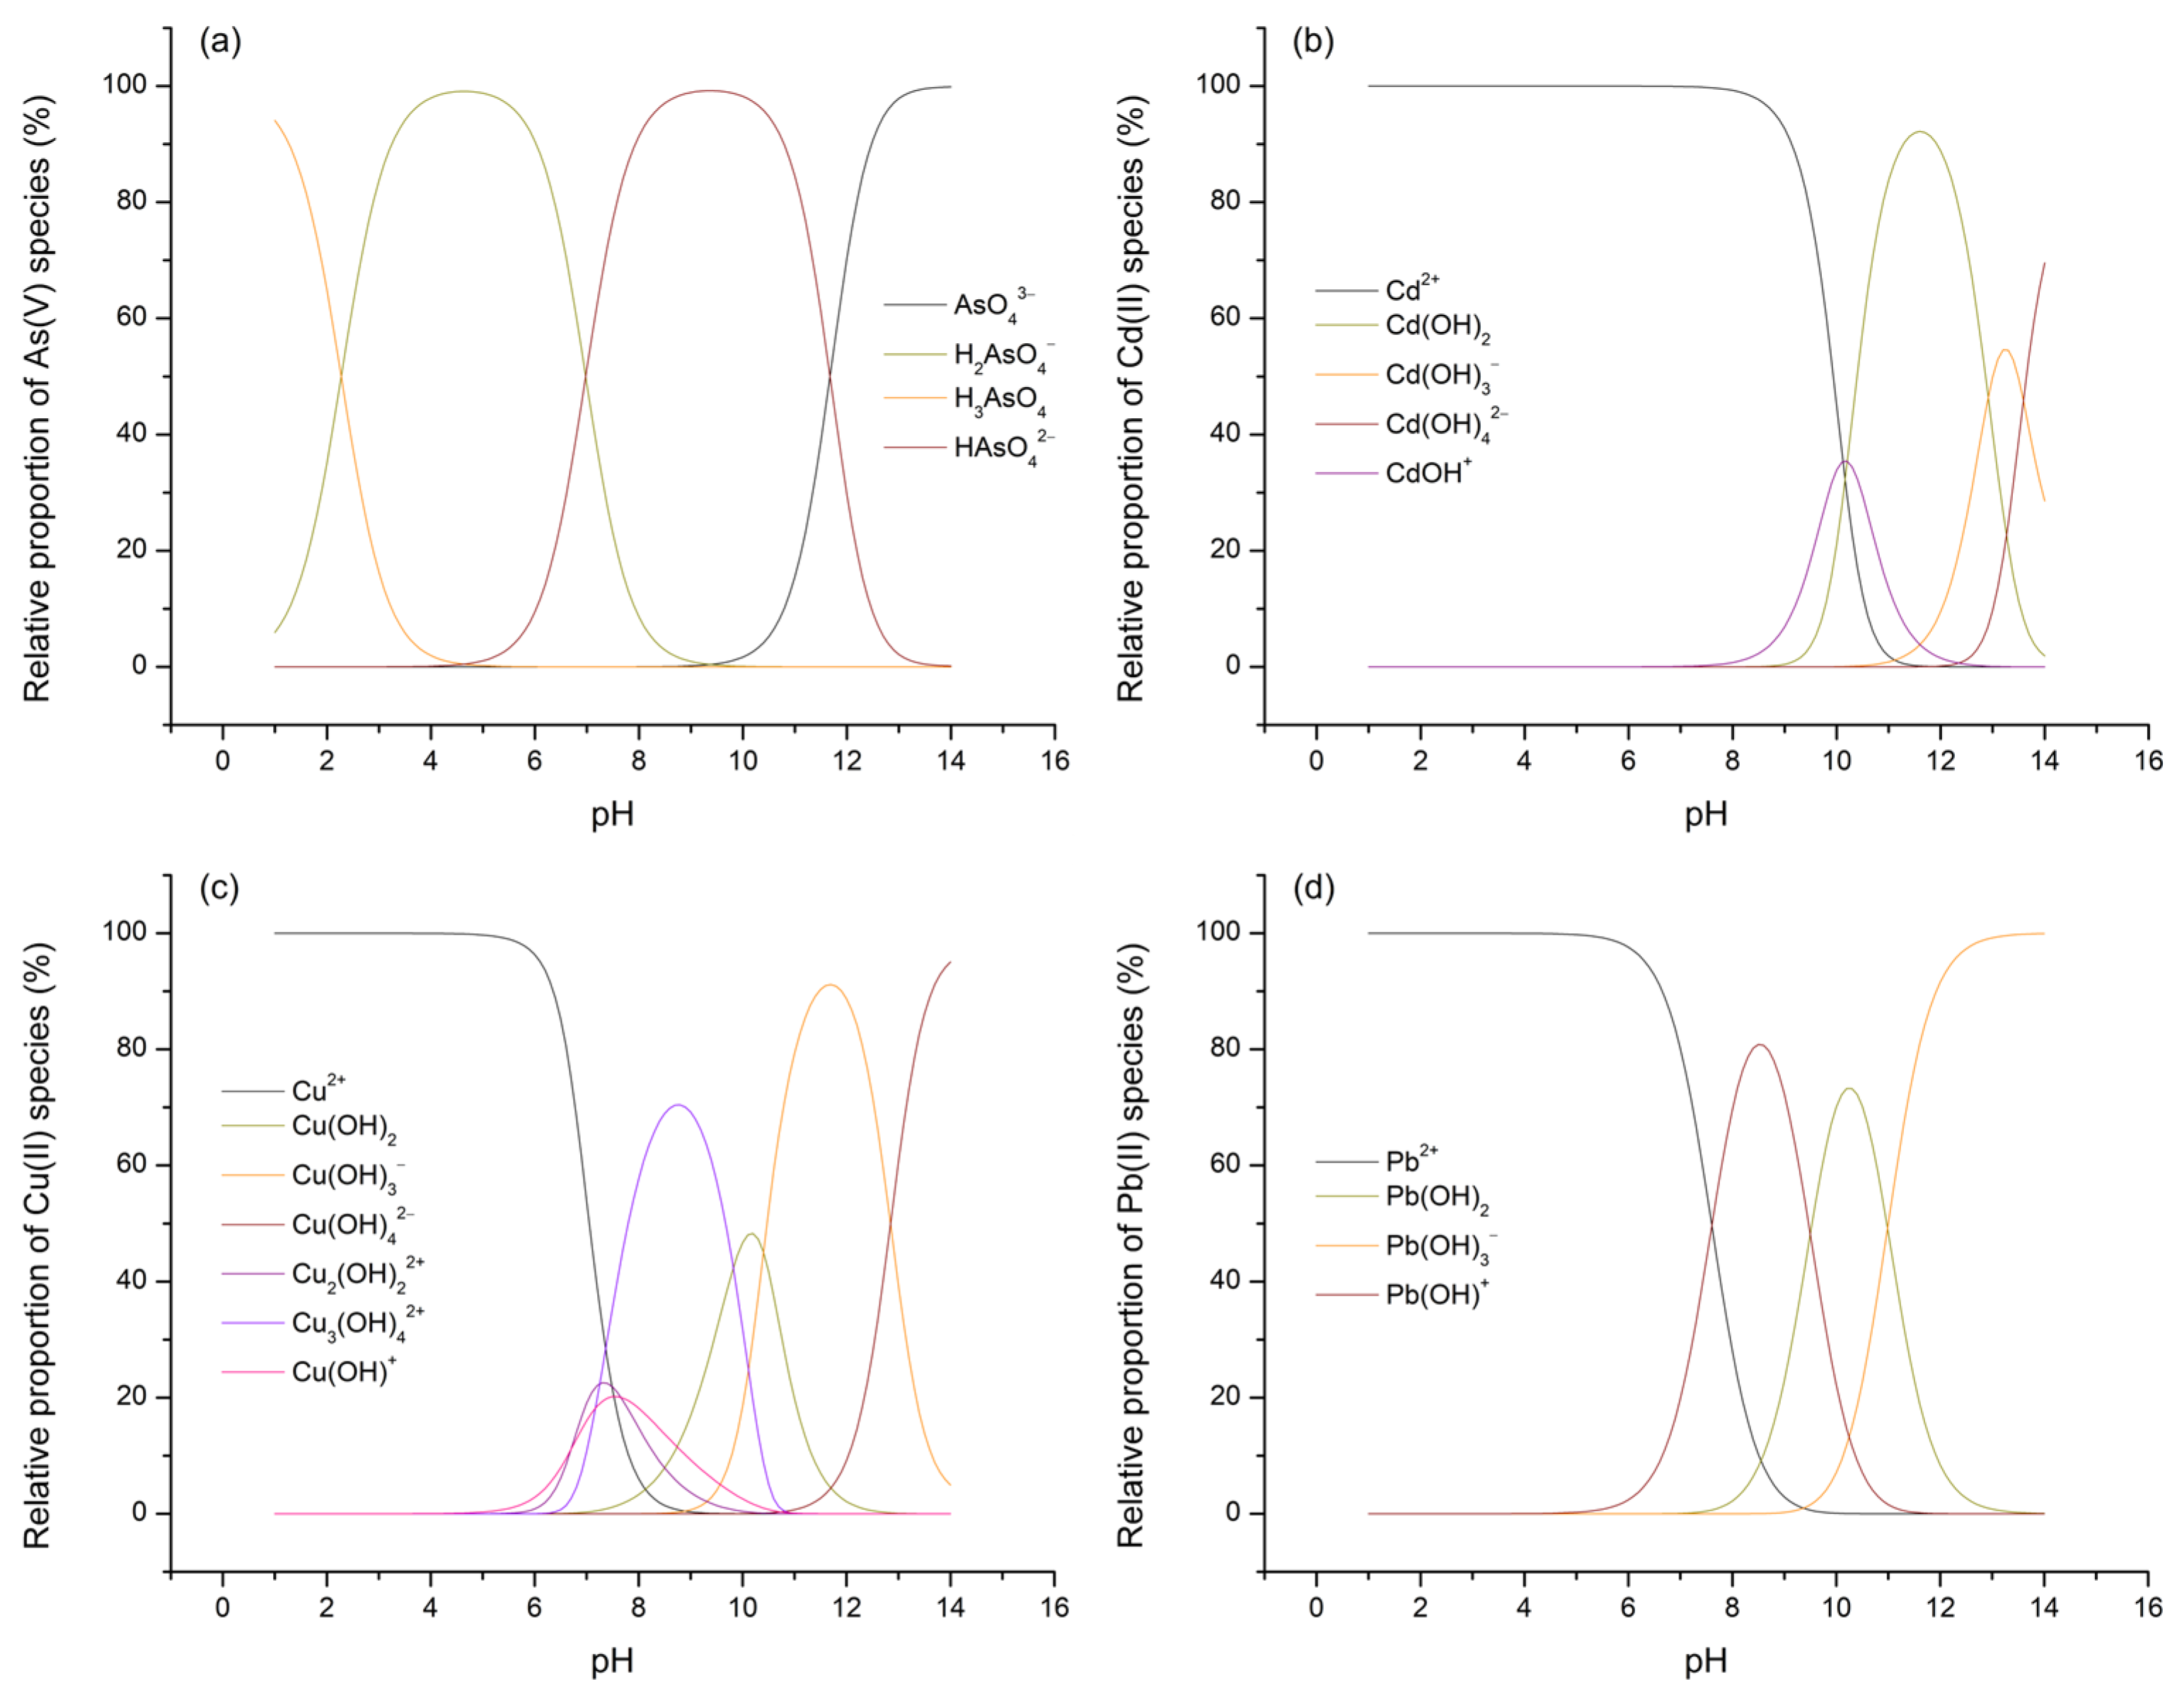
Considering that the potential for and extent of adsorption processes for As(V) and M(II) on TiO2 are influenced not only by the electric state of the surface of the given metal oxide but also by the forms in which the investigated adsorbates are present within the aqueous phase, the concentrations of their species across the entire pH range were calculated using Visual MINTEQ software (version 3.1). The results obtained this way, expressed in terms of percentage distributions, are presented in Figure 11 (species with a relative abundance of less than 5% are not shown or considered for further discussion).
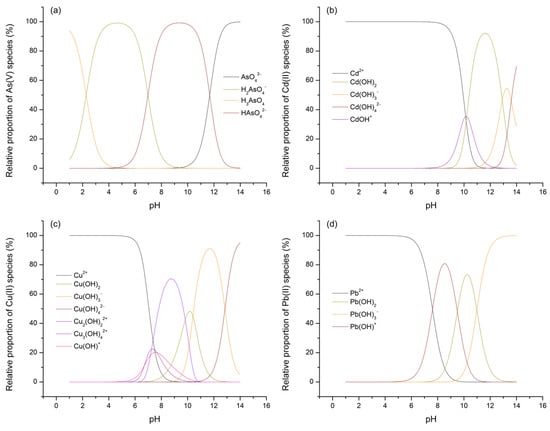
Figure 11.
Relative distributions of As(V) (a), Cd(II) (b), Cu(II) (c), and Pb(II) (d) species as a function of background pH.
By referring to the speciation diagrams, it is observed that, at pH 3, As(V) predominantly exists in the form of the H2AsO4– oxyanion, followed by a significantly smaller fraction of the neutral H3AsO4 acid, while all three M(II) ions predominantly exist as M2+ ([(M(H2O)6]2+). Upon reaching pH 7, As(V) is approximately evenly distributed between the H2AsO4– and HAsO42– oxyanions, while the range and distribution of the M(II) species now vary depending on the specific metal: Cd(II)—Cd2+; Cu(II)—Cu2+ > Cu2(OH)22+ > CuOH+ > Cu3(OH)42+; Pb(II)—Pb2+ > Pb(OH)+.
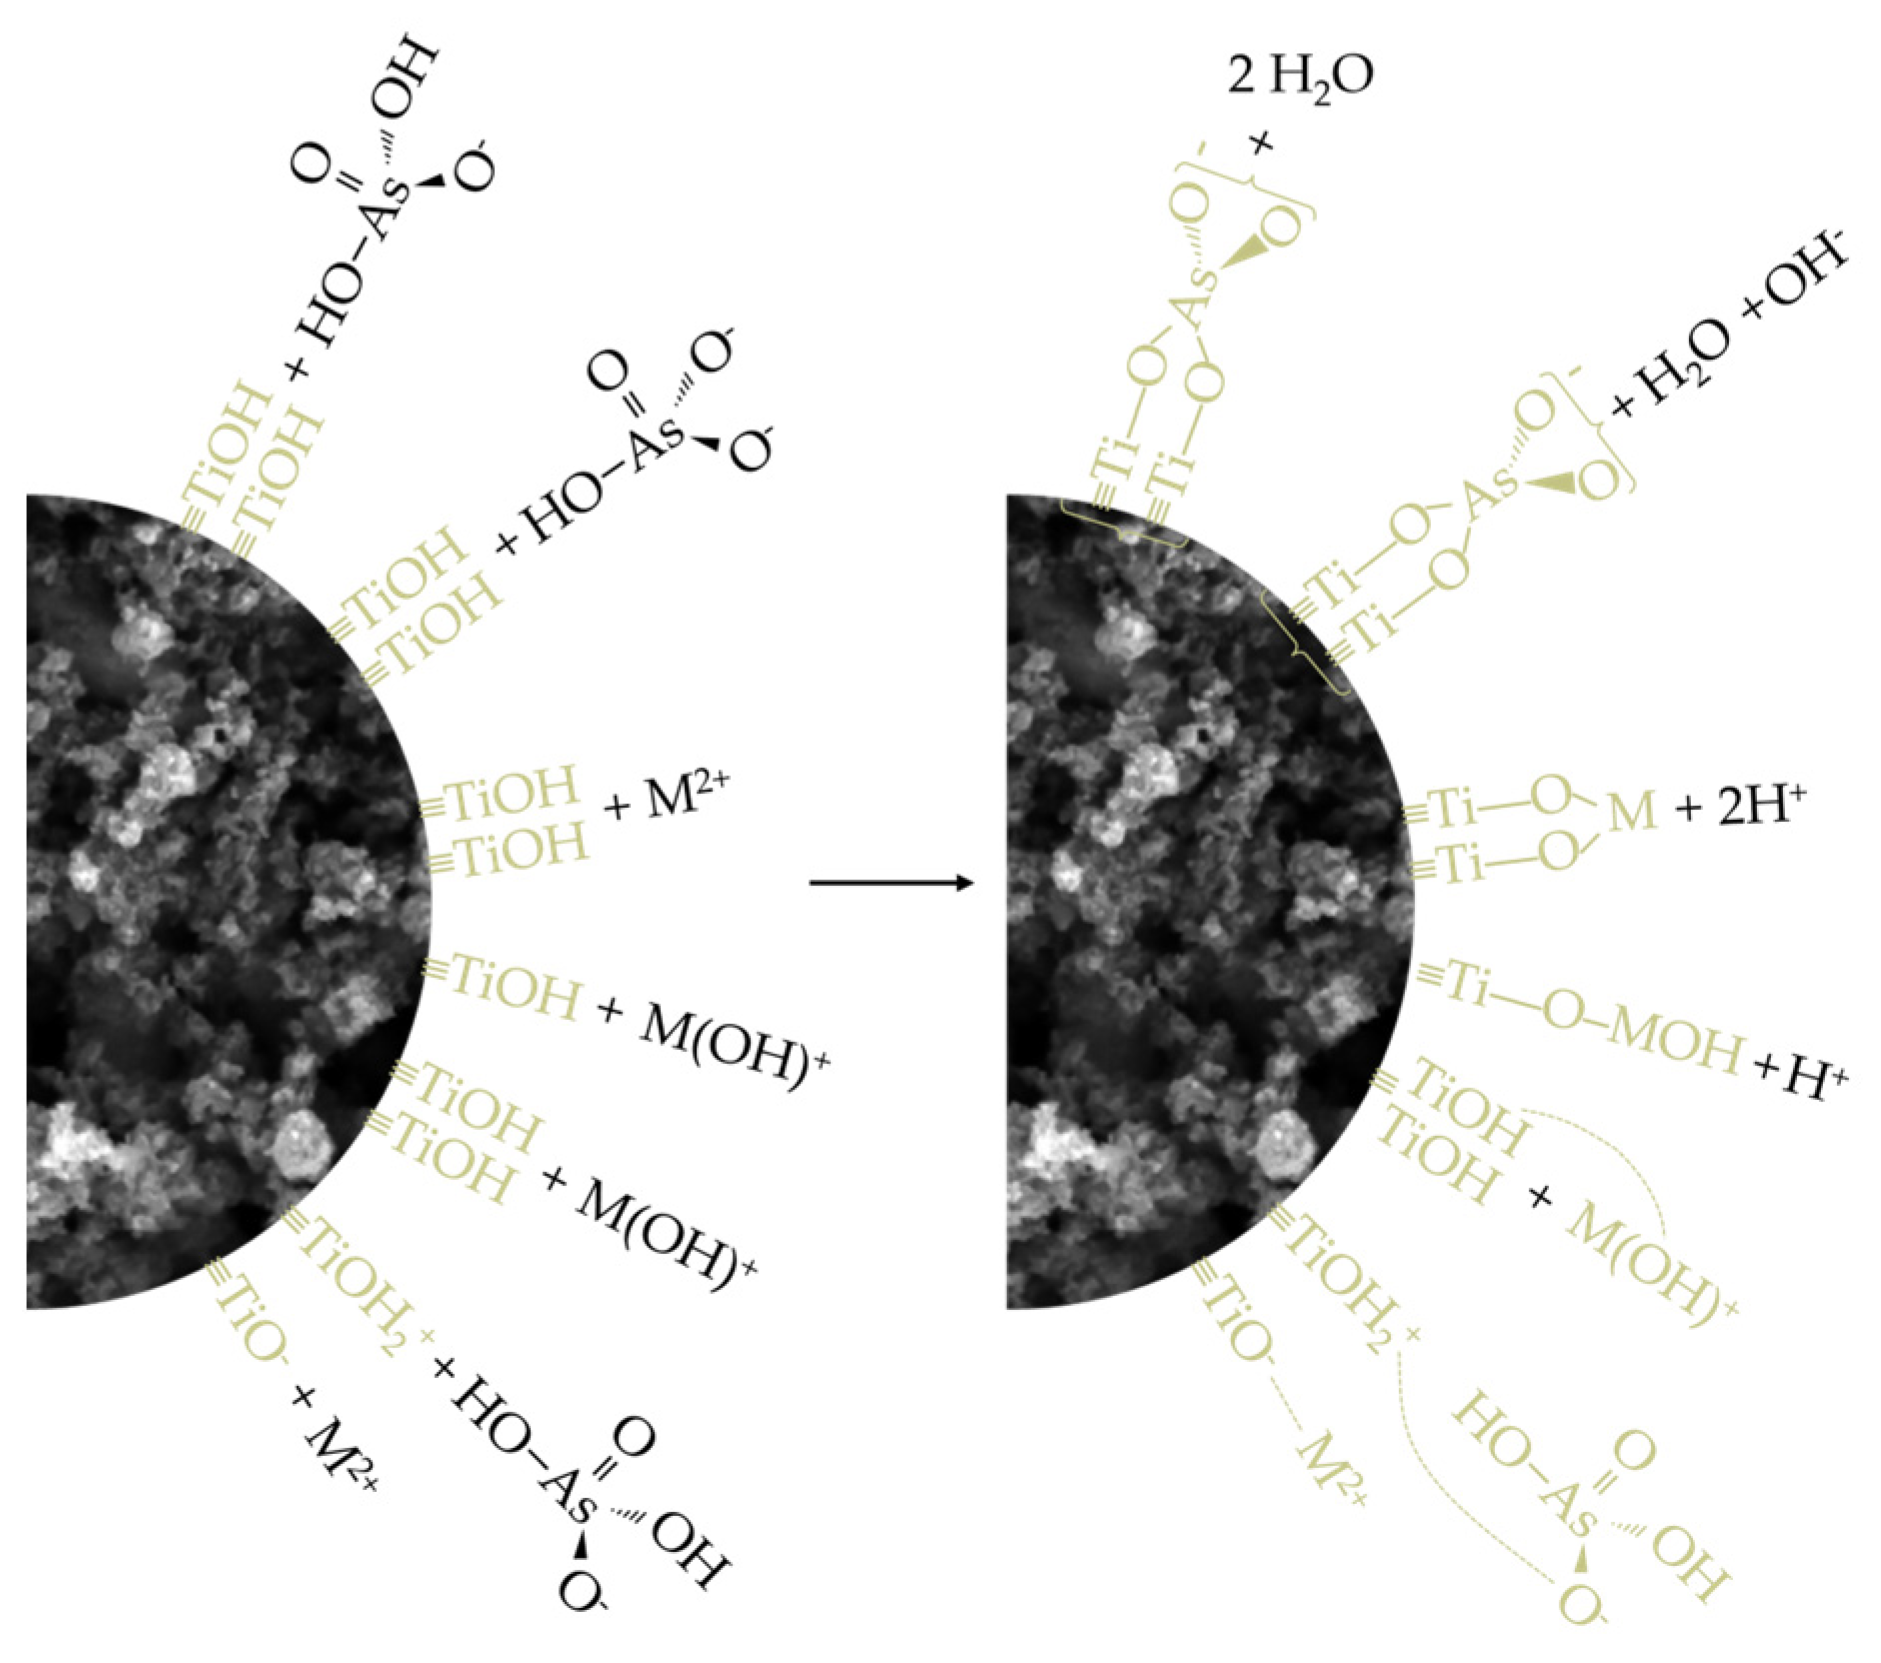
Having thus established a comprehensive understanding of the charge distribution in contact pairs, it is reasonable to expect a higher extent of As(V) adsorption at pH 3 and, conversely, a more pronounced removal of M(II) species at pH 7, particularly under the assumption that electrostatic interactions, i.e., physisorption, predominantly govern the processes of interest. This rationale stems from the fact that, at pH 3, electrostatic compatibility is achieved solely in the TiO2/As(V) system (referring here to electrophilic TiOH2+ surface sites and H2AsO4– ions), whereas in other cases, this compatibility is lost and is further accompanied by unfavorable competition between M2+ ions and the highly mobile and abundant H3O+ ions for the same adsorption sites. On the other hand, at pH 7, due to the formation of certain nucleophilic centers on the TiO2 surface (the precise nature of which is difficult to determine, as the pKa2 of the –OH groups on TiO2 typically ranges between 8 and 9), favorable conditions are established for the removal of various M(II) cationic species, though not for the adsorption of H2AsO4– and HAsO42–, further hindered by the now significant participation of competing OH– ions. Nevertheless, based on the values of the parameters qm and qd, which represent the adsorption capacities of TiO2 for As(V) and M(II), the hypothesis holds true only for Cd(II) and Cu(II), considering that the increase in pH has little or even an unexpected effect on the removal levels of As(V) and Pb(II). Moreover, given that all four adsorbates exhibit substantial removal even under conditions generally considered unfavorable (e.g., at C0 = 1, REe ranges from 57.73 to 95.49%), it is justifiable to argue that the interpreted adsorption mechanisms, in addition to electrostatic interactions, also involve the contribution of other phenomena. It should be noted that, even under broadly unfavorable conditions, certain localized surface sites may retain compatibility with the species being removed, which is evident from the pKa1 values, spanning the range of 2 to 4, that is, both below and above the pHpzc. These additional contributions are understood to include processes such as ligand exchange, ion exchange, and hydrogen bonding. Of these, the first is most likely to occur in systems involving As(V), while the latter two are more prominent when M(II) species serve as adsorbates (some of the potentially relevant reaction pathways for these adsorption mechanisms are illustrated in Equations (5)–(9)). Therefore, it can be concluded that the removal of As(V) and M(II) by TiO2, despite various observations and parameter values suggesting a predominance of either physisorption or chemisorption, is most appropriately characterized as a complex process involving the simultaneous action of both mechanisms (Figure 12), with their mutual contribution being determined by the surrounding environmental conditions [28,70,79,80,81,82].
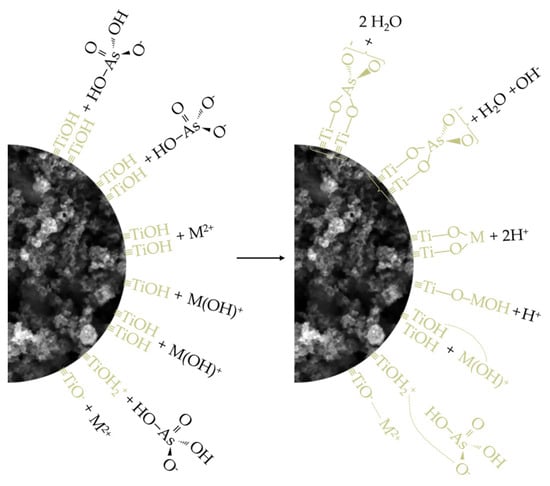
Figure 12.
Schematic illustration of the adsorption mechanisms of As(V) and M(II) on TiO₂.
4. Conclusions
This study systematically investigated the adsorption performance and mechanisms of TiO2 nanoparticles for the removal of As(V), Cd(II), Cu(II), and Pb(II) under environmentally relevant conditions. Comprehensive characterization confirmed that TiO2 is a mesoporous material with a high specific surface area and a mixed-phase crystal structure (anatase/rutile).
Adsorption kinetics were best described by the Elovich model, suggesting that chemisorption and surface heterogeneity significantly influenced the process. Among the isotherm models, Langmuir provided the best overall fit, indicating monolayer adsorption on a homogeneous surface, while Freundlich and Temkin models offered additional insights into surface heterogeneity and interaction energy.
The adsorption behavior of arsenic and metals was strongly pH-dependent: Pb(II) and As(V) showed higher uptake under acidic conditions, whereas Cd(II) and Cu(II) removal improved at neutral pH. These trends reflect a combined adsorption mechanism, with the balance between physisorption and chemisorption governed by environmental conditions.
Principal Component Analysis (PCA) revealed that physicochemical properties, primarily electronegativity, significantly influenced adsorption efficiency, underscoring the utility of multivariate analysis in optimizing adsorption systems.
Overall, TiO2 demonstrated versatile, selective, and pH-responsive adsorption behavior, underscoring its potential as a sustainable material for the removal of arsenic and heavy metals from water. Future research should address current limitations, including challenges in nanoparticle recovery, aggregation in complex water matrices, and the need for cost-effective regeneration or immobilization strategies to ensure long-term application.
Author Contributions
M.Š.: Investigation, conceptualization, formal analysis, writing—original draft preparation, writing—review and editing; J.N.: Investigation, formal analysis, writing—original draft preparation; A.K.M.: Investigation, formal analysis, visualization, writing—original draft preparation; T.A.: Investigation, formal analysis, visualization, writing—original draft preparation; M.W.: Formal analysis; M.K.I.: Formal analysis, visualization; S.M.: Formal analysis, visualization, writing—review and editing. All authors have read and agreed to the published version of the manuscript.
Funding
The authors gratefully acknowledge the financial support of the Ministry of Science, Technological Development and Innovation of the Republic of Serbia (Grant Nos. 451-03-137/2025-03/200125 and 451-03-136/2025-03/200125).
Data Availability Statement
The data presented in this study are available on request from the corresponding author.
Conflicts of Interest
The authors declare no conflicts of interest.
References
- Sevak, P.; Pushkar, B. Arsenic Pollution Cycle, Toxicity and Sustainable Remediation Technologies: A Comprehensive Review and Bibliometric Analysis. J. Environ. Manag. 2024, 349, 119504. [Google Scholar] [CrossRef] [PubMed]
- Singh, V.; Singh, N.; Rai, S.N.; Kumar, A.; Singh, A.K.; Singh, M.P.; Sahoo, A.; Shekhar, S.; Vamanu, E.; Mishra, V. Heavy Metal Contamination in the Aquatic Ecosystem: Toxicity and Its Remediation Using Eco-Friendly Approaches. Toxics 2023, 11, 147. [Google Scholar] [CrossRef]
- Smereczański, N.M.; Brzóska, M.M.; Rogalska, J.; Hutsch, T. The Protective Potential of Aronia melanocarpa L. Berry Extract against Cadmium-Induced Kidney Damage: A Study in an Animal Model of Human Environmental Exposure to This Toxic Element. Int. J. Mol. Sci. 2023, 24, 11647. [Google Scholar] [CrossRef] [PubMed]
- Fulke, A.B.; Ratanpal, S.; Sonker, S. Understanding Heavy Metal Toxicity: Implications on Human Health, Marine Ecosystems and Bioremediation Strategies. Mar. Pollut. Bull. 2024, 206, 116707. [Google Scholar] [CrossRef]
- Kawahara, M.; Tanaka, K.-I.; Kato-Negishi, M. Copper as a Collaborative Partner of Zinc-Induced Neurotoxicity in the Pathogenesis of Vascular Dementia. Int. J. Mol. Sci. 2021, 22, 7242. [Google Scholar] [CrossRef]
- Roychoudhury, S.; Saha, M.R.; Saha, M.M. Environmental Toxicants and Male Reproductive Toxicity: Oxidation-Reduction Potential as a New Marker of Oxidative Stress in Infertile Men. In Environmental Science and Engineering; Springer Berlin Heidelberg: Berlin/Heidelberg, Germany, 2019; pp. 99–115. [Google Scholar] [CrossRef]
- Muzaffar, S.; Khan, J.; Srivastava, R.; Gorbatyuk, M.S.; Athar, M. Mechanistic Understanding of the Toxic Effects of Arsenic and Warfare Arsenicals on Human Health and Environment. Cell Biol. Toxicol. 2023, 39, 85–110. [Google Scholar] [CrossRef]
- Jaishankar, M.; Tseten, T.; Anbalagan, N.; Mathew, B.B.; Beeregowda, K.N. Toxicity, Mechanism and Health Effects of Some Heavy Metals. Interdiscip. Toxicol. 2014, 7, 60–72. [Google Scholar] [CrossRef] [PubMed]
- Santhosh Kumar, R.; Asha Devi, S. Lead Toxicity on Male Reproductive System and Its Mechanism: A Review. Res. J. Pharm. Technol. 2018, 11, 1228–1232. [Google Scholar] [CrossRef]
- Zhang, H.; Yan, J.; Xie, Y.; Chang, X.; Li, J.; Ren, C.; Zhu, J.; Ren, L.; Qi, K.; Bai, Z.; et al. Dual Role of Cadmium in Rat Liver: Inducing Liver Injury and Inhibiting the Progression of Early Liver Cancer. Toxicol. Lett. 2022, 355, 62–81. [Google Scholar] [CrossRef]
- World Health Organization. Fourth Edition Incorporating the First and Second Addenda Guidelines for Drinking-Water Quality; World Health Organization: Geneva, Switzerland, 2022. [Google Scholar]
- European Commission. European Commission Implementing Decision (EU) 2016/1032 of 13 June 2016 Establishing Best Available Techniques (BAT) Conclusions, Under Directive 2010/75/EU of the European Parliament and of the Council, for the Non-Ferrous Metals Industries. Available online: http://www.legislation.gov.uk/eudn/2016/1032 (accessed on 2 March 2025).
- Saleh, T.A.; Mustaqeem, M.; Khaled, M. Water Treatment Technologies in Removing Heavy Metal Ions from Wastewater: A Review. Environ. Nanotechnol. Monit. Manag. 2022, 17, 100617. [Google Scholar] [CrossRef]
- Rahidul Hassan, H. A Review on Different Arsenic Removal Techniques Used for Decontamination of Drinking Water. Environ. Pollut. Bioavailab. 2023, 35, 2165964. [Google Scholar] [CrossRef]
- Gahrouei, A.E.; Rezapour, A.; Pirooz, M.; Pourebrahimi, S. From Classic to Cutting-Edge Solutions: A Comprehensive Review of Materials and Methods for Heavy Metal Removal from Water Environments. Desalination Water Treat. 2024, 319, 100446. [Google Scholar] [CrossRef]
- Raji, Z.; Karim, A.; Karam, A.; Khalloufi, S. Adsorption of Heavy Metals: Mechanisms, Kinetics, and Applications of Various Adsorbents in Wastewater Remediation—A Review. Waste 2023, 1, 775–805. [Google Scholar] [CrossRef]
- Zaimee, M.Z.A.; Sarjadi, M.S.; Rahman, M.L. Heavy Metals Removal from Water by Efficient Adsorbents. Water 2021, 13, 2659. [Google Scholar] [CrossRef]
- Kumar, R.; Rauwel, P.; Rauwel, E. Nanoadsorbants for the Removal of Heavy Metals from Contaminated Water: Current Scenario and Future Directions. Processes 2021, 9, 1379. [Google Scholar] [CrossRef]
- Janani, R.; Gurunathan, B.; K, S.; Varjani, S.; Ngo, H.H.; Gnansounou, E. Advancements in Heavy Metals Removal from Effluents Employing Nano-Adsorbents: Way towards Cleaner Production. Environ. Res. 2022, 203, 111815. [Google Scholar] [CrossRef]
- Rajendran, S.; Priya, A.K.; Senthil Kumar, P.; Hoang, T.K.A.; Sekar, K.; Chong, K.Y.; Khoo, K.S.; Ng, H.S.; Show, P.L. A Critical and Recent Developments on Adsorption Technique for Removal of Heavy Metals from Wastewater—A Review. Chemosphere 2022, 303, 135146. [Google Scholar] [CrossRef]
- Dharmapriya, T.N.; Li, D.Y.; Chung, Y.C.; Huang, P.J. Green Synthesis of Reusable Adsorbents for the Removal of Heavy Metal Ions. ACS Omega 2021, 6, 30478–30487. [Google Scholar] [CrossRef] [PubMed]
- Fouda-Mbanga, B.G.; Velempini, T.; Pillay, K.; Tywabi-Ngeva, Z. Heavy Metals Removals from Wastewater and Reuse of the Metal Loaded Adsorbents in Various Applications: A Review. Hybrid Adv. 2024, 6, 100193. [Google Scholar] [CrossRef]
- Karthik, V.; Periyasamy, S.; Dharneesh, S.; Duvakeesh, G.K.; Gizaw, D.G.; Vijayashankar, T. Biochar as a Sustainable Adsorbent for Heavy Metal Removal From Polluted Waters: A Comprehensive Outlook. J. Chem. 2024, 2024, 8217730. [Google Scholar] [CrossRef]
- Acharya, R.; Parida, K. A Review on Adsorptive Remediation of Cr (Vi) by Magnetic Iron Oxides and Their Modified Forms. Biointerface Res. Appl. Chem. 2020, 10, 5266–5272. [Google Scholar] [CrossRef]
- Acharya, R.; Lenka, A.; Parida, K. Magnetite Modified Amino Group Based Polymer Nanocomposites towards Efficient Adsorptive Detoxification of Aqueous Cr (VI): A Review. J. Mol. Liq. 2021, 337, 116487. [Google Scholar] [CrossRef]
- Acharya, R.; Sillanpää, M.; Al-Farraj, S. A Comprehensive Review on Sequestration of Aqueous Cr (VI) over Graphene Based Adsorbents. J. Hazard. Mater. Adv. 2025, 18, 100670. [Google Scholar] [CrossRef]
- Olawade, D.B.; Wada, O.Z.; Egbewole, B.I.; Fapohunda, O.; Ige, A.O.; Usman, S.O.; Ajisafe, O. Metal and Metal Oxide Nanomaterials for Heavy Metal Remediation: Novel Approaches for Selective, Regenerative, and Scalable Water Treatment. Front. Nanotechnol. 2024, 6, 1466721. [Google Scholar] [CrossRef]
- Guan, X.; Du, J.; Meng, X.; Sun, Y.; Sun, B.; Hu, Q. Application of Titanium Dioxide in Arsenic Removal from Water: A Review. J. Hazard. Mater. 2012, 215, 1–16. [Google Scholar] [CrossRef]
- Irshad, M.A.; Shakoor, M.B.; Ali, S.; Nawaz, R.; Rizwan, M. Synthesis and Application of Titanium Dioxide Nanoparticles for Removal of Cadmium from Wastewater: Kinetic and Equilibrium Study. Water Air Soil Pollut. 2019, 230, 278. [Google Scholar] [CrossRef]
- Ezati, F.; Sepehr, E.; Ahmadi, F. The Efficiency of Nano-TiO2 and γ-Al2O3 in Copper Removal from Aqueous Solution by Characterization and Adsorption Study. Sci. Rep. 2021, 11, 18831. [Google Scholar] [CrossRef]
- Chen, B.; Li, L.; Liu, L.; Cao, J. Molecular Simulation of Adsorption Properties of Thiol-Functionalized Titanium Dioxide (TiO2) Nanostructure for Heavy Metal Ions Removal from Aqueous Solution. J. Mol. Liq. 2022, 346, 118281. [Google Scholar] [CrossRef]
- Ajala, M.A.; Abdulkareem, A.S.; Tijani, J.O.; Kovo, A.S. Adsorptive Behaviour of Rutile Phased Titania Nanoparticles Supported on Acid-Modified Kaolinite Clay for the Removal of Selected Heavy Metal Ions from Mining Wastewater. Appl. Water Sci. 2022, 12, 19. [Google Scholar] [CrossRef]
- Neisan, R.S.; Saady, N.M.C.; Bazan, C.; Zendehboudi, S.; Albayati, T.M. Adsorption of Copper from Water Using TiO2-Modified Activated Carbon Derived from Orange Peels and Date Seeds: Response Surface Methodology Optimization. Heliyon 2023, 9, e21420. [Google Scholar] [CrossRef]
- Rafiq, K.; Asghar, S.; Abid, M.Z.; Sultana, M.; Waleed, M.Z.; Hashem, A.; Avila-Quezada, G.D.; Abd_Allah, E.F.; Hussain, E. Unveiling the Potential of Fe2O3/TiO2 System to Produce Clean Water: An Effective and Low-cost Approach for Arsenic Removal from Ground Water. Surf. Interfaces 2024, 52, 104913. [Google Scholar] [CrossRef]
- Nazari, A.; Nakhaei, M.; Yari, A.R. Arsenic Adsorption by TiO2 Nanoparticles Under Conditions Similar to Groundwater: Batch and Column Studies. Int. J. Environ. Res. 2021, 15, 79–91. [Google Scholar] [CrossRef]
- Poursani, A.S.; Nilchi, A.; Hassani, A.; Shariat, S.M.; Nouri, J. The Synthesis of Nano TiO2 and Its Use for Removal of Lead Ions from Aqueous Solution. J. Water Resour. Prot. 2016, 8, 438–448. [Google Scholar] [CrossRef]
- Wang, N.; Wang, B.; Zhang, X. TiO2-Loaded Phosphogypsum-Modified Biochar for the Removal of Ofloxacin and Cu2+: Performance, Mechanisms, and Toxicity Assessment. Chem. Eng. J. 2024, 498, 155441. [Google Scholar] [CrossRef]
- Siddeeg, S.M. A Novel Synthesis of TiO2/GO Nanocomposite for the Uptake of Pb2+ and Cd2+ from Wastewater. Mater. Res. Express 2020, 7, 025038. [Google Scholar] [CrossRef]
- Wang, C.; Zhan, Y.; Wu, Y.; Shi, X.; Du, Y.; Luo, Y.; Deng, H. TiO2/Rectorite-Trapped Cellulose Composite Nanofibrous Mats for Multiple Heavy Metal Adsorption. Int. J. Biol. Macromol. 2021, 183, 245–253. [Google Scholar] [CrossRef]
- Tian, Y.; Gao, B.; Wang, Y.; Morales, V.L.; Carpena, R.M.; Huang, Q.; Yang, L. Deposition and Transport of Functionalized Carbon Nanotubes in Water-Saturated Sand Columns. J. Hazard. Mater. 2012, 213, 265–272. [Google Scholar] [CrossRef]
- U.S. Environmental Protection Agency. Method 6020B Update V Final 11-07-14.Docx; U.S. Environmental Protection Agency: Washington, DC, USA, 2014. [Google Scholar]
- Wang, J.; Guo, X. Adsorption Kinetic Models: Physical Meanings, Applications, and Solving Methods. J. Hazard. Mater. 2020, 390, 122156. [Google Scholar] [CrossRef]
- Largitte, L.; Pasquier, R. A Review of the Kinetics Adsorption Models and Their Application to the Adsorption of Lead by an Activated Carbon. Chem. Eng. Res. Des. 2016, 109, 495–504. [Google Scholar] [CrossRef]
- Tan, K.L.; Hameed, B.H. Insight into the Adsorption Kinetics Models for the Removal of Contaminants from Aqueous Solutions. J. Taiwan Inst. Chem. Eng. 2017, 74, 25–48. [Google Scholar] [CrossRef]
- Plazinski, W.; Rudzinski, W.; Plazinska, A. Theoretical Models of Sorption Kinetics Including a Surface Reaction Mechanism: A Review. Adv. Colloid. Interface Sci. 2009, 152, 2–13. [Google Scholar] [CrossRef] [PubMed]
- Al-Ghouti, M.A.; Da’ana, D.A. Guidelines for the Use and Interpretation of Adsorption Isotherm Models: A Review. J. Hazard. Mater. 2020, 393, 122383. [Google Scholar] [CrossRef]
- Foo, K.Y.; Hameed, B.H. Insights into the Modeling of Adsorption Isotherm Systems. Chem. Eng. J. 2010, 156, 2–10. [Google Scholar] [CrossRef]
- Ayawei, N.; Ebelegi, A.N.; Wankasi, D. Modelling and Interpretation of Adsorption Isotherms. J. Chem. 2017, 2017, 3039817. [Google Scholar] [CrossRef]
- Rangabhashiyam, S.; Anu, N.; Giri Nandagopal, M.S.; Selvaraju, N. Relevance of Isotherm Models in Biosorption of Pollutants by Agricultural Byproducts. J. Environ. Chem. Eng. 2014, 2, 398–414. [Google Scholar] [CrossRef]
- Chobchun, M.; Jutakridsada, P.; Thiamsinsangwon, P.; Kasemsiri, P.; Kamwilaisak, K.; Chindaprasirt, P. Characterization of TiO2-Activated Carbon onto Adsorption and Photocatalytic Properties and Its Application. J. Met. Mater. Miner. 2020, 30, 30–38. [Google Scholar] [CrossRef]
- Abdelouahab Reddam, H.; Elmail, R.; Lloria, S.C.; Monrós Tomás, G.; Reddam, Z.A.; Coloma-Pascual, F. Synthesis of Fe, Mn and Cu Modified TiO2 photocatalysts for Photodegradation of Orange II. Bol. Soc. Esp. Ceram. Vidr. 2020, 59, 138–148. [Google Scholar] [CrossRef]
- Nimmy, A.V.; Anandakumar, V.M.; Biju, V. Enhancing the Visible-Light Sensitive Photocatalysis of Anatase TiO2 through Surface-Modification. Discov. Mater. 2025, 5, 45. [Google Scholar] [CrossRef]
- Thommes, M.; Kaneko, K.; Neimark, A.V.; Olivier, J.P.; Rodriguez-Reinoso, F.; Rouquerol, J.; Sing, K.S.W. Physisorption of Gases, with Special Reference to the Evaluation of Surface Area and Pore Size Distribution (IUPAC Technical Report). Pure Appl. Chem. 2015, 87, 1051–1069. [Google Scholar] [CrossRef]
- Khoa Le, T.; Flahaut, D.; Martinez, H.; Hung Nguyen, H.K.; Xuan Huynh, T.K. Study of the Effects of Surface Modification by Thermal Shock Method on Photocatalytic Activity of TiO2 P25. Appl. Catal. B 2015, 165, 260–268. [Google Scholar] [CrossRef]
- Natarajan, T.S.; Gopi, P.K.; Natarajan, K.; Bajaj, H.C.; Tayade, R.J. TiO2/Graphene Oxide Nanocomposite with Enhanced Photocatalytic Capacity for Degradation of 2,4-Dichlorophenoxyacetic Acid Herbicide. Water-Energy Nexus 2021, 4, 103–112. [Google Scholar] [CrossRef]
- Pucar Milidrag, G.; Nikić, J.; Gvoić, V.; Kulić Mandić, A.; Agbaba, J.; Bečelić-Tomin, M.; Kerkez, D. Photocatalytic Degradation of Magenta Effluent Using Magnetite Doped TiO2 in Solar Parabolic Trough Concentrator. Catalysts 2022, 12, 986. [Google Scholar] [CrossRef]
- Mubarak, N.S.A.; Sabar, S.; Jawad, A.H. The Study of Commercial Titanium Dioxide (TiO2) Degussa P25 for the Adsorption of Acidic Dye. Sci. Lett. 2020, 14, 68–83. [Google Scholar] [CrossRef]
- Irshad, M.A.; Nawaz, R.; ur Rehman, M.Z.; Adrees, M.; Rizwan, M.; Ali, S.; Ahmad, S.; Tasleem, S. Synthesis, Characterization and Advanced Sustainable Applications of Titanium Dioxide Nanoparticles: A Review. Ecotoxicol. Environ. Saf. 2021, 212, 111978. [Google Scholar] [CrossRef]
- Rajashekhar, K.E.; Devi, L.G. Polymorphic Phase Transformation of Degussa P25 TiO2 by the Chelation of Diaminopyridine on TiO62− Octahedron: Correlation of Anatase to Rutile Phase Ratio on the Photocatalytic Activity. J. Mol. Catal. A Chem. 2013, 374, 12–21. [Google Scholar] [CrossRef]
- Revellame, E.D.; Fortela, D.L.; Sharp, W.; Hernandez, R.; Zappi, M.E. Adsorption Kinetic Modeling Using Pseudo-First Order and Pseudo-Second Order Rate Laws: A Review. Clean. Eng. Technol. 2020, 1, 100032. [Google Scholar] [CrossRef]
- Simonin, J.P. On the Comparison of Pseudo-First Order and Pseudo-Second Order Rate Laws in the Modeling of Adsorption Kinetics. Chem. Eng. J. 2016, 300, 254–263. [Google Scholar] [CrossRef]
- Mahdavi, S.; Jalali, M.; Afkhami, A. Heavy Metals Removal from Aqueous Solutions Using TiO2, MgO, and Al2O3 Nanoparticles. Chem. Eng. Commun. 2013, 200, 448–470. [Google Scholar] [CrossRef]
- Engates, K.E.; Shipley, H.J. Adsorption of Pb, Cd, Cu, Zn, and Ni to Titanium Dioxide Nanoparticles: Effect of Particle Size, Solid Concentration, and Exhaustion. Environ. Sci. Pollut. Res. 2011, 18, 386–395. [Google Scholar] [CrossRef]
- Shirzadeh, M.; Sepehr, E.; Rasouli Sadaghiani, M.H.; Ahmadi, F. Effect of pH, Initial Concentration, Background Electrolyte, and Ionic Strength on Cadmium Adsorption by TiO2 and γ-Al2O3 Nanoparticles. Pollution 2020, 6, 223–235. [Google Scholar] [CrossRef]
- Chen, X.; Hossain, M.F.; Duan, C.; Lu, J.; Tsang, Y.F.; Islam, M.S.; Zhou, Y. Isotherm Models for Adsorption of Heavy Metals from Water—A Review. Chemosphere 2022, 307, 135545. [Google Scholar] [CrossRef] [PubMed]
- Dutta, P.K.; Ray, A.K.; Sharma, V.K.; Millero, F.J. Adsorption of Arsenate and Arsenite on Titanium Dioxide Suspensions. J. Colloid. Interface Sci. 2004, 278, 270–275. [Google Scholar] [CrossRef]
- Ade, I.A.; Tran, H.N.; Zhang, J.W.; Wang, Y.C.; Dat, N.D.; Nguyen, D.T.; Chao, H.P. Adsorption Characteristics of Lead, Copper, Cadmium, Methylene Blue, Phenol, and Toluene in Water Using Composite Synthesized from Titanium Dioxides and Carbon Spheres through Hydrothermal Method. J. Water Process Eng. 2022, 50, 103221. [Google Scholar] [CrossRef]
- Chen, B.; Li, L.; Liu, L.; Cao, J. Effective Adsorption of Heavy Metal Ions in Water by Sulfhydryl Modified Nano Titanium Dioxide. Front. Chem. 2023, 10, 1072139. [Google Scholar] [CrossRef] [PubMed]
- Gebru, K.A.; Das, C. Removal of Pb (II) and Cu (II) Ions from Wastewater Using Composite Electrospun Cellulose Acetate/Titanium Oxide (TiO2) Adsorbent. J. Water Process Eng. 2017, 16, 1–13. [Google Scholar] [CrossRef]
- Mostafa, N.G.; Yunnus, A.F.; Elawwad, A. Adsorption of Pb(II) from Water onto ZnO, TiO2, and Al2O3: Process Study, Adsorption Behaviour, and Thermodynamics. Adsorpt. Sci. Technol. 2022, 2022, 7582756. [Google Scholar] [CrossRef]
- Xiong, L.; Chen, C.; Chen, Q.; Ni, J. Adsorption of Pb(II) and Cd(II) from Aqueous Solutions Using Titanate Nanotubes Prepared via Hydrothermal Method. J. Hazard. Mater. 2011, 189, 741–748. [Google Scholar] [CrossRef]
- Wang, J.; Guo, X. Adsorption Kinetics and Isotherm Models of Heavy Metals by Various Adsorbents: An Overview. Crit. Rev. Environ. Sci. Technol. 2023, 53, 1837–1865. [Google Scholar] [CrossRef]
- Moore, J.; Zhou, J. Etienne Garand LibreTexts Chemistry Interactive Chemistry. Available online: https://chem.libretexts.org/Bookshelves/General_Chemistry/Interactive_Chemistry_(Moore_Zhou_and_Garand)/06%3A_Appendix (accessed on 20 March 2025).
- National Center for Biotechnology Information PubChem Periodic Table of Elements. Available online: https://pubchem.ncbi.nlm.nih.gov/periodic-table/ (accessed on 20 March 2025).
- Mark, J. Winter WebElements. Available online: https://winter.group.shef.ac.uk/webelements/ (accessed on 20 March 2025).
- Klačić, T.; Katić, J.; Namjesnik, D.; Jukić, J.; Kovačević, D.; Begović, T. Adsorption of Polyions on Flat TiO2 Surface. Minerals 2021, 11, 1164. [Google Scholar] [CrossRef]
- Bischoff, M.; Kim, N.Y.; Joo, J.B.; Marchioro, A. Water Orientation at the Anatase TiO2 Nanoparticle Interface: A Probe of Surface p KaValues. J. Phys. Chem. Lett. 2022, 13, 8677–8683. [Google Scholar] [CrossRef]
- Vlasova, N.N.; Markitan, O.V. Surface Complexation Modeling of Biomolecule Adsorptions onto Titania. Colloids Interfaces 2019, 3, 28. [Google Scholar] [CrossRef]
- Vasquez-Caballero, M.A.; Canchanya-Huaman, Y.; Mayta-Armas, A.F.; Pomalaya-Velasco, J.; Checca-Huaman, N.R.; Bendezú-Roca, Y.; Ramos-Guivar, J.A. Pb(II) Uptake from Polluted Irrigation Water Using Anatase TiO2 Nanoadsorbent. Molecules 2023, 28, 4596. [Google Scholar] [CrossRef] [PubMed]
- Herrera-Barros, A.; Bitar-Castro, N.; Villabona-Ortíz, Á.; Tejada-Tovar, C.; González-Delgado, Á.D. Nickel Adsorption from Aqueous Solution Using Lemon Peel Biomass Chemically Modified with TiO2 Nanoparticles. Sustain. Chem. Pharm. 2020, 17, 100299. [Google Scholar] [CrossRef]
- Bourikas, K.; Kordulis, C.; Lycourghiotis, A. Titanium Dioxide (Anatase and Rutile): Surface Chemistry, Liquid-Solid Interface Chemistry, and Scientific Synthesis of Supported Catalysts. Chem. Rev. 2014, 114, 9754–9823. [Google Scholar] [CrossRef]
- Lee, S.H.; Jang, Y.H.; Nguyen, D.D.; Chang, S.W.; Kim, S.C.; Lee, S.M.; Kim, S.S. Adsorption Properties of Arsenic on Sulfated TiO2 Adsorbents. J. Ind. Eng. Chem. 2019, 80, 444–449. [Google Scholar] [CrossRef]

Disclaimer/Publisher’s Note: The statements, opinions and data contained in all publications are solely those of the individual author(s) and contributor(s) and not of MDPI and/or the editor(s). MDPI and/or the editor(s) disclaim responsibility for any injury to people or property resulting from any ideas, methods, instructions or products referred to in the content. |
© 2025 by the authors. Licensee MDPI, Basel, Switzerland. This article is an open access article distributed under the terms and conditions of the Creative Commons Attribution (CC BY) license (https://creativecommons.org/licenses/by/4.0/).