


Influence of Hydrophilic Groups of Surfactants on Their Adsorption States and Wetting Effect on Coal Dust


Abstract

1. Introduction
2. Materials and Methods
2.1. Materials
2.2. Preparation of Surfactant Solution
2.3. Surface Tension Measurement
2.4. Wetting Time Measurement
2.5. Infrared Spectrum Measurement
2.6. Wetting Heat Measurement
3. Results and Discussion
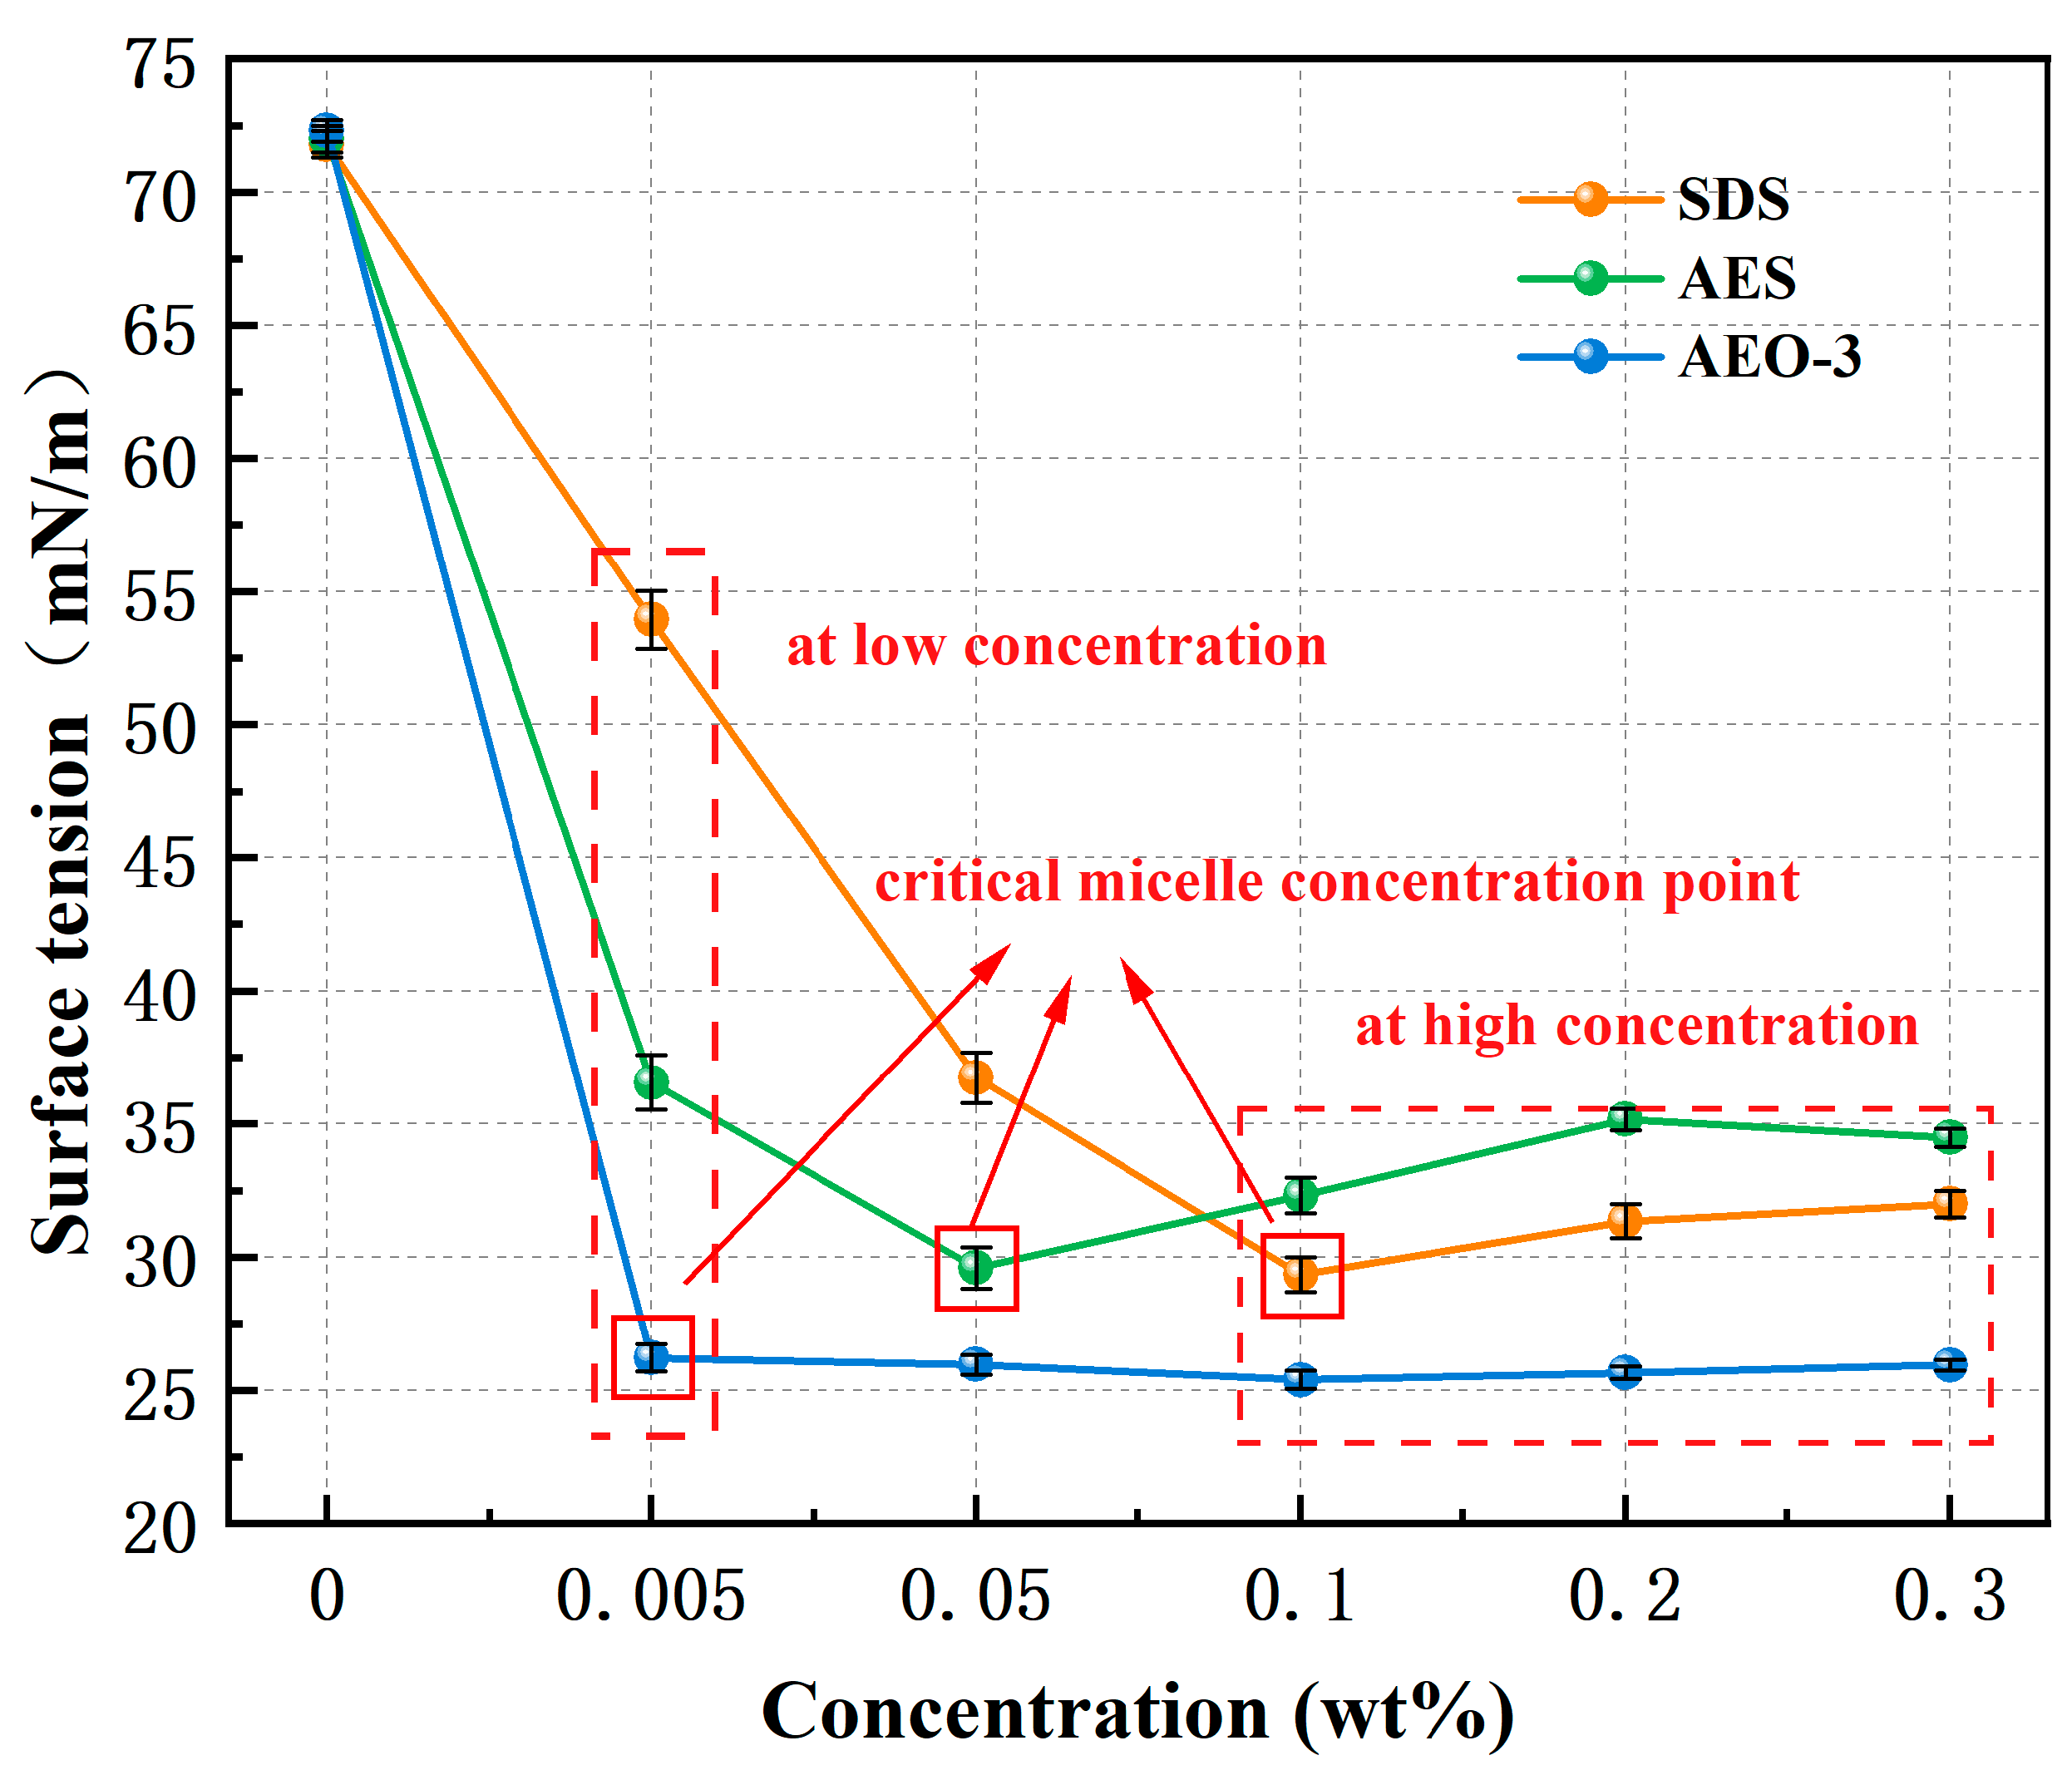
3.1. Surface Tension
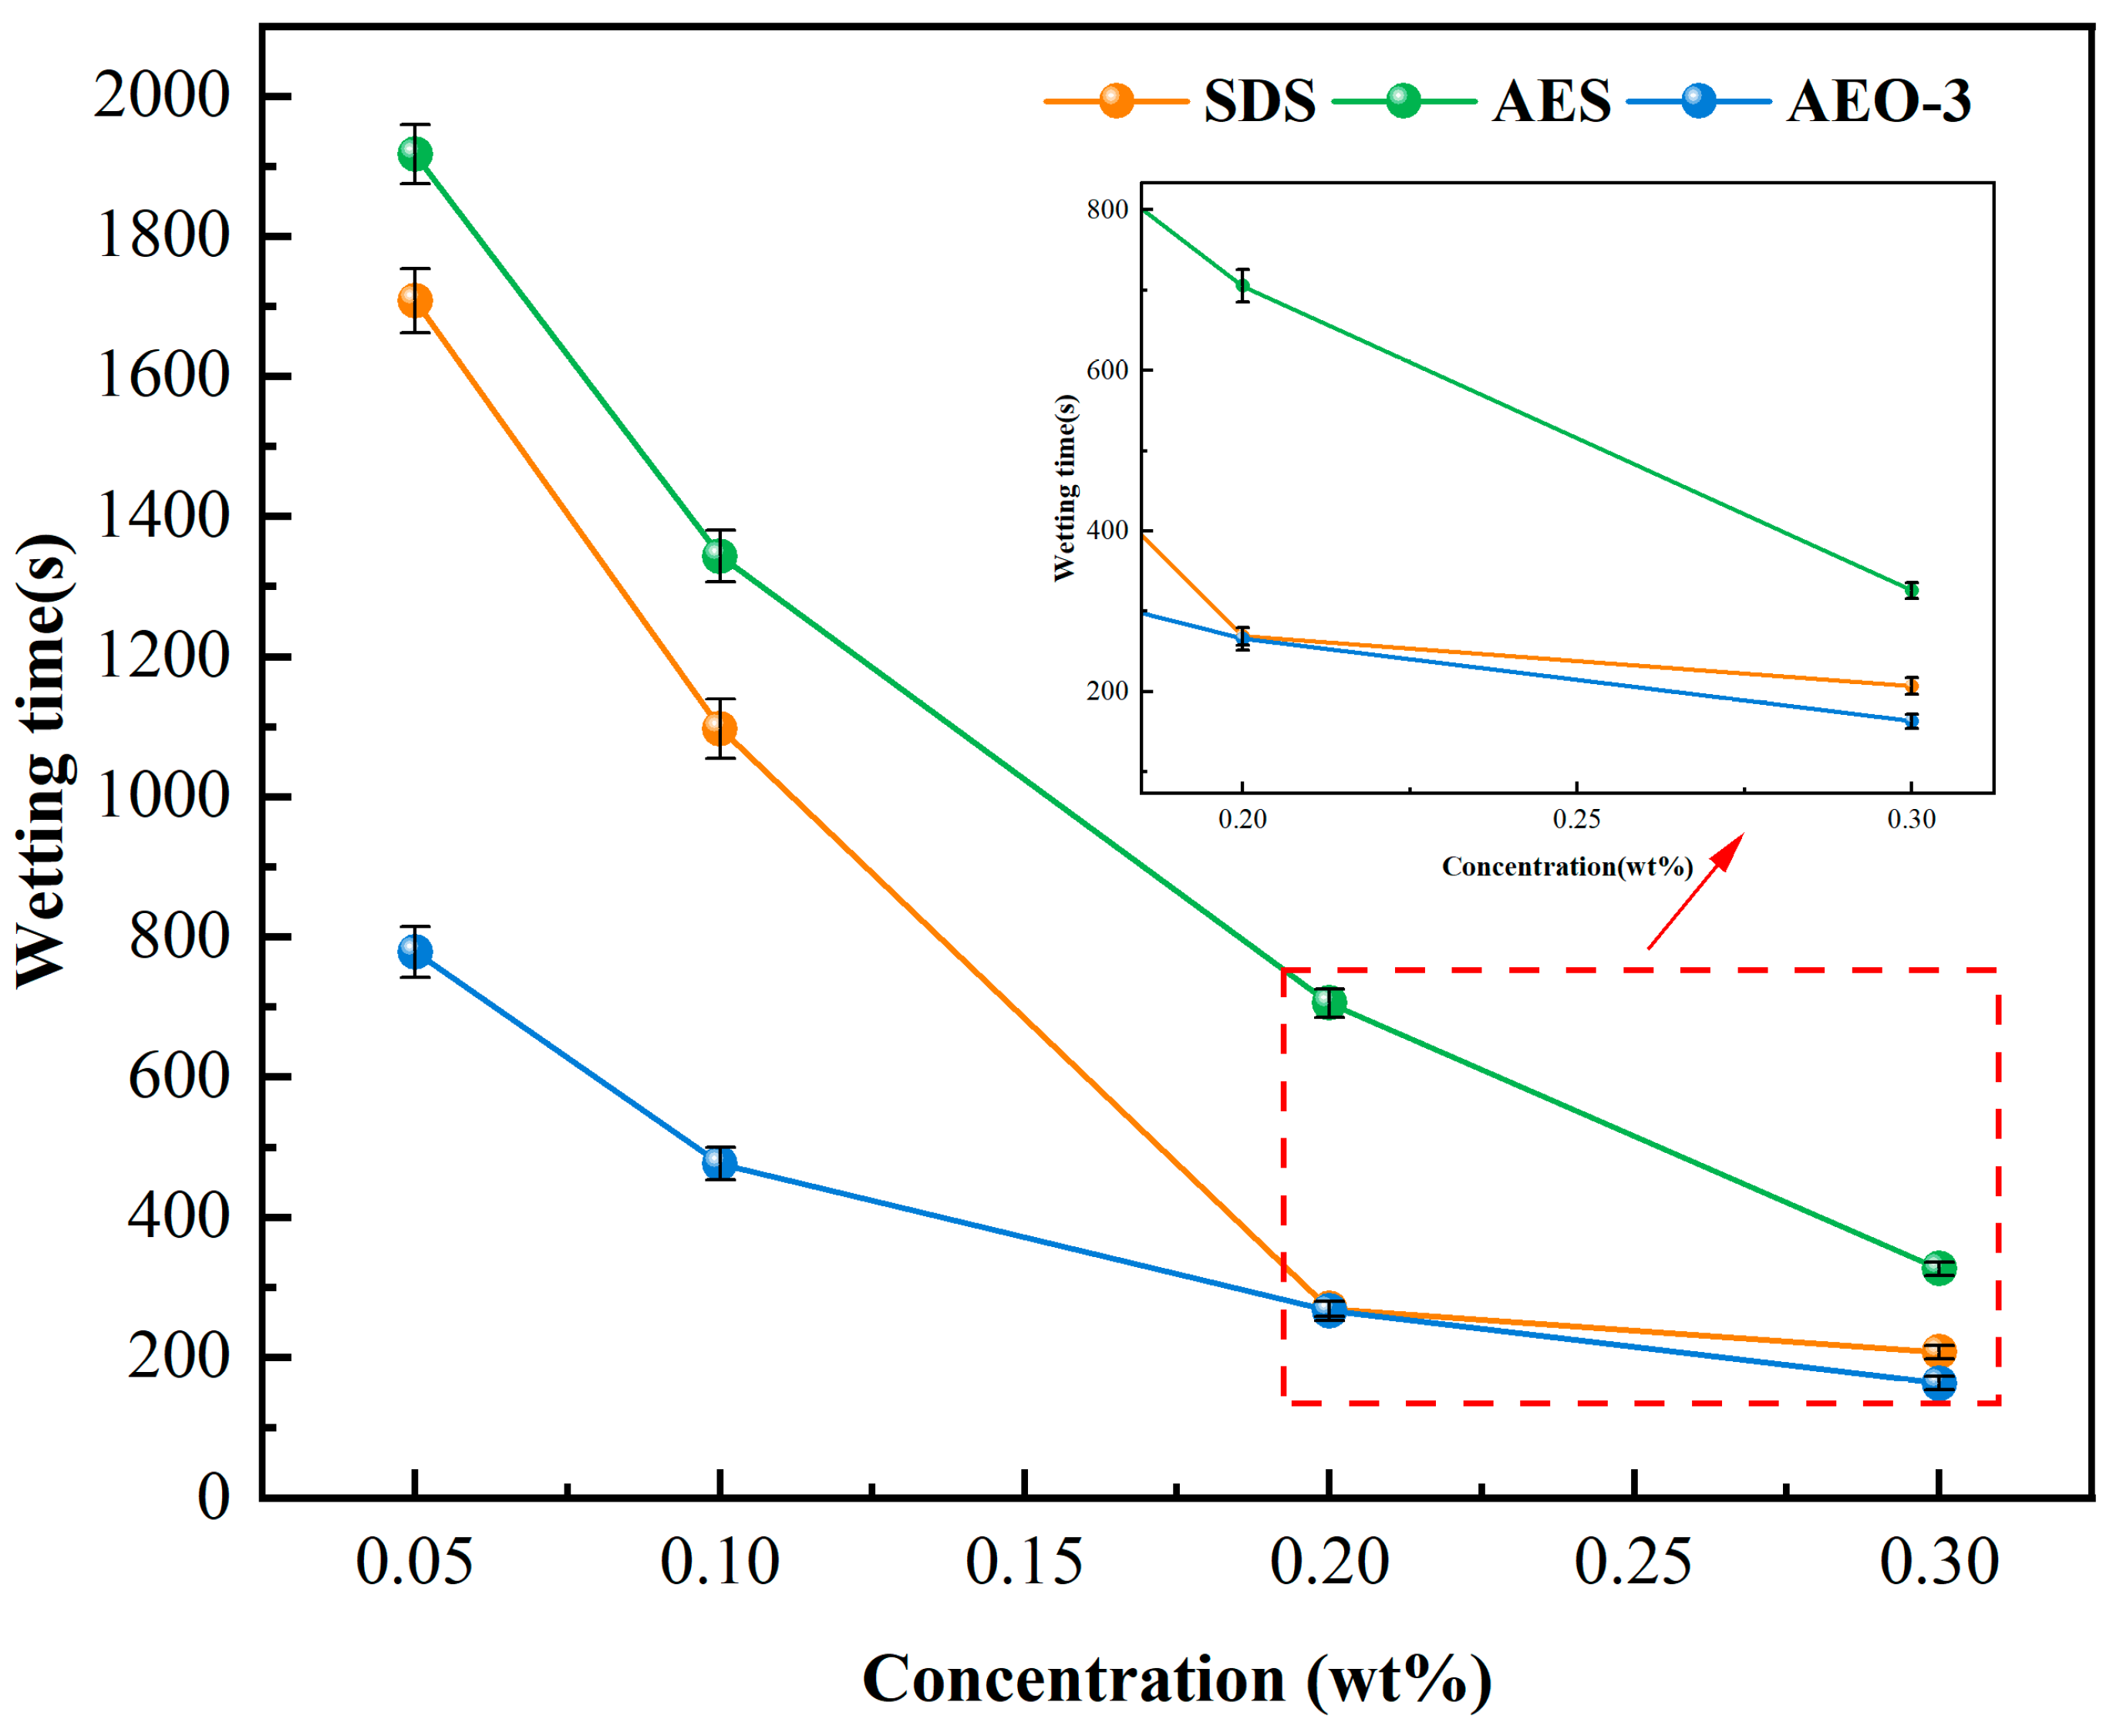
3.2. Wetting Time of Coal Dust
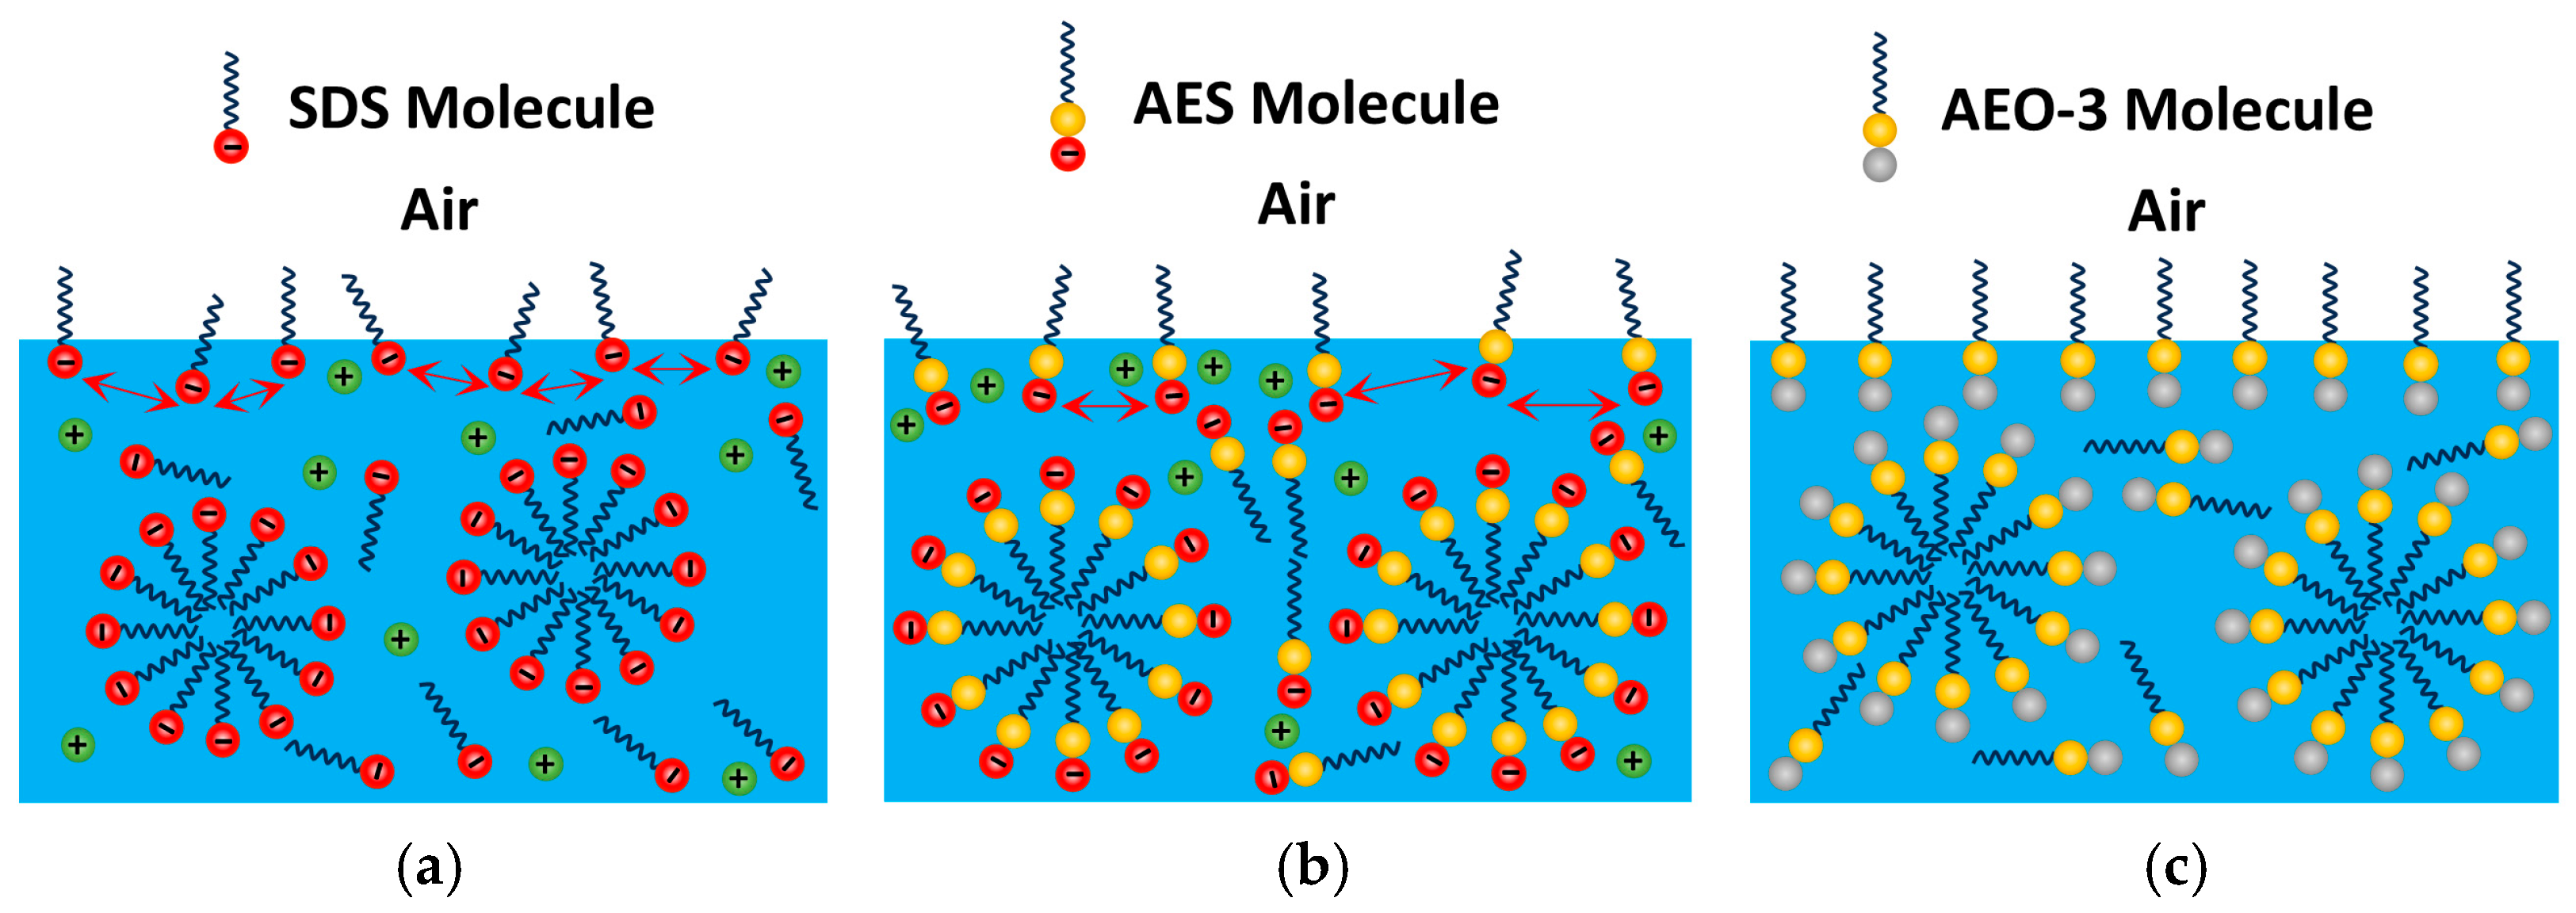
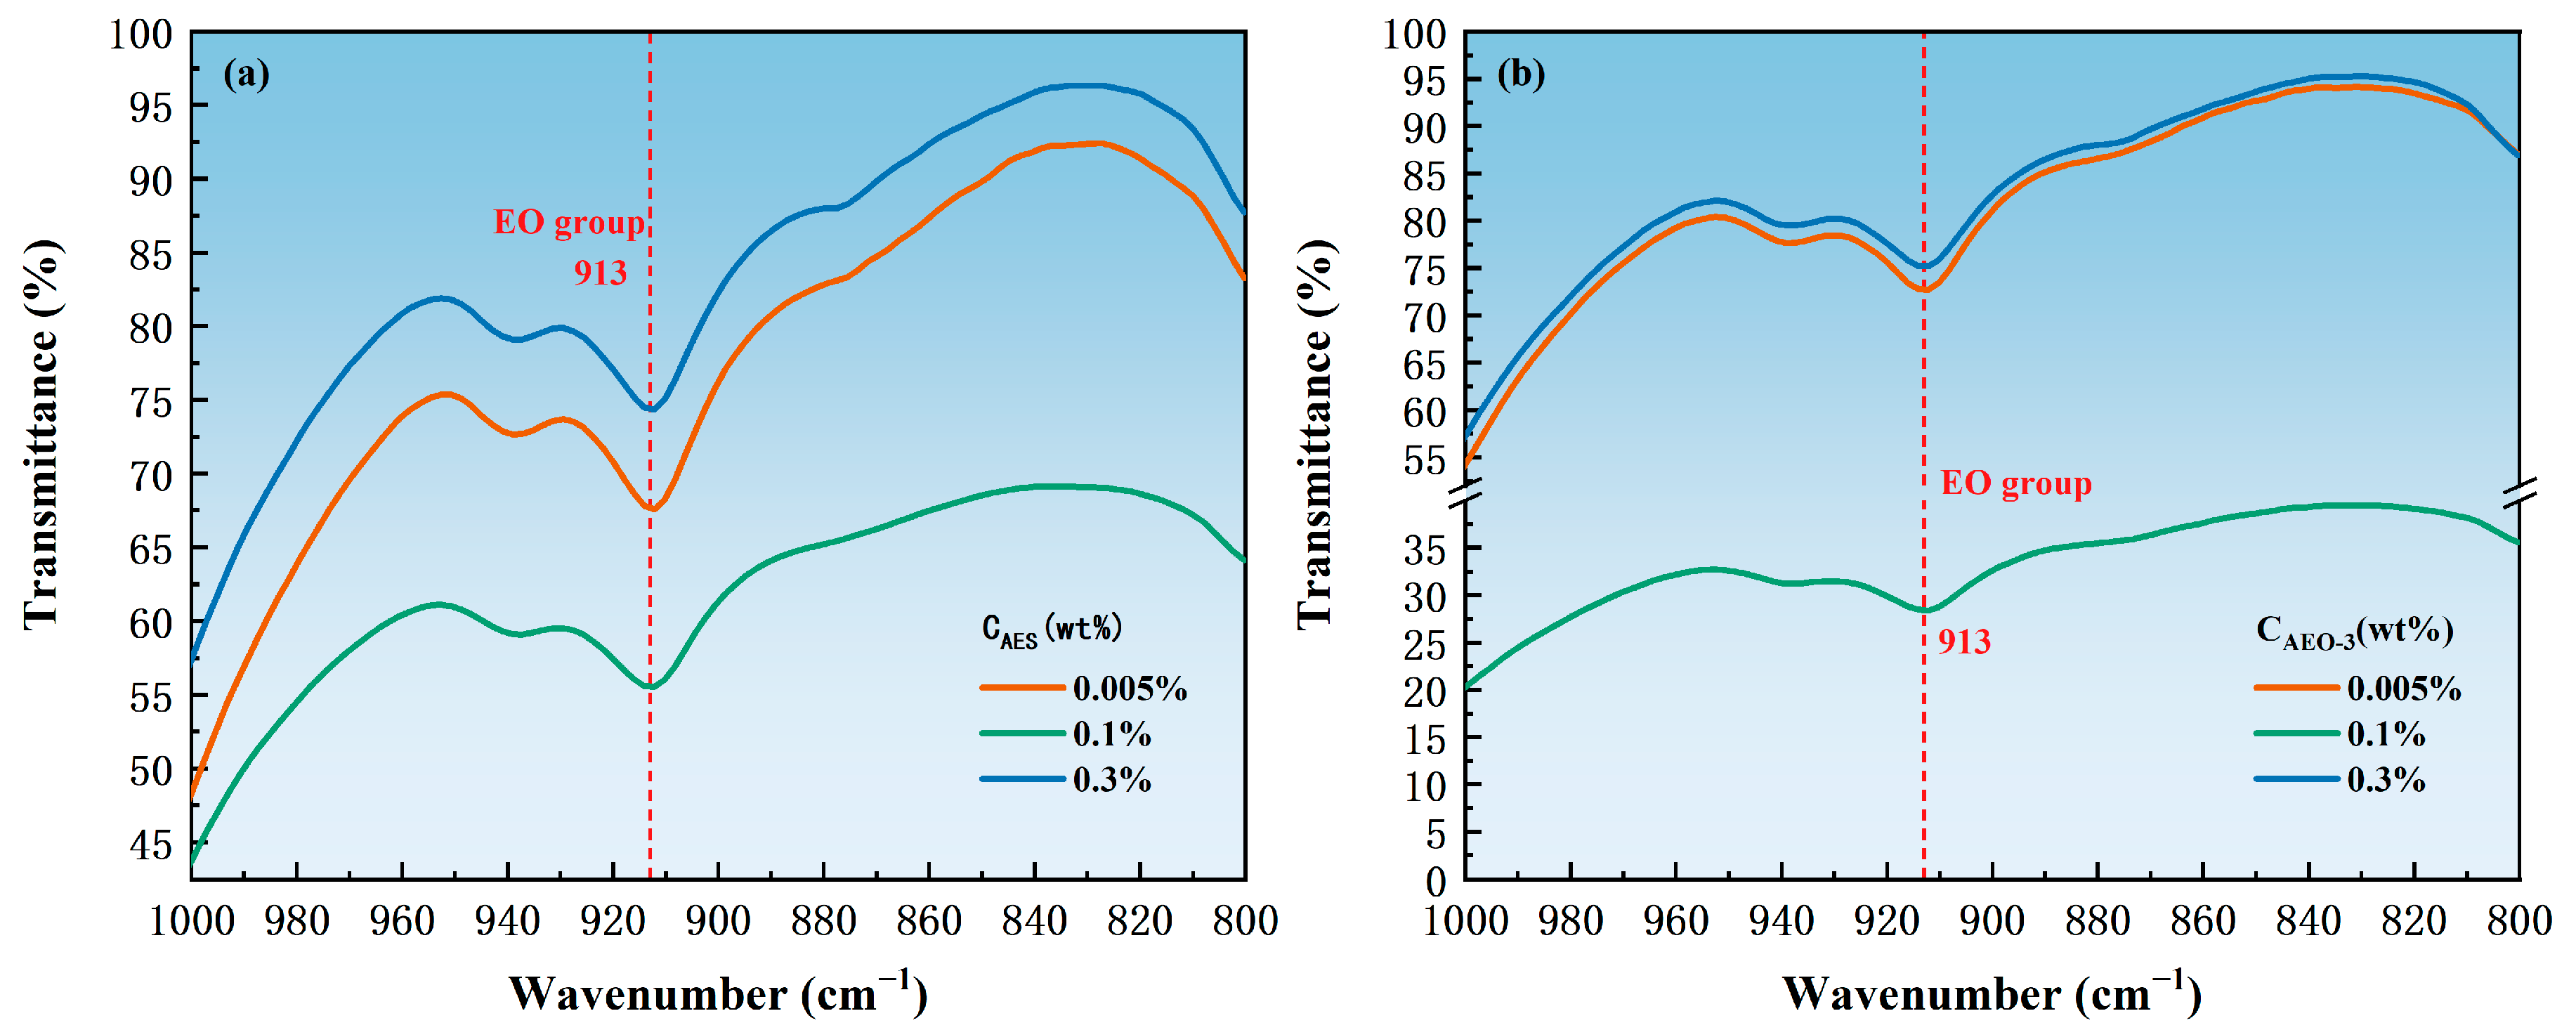
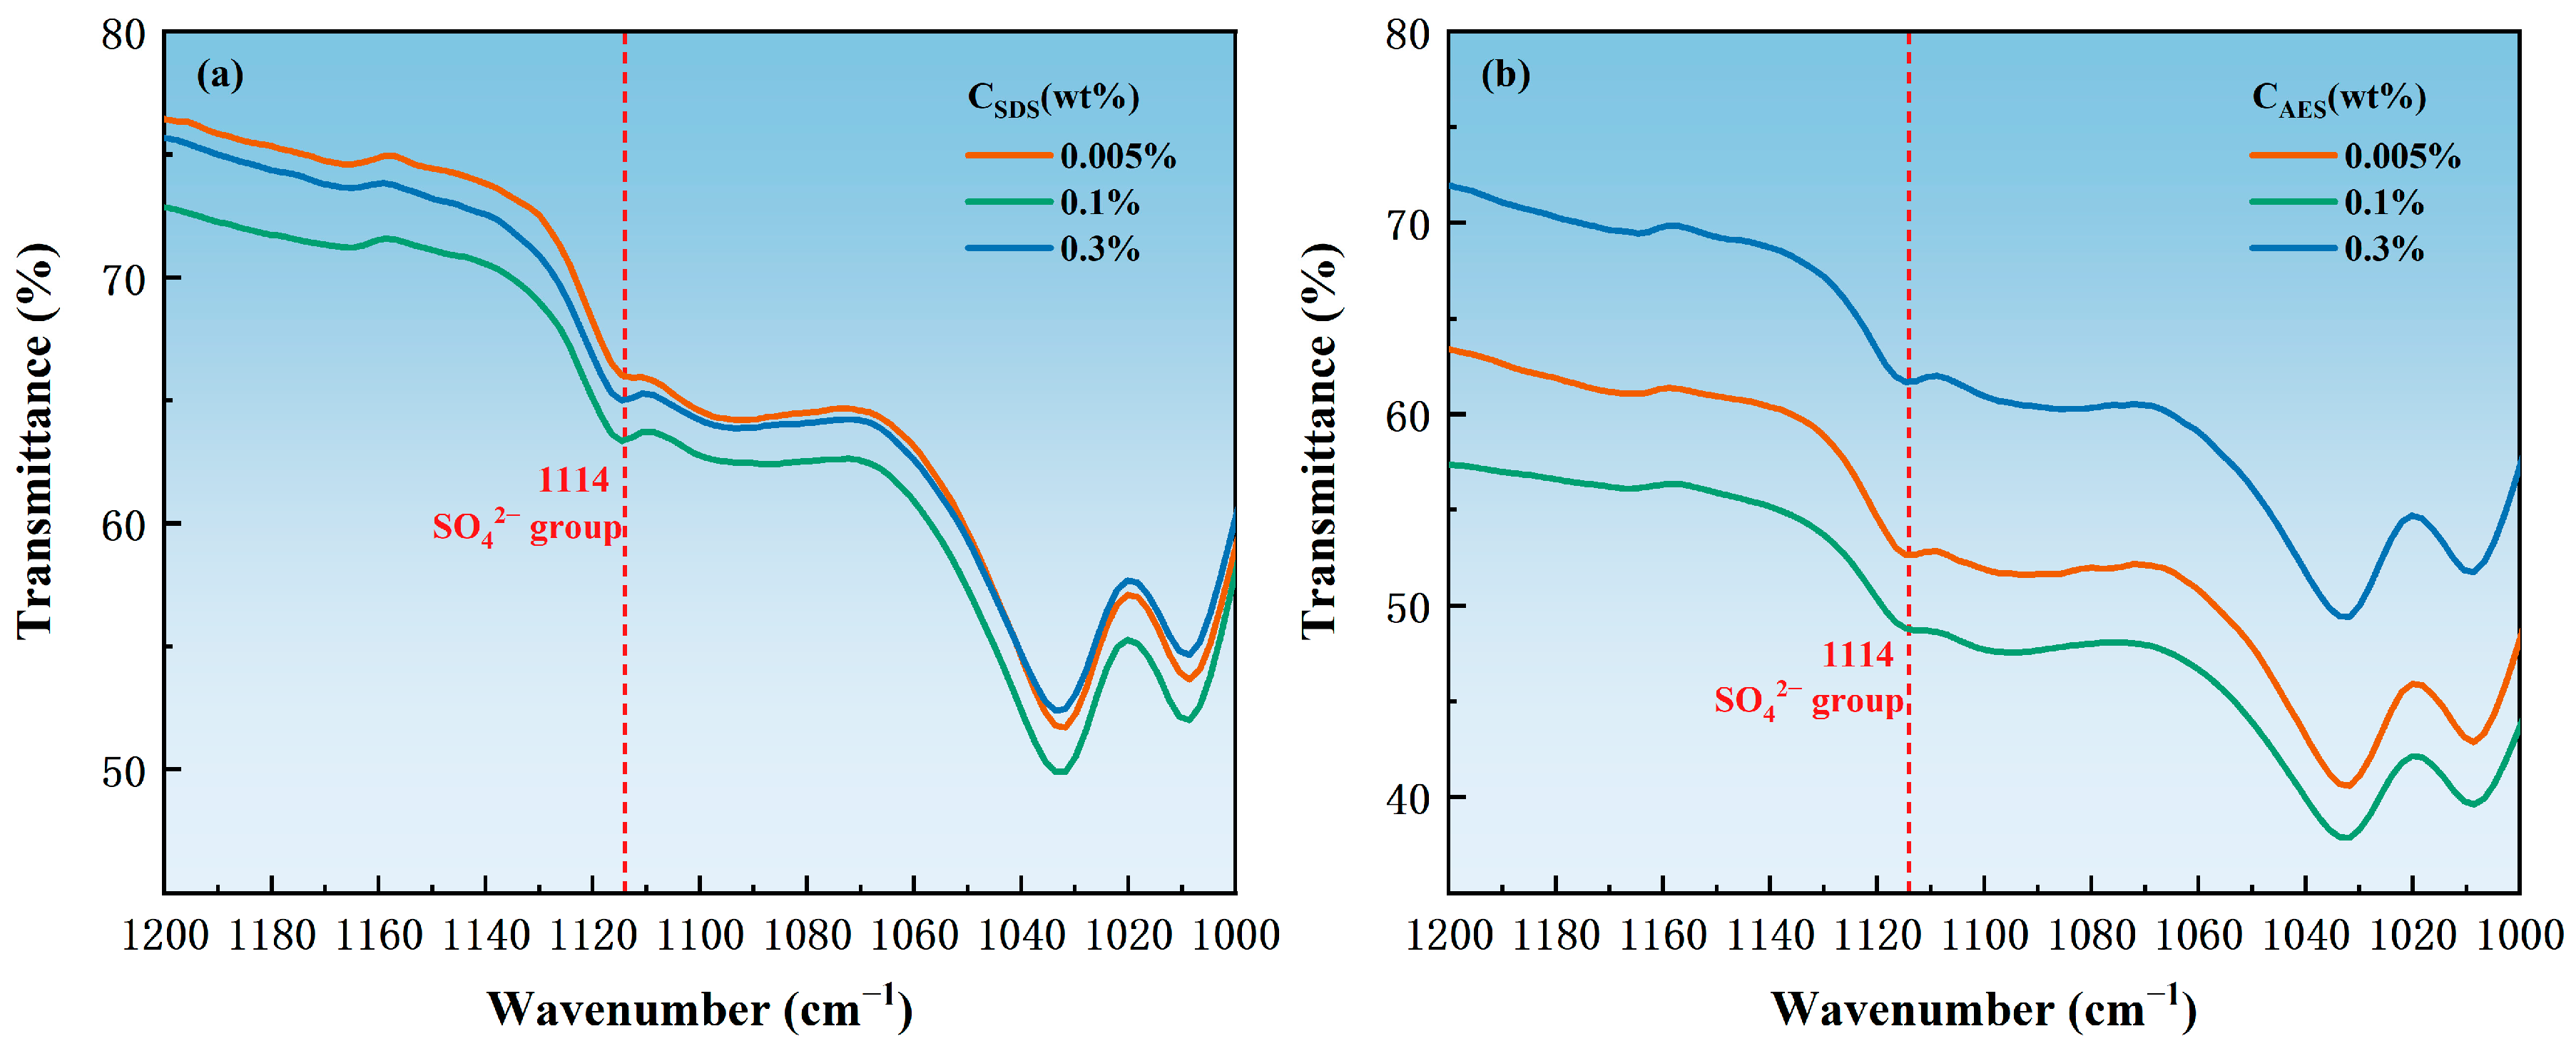
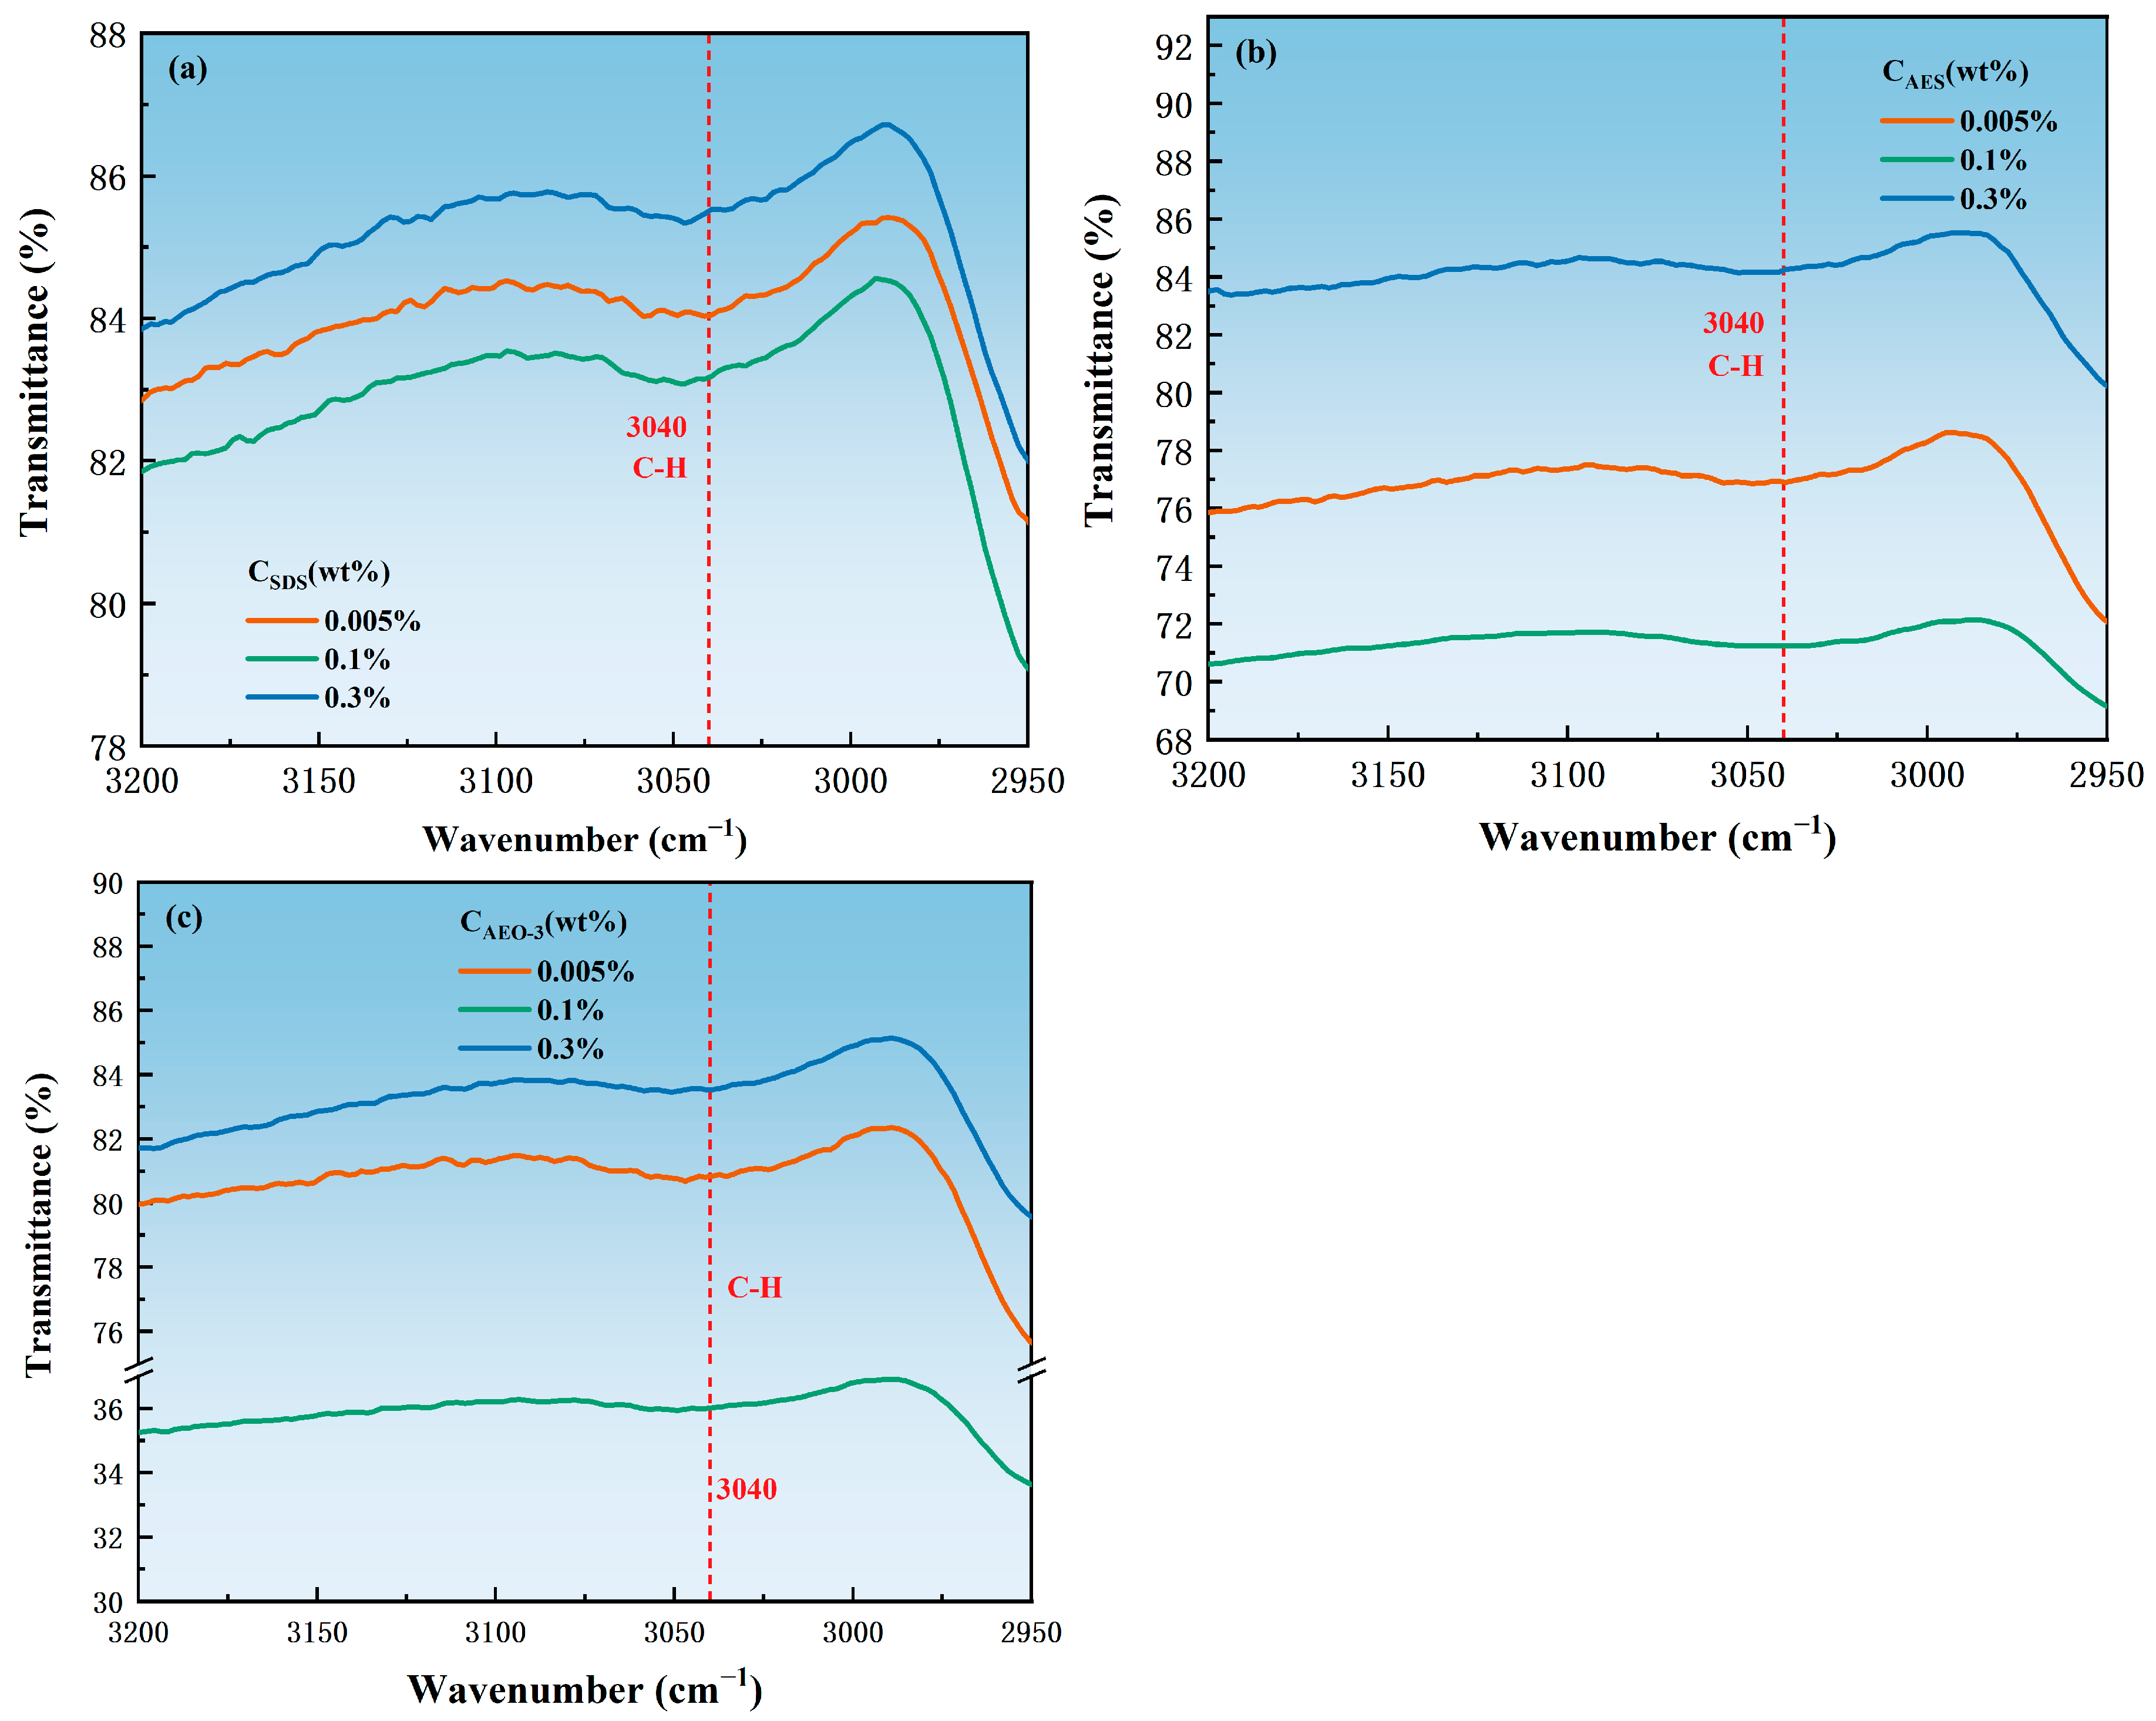
3.3. Adsorption State
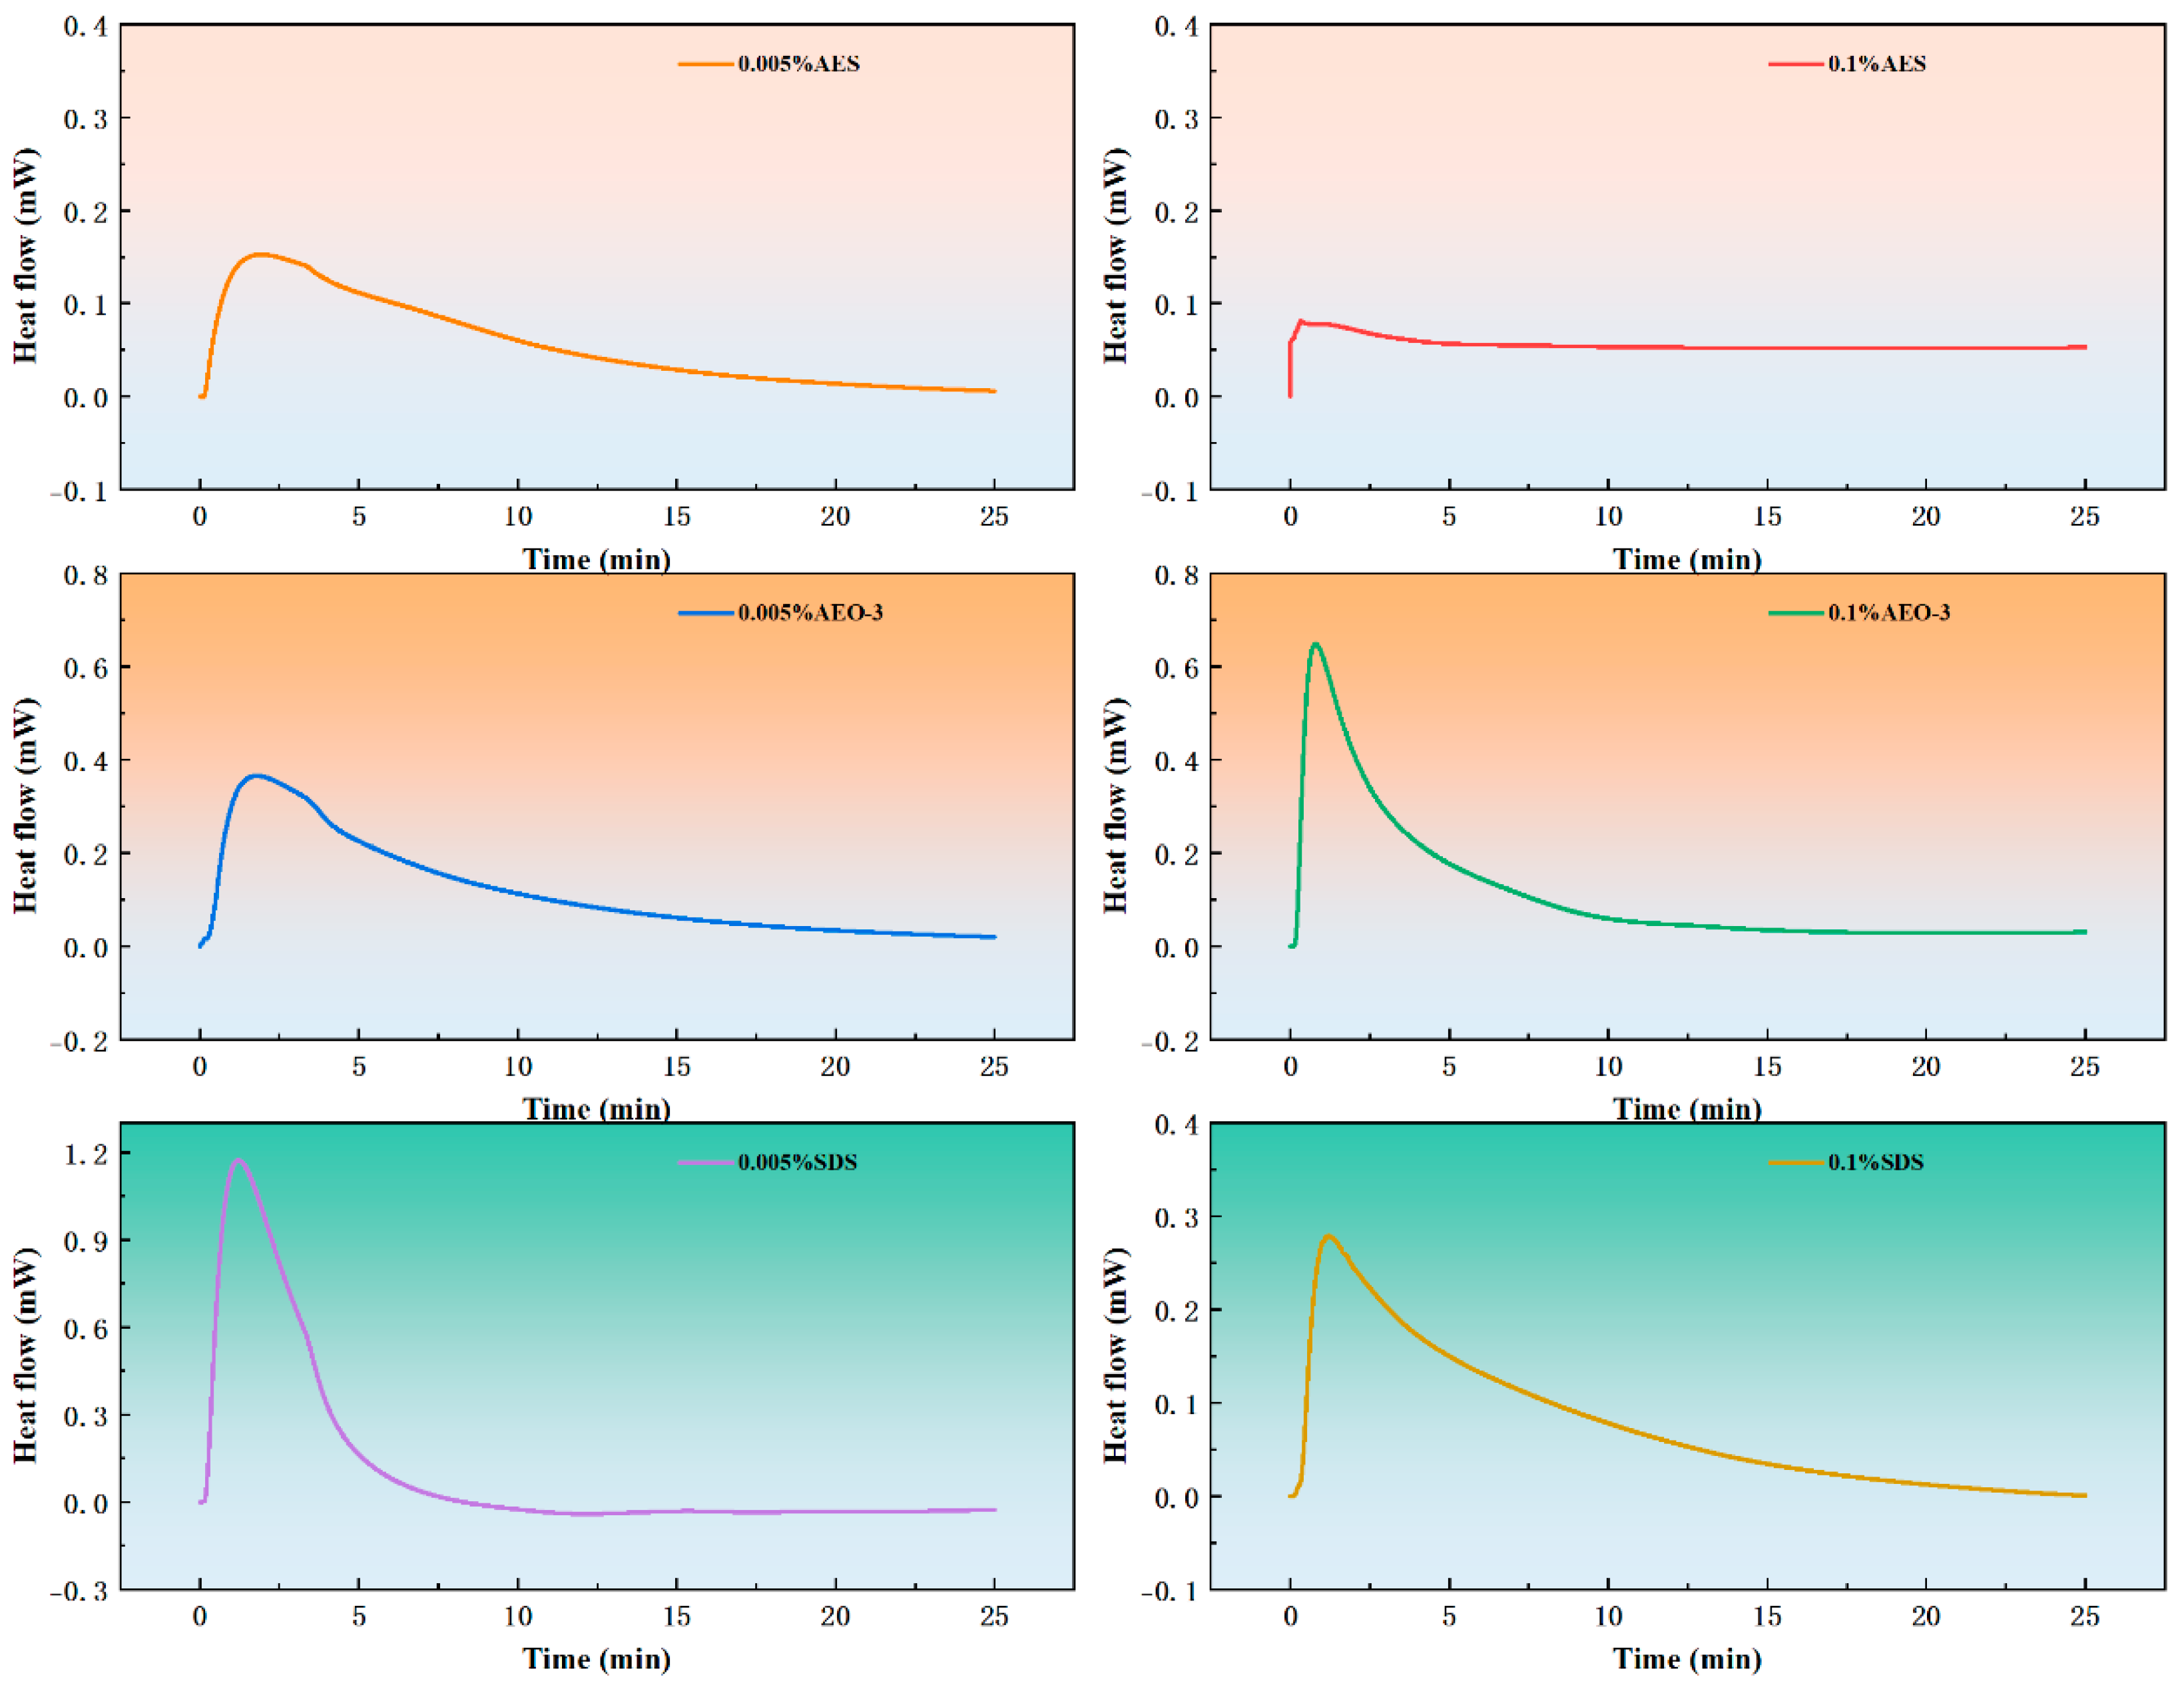
3.4. Wetting Heat
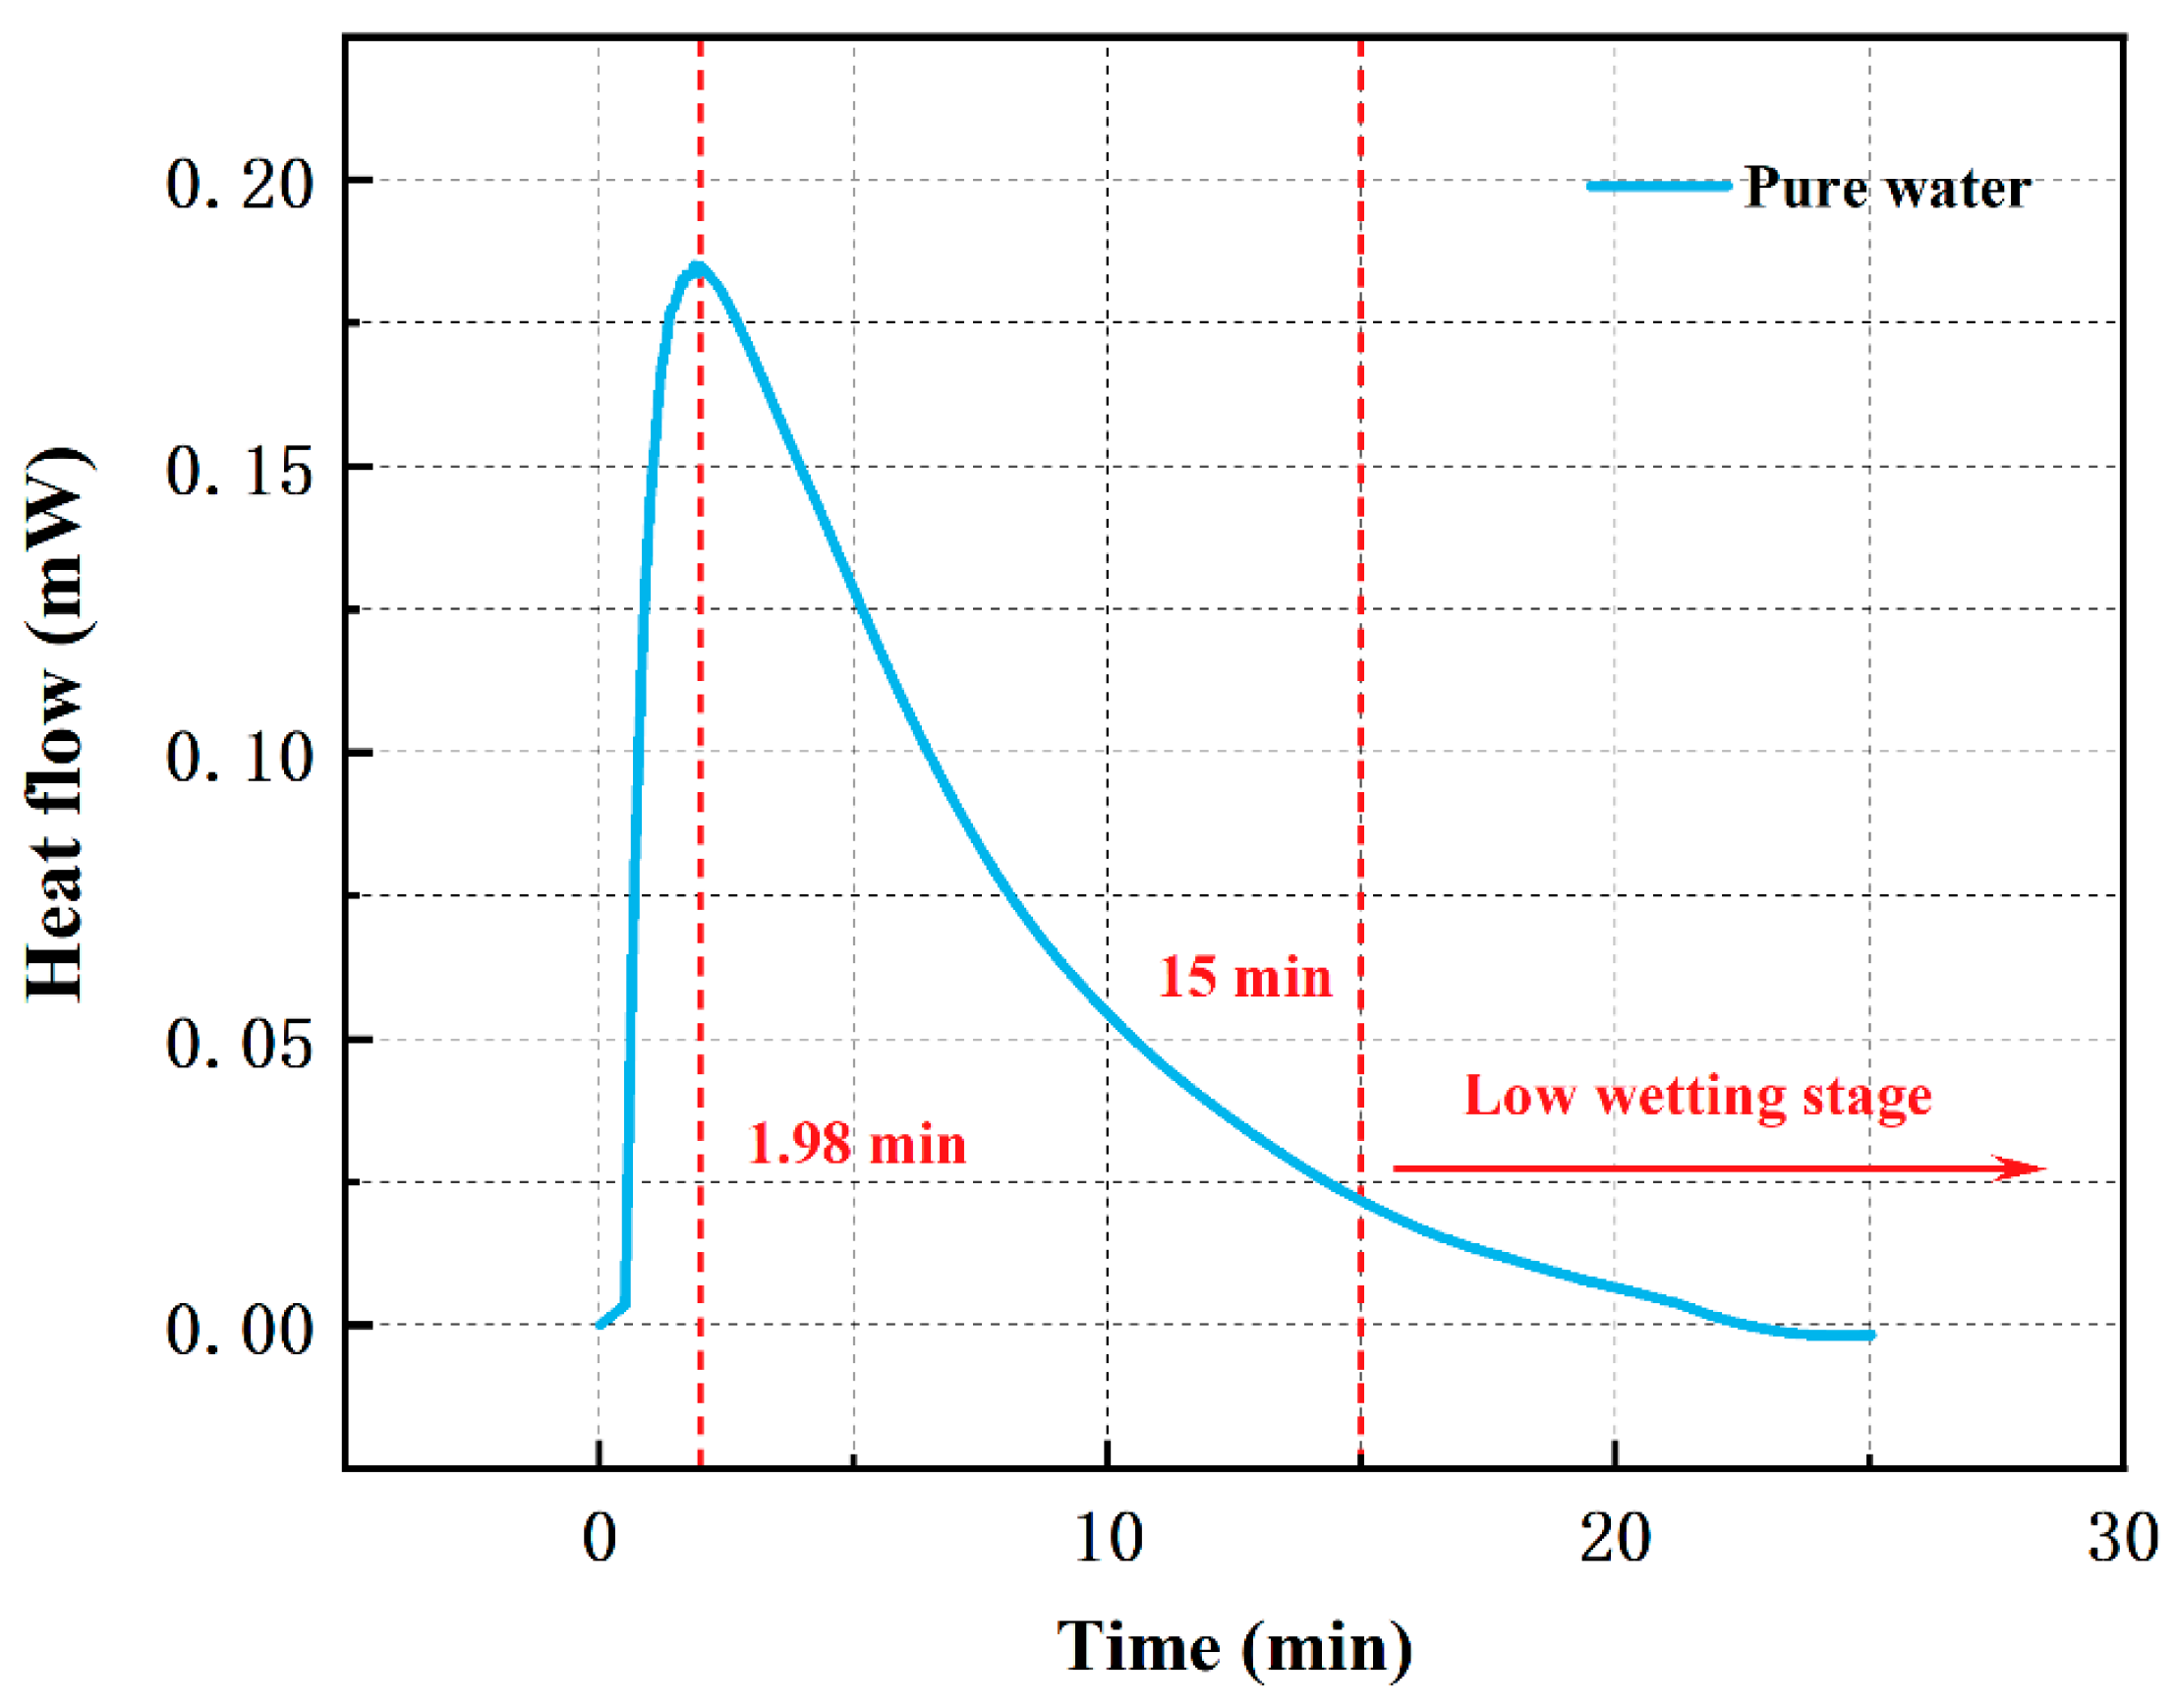
3.4.1. Wetting Heat Flow Curve of Pure Water
3.4.2. Peak Time of Wetting Heat Flow Curves
3.4.3. Wetting Heat Value
4. Conclusions
- (1)
- With the increase in surfactant concentration, the surface tension decreased first and then stabilized, while the wetting time continued to decrease, which proved that surface tension was not the only factor affecting the wetting effect. The wetting ability of nonionic surfactant AEO-3 was completely superior to anionic surfactant SDS and anionic-nonionic surfactant AES. But, the FTIR results showed that AES and SDS had the highest and lowest adsorption density, respectively. In the wetting heat experiment, there was a negative correlation between the peak time of the wetting heat curves and the adsorption density, and a positive correlation between the wetting heat value and the wetting ability of the surfactant. Therefore, the different adsorption states on the coal dust surface caused by different hydrophilic group structures of surfactants would also affect the wetting effect significantly.
- (2)
- The EO groups in the AES surfactant molecules could adsorb some free positively charged Na+ ions in the solution around it. This led to the combination of EO groups with Na+ ions, forming the bilayer adsorption structure and resulting in the highest adsorption density. However, the bilayer adsorption structure also caused the hydrophobic groups of AES molecules in the outer layer to face outward. This resulted in incomplete conversion of hydrophobic sites on the coal dust surface into hydrophilic sites. Therefore, AES had the weakest wetting ability and the lowest wetting heat.
- (3)
- For SDS and AEO-3 surfactants, a monolayer adsorption structure was formed. The hydrophilic groups of surfactants faced outward, making the hydrophobic sites on the coal dust surface transform into hydrophilic sites. Thus, the wetting ability of SDS and AEO-3 was better than that of AES. Due to the electrostatic repulsion between adjacent SDS molecules, the intermolecular distance increased, resulting in the lowest adsorption density. Owing to the absence of electrostatic repulsion and the presence of EO groups, AEO-3 had higher adsorption density than SDS, resulting in the best wetting performance and highest wetting heat.
Author Contributions
Funding
Data Availability Statement
Conflicts of Interest
References
- BP. BP Statistical Review of World Energy 2023; The United Kingdom of Great Britain and Northern Ireland: London, UK, 2023. [Google Scholar]
- Li, Z.L.; Li, H.; Li, W.H.; Sun, J.P.; Li, K.Y. Organic Geochemical Features of the Upper Paleozoic Coal-Bearing Deposits in Ordos Basin, North-Central China. Energies 2023, 16, 15. [Google Scholar] [CrossRef]
- Zhou, S.; Tong, Q.; Pan, X.Z.; Cao, M.; Wang, H.L.; Gao, J.; Ou, X.M. Research on low-carbon energy transformation of China necessary to achieve the Paris agreement goals: A global perspective. Energy Econ. 2021, 95, 11. [Google Scholar] [CrossRef]
- Wu, Y.; Meng, X.; Zhang, Y.; Shi, L.; Wu, Q.; Liu, L.; Wang, Z.; Liu, J.; Yan, K.; Wang, T. Experimental study on the suppression of coal dust explosion by silica aerogel. Energy 2023, 267, 126372. [Google Scholar] [CrossRef]
- Cao, W.; Qin, Q.; Cao, W.; Lan, Y.; Chen, T.; Xu, S.; Cao, X. Experimental and numerical studies on the explosion severities of coal dust/air mixtures in a 20-L spherical vessel. Powder Technol. 2017, 310, 17–23. [Google Scholar] [CrossRef]
- Yan, H.; Nie, B.; Peng, C.; Liu, P.; Wang, X.; Yin, F.; Gong, J.; Wei, Y.; Lin, S.; Gao, Q. Evaluation on explosion characteristics and parameters of pulverized coal for low-quality coal: Experimental study and analysis. Environ. Sci. Pollut. Res. 2022, 29, 18851–18867. [Google Scholar] [CrossRef]
- Liang, G.Q.; Dai, H.M.; Yin, H.P.; Zhao, Q.; Chen, X.F. Inhibition characteristics of coal dust explosion at the gasification atmosphere. Adv. Powder Technol. 2021, 32, 3725–3734. [Google Scholar] [CrossRef]
- Liu, Z.Q.; Zhou, G.; Li, S.L.; Wang, C.M.; Liu, R.L.; Jiang, W.J. Molecular dynamics simulation and experimental characterization of anionic surfactant: Influence on wettability of low-rank coal. Fuel 2020, 279, 118323. [Google Scholar] [CrossRef]
- Guo, Q.; Ren, W.X.; Shi, J.T. Foam for coal dust suppression during underground coal mine tunneling. Tunn. Undergr. Space Technol. 2019, 89, 170–178. [Google Scholar] [CrossRef]
- Han, F.W.; Peng, Y.Y.; Zhao, Y.; Yang, P.; Hu, F.H. Comparative investigation of methods for evaluating the wettability of dust suppression reagents on coal dust. J. Mol. Liq. 2024, 399, 124380. [Google Scholar] [CrossRef]
- Zhang, T.; Jing, D.J.; Ge, S.C.; Wang, J.R.; Chen, X. Supersonic antigravity aerodynamic atomization dusting nozzle based on the Laval nozzle and probe jet. J. Braz. Soc. Mech. Sci. Eng. 2020, 42, 335. [Google Scholar] [CrossRef]
- Yuan, M.Y.; Nie, W.; Zhou, W.W.; Yan, J.Y.; Bao, Q.; Guo, C.J.; Tong, P.; Zhang, H.H.; Guo, L.D. Determining the effect of the non-ionic surfactant AEO9 on lignite adsorption and wetting via molecular dynamics (MD) simulation and experiment comparisons. Fuel 2020, 278, 118339. [Google Scholar] [CrossRef]
- Xu, C.H.; Lin, Z.K.; Zhou, G.; Hu, X.M.; Wang, H.T.; Chen, X.F. Effect of welan gum and carbomer on foam and wetting properties of sodium alpha-olefin sulfonate for coal dust control. J. Mol. Liq. 2023, 388, 122692. [Google Scholar] [CrossRef]
- Gan, J.; Wang, D.M.; Xiao, Z.M.; Wang, Y.N.; Zhang, K.; Zhu, X.L.; Li, S.L. Experimental and molecular dynamics investigations of the effects of ionic surfactants on the wettability of low-rank coal. Energy 2023, 271, 127012. [Google Scholar] [CrossRef]
- Han, F.W.; Hu, F.H.; Zhao, X.L.; Liu, M.; Yang, P.; Niu, G.R. Study on the effect of electrolyte on surface tension of surfactant solution and wettability of coal dust. Colloid Surf. A-Physicochem. Eng. Asp. 2024, 682, 132929. [Google Scholar] [CrossRef]
- Han, F.W.; Liu, M.; Hu, F.H.; Zhao, Y.; Peng, Y.Y. Spreading Behavior and Wetting Characteristics of Anionic Surfactant Droplets Impacting Bituminous Coal. ACS Omega 2022, 7, 46241–46249. [Google Scholar] [CrossRef]
- Li, J.J.; Yan, G.C.; Kong, S.Q.; Bai, X.Y.; Li, G.; Zhang, J.W. Molecular Mechanism Study on the Effect of Microstructural Differences of Octylphenol Polyoxyethylene Ether (OPEO) Surfactants on the Wettability of Anthracite. Molecules 2023, 28, 4748. [Google Scholar] [CrossRef]
- Zhou, Q.; Qin, B.T. Coal dust suppression based on water mediums: A review of technologies and influencing factors. Fuel 2021, 302, 121196. [Google Scholar] [CrossRef]
- Marinova, K.G.; Naydenova, K.T.; Basheva, E.S.; Bauer, F.; Tropsch, J.; Franke, J. New surfactant mixtures for fine foams with slowed drainage. Colloid Surf. A-Physicochem. Eng. Asp. 2017, 523, 54–61. [Google Scholar] [CrossRef]
- Chang, P.; Xu, G.; Chen, Y.P.; Ghosh, A.; Moridi, M.A. Improving coal powder wettability using electrolyte assisted surfactant solution. Colloid Surf. A-Physicochem. Eng. Asp. 2021, 613, 126042. [Google Scholar] [CrossRef]
- Wang, Q.G.; Wang, D.M.; Wang, H.T.; Xu, C.H. Influence of alkyl polyglucoside and fatty alcohol ether sulfate on the foaming and wetting properties of sodium dodecyl benzene sulfonate for mine dust control. Powder Technol. 2019, 345, 91–98. [Google Scholar] [CrossRef]
- Liu, Z.; Jiao, L.S.; Yang, H.; Zhu, M.Y.; Zhang, M.M.; Dong, B.W. Study on the microstructural characteristics of coal and the mechanism of wettability of surfactant solutions at different pH levels. Fuel 2023, 353, 129268. [Google Scholar] [CrossRef]
- Chen, M.; Lu, X.C.; Liu, X.D.; Hou, Q.F.; Zhu, Y.Y.; Zhou, H.Q. Specific Counterion Effects on the Atomistic Structure and Capillary-Waves Fluctuation of the Water/Vapor Interface Covered by Sodium Dodecyl Sulfate. J. Phys. Chem. C 2014, 118, 19205–19213. [Google Scholar] [CrossRef]
- Xu, C.H.; Mandal, T.; Larson, R.G.; Wang, D.M.; Wang, H.T. A molecular dynamics simulation of the structure of sodium lauryl ether sulfate and poly( vinyl alcohol) at the air/water interface. Colloid Surf. A-Physicochem. Eng. Asp. 2019, 563, 84–94. [Google Scholar] [CrossRef]
- Crawford, R.J.; Mainwaring, D.E. The influence of surfactant adsorption on the surface characterisation of Australian coals. Fuel 2001, 80, 313–320. [Google Scholar] [CrossRef]
- Xu, C.H.; Wang, D.M.; Wang, H.T.; Ma, L.Y.; Zhu, X.L.; Zhu, Y.F.; Zhang, Y.; Liu, F.M. Experimental investigation of coal dust wetting ability of anionic surfactants with different structures. Process Saf. Environ. Protect. 2019, 121, 69–76. [Google Scholar] [CrossRef]
- Liu, S.Y.; Liu, X.Y.; Guo, Z.Y.; Liu, Y.T.; Guo, J.Y.; Zhang, S.H. Wettability modification and restraint of moisture re-adsorption of lignite using cationic gemini surfactant. Colloid Surf. A-Physicochem. Eng. Asp. 2016, 508, 286–293. [Google Scholar] [CrossRef]
- Wang, X.N.; Yuan, S.J.; Jiang, B.Y. Experimental investigation of the wetting ability of surfactants to coals dust based on physical chemistry characteristics of the different coal samples. Adv. Powder Technol. 2019, 30, 1696–1708. [Google Scholar] [CrossRef]
- Tessum, M.W.; Raynor, P.C.; Keating-Klika, L. Factors Influencing the Airborne Capture of Respirable Charged Particles by Surfactants in Water Sprays. J. Occup. Environ. Hyg. 2014, 11, 571–582. [Google Scholar] [CrossRef]
- Xu, H.; Penfold, J.; Thomas, R.K.; Petkov, J.T.; Tucker, I.; Webster, J.P.R. The Formation of Surface Multi layers at the Air-Water Interface from Sodium Polyethylene Glycol Monoalkyl Ether Sulfate/AlCl3 Solutions: The Role of the Size of the Polyethylene Oxide Group. Langmuir 2013, 29, 11656–11666. [Google Scholar] [CrossRef]
- Jang, S.S.; Goddard, W.A., III. Structures and properties of newton black films characterized using molecular dynamics simulations. J. Phys. Chem. B 2006, 110, 7992–8001. [Google Scholar] [CrossRef]
- Hao, B.; Fan, M.Q.; Li, H.P. Adsorption process and mechanisms of AEO-3/dodecane mixed collector on low-rank coal surface driven by water flow: A non-equilibrium molecular dynamics simulation study. J. Mol. Liq. 2022, 364, 119993. [Google Scholar] [CrossRef]
- Zheng, R.J.; Ren, Z.J.; Gao, H.M.; Qian, Y.P. Evaluation of Sulfonate-Based Collectors with Different Hydrophobic Tails for Flotation of Fluorite. Minerals 2018, 8, 57. [Google Scholar] [CrossRef]
- Bera, A.; Kumar, T.; Ojha, K.; Mandal, A. Adsorption of surfactants on sand surface in enhanced oil recovery: Isotherms, kinetics and thermodynamic studies. Appl. Surf. Sci. 2013, 284, 87–99. [Google Scholar] [CrossRef]
- Pucic, I.; Jurkin, T. FTIR assessment of poly(ethylene oxide) irradiated in solid state, melt and aqueous solution. Radiat. Phys. Chem. 2012, 81, 1426–1429. [Google Scholar] [CrossRef]
- Zhanzakova, A.; Tong, S.Y.; Yang, K.J.; Chen, L.; Li, K.J.; Fu, H.B.; Wang, L.; Kong, L.D. The effects of surfactants on the heterogeneous uptake of sulfur dioxide on hematite. Atmos. Environ. 2019, 213, 548–557. [Google Scholar] [CrossRef]
- Du, C.T.; Kong, L.D.; Zhanzakova, A.; Tong, S.Y.; Yang, X.; Wang, L.; Fu, H.B.; Cheng, T.T.; Chen, J.M.; Zhang, S.C. Impact of adsorbed nitrate on the heterogeneous conversion of SO2 on α-Fe2O3 in the absence and presence of simulated solar irradiation. Sci. Total Environ. 2019, 649, 1393–1402. [Google Scholar] [CrossRef]
- Smith, B.C. Group Wavenumbers and an Introduction to the Spectroscopy of Benzene Rings. Spectroscopy 2016, 31, 34–37. [Google Scholar]
- Al-Sabagh, A.M.; Azzam, E.M.S.; Mahmoud, S.A.; Saleh, N.E.A. Synthesis of ethoxylated alkyl sulfosuccinate surfactants and the investigation of mixed solutions. J. Surfactants Deterg. 2007, 10, 3–8. [Google Scholar] [CrossRef]
- Xu, C.H.; Wang, H.T.; Wang, D.M.; Zhu, Y.F.; Zhu, X.L.; Yu, H. Study on the mechanism of polyethylene oxide groups improving the foamability of anionic surfactants in hard water. Colloid Surf. A-Physicochem. Eng. Asp. 2021, 613, 126046. [Google Scholar] [CrossRef]
- Allardice, D.; Evans, D. The-brown coal/water system: Part 2. Water sorption isotherms on bed-moist Yallourn brown coal. Fuel 1971, 50, 236–253. [Google Scholar] [CrossRef]


| Surfactant | Type | Molecular Structure |
|---|---|---|
| SDS | Anionic |  |
| AES | Anionic-nonionic | 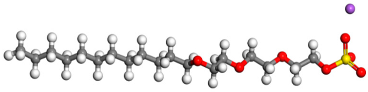 |
| AEO-3 | Nonionic | 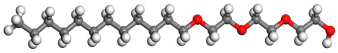 |
 —O atoms;
  —S atoms;
  —Na atoms;
  —C atoms;
  —H atoms.
| Surfactant Concentration | Coal Dust Wetting Time | ||
|---|---|---|---|
| SDS | AES | AEO-3 | |
| 0% | >24 h | >24 h | >24 h |
| 0.005% | >24 h | >24 h | 11,124.44 s |
| 0.05% | 1703.90 s | 1915.96 s | 776.15 s |
| 0.1% | 1096.59 s | 1344.72 s | 176.71 s |
| 0.2% | 269.16 s | 705.78 s | 266.30 s |
| 0.3% | 207.31 s | 326.82 s | 163.24 s |
| Surfactant | Concentration (wt.%) | EO Groups | Benzene Ring C-H Bond | Ratio of the Transmittance of the EO Groups to the C-H Bond of the Benzene Ring |
|---|---|---|---|---|
| AEO-3 | 0.005 | 72.69923 | 80.84245 | 0.89974 |
| 0.1 | 28.39412 | 36.02352 | 0.78821 | |
| 0.3 | 75.18254 | 83.56574 | 0.89968 | |
| AES | 0.005 | 67.59277 | 76.89948 | 0.87898 |
| 0.1 | 55.54300 | 71.25000 | 0.77955 | |
| 0.3 | 74.36169 | 84.27282 | 0.88239 |
| Surfactant | Concentration (wt.%) | SO42− Groups | Benzene Ring C-H Bond | Ratio of the Transmittance of the SO42− Groups to the C-H Bond of the Benzene Ring |
|---|---|---|---|---|
| AES | 0.005 | 52.63848 | 76.89948 | 0.68451 |
| 0.1 | 48.75639 | 71.25000 | 0.68430 | |
| 0.3 | 61.68929 | 84.27282 | 0.73202 | |
| SDS | 0.005 | 66.03024 | 84.04665 | 0.78564 |
| 0.1 | 63.36406 | 83.18496 | 0.76172 | |
| 0.3 | 65.16047 | 85.38580 | 0.76313 |
| Surfactant | Peak Time (min) | ||
|---|---|---|---|
| 0% | 0.005% | 0.1% | |
| SDS | 1.98 | 1.22 | 1.21 |
| AES | 1.98 | 1.94 | 0.34 |
| AEO-3 | 1.98 | 1.80 | 0.80 |
| Surfactant | Wetting Heat Value (J/g) | ||
|---|---|---|---|
| 0% | 0.005% | 0.1% | |
| SDS | 1.38 | 2.92 | 1.92 |
| AES | 1.38 | 1.41 | 1.40 |
| AEO-3 | 1.38 | 2.96 | 2.78 |
Disclaimer/Publisher’s Note: The statements, opinions and data contained in all publications are solely those of the individual author(s) and contributor(s) and not of MDPI and/or the editor(s). MDPI and/or the editor(s) disclaim responsibility for any injury to people or property resulting from any ideas, methods, instructions or products referred to in the content. |
© 2025 by the authors. Licensee MDPI, Basel, Switzerland. This article is an open access article distributed under the terms and conditions of the Creative Commons Attribution (CC BY) license (https://creativecommons.org/licenses/by/4.0/).
Share and Cite
Xu, C.; Zhang, T.; Wang, S.; Gan, J.; Wang, H. Influence of Hydrophilic Groups of Surfactants on Their Adsorption States and Wetting Effect on Coal Dust. Processes 2025, 13, 1612. https://doi.org/10.3390/pr13051612
Xu C, Zhang T, Wang S, Gan J, Wang H. Influence of Hydrophilic Groups of Surfactants on Their Adsorption States and Wetting Effect on Coal Dust. Processes. 2025; 13(5):1612. https://doi.org/10.3390/pr13051612
Chicago/Turabian StyleXu, Chaohang, Tongyuan Zhang, Sijing Wang, Jian Gan, and Hetang Wang. 2025. "Influence of Hydrophilic Groups of Surfactants on Their Adsorption States and Wetting Effect on Coal Dust" Processes 13, no. 5: 1612. https://doi.org/10.3390/pr13051612
APA StyleXu, C., Zhang, T., Wang, S., Gan, J., & Wang, H. (2025). Influence of Hydrophilic Groups of Surfactants on Their Adsorption States and Wetting Effect on Coal Dust. Processes, 13(5), 1612. https://doi.org/10.3390/pr13051612