Article

Experimental Study on Simulated Acoustic Characteristics of Downhole Tubing Leakage

by
Yun-Peng Yang
1,*,
Sheng-Li Chu
1,
Ying-Hua Jing
1,
Bing-Cai Sun
1,
Jing-Wei Zhang
2,
Jin-You Wang
1,
Jian-Chun Fan
3,
Mo-Song Li
1,
Shuang Liang
1 and
Yu-Shan Zheng
1
1
CNPC Research Institute of Safety & Environment Technology, Beijing 102206, China
2
PetroChina Tarim Oilfield Company, Korla 841000, China
3
PetroChina Jilin Oilfield Company, Songyuan 138000, China
*
Author to whom correspondence should be addressed.
Processes 2025, 13(5), 1586; https://doi.org/10.3390/pr13051586
Submission received: 15 April 2025 / Revised: 12 May 2025 / Accepted: 14 May 2025 / Published: 20 May 2025
(This article belongs to the Section Energy Systems)

Abstract

:
In response to the limitations of experimental methods for detecting oil and gas well tubing leaks, this study developed a full-scale indoor simulation system for oil tubing leakage. The system consists of three components: a wellbore simulation device, a dynamic leakage simulation module, and a multi-parameter monitoring system. The wellbore simulator employs a jacketed structure to replicate real-world conditions, while the leakage module incorporates a precision flow control device to regulate leakage rates. The monitoring system integrates high-sensitivity acoustic sensors and pressure sensors. Through multi-condition experiments, the system simulated complex scenarios, including leakage apertures of 1–5 mm, different leakage positions relative to the annular liquid level, and multiple leakage point combinations. A comprehensive acoustic signal processing framework was established, incorporating time–domain features, frequency–domain characteristics, and time–frequency joint analysis. Experimental results indicate that when the leakage point is above the annular liquid level, the acoustic signals received at the wellhead exhibit high-frequency characteristics typical of gas turbulence. In contrast, leaks below the liquid level produce acoustic waves with distinct low-frequency fluid cavitation signatures, accompanied by noticeable medium-coupled attenuation during propagation. These differential features provide a foundation for accurately identifying leakage zones and confirm the feasibility of using acoustic detection technology to locate concealed leaks below the annular liquid level. The study offers experimental support for improving downhole leakage classification and early warning systems.

1. Introduction

As the critical conduit connecting sub-surface formations to surface facilities, oil tubings serve a dual mission in hydrocarbon production: functioning both as the primary pathway for fluid transport and as the essential barrier safeguarding wellbore integrity [1]. Industrial experience demonstrates that tubing leakage has emerged as the leading cause of wellbore integrity failure, with its underlying mechanisms closely tied to downhole multi-field coupling environments—casings endure sustained formation pressure, multiphase corrosion, and high-velocity fluid erosion throughout their service life, significantly elevating perforation and leakage risks [2,3,4,5,6,7].
Leakage incidents not only trigger safety hazards such as abnormal annular pressure but may also initiate chain reactions: at best, causing unplanned well shutdowns with economic losses, and at worst, leading to catastrophic blowouts or platform structural failures. Notably, sustained casing pressure (SCP) exhibits distinct time-dependent characteristics. Monitoring data from the U.S. Minerals Management Service reveals that abnormal pressure occurrence rates in production and intermediate casings in the Gulf of Mexico reach 50% and 35%, respectively [7], with the global prevalence of SCP wells showing exponential growth with the field development duration.
Acoustic detection technology is one of the most rapid and efficient detection methods and also one of the most extensively researched pipeline leak detection and localization techniques [8,9,10,11,12]. By detecting the leak-induced acoustic waves generated during structural leakage, leakage information can be obtained. Conventional methods such as noise logging, ultrasonic logging, and acoustic wave detection in surface pipelines are all based on this principle [13,14,15,16]. The development of leak acoustic wave detection technology in surface pipelines has reached relative maturity, and related research findings can be extended to downhole tubing leak detection. Although downhole tubing shares similarities with natural gas pipelines, such that leak acoustic waves are generated by gas jet flows inside the pipes, natural gas pipelines typically have no external structures, allowing free jet development. In contrast, downhole tubing is surrounded by casing, and the gas jet from leakage holes cannot fully develop freely due to casing constraints [17,18,19]. Additionally, factors such as tubing string vibrations during gas well production, the presence of cement sheaths outside the casing, and sea wave impacts on wellbores all increase the difficulty of acoustic wave acquisition in tubing and casing [19]. Researchers including Wang Qiong and Liu Yanjun conducted theoretical analyses and experimental studies on inner pipe leakage noise in jacketed structures. They concluded that when both the inner pipe and jacket contain gas environments, the noise primarily originates from jet noise, vortex noise, monopole sources, and gas impacts on outer pipe walls. The strongest noise occurs at leakage points and outer pipe wall boundaries. They conducted experimental detection studies using acoustic emission technology on the outer walls of casing pipes [20,21]. These findings provide foundational data for understanding downhole tubing leakage acoustic source characteristics, but none address scenarios where a leakage occurs beneath annular protective fluid, failing to achieve full-wellbore tubing leak detection at the wellhead. Therefore, the core objective of this study is to explore the feasibility of using acoustic detection technology for full-wellbore tubing leak detection at the wellhead, aiming to provide data support for improving downhole tubing leak detection technology systems.

2. Experimental Study on Tubing Leakage Detection

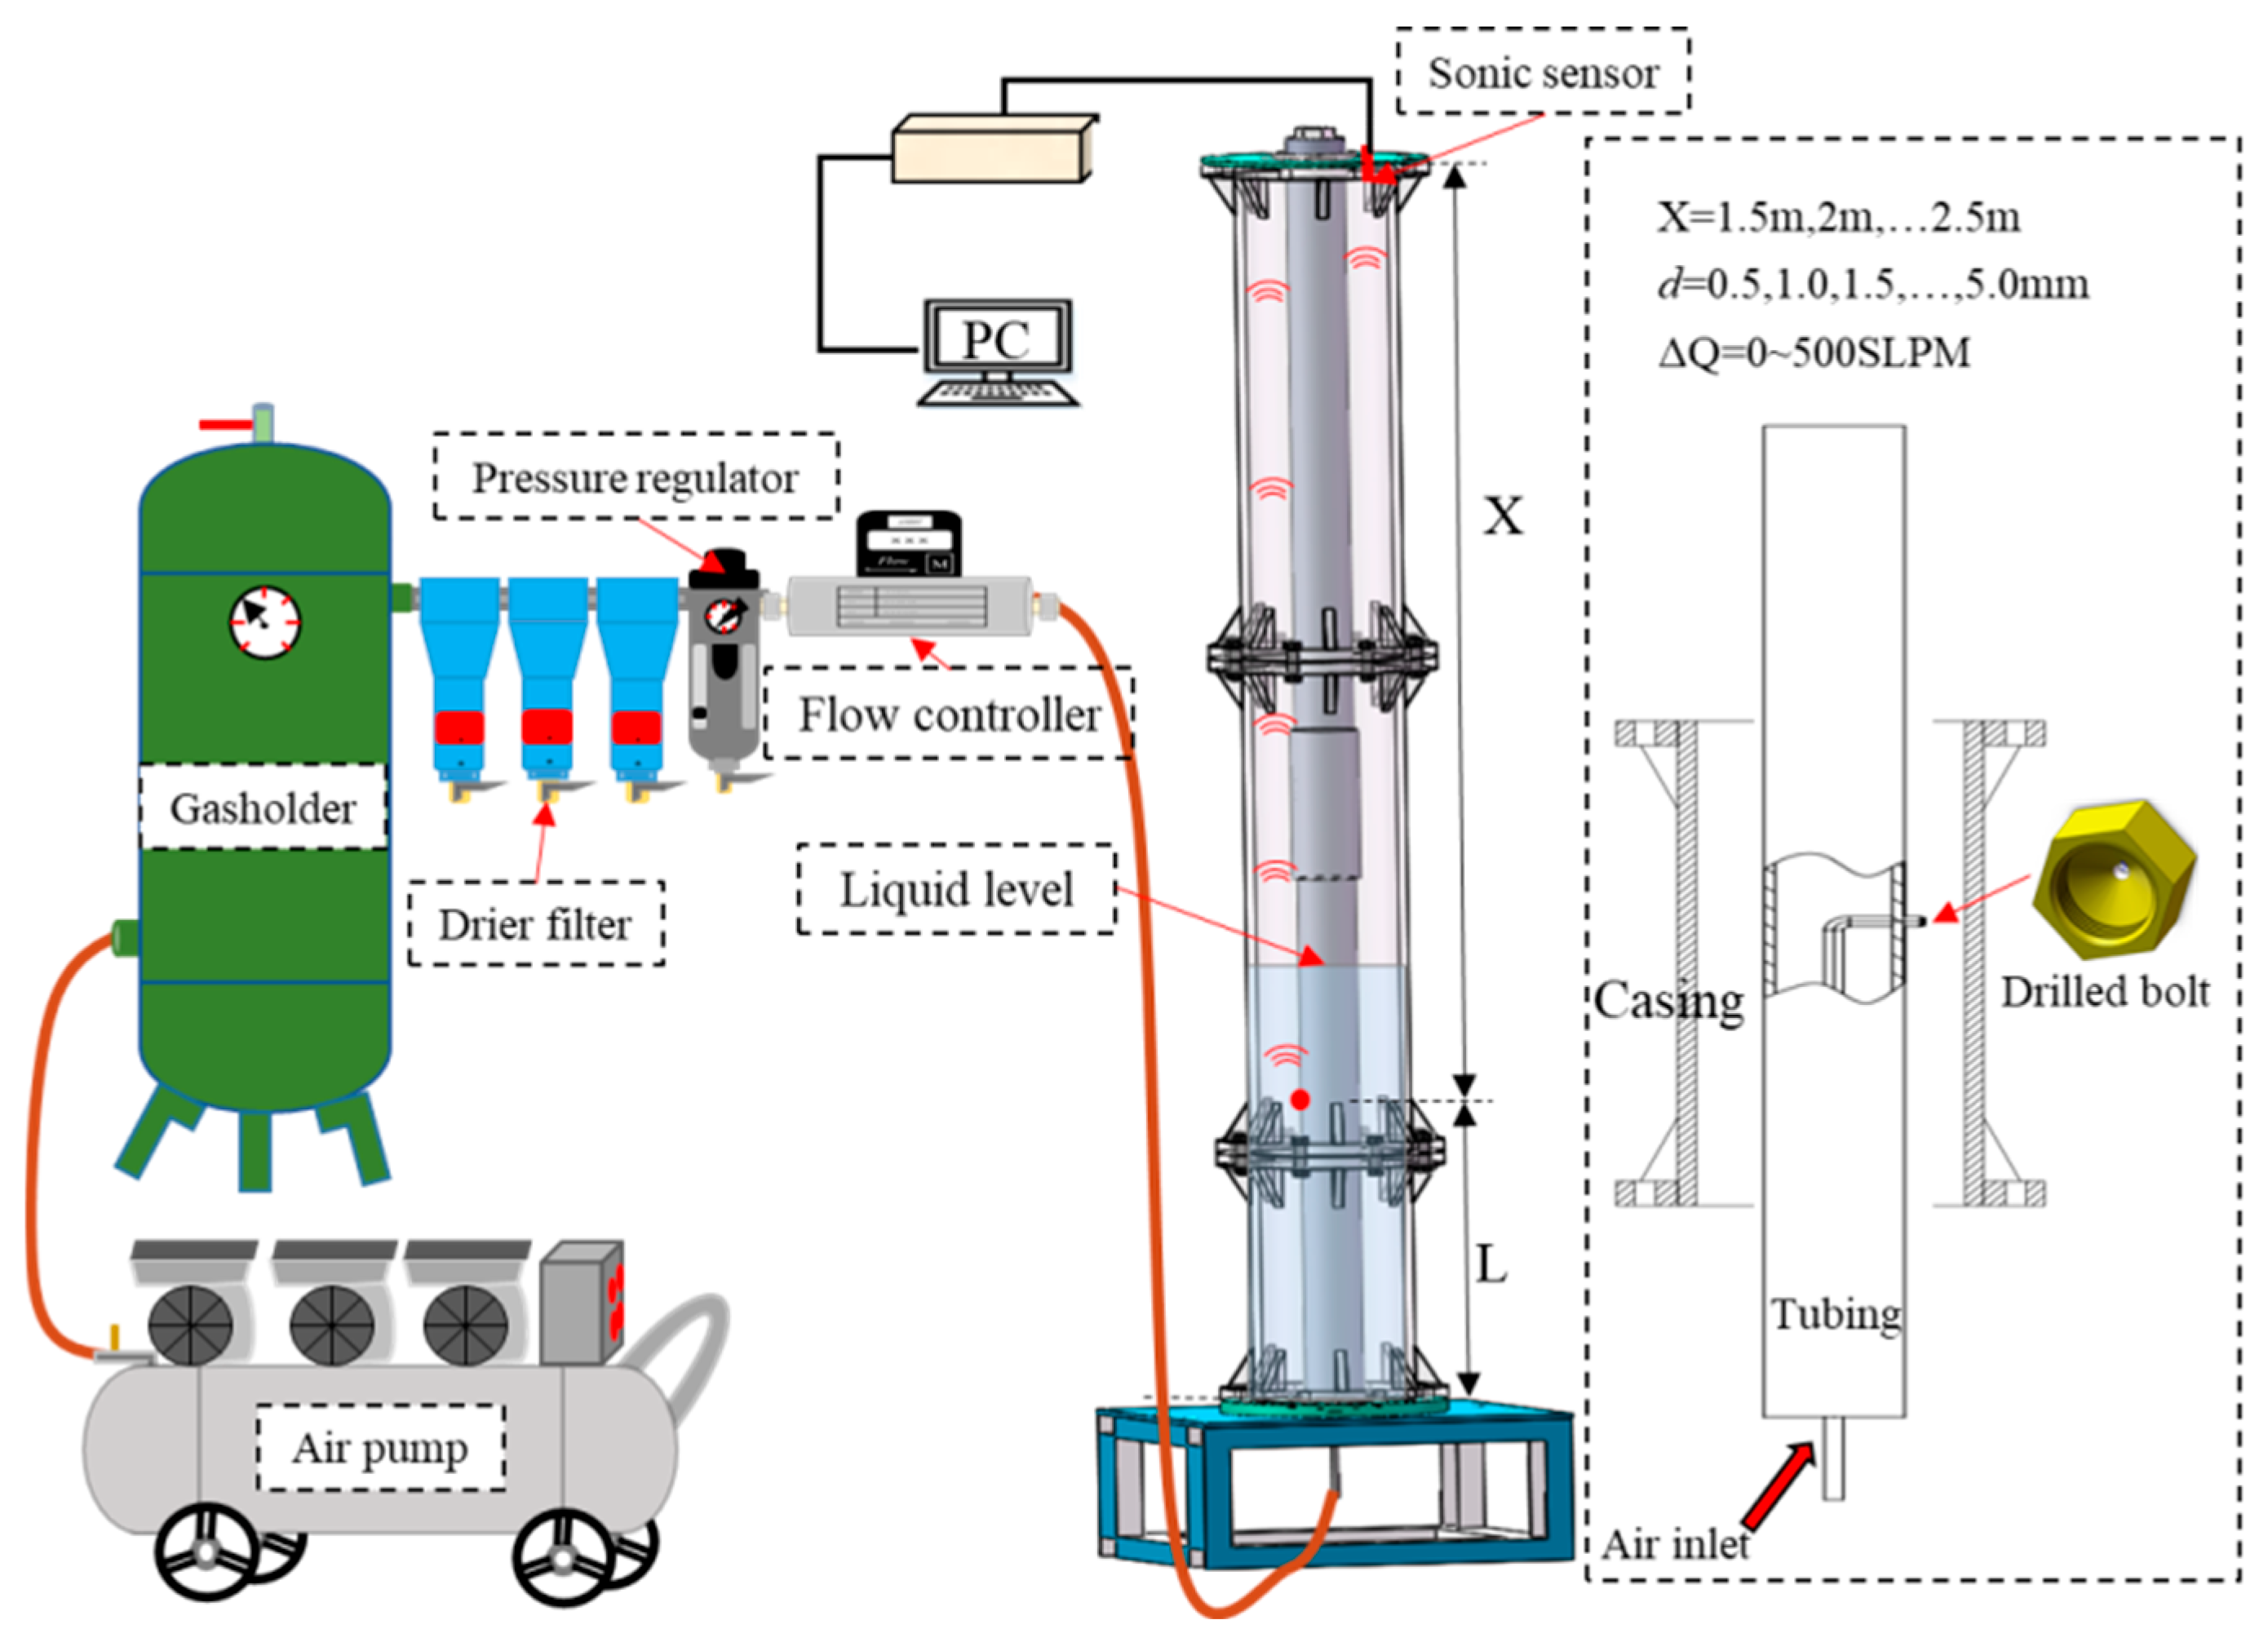
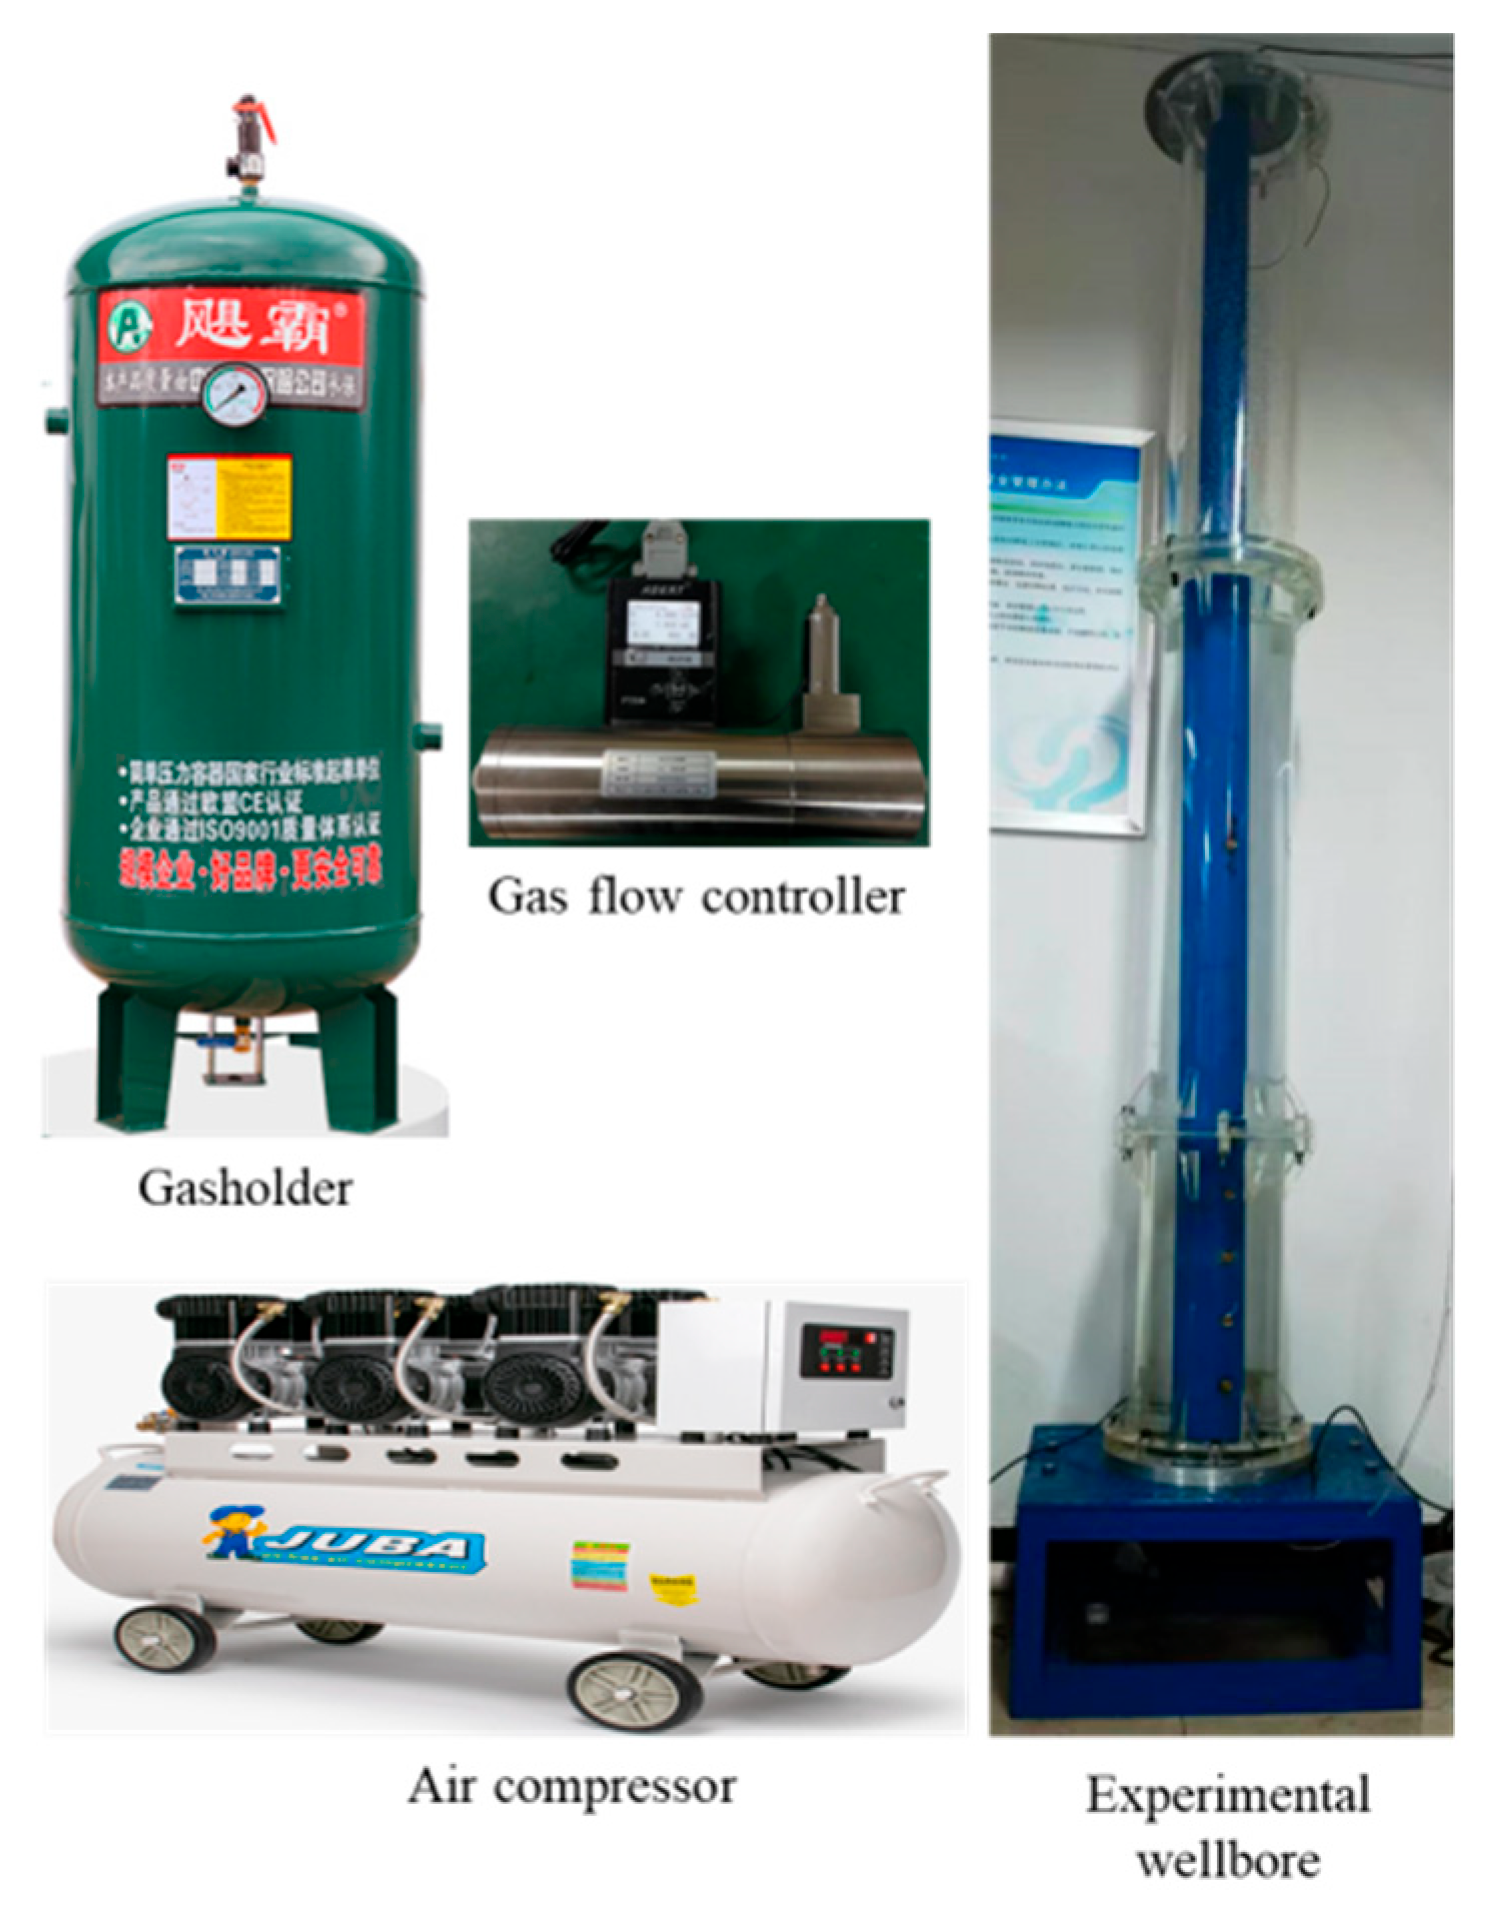
2.1. Casing Leakage Simulation Experimental System

To investigate surface-based acoustic monitoring methods for downhole tubing leakage diagnosis, a series of wellhead acoustic detection experiments were conducted. The existing tubing leakage simulation system (Figure 1) is a full-scale setup capable of high-pressure, high-flow-rate leakage localization experiments [22]. However, it presents several limitations:
  • High gas supply demand: Full-scale tubing requires substantial gas reserves, making flow stability difficult to maintain, which significantly interferes with leakage acoustic signals.
  • Submerged leakage simulation challenges: Conditions with leakage points below liquid levels are poorly replicated.
  • Leakage orifice control issues: Precise positioning and sizing of leakage holes are hard to achieve, and frequent replacements are impractical.
  • Safety risks: High-pressure gas leakage experiments pose hazards, and repeated pipe disassembly compromises sealing integrity at connections.
To address the aforementioned issues, the optimized tubing leakage simulation system is shown in Figure 2. First, the simulation system maintains geometric similarity with production wellbore structures: it faithfully replicates the actual dimensions of tubing and casing while adopting a vertical configuration to facilitate the creation of leakage conditions below the annular protection fluid. Second, the system achieves dynamic similarity in gas migration into the annulus: leakage gas flows upward, driven by gravity (with additional buoyancy for leaks below the liquid level) and pressure differentials, mirroring field conditions. Third, power source similarity is ensured: while production wells rely on downhole high-pressure gas reservoirs, the simulation system utilizes a pressurized gas tank as its driving source.
The full-scale casing/tubing assembly features a substantial internal volume, requiring significant gas source pressure and volume to maintain stable internal flow conditions over extended periods—a requirement difficult to meet in laboratory settings. Since this study primarily focuses on investigating flow field characteristics within the annulus and acoustic field distribution patterns, we implemented multiple gas supply lines connected directly to perforated bolts inside the tubing. This configuration dramatically reduces gas consumption while avoiding interference with leakage gas flow in the annulus. By selectively connecting different gas supply lines within the tubing, researchers can modify both leakage locations and the number of leakage points as needed. Leakage aperture sizes are controlled by replacing perforated bolts with different bore diameters.
During propagation through the annular space, sound attenuation results not only from gas absorption but also from friction with the casing/tubing walls [23]. The system components are detailed in Table 1. The data reveal that within the 0–500 Hz frequency range, gas absorption causes attenuation coefficients between 10−7 and 10−2 dB/m, wall friction contributes coefficients of 10−4~10−3 dB/m, and their combined effects yield 10−4~10−2 dB/m. Downhole tubing leakage generates broadband noise with an initial sound pressure around 100 dB, which increases with the leakage flow rate. The CRY372 acoustic sensors selected for experiments have a minimum detectable pressure of 25 dB, indicating that 100 dB leakage noise theoretically propagates over 3.75 km. Consequently, the scaled experimental system based on similarity principles effectively simulates the acoustic characteristics of kilometer-deep tubing leaks.
Figure 3 shows the physical diagram of the experimental system for acoustic detection of casing/tubing leaks, with corresponding pipe and equipment parameters listed in Table 1. The operational procedures are as follows:
(1)
Start the air compressor and shut it down when the buffer tank pressure reaches 0.7 MPa, preventing motor noise interference during compression from affecting the leakage acoustic experiments;
(2)
Open the pipeline valve between the buffer tank and the simulated wellbore, then activate the filter pressure regulator and set the output pressure to 0.5 MPa. Turn on the gas flow controller and set the output flow rate;
(3)
For leak-free experiments, ambient noise serves as the system background noise;
(4)
For tubing leakage experiments, compressed air flows from the buffer tank through the pipeline, sequentially passing through the desiccant filter, filter pressure regulator, gas flow controller, and finally jets into the annulus through the tubing leakage orifice.

2.2. Experimental Program

(I)
Experimental Objectives and Content
  • Objectives: Investigate the acoustic characteristics of tubing leakage in the annulus under various conditions.
  • Content: Based on leakage scenarios, the study focuses on five aspects:
    Leakage rate: Impact on acoustic characteristics.
    Leakage aperture size: Influence on acoustic signatures.
    Leakage depth: Effect on sound wave propagation.
    Number of leakage points: Relationship with acoustic response.
    Leakage position: Comparative analysis of leaks above vs. below the liquid level.
(II)
Experimental Procedure
As shown in Figure 4, prior to conducting the acoustic detection experiment for tubing leakage, the following preparatory steps must be performed: First, connect all pipelines and electrical circuits of the system components. Then, systematically inspect both the sealing integrity of gas pipelines and the parameter configuration of the signal acquisition system. Particularly noteworthy, since the research focuses on leakage acoustic signals, it is imperative to ensure hermetic sealing at all gas pipeline connections to minimize interference from extraneous leakage noise on experimental results. Upon confirming proper connection and normal functionality of all systems, activate the air pump to pressurize the buffer tank to its rated pressure of 0.7 MPa, then deactivate the pump to maintain a silent operational state.
Before acoustic detection experiments for tubing leakage, the following procedure shall be strictly followed: First, activate the gas flow controller for a 5 min warm-up period. During this interval, ambient noise signals may be collected as baseline acoustic data under leak-free conditions. All signal acquisitions maintain identical durations of 5 s. After the 5 min warm-up, configure the gas flow meter control parameters and then open the gas supply.
When conducting acoustic detection experiments under different leakage flow-rate conditions, first adjust the input pressure of the flow controller to stabilize it at 0.5 MPa using the pressure regulating valve. Then, activate the gas flow controller and collect noise data from the annular space after ensuring the gas flow controller readings stabilize.
Prior to acoustic detection experiments with different leakage aperture sizes, replace the original bolt with a pre-designed perforated bolt. Subsequently, use the pressure regulating valve to adjust the input pressure of the flow controller and maintain it at a fixed value. After completing these preparations, activate the gas flow controller and collect noise data from the annular space once the readings stabilize.
Similarly, before conducting acoustic detection experiments with different leakage locations and varying numbers of leakage points, switch the gas source inlet to the gas pipe connected to the leakage hole on the tubing wall. The principle is illustrated in Figure 2. Subsequently, repeat the aforementioned steps.
Critical operational requirement: The buffer tank pressure must remain above 0.5 MPa throughout all experimental groups; otherwise, unstable input pressure at the pressure regulating valve will directly compromise leakage acoustic measurement accuracy. The experimental parameter designs for various leakage scenarios are detailed in Table 2.

3. Acoustic Source Characteristics of Tubing Leakage

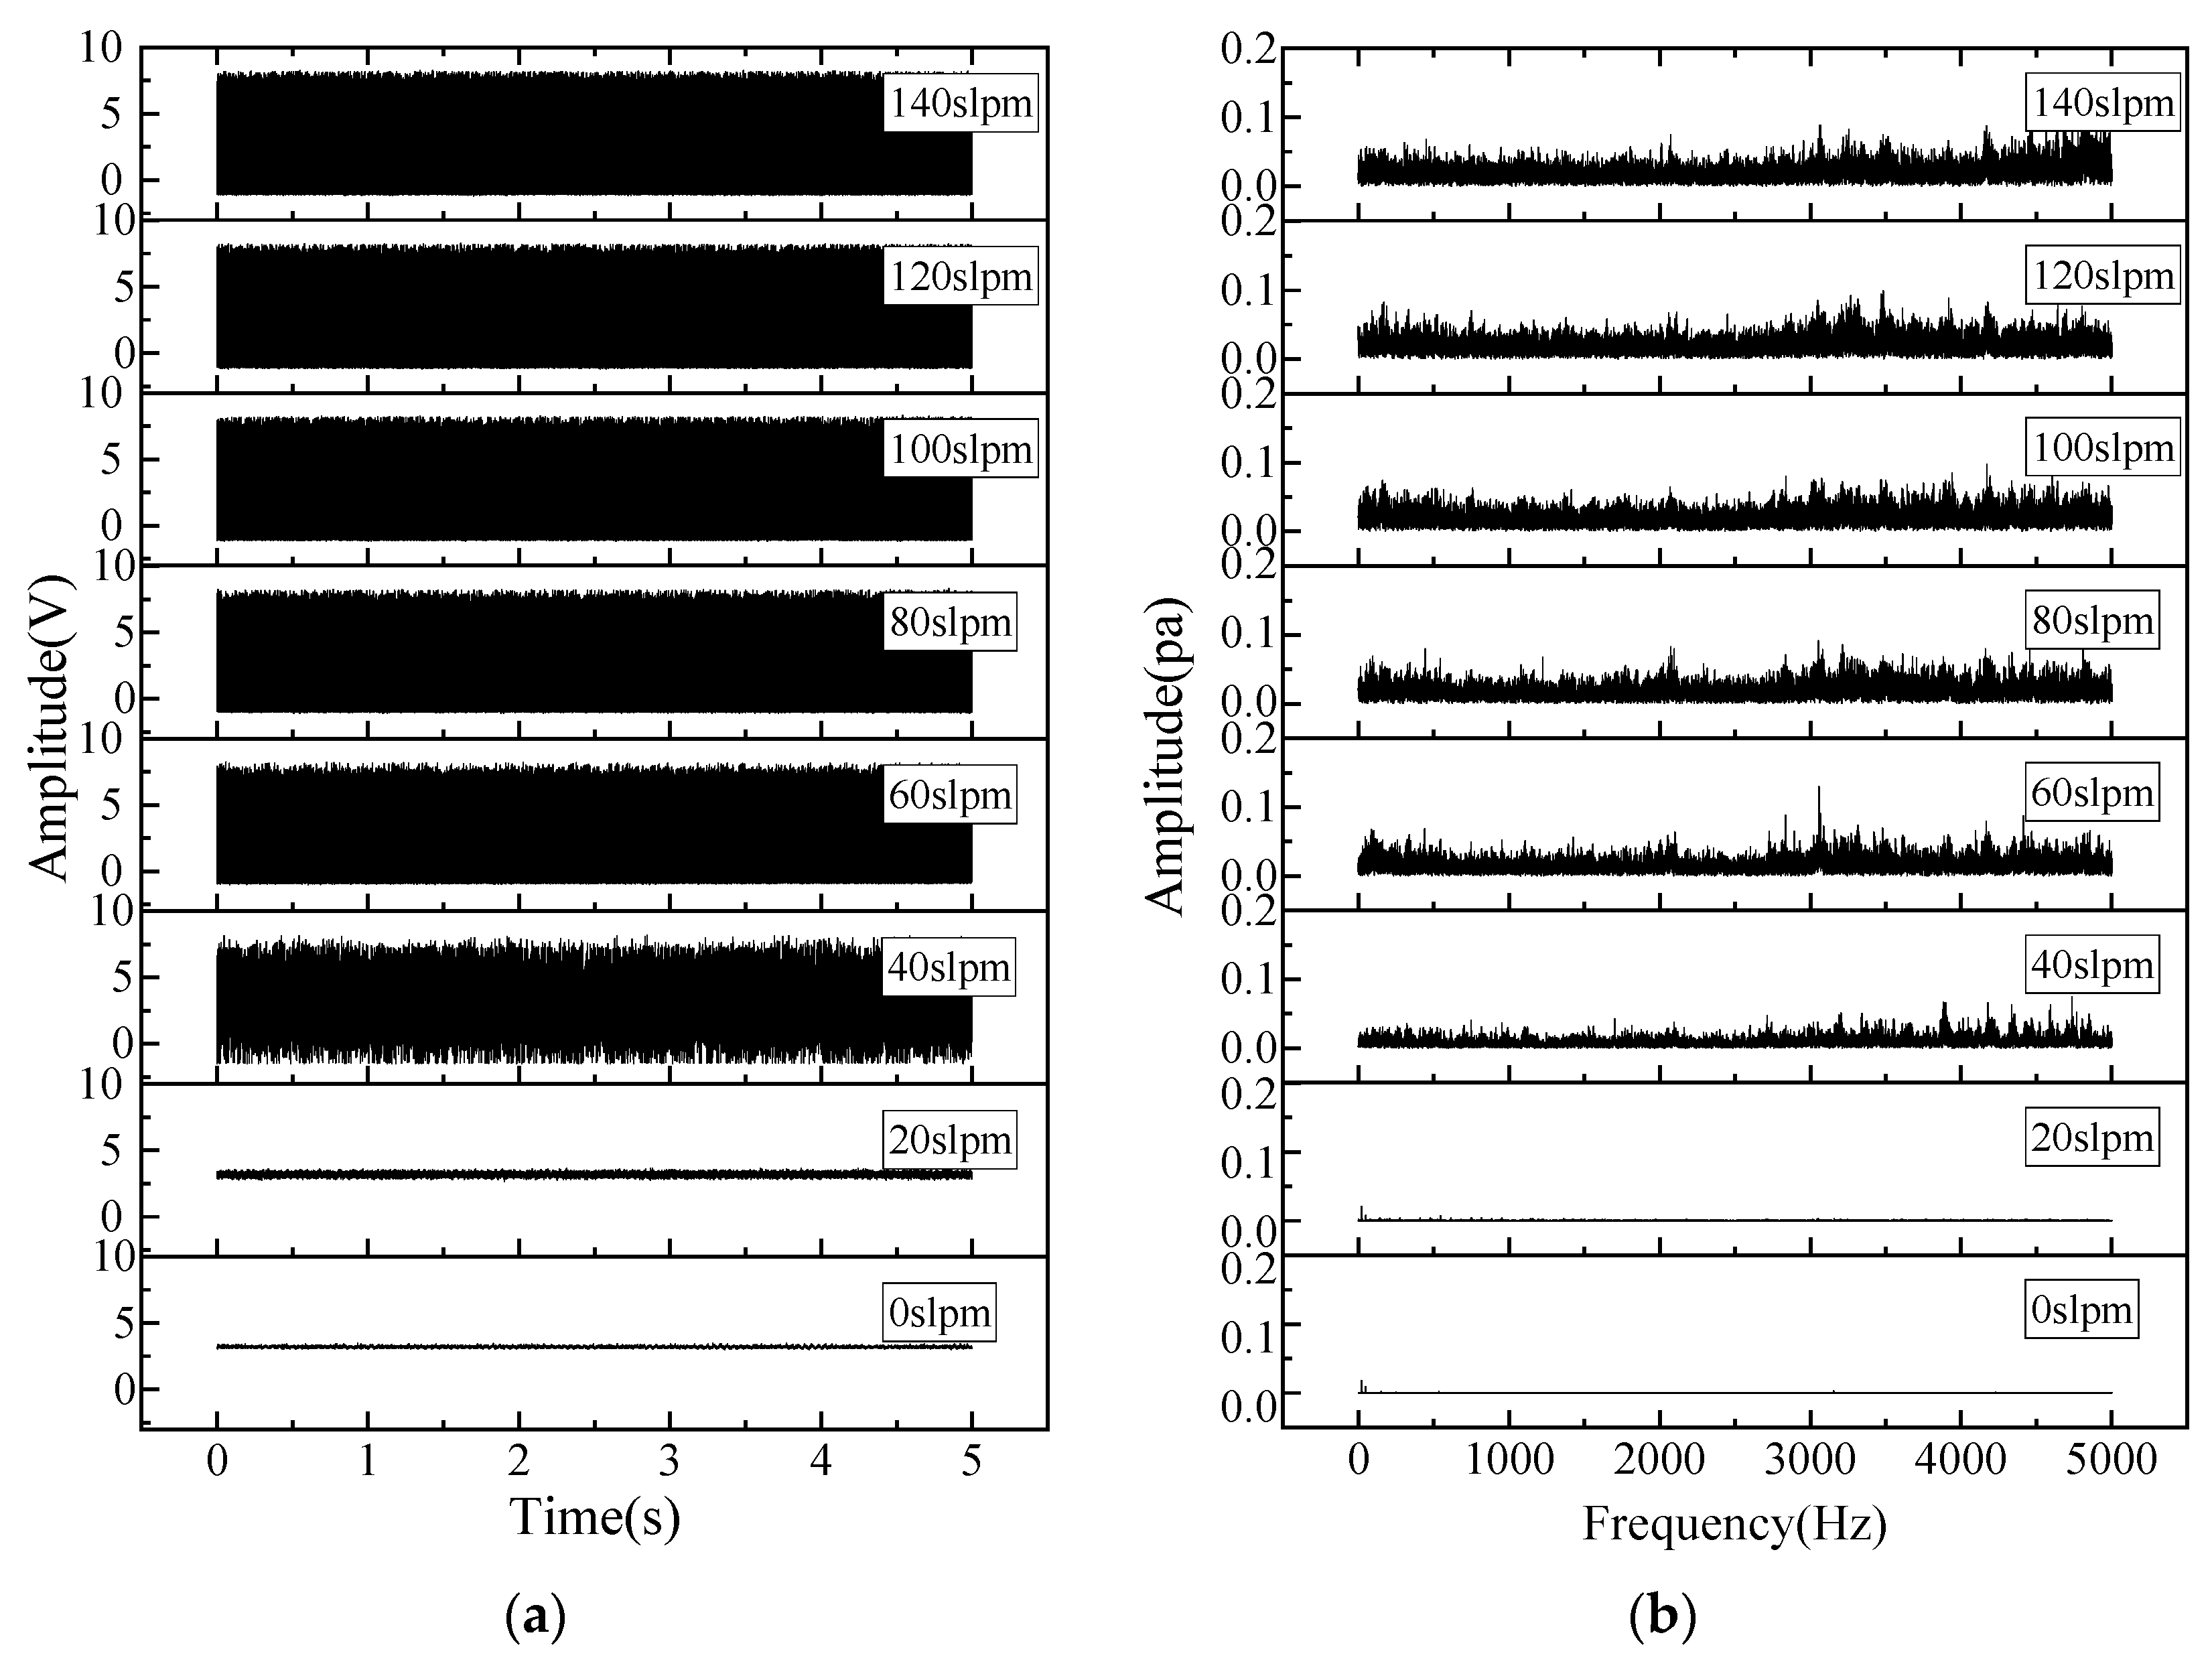
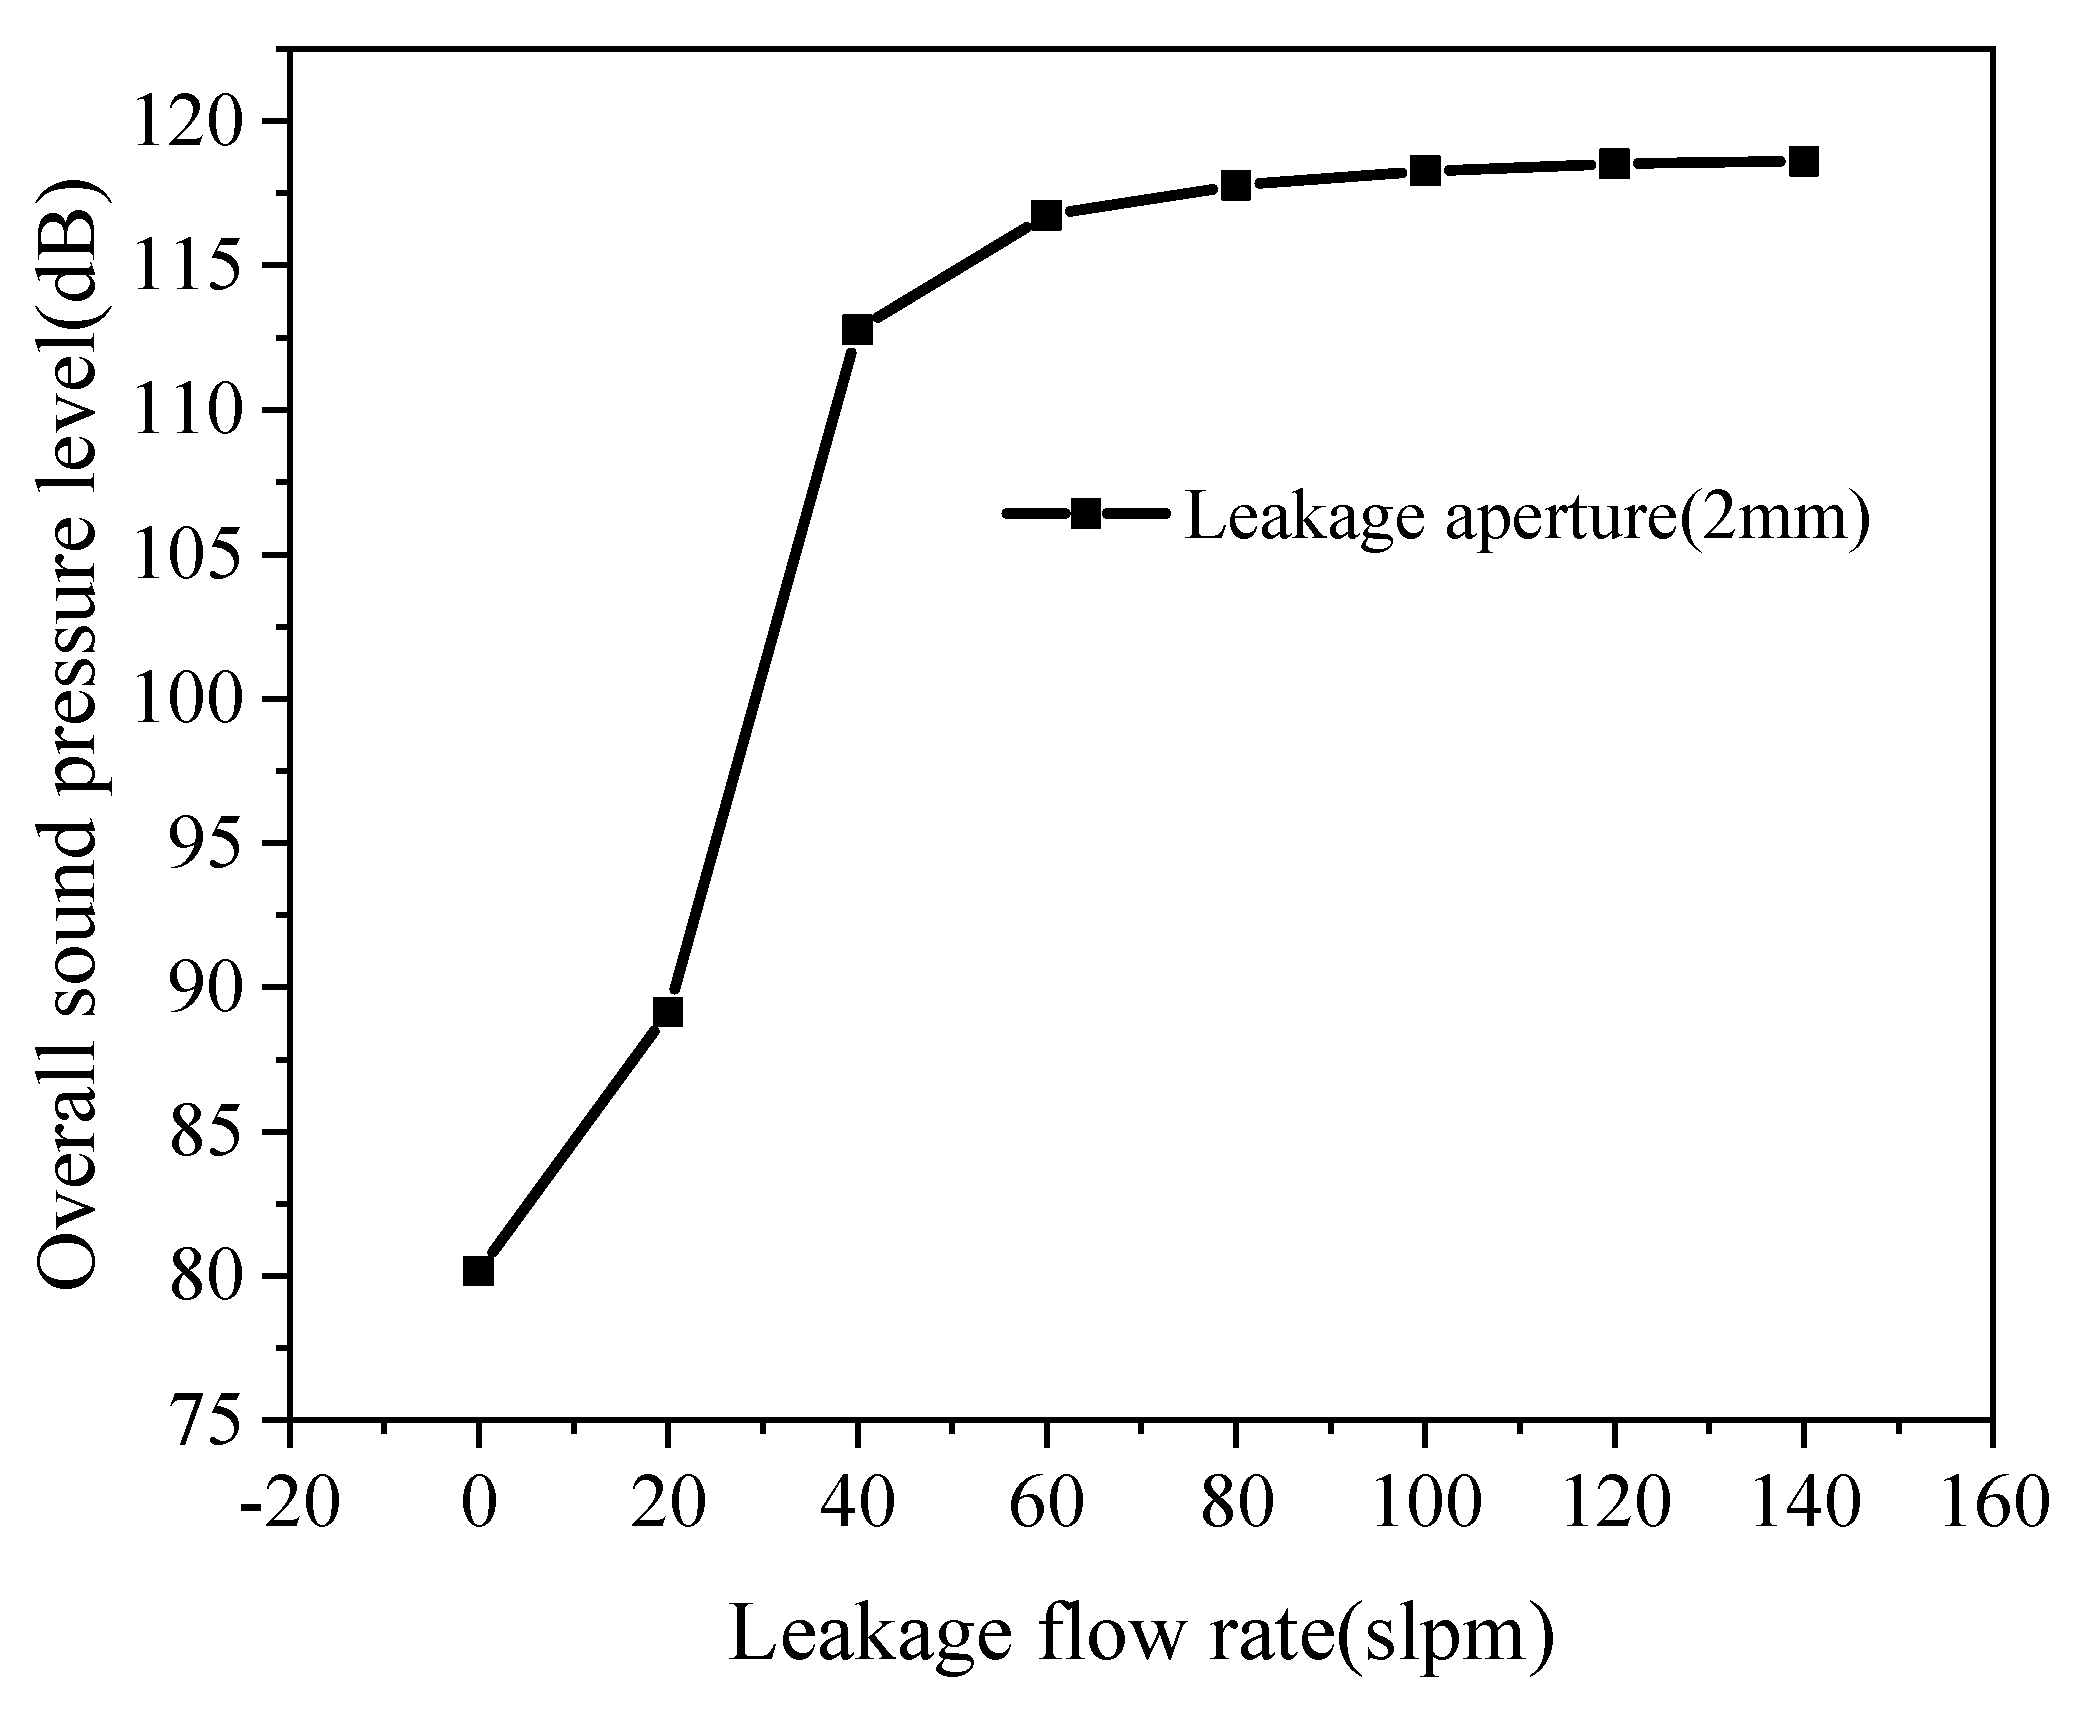
3.1. Influence of Leakage Flow Rate on Acoustic Characteristics

Taking a 2 mm leakage aperture as an example, Figure 5 demonstrates the time–frequency characteristics of leakage noise when the leakage flow rate is controlled within the 0–140 SLPM range (all time–domain signals use a 5 s time window, and the frequency–domain signals are obtained through Fast Fourier Transform (FFT) processing of the time–domain signals. The same applies hereinafter). The figure reveals two key observations: (1) The amplitude of leakage noise energy increases with higher flow rates, and (2) the broadband noise exhibits progressively stronger high-frequency components at elevated flow rates.
According to established noise spectrum calculation methods [24,25], under constant aperture conditions, the peak value of the noise spectrum shows direct proportionality to the leakage rate. Figure 6 presents the corresponding curve of total sound pressure level (SPL) versus flow-rate variation, showing that while the overall SPL increases with flow rate, its growth rate significantly decelerates beyond certain flow rates. This phenomenon stems from two physical mechanisms: First, the relationship between total SPL and leakage flow rate is inherently nonlinear. Second, given fixed pressure differentials, a 2 mm aperture has a maximum achievable flow capacity—beyond this threshold, the gas flow controller loses regulation capability.

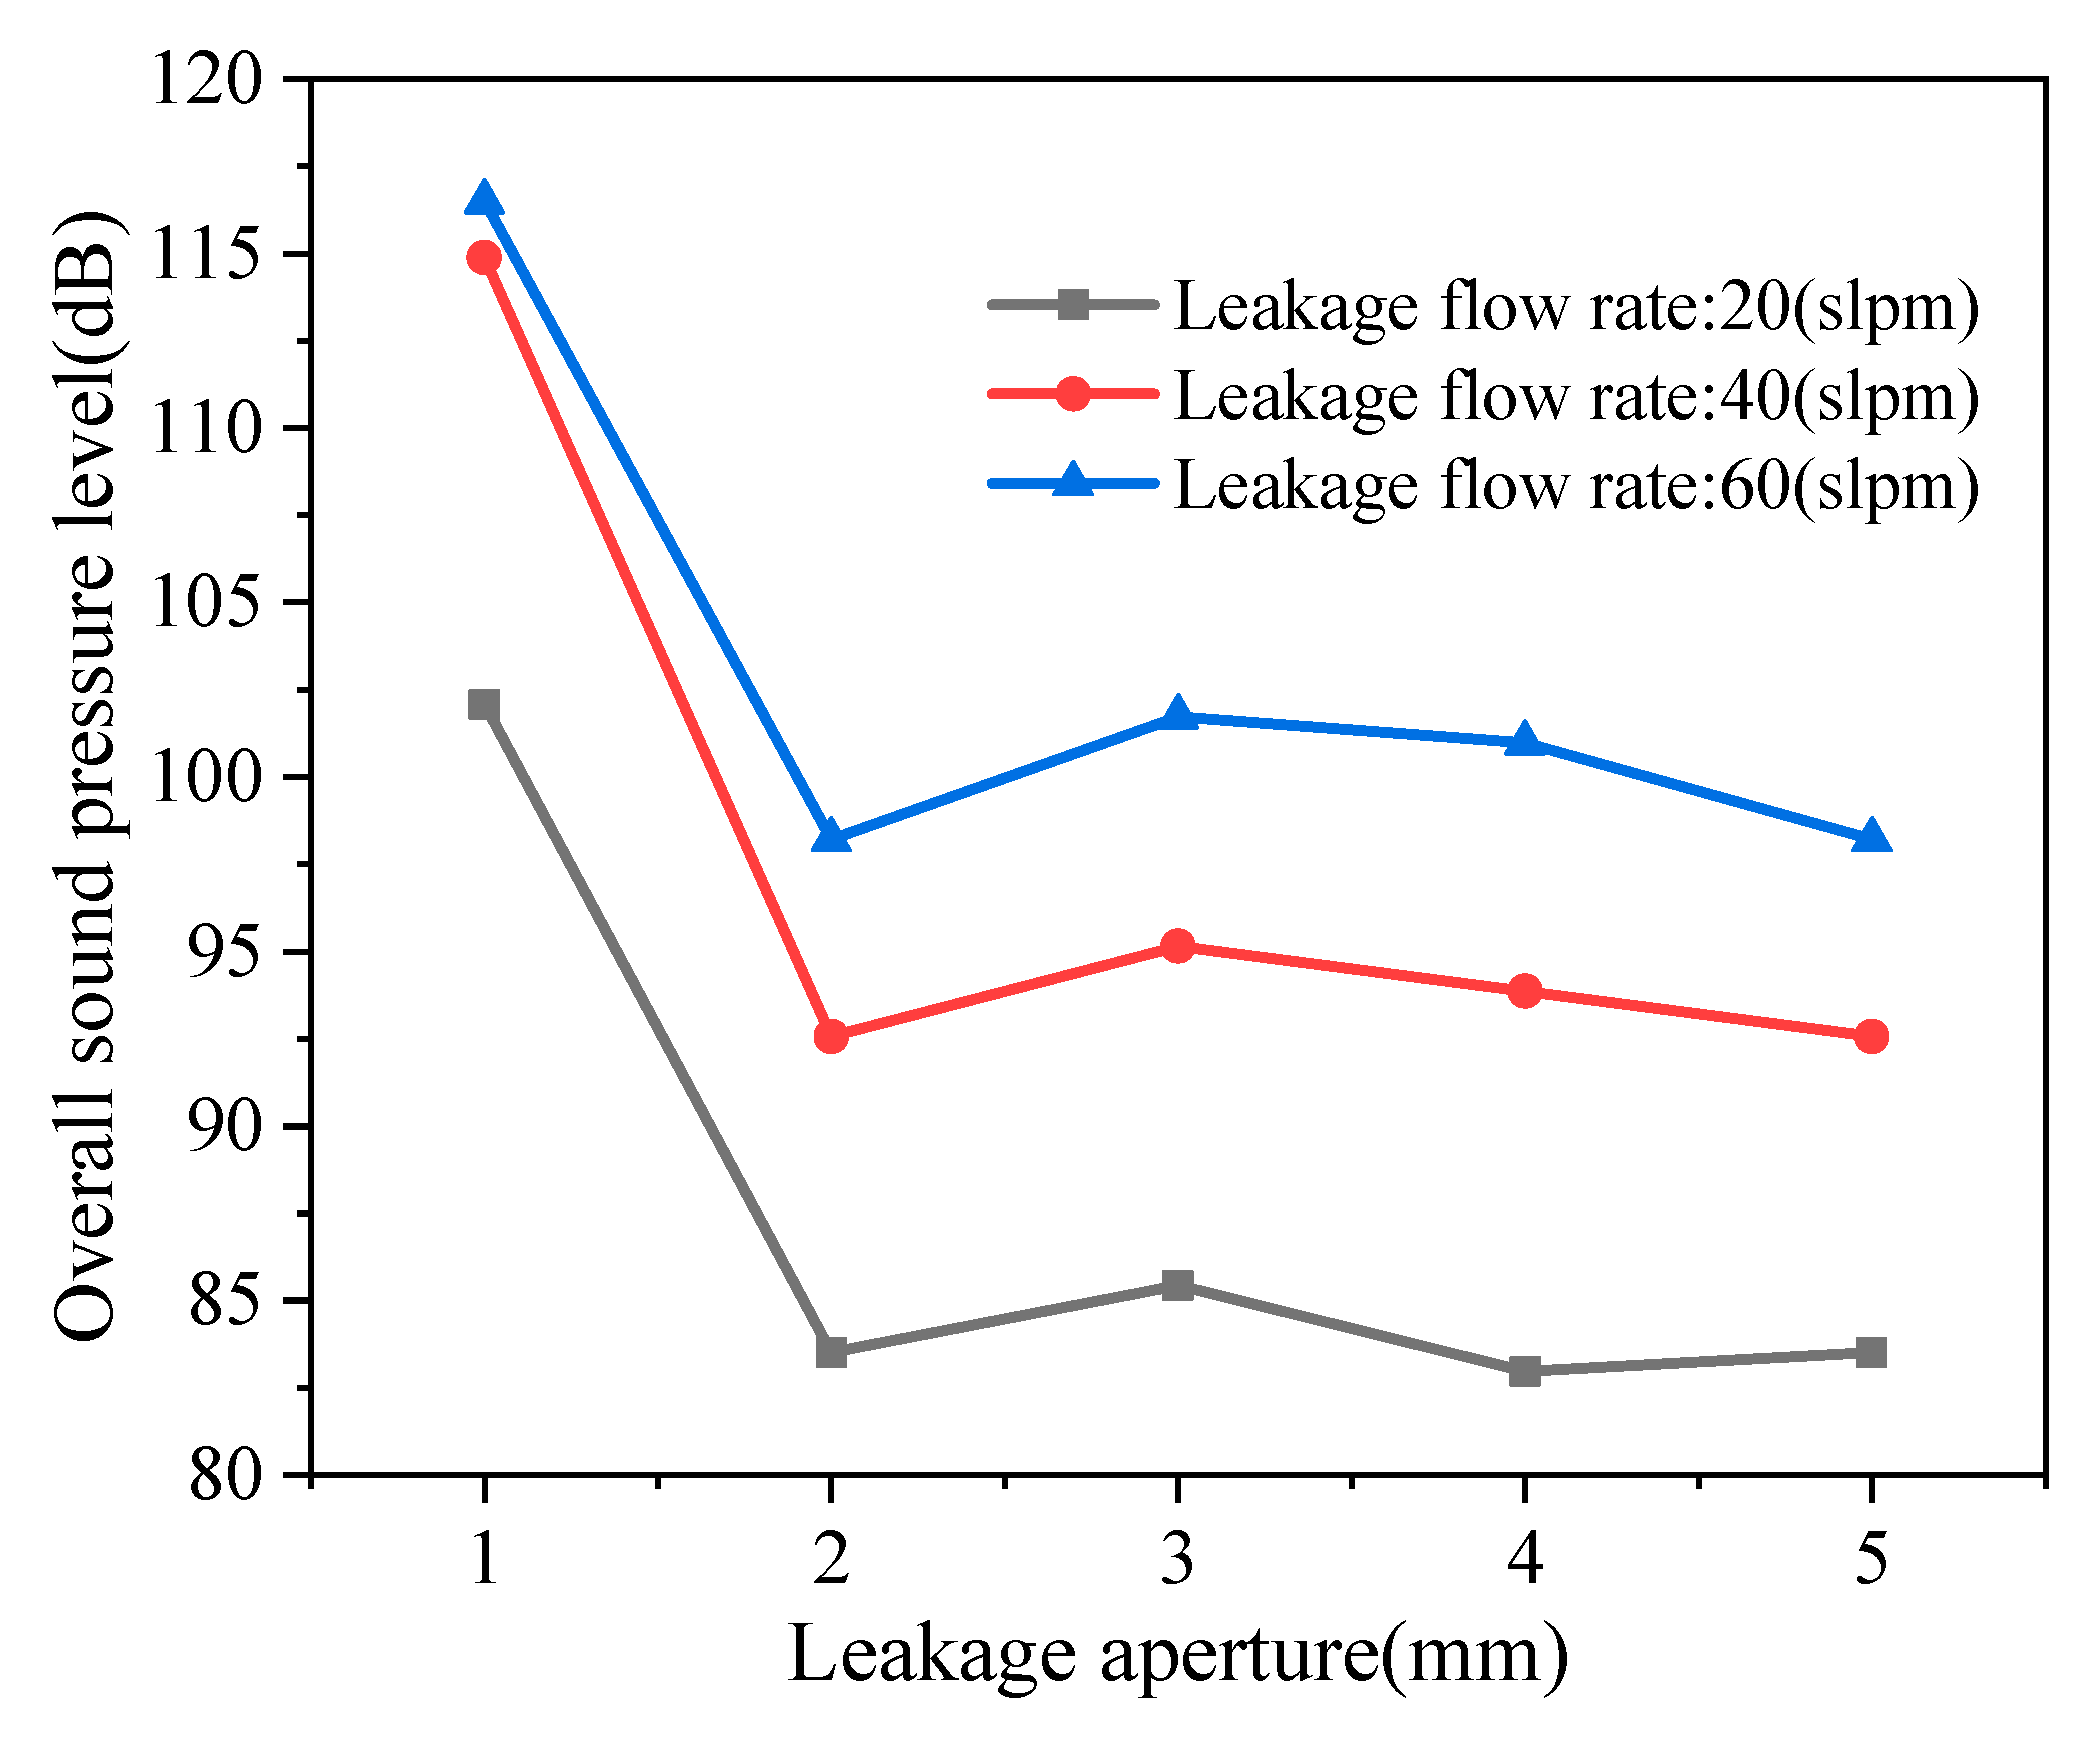
3.2. Influence of Leakage Aperture on Acoustic Characteristics

The leakage aperture is one of the key factors affecting the acoustic characteristics of leakage. Taking a leakage flow rate of 60 SLPM as an example, Figure 7 shows the time–frequency distribution of leakage noise under different aperture sizes. The figure reveals that under the same flow-rate conditions, the amplitude of leakage noise decreases as the aperture size increases. This occurs because when the gas flow controller maintains a constant output flow rate, a larger aperture results in a smaller instantaneous flow through the leakage hole.
Cross-referencing with Figure 5, it can be seen that lower leakage flow rates correspond to reduced leakage noise energy. The corresponding curve of total sound pressure level (SPL) versus aperture size is shown in Figure 8. At the same leakage flow rate, the total SPL of leakage noise generally decreases as the aperture size increases.
In summary, the leakage aperture primarily affects the energy distribution of leakage acoustic waves across different frequency bands, while having minimal impact on the frequency bandwidth of the acoustic waves. Under the same leakage rate conditions, larger leakage apertures result in smaller relative spectral levels of leakage noise.

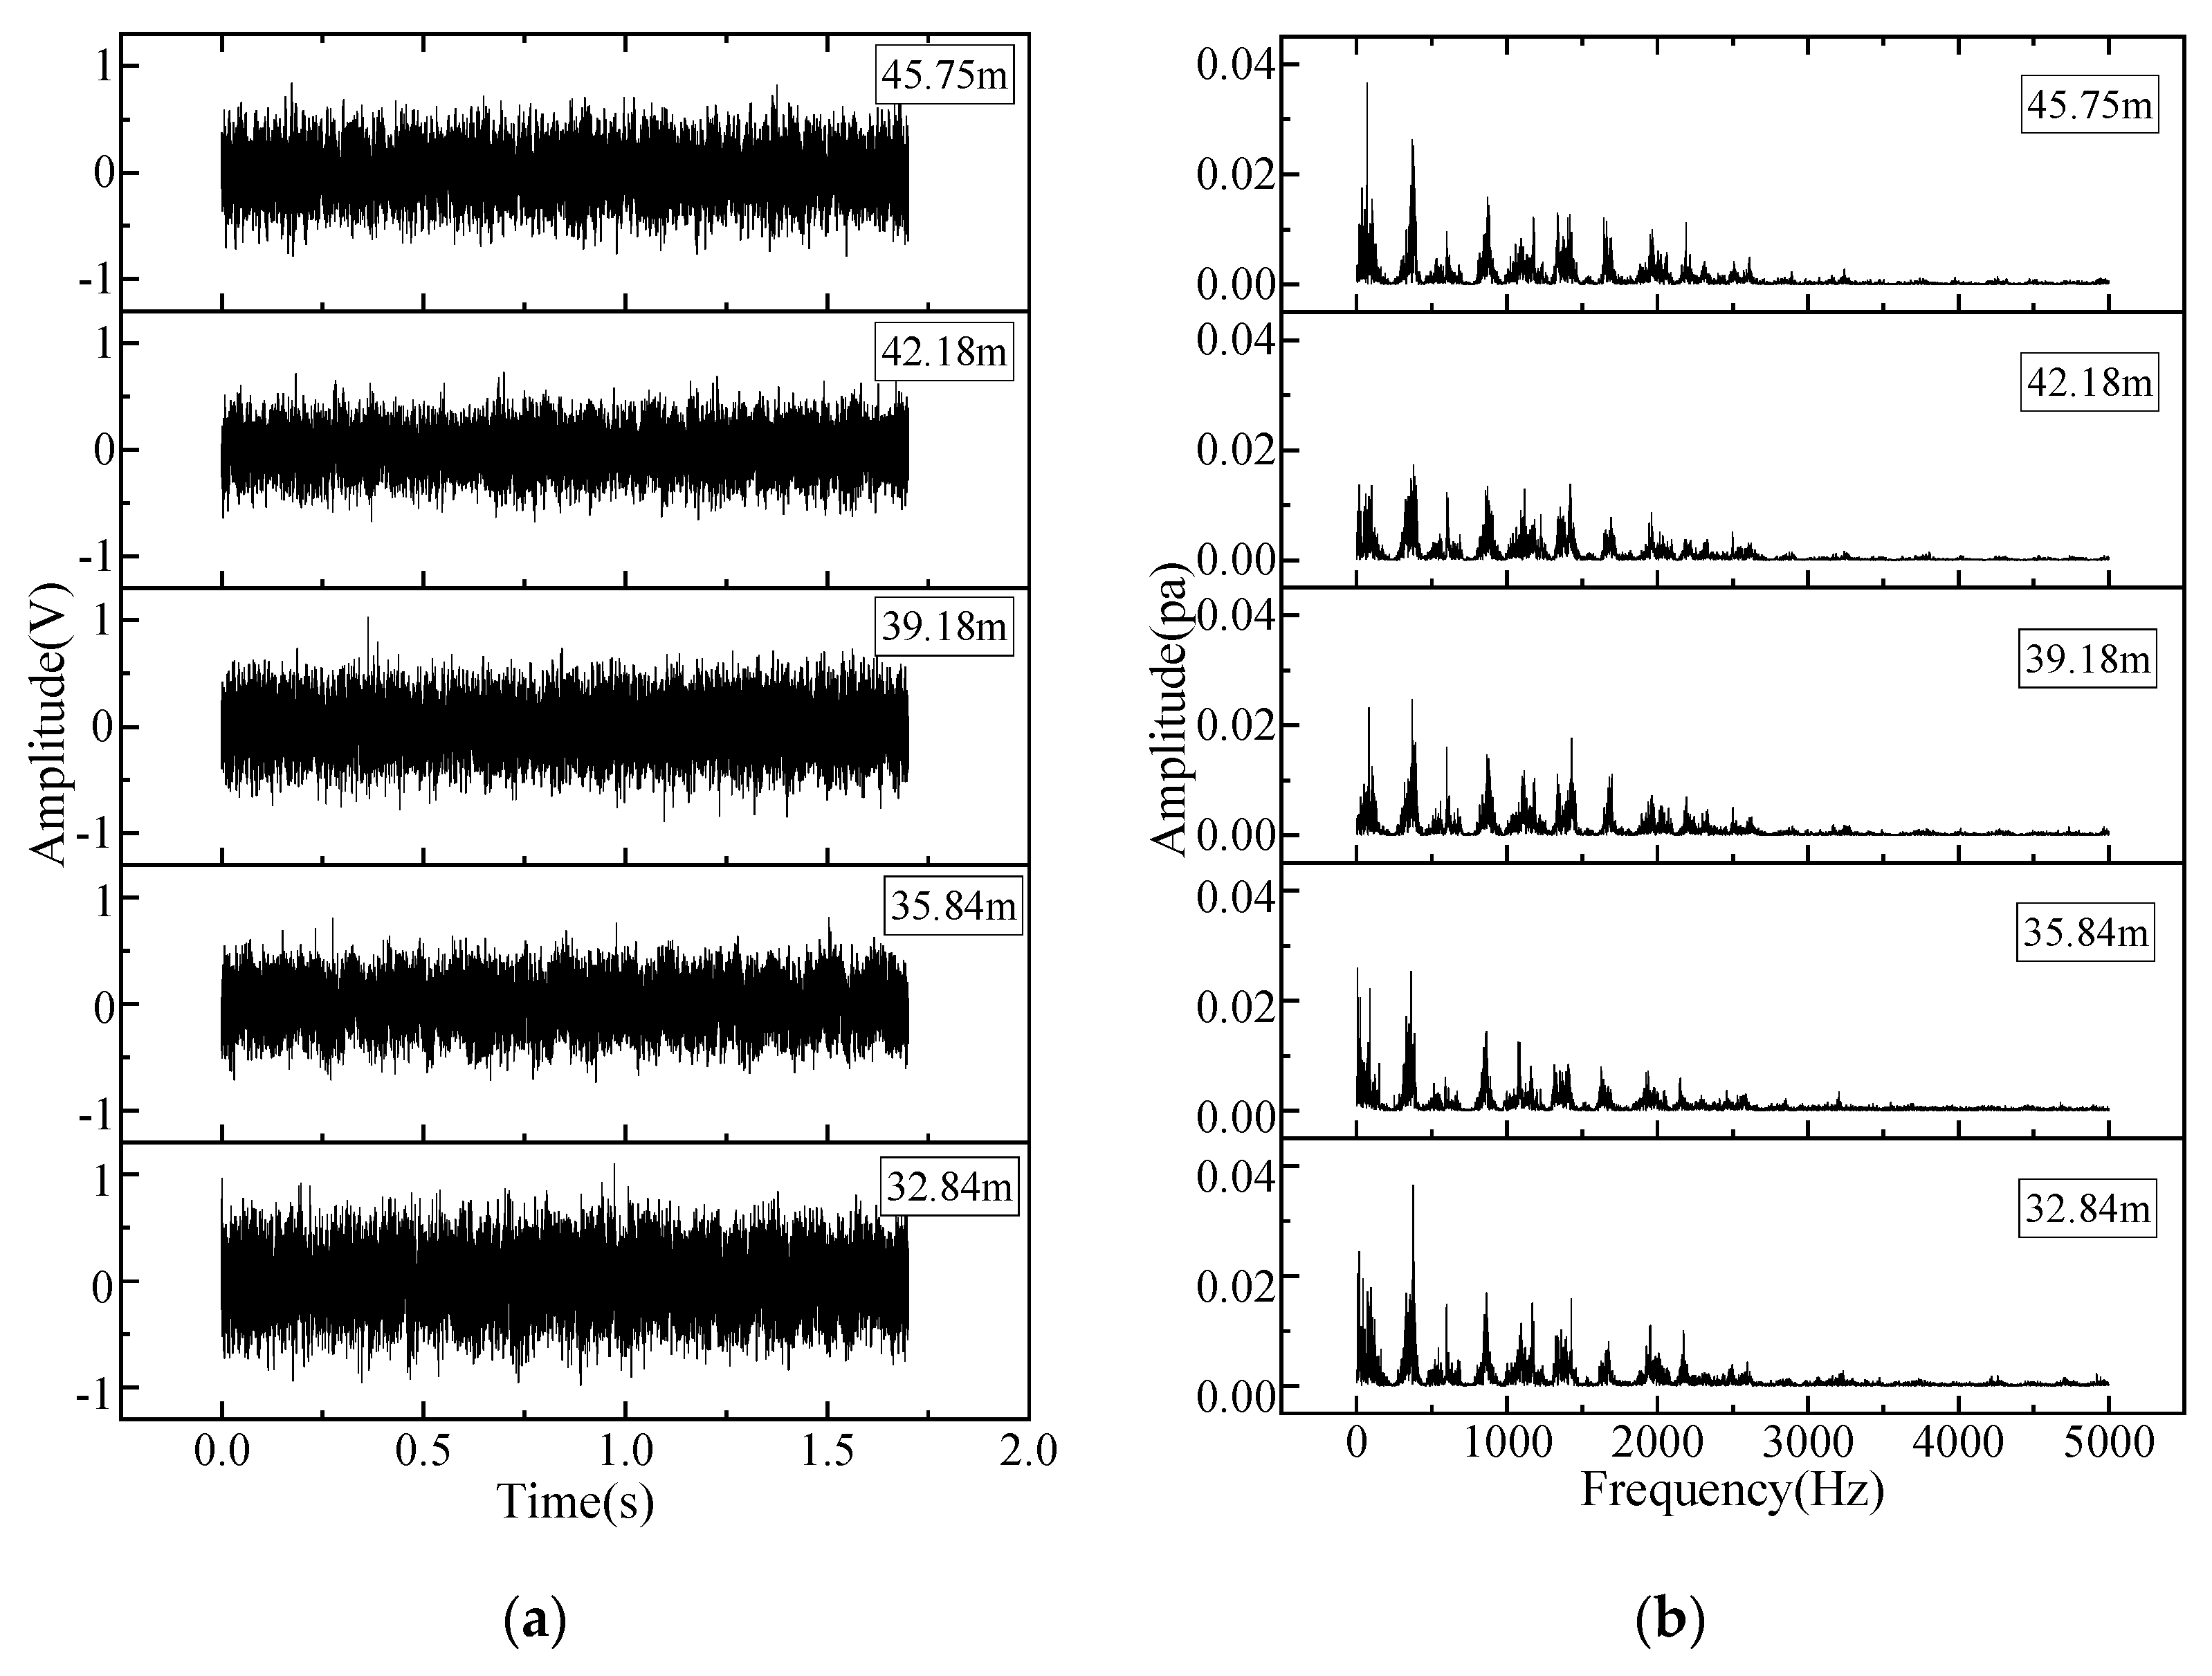
3.3. Influence of Leakage Depth on Acoustic Characteristics

Taking a leakage aperture of 1.5 mm and a pressure differential of 1.0 MPa as an example, Figure 9 presents the time–frequency characteristics of leakage noise at different leakage depths, with experimental data obtained from the simulation system shown in Figure 1. Under the current simulation scale, the time–frequency features of leakage acoustic waves show insignificant variations with changing leakage depths. A notable observation is the presence of distinct impact tones in the frequency spectrum. This phenomenon occurs because large-scale vortices generated by the jet flow impact the inner casing wall, producing impact noise that exhibits discrete characteristics in the frequency domain [25].
The corresponding curve of total sound pressure level (SPL) versus leakage depth is shown in Figure 10. Under constant casing–tubing pressure differentials, the total SPL of leakage noise generally decreases with increasing aperture size. Additionally, the SPL diminishes as the monitoring point moves farther from the leakage location.

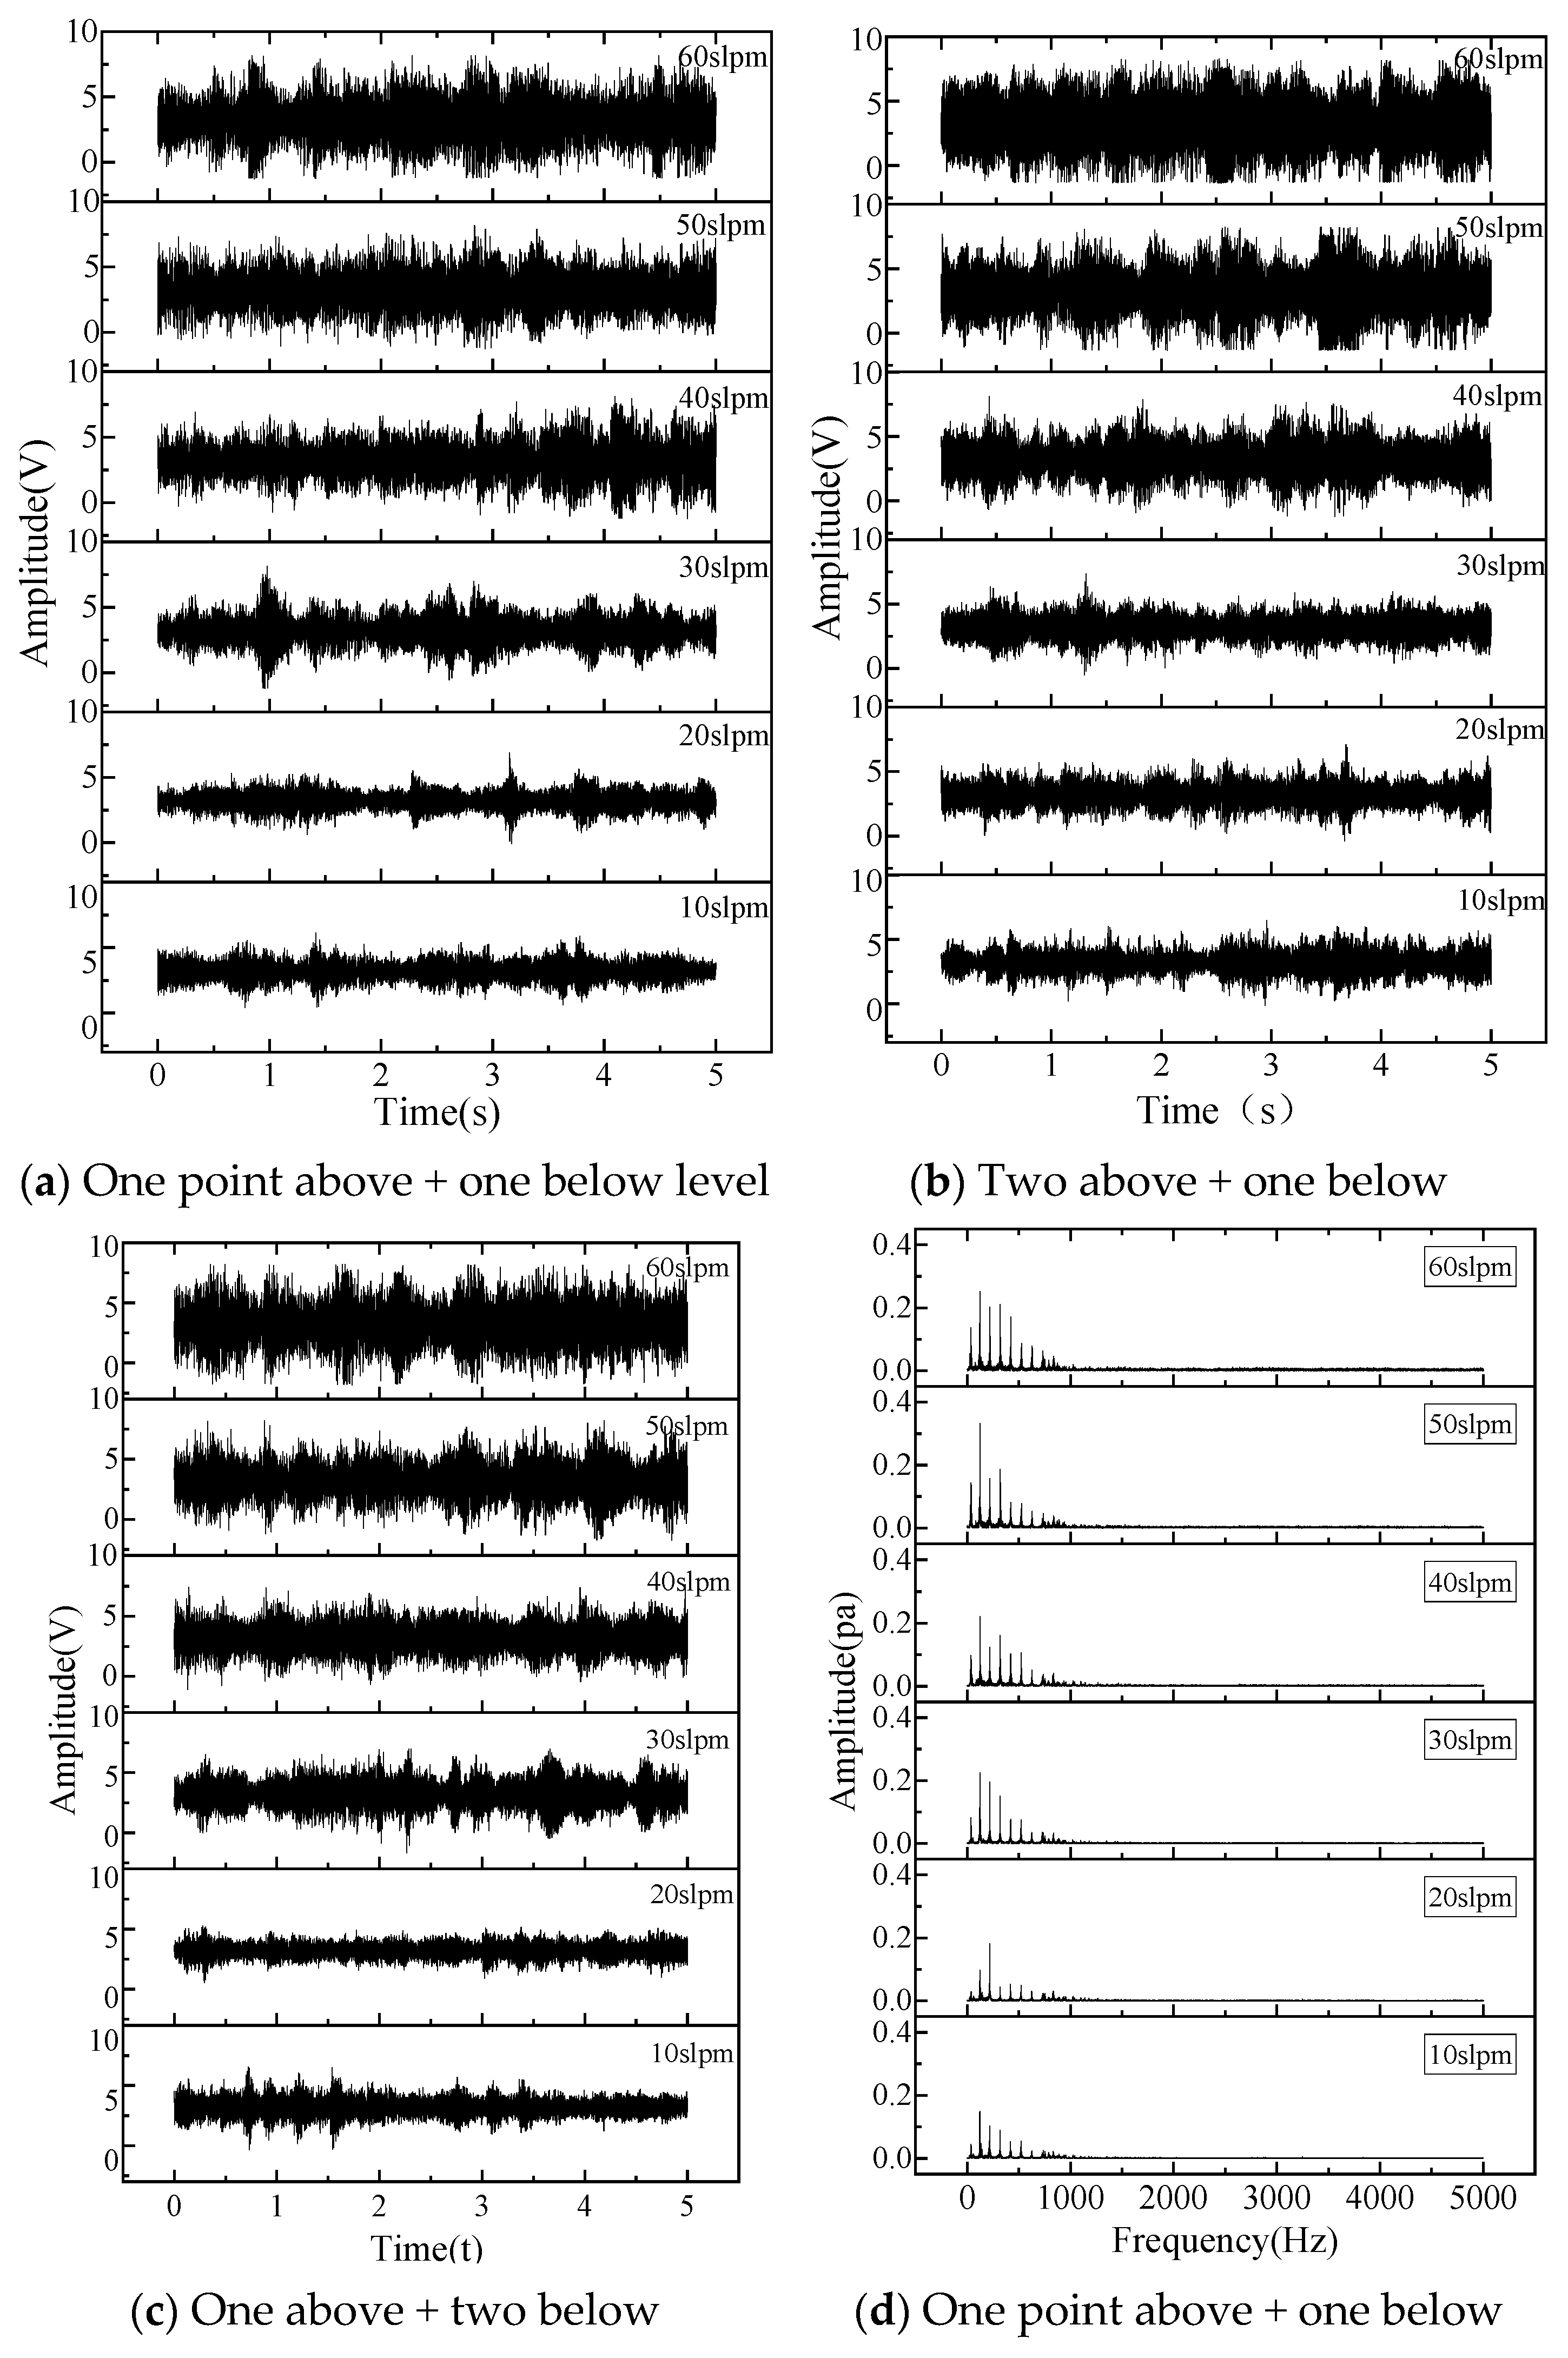
3.4. Effect of Leakage Point Quantity on Acoustic Wave Characteristics

In cases of multiple downhole tubing leaks, Figure 11 demonstrates the time–frequency distribution of leakage noise for 1–3 leakage points (each with 1 mm aperture above the liquid level and an average flow rate of 20 SLPM per orifice). Key findings reveal that (1) The time–frequency amplitude of multi-point leakage noise does not show strict positive correlation with point quantity—notably, two-point leakage exhibits lower amplitude than single-point leakage; (2) This phenomenon occurs because dual leakage sources under these simulation conditions create mutually destructive wave interference, reducing overall signal intensity in the annulus; (3) Similarly, the enhanced energy at 2 kHz and 4 kHz bands for three-point leakage results from constructive interference of superimposed acoustic signals.
Figure 12’s SPL-versus-quantity curve further demonstrates that the wellbore noise’s total sound pressure level does not necessarily increase with more leakage points, as multi-source superposition can produce attenuating effects.

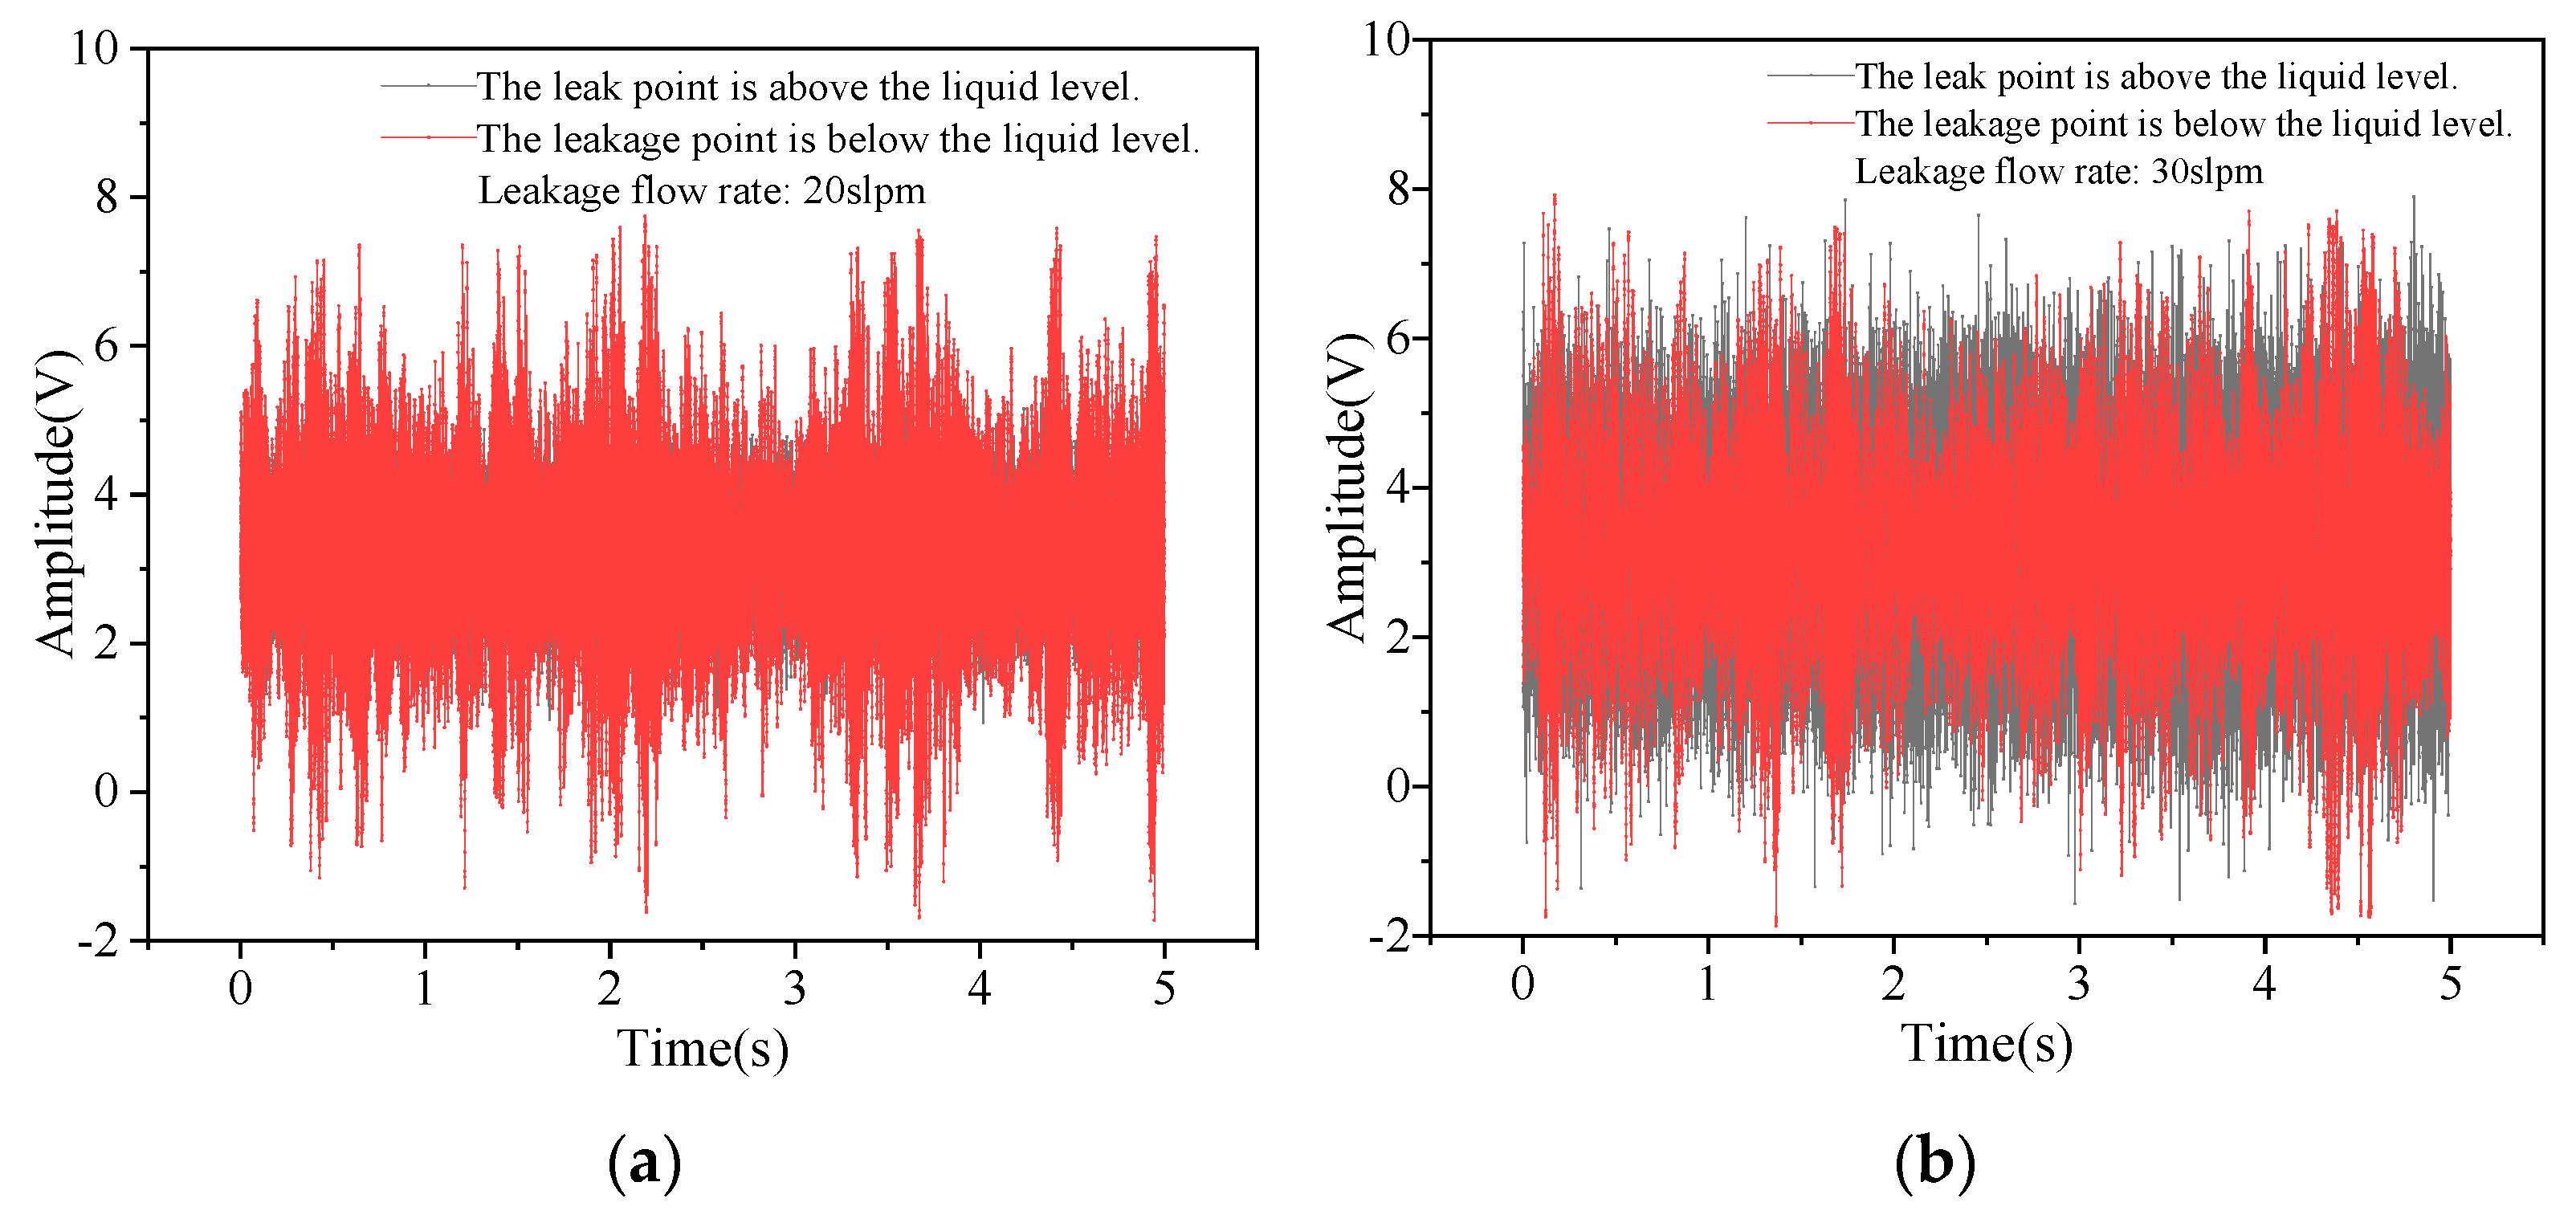
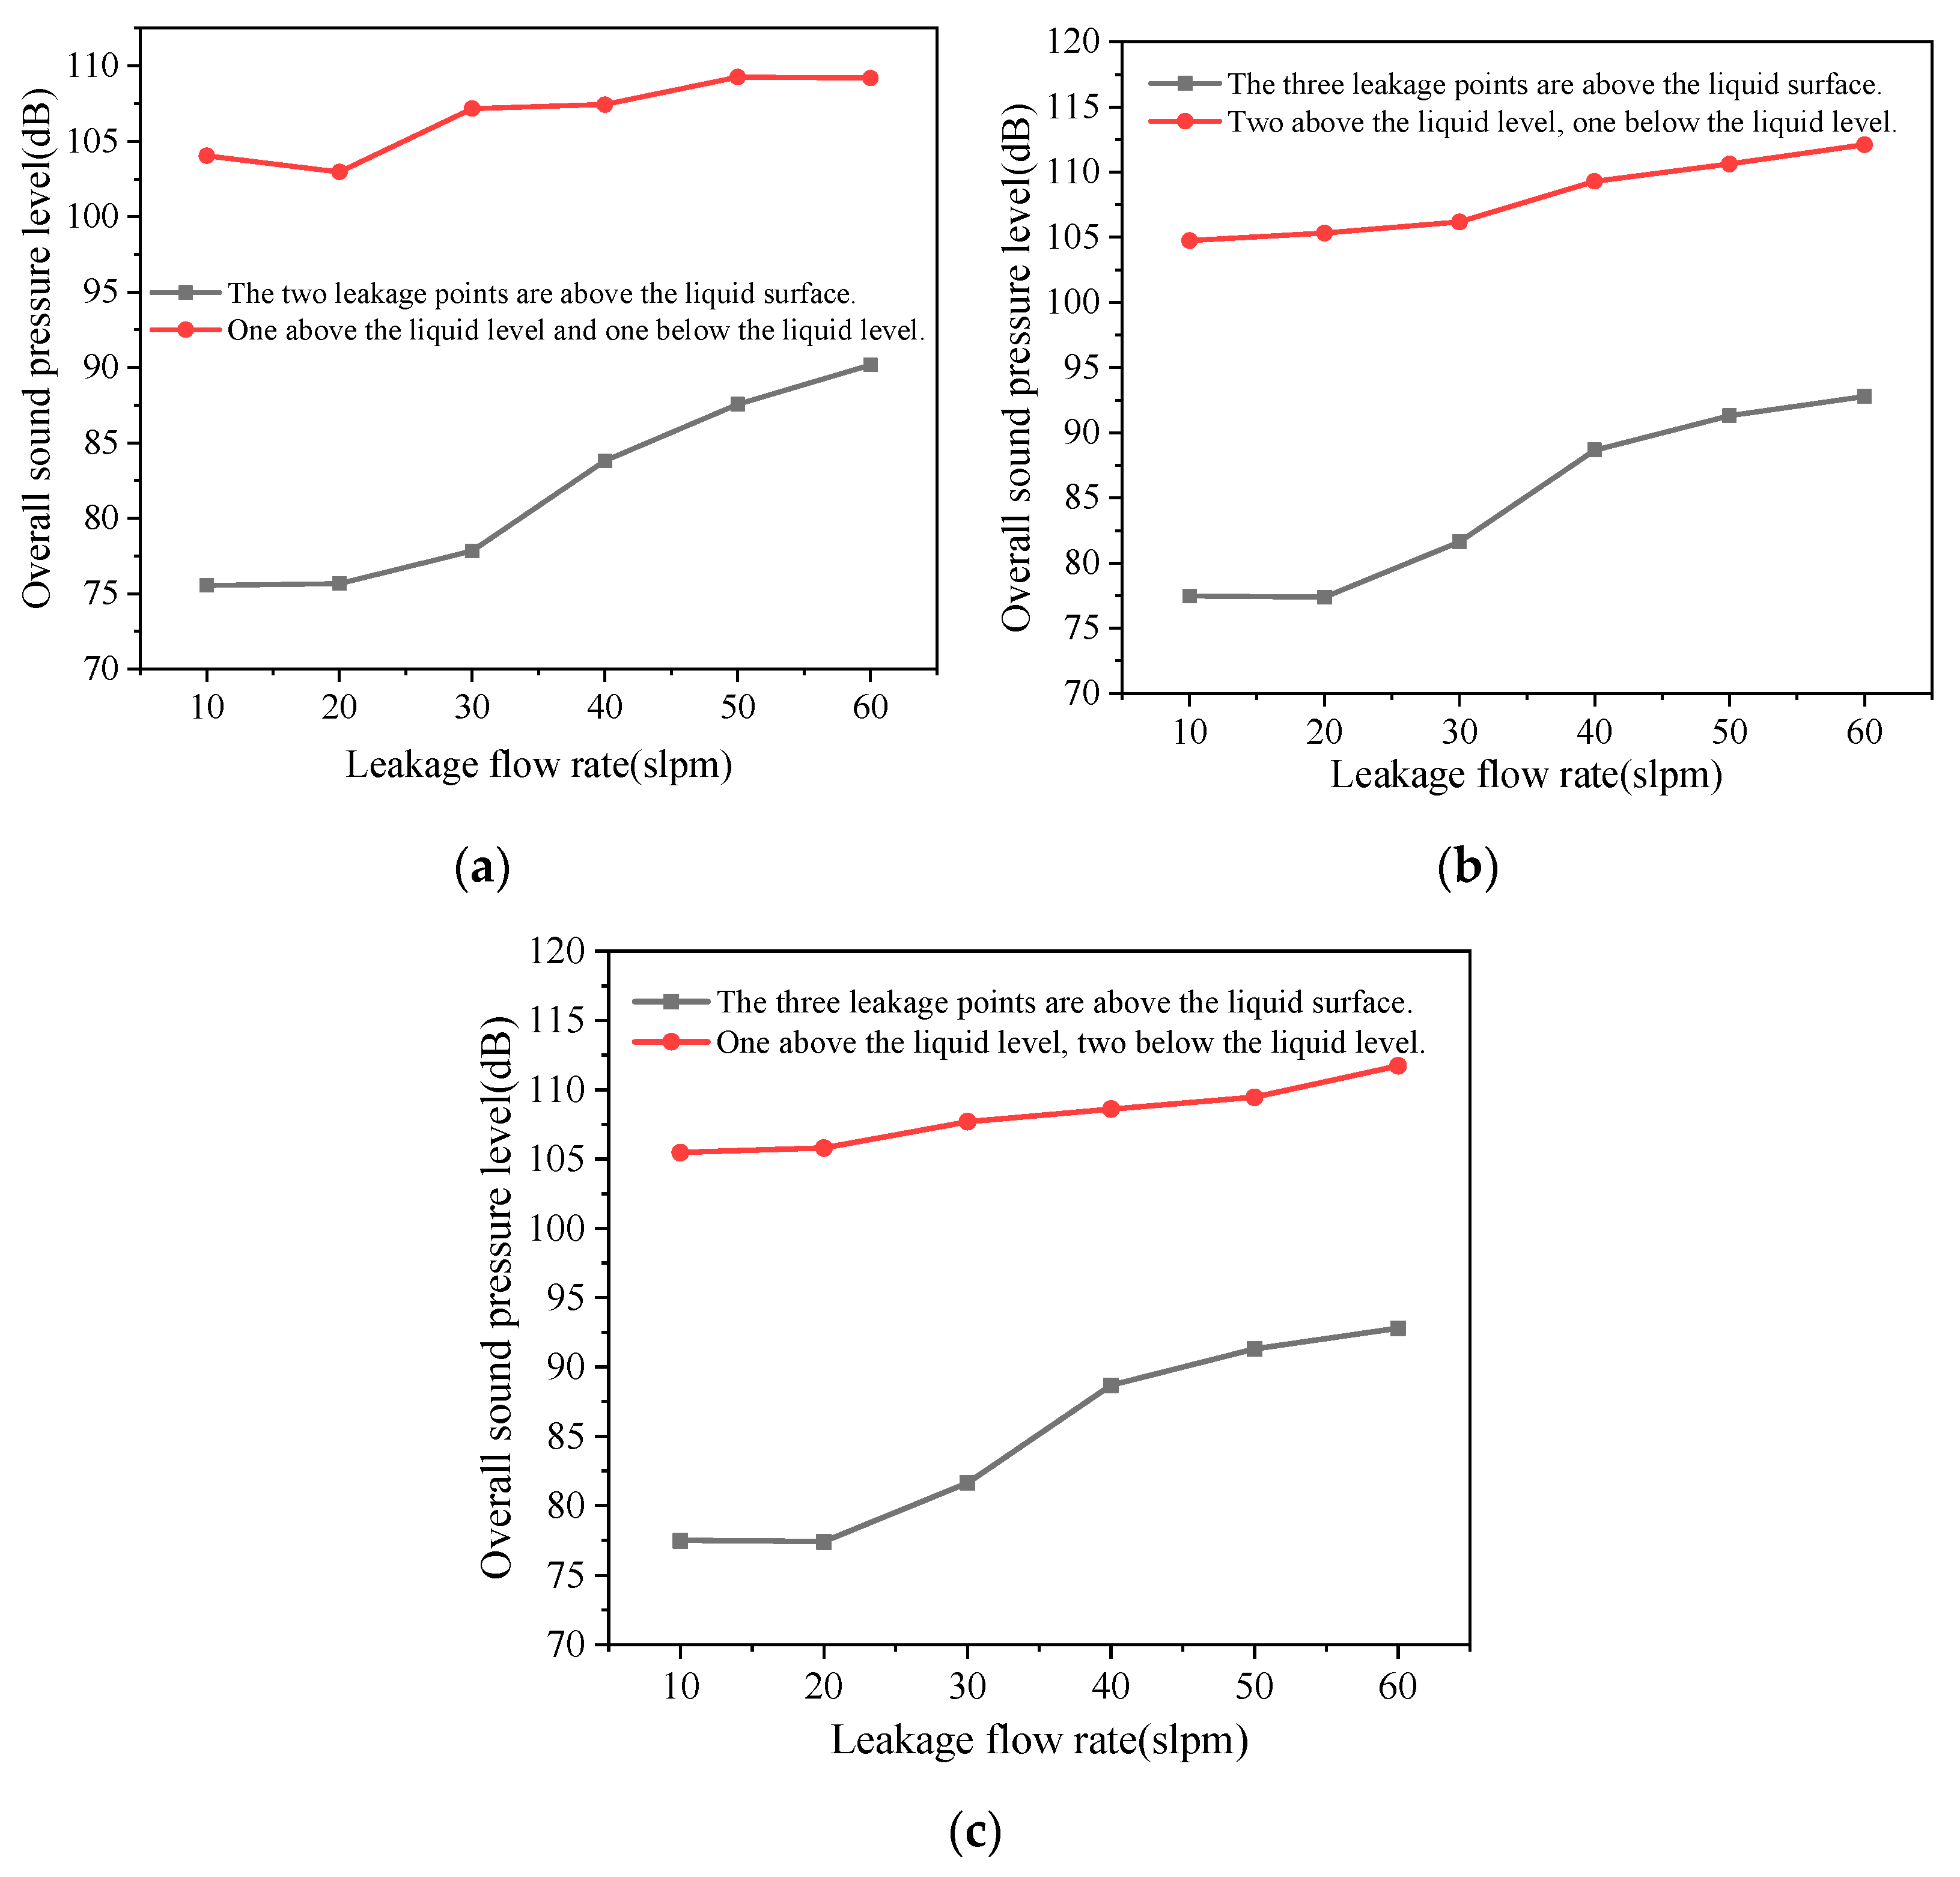
3.5. Comparative Analysis of Leakage Acoustic Waves Above and Below Liquid Level

For a leakage aperture of 1 mm, Figure 13 shows the time–frequency characteristics of leakage noise when the leakage position is either above or below the liquid level, with the leakage flow rate controlled within the range of 0–60 SLPM. As shown in Figure 13a, when the leakage point is above the liquid level, the amplitude distribution of the leakage acoustic wave signal remains relatively consistent in the time domain. The signal amplitude increases with the leakage flow rate, but when the flow rate exceeds a certain level, the growth rate of the amplitude significantly slows down. This occurs because a leakage flow rate of 60 SLPM approaches the maximum allowable flow rate for a 1 mm aperture when the gas flow controller’s input pressure is set at 0.5 MPa.
Figure 13c displays the frequency distribution of the leakage acoustic wave signal when the leakage point is above the liquid level. The gas leakage acoustic signal exhibits broadband noise characteristics. Due to the signal sampling frequency of 10 kHz, the figure only shows the frequency range of 0–5 kHz, while the actual frequency distribution extends beyond 5 kHz. The acoustic energy in different frequency bands increases with the leakage flow rate, and the energy distribution is frequency-dependent. The leakage acoustic wave primarily consists of quadrupole sound sources.
Combining the time–domain diagrams of leakage noise when the leakage position is above or below the liquid level (Figure 13b and Figure 14), it can be observed that when the leakage point is below the liquid level, the leakage acoustic signal exhibits pulsating impact characteristics in the time domain.
Cross-referencing with Figure 15, showing the motion trajectory of leakage gas in liquid when the leakage point is below the liquid level, reveals the gas movement after leaving the leakage orifice displays discontinuous patterns. At lower flow rates, the detected acoustic signals primarily originate from bubble bursting sounds as gas reaches the liquid surface and surface disturbance noises. As the flow rate increases, some leakage gas penetrates through the liquid and impacts the casing well, adding new components to the detected acoustic signals in the annulus.
The signal amplitude increases with flow rate, but this growth rate significantly slows down beyond certain flow thresholds—a trend consistent with above-liquid-level leaks. However, the frequency distribution characteristics differ markedly from those of above-liquid cases. As shown in Figure 13d, when detecting noise above the liquid surface for sub-surface leaks, the frequency band narrows significantly, concentrating below 1 kHz. This occurs because (1) the substantial acoustic impedance difference between gas and liquid phases severely attenuates high-frequency transmission across the interface, while preserving low-frequency signals; (2) Additionally, sub-surface leaks generate higher amplitude signals due to violent liquid surface fluctuations and bubble rupture sounds when gas reaches the interface, significantly increasing noise energy levels.
As evidenced by Figure 13d, when the leakage point is below the liquid level, the noise energy concentrates primarily within the 0–1 kHz bandwidth, with high-frequency noise experiencing rapid energy attenuation and limited propagation distance, resulting in predominantly low-frequency signals being detected at the wellhead. To enable comparative analysis of the above-liquid and below-liquid leakage acoustic characteristics within equivalent frequency ranges, a 1 kHz cutoff frequency was applied when calculating the total sound pressure level (SPL).
The corresponding SPL-versus-flow-rate curves for both leakage positions are presented in Figure 16, revealing two key observations: (1) At identical flow rates, below-liquid leaks produce 3–5 dB higher noise levels in annular measurements compared to above-liquid scenarios; (2) Both configurations exhibit monotonically increasing total SPL with higher leakage flow rates, though the below-liquid condition maintains consistent amplitude superiority across the entire 0–60 SLPM test range.
To account for complex downhole tubing leakage scenarios, we investigated conditions with leakage points both above and below the liquid level. Using 1 mm leakage orifices with 2–3 leakage points and flow rates controlled within 0–60 SLPM, Figure 17 presents the time–frequency characteristics under varying flow conditions. Key observations reveal (1) When sub-surface leaks exist, over 85% of detected signal energy concentrates within 0–1 kHz, with amplitudes consistently exceeding those in above-liquid-only scenarios; (2) Time–domain signals exhibit distinct pulsating characteristics that intensify with increasing flow rates.
Comparative analysis of Figure 13, Figure 14 and Figure 18 demonstrates that sub-surface leakage fundamentally alters acoustic signatures: Time–domain signals show impact-type pulsations while frequency–domain responses narrow to <1 kHz bandwidth—markedly different from above-liquid-only conditions.
Figure 19’s SPL–flow-rate curves (cross-referenced with Figure 16) confirm that sub-surface leakage produces 3.8–6.2 dB higher noise levels than equivalent above-liquid cases. This consistent amplitude differential provides reliable diagnostic criteria for identifying sub-surface tubing leaks in field applications.

4. Conclusions

This study yields the following key findings:
(1)
Tubing gas leakage generates broadband noise, with high-frequency energy levels increasing proportionally to either higher flow rates or smaller aperture sizes. The acoustic sources primarily comprise quadrupole and dipole components.
(2)
For multi-point leakage, neither time–frequency amplitudes nor total sound pressure levels (SPL) exhibit a strict positive correlation with the leak quantity. Acoustic wave superposition between multiple sources may amplify or attenuate overall noise energy.
(3)
Sub-surface leaks (below the liquid level) demonstrate fundamentally distinct acoustic signatures compared to above-surface leaks:
  • Time–domain: Pulsating impact signals caused by discontinuous gas migration through liquid, inducing surface turbulence and bubble rupture upon reaching the interface.
  • Frequency–domain: Energy concentration within 0–1000 Hz due to severe high-frequency attenuation across the gas–liquid interface (acoustic impedance mismatch), while low-frequency components persist.
(4)
Simultaneous leaks above and below the liquid level produce hybrid acoustic features distinguishable from above-surface-only scenarios. Critically, any sub-surface leakage—whether isolated or combined—significantly alters both time–domain pulsation patterns and frequency-bandwidth distributions in annular acoustic signals.
(5)
Limitations and challenges in field applications: This study focuses on the acoustic characteristics of gas leakage under low-pressure conditions (i.e., pressure levels that induce phase transitions). If phase transitions occur during a gas leakage, more complex acoustic signals may be generated. For instance, in the case of tubing leakage in CO2 injection wells, leaked CO2 entering the annulus space may undergo phase transitions. Further research on the acoustic characteristics of downhole CO2 leakage under varying pressure conditions is recommended.

Author Contributions

Conceptualization, Y.-P.Y. and S.-L.C.; methodology, B.-C.S.; software, Y.-P.Y. and M.-S.L.; validation, Y.-H.J.; formal analysis, Y.-P.Y.; investigation, Y.-P.Y. and B.-C.S.; resources, J.-W.Z. and J.-C.F.; data curation, M.-S.L.; writing—original draft preparation, Y.-P.Y.; writing—review and editing, S.L.; visualization, S.L.; supervision, Y.-S.Z.; project administration, J.-Y.W.; funding acquisition, J.-Y.W. All authors have read and agreed to the published version of the manuscript.

Funding

This research was funded by “Evolution Mechanism of Major Risks in Complex Oil and Gas Drilling and Production and Intelligent Safety Operation and Maintenance Methods” and “Research and Application of Quality, Safety, and Environmental Risk Control Technologies for Oil and Gas Fields”, grant number “2023DJ6508” and “2024YQX20102”.

Data Availability Statement

All data generated or analyzed during this study are included in this published article.

Conflicts of Interest

Authors Yun-Peng Yang, Sheng-Li Chu, Ying-Hua Jing, Bing-Cai Sun, Jin-You Wang, Mo-Song Li, Shuang Liang, and Yu-Shan Zheng were employed by the CNPC Research Institute of Safety&Environment Technology. Author Jing-Wei Zhang was employed by the PetroChina Tarim Oilfield Company. Author Jian-Chun Fan was employed by the PetroChina Jilin Oilfield Company. The companies had no role in the design of the study; in the collection, analyses, or interpretation of data; in the writing of the manuscript, or in the decision to publish the results.

Abbreviations

The following abbreviations are used in this manuscript:
SCPsustained casing pressure
SPLsound pressure level
SLPMstandard liter per minute

References

  1. Ma, F.; Fan, J.; Yang, Y.; Ding, J.; Fang, Y. Gas Leakage Acoustic Wave Detection Below the Liquid Level of Oil Pipe in Gas Wells Based on Convolutional Neural Network. J. Appl. Acoust. 2024, 43, 765–774. [Google Scholar]
  2. Fang, Y.; Fan, J.; Yang, Y.; Ma, F. Simulation of the Sound Field for Leakage Below the Annular Liquid Level in Gas Wells. China Pet. Mach. 2024, 52, 64–69. [Google Scholar]
  3. Wan, Z.; Zhang, Z.; Liu, L.; Dou, Y. Current status and development of ground detection techniques for oil casing leaks. Unconv. Oil Gas 2025, 12, 1–10. [Google Scholar]
  4. He, H. Reliability Evaluation Method and Application of Oil and Gas Well Shaft System. Saf. Sci. Technol. China 2018, 14, 6. [Google Scholar]
  5. Yang, S.; He, H.; Zhang, Z.; Dou, X.; Yin, X. Research on a Multifunctional Annular Space Pressurized Ground Diagnosis Method and Device. J. Southwest Pet. Univ. Nat. Sci. Ed. 2023, 45, 131–139. [Google Scholar]
  6. He, H.; Yang, S.; Dou, N.; Dou, X. Research Status and Progress of Ground Detection Technology for Oil and Casing Leakage. China Equip. Eng. 2022, 6, 173–174. [Google Scholar]
  7. Liang, Z. Analysis of Underground Oil and Casing Leakage Signals Based on Hilbert-Huang Transform. Master’s Thesis, China University of Petroleum, Beijing, China, 2018. [Google Scholar]
  8. Bi, R.; Guo, M.; Wang, S.; Zhang, Y.; Si, X.; Chen, X.; Zhang, L. Theories, Techniques and Materials for Sealing Coalbed Methane Extraction Boreholes in Underground Mines: A Review. Processes 2024, 12, 2022. [Google Scholar] [CrossRef]
  9. Lee, J.H.; Kim, Y.; Kim, I.; Hong, S.B.; Yun, H.S. Comparative Analysis of Ultrasonic and Traditional Gas-Leak Detection Systems in the Process Industries: A Monte Carlo Approach. Processes 2023, 12, 67. [Google Scholar] [CrossRef]
  10. Shan, H.; Zhu, Y. Gas pipeline leakage detection method based on IUPLCD and GS-TBSVM. Processes 2023, 11, 278. [Google Scholar] [CrossRef]
  11. Mujtaba, S.M.; Lemma, T.A.; Taqvi, S.A.A.; Ofei, T.N.; Vandrangi, S.K. Leak detection in gas mixture pipelines under transient conditions using Hammerstein model and adaptive thresholds. Processes 2020, 8, 474. [Google Scholar] [CrossRef]
  12. Zhou, M.; Zhang, Q.; Liu, Y.; Sun, X.; Cai, Y.; Pan, H. An integration method using kernel principal component analysis and cascade support vector data description for pipeline leak detection with multiple operating modes. Processes 2019, 7, 648. [Google Scholar] [CrossRef]
  13. Johns, J.E.; Blount, C.G.; Dethlefs, J.C.; Loveland, M.J.; McConnell, M.L.; Schwartz, G.L.; Julian, J.Y. Applied ultrasonic technology in wellbore-leak detection and case histories in Alaska North Slope wells. SPE Prod. Oper. 2008, 24, 225–232. [Google Scholar]
  14. Martinez, R.; Hill, A.D. Diagnosis of fracture flow conditions with acoustic sensing. In Proceedings of the SPE Hydraulic Fracturing Technology Conference, The Woodlands, TX, USA, 6–8 February 2014; ISBN 978-1-61399-310-1. [Google Scholar]
  15. Bateman, R.M. Cased-Hole Log Analysis and Reservoir Performance Monitoring; Springer: New York, NY, USA, 2015. [Google Scholar] [CrossRef]
  16. Jalan, S.N.; Ai-Haddad, S.; Ali, S.M.; Al-Hamli, D.; Prosvirkin, S.; Aristov, S. Application of noise and high precision temperature logging technology to detect tubing leak in an oil well-a case study. In Proceedings of the SPE Kuwait Oil and Gas Show and Conference, Kuwait City, Kuwait, 15–18 October 2017. [Google Scholar] [CrossRef]
  17. Dong, Z. Jet Mechanics; Science Press: Beijing, China, 2005. [Google Scholar]
  18. Ho, C.M.; Nosseir, N.S. Dynamics of an impinging jet. Part 1. The feedback phenomenon. J. Fluid Mech. 1981, 105, 119–142. [Google Scholar] [CrossRef]
  19. Ge, Q.; Yao, Z.; Cui, Y.; He, F. Experimental study on the noise characteristics of impinging jets with concave-convex plates. J. Tsinghua Univ. 2005, 5, 681–684. [Google Scholar]
  20. Wang, Q. Study on Source Characteristics and Testing Technology Experiment of Jacketed Structure Inner Pipe Leakage. Master’s. Thesis, Northeast Petroleum University, Daqing, China, 2014. [Google Scholar]
  21. Liu, Y. Study on Source Characteristics and Testing Technology Experiment of Jacketed Structure Inner Pipe Leakage. Ph.D. Thesis, Northeast Petroleum University, Daqing, China, 2016. [Google Scholar]
  22. Liu, D.; Fan, J.; Liu, S.; Wang, C.; Liang, Z.; Fan, Z. Experimental Research on the Location of Multiple Leaks in Downhole Tubing of Gas Wells. China Saf. Sci. J. 2018, 14, 6. [Google Scholar]
  23. Budenkov, G.A.; Nedzvetskaya, O.V.; Strizhak, V.A. Acoustics of the annular space of producing and injection wells. Russ. J. Nondestruct. Test. 2004, 39, 571–576. [Google Scholar] [CrossRef]
  24. Rodrigues, S.S.; Marta, A.C. On addressing noise constraints in the design of wind turbine blades. Struct. Multidiscip. Optim. 2014, 50, 489–503. [Google Scholar] [CrossRef]
  25. Huang, Y.M.; Chen, T.C.; Shieh, P.S. Analytical estimation of the noise due to a rotating shaft. Appl. Acoust. 2014, 76, 187–196. [Google Scholar] [CrossRef]
Figure 1. Existing oil tubing leakage simulation system.
Processes 13 01586 g001
Figure 2. Newly built experimental system for oil tubing leakage simulation.
Processes 13 01586 g002
Figure 3. Physical diagram of the acoustic detection simulation experimental system for oil tubing leakage.
Processes 13 01586 g003
Figure 4. Experimental procedure for acoustic detection of oil tubing leakage.
Processes 13 01586 g004
Figure 5. (a) Time-domain characteristics under different leakage flow rates, (b) Frequency-domain characteristics under different leakage flow rates.
Processes 13 01586 g005
Figure 6. Curve of total sound pressure level versus leakage flow rate.
Processes 13 01586 g006
Figure 7. (a) Time-domain Characteristics Under Different Leakage Aperture Diameters, (b) Frequency-domain Characteristics Under Different Leakage Aperture Diameters.
Processes 13 01586 g007
Figure 8. Variation curve of total sound pressure level with leakage orifice diameter.
Processes 13 01586 g008
Figure 9. (a) Time-domain Characteristics Under Different Leakage Depths, (b) Frequency-domain Characteristics Under Different Leakage Depths.
Processes 13 01586 g009
Figure 10. Variation curve of total sound pressure level versus leakage depth.
Processes 13 01586 g010
Figure 11. (a) Time-domain Characteristics Under Different Leakage Point Quantities, (b) Frequency-domain Characteristics Under Different Leakage Point Quantities.
Processes 13 01586 g011
Figure 12. Variation curve of total sound pressure level with the number of leakage points.
Processes 13 01586 g012
Figure 13. Time–frequency characteristics of leakage noise with leakage points above or below liquid level.
Processes 13 01586 g013
Figure 14. Time–domain diagrams of leakage noise for above-surface and sub-surface leakage positions: (a) Leakage Flow Rate at 20 slpm, (b) Leakage Flow Rate at 30 slpm.
Processes 13 01586 g014
Figure 15. Migration trajectory of leakage gas with sub-surface leakage point.
Processes 13 01586 g015
Figure 16. Variation curves of total sound pressure level versus leakage flow rate for both above-surface and sub-surface leakage conditions.
Processes 13 01586 g016
Figure 17. Time–frequency characteristics of leakage noise with simultaneous above-surface and sub-surface leakage points: (a) Time-domain Signals of Leakage Noise with One Leakage Point Above and Below Liquid Level Each, (b) Time-domain Signals of Leakage Noise with Two Leakage Points Above and One Below Liquid Level, (c) Time-domain Signals of Leakage Noise with One Leakage Point Above and Two Below Liquid Level, (d) Frequency-domain Signals of Leakage Noise with One Leakage Point Above and Below Liquid Level Each, (e) Frequency-domain Signals of Leakage Noise with Two Leakage Points Above and One Below Liquid Level, (f) Frequency-domain Signals of Leakage Noise with One Leakage Point Above and Two Below Liquid Level.
Processes 13 01586 g017aProcesses 13 01586 g017b
Figure 18. Time–domain diagrams of leakage noise under simultaneous above- and sub-surface leakage conditions: (a) Leakage Flow Rate at 20 slpm, (b) Leakage Flow Rate at 60 slpm.
Processes 13 01586 g018
Figure 19. Variation curves of total sound pressure level versus leakage flow rate under combined above- and sub-surface leakage conditions:(a) Two Leakage Points: Both Above vs. One Above and One Below Liquid Level, (b) Three Leakage Points: All Above vs. Two Above and One Below Liquid Level, (c) Three Leakage Points: All Above vs. One Above and Two Below Liquid Level.
Processes 13 01586 g019
Table 1. Composition of the oil tubing leakage simulation system.
Equipment NameTechnical ParametersEquipment NameTechnical Parameters
Tubing3.5 inch, Φ88.9 mm × 6.54 mmData Acquisition CardMCC1608
CasingAcrylic, Φ240 mm × 15 mmAcoustic SensorCRY372
Gas Flow ControllerFlow range: 0–500 SLPM;
Accuracy: 0.3% F.S.
Air PumpRated pressure: 0.7 MPa; Capacity: 80 L
Filter Pressure RegulatorOutput pressure: 0.05–0.7 MPaBuffer TankPressure rating: 1.5 MPa; Capacity: 300 L
Desiccant FilterQPS-015 Triple-stage filtration————
Table 2. Design of experimental parameters.
No.Controlled VariableDesign Parameters
1Leakage Aperture (mm)1, 2, 3, 4, 5
2Leakage Flow Rate (SLPM)0~140
3Number of Leakage Points1, 2, 3
4Leakage PositionAbove and Below Liquid Level
5Gas MediumCompressed Air
6Signal Sampling Frequency10 kHz
Disclaimer/Publisher’s Note: The statements, opinions and data contained in all publications are solely those of the individual author(s) and contributor(s) and not of MDPI and/or the editor(s). MDPI and/or the editor(s) disclaim responsibility for any injury to people or property resulting from any ideas, methods, instructions or products referred to in the content.

