Article

Optimized Economic Evaluation Model for Intensive Drilling in Unconventional Oil and Gas Development

1
Petroleum Engineering and Technology Research Institute, Shengli Oilfield Branch, Dongying 257000, China
2
Sanya Offshore Oil & Gas Research Institute, Northeast Petroleum University, Sanya 572025, China
*
Author to whom correspondence should be addressed.
Processes 2025, 13(5), 1579; https://doi.org/10.3390/pr13051579
Submission received: 31 March 2025 / Revised: 13 May 2025 / Accepted: 16 May 2025 / Published: 19 May 2025
(This article belongs to the Section Energy Systems)

Abstract

:
This paper presents an optimized economic evaluation model for intensive drilling in unconventional oil and gas development, based on the “well factory” concept. The model integrates cost components—including pre-drilling, drilling operations, drilling materials, and drilling fluid treatment—with synergy factors that capture the benefits of centralized operations. These synergy factors reflect cost savings arising from reduced land acquisition, optimized rig sharing, and enhanced reuse of drilling fluids. Furthermore, a decision timeliness component is incorporated into the objective function, ensuring that the model can dynamically balance cost minimization with rapid decision making—a critical requirement in fast-paced energy projects. The model is rigorously developed by building on conventional cost equations and is validated using field data from the Shengli Oilfield Yan 227 block. The results demonstrate significant reductions in pre-drilling and drilling operation costs under the “well factory” mode compared to conventional single-well approaches. Additionally, an optimal platform configuration is identified, highlighting the economic benefits of integrating centralized infrastructure and shared resources in large-scale drilling operations. This comprehensive framework provides a robust decision-support tool for enhancing economic efficiency and operational effectiveness in the development of unconventional resources.

1. Introduction

In the accelerated global transition toward a low-carbon energy system, the development of unconventional oil and gas resources is undergoing a strategic redefinition. According to the International Energy Agency’s World Energy Investment Report 2023, although renewable energy investments continue to rise, more than 40% of global fossil energy demand will still depend on unconventional oil and gas by 2030 [1,2,3]. As China holds the largest shale gas reserves—estimated by the U.S. Energy Information Administration (EIA) at 31.6 trillion cubic meters—its shale gas production accounted for only 12% of the total natural gas supply in 2022, significantly lower than the 35% seen in North America [4,5,6]. This discrepancy underscores the technical and economic bottlenecks inherent in the traditional, extensive drilling model [7]. For example, in the Sichuan Basin, the average cost per well reaches 68 million yuan, while the production decline rate in the first year exceeds 65%. Against this backdrop, intensive drilling—achieved through coordinated parameter optimization, reengineered operational processes, and intelligent equipment upgrades—emerges as the key pathway to overcoming the “high investment–low return” dilemma [8,9,10].
However, the economic evaluation of emerging drilling technologies is hindered by a lack of fundamental data. The U.S. Geological Survey’s 2022 assessment of global unconventional blocks revealed that 62% of undeveloped blocks lack continuous dynamic monitoring data [11,12]. Moreover, in China’s southern marine shale gas reservoirs, complex geological structures have resulted in less than 40% completeness in downhole parameter acquisition [13,14,15]. These challenges compel the adoption of economic evaluation methods that harness the time-efficiency advantages of static models. In North America’s Permian Basin, the initial development phase widely employed static cost models to quantify savings from reduced well spacing—yielding an 18% reduction in land lease costs per well—and to benefit from lower equipment depreciation rates due to bulk procurement (a reduction of up to 22%) [16,17]. This approach enabled the rapid iteration of development plans within 48 h. In contrast, a comparative study between CNPC’s Changning Block and North America’s Eagle Ford formation demonstrated that, under similar geological conditions, the failure to leverage static models’ cost-sensitivity during early-stage scheme selection resulted in a 23% longer development cycle and a 15% increase in indirect costs [18,19].
Intensive well construction refers to a specialized reservoir development model characterized by conceptual and technological innovation, large-scale well clusters, a focus on intensive efficiency, and multidisciplinary, factory-style operations [20,21,22,23]. The investment in intensive drilling encompasses drilling engineering costs, temporary land use, and environmentally safe mud treatment [24,25,26]. Notably, drilling engineering—covering pre-drilling preparations, drilling operations, and cementing—is the most significant cost component, with temporary land use and platform scale being closely linked to well depth and density [27,28,29].
Based on the characteristics of intensive drilling, this study examines the economic impacts of various factors—including reservoir depth, well pattern and spacing, construction modes, and build deviation rates. It also considers the influence of drilling engineering investments, such as civil works, pond construction, pre-drilling preparations, drilling operation costs, material costs, transportation costs, technical service charges, cementing costs, and other miscellaneous expenses on the economic performance of intensive drilling designs. For each drilling engineering cost factor, optimal design parameters and factor groups are identified through both qualitative and quantitative evaluations. An economic evaluation model is then established to calculate the costs associated with the intensive drilling platform. Moreover, to develop an “integrated geological and engineering economic evaluation system” in situations where data are incomplete, the construction of a “rapid response decision-making tool” becomes essential. This research focuses on adaptive innovations within the static model framework, aiming to resolve the dual challenges of “insufficient data accuracy” and “stringent decision-making timeliness” in the economic evaluation of intensive drilling, thereby providing methodological support for the efficient development of unconventional oil and gas resources.
The novelty of this study lies in its proposal of an optimized economic evaluation model for intensive drilling based on the concept of “drilling factories”. By integrating cost factors, such as pre-drilling, drilling operations, drilling materials, and drilling fluid treatment, and combining collaborative factors to capture the benefits of centralized operations, this study overcomes the “high investment-low return” issue existing in traditional single-well drilling methods. Furthermore, by introducing decision timeliness components, the model can achieve a dynamic balance between quick decision making and cost minimization, which is crucial for the fast-paced development of energy projects. Compared to the existing literature, this study not only provides theoretical innovations but also validates the effectiveness and practicality of the model through real-world cases.

2. Materials and Methods

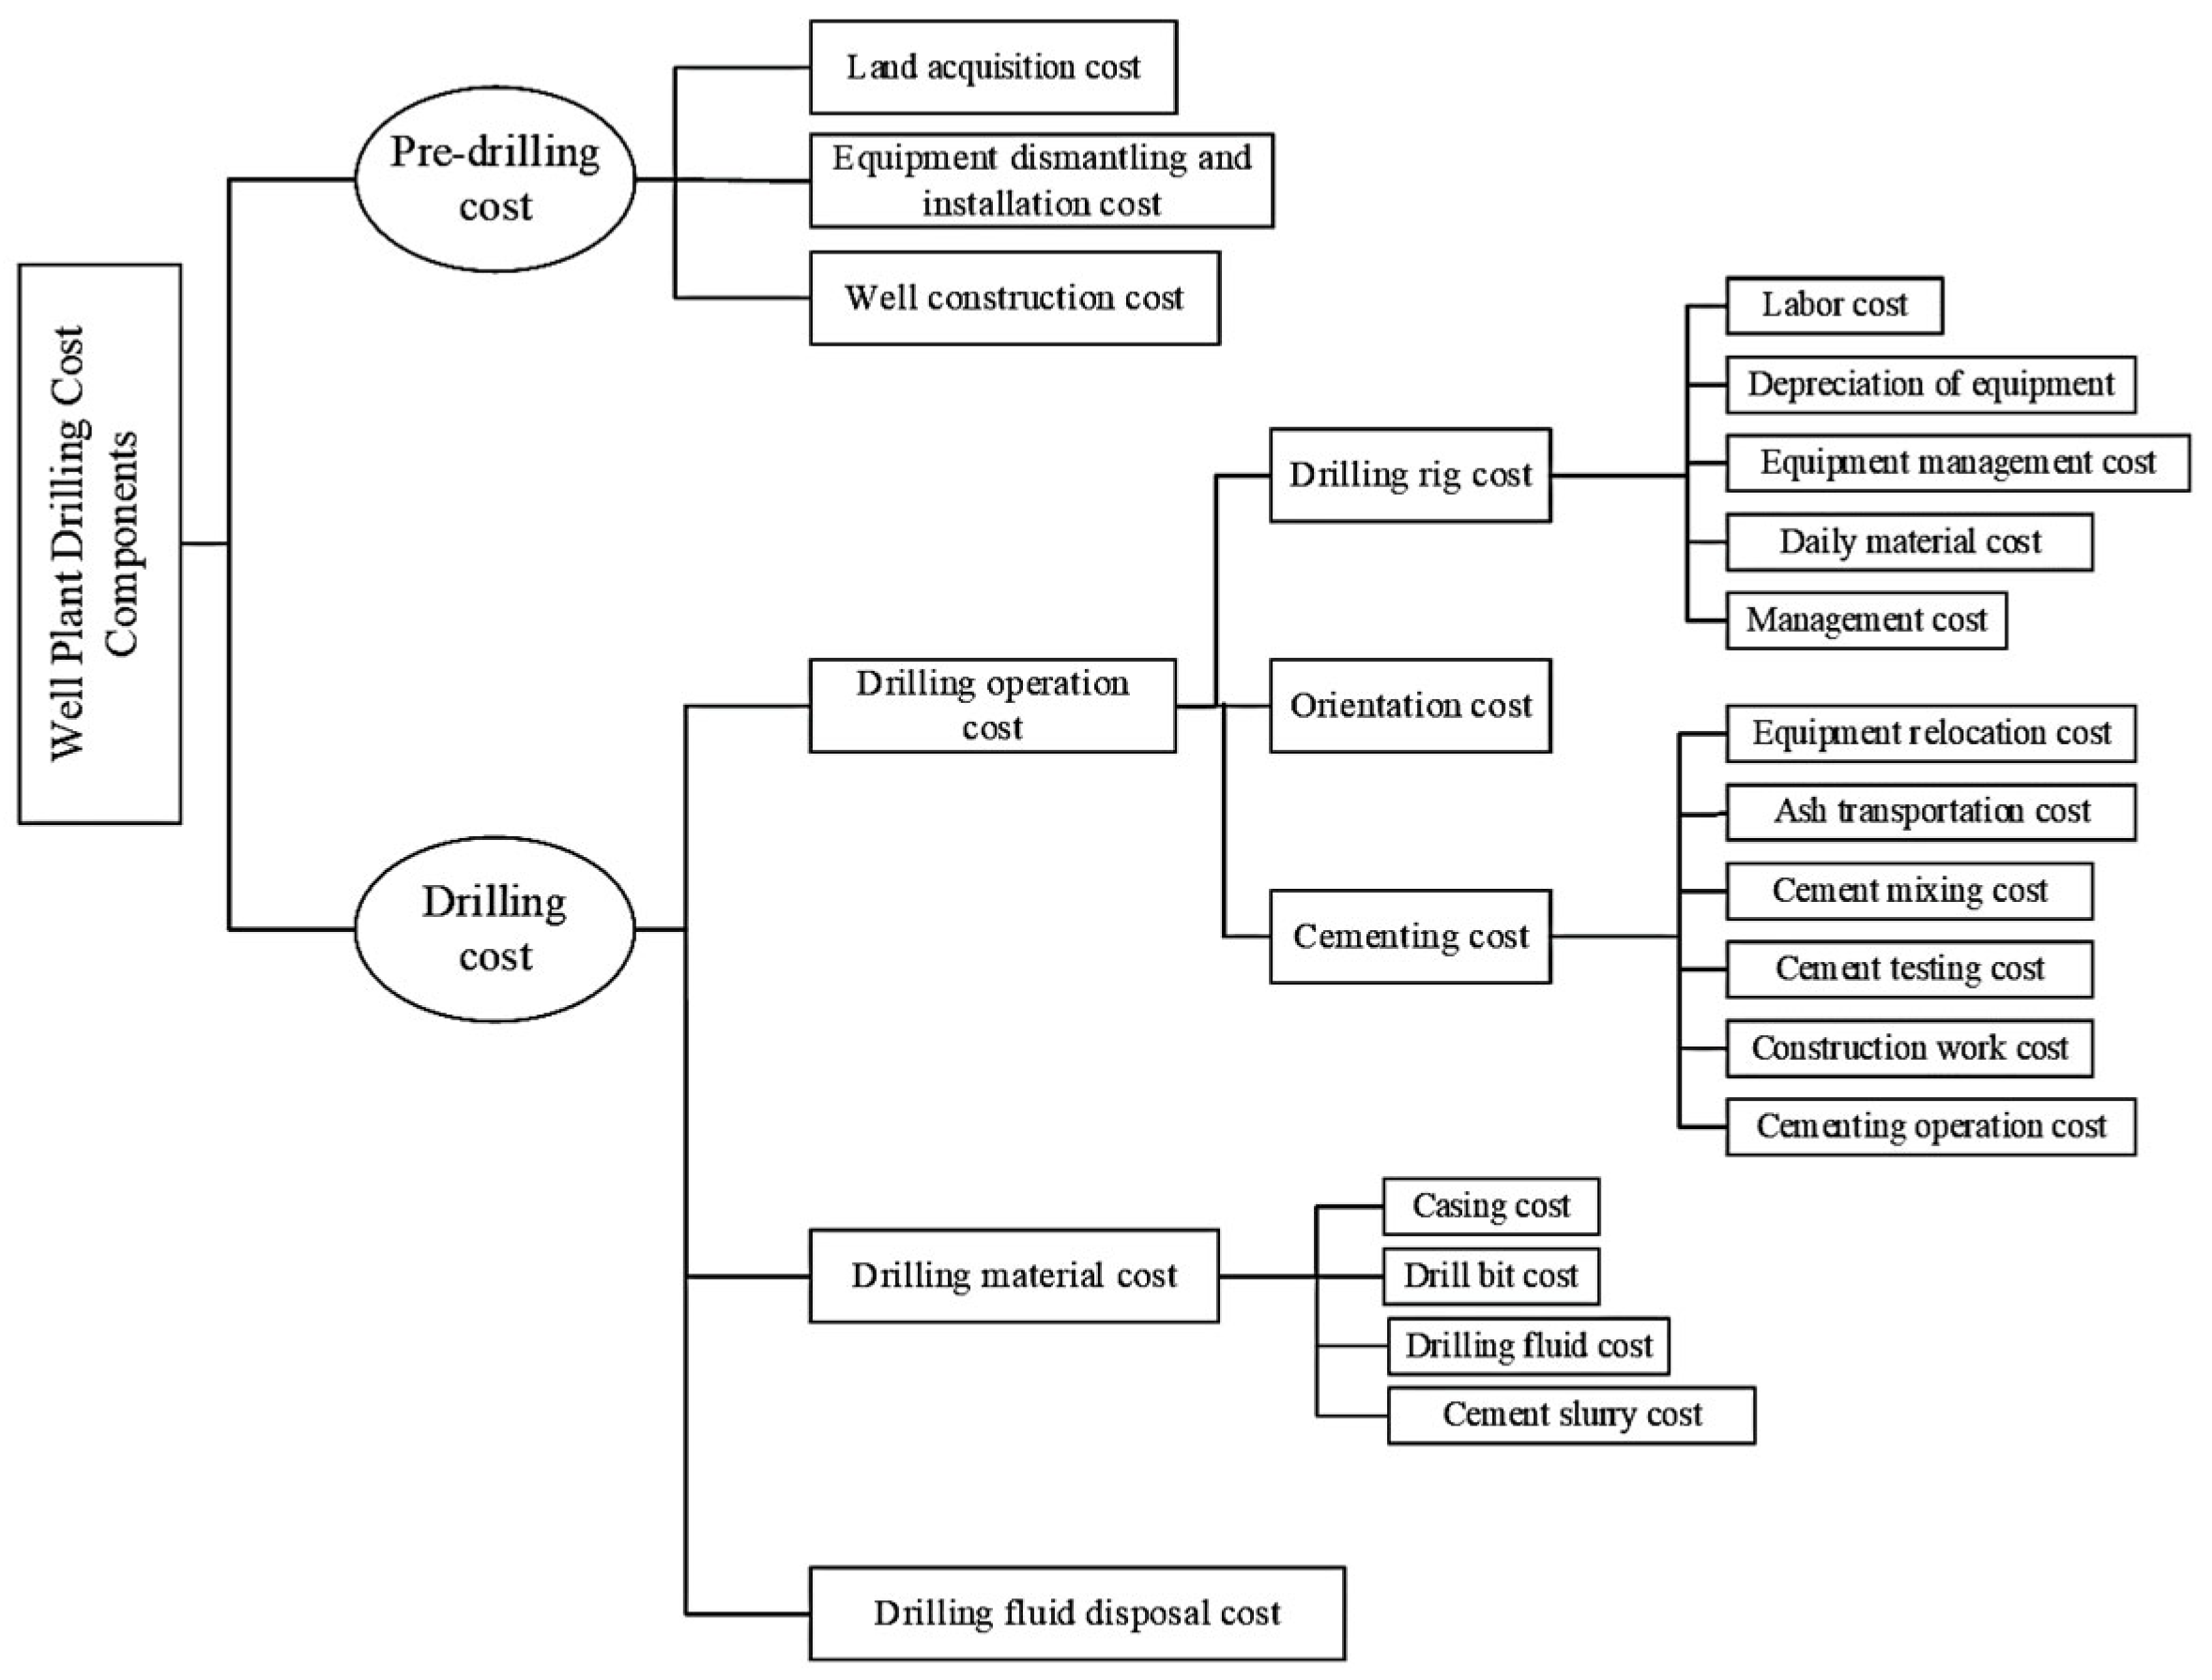
2.1. Model Cost Classification

Factory-based drilling is a comprehensive engineering project that requires close collaboration among multiple disciplines. When deploying platforms and designing well sites, it is essential to consider a range of factors—including drilling, fracturing, surface operations, and subsequent management. An optimization model is established based on these factors to ensure overall investment efficiency [30,31].
First, the components of the drilling costs in a well factory are identified through a detailed analysis. These cost elements are then quantified to construct a robust drilling cost evaluation model. Based on the drilling sequence in the factory, the cost components are determined. The quantifiable elements, as illustrated in Figure 1, include eleven factors, as follows:
Pre-drilling cost: land acquisition cost, equipment dismantling and installation cost, and well construction cost.
Drilling operation cost: drilling rig cost, orientation cost, and cementing cost.
Drilling material cost: drill bit cost, drilling fluid cost, casing cost, and cement slurry cost.
Drilling fluid disposal cost.
The cost categorization intent is shown in Figure 1, and Table 1 directly reflects the 11 cost elements outlined in Figure 1 (“Components of Drilling Cost Elements”), grouped by category, and briefly describes each subcomponent.

2.2. Quantification of the Economic Benefit Components for Intensive Drilling Design

2.2.1. Pre-Drilling Costs

Pre-drilling costs generally consist of land acquisition costs, well-site construction costs, and equipment installation/removal costs.
  • Land Acquisition Costs
The land acquisition cost (denoted as A1i) is determined using the following formula:
C z d i =   [ S 1 + s 1 ( n i 1 ) ] q   n i   <   5             =   [ S 1 + s 1 × 3 + s 2 ( n i 4 ) ] q   n i 5
where Czdi represents the temporary land occupation cost for platform i (in yuan). In the formula, S1 is the area occupied by the first well. According to SY/T 5466-2013 “Technical Requirements for Pre-Drilling Engineering and Well Site Layout”, well site areas for different drilling rigs are specified [32]. For the oil field, where the drilling types are ZJ20 and ZJ30, S1 is taken as 8000 m2. s1 is the occupied area for each of the second, third, and fourth wells; based on SY/T 5505-2006 “Cluster Well Platform Layout,” the platform area for the oil field is 400 m2 per well [33]. S2 is the occupied area for the fifth and subsequent wells on the platform. ni denotes the number of wells on the platform, and q is the land cost per square meter (yuan/m2).
  • Well Construction Costs
Well factory platforms use a centralized well layout, greatly reducing the average land area per well. For each additional well, the well-site construction cost is estimated to increase by 10%. The well-site construction cost (denoted as A2i) is calculated as follows:
C j s i   =   [ 1 + 0.1 ( n i 1 ) ] q 1
where Cjsi is the well-site construction cost for platform i (in yuan) and q1 is the pre-drilling quota cost per well.
  • Equipment Installation and Removal Costs
A correlation exists between the number of platforms within a block and the frequency of rig relocation and installation. Since most relocation and installation work is carried out on the platform, the overall rig relocation and installation costs are reduced. The equipment installation and removal cost (denoted as A3i) is determined by the following process.
First, the number of major rig relocations, pad-to-pad relocations, and total relocations are established based on the number of wells and the wellhead layout on the platform.
Then, the total cost is calculated using the frequency of these events, as in the following Equation (3):
C b a i = q r 1 + q r 2 ( n i 1 )                           Sin gle   row   wellhead q r 1 + q r 2 ( n i 2 ) + q r 2           Double   row   wellhead
where Cbai is the equipment installation and removal cost for platform i; qr1 is the cost for one major rig relocation; qr2 is the cost for one complete relocation; and qr3 is the cost for one pad-to-pad relocation on the platform.
The total pre-drilling engineering cost for platform i (Cbai) is the sum of the land acquisition costs, well-site construction costs, and equipment installation/removal costs. The overall pre-drilling cost for the well factory is given by the following Equation (4):
C d b = i = 1 k C d b i
where Cdb is the total pre-drilling engineering cost for k platforms in the block.

2.2.2. Drilling Costs

Having established the full scope of pre-drilling investments—from land acquisition to equipment mobilization—it is now essential to quantify the downstream drilling costs incurred during the actual well-boring operations. Drilling costs comprise three main components: drilling operation costs, drilling material costs, and drilling fluid environmentally safe treatment costs.
  • Drilling Operation Costs
Drilling operation costs include rig operation costs, directional drilling service costs, and cementing operation costs.
Rig operation costs: These costs cover labor, equipment depreciation, management costs, daily material costs, and other related expenses. Rig operation costs depend on the rig’s daily operating cost and the drilling cycle. They are calculated as follows:
C z j i = n = 1 n i j = 1 m R n j T z n j
where Czji is the rig operation cost for platform i (covering ni wells) in yuan; Rnj is the daily cost for rig and labor for the jth drilling of the nth well (yuan/day), accounting for different rig models; and Tznj is the drilling cycle (in days) for the jth drilling of the nth well.
Directional drilling service costs: As the number of wells on a platform increases, lateral displacement also increases. This results in longer directional sections and higher associated costs, since additional directional drilling requires more time and incurs higher service costs. The cost is determined by the following Equation (6):
C d x i = n = 1 n i j = 1 m D n j T d x n j
where Cdxi is the directional drilling service cost for platform i (for ni wells) in yuan; Dnj is the daily directional drilling cost for the jth directional operation on the nth well (yuan/day); and Tdxnj is the directional drilling time (in days) for the jth directional operation on the nth well.
Cementing operation costs: Cementing costs include equipment relocation, transportation of cuttings, cement mixing, cement testing, construction operations, and waiting/curing operations. They are calculated as follows:
C g j i = n = 1 n i j = 1 m G n j
where Cgji is the cementing operation cost for platform i (covering ni wells) in yuan, and Gnj is the cementing operation cost for the jth cementing operation on the nth well (in yuan).
  • Drilling Material Costs
Materials used in drilling include drill bits, drilling fluids, casing, and cement slurry. The cost for these materials is given by the following Formula (8):
C c l i = n = 1 n i j = 1 m a = 1 4 H n j q a n j
where Ccli is the drilling material cost for platform i (covering ni wells) in yuan; Hnj is the drilling depth (in meters) for the jth drilling of the nth well; a (taking values 1, 2, 3, and 4) corresponds, respectively, to drill bits, drilling fluids, casing, and cement slurry; and qanj is the cost per meter (in yuan/m) for the corresponding material in the jth drilling of the nth well.
Drilling fluids are mainly divided into two categories, namely water-based drilling fluids and oil-based drilling fluids, with each having different physical and chemical properties and mechanisms of action on site. Water-based mud (WBM) usually consists primarily of a water phase, mixed with additives, such as bentonite and polymers, with densities typically ranging from 1.05 to 1.20 g/cm3 to balance formation pore pressure; its viscosity is adjustable, ensuring the stability of the wellbore and sand carrying capacity through shear-thinning characteristics; because of its good water content, costs are relatively low, but the thermal stability for deep wells or high-temperature formations is poor. Oil-based mud (OBM) uses an oil phase as the carrier, with additives, like emulsifiers and swelling clay, providing higher lubricity and excellent wellbore anti-erosion stability, which are especially suitable for complex formations; however, the cost per unit volume is typically 1.5 to 2 times that of water-based drilling fluids. During the drilling process, in addition to cooling the drill bit, carrying rock cuttings, and balancing formation pressure, drilling fluids can also strengthen the wellbore by forming a filter cake to reduce the risk of wellbore collapse. These performance indicators are directly reflected in material cost calculations: in Formula (8), the fluid cost q2nj is multiplied by the usage volume Hnj, where oil-based drilling fluids with higher viscosity and density have a higher unit price; in Formula (9), the economic benefit of the reuse volume ΔVnj depends on circulation performance and stability; water-based drilling fluids usually have a lower reuse rate, resulting in a smaller Δq2nj; in the waste liquid treatment cost Ctreat (Formula (10)), the treatment prices Bn for waste water-based and waste oil-based drilling fluids are also different, with the environmental treatment costs for oil-based waste fluids being higher. By setting different parameters (Qnj, ΔVnj, and Bn) in the model, it is possible to accurately reflect the actual cost differences and economic optimization space for various types of drilling fluids.
For well factory operations conducted in batches, the drilling fluid cost q2nj for the first well (n = 1) is based on the actual cost per drilling operation. For subsequent wells (n ≥ 2), cost adjustments are made to account for the reuse of drilling fluids. The reduction in drilling fluid costs for the jth drilling of the nth well on platform i is given by the following Formula (9):
Δ q 2 n j = n = 1 n i j = 1 m Q n j Δ V n j
where Δq2nj is the reduction in the drilling fluid cost (in yuan); Qnj is the unit price of the drilling fluid (in yuan/m3); and ΔVnj is the volume of drilling fluid reused (in m3).
  • Drilling Fluid Environmentally Safe Treatment Costs
The cost of drilling fluid waste treatment (see Formula (10)) typically accounts for 5–10% of the overall drilling cost; however, against the backdrop of increasingly stringent environmental regulations, its relative weight and risk costs are continuously rising. As the scale of the platform and the circulation volume of drilling fluid increase, the product of the volume of waste Vn and the unit treatment price Bn directly determines the level of this expense. Furthermore, drilling fluid waste often contains heavy metals and chemical additives, and, if not disposed of properly, it can lead not only to environmental penalties and community safety incidents but also to potential health and environmental risks, severely impacting the ongoing operations of the project and the reputation of the enterprise. This cost covers the treatment of water-based and oil-based drilling fluid waste, drilling wastewater, cementing slurry waste, and tank cleaning wastewater. It is calculated as follows:
C m c i = n = 1 n i B n V n
where Cmci is the environmentally safe treatment cost for drilling fluids for platform i (covering ni wells) in yuan; Vn is the volume of fluids requiring treatment for the nth well (in m3); and Bn is the unit treatment cost (in yuan/m3).
Additional formulas specify the volumes of waste, as follows.
The volume of water-based drilling fluid waste is expressed in the following Equation (11):
V w b w = n = 1 n i j = 1 m H n j Q c e c
The volume of oil-based drilling fluid waste is expressed in the following Equation (12):
V o b w = n = 1 n i j = 1 m H n j Q c
For cementing slurry waste, each cementing operation adds 30 m3, and for tank cleaning wastewater, an additional 100 m3 is generated per well. In these formulas, Vwbw and Vobw represent the volumes (in m3) of water-based and oil-based drilling fluid waste produced for the nth well on platform i; Hnj is the drilling depth (in meters) for the jth drilling of the nth well; Qc is the drilling cuttings generation per meter (in m3/m); and ec is the cuttings expansion factor (taken as 2). With individual cost components for rig operations, materials, and waste treatment defined, we next aggregate these into a single platform-level engineering cost to facilitate comparative analysis.

2.2.3. Drilling Engineering Costs

The drilling engineering cost for platform i is given by the following Equation (13):
C d r i = C z j i + C d x i + C g j i + C c l i + C m c i = n = 1 n i j = 1 m R n j T z n j + j = 1 m D n j T d x n j + j = 1 m G n j + j = 1 m a = 1 4 H n j q a n j + B n V n
where Cdri is the drilling engineering cost for platform i (covering ni wells) in yuan. The total drilling engineering cost for k platforms in the block is as follows:
C d r = i = 1 k C d r i

2.2.4. Optimized Economic Evaluation Model

In order to optimize the economic evaluation equation of intensive drilling, so that the model can not only calculate the overall drilling cost, but also explicitly consider the synergistic effect of intensive drilling parameters and introduce the requirement of decision timeliness, the core idea is to incorporate a “collaborative factor” into cost calculation to reflect cost savings under the intensive drilling mode (such as reducing land occupation, relocating shared drilling rigs, reusing materials, etc.) and to establish an optimized decision function that balances cost minimization and rapid decision response.
  • Combined Cost Function
The total cost Ctotal for an intensive drilling platform is the sum of the pre-drilling cost Cpre, drilling operation cost Cdrill, material cost Cmat, and drilling fluid treatment cost Ctreat, as in the following Equation (15):
C t o t a l   = C p r e   + C d r i l l   + C m a t   + C t r e a t  
Each component is modified by a synergy factor that reflects the benefits of intensive drilling. Cpre represents the pre-drilling engineering cost (from Equations (1)–(4)); Cdrill represents the drilling operation cost (from Equations (5)–(7)); Cmat represents the drilling material cost (from Equations (8)–(9)); Ctreat represents the drilling fluid environmentally safe treatment cost (from Equation (10), with additional details in (11)–(12)).
  • Pre-Drilling Cost with Synergy Effect
The pre-drilling cost Cpre is composed of land acquisition, well-site construction, and equipment mobilization/demobilization costs. We introduce a synergy factor Φpre (with 0 < Φpre ≤ 1) to account for the cost reductions obtained from optimized layout and shared resources, as follows:
C p r e   = Φ p r e   [ A 1 i   + A 2 i   + A 3 i   ]
A sample formulation for Φpre is as follows:
Φ p r e   = 1 α · n i   n 0 n i      
where ni is the number of wells on the platform, n0 is the baseline well number (e.g., 4), and α (0–1) is a tuning parameter representing synergy intensity.
  • Drilling Operation Cost with Synergy Effect
The drilling operation cost Cdrill includes rig operating costs, directional drilling service costs, and cementing costs. We incorporate a synergy factor Φdrill that captures the reduction in per-well rig operation costs due to shared cycles and optimized scheduling, as follows:
C d r i l l   = n = 1 n i   j = 1 j   [ R n j   T z n j   · Φ d r i l l   + D n j   T d x n j   + G n j   ]
where Rnj and Tznj are from Equation (5), Dnj and Tdxnj are from Equation (6), and Gnj is from Equation (7)
A possible formulation for Φdrill is as follows:
Φ d r i l l   = 1 β · ( T s i n g l e T f a c t o r y     1 )
where Tfactory is the drilling cycle under the well factory mode, Tsingle is the drilling cycle for conventional single-well drilling, and β is a synergy coefficient reflecting operational efficiency gains.
  • Material Cost with Synergy Effect
The drilling material cost Cmat (including drill bits, drilling fluids, casing, and cement slurry) can be expressed as follows:
C m a t   = n = 1 n i   j = 1 j a = 1 4     ( q a n j   · H n j   ) · Φ m a t  
where qanj and Hnj are from Equation (8) and the reduction Δq2nj as defined in Equation (9). Here, Φmat accounts for cost reductions due to bulk procurement and reuse (for example, recycling of drilling fluids). A possible expression is as follows:
Φ m a t   = 1 γ · ( V r e u s e d V t o t a l       )
where γ is a coefficient of material reuse efficiency, Vreused is the volume of drilling fluid reused, and Vtotal is the total volume required without reuse.
  • Drilling Fluid Treatment Cost
The drilling fluid treatment cost Ctreat remains as follows:
C t r e a t = n = 1 n i ( V n   · B n   )
where Vn is the volume of waste and Bn is the unit cost of treatment, with Vn and Bn defined in Equation (10). Although this cost is less affected by synergy, coordination in waste management can be embedded in overall scheduling.
  • Final Integrated Equation
By summing the modified cost components across all k platforms, the integrated cost function becomes as follows:
C t o t a l = i = 1 k { Φ p r e   [ A 1 i   + A 2 i   + A 3 i   ] + n = 1 n i   j = 1 j   [ R n j   T z n j   · Φ d r i l l   + D n j   T d x n j   + G n j   ] + n = 1 n i   j = 1 j a = 1 4     ( q a n j   · H n j   ) · Φ m a t + Δ q 2 n j + n = 1 n i ( V n   · B n   ) }
  • Decision Timeliness Optimization
To meet the decision timeliness requirements, we propose an objective function that not only minimizes the total cost but also minimizes the decision response time Tdecision. This is achieved by integrating a penalty term, as follows:
p m i n   { F ( P ) = C t o t a l   ( P ) + λ T d e c i s i o n   ( P ) }
where P represents the vector of decision parameters (e.g., well spacing, drilling cycle, number of wells), Tdecision(P) is the estimated decision-making time (which could be modeled based on computational complexity or data processing time), and λ is a weighting factor that balances cost minimization and decision speed.
By tuning λ, decisionmakers can prioritize faster response times (at potentially slightly higher cost) or lower costs (with longer decision times).
In Formulas (16)–(24), the synergy coefficients Φpre, Φdrill, and Φmat reflect the efficiency improvements brought by centralized operations by scaling pre-drilling costs, drilling operation costs, and material costs, respectively. Increasing Φ (approaching 1) means a weakening of the synergy effect, at which point the total cost output of the model is closer to the baseline value in the absence of synergy; conversely, when Φ approaches 0, it indicates the idealized maximum synergy effect, significantly reducing output costs. Specifically, increasing α, β, or γ can reduce the corresponding Φpre (Equation (17)), Φdrill (Equation (19)), or Φmat (Equation (21)), thereby achieving a lower Cfactory at the same platform scale. Meanwhile, the decision timeliness weight λ directly impacts the cost-time balance in the objective function (Equation (24)). When λ increases, the model prioritizes faster decision-making responses (i.e., a smaller Tdecision), even if it means accepting a slightly higher Cfactory; conversely, when λ decreases, it emphasizes cost minimization while relaxing the requirements for timeliness. Therefore, by adjusting λ, decisionmakers can flexibly switch between “cost optimal” and “fastest response” approaches, allowing the model to better adapt to different project stages or management needs. Please refer to the appendix for more information and details (Appendix A and Appendix B).

3. Results and Discussions

3.1. Validation of the Established Model

The following section validates this integrated cost–timeliness model using field data from the Shengli Oilfield Yan 227 block, illustrating both savings and practical deployment insights. To validate the accuracy of the established model, an analysis was conducted using the platform well in the Shengli Oilfield Yan 227 block. The specific parameters for this study are as follows. The well is a two-dimensional, three-section directional well with a land acquisition area of 13,200 m2 for the first well, and the associated land cost is CNY 10 per m2. The fixed pre-drilling cost per single-well site is CNY 300,000. In this case, the well factory consists of one platform accommodating a total of nine wells and covering an area of 42,500 m2. The drilling is performed using a fully automated Model 70 rig, which incurs a daily cost of CNY 25,000 for both rig operation and labor. The drilling cycle for the well factory is 90 days, whereas each single well requires 200 days of drilling. Directional drilling incurs a cost of CNY 8000 per day, with the well factory dedicating 20 days to directional drilling and each individual well 10 days. For rig relocation within a single-row wellhead, a major relocation costs CNY 230,000 per move and an integrated transportation move costs CNY 96,000 per move. The average well depth is 4500 m. The drill bits used are sized at Ø311.2 mm for the second section and Ø215.9 mm for the third section, at a cost of CNY 22 per meter. Drilling fluid is priced at CNY 250 per meter, and 235.44 m3 of drilling fluid is reused. The cost of cement slurry is CNY 12.58 per meter, while casing costs are based on a second section technical casing of Ø244.5 mm and a third section reservoir casing of Ø139.5 mm, with a unit cost of CNY 230 per meter. Finally, waste treatment is carried out at a unit cost of CNY 500 per m3.
Figure 2, Figure 3 and Figure 4 illustrate the expenses for pre-drilling, drilling operations, drilling materials, and overall drilling investment under both the well factory model and the conventional single-well construction model. In both models, the costs for drilling operations and materials constitute the majority of the overall drilling expenses. Under the well factory model, the combined cost of these two components is CNY 41.58 million, accounting for 81% of the total drilling cost. Within the drilling operation costs, 91% is attributable to rig expenses, while the total cost for casing and drilling fluid amounts to CNY 18.37 million, representing 93% of the drilling material expenses. In contrast, the conventional single-well construction model incurs a combined cost of CNY 66.19 million for drilling operations and materials, which account for 83% of the total drilling cost, and the casing and drilling fluid expenses in this model total CNY 19.44 million, also comprising 93% of the drilling material costs.
Figure 5 presents a detailed comparison of the drilling costs under the well factory mode versus the conventional single-well drilling mode. The analysis reveals that the well factory mode significantly reduces both pre-drilling and drilling operation expenses. In particular, the pre-drilling costs decrease dramatically from 5.958 million yuan in the conventional approach to 2.331 million yuan under the well factory model, achieving a remarkable 61% reduction in investment. Similarly, drilling operation costs are substantially reduced, falling from 45.3462 million yuan to 21.8112 million yuan, which translates to a 52% saving. As a result, the overall drilling cost is lowered from 79.8847 million yuan to 51.6004 million yuan, representing a total investment saving of 34%.
These cost reductions can be attributed to several factors inherent in the well factory approach. The centralized design and standardized operating procedures in a well factory enable economies of scale that optimize resource utilization, streamline operations, and reduce redundancies. By consolidating pre-drilling activities, such as land acquisition and site preparation, the well factory model minimizes the fixed costs that are typically high in conventional single-well projects. Moreover, the model promotes more efficient scheduling and utilization of drilling rigs, reducing idle time and operational delays, which are common in dispersed drilling operations.
The significant decrease in drilling operation costs is largely due to the effective management of rig mobilization and the optimized execution of directional drilling, which collectively reduce the overall time and labor required per well. Furthermore, the well factory mode benefits from improved bulk procurement of drilling materials and the potential for reusing drilling fluids, further lowering the variable costs associated with drilling operations.
In summary, the well factory mode not only enhances operational efficiency but also offers substantial cost savings, making it a highly attractive strategy for large-scale oil drilling projects. The substantial reductions in both pre-drilling and drilling operation costs underscore the economic benefits of adopting this integrated approach, which could ultimately improve the feasibility and competitiveness of unconventional oil and gas development.

3.2. The Impact of Platform Scale on Drilling Investment

A well pattern comprising 100 wells is divided among 1, 2, 3, 4, 6, 11, and 25 platforms, respectively, to analyze the impact of platform scale and well depth on drilling investment.

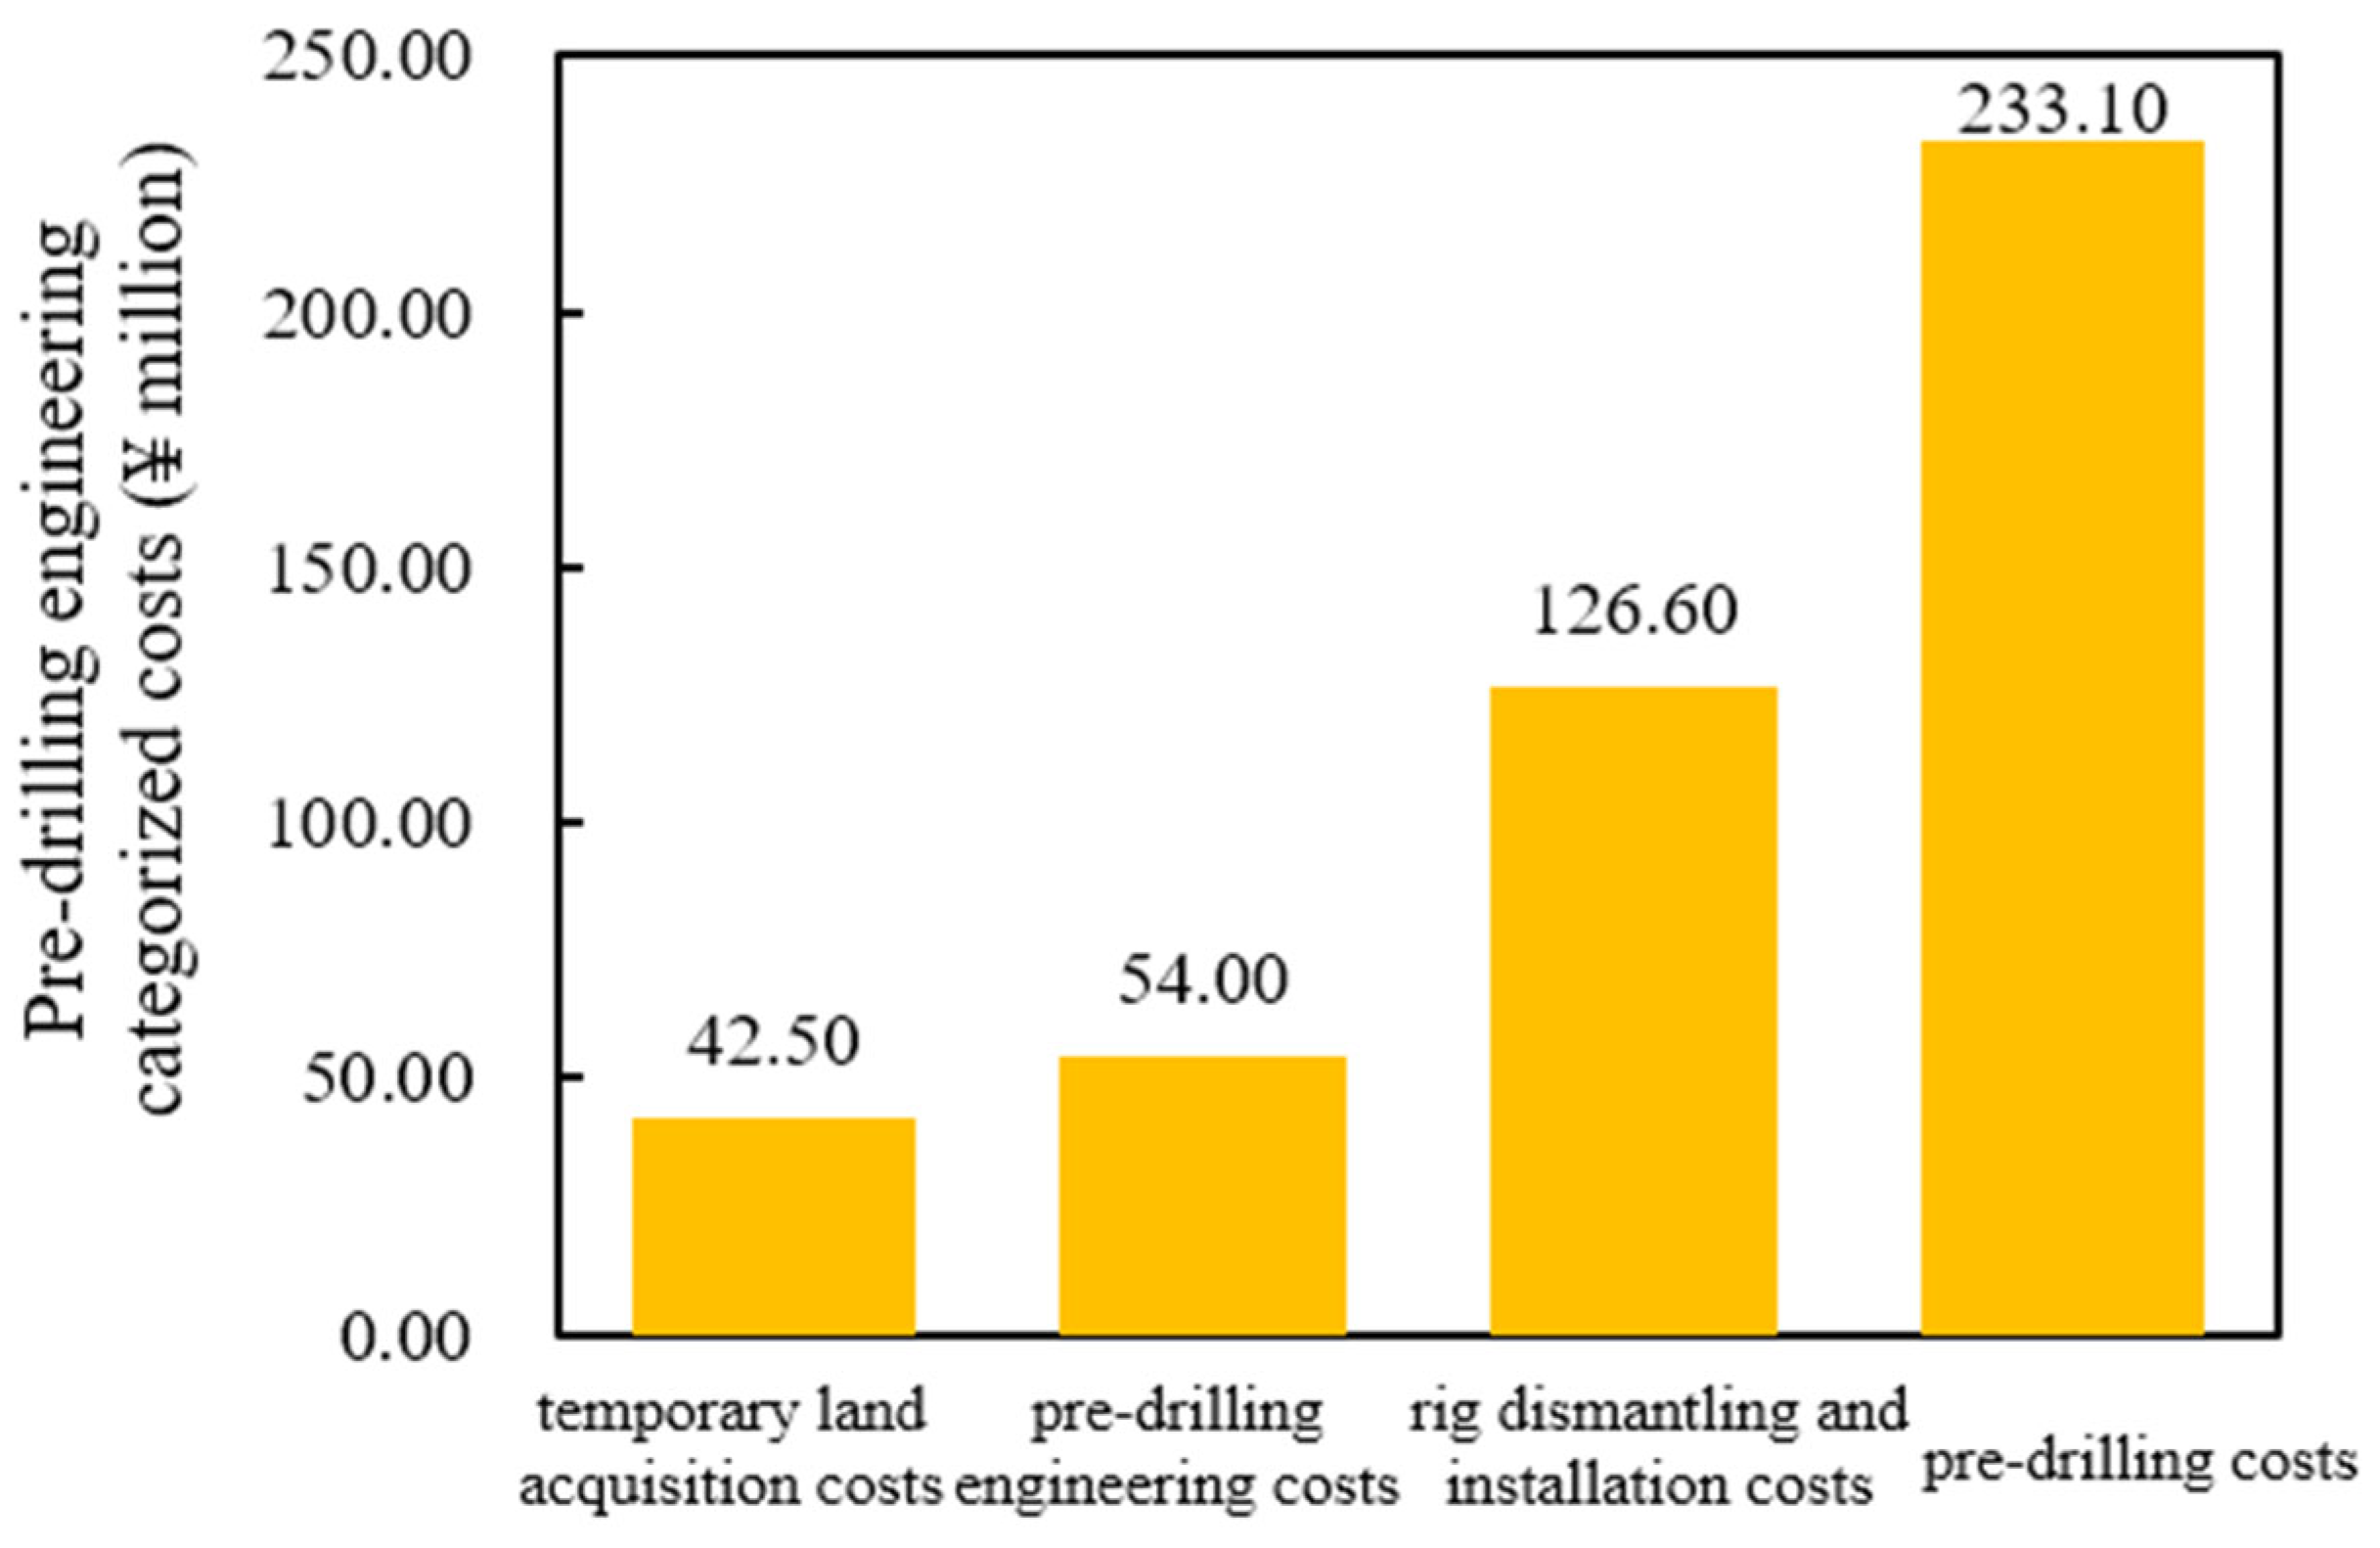
3.2.1. Temporary Land Acquisition Costs

Figure 6 illustrates the temporary land acquisition costs associated with different platform scales. The data clearly indicate that as the platform scale increases, the temporary land costs per well decrease markedly. This reduction is primarily due to the “well factory” concept, which employs a centralized well layout. In such a layout, multiple wells are drilled from a single platform, substantially reducing the average land area required per well. In addition to the reduction in area, larger platforms benefit from the economies of scale in site preparation, as fewer access roads and support facilities are needed. This approach not only minimizes the direct cost of land acquisition but also reduces ancillary expenses, thereby contributing to a lower overall investment in the early stages of development.

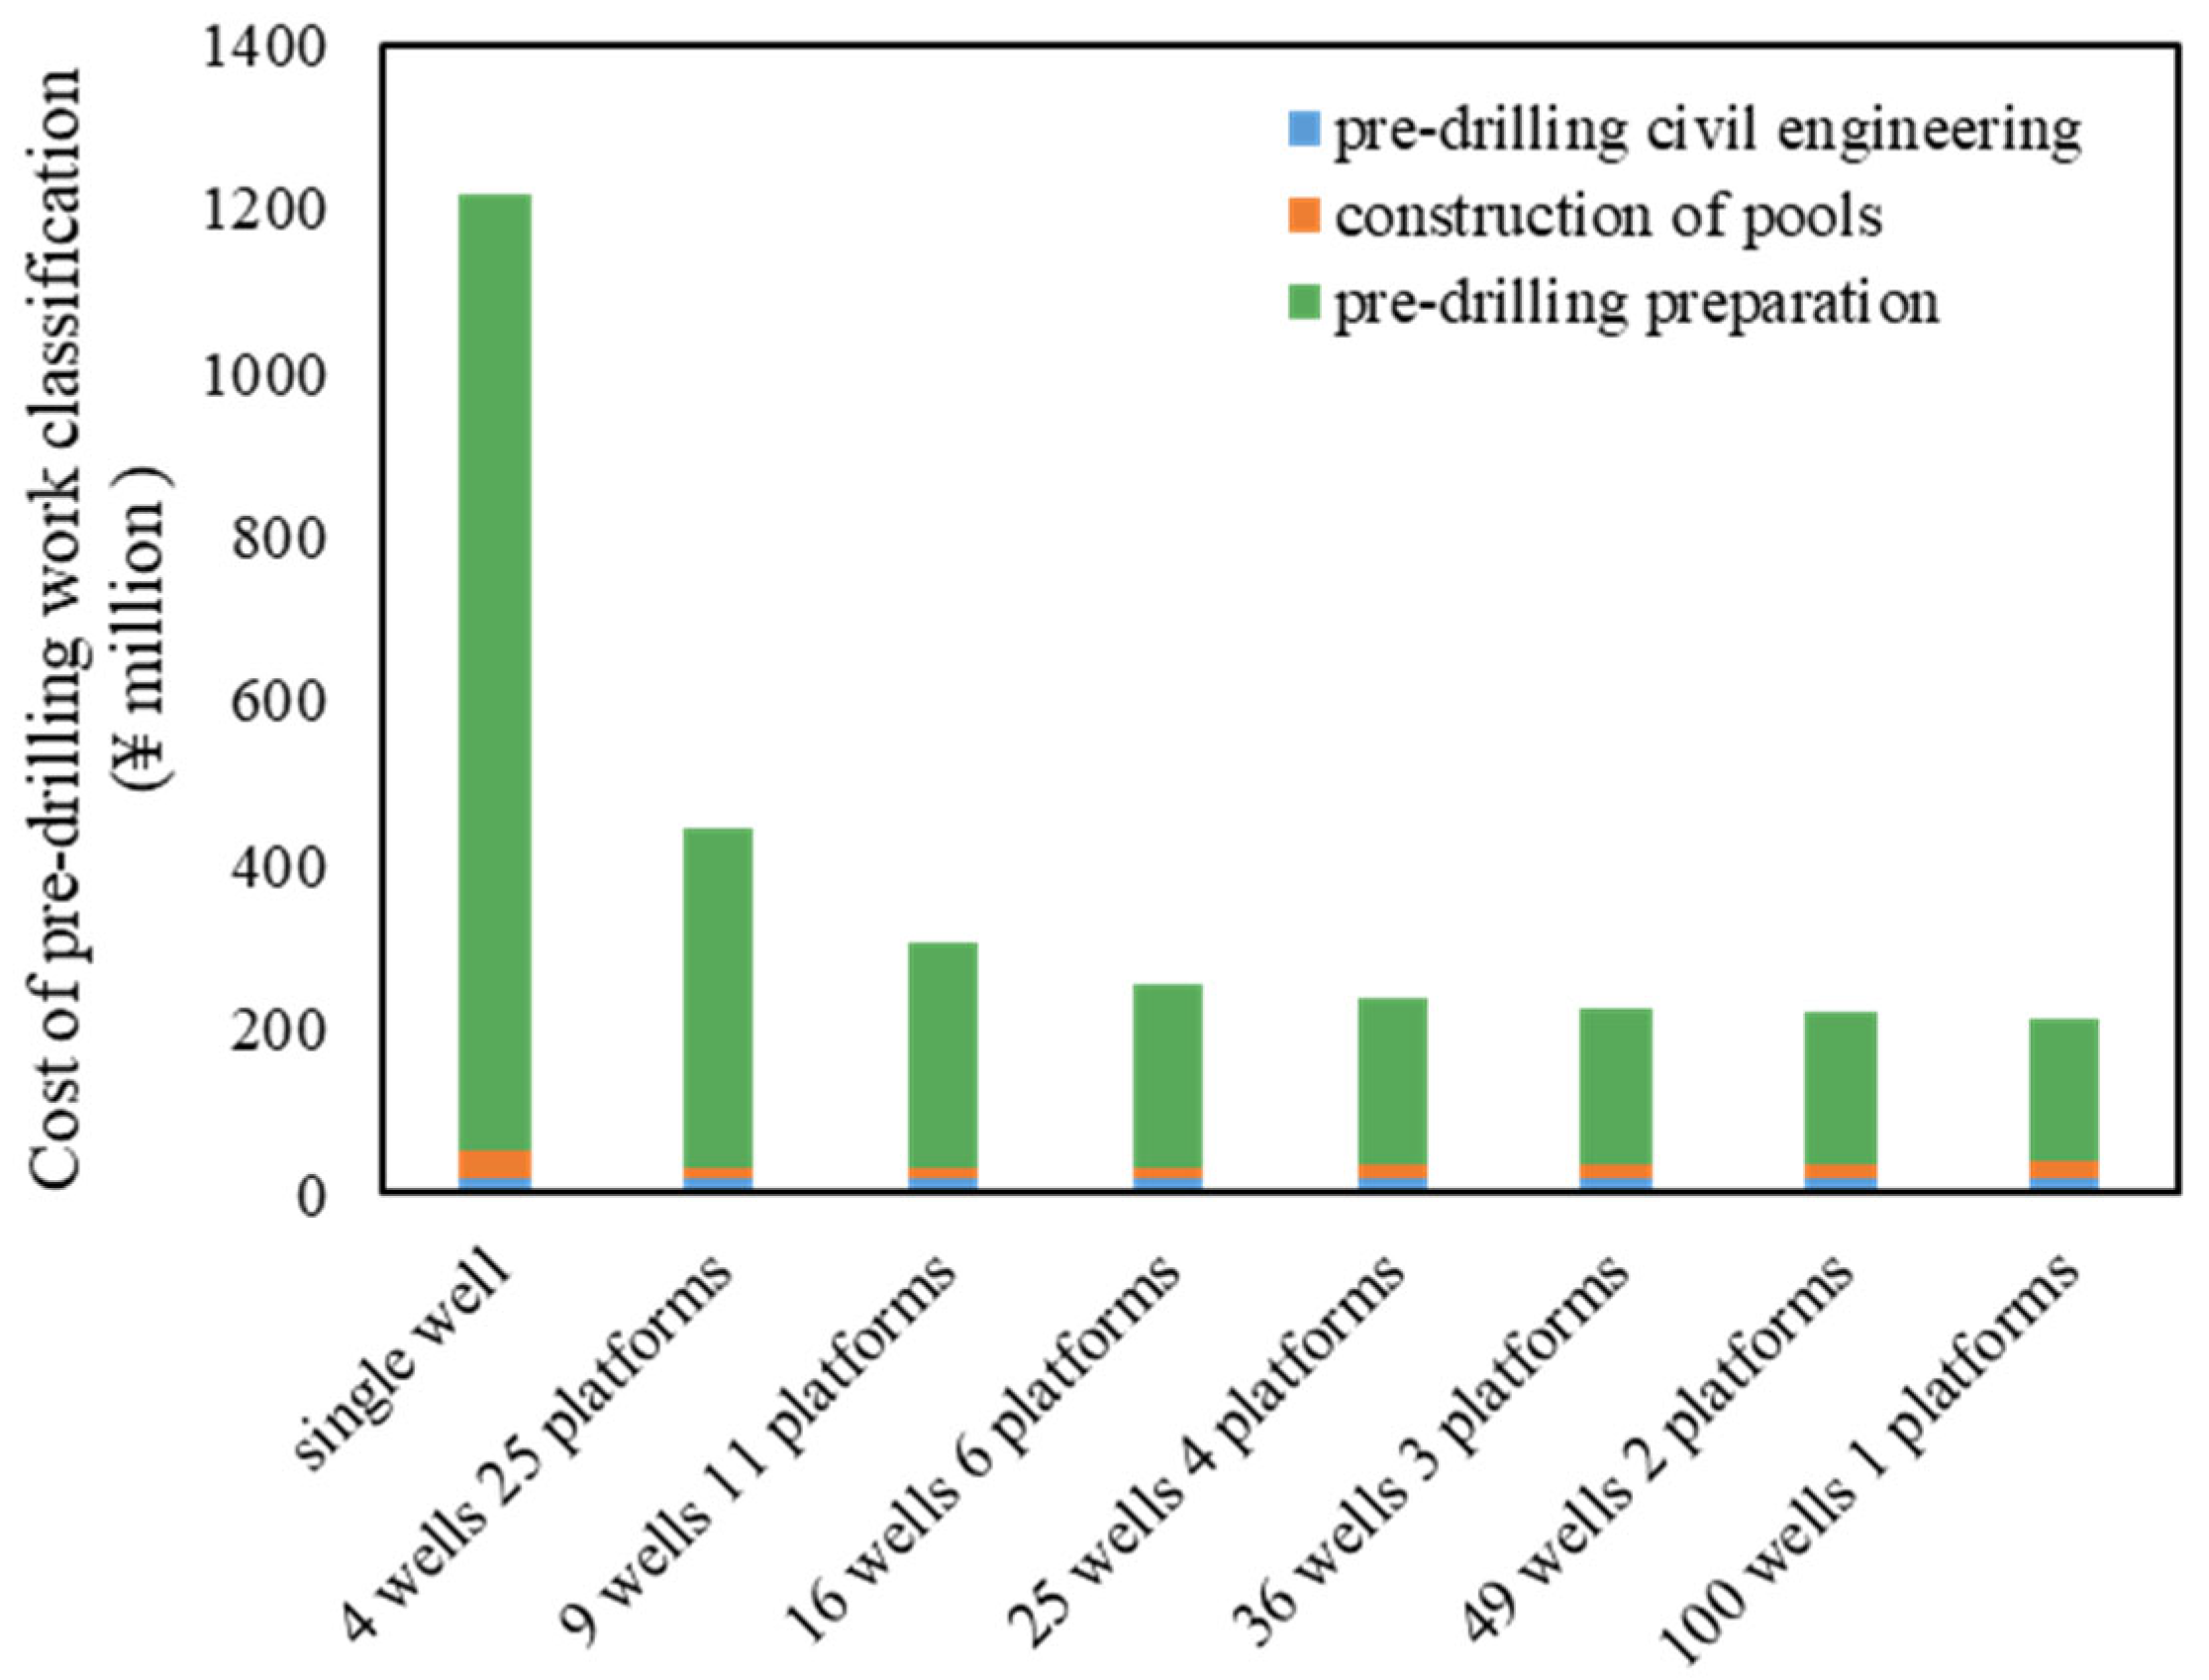
3.2.2. Pre-Drilling Engineering

Figure 7 present a detailed breakdown of pre-drilling engineering costs by category as well as the total pre-drilling investment for various platform scales. As the platform scale increases, the overall pre-drilling costs show a consistent decline. This is largely attributable to the fact that when multiple wells are integrated on a single platform, only one primary access road and a single centralized living or support area are required for all the wells, which significantly reduces the site construction expenses. Additionally, the “factory-based” drilling approach leverages an assembly-line method for pre-drilling activities, enabling simultaneous operations that reduce rig mobilization and installation costs. Fewer platforms in a given block mean fewer instances of expensive rig relocations, resulting in further cost reductions and a streamlined pre-drilling process.

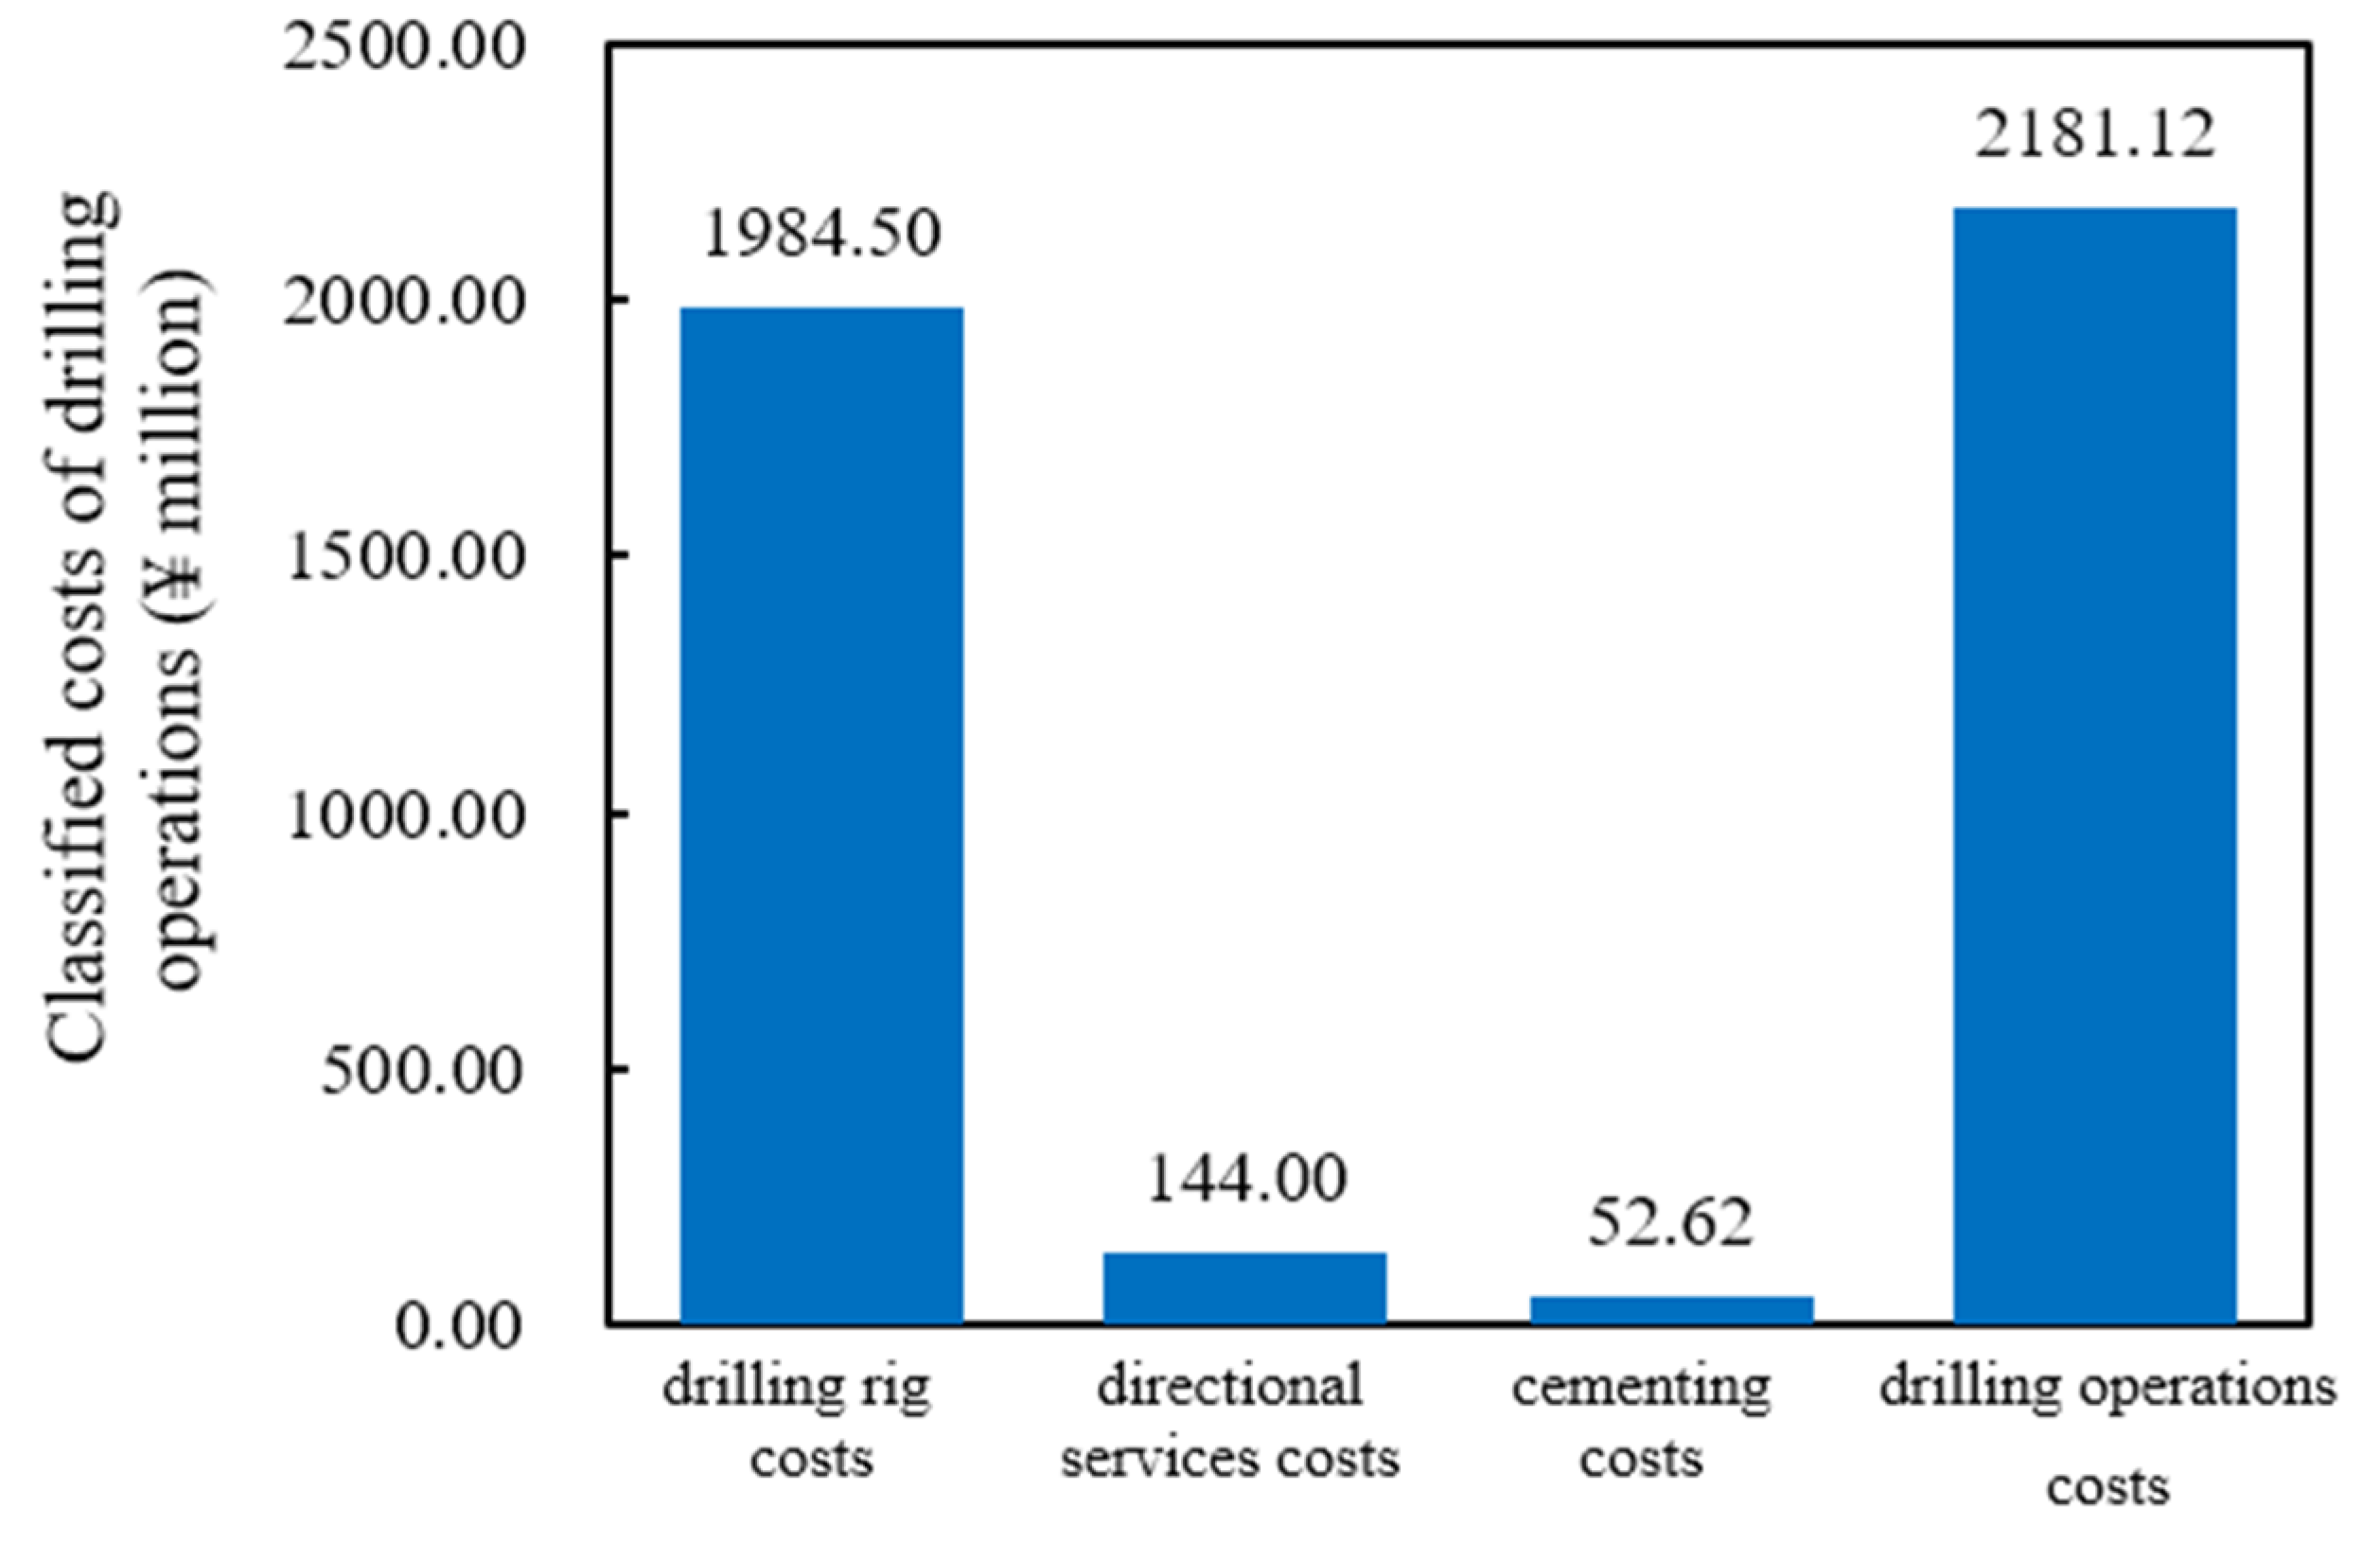
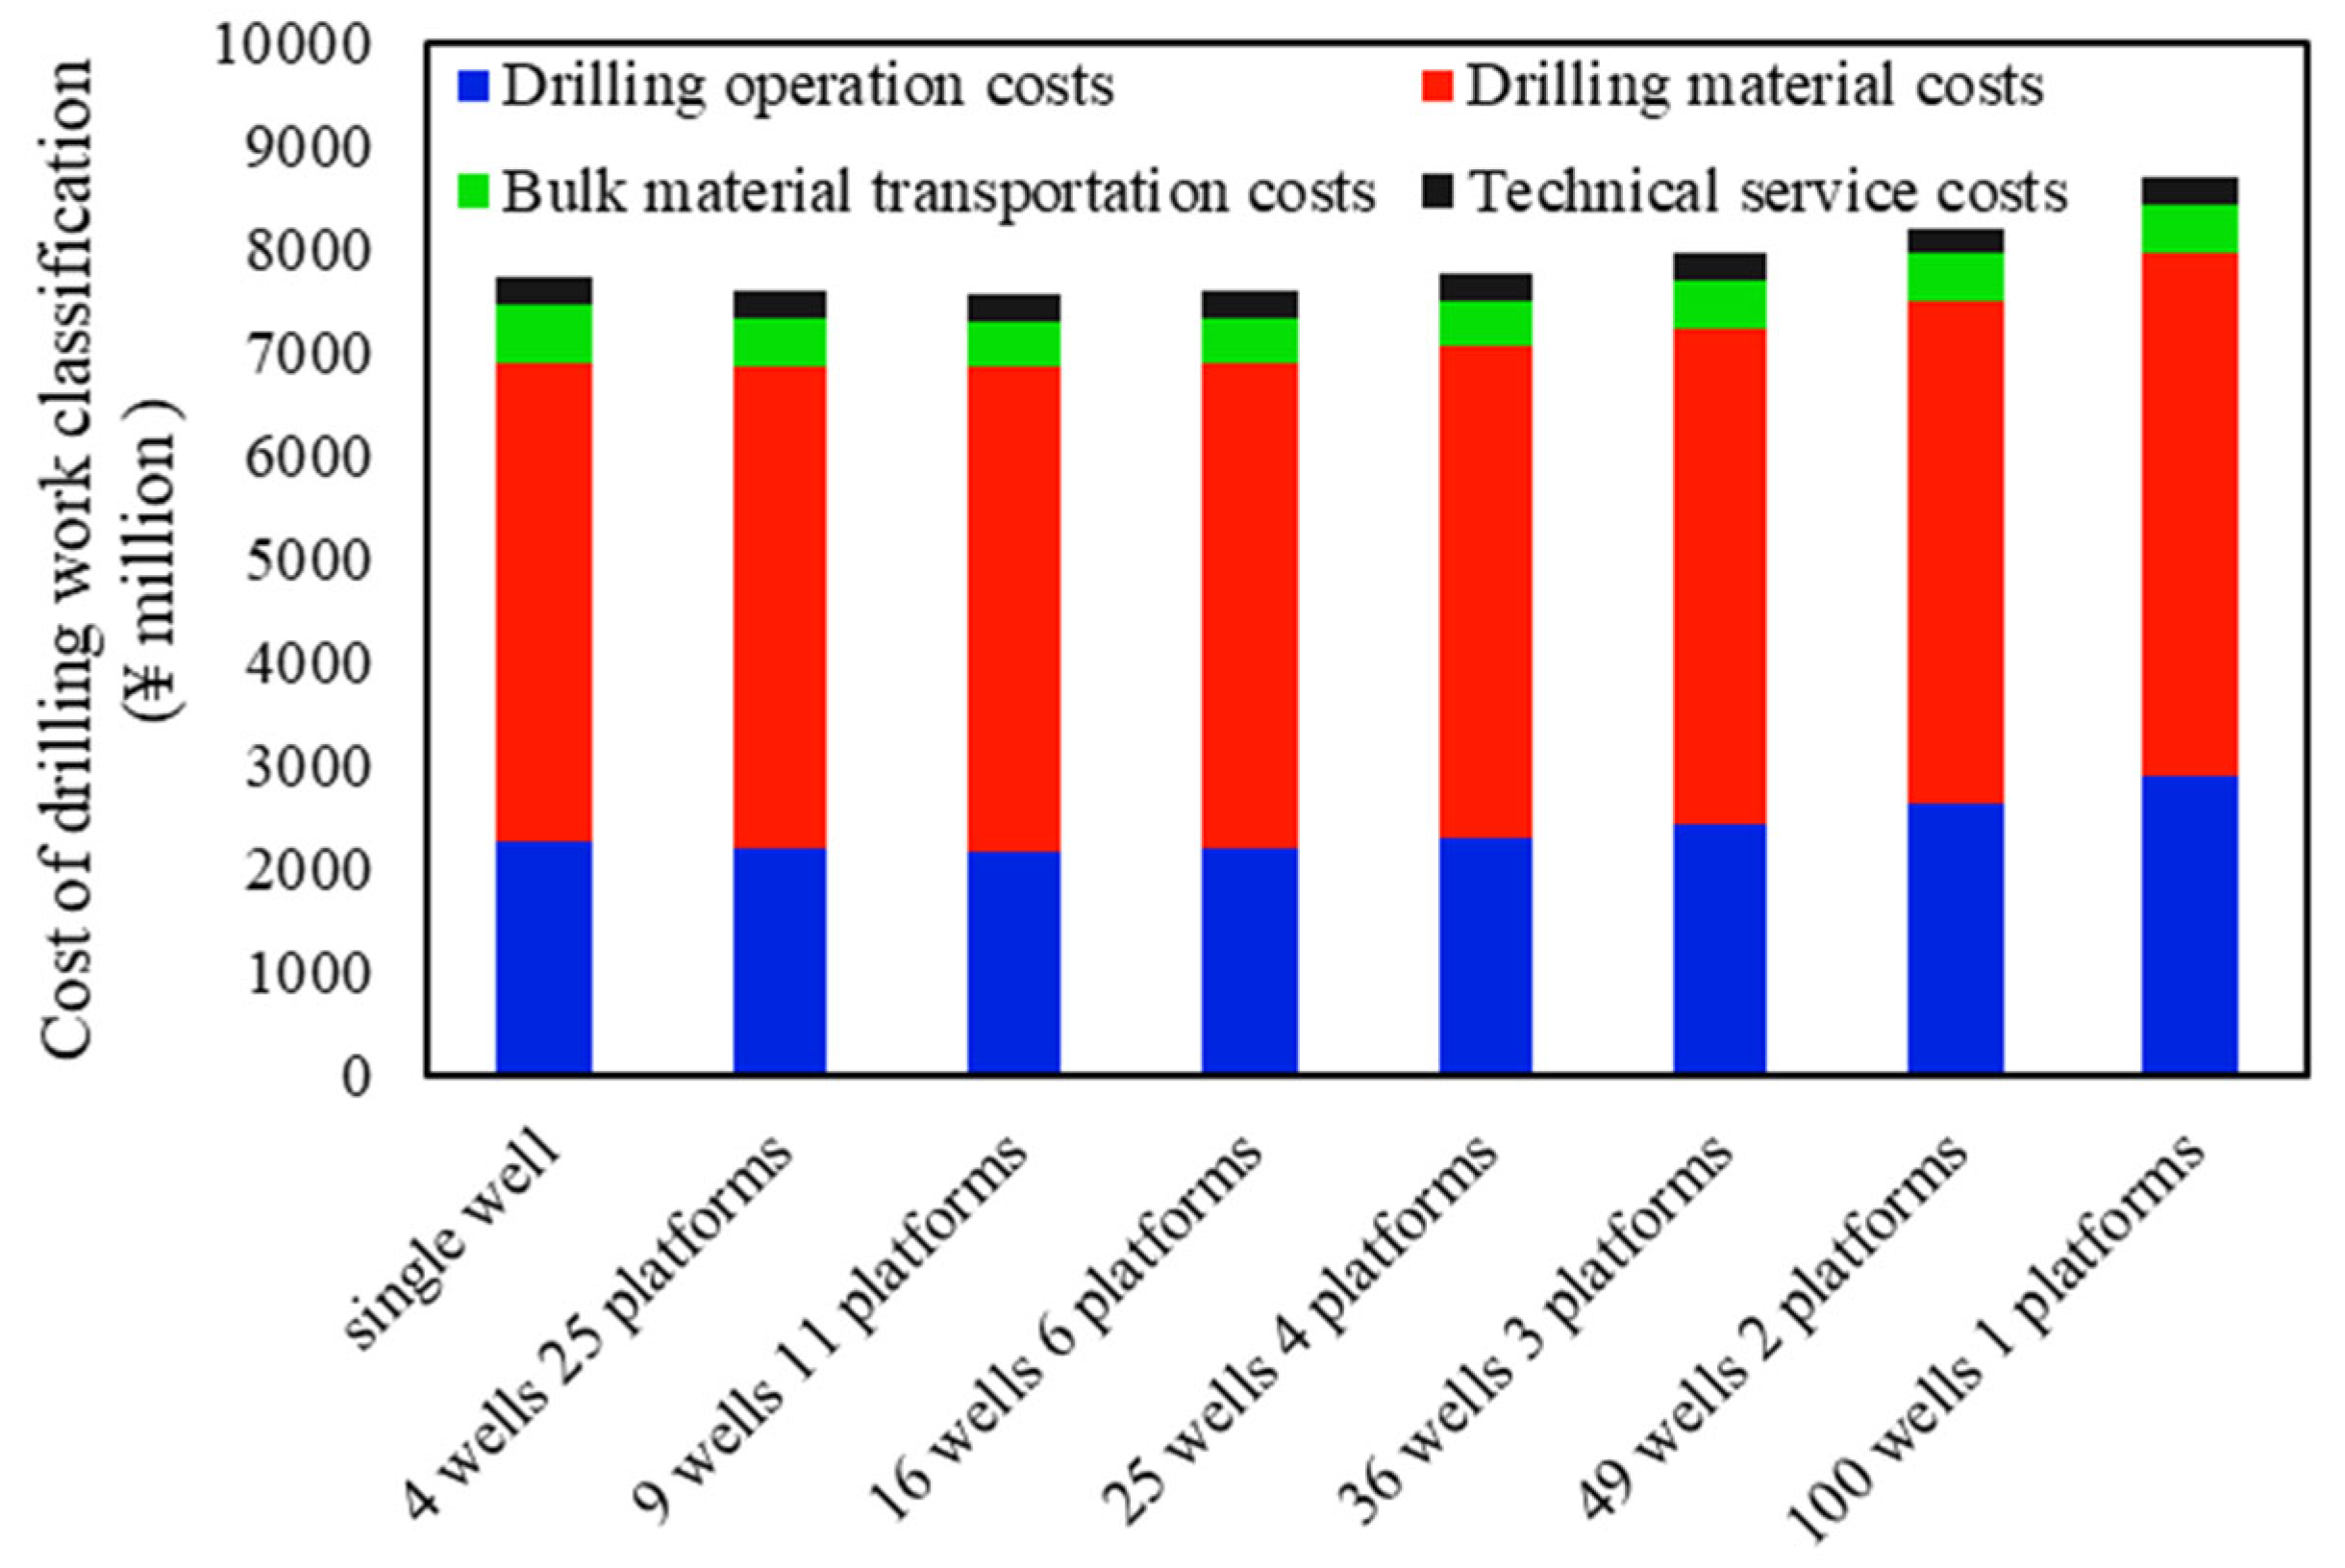
3.2.3. Drilling Engineering

Figure 8 depict the categorized and total drilling engineering costs across different platform scales. Interestingly, the drilling engineering expenses do not continuously decrease with increasing platform scale. Instead, an optimal platform configuration exists where these costs are minimized. This optimum is achieved because the “well factory” technology can substantially shorten the well construction cycle, thereby reducing cycle-dependent costs, such as rig operating costs. Moreover, improvements in drilling fluid circulation and reuse further reduce variable costs. However, as the number of wells per platform increases beyond a certain point, the benefits of centralization are offset by increases in drilling material costs and the logistics costs associated with transporting these materials. Thus, the relationship between platform scale and drilling engineering costs is non-linear, with an optimal scale that minimizes overall expenditure.

3.2.4. Cementing Engineering

Figure 9 provides insights into the breakdown of cementing engineering costs as well as the total cementing costs under varying platform scales. The analysis shows that an intermediate platform scale is most effective at minimizing cementing expenses. The centralized “well factory” layout initially leads to savings by consolidating operations; however, as the number of wells on a platform increases, the demand for cementing materials also rises. This results in higher costs for cement mixing, testing, and related services. Consequently, there is a direct correlation between the number of wells per platform and the cementing costs incurred. The optimal platform size is, thus, one that balances the advantages of centralized operations against the incremental increases in material and service costs, achieving the lowest possible cementing investment.

3.2.5. Drilling Fluid Waste Treatment

Figure 10 displays the drilling fluid waste treatment costs for different platform scales. Waste treatment expenses are directly linked to the total volume of drilling fluid processed, which includes both the fluid that is recycled and the fluid that is consumed during operations. As the platform scale increases, the overall volume of drilling fluid used also increases, leading to higher waste treatment costs. However, centralized operations offer opportunities for improved efficiency in managing waste, such as more effective recycling processes and better bulk handling logistics. The analysis reveals that there is an optimal platform scale at which these efficiencies are maximized, and the drilling fluid waste treatment costs are minimized. This optimal scale is determined by the balance between increased fluid usage and the enhanced capabilities for processing and recycling in a centralized system.

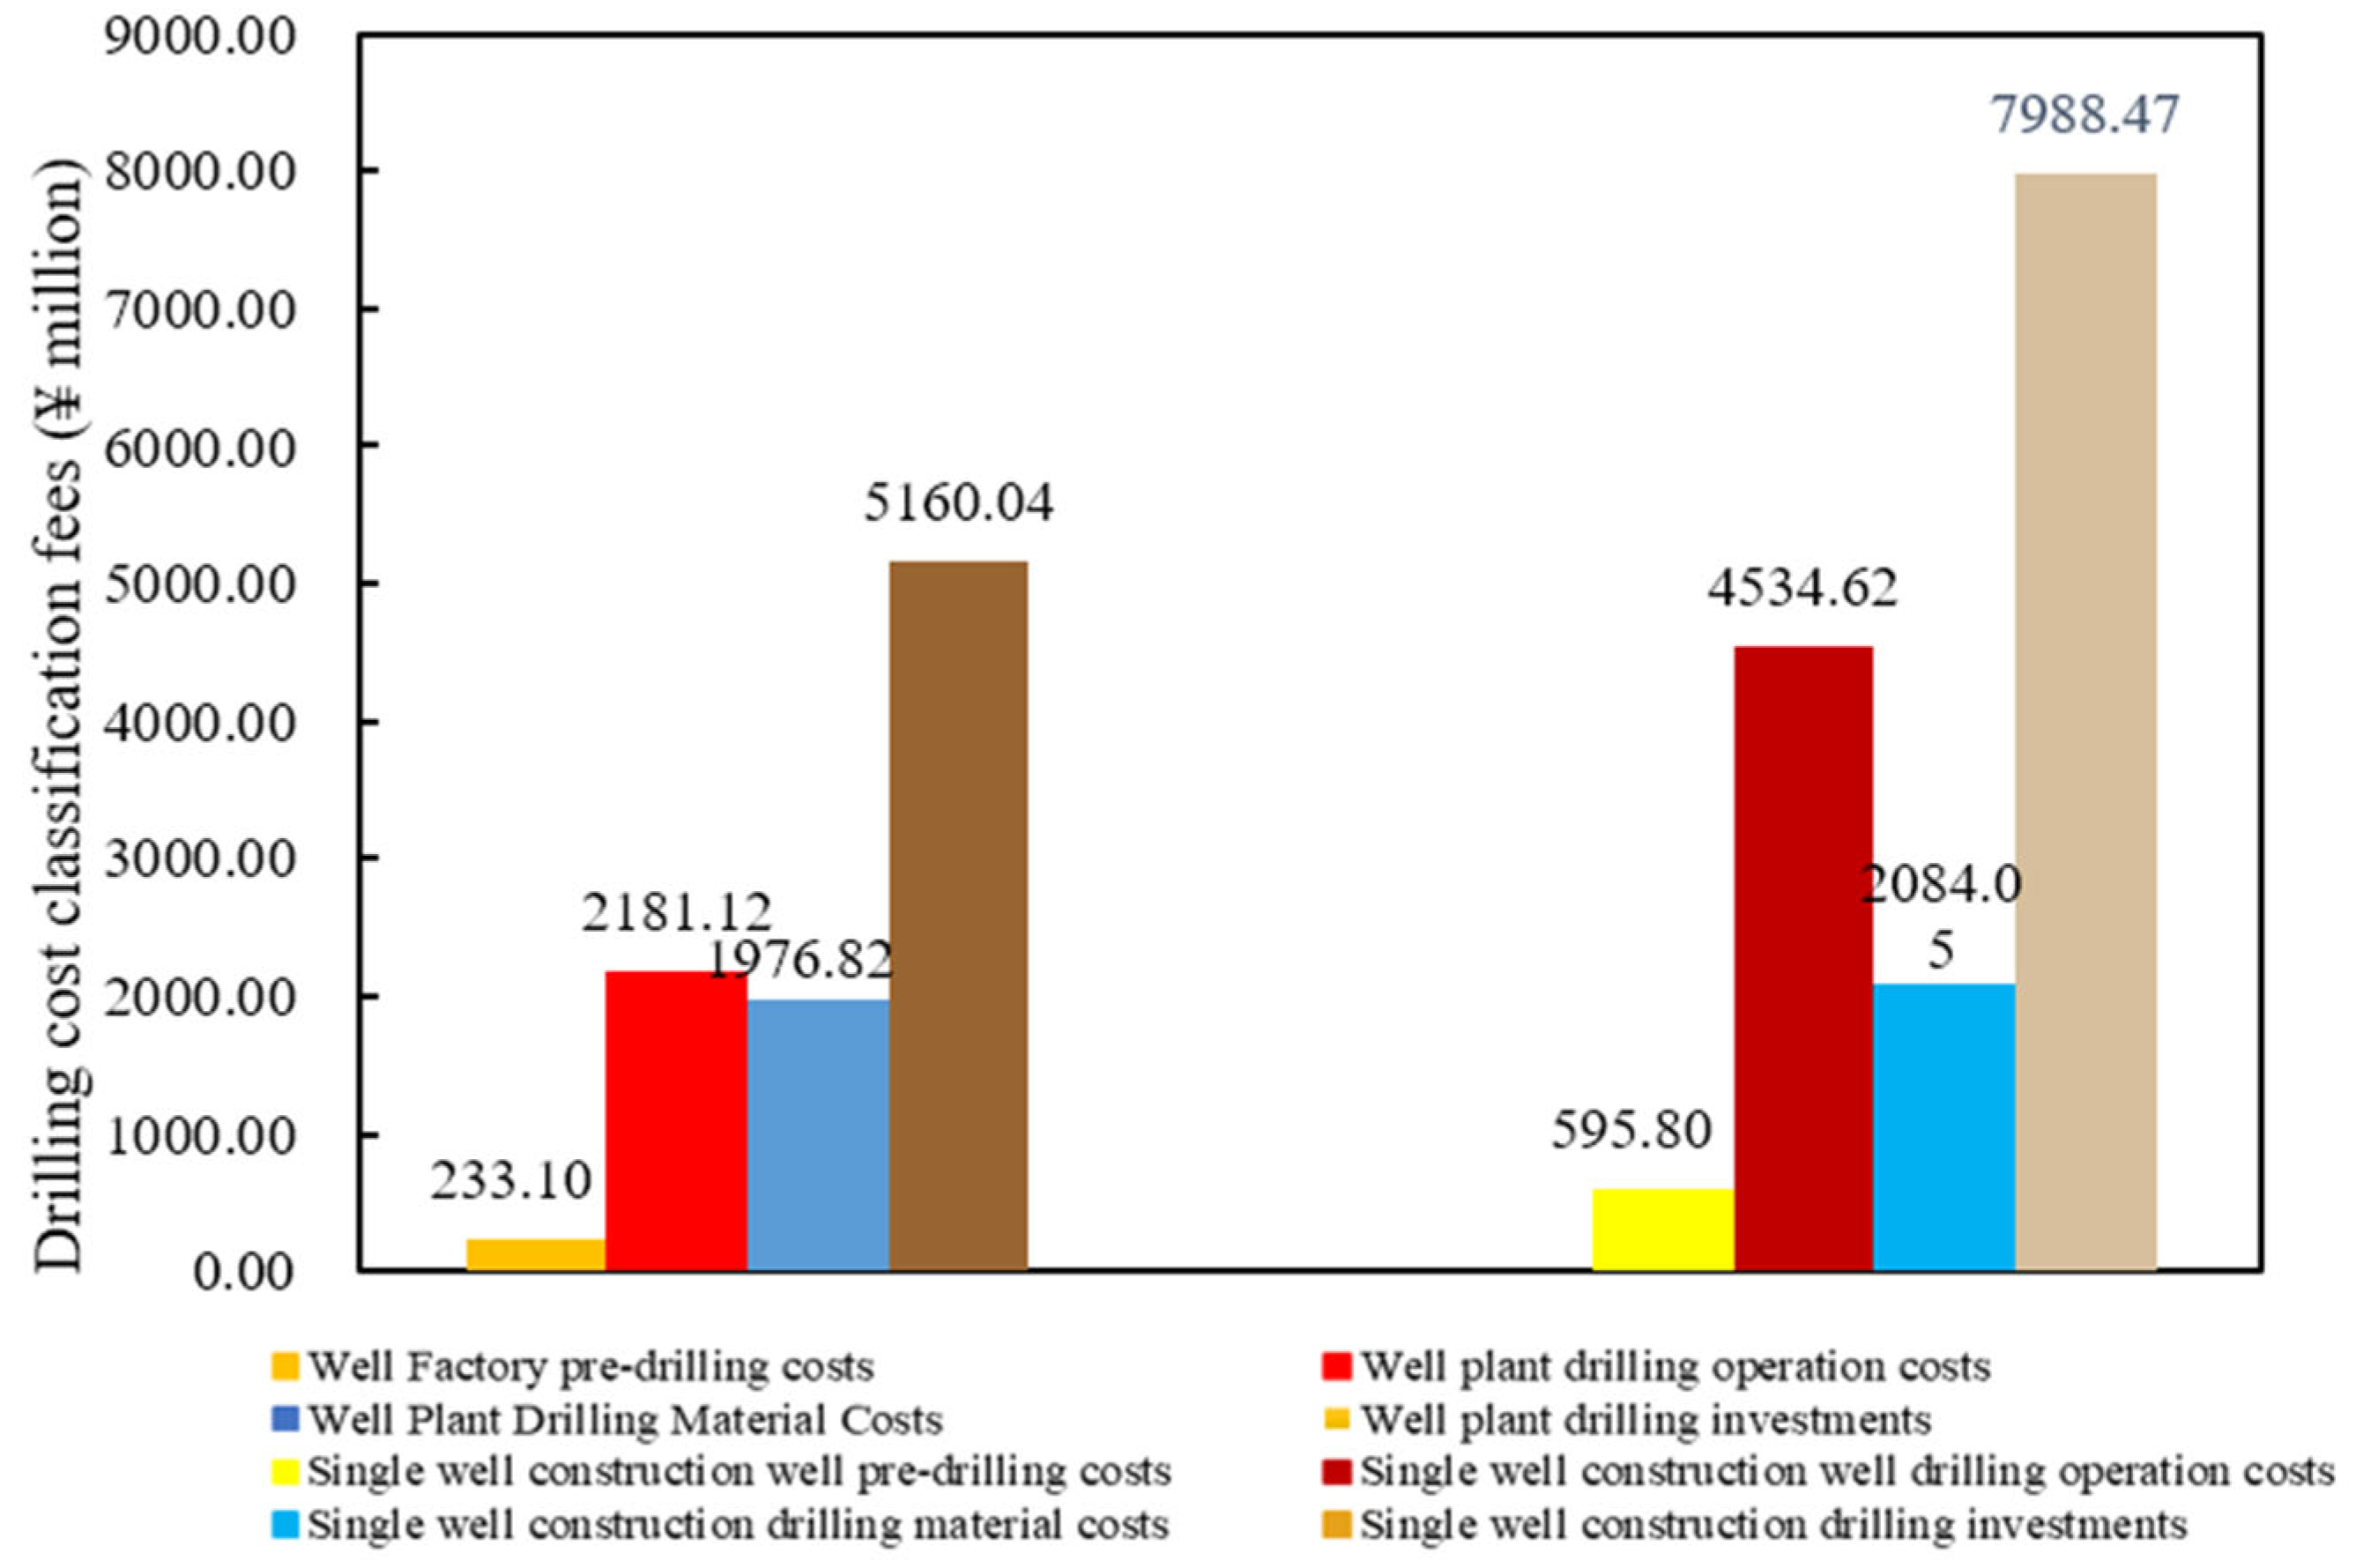
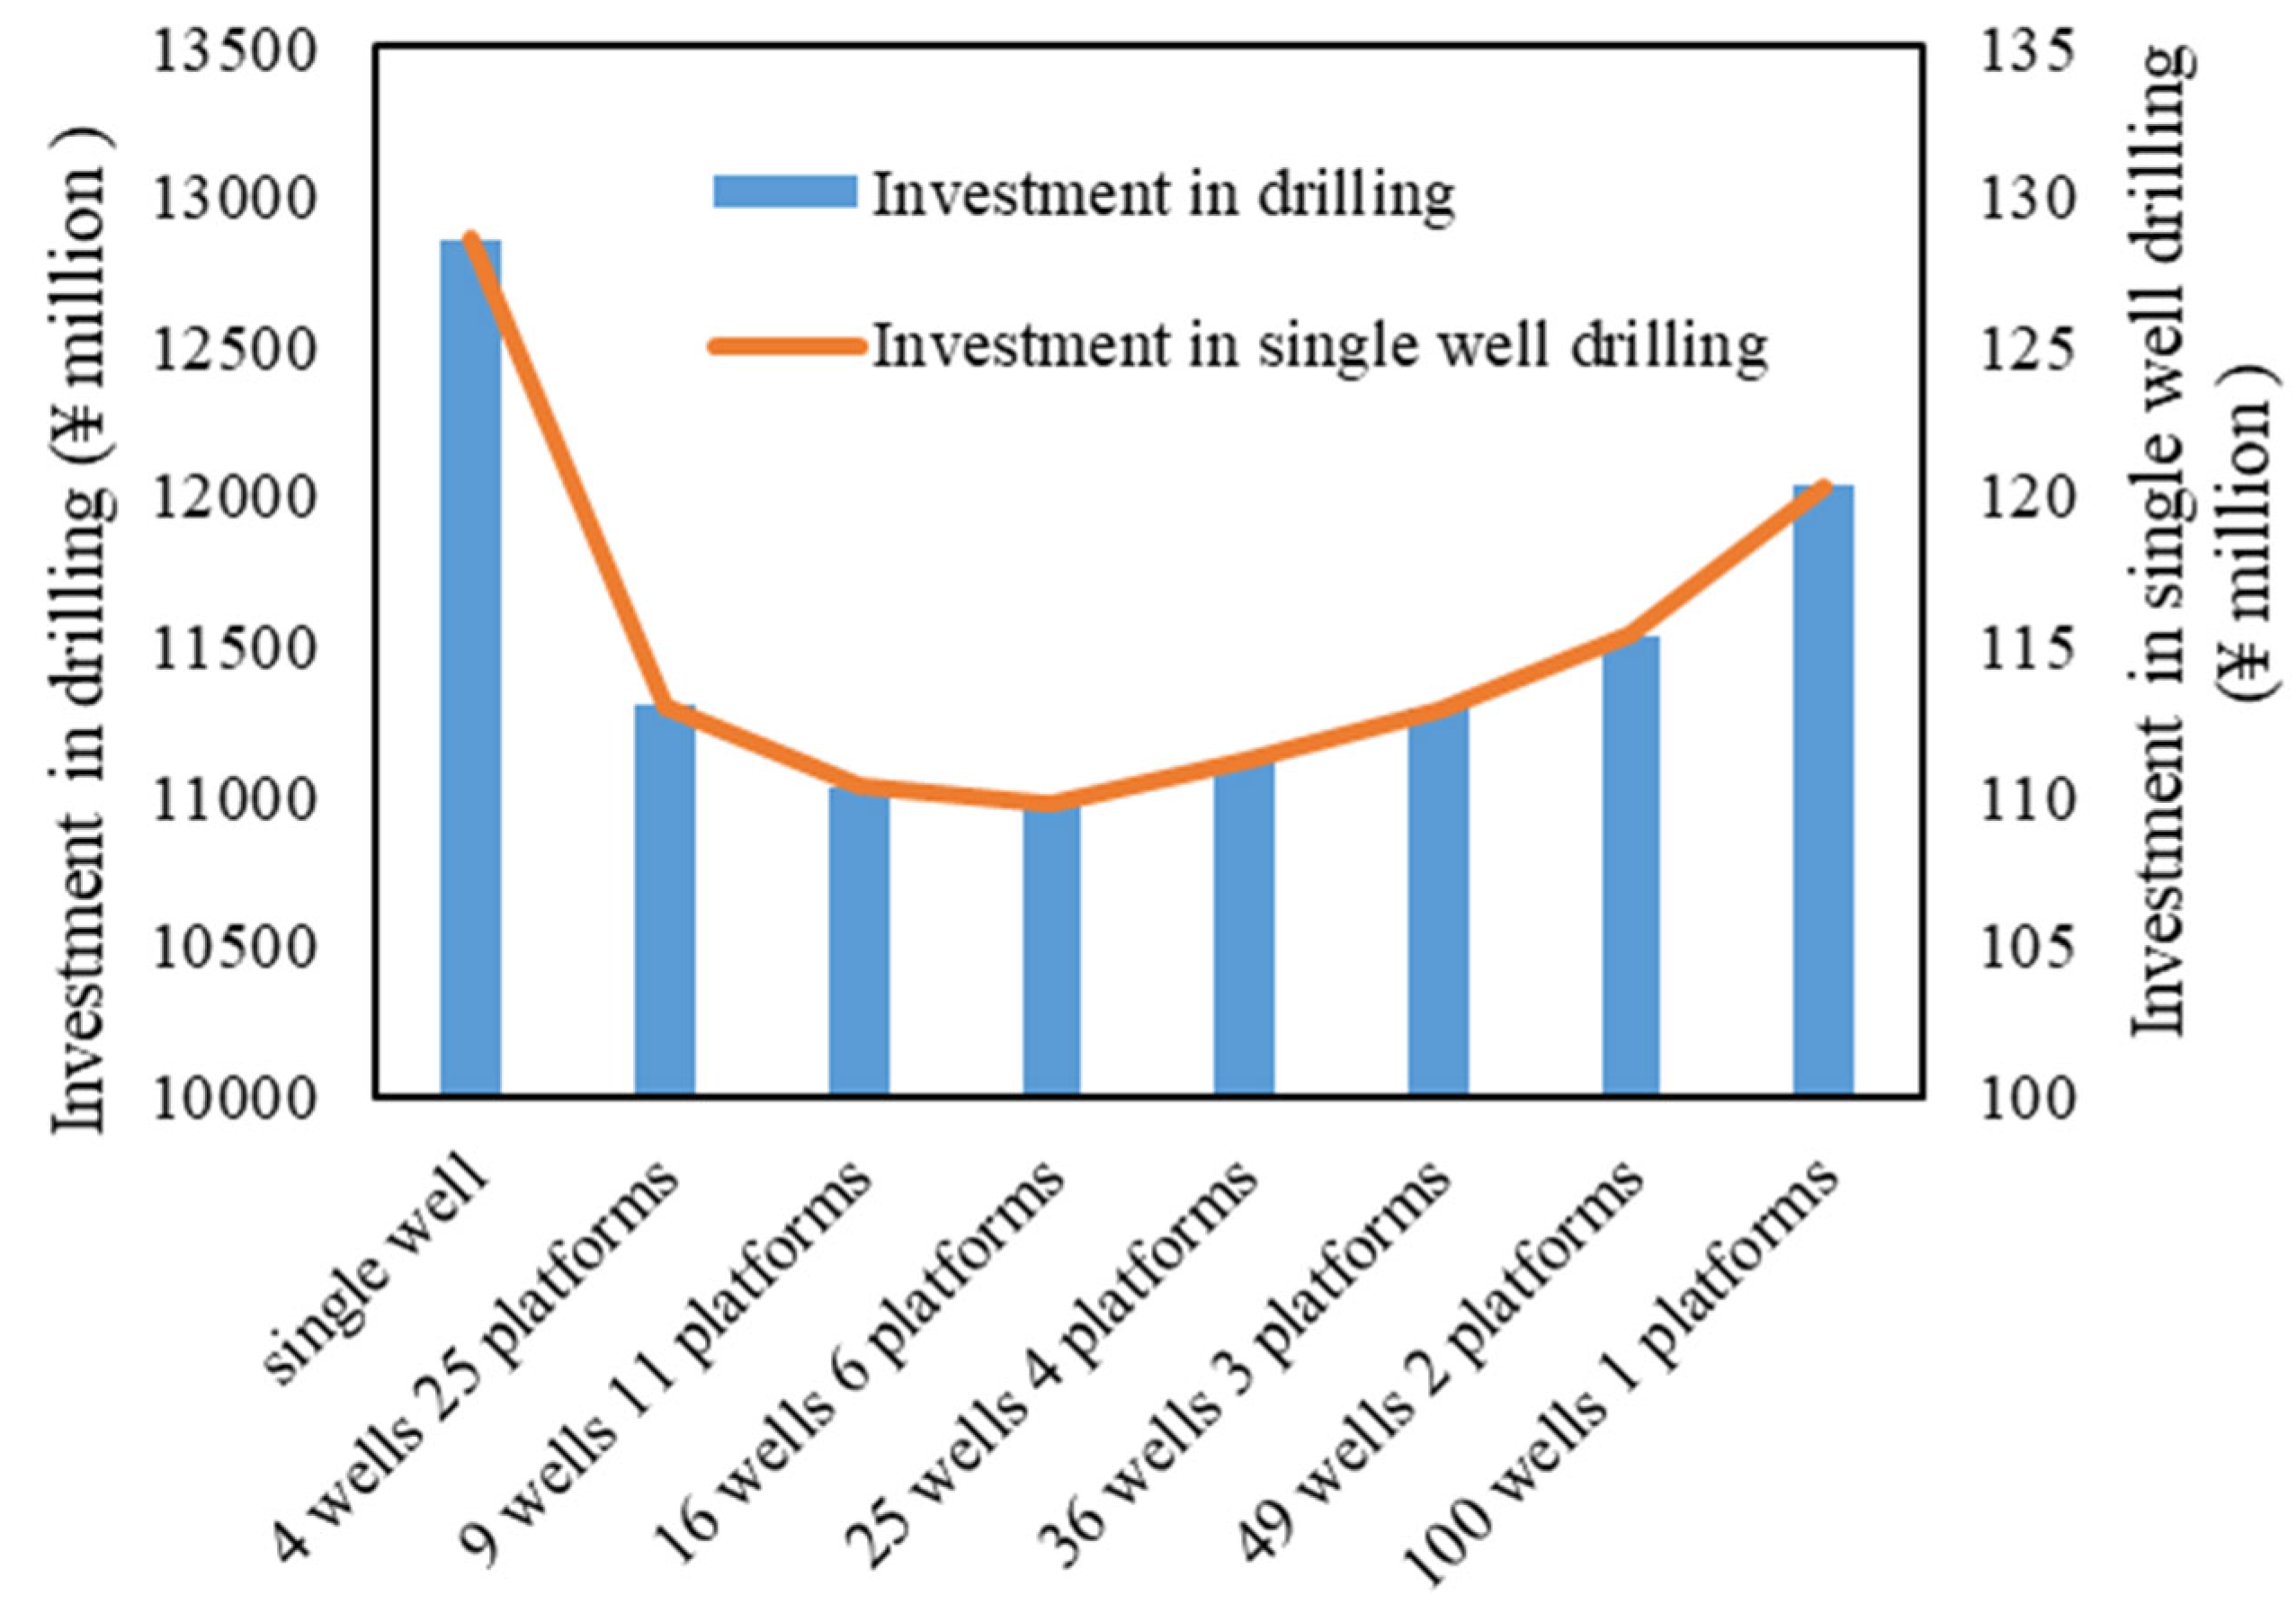
3.2.6. Total Drilling Investment and Drilling Investment per Well

Figure 11 and Figure 12 compare the total drilling investment as well as the drilling investment per well across different platform scales. The comprehensive evaluation demonstrates that while temporary land acquisition and pre-drilling costs steadily decline with larger platform scales, the combined costs for drilling engineering, cementing, and drilling fluid waste treatment initially decrease before eventually increasing. This non-linear behavior highlights the existence of an optimal platform scale that minimizes the overall drilling investment. Under the current parameters, the optimal “well factory” configuration is achieved when 16 wells are deployed per platform. This configuration results in a drilling investment that is approximately 15% lower than that of the conventional single-well drilling model. The finding underscores the economic benefits of the “well factory” approach, where centralized infrastructure and shared resources contribute to significant cost savings, while still maintaining an efficient balance in operational expenditures.

4. Conclusions

Summarizing the full study—from cost classification to factory-mode optimization—this section distills the key takeaways and practical recommendations for intensive drilling economics in unconventional plays.
(1)
The optimized model incorporates synergy factors—Φpre, Φdrill, and Φmat—to capture the cost-saving effects of intensive drilling, such as reduced land acquisition costs, optimized rig sharing, and enhanced reuse of drilling fluids. Moreover, by explicitly incorporating decision response time into the objective function, the model can be dynamically adjusted to meet varying requirements in the balance between cost minimization and decision efficiency, thus fulfilling the high timeliness demands of economic evaluation methods in unconventional oil and gas development.
(2)
Compared with the conventional single-well drilling approach, the “well factory” operation mode significantly reduces drilling costs. Notably, there are substantial reductions in both pre-drilling costs and drilling operation costs. Within the pre-drilling category, costs associated with temporary land acquisition and pre-drilling engineering are considerably lower, while in the drilling operations category, rig costs are dramatically reduced.
(3)
The primary advantage of the intensive well construction method lies in its ability to save considerable land expenses and lower rig mobilization and installation costs, thereby reducing the overall investment. However, as well depth increases, the cost of drilling materials rises. When the number of wells per platform reaches a certain threshold, the incremental increase in drilling investment due to greater well depths can outweigh the savings in land and rig-related expenses, causing overall costs to rise gradually. Therefore, it is essential to analyze and determine an optimal platform scale.

Author Contributions

Methodology, S.Y. and K.W.; Validation, H.D.; Data curation, Y.T. and Z.C.; Writing—original draft, D.Z.; Writing—review & editing, S.S. All authors have read and agreed to the published version of the manuscript.

Funding

This research received no external funding.

Data Availability Statement

The original contributions presented in this study are included in the article. Further inquiries can be directed to the corresponding author.

Conflicts of Interest

Authors Shaoqing Yu, Kai Wang, Huimin Dong, Yuehua Tai, Zezhou Chen, and Dongmei Zhou are employed by the Petroleum Engineering and Technology Research Institute, Shengli Oilfield Branch; the remaining authors declare that the research was conducted in the absence of any commercial or financial relationships that could be construed as a potential conflict of interest.

Appendix A

Below is a step-by-step derivation and explanation of each numbered equation in our model, with special emphasis on Equations (15) and (16). Wherever one equation feeds into another, we have included a brief “Linkage Note” to make the logical flow explicit.
1.
Pre-Drilling Cost Block (Equations (1)–(4))
The land acquisition cost is determined as follows:
A 1 i = C z d i =   [ S 1 + s 1 ( n i 1 ) ] q   n i < 5               = [ S 1 + s 1 × 3 + s 2 ( n i 4 ) ] q   n i 5
Derivation:
Start from per-unit area cost q (¥/m2).
The first well occupies S1 m2; each additional well adds S2 m2.
Multiply areas by q and sum.
Linkage note: feeds directly into total pre-drilling cost (Equation (4)).
The well-site construction cost is determined as follows:
A 2 i = C j s i = [ 1 + 0.1 ( n i 1 ) ] q 1
Derivation:
Base construction cost q1 per well × ni wells.
Add 10% complexity surcharge for each extra well beyond the first.
Linkage note: likewise summed in Equation (4).
The equipment mobilization cost is calculated as follows:
A 3 i = C b a i = q r 1 + q r 2 ( n i 1 )           Single   row   wellhead q r 1 + q r 2 ( n i 2 ) + q r 2         Double   row   wellhead
Derivation: sum of unit-move costs × move counts for rig major moves, full relocations, and pad-to-pad moves.
Linkage note: completes the three components of pre-drilling cost.
The total pre-drilling cost is calculated as follows:
C pre , total = i = 1 k ( A 1 i + A 2 i + A 3 i )
Derivation: straightforward summation over all k platforms.
Linkage note: provides baseline Cpre for the factory optimization (Equation (18)).
2.
Drilling Cost Block (Equations (5)–(12))
The rig operation cost is calculated as follows:
C z j i = n = 1 n i j = 1 m R n j T z n j
Derivation: daily rig cost Rnj × days drilled Tznj, summed over all phases j of each well n.
Linkage note: part of the “operation” sum in Equation (15).
The directional drilling cost is determined as follows:
C d x i = n = 1 n i j = 1 m D n j T d x n j
Derivation: analogous to Equation (5), but for directional service rates Dnj.
Linkage note: also enters Equation (15).
The cementing cost is determined as follows:
C g j i = n = 1 n i j = 1 m G n j
Derivation: each cement job Gnj summed over all wells/phases.
Linkage note: completes the operation costs in Equation (15).
The drilling material cost is determined as follows:
C c l i = n = 1 n i j = 1 m a = 1 4 H n j q a n j
Derivation: unit cost qanj (for bits, fluids, casing, slurry) × depth Hnj, summed.
Linkage note: appears as Ccl in Equation (15).
The fluid-reuse savings are determined as follows:
Δ q 2 n j = n = 1 n i j = 1 m Q n j Δ V n j
Derivation: fluid price Qnj × reused volume ΔVnj, representing cost offset.
Linkage note: net material cost = Equation (8) minus reuse Equation (9).
The environmentally safe treatment cost is determined as follows:
C m c i = n = 1 n i B n V n
Derivation: unit treatment cost Bn × waste volume Vn.
Linkage note: included in total drilling cost Equation (15).
The waste volume (water-based) is determined as follows:
V w b w = n = 1 n i j = 1 m H n j Q c e c
Derivation: cuttings rate Qc × depth × expansion factor ec.
Linkage note: defines Vn in Equation (10).
The waste volume (oil-based) is determined as follows:
V o b w = n = 1 n i j = 1 m H n j Q c
Derivation: analogous to Equation (11) for oil-based fluids.
Linkage note: alternative calculation for Vn.
3.
Drilling-Engineering Aggregates (Equations (13) and (14))
The platform-level engineering cost is determined as follows:
C d r i = C z j i + C d x i + C g j i + C c l i + C m c i
Derivation: simple sum of rig, directional, and cementing costs.
The block-level engineering cost is determined as follows:
C d r = i = 1 k C d r i
Derivation: sum across all platforms.
4.
Synergistic and Optimization Model (Equations (15)–(24))
The baseline combined cost is determined as follows:
C t o t a l   = C p r e   + C d r i l l   + C m a t   + C t r e a t  
It is the sum of the four cost blocks before applying any synergy factors.
Equations (16)–(22). Synergy-Adjusted Cost Blocks
-
Equation (16) scales pre-drilling by Φpre (from Equation (17)).
-
Equation (18) scales drilling ops by Φdrill (from Equation (19)).
-
Equation (20) scales materials by Φmat (from Equation (21)).
-
Equation (22) retains Equation (10)’s treatment cost (synergy minor).
The factory-mode total cost is determined as follows:
C t o t a l = i = 1 k { Φ p r e   [ A 1 i   + A 2 i   + A 3 i   ] + n = 1 n i   j = 1 j   [ R n j   T z n j   · Φ d r i l l   + D n j   T d x n j   + G n j   ] + n = 1 n i   j = 1 j a = 1 4     ( q a n j   · H n j   ) · Φ m a t + Δ q 2 n j + n = 1 n i ( V n   · B n   ) }
This equation applies synergy factors to each platform’s cost components.
5.
Decision-Timeliness Objective
p m i n   { F ( P ) = C t o t a l   ( P ) + λ T d e c i s i o n   ( P ) }
Derivation: augment total cost with a weighted penalty λ for decision time Tdecision, ensuring a balance between cost savings and responsiveness.

Appendix B

Table A1. Model Parameters and Interpretation.
SymbolUnitDescription
CpreYuanTotal pre-drilling cost (land + site + mobilization) across all platforms
CzjiYuanRig operation cost for platform i (daily rig  +  labor rate × drilling days)
CdxiYuanDirectional drilling service cost (daily directional rate × days)
CgjiYuanCementing cost (sum of individual cement job costs)
CcliYuanDrilling material cost (unit cost per meter for bits, fluids, casing, slurry × drilled length)
Δq2njYuanFluid-reuse savings (fluid unit price × reused volume)
CmciYuanWaste treatment cost (treatment fee per m3 × waste volume)
CdriYuanPlatform-level total drilling cost
CdrillYuanSum of all platform drilling costs
CtotalYuanSynergy-adjusted total cost under factory-mode optimization
S1, S2m2First-well and additional-well pad area
qYuan/m2Land cost per square meter
qr1, qr2,qr3Yuan/moveUnit costs for major rig move, full relocation, pad-to-pad move
Tznj, TdxnjDayDrilling and directional-drilling durations
HnjmDepth drilled in phase j of well n
QnjYuan/m3Drilling fluid unit price
ΔVnjm3Volume of fluid reused
BnYuan/m3Unit treatment cost per cubic meter of waste
Vnm3Total waste volume (cuttings + spent fluid)
αCoefficient controlling pre-drilling synergy
βCoefficient controlling drilling synergies
γCoefficient governing material-reuse efficiency
λYuan/dayWeight for decision-timeliness penalty in the objective function
TdecisionDayEstimated decision-making time

References

  1. Chukwunweike, J.N. Leveraging AI and Principal Component Analysis (PCA) For In-Depth Analysis in Drilling Engineering: Optimizing Production Metrics through Well Logs and Reservoir Data. Int. J. Comput. Appl. Technol. Res. 2024, 13, 40–52. [Google Scholar] [CrossRef]
  2. Hansen, P.; de Luna Pedrosa Filho, E.; Carneiro Ribeiro, C. Location and Sizing of Offshore Platforms for Oil Exploration. Eur. J. Oper. Res. 1992, 58, 202–214. [Google Scholar] [CrossRef]
  3. Jiang, P.; Li, L.; Fu, Y. Research and Application of Drilling and Completion Technology for Cluster Wells. J. Phys. Conf. Ser. 2024, 2834, 012033. [Google Scholar] [CrossRef]
  4. Zou, C.; Dong, D.; Wang, Y.; Li, X.; Huang, J.; Wang, S.; Guan, Q.; Zhang, C.; Wang, H.; Liu, H.; et al. Shale Gas in China: Characteristics, Challenges and Prospects (II). Pet. Explor. Dev. 2016, 43, 182–196. [Google Scholar] [CrossRef]
  5. Dou, Z.; Liu, Y.; Zhang, J.; Xu, X.; Zhang, W.; Zhu, J. Optimization of Well Factory Platform Mode Considering Optimal Allocation of Water Resources. Arab. J. Sci. Eng. 2022, 47, 11159–11170. [Google Scholar] [CrossRef]
  6. Li, Y.; Zhou, D.H.; Wang, W.H.; Jiang, T.X.; Xue, Z.J. Development of Unconventional Gas and Technologies Adopted in China. Energy Geosci. 2020, 1, 55–68. [Google Scholar] [CrossRef]
  7. Liang, X.; Shan, C.; Wang, W.; Li, Z.; Zhu, D.; Xu, J.; Zhang, Z.; Zhang, Z.; Luo, Y.; Yuan, X. Exploration and Development in the Zhaotong National Shale Gas Demonstration Area: Progress and Prospects. Nat. Gas Ind. B 2023, 10, 44–61. [Google Scholar] [CrossRef]
  8. Ertekin, T. The Efficacy and Superiority of the Expert Systems in Reservoir Engineering Decision Making Processes. Appl. Sci. 2021, 11, 6347. [Google Scholar] [CrossRef]
  9. Hu, Q.; Li, Y.; Wu, N.; Jiang, Y.; Sun, X.; Wang, H.; Bu, Q.; Hu, G. Influences of Stress State on Compressional Wave Velocity of Sandy Hydrate-Bearing Sediment: Experiments and Modeling. Geoenergy Sci. Eng. 2024, 234, 212683. [Google Scholar] [CrossRef]
  10. Guo, X.; Hu, D.; Shu, Z.; Li, Y.; Zheng, A.; Wei, X.; Ni, K.; Zhao, P.; Cai, J. Exploration, Development, and Construction in the Fuling National Shale Gas Demonstration Area in Chongqing: Progress and Prospects. Nat. Gas Ind. B 2023, 10, 62–72. [Google Scholar] [CrossRef]
  11. Al-Qahtani, G.D.; Elrafie, E.A.; Abbas, R.T.; Ikuku, C.E.; Hogg, M.F.; Rincon, A. Complex Well Modeling Workflow Enabling Full Field Optimization and Forward Decisions. In Proceedings of the SPE Latin America and Caribbean Petroleum Engineering Conference. SPE, Cartagena, Columbia, 31 May–3 June 2009; Volume 1, pp. 28–40. [Google Scholar] [CrossRef]
  12. Li, W.; Finsa, M.M.; Laskey, K.B.; Houser, P.; Douglas-Bate, R.; Verner, K. Optimizing Well Placement for Sustainable Irrigation: A Two-Stage Stochastic Mixed Integer Programming Approach. Water 2024, 16, 2715. [Google Scholar] [CrossRef]
  13. Wang, G.; Zhang, W. Study and Application of Wellbore Trajectory Optimization for Dense Cluster Wells. In E3S Web of Conferences; EDP Sciences: Paris, France, 2021; Volume 261, pp. 1–5. [Google Scholar] [CrossRef]
  14. Ochulor, O.J.; Onita, F.B. Geosteering in Deep Water Wells: A Theoretical Review of Challenges and Solutions. World J. Eng. Technol. Res. 2024, 3, 046–054. [Google Scholar] [CrossRef]
  15. Li, S.Q.; Tong, Y.S.; Yan, T.; Zhou, Y.C.; Li, W.; Sun, X.F. Numerical Simulation of Rock Breaking by Resonance Coring Based on Laboratory Experiments. SPE J. 2025, 3, 1162–1176. [Google Scholar] [CrossRef]
  16. Saleem, M. Application of Machine Learning for Optimizing Oil Well Production and Reservoir Management: A Simulation-Based Approach. J. Biol. Allied Heal. Sci. 2022, 05, 3–13. [Google Scholar] [CrossRef]
  17. Alpak, F.O. Simultaneous Optimization of Well Count and Placement: Algorithm, Validation, and Field Testing. SPE J. 2023, 28, 147–172. [Google Scholar] [CrossRef]
  18. LIU, Z. Innovation and Practice of Petroleum Engineering Synergetic Management for the Development of Difficult-to-Produce Reserves. Pet. Explor. Dev. 2020, 47, 1316–1324. [Google Scholar] [CrossRef]
  19. Gu, Y.; Gao, D.; Yang, J.; Wang, Z.; Li, X.; Tan, L. A Model for Platform Location Optimization in Shale Gas with Learning Effect. In SPE Asia Pacific Oil and Gas Conference and Exhibition 2018; SPE: Richardson, TX, USA. [CrossRef]
  20. Dbouk, H.M.; Ghorayeb, K.; Kassem, H.; Hayek, H.; Torrens, R.; Wells, O. Facility Placement Layout Optimization. J. Pet. Sci. Eng. 2021, 207, 109079. [Google Scholar] [CrossRef]
  21. Wang, G.; Huang, W.; Gao, D. Optimization Design Method of “Well Factory” Platform Planning and Wellhead Layout for Oil and Gas Development. SPE J. 2024, 29, 5875–5895. [Google Scholar] [CrossRef]
  22. Egbumokei, P.I.; Dienagha, I.N.; Digitemie, W.N.; Cynthia, E.; Oladipo, O.T. Strategic Contract Management for Drilling Efficiency and Cost Reduction: Insights and Perspectives. Int. J. Multidiscip. Res. Growth Eval. 2024, 05, 1042–1050. [Google Scholar] [CrossRef]
  23. Li, Y.; Peng, G.; Du, T.; Jiang, L.; Kong, X.Z. Advancing Fractured Geothermal System Modeling with Artificial Neural Network and Bidirectional Gated Recurrent Unit. Appl. Energy 2024, 372, 123826. [Google Scholar] [CrossRef]
  24. Qiaobo, H.; Xiaofeng, S.; Jingyu, Q.; Yanlong, L. Creep Behaviors of Methane Hydrate-Bearing Sandy Sediments under Load-to-Unload Stress State. Geoenergy Sci. Eng. 2025, 247, 213702. [Google Scholar] [CrossRef]
  25. Kohler, M.; Vellasco, M.; Silva, E.; Figueiredo, K. SimProxy Decision Support System: A Neural Network Proxy Applied to Reservoir and Surface Integrated Optimization. IEEE Syst. J. 2020, 14, 5111–5120. [Google Scholar] [CrossRef]
  26. Li, Y.; Peng, G.; Tang, J.; Zhang, J.; Zhao, W.; Liu, B.; Pan, Y. Thermo-Hydro-Mechanical Coupling Simulation for Fracture Propagation in CO2 Fracturing Based on Phase-Field Model. Energy 2023, 284, 128629. [Google Scholar] [CrossRef]
  27. Gao, D. Some Research Advances in Well Engineering Technology for Unconventional Hydrocarbon. Nat. Gas Ind. B 2022, 9, 41–50. [Google Scholar] [CrossRef]
  28. Hummes, O.; Bond, P.; Jones, A.; Symons, W.; Bishop, M.; Serdy, A.; Pokrovsky, S.; Polito, N. Using Advanced Drilling Technology to Enable Well Factory Concept in the Marcellus Shale. In SPE/IADC Drilling Conference and Exhibition; SPE: Richardson, TX, USA, 2012; Volume 2, pp. 1089–1105. [Google Scholar] [CrossRef]
  29. Ranjith, R.; Suhag, A.; Balaji, K.; Putra, D.; Dhannoon, D.; Saracoglu, O.; Hendroyono, A.; Temizel, C.; Aminzadeh, F. Production Optimization through Utilization of Smart Wells in Intelligent Fields. In Proceedings of the SPE Western Regional Meeting, Bakersfield, CA, USA, 23–27 April 2017; pp. 1284–1312. [Google Scholar] [CrossRef]
  30. Gamal, H.; Albahri, S.; Essa, H.; Srivastava, M.; Alghamdi, N.; Shaikh, W. Driving Operational Excellence: Cost Savings and Performance Optimization Through Tripping and Connection Time Optimization. In Proceedings of the International Petroleum Technology Conference, Damman, Saudi Arabia, 12–14 February 2024. [Google Scholar] [CrossRef]
  31. Karacali, O.; Ramcharan, N.; Sahadeo, L.; Holub, C.; Julien, J.; Sunarto, H.; Tong, S. Pushing the Limits in Deep Water Data Acquisition for Accelerated Field Development: Industry Record Batch Well Testing. In Proceedings of the Offshore Technology Conference, OTC, Houston, TX, USA, 1–4 May 2023. [Google Scholar] [CrossRef]
  32. SY/T 5466-2013; Well Site Preparation and Layout Requirements. National Energy Administration: Beijing, China, 2013.
  33. SY/T 5505-2006; Cluster Well Platform Layout. National Energy Administration: Beijing, China, 2006.
Figure 1. Composition of drilling cost elements.
Processes 13 01579 g001
Figure 2. Classification of pre-drilling engineering costs under the well factory mode.
Processes 13 01579 g002
Figure 3. Classification of drilling operation costs under the well factory mode.
Processes 13 01579 g003
Figure 4. Classification of drilling material costs under the well factory mode.
Processes 13 01579 g004
Figure 5. Classification of drilling cost components under the well factory mode.
Processes 13 01579 g005
Figure 6. Temporary land acquisition costs for different platform scales.
Processes 13 01579 g006
Figure 7. Classification of pre-drilling engineering costs for different platform scales.
Processes 13 01579 g007
Figure 8. Classification of drilling engineering costs for different platform scales.
Processes 13 01579 g008
Figure 9. Classification of cementing engineering costs for different platform scales.
Processes 13 01579 g009
Figure 10. Cost of environmentally friendly drilling fluid treatment for different platform scales.
Processes 13 01579 g010
Figure 11. Drilling investment for different platform scales.
Processes 13 01579 g011
Figure 12. Drilling investment and single-well drilling investment for different platform scales.
Processes 13 01579 g012
Table 1. Composition of drilling cost elements by cost category.
CategorySub-ComponentDescription
Pre-drilling costLand acquisition costTemporary land occupation cost for platform I (first-well area + additional well area)
Well-site construction costSite preparation quota per well, with 10% surcharge for each extra well
Equipment installation/removal costRig mobilization and demobilization (major moves, full relocations, pad-to-pad moves)
Drilling operation costRig operation costDaily rig + labor cost × drilling cycle days (including depreciation, management, and materials)
Directional drilling service costDaily directional service rate × days of directional drilling
Cementing operation costRig mobilization and cost per cement job (equipment, transport, mixing, curing)
Drilling material costDrill bit costUnit cost per meter of drilling bit used
Drilling fluid costFluid unit price × volume used (net of reuse savings)
Casing costUnit cost per meter of casing string
Cement slurry costUnit cost per meter of cement slurry
Drilling fluid disposal costEnvironmentally safe treatment costTreatment fee per m3 × waste volume (water- and oil-based cuttings and fluids)
Disclaimer/Publisher’s Note: The statements, opinions and data contained in all publications are solely those of the individual author(s) and contributor(s) and not of MDPI and/or the editor(s). MDPI and/or the editor(s) disclaim responsibility for any injury to people or property resulting from any ideas, methods, instructions or products referred to in the content.

