Article

Evaluation of Ultrasonic Cleaning Characteristics of Filter Cloth in Filter Press Cleaning System

Bio Resource Center, Institute for Advanced Engineering, Yongin-si 17180, Gyeonggi-do, Republic of Korea
*
Author to whom correspondence should be addressed.
Processes 2025, 13(5), 1574; https://doi.org/10.3390/pr13051574
Submission received: 7 April 2025 / Revised: 14 May 2025 / Accepted: 15 May 2025 / Published: 19 May 2025
(This article belongs to the Section Chemical Processes and Systems)

Abstract

:
In this study, ultrasonic excitation was employed for filter cloth cleaning, with the aim of predicting optimal cleaning conditions and monitoring the efficiency and performance of the cloth under various cleaning parameters. A clogged filter cloth of uniform size (Φ0.11 m) was secured in a prepared cleaning apparatus, and cleaning experiments were conducted by varying the following operational conditions: time (2, 5, 10 min), frequency (34, 76, 120 kHz), and power output (100, 200, 300 W). Through these experiments, this study sought to investigate the cleaning capacity and efficiency of each condition and to evaluate the effectiveness of ultrasonic cleaning. The morphology of the filter cloths before and after cleaning was examined through SEM imaging, and the weight content of the filter cloths was measured before and after the cleaning experiments to incorporate these values into the cleaning efficiency assessment. Additionally, air permeability measurements were taken to predict the impact of permeability on cleaning performance, which was statistically analyzed based on a predictive model’s equation. The experimental results showed that the maximum recovery rate of air permeability for clogged filter cloths was approximately 28.6%. Using Response Surface Methodology (RSM), the air permeability recovery rate and weight reduction rate were 19.8% and 5.8%, respectively, under conditions of 5.2 min, 34 kHz, and 300 W. It is anticipated that the utilization of the filter press cleaning device will enable data acquisition through repeated experiments and that this device can be used in filter cloth management and operational techniques.

1. Introduction

The main problem in the filter press dewatering process is filter cloth clogging, where solids or contaminants block the pores of the filter cloth, reducing its filtration efficiency, and inorganic materials accumulate on the filter cloth surface, degrading its filtration capacity. Therefore, appropriate filter cloth cleaning methods are necessary. Major cleaning methods include high-pressure water washing, chemical cleaning, backwashing, ultrasonic cleaning, mechanical cleaning, and steam cleaning. The choice of cleaning method depends on the filter cloth’s material, type of contaminants, and characteristics of the processed material. For effective cleaning, it is advisable to combine several methods. Additionally, it is important to establish regular maintenance and cleaning schedules to maintain optimal filter cloth performance [1,2,3].
Ultrasonic cleaning methods are characterized by a high speed and environmental friendliness and have been the subject of increasing attention and numerous studies [4,5,6,7,8,9,10,11,12,13,14,15,16,17]. While energy consumption in ultrasonic cleaning is considered one of the key challenges in its application, several studies have demonstrated its economic viability and feasibility [18,19]. The energy consumption of ultrasonic cleaning is primarily determined by selected operational parameters such as frequency, power intensity, and duration. Consequently, the cost of ultrasonic cleaning can be linearly reduced by optimizing these operational parameters according to the mode of cleaning required [20,21].
Previous studies have shown that numerous parameters, including ultrasonic frequency, power intensity, cleaning duration, and cleaning temperature, significantly influence the effectiveness of the ultrasonic cleaning process [6,7]. Lower frequencies are generally more effective than higher frequencies due to their ability to generate stronger ultrasonic cavitation [6,8]. For polymeric membranes, the recommended frequency typically ranges between 40 kHz and 60 kHz [4]. Regarding power intensity, many studies have observed an increase in flux recovery with increasing power intensity. However, some research has noted that at higher power intensities, an excessive number of bubbles can form, inhibiting the propagation of ultrasonic waves and consequently reducing flux recovery. Hauptmann et al. demonstrated that applying a pulsed ultrasonic treatment to oversaturated UPW gas under traveling wave conditions can significantly enhance cavitation activity [22]. Conclusions regarding temperature and cleaning duration are more diverse and sometimes contradictory. Li et al. reported that for nylon MF membranes fouled with kraft paper mill effluent, flux recovery decreased as the temperature increased from 23 °C to 40 °C. In contrast, Luo et al. concluded that temperature had no impact on flux recovery [17]. In ultrasonic cleaning technology, it is believed that flux enhancement varies depending on conditions such as frequency, output, and power density, and that researching this by material type is also necessary.
Ultrasonic cleaning, a technology that utilizes wave energy, makes use of the cavitation phenomenon and high vibrational acceleration that occur when a cleaning solution undergoes high-frequency vibrations due to wave propagation. When ultrasonic waves are radiated into the cleaning solution, standing waves with a corresponding frequency are generated, creating zones where the sound pressure becomes highest at positions that correspond to integer multiples of λ/2. Cavitation is most effective in these zones [23]. As the strength of the bubble oscillation, and therefore the magnitude of those effects, is strongly dependent on the bubble radius, precise control over the size and number of the active bubbles is crucial. It is clear that process conditions such as the gas content of the liquid have a significant effect on the cleaning result. Active bubbles in a sound field act as secondary emitters and, due to the nonlinear nature of their oscillation, can cause a multitude of higher and ultra harmonics in the measured frequency.
The density of cavitation can be expressed as the reciprocal of its intensity, indicating that there is an inverse relationship in which the density decreases as the intensity of cavitation increases. When powerful ultrasonic waves are applied to a liquid, they propagate as longitudinal waves, alternating between periods of compression (positive pressure) and rarefaction (negative pressure). During the rarefaction phase, bubbles form within the cleaning solution. These bubbles subsequently collapse during the following compression phase. This process of bubble formation and collapse repeats tens of thousands of times per second, with the bubbles gradually increasing in size. Once they reach a critical diameter, these bubbles implode rapidly, generating significant shock waves. These shock waves not only produce high pressure but also create momentary extreme heat, inducing various physical effects and accelerating chemical reactions within the liquid medium. In essence, the collapse of cavitation bubbles creates fissures between contaminant particles. Additional bubbles then penetrate these fissures and implode, effectively separating the contaminants from the surface. This mechanism facilitates thorough cleaning and the removal of pollutants [24].
Design of experiments (DOE) refers to the method of designing and analyzing experiments to effectively draw valid and objective conclusions. DOE can be described as a series of tests in which input factors are deliberately changed to identify the causes of significant changes in response reactions. Fundamentally, DOE involves using specific experimental patterns to generate substantial information about a process while minimizing the actual experimental processes required to obtain that information [25,26].
RSM (Response Surface Methodology) is a type of experimental design method. Its main purpose is to find optimal process conditions from the maximum, minimum, or saddle points on a response surface when independent variables influence dependent variables through interactions or individual effects. Representative RSM methods include central composite design (CCD) and Box–Behnken design (BBD). Three-level Box–Behnken design, which lacks corner points and isolates the extreme values of parameters, can reduce the risk of update failure and estimate a model with fewer experimental runs compared to the central composite design method [26,27].
There are no previous studies on filter cloth washing in conventional filter press dewatering processes that utilize ultrasonic cleaning parameters such as frequency, duration, and power. In this experiment, filter cloths used in the filter press dewatering process were cleaned using ultrasonic vibration. Although there has been extensive research on ultrasonic operating conditions to date, mathematical models predicting cleaning efficiency have rarely been reported. This study aimed to predict the optimal cleaning conditions for the filter cloths and to monitor how the efficiency and performance of these cloths were affected by various cleaning conditions. The experimental design was based on the statistical central composite design method, setting experimental ranges for important independent variables in the cleaning process, including cleaning time, frequency, and power output. Through these experiments, this study sought to examine the cleaning efficiency and characteristics of each condition and to determine the effectiveness of ultrasonic cleaning. In conjunction with the filter press dewatering process, a basic approach can be proposed for restoring filtration rates via the ultrasonic cleaning of filter cloths contaminated with sludge particles.

2. Materials and Methods

2.1. Preparation of Materials

Contaminated filter cloths were collected from a membrane filter press used in the organic sludge treatment process. Contaminated filter cloths were produced using a 3-ton-capacity pilot filter press. Sewage sludge was introduced into the filter press and repeatedly dewatered in the range of 18–25 bar to contaminate the filter cloths. After filtration, the dewatered cake was peeled off, and no separate washing was performed. As a result of repeated operations, the filtration flux of the cloths decreased during their 11th filtration, and the filter cloth was collected after their 12th use. Due to the large size of the filter cloths, samples were cut to a smaller size of Φ0.11 m, and similar filter cloths were selected and prepared. In this experiment, samples with generally uniform properties were used, and the procedures were conducted within the margin of error. However, since the number of contaminants attached to the filter cloth may not be exactly the same for all samples, some variation between experimental samples could occur.

2.2. Experimental Conditions and Apparatus

An ultrasonic cleaning apparatus was constructed, as shown in Figure 1, for cleaning the pores of the filter cloths. The specifications of the ultrasonic cleaning apparatus are presented in Table 1. The apparatus consists of a tank, filter cloth holder, vibration unit, and oscillator unit. The tank was made of transparent acrylic and designed to have a 0.85 m width, 0.45 m length, and 0.50 m height. Piping was installed at the top of the tank to prevent the overflow of the cleaning solution, and drainage piping and valves were installed at the bottom. The filter cloth holder was designed as a jig on which the filter cloth can be vertically mounted. The filter cloth is fixed in position by the holder, allowing for cleaning to occur at the same location even when it is replaced with a different filter cloth. Two oscillator units were installed to control each vibration unit, and the ultrasonic vibration units were manufactured with dimensions of a 0.40 m width and 0.40 m length. The cleaning efficiency of the system was evaluated with a distance of 0.035 m between the filter cloth and the ultrasonic vibration unit, which is the optimal distance for standing waves.
The cleaning experiment was conducted by creating a clogged filter cloth of a specific size (Φ0.11 m), fixing it to the cleaning apparatus, and varying the operating conditions in terms of time (2, 5, 10 min), frequency (34, 76, 120 kHz), and power output (100, 200, 300 W). The experiment was conducted using 15 samples prepared according to the design of experiments. Through this process, the cleaning efficiency and characteristics of each condition were examined to investigate the effectiveness of ultrasonic cleaning. In order to improve overall throughput and per-cycle processing efficiency in conjunction with the dewatering process, the filter press cleaning system must complete its operation within 10 min. As ultrasonic cleaning can be completed within minutes, the time was set to less than 10 min for efficiency purposes. Accordingly, the time was divided into three intervals, each less than 10 min, and three frequencies commonly used in commercial oscillators were selected. Since most previous studies have reported significant effects at low frequencies, two frequencies below 75 kHz were chosen, along with the higher frequency of 120 kHz.

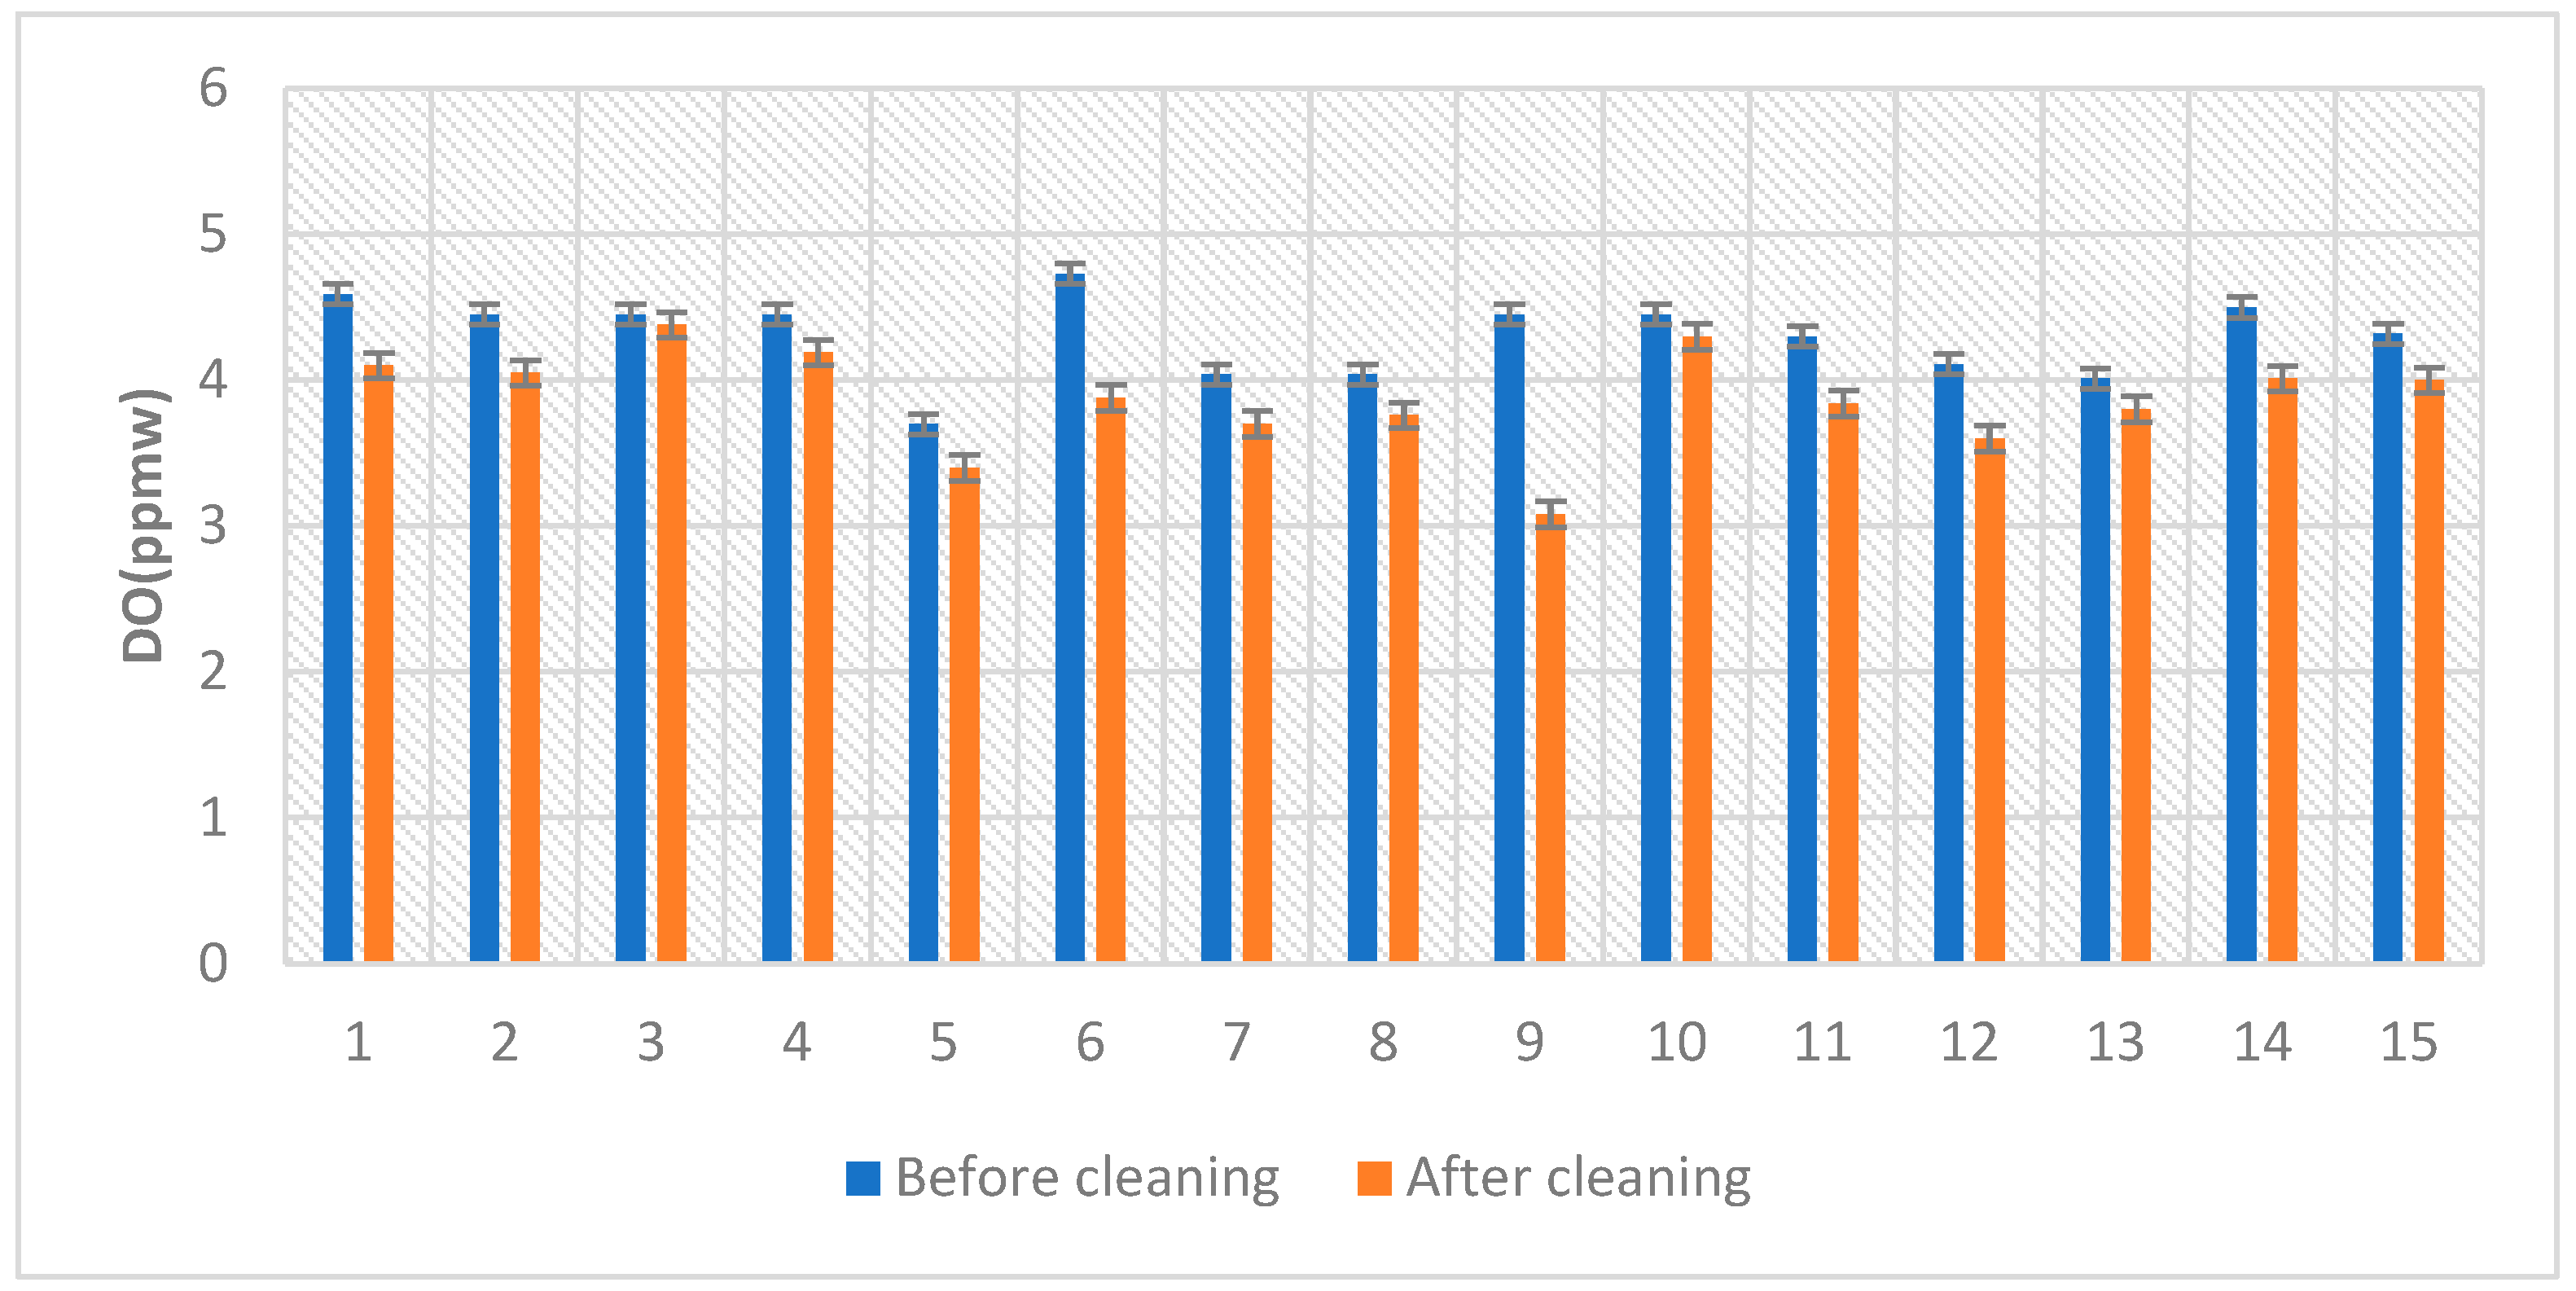
2.3. Sample Analysis

After the cleaning experiment, the filter cloth was dried for 24 h at room temperature. Its air permeability was then measured using an air permeability tester (FX-3320, TEXTEST INSTRUMENTS, Schwerzenbach, Switzerland) under 200 Pa of pressure and over a 20 cm2 area (KS K ISO 9237) [28]. Three measurements were taken to compare the values before and after cleaning, and the rate of change in the air permeability of the clogged filter cloth was calculated. Additionally, a precision balance was used to measure the weight of the filter cloth, calculating the change in the amount of contaminant present before and after cleaning. The recovered air permeability rate and the weight change rate were determined according to Equations (1) and (2). An oxygen meter within the experimental apparatus was used to measure the dissolved oxygen concentration (DO). The morphology of the filter cloth before and after cleaning was examined using SEM images.
R e c o v e r y   P e r m e a b i l i t y   r a t e % = ( P 0 P C ) P 0 × 100
R e m o v a l   W e i g h t   r a t e % = ( W 0 W C ) W 0 × 100
where P0, Pc, W0, and Wc are the air permeability before cleaning (m3·m−2·h−1), the air permeability after cleaning (m3·m−2·h−1), the weight before cleaning (g), and the weight after cleaning (g), respectively.

2.4. RSM (Response Surface Methodology)

The Response Surface Methodology (RSM) is based on statistical and mathematical techniques that can propose suitable practical equations from experimental data. The RSM explores optimal conditions according to linear and nonlinear polynomial models, identifies the most effective or significant factors, determines correlations between inputs and outputs, and improves the cost-effectiveness of procedures [29,30]. In this study, we employed the Box–Behnken design (BBD) method to optimize ultrasonic cleaning conditions (three factors at three levels with 15 runs) and to evaluate the main effects and interaction effects of these cleaning parameters. The Box–Behnken design allows for the estimation of first-order models with fewer experimental runs compared to those required by the central composite design (CCD) method. The central composite design method, through its central points and first-order regression equation, enables the consideration of both the main effects of factors and the interactions between factors, allowing for the effective modeling of complex response surfaces [25,26]. Data analysis and model construction were performed using Design Expert software (version 13 trial, Stat-Ease Inc., Minneapolis, MN, USA).
The experimental range for the key independent variables in the cleaning process, namely cleaning time (X1), frequency (X2), and power output (X3), was established to conduct a statistical analysis. The dependent variables influenced by these independent variables were cleaning efficiency, measured by the rate of change in the air permeability of the cloths, and the rate of change in the weight of the clogged filter cloths, and these were used for the analysis. The ranges and levels of the three independent variables are summarized in Table 2. As ultrasonic cleaning can be completed within minutes, the time was set to less than 10 min for efficiency purposes [26].
The experimental data were fitted to a Two-Factor Interaction model to express the rate of change in air permeability and the rate of change in clogged filter weight as functions of the independent variables. This model considers not only the individual effects of each factor but also the additional effects that occur when the two factors interact. This approach allows for a more accurate understanding and modeling of the relationships between factors in complex systems. Its general form is presented in Equation (3):
Y = β 0 + i = 1 k β i X i + i < j β i j X i X j + ε
where Y is the dependent variable, β0 is the intercept, βi are the main effect coefficients, βij are the linear regression coefficients produced by interaction effects, Xi and Xj are independent variables, and ε is the error [26].

3. Results

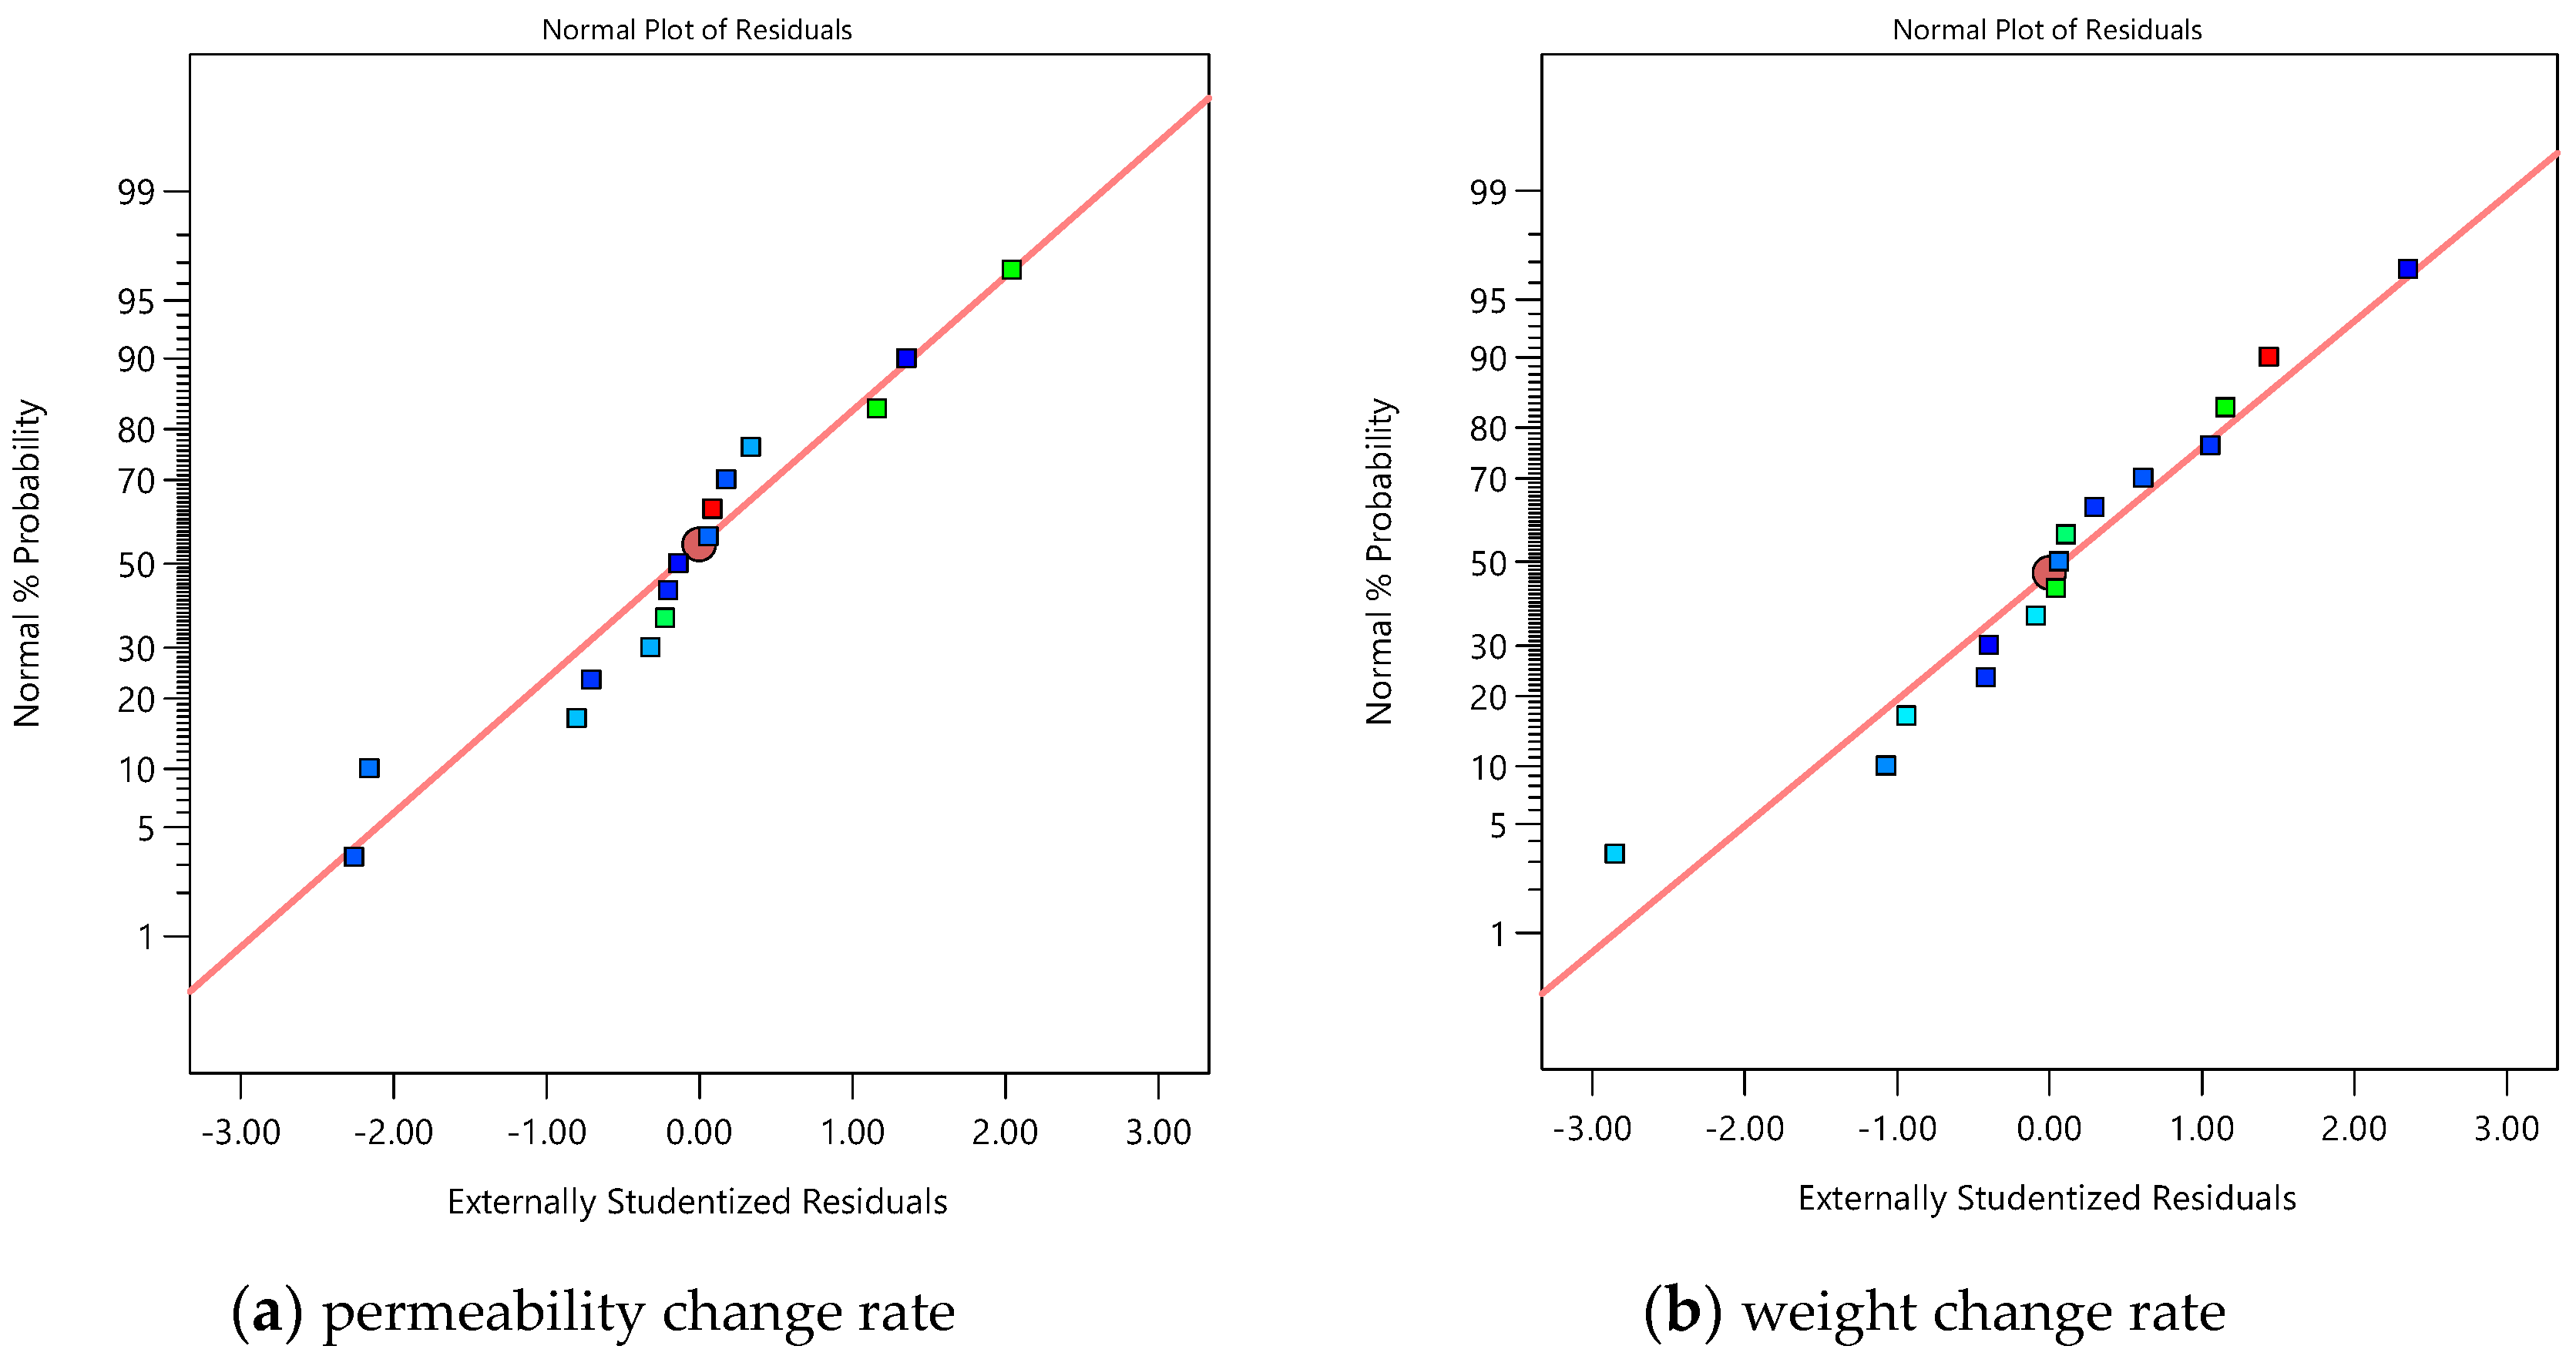
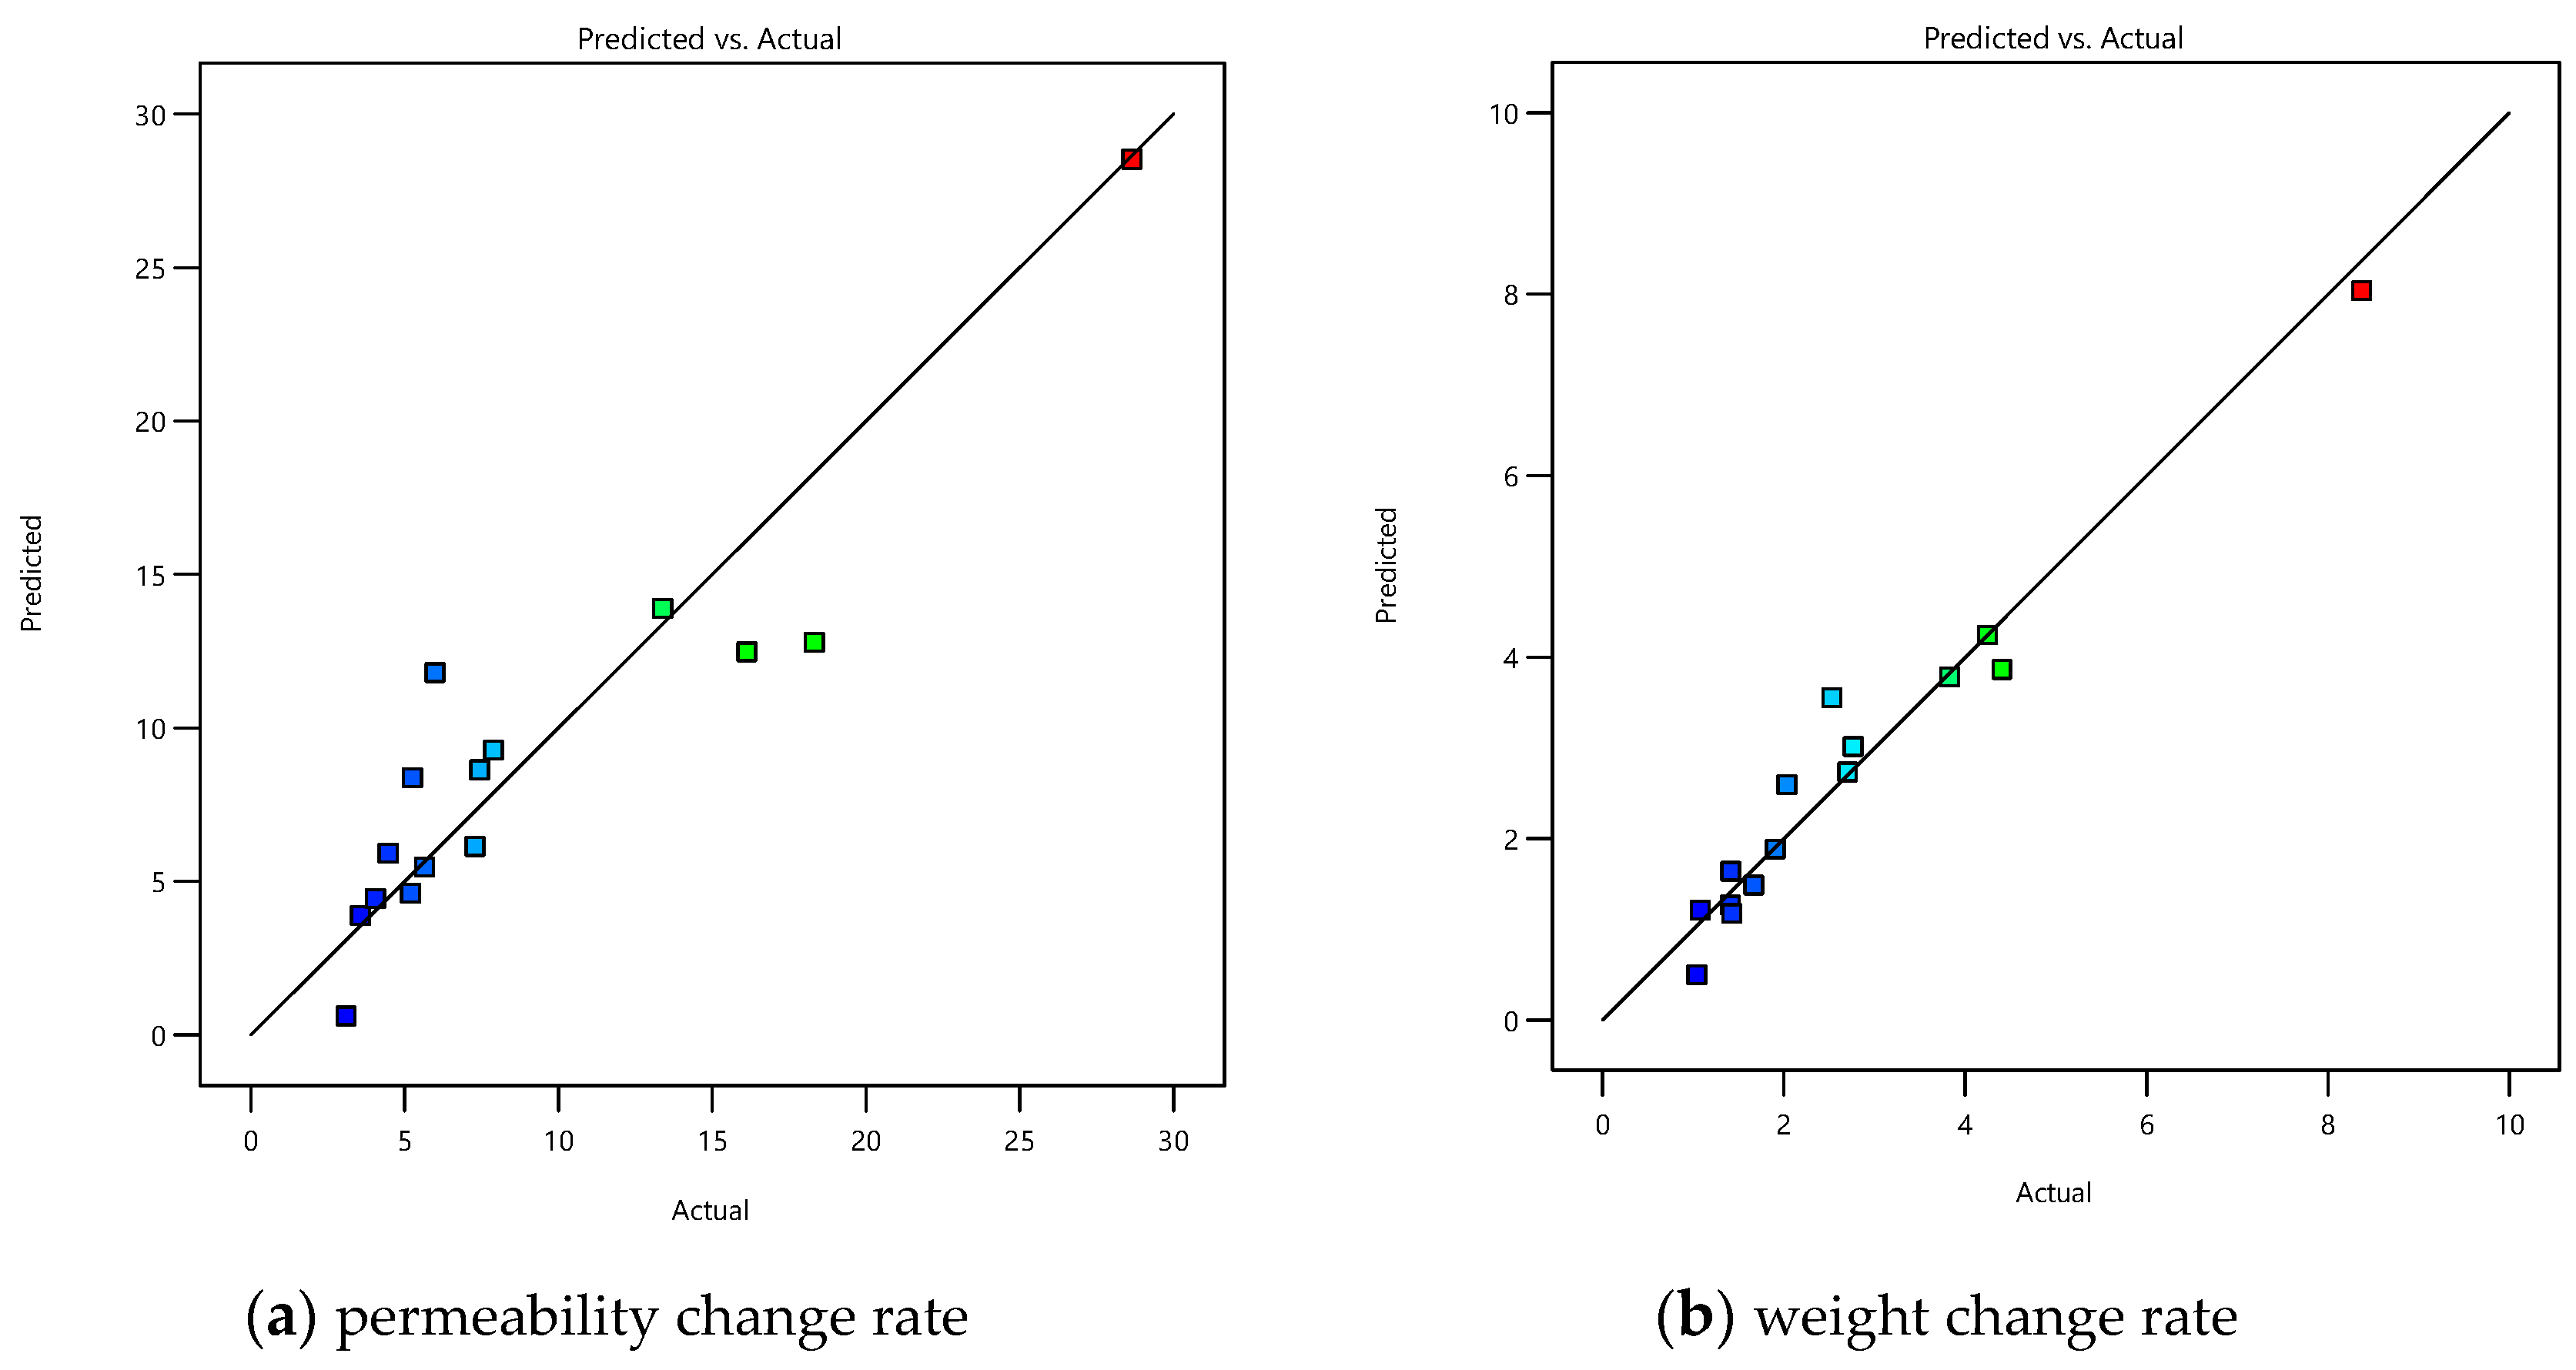
3.1. Analysis of Statics

The dissolved oxygen measurements taken before and after the experiment are presented in Figure 2 and Table 3. Overall, the values tended to decrease after washing, with an average reduction of 10 ppmw. Generally, there were no dramatically large values observed. Table 4 shows the changes in air permeability and weight, which are the dependent variables, according to each independent variable.

Analysis of Models (ANOVA)

The ANOVA test results indicated that the Two-Factor Interaction model most appropriately explained the changes in air permeability and weight. The significance of each factor and the interactions between factors were analyzed using cross-tabulation analysis. The variance inflation factor (VIF) for the independent variables is close to 1. Therefore, it appears that there is no multicollinearity among the independent variables. The ANOVA results of the Two-Factor Interaction model for the air permeability change rate and weight change rate, along with the F-values and p-values for each model term, are presented in Table 5 and Table 6, respectively. Coefficients with p-values greater than 0.1 were considered statistically insignificant and were excluded from the equations. After eliminating the statistically insignificant coefficients, the models presented in Equations (4) and (5) were obtained [31].
Permeability rate (%) = +9.35 + 3.29A − 4.30B + 3.71C − 1.49AB + 2.54AC − 3.83BC
Weight rate (%) = +2.80 + 0.9403A − 1.40B + 1.08C − 0.3903AB + 0.5676AC − 0.8662BC
The air permeability change rate and weight change rate presented in Table 5 and Table 6 were calculated using the Two-Factor Interaction model expressed in Equation (3). The models for air permeability change rate and weight change rate were found to be statistically significant at the 5% confidence level, with p-values of less than 0.05 for both models. The equations written in terms of coded factors can be utilized to predict the response to specified levels of each factor. By convention, high levels of the factors are coded as +1 and low levels as −1. The coded equation is valuable for assessing the relative impact of the factors by comparing their coefficients. The regression model for the permeability change rate and weight change rate, expressed with coded factors, demonstrated a good fit to the values of the dependent variables [32].
The overall efficiency of these models’ prediction is defined by their coefficient of determination, R-squared. In this study, both models showed relatively high R-squared values for the air permeability change rate (R2 = 0.85) and weight change rate (R2 = 0.92), ensuring a good correlation between the model-predicted values and actual experimental values. However, the R-squared value should also closely align with the adjusted R-squared value. When there is a significant difference between R-squared and adjusted R-squared values, it is likely that the model includes unimportant terms. The R-squared predicted term explains the model’s ability to predict new responses, thus R-squared and R-squared predicted terms should match closely. As shown in Table 5 and Table 6, the weight change rate demonstrates less discrepancy among its R-squared, R-squared adjusted, and R-squared predicted values compared to the air permeability change rate. Furthermore, from the perspective of combinatorial effects, the interaction of weight change rates with other factors was found to be somewhat more significant [26].
Adequate precision (AP) is the ratio of the range of values predicted at the design point to the average standard deviation of all predicted responses and should be greater than four for a good model. The ratios of the permeability change rate and weight change rate models were 11.47 and 20.58, respectively, indicating that these were adequate models.
The normal probability plots of the standardized Studentized residuals for the permeability change rate and weight change rate presented in Figure 3 do not deviate significantly from a straight line, suggesting that the data follow a normal distribution. The diagnostic plot of predicted versus actual values for the weight change rate, shown in Figure 4, demonstrates the good agreement between the model predictions and the actual experimental data. Therefore, we can conclude that the Two-Factor Interaction model presented in Equations (4) and (5) is significant and appropriate. Figure 5 illustrates the plot of the Studentized residuals against the run order. The data points do not exhibit any discernible pattern of overlapping and fall within the designated red control limits. This observation suggests the absence of extreme outliers and supports the appropriateness of the model [33,34,35].
The 3D plots presented in Figure 6 and Figure 7 illustrate the effects of the variables and their interactions on the rates of air permeability change and weight change. As frequency and power increased, the rates of air permeability change and weight change also increased, demonstrating the removal effect seen within the ranges selected for this study [36].

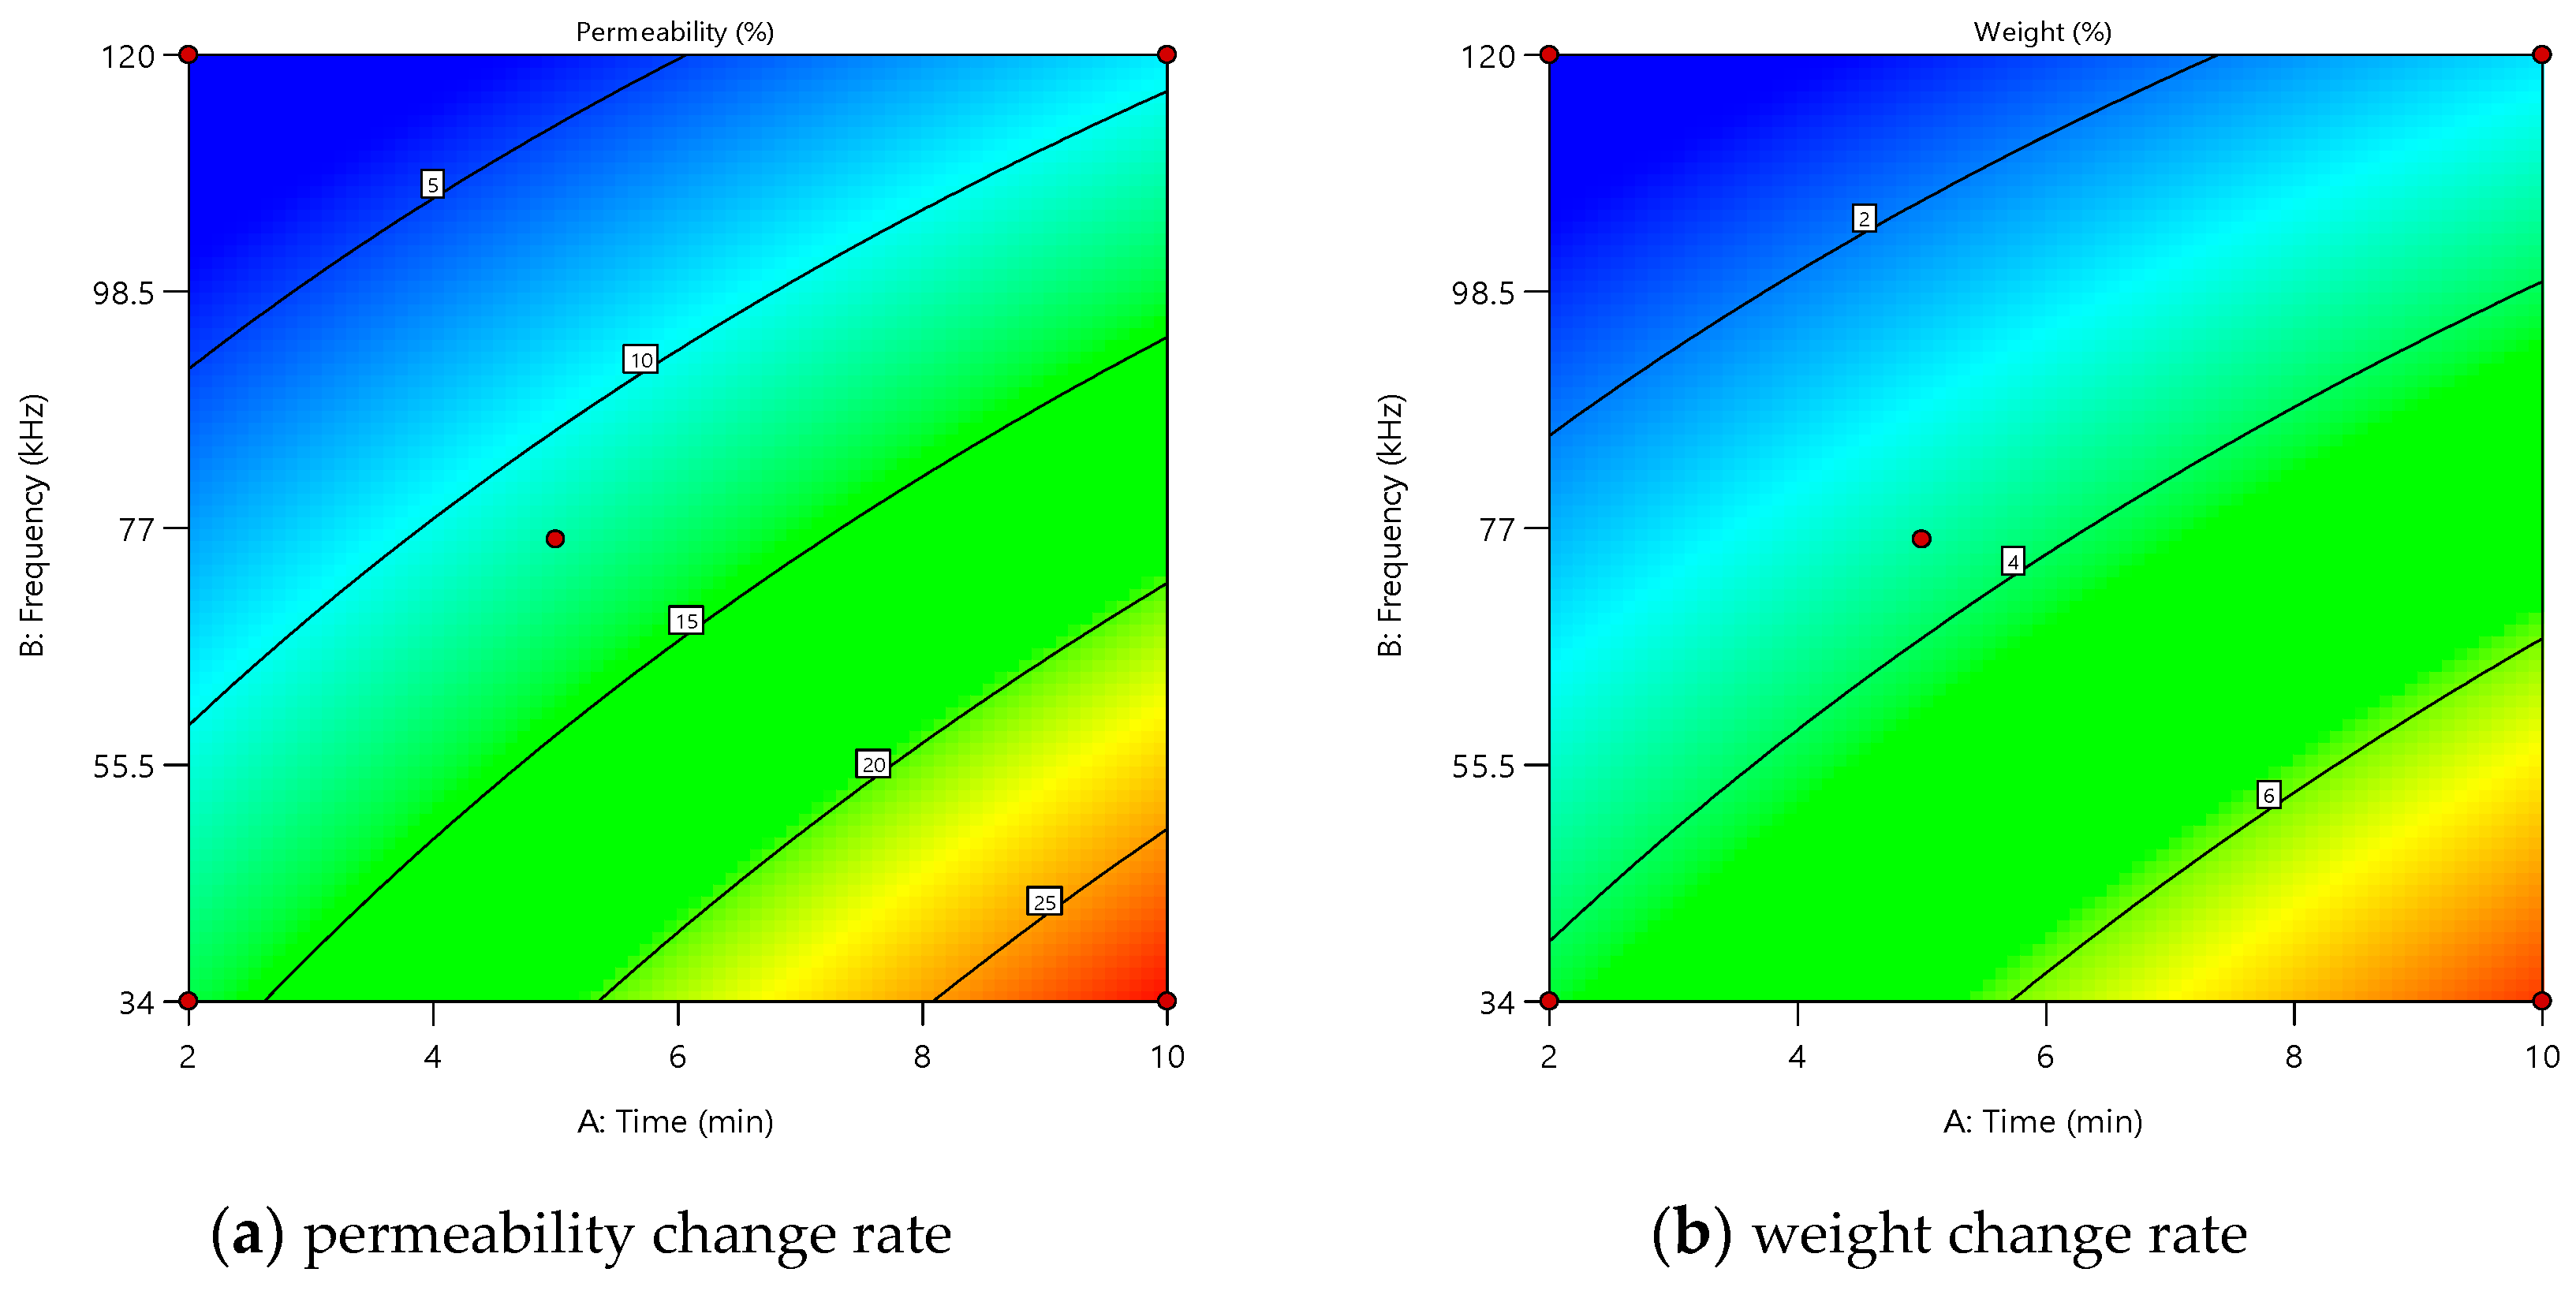
3.2. Optimization of Statistics (RSM)

Multiple-response optimization is a strategy widely used in Response Surface Methodology (RSM) to find the optimal combination of input variables while simultaneously considering multiple response variables. This approach involves combining individual responses into a composite function, thereby transforming multiple responses into a single response for optimization [26].
In this study, the desirability function approach was employed for optimization. The desirability function approach consists of transforming each response into an individual desirability function (d), which is then aggregated into a composite function (D), typically using geometric or arithmetic meaning. Desirability ranges from 0 to 1 for a given response. Ideally, the desirability function should equal 1, but, in practical situations, it should be close to 1. A value of 0 indicates that one or more responses have fallen outside the desired limits. To establish optimization criteria, five possibilities (none, maximize, minimize, target, and in range) are used to select the desired goal for each variable and response. The desired goals for air permeability change rate and weight change rate were set to “maximize”. For time, the goal was set to “minimize”, as a faster time is more efficient, while frequency and power were set to “in range”.
In this study, equal weights and priorities were assigned to all factors. The lower and upper limits for all responses were derived from the experimental data gathered with the Box–Behnken design. Figure 8 depicts the optimization contour plot and optimization response surface plot [37].
The optimal conditions predicted by the model are presented in Table 7. The first solution out of the 44 generated was selected. Confirmation tests were conducted with three repetitions to verify the predicted optimal values, and the comparison between the predicted and experimental values is shown in Table 8. The results of the confirmation tests were an air permeability change rate of 19.4% and a weight change rate of 5.7%, indicating that the air permeability change rate and weight change rate obtained from the experimental values were similar to those predicted using the regression model [38,39,40,41]. Considering the reproducibility of the experiment under optimal conditions, the results appear to be significant, as the values fall within a 5% margin of error.

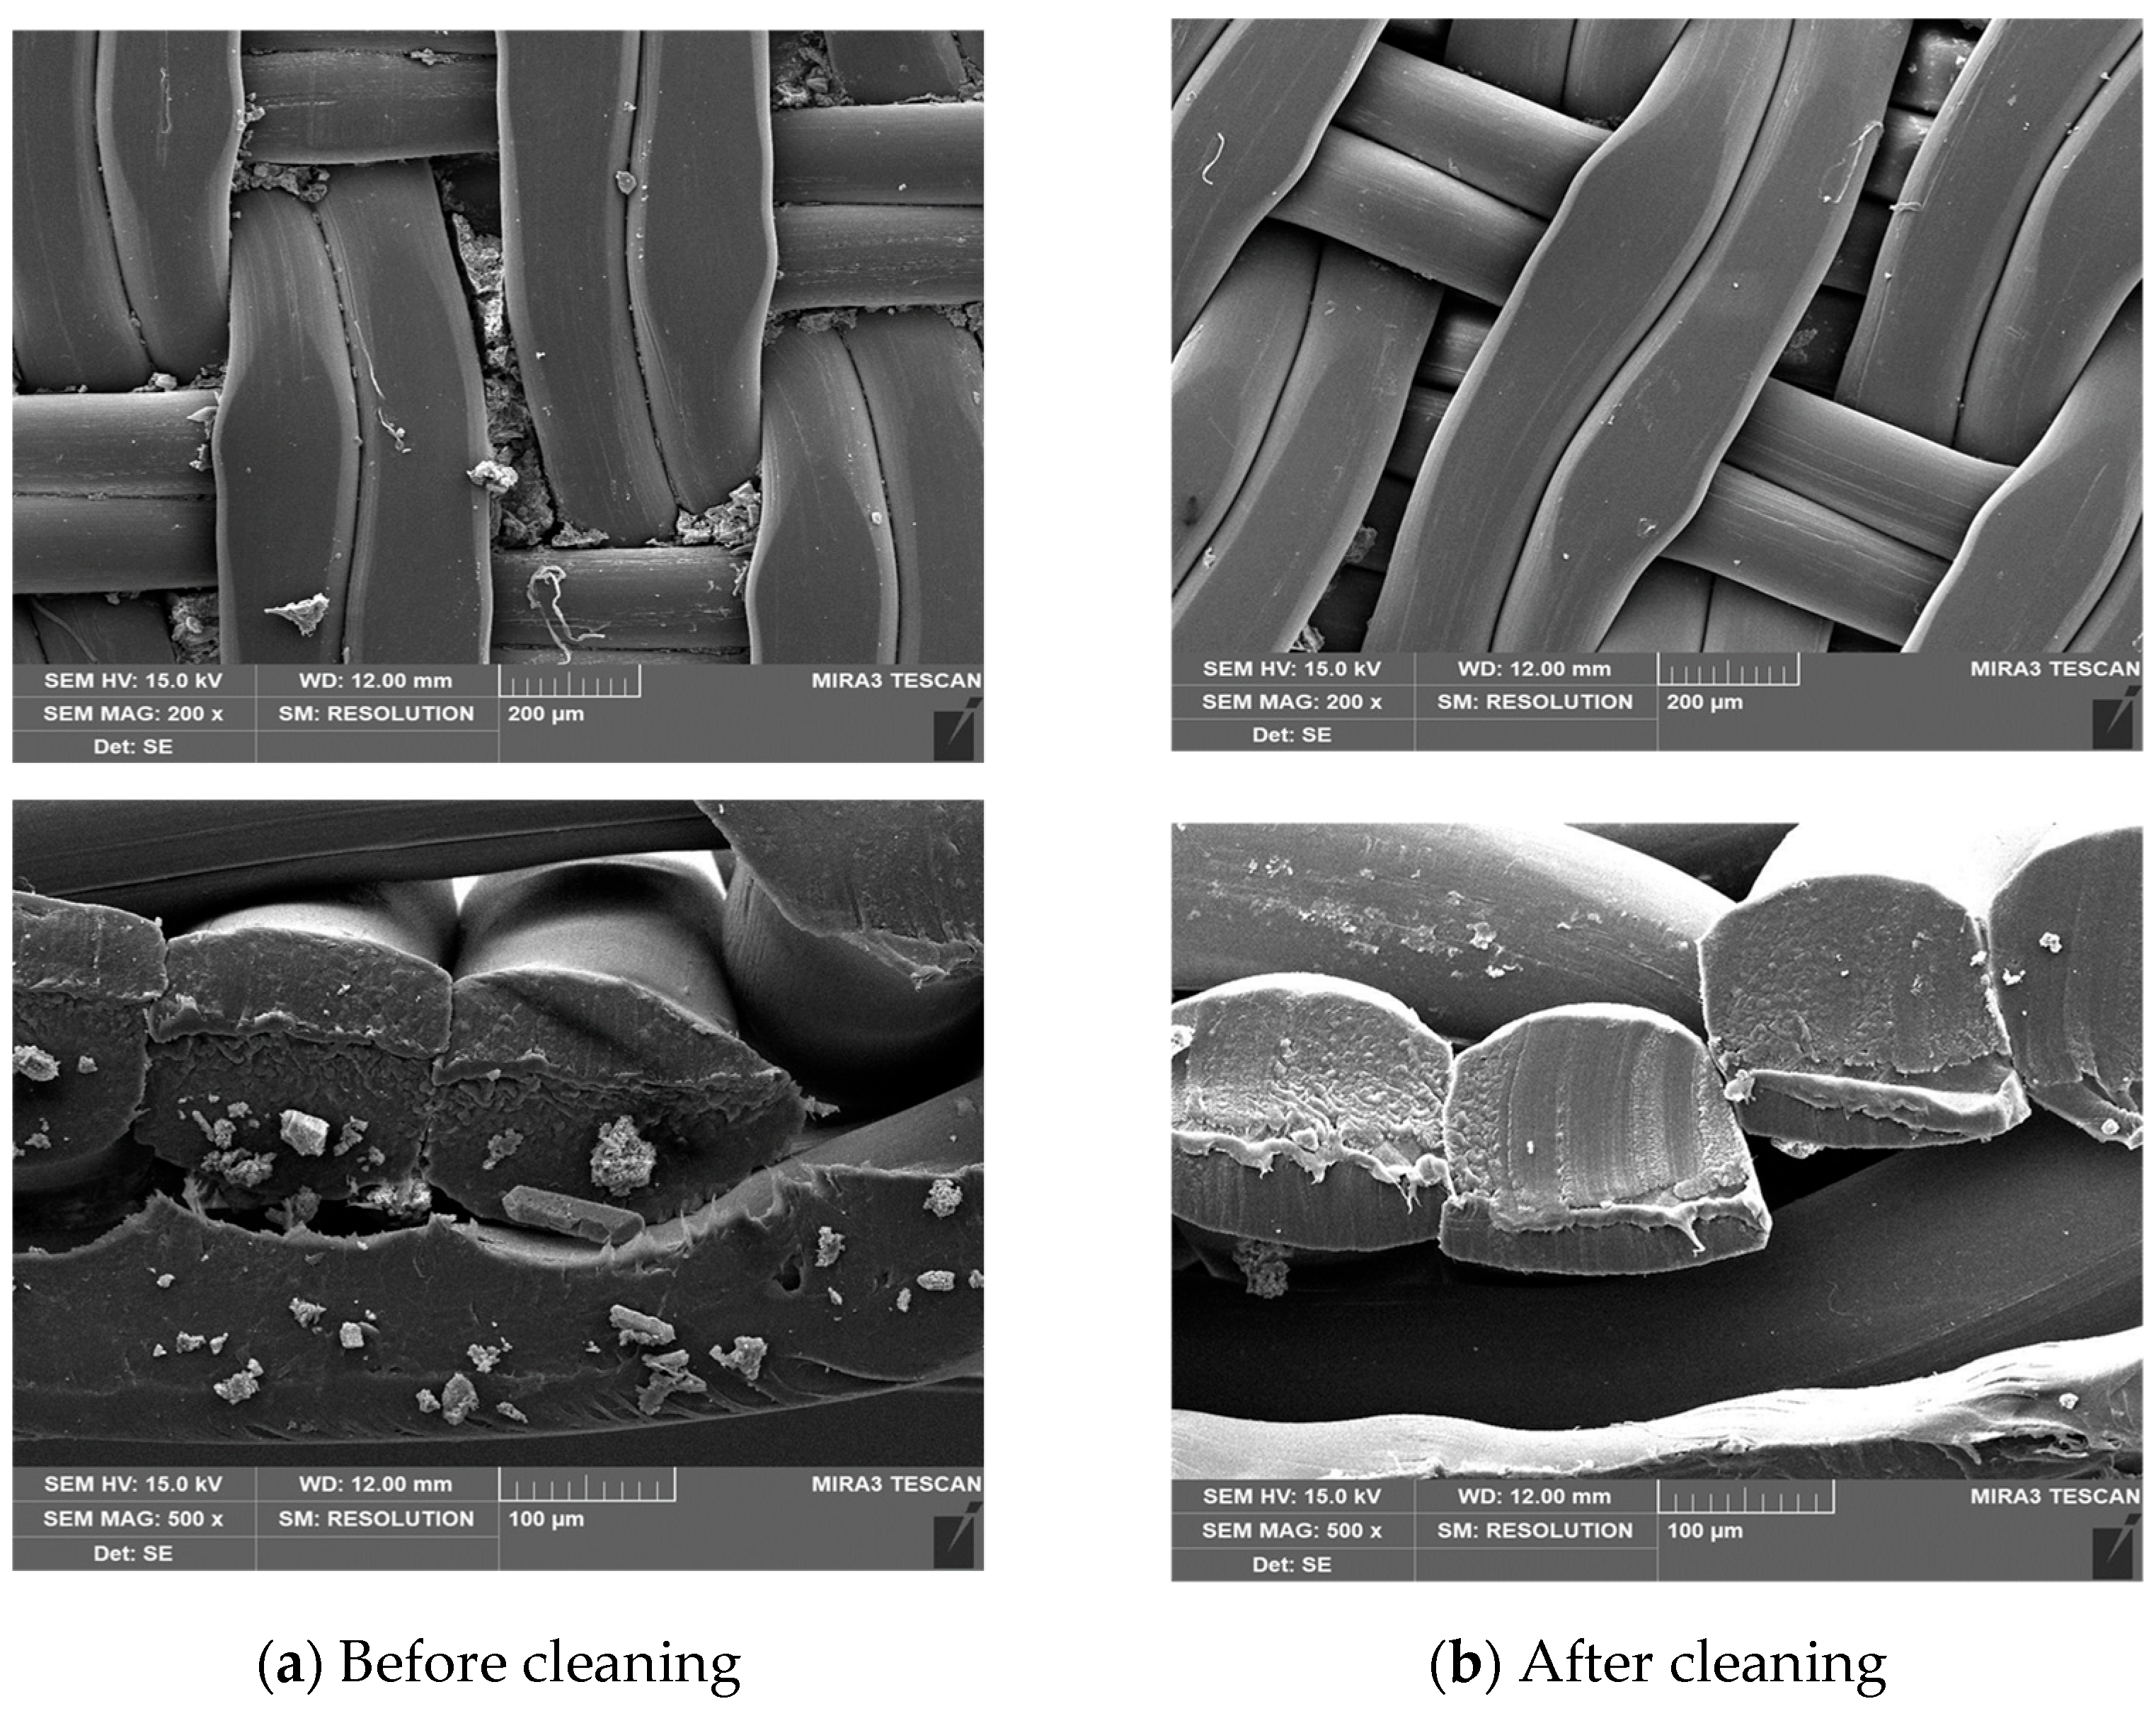
3.3. Analysis of SEM

The morphology of the filter cloth before and after cleaning was examined through SEM images, as shown in Figure 9. The SEM images captured at 200× and 500× magnifications reveal that the contaminants adhering to the cloth structure before cleaning were largely removed by the cleaning process. Physical damage to the filter cloth was not observed after washing, and no structural destruction of the filter cloth was detected in the SEM analysis images. The filter cloth is a woven fabric with a pore size of 200 μm. The particle size distribution of the contaminant shows that 90% of the particles range from 10 to 240 μm. It was confirmed that contaminants with a size of 50 μm, which accounted for more than 50% of those captured in the pores between the filter cloths, were mostly removed after cleaning, except for a small portion of 10 μm sized particles. It is believed that the application of ultrasound facilitated the detachment of contaminants adhered to the pores and surfaces of the filter cloth. This demonstrates the significant effectiveness of ultrasonic cleaning [42,43,44].

4. Conclusions

In this study, ultrasonic excitation was employed for filter cloth cleaning, and the optimal cleaning conditions were predicted while monitoring the efficiency and performance of various cleaning parameters. Cleaning experiments were conducted on clogged filter cloths of a fixed size (Φ0.11 m) by varying operational conditions such as time (2, 5, 10 min), frequency (34, 76, 120 kHz), and power output (100, 200, 300 W). The aim was to investigate the cleaning capacity and efficiency of each set of parameters and to evaluate the effectiveness of ultrasonic cleaning. The results are detailed below.
The analysis of variance (ANOVA) results demonstrated that the Two-Factor Interaction model provided the most suitable explanation for the variations in air permeability and weight. The models for the air permeability recovery rate and weight change rate exhibited statistical significance at the 5% confidence level, with p-values below 0.05. The regression models, utilizing coded factors to express the air permeability change rate and weight change rate, demonstrated a high degree of fit to the dependent variable values.
Scanning electron microscopy (SEM) image analysis elucidated the efficacy of ultrasonic cleaning, as evidenced by the substantial removal of contaminants from the filter cloth post-washing compared to those seen in its pre-washing state.
Our experimental findings indicated that the air permeability recovery rate of the clogged filter cloth attained a maximum value of approximately 28.6%. By employing the Response Surface Methodology (RSM), under the conditions of 5.2 min, 34 kHz, and 300 W, the air permeability recovery rate and weight change rate were determined to be 19.8% and 5.8%, respectively. Corroborating these results, the analysis of our experimental tests yielded air permeability recovery and weight change rates of 19.4% and 5.7%, respectively, under identical conditions, demonstrating that there was a high degree of concordance between the predicted and observed values.
The congruence between the RSM predictions and experimental outcomes suggests the potential applicability of this filter press cleaning device in filter cloth management and operational technology. Further refinement and validation of this technology may be achieved through the acquisition and analysis of data from repeated experiments. Based on the experimental results of this cleaning process, we plan to apply and validate this device in conjunction with a pilot-scale filter press dewatering process to gather further practical experimental results.

Author Contributions

Conceptualization, C.J.; methodology, C.J. and S.H.; validation, E.K. and S.H.; formal analysis, C.J. and E.K.; investigation, C.J. and E.K.; resources, C.J., E.K. and S.H.; data curation, C.J.; writing—original draft preparation, C.J. and E.K.; writing—review and editing, C.J., E.K. and S.H.; visualization, C.J.; supervision, C.J.; project administration, C.J., E.K. and S.H.; funding acquisition, C.J., E.K. and S.H. All authors have read and agreed to the published version of the manuscript.

Funding

This research was supported by the Korea Ministry of Environment (MOE) as a Waterworks and Sewerage Innovation Technology Development Project (no. 2021002690009).

Data Availability Statement

The data presented in this study are available on request from the corresponding author.

Conflicts of Interest

The authors declare no conflict of interest.

Abbreviations

DOEDesign of Experiments
RSMResponse Surface Methodology
CCDCentral composite design
BBDBox–Behnken design
DODissolved oxygen
ANOVAAnalysis of Variance
APAdequate precision
CIConfidence Interval
TITest Interval
SEStandard Error
SEMScanning electron microscopy
p-valueProbability value
Dev Deviation
kHz Kilohertz
WWatt
P0Air permeability before cleaning (m3·m−2·h−1)
PcAir permeability after cleaning (m3·m−2·h−1)
W0Weight before cleaning (g)
WcWeight after cleaning (g)
εError
2FITwo-Factor Interaction

References

  1. Bernd, F.; Patrick, M.; Hermann, N. Regeneration assessments of filter fabrics of filter presses in the mining sector. Miner. Eng. 2021, 168, 106922. [Google Scholar]
  2. Gunson, A.J.; Klein, B.; Veiga, M.; Dunbar, S. Reducing mine water requirements. J. Clean. Prod. 2012, 21, 71–82. [Google Scholar] [CrossRef]
  3. Amir, H.M.; Ali, H. Filter press optimisation for black mulberry juice extraction. Biosyst. Eng. 2022, 215, 80–103. [Google Scholar]
  4. Qasim, M.; Darwish, N.N.; Mhiyo, S. The use of ultrasound to mitigate membrane fouling in desalination and water treatment. Desalination 2018, 443, 143–164. [Google Scholar] [CrossRef]
  5. Alventosa-deLara, E.; Barredo-Damas, S.; Alcaina-Miranda, M.I.; Iborra-Clar, M.I. Study and optimization of the ultrasound-enhanced cleaning of an ultrafiltration ceramic membrane through a combined experimentale statistical approach. Ultrason. Sonochem. 2014, 21, 1222–1234. [Google Scholar] [CrossRef]
  6. Gonzalez-Avila, S.R.; Prabowo, F.; Kumar, A.; Ohl, C.D. Improved ultrasonic cleaning of membranes with tandem frequency excitation. J. Membr. Sci. 2012, 415, 776–783. [Google Scholar] [CrossRef]
  7. Jin, W.; Guo, W.; Lu, X.; Han, P.; Wang, Y. Effect of the ultrasound generated by flat plate transducer cleaning on polluted polyvinylidene fluoride hollow fiber ultrafiltration membrane. Chin. J. Chem. Eng. 2008, 16, 801–804. [Google Scholar] [CrossRef]
  8. Kobayashi, T.; Kobayashi, T.; Hosaka, Y.; Fujii, N. Ultrasound enhance membrane cleaning processes applied water treatments: Influence of sonic frequency on filtration treatments. Ultrasonics 2003, 41, 185–190. [Google Scholar] [CrossRef]
  9. Lamminen, M.O.; Walker, H.W.; Weavers, K. Mechanisms and factors influencing the ultrasonic cleaning of particle-fouled ceramic membranes. J. Membr. Sci. 2004, 237, 213–223. [Google Scholar] [CrossRef]
  10. Lujan-Facundo, M.J.; Mendoza-Roca, J.A.; Cuartas-Uribe, B.; Alvarez-Blanco, S. Ultrasonic cleaning of ultrafiltration membranes fouled with BSA solution. Sep. Purif. Technol. 2013, 120, 275–281. [Google Scholar] [CrossRef]
  11. Muthukumaran, S.; Yang, K.; Seuren, A.; Kentish, S.; Ashokkumar, M.; Stevens, G.W.; Grieser, F. The use of ultrasonic cleaning for ultrafiltration membranes in the dairy industry. Sep. Purif. Technol. 2004, 39, 99–107. [Google Scholar] [CrossRef]
  12. Li, J.; Sanderson, R.D.; Jacobs, E.P. Ultrasonic cleaning of nylon microfiltration membranes fouled by Kraft paper mill effluent. J. Membr. Sci. 2002, 205, 247–257. [Google Scholar] [CrossRef]
  13. Masselin, I.; Chasseray, X.; Laurence, D.B.; Laine, J.M.; Syzaret, P.-Y.; Lemordant, D. Effect of sonication on polymeric membranes. J. Membr. Sci. 2001, 181, 213–220. [Google Scholar] [CrossRef]
  14. Vergara-Araya, M.; Oeltze, H.; Radeva, J.; Roth, A.G.; Göbbert, C. Operation of Hybrid Membranes for the Removal of Pharmaceuticals and Pollutants from Water and Wastewater. Membranes 2022, 12, 502. [Google Scholar] [CrossRef]
  15. Abdullayev, A.; Bekheet, M.F.; Hanaor, D.A.H.; Gurlo, A. Materials and Applications for Low-Cost Ceramic Membranes. Membranes 2019, 9, 105. [Google Scholar] [CrossRef]
  16. Sewerin, T.; Elshof, M.G.; Matencio, S.; Boerrigter, M.; Yu, J.; de Grooth, J. Advances and Applications of Hollow Fiber Nanofiltration Membranes: A Review. Membranes 2021, 11, 890. [Google Scholar] [CrossRef]
  17. Luo, H.; Wang, Z. A new ultrasonic cleaning model for predicting the flux recovery of the UF membrane fouled with humic acid. J. Environ. Chem. Eng. 2022, 10, 107156. [Google Scholar] [CrossRef]
  18. Shi, X.; Tal, G.; Hankins, N.P.; Gitis, V. Fouling and cleaning of ultrafiltration membranes: A review. J. Water Process Eng. 2014, 1, 121–138. [Google Scholar] [CrossRef]
  19. Lujan-Facundo, M.J.; Mendoza-Roca, J.A.; Cuartas-Uribe, B.; Alvarez-Blanco, S. Membrane fouling in whey processing and subsequent cleaning with ultrasounds for a more sustainable process. J. Clean. Prod. 2017, 143, 804–813. [Google Scholar] [CrossRef]
  20. Arefi-Oskoui, S.; Khataee, A.; Safarpour, M.; Orooji, Y.; Vatanpour, V. A review on the applications of ultrasonic technology in membrane bioreactors. Ultrason. Sonochem. 2019, 58, 104633. [Google Scholar] [CrossRef]
  21. Ge, H.; Zhan, W.; Xi, W. Ultrasonic cleaning in the membrane process: From phenomenon to mechanism and mathematical model. Chem. Eng. Sci. 2023, 282, 119267. [Google Scholar]
  22. Hauptmann, M.; Frederickx, F.; Struyf, H.; Mertens, P.; Heyns, M.; De Gendt, S.; Glorieux, C.; Brems, S. Enhancement of cavitation activity and particle removal with pulsed high frequency ultrasound and supersaturation. Ultrason. Sonochem. 2013, 20, 69–76. [Google Scholar] [CrossRef] [PubMed]
  23. Verhaagen, B.; Fernandez Rivas, D. Measuring cavitation and its cleaning effect. Ultrason. Sonochem. 2016, 29, 619–628. [Google Scholar] [CrossRef] [PubMed]
  24. Chahine, G.L.; Kapahi, A.; Choi, J.K.; Hsiao, C.T. Modeling of surface cleaning by cavitation bubble dynamics and collapse. Ultrason. Sonochem. 2016, 29, 528–549. [Google Scholar] [CrossRef]
  25. Park, S.H. Modern Design of Experiments; Minyoug Pub.: Seoul, Republic of Korea, 2011; pp. 521–571. [Google Scholar]
  26. Raymond, H.M.; Douglas, C.M.; Christine, M.A. Response Surface Methodology: Process and Product Optimization Using Designed Experiments, 3rd ed.; John Wiley & Sons: Hoboken, NJ, USA, 2009; pp. 1–58. [Google Scholar]
  27. Yuan, J.; Huang, J.; Wu, G.; Tong, J.; Xie, G.; Duan, J.; Qin, M. Multiple responses optimization of ultrasonic-assisted extraction by response surface methodology (RSM) for rapid analysis of bioactive compounds in the flower head of Chrysanthemum morifolium Ramat. Ind. Crops Prod. 2015, 74, 192–199. [Google Scholar] [CrossRef]
  28. KS K ISO9237; Detemination of the permeability of fabrics to air. Korean Agency for Technology and Standards: Eumseong, Republic of Korea, 1995.
  29. Pooralhossini, J.; Zanjanchi, M.A.; Ghaedi, M.; Asfaram, A.; Ahmadi Azqhandi, M.H. Statistical optimization and modeling approach for azo dye decolorization: Combined effects of ultrasound waves and nanomaterial-based adsorbent. Appl. Organometal. Chem. 2018, 32, e4205. [Google Scholar] [CrossRef]
  30. Azqhandi, M.H.A.; Foroughi, M.; Yazdankish, E. A highly effective, recyclable, and novel host-guest nanocomposite for Triclosan removal: A comprehensive modeling and optimization-based adsorption study. J. Colloid Interface Sci. 2019, 551, 195–207. [Google Scholar] [CrossRef]
  31. O’Brien, R.M. A Caution Regarding Rules of Thumb for Variance Inflation Factors. Qual. Quant. 2007, 41, 673–690. [Google Scholar] [CrossRef]
  32. Malika, M.; Sonawane, S.S. Statistical modelling for the Ultrasonic photodegradation of Rhodamine B dye using aqueous based Bi-metal doped TiO2 supported montmorillonite hybrid nanofluid via RSM. Sustain. Energy Technol. Assess. 2021, 44, 100980. [Google Scholar] [CrossRef]
  33. Banerjee, P.; Barman, S.R.; Mukhopadhayay, A.; Das, P. Ultrasound assisted mixed azo dye adsorption by chitosan-graphene oxide nanocomposite. Chem. Eng. Res. Des. 2017, 117, 43–56. [Google Scholar] [CrossRef]
  34. Bhattacharya, S.; Banerjee, P.; Das, P.; Bhowal, A.; Majumdar, S.K.; Ghosh, P. Removal of aqueous carbamazepine using graphene oxide nanoplatelets: Process modelling and optimization. Sustain. Environ. Res. 2020, 30, 17. [Google Scholar] [CrossRef]
  35. Bhattacharya, S.; Das, P.; Bhowal, A.; Saha, A. Thermal, Chemical and ultrasonic assisted synthesis of carbonized Biochar and its application for reducing Naproxen: Batch and Fixed bed study and subsequent optimization with response surface methodology (RSM) and artificial neural network (ANN). Surf. Interfaces 2021, 26, 101378. [Google Scholar] [CrossRef]
  36. Noorani Khomeyrani, S.F.; Ahmadi Azqhandi, M.H.; Ghalami-Choobar, B. Rapid and efficient ultrasonic assisted adsorption of PNP onto LDH-GO-CNTs: ANFIS, GRNN and RSM modeling, optimization, isotherm, kinetic, and thermodynamic study. J. Mol. Liq. 2021, 333, 115917. [Google Scholar] [CrossRef]
  37. Costa, N.R.; Lourenço, J.; Pereira, Z.L. Desirability function approach: A review and performance evaluation in adverse condition. Chemom. Intell. Lab. Syst. 2011, 107, 234–244. [Google Scholar] [CrossRef]
  38. Nair, A.T.; Ahammed, M.M. The reuse of water treatment sludge as a coagulant for post-treatment of UASB reactor treating urban wastewater. J. Clean. Prod. 2015, 96, 272–281. [Google Scholar] [CrossRef]
  39. Pandey, A.; Belwala, T.; Sekara, K.C.; Bhatta, I.D.; Rawal, R.S. Optimization of ultrasonic-assisted extraction (UAE) of phenolics and antioxidant compounds from rhizomes of Rheum moorcroftianum using response surface methodology (RSM). Ind. Crops Prod. 2018, 119, 218–225. [Google Scholar] [CrossRef]
  40. Vivek, K.; Subbarao, K.V.; Srivastava, B. Optimization of postharvest ultrasonic treatment of kiwifruit using RSM. Ultrason. Sonochemistry 2016, 32, 328–335. [Google Scholar] [CrossRef]
  41. Bai, H.; Tian, J.; Talifu, D.; Okitsu, K.; Abulizi, A. Process optimization of esterification for deacidification in waste cooking oil: RSM approach and for biodiesel production assisted with ultrasonic and solvent. Fuel 2022, 318, 123697. [Google Scholar] [CrossRef]
  42. Ealias, A.M.; Saravanakumar, M.P. Facile synthesis and characterisation of AlNs using Protein Rich Solution extracted from sewage sludge and its application for ultrasonic assisted dye adsorption: Isotherms, kinetics, mechanism and RSM design. J. Environ. Manag. 2018, 206, 215–227. [Google Scholar] [CrossRef]
  43. Vedaramana, N.; Sandhyaa, K.V.; Charukeshb, N.R.B.; Venkatakrishnana, B.; Haribabub, K.; Sridharana, M.R.; Nagarajanc, R. Ultrasonic extraction of natural dye from Rubia Cordifolia, optimisation using response surface methodology (RSM) & comparison with artificial neural network (ANN) model and its dyeing properties on different substrates. Chem. Eng. Process. 2017, 114, 46–54. [Google Scholar]
  44. Vyas, N.; Dehghani, H.; Sammons, R.L.; Wang, Q.X.; Leppinen, D.M.; Walmsley, A.D. Imaging and analysis of individual cavitation microbubbles around dental ultrasonic scalers. Ultrasonics 2017, 81, 66–72. [Google Scholar] [CrossRef] [PubMed]
Figure 1. Schematic diagram of ultrasonic cleaning apparatus.
Processes 13 01574 g001
Figure 2. Dissolved oxygen concentration measurements before and after the experiment.
Processes 13 01574 g002
Figure 3. Normal probability plot of Studentized residuals (permeability change rate and weight change rate).
Processes 13 01574 g003
Figure 4. Plot of predicted vs. actual results (permeability change rate and weight change rate).
Processes 13 01574 g004
Figure 5. Plot of Studentized residuals vs. each run (permeability change rate and weight change rate).
Processes 13 01574 g005
Figure 6. Contour plots of permeability change rate and weight change rate.
Processes 13 01574 g006
Figure 7. Three-dimensional surface plots of permeability change rate and weight change rate.
Processes 13 01574 g007
Figure 8. Optimization plots of permeability change rate and weight change rate: (a) optimization contour plot; (b) optimization response surface plot.
Processes 13 01574 g008
Figure 9. Analysis of SEM images before and after filter cloth cleaning.
Processes 13 01574 g009
Table 1. Specifications of ultrasonic cleaning apparatus.
Component PartsParameterValue
TankVolume191 L
Transducers (BLT)Length0.40 m
Interval0.05–0.15 m
Ultrasonic GeneratorsFrequency34 kHz, 76 kHz, 120 kHz
Power100 W, 200 W, 300 W
Table 2. Range and level of independent variables.
Independent
Variable
Symbol Levels
−101
Time (min)A2510
Frequency (kHz)B3476120
Power (W)C100200300
Table 3. Dissolved oxygen concentration measurements before and after the experiment.
A: TimeB: FrequencyC: PowerBeforeAfter
minkHzWDO (ppmw)
12343004.594.10
25342004.454.05
32762004.454.38
410341004.454.19
521201003.703.40
6101203004.733.88
710343004.043.70
82341004.043.76
95761004.453.08
10101201004.454.30
115762004.303.84
125763004.113.60
1351202004.013.80
1410762004.504.01
1521203004.324.00
Table 4. Changes in ventilation and weight according to encoded independent variables.
Factor 1Factor 2Factor 3Response 1Response 2
StdRunA: TimeB: FrequencyC: PowerPermeabilityWeight
minkHzW%%
4123430013.404.25
5253420016.144.41
1232762007.291.91
10410341005.262.77
1521201004.471.08
136101203007.902.70
97103430028.668.37
382341003.581.67
1195761005.661.41
610101201004.061.43
8115762007.452.04
15125763006.002.53
21351202005.201.41
714107620018.343.83
141521203003.101.04
Table 5. ANOVA for 2FI permeability model.
SourceSum of SquaresdfMean SquareF-Valuep-Value
Model606.686101.117.980.0049significant
A—Time110.491110.498.720.0183
B—Frequency184.761184.7614.580.0051
C—Power137.411137.4110.840.0110
AB18.03118.031.420.2671
AC52.11152.114.110.0771
BC117.141117.149.240.0161
Residual101.37812.67
Cor Total708.0514
0.85Predicted R² 0.36
Adjusted R²0.74Adeq Precision11.47
Table 6. ANOVA for 2FI model weight.
SourceSum of SquaresdfMean SquareF-Valuep-Value
Model48.9268.1528.36<0.0001significant
A—Time9.0219.0231.390.0005
B—Frequency19.41119.4167.52<0.0001
C—Power11.59111.5940.330.0002
AB1.2311.234.290.0720
AC2.6112.619.080.0167
BC6.0016.0020.880.0018
Residual2.3080.29
Cor Total51.2214
0.95Predicted R² 0.77
Adjusted R²0.92Adeq Precision20.58
Table 7. Prediction of optimal conditions.
Solution 1 of 44 ResponsesPredicted MeanPredicted MedianStd DevSE Mean95% CI Low for Mean95% CI High for Mean95% TI Low for 99% Pop95% TI High for 99% Pop
Permeability19.7919.793.552.2314.6324.950.0539.64
Weight5.775.770.530.334.996.552.788.76
Table 8. Comparison of predicted and experimental values.
Time
min
Frequency
kHz
Power
W
Permeability
%
Weight
%
Predicted5.23430019.85.8
Experimental5.03430019.45.7
Disclaimer/Publisher’s Note: The statements, opinions and data contained in all publications are solely those of the individual author(s) and contributor(s) and not of MDPI and/or the editor(s). MDPI and/or the editor(s) disclaim responsibility for any injury to people or property resulting from any ideas, methods, instructions or products referred to in the content.

