1. Introduction
Modeling of plasmonic thin-film solar cells involves understanding and simulating the interaction of light with nanostructured materials that enhance the light absorption and efficiency. Recently, global warming has become one of the most critical issues as a result of the worldwide rise in temperature. Climate change can prevent people from living comfortably and create an environment that is nearly impossible to survive if the planet continues to warm up at such an accelerated rate [
1]. Several parts of the world experience record-breaking temperature levels during summer, where temperature soars beyond 50 °C, which result in electrical power outage due to the increase in load demand. To generate sustainable energy using PV panels, it is necessary not only to quantify the current solar resource but also to forecast how it changes as a result of any future climate change [
2]. Although the PV panels efficiency would fall everywhere during the hot summer days, the situation will be worse in some areas than in others due to global warming and climate change [
3]. Areas significantly affected include Southern Europe, Southern United States, Central Asia, Northern South America, and Northern Africa [
3].
The overall PV conversion efficiency of solar panels decreases as the cell temperature rises [
4,
5,
6]. In general, researchers have shown that there is a significant increase in the PV solar cell efficiency of 0.4–0.65% being achieved per one-degree Celsius reduction in the cell temperature [
7,
8]. In solar panels, sunlight is absorbed and converted into electricity by the photovoltaic effect. The resistive losses of semiconductor materials in solar cells increase when temperatures rise, which reduces the overall efficiency of energy conversion [
9,
10]. The voltage output of solar panels also decreases when temperature increases. Thus, the overall output power of PV solar panels decreases [
11,
12]. In general, solar panels are more efficient at lower temperatures. As a result of heat waves, solar panels are challenged to dissipate excess heat, resulting in higher operating temperatures. Thermal stress can be caused by prolonged operation in high temperatures. As a result of such stress, encapsulants, back sheets, and interconnections are degraded. This can affect the solar panels’ longevity and reliability over time [
13,
14]. In addition, higher temperatures might cause increased electron–phonon scattering, which in turn can increase intrinsic losses in plasmonic metals, resulting in less field enhancement and wider resonance linewidths. As a result, the plasmon-enhanced photovoltaic process’s efficiency and optical absorption are reduced. By decreasing carrier dispersion and maintaining the metal’s dielectric function, cooling counteracts these effects and maintains stronger localized fields and sharper resonances. Furthermore, by preserving more advantageous carrier dynamics inside the solar material, cooling not only improves optical absorption properties but also indirectly increases electrical efficiency. Accelerated degradation of solder joint interconnections in crystalline silicon PV solar cells drives high failure rate when rising cell temperatures. It has been found that solder degradation increases with every 1 °C rise from the Standard Test Conditions (STC) [
15,
16]. Thus, when the solar cell temperature is reduced by 1 °C, the lifetime and the overall efficiency of the solar cell increase.
Lower recombination losses, lower material costs, high absorption, and high efficiency are clear benefits of thin-film solar cells [
17]. Incorporating metallic thin-film into the PV structure has garnered a lot of attention lately as a way to increase the efficiency of thin-film solar cell conversion [
18]. This method, referred to as a thin-film plasmonic solar cell (PSC), has been discussed in many research works. To increase the photoelectric conversion efficiency of solar devices, localized surface plasmon resonance, or LSPR, has been used in [
19]. This study determined the mechanism of LSPR in dye-sensitized solar cells (DSSCs). Simple models are presented in [
20] to highlight the significant parameters for optical enhancement in plasmonic PSCs. In [
21], Ag nanoparticles were synthesized and used to form a SnO
2. A hybrid modification strategy of donor and acceptor weight ratio adjustment with simple optical coupling layer has been adopted in [
22] to enhance both the power conversion efficiency (PCE) and the average visible transmittance (AVT). Nanoparticles were also incorporated into the active layer of plasmonic photovoltaics to improve power absorption [
23].
In addition, a numerical analysis has been presented in [
24] to demonstrate the absorption enhancement using the plasmonic effects of Ag nanoparticles (Ag NPs). The aforementioned nanoparticles were integrated at the interface between an ultra-thin MoO
3 anode buffer layer and an indium-tin-oxide (ITO) anode to create polymer-based polymer solar cells (PSCs). In [
25], a typical thin-film solar cell construction has been introduced to show a highly doped coating on a substrate, on top of which an absorber layer has been deposited. Another study has been reported in [
26], which showed that the variations in the thickness of the absorber layer cause significant changes in the electroluminescence spectra of bulk heterojunction organic solar cells. It has been demonstrated that, for devices composed of various photoactive materials, both with and without indium tin oxide, optical thin-film effects significantly affect the optical out-coupling of luminescence radiation. The impacts of the nanoparticles’ form and location inside the active layer (AL) on the rise of absorption within the PSC are examined in [
27] via computing the cross-sectional area of dispersion and absorption on gold (Au) nanoparticles. In order to improve optical absorption for longer wavelengths, an organic solar cell (OSC) with a relatively new low band gap (LBG) semiconducting polymer and different shaped plasmonic silver nanostructures implanted on top of the OSCs’ back Ag layer has been shown in [
28]. However, to the best of the authors’ knowledge, the previous research works have not discussed the electrical, optical, and thermal performance of the same structure, as well as studying the economy and lifespan of plasmonic PV solar cells.
In this work, the plasmonic thin-film silver technology is utilized to enhance the thermal, optical, and electrical performance via improving absorbed optical power, output electrical power, economy, and lifespan of PV solar cells. The plasmonic thin-film Ag is proposed to design and improve the solar cell panel via making a waveguide structure. The proposed design reduces the heat concentration in specific areas via dispersing the absorbed light energy more efficiently as compared to the conventional designs that utilize plasmonic nanoparticles. This design prevents the overheating problems commonly associated with nanoparticles by enabling more uniform heat dispersion over the film, hence minimizing thermal localized hotspots. A three-dimensional CFD model is developed and analyzed. The proposed technique aims to compensate for the decline resulting from the rise in ambient temperatures due to climate change, especially in relatively hot regions. During daylight hours, the amount of solar radiation falling on the solar cells, the actual temperature of the environment, and the wind speed are considered in the proposed CFD model as factors that affect the cell’s temperature.
The Surface Plasmon Polariton (SPP) model was directly incorporated into the Computational Fluid Dynamics (CFD) analysis by using separate physics in COMSOL ver.6.1 software that is electromagnetic wave physics. The SPP phenomenon was analyzed using Maxwell’s equations with appropriate boundary conditions at the metal-dielectric interface. A numerical or analytical approach was employed to solve for the SPP dispersion relation and field distributions. SPPs are inherently an electromagnetic wave phenomenon and require Maxwell’s equations for accurate modeling. CFD primarily focuses on fluid flow and heat transfer, which do not directly solve for electromagnetic field interactions. Electromagnetic simulations (SPPs) and computational fluid dynamics (CFD) are frequently treated as separate but related processes. Accordingly, each model functions separately using distinct physics that are included into the COMSOL program. In the proposed work, the electromagnetic characteristics are influenced by the temperature field from the CFD simulation, which in turn impacts how SPPs propagate. In contrast, the electro-magnetic properties of our model are not directly affected by fluid movement. The fluid movement affects the temperature distribution, which in turn affects the electromanetic simulations indirectly. As a result, the coupling usually happens through temperature rather than directly through the fluid flow. The outcomes of the CFD analysis, such as temperature, were coupled to the SPP model. This allowed for a direct coupling between fluid dynamics and plasmonic effects, ensuring that variations in the surrounding medium were accounted for in the SPP calculations. A fully coupled CFD-SPP model would require complex Multiphysics simulations, which was behind the reason for using the COMSOL Multiphysics ver. 6.1 software, which allows the use of more than one physics at the same time.
This work contributes to the research development of the plasmonic thin-films technology in solar cells. The research finding is significant since it shows a new technique that can be used to improve the solar cell performance based on the plasmonic technology. The design of the proposed solar cells can motivate other optimization techniques in real-world energy applications, which result in several advantages in the subsequent research works.
The organization of this paper is as follows:
Section 2 explains the mathematical equations of Surface Plasmon Polaritons (SPPs).
Section 3 shows the PV solar cell thermal effects modal.
Section 4 demonstrates the results and discussion on thermal effect. In
Section 5, the results and discussion of optical and electrical power for the proposed PV solar cell are presented. A comparison with other previous modern works is presented in
Section 6. The conclusion of this work is given in
Section 7.
2. Mathematical Model for Surface Plasmon Polaritons (SPPs)
Together with photons in dielectric and electrons in metal, SPPs will excite. The interaction of electromagnetic waves with metal free electrons that propagate on metal–dielectric or dielectric–metal interfaces is known as an SPPs [
27]. To understand how the surface plasmon polaritons (SPPs) behave depends on the transition between the metal (Ag) and the dielectric. The connection between the material characteristics and electromagnetic fields at the nanoscale is controlled by the dielectric-metal interface. The propagation of SPPs, or electromagnetic waves related to the metal surface, is supported by the metal (Ag) layer, while the light is guided and the field confinement inside the structure is controlled by the dielectric material. The improved light confinement, which is essential for the plasmonic structures’ performance, is caused by a transition between the metal and the dielectric that affects the plasmonic resonance frequency and the coupling efficiency between the light and the surface plasmon. The transition happens when the metal and dielectric have different refractive indices, which causes intense field localization at the interface and increases the plasmonic resonance. As a result, when the interface is where the field intensities are the highest, contributing to the overall efficiency and optical properties of the structure, which leads to enhance the thermal, optical, electrical aspects for the proposed structure. Excitation of electrons results in the production of an excitation in the metallic mass. The dispersion of electrons coincides with the distribution of light energy in plasma form [
28].
2.1. Mathematical Model for Dispersion Relation in SPP
It is possible to determine the SPP characteristics using Maxwell’s equations. On the
z-axis,
z > 0 is related to the dielectric,
z < 0 is related to the metal, and
z = 0 represents the metal-dielectric interface. It is possible to express the electric and magnetic fields as a function of time
t and coordinates (
x,
y,
z) as [
29].
The subscript n in (1)–(3) refers to the physical material (1 for z < 0 metal or 2 for z > 0 dielectric). The angular frequency of the waves is w. In (2), ± is related to the physical material, where − and + refer to the metallic and dielectric material, respectively. The terms Eo and Ho represent the amplitude of electric and magnetic fields, respectively. In addition, Ex and Ez represent the electric field vector through x- and z-axes, while Hy the magnetic field vector is the y-axis, in addition to the other parts (Ey, Hx, Hz) are zero because the SPPs are always TM (transverse magnetic) waves. The term k is the wave vector, which is a compound vector. When a lossless SPP occurs, it transforms the x and z components into real and imaginary components, respectively. The wave fluctuates along the x-axis and exponentially in the z-axis.
The term
kx is often the same as intended for the content when
kz,1 is usually different from
kz,2, where [
29]:
where
,
, and
c are permittivity of metal, permittivity of dielectric, and speed of light, respectively.
A wave of this metal dielectric plasmonic structure that fulfills Maxwell’s equations in single state, is [
29]:
Equations (6) and (7) can be solved to obtain the dispersion relationship for a wave propagating at the top surface as [
29]:
The metal dielectric formula is obtained within the free electron model of the electron stream or [
29]:
where
wp the frequency of plasma and can be written as [
29]:
In (10), nd stands for electron density, e for charge, m* for effective mass, and for free-space permittivity. The dispersion relationship bows and hits an asymptotic barrier known as the “surface plasma frequency” as it rises, but at low k the SPP behaves like a photon.
2.2. The SPP’s Propagation Length and Skin Depth
As a result, an SPP lengthens the top and releases energy in the direction of the metallic due to absorption. At a distance
x, the intensity dropped by the factor of (
exp(
−2kxi)) because the surface plasmon concentration decreases with the square of the electric field. The term
kxi is the imaginary part of the wave vector. The expanse to fall by a factor of 1/e to the SPP power is used to express the length of propagation (
L) [
30]. This requirement is partially met by [
29]:
Likewise, the electric field evanescently diminishes, forming a corner at the metallic’s top. The skin depth at lower frequencies is usually used to compute the SPP diffusion depth within this metal. Further, the dielectric’s internal field will gradually diminish. The measurements of the decline within the metal and dielectric medium recorded as follows [
30]:
where
m,
d, and
are the skin depth in metal, skin depth in dielectric, and free space wavenumber, respectively.
It should be noted the above parameters are affected by temperature changes because they affect the dielectric function of plasmonic materials, thus, they can drastically vary their electromagnetic response. In particular, the temperature-dependent permittivity of metals (in our case, silver) influences the confinement and propagation length of surface plasmon polaritons. In addition, greater electron-phonon scattering rates brought on by greater temperatures might affect the damping of plasmonic modes and the general properties of absorption. In addition, resonance conditions can be altered by changes in the insulator layer’s dielectric characteristics brought on by thermal expansion or variations in the refractive index.
3. PV Solar Cell Thermal Effects CFD Model
A rising ambient temperature has a major impact on the temperature increase of PV solar modules. PV solar modules can be affected by temperature rise in various ways, affecting their output power, efficiency, economy, and lifespan [
31]. PV solar modules lose their output power when exposed to high temperatures. As the temperature rises, the solar cells become more resistant to sunlight, making converting sunlight into electricity more difficult. PV solar modules also lose efficiency as a result of increasing temperatures. The ability of the module to convert sunlight into usable electricity is reduced due to increased cell resistance that is caused by increased heat. Module degradation will be accelerated by extremely hot temperatures. Over time, these can reduce a module’s performance and reduce its lifespan [
32].
3.1. Computational Domain
A silicon PV solar panel with an area of 120 × 54 cm
2 and a power rating of 100 watts has been used in the present work. Considering measurements and manufacturer specifications,
Figure 1 shows a PV panel with all its main layers, including crystalline cells, external front surface glass, and the sheet that is placed in the back of the solar cells. PV solar cells are made up of layers made from different types of materials. In
Table 1, each component is listed along with its material properties [
33]. Finite element methods have been used to solve the equations related to the energy of the PV solar panel within COMSOL’s CFD package ver. 6.1 [
34].
3.2. Numerical Modeling Equations
Through the use of CFD, it has been possible to model and analyze a three-dimensional PV solar module system. During the day, a cell unit receives irradiance from the sun. Conduction of heat through the layers of the cell, natural convection of heat to the ambient atmosphere air, as well as radiation to the environment are all factors that contribute to the operation of a cell.
Using the energy equation, it is possible to determine the transfer of heat within the PV solar module system [
31,
32,
33,
34]
The parameters used in the energy equation can be defined as follows: corresponds to the temperature distribution through the PV module system, is time (s), represents the density of the PV module system parts (kg/m3), indicates thermal conductivity of the PV module system components (W/m·K), refers to the heat capacity of the PV module system segments (J/kg·K). The symbols and EL in the second part of Equation (14) represent the solar irradiance (W/m3) as a heat source falling on the PV solar module and the rate of electrical energy output, respectively. The electrical energy output term was excluded from the energy balance equation because of its minimal contribution (only 16%) and also to enable more accurate analysis of temperature distribution under non-uniform conditions of localized thermal gradients, which are known as ‘hot spots’. Such spots occur in operational photovoltaic modules due to factors such as partial shading, cell mismatch, or localized defects.
In the form of emission, absorption, reflection, and transmission of heat, objects’ surfaces modulate heat transfer [
34,
35]. The ambient environment is responsible for the convection and radiation of heat by all external surfaces as shown in Equation (15) [
34];
The following parameters describe the above energy balance equation of the PV solar module system, refers to the coefficient of convection (W/m2·K), represents the surface’s normal vector as a unit vector, refers to the Stefan-Boltzmann constant, which is 5.67 × 10⁻⁸ (J/(s·m2·K4)), is ambient temperature (K), and is emissivity.
The ambient temperature was used instead of the sky temperature due to it being typically easier to measure directly using a standard thermometer (supplied by the weather station as shown in
Figure 2). Determining an accurate sky temperature can be more complex, often requiring specialized instruments. The ambient temperature is a more representative measure of the effective temperature of the surroundings with which the object is exchanging heat through radiation. It represents the temperature of the air and all other objects in the environment that the object in question can see. This includes not just the sky, but also the ground, nearby buildings, trees, and any other elements that might be exchanging heat with the object through radiation [
36].
When it comes to convective heat transfer, it is calculated by taking into account the wind speed (
u (m/s)) at which the flat plates of the PV module system are placed in order to calculate the coefficient of heat transfer as follows [
33,
34,
35,
37];
The operating temperature of the PV solar module significantly impacts the system efficiency. As a result of the operating temperature of PV solar cells, the photovoltaic conversion process is influenced. PV solar cell performance decreases as the temperature increases due to the high carrier concentrations and high recombination rates. As the temperature of the cell rises, the efficiency of PV solar cells decreases dramatically, which can be calculated by the fundamental equation of solar cell efficiency [
31,
32,
33,
34,
35,
37];
The coefficient of the temperature
depends on the manufacturing reference temperature
and the highest temperature of the solar cell at which the PV solar cell efficiency falls to the value of zero
. In this case,
for silicon-type of the crystalline solar cells [
37], as shown in the following equation
3.3. Simulation Procedure
The simulation procedure begins with carefully designing the domain of the solar cell module with its layers, including front glass, crystalline cells, and back sheet, which were modelled following measurements and manufacturer specifications. The material properties are specified for each layer in the solar panel domain. For the energy equation to be solved and the solar cell temperature to be determined, it is essential to measure the following variables to specify the amount of thermal energy that will be transferred from the PV solar module to the surrounding atmosphere through convection and radiation. The ambient air temperature, wind speed, solar irradiance flux, and heat energy source from the sun are measured according to the atmospheric conditions from the local meteorology center. The heat transfer coefficients for the PV solar panel flat plates are calculated. A heat source of solar irradiance has been applied over the external surface of the front glass layer of the PV solar panel.
The study location was selected in an arid and hot climate to demonstrate how high temperature affects the solar panels. The climate of Najaf city in Iraq, located at 32.0107° N, 44.3265° E, 53 m elevation, is considered one of the desert climates that has been dramatically affected by climate change and has become extremely hot. In addition to the relatively hot weather in Najaf city, it receives relatively high solar radiation levels throughout the year. The PV solar panel is modelled to tilt at an angle of 32 degrees, matching the latitude of Najaf city, which is optimal for solar energy production throughout the year. The computational model requires the atmospheric conditions over time as input parameters. The inclined solar irradiance was obtained from the National Renewable Energy Laboratory, whereas hourly average wind speed and ambient air temperature were obtained from Najaf International Airport’s weather station.
Figure 2 and
Figure 3 show the daily inclined solar irradiance, ambient air temperature, wind speed, and calculated heat transfer coefficient during daylight hours on 2 August 2023 in Najaf, Iraq [
38]. In the proposed model, changes in solar radiation, wind speed, and ambient temperature are taken into account as shown in
Figure 2 and
Figure 3. For each daytime hour, there is a value for the ambient temperature, wind speed and solar radiation intensity that is entered into the simulation model as a real value based on Najaf International Airport’s weather station [
37].
It should be noted that the model takes into account the change in solar radiation, wind speed, and ambient temperature as shown in
Figure 2 and
Figure 3. For each daytime hour, there is a value for the ambient temperature, wind speed, and solar radiation intensity that is entered into the simulation model as a real value based on Najaf International Airport’s weather station [
38].
The independence of the solutions from grid size was verified through a rigorous numerical test. The equation of the relative error is given by
which was tested for various mesh grid sizes (
Table 2). A mesh number of 134,226 domain, 61,522 boundary, and 1514 edge elements in a computational quadratic finer mesh, as shown in
Figure 4, provided an appropriate spatial resolution with an error rate of 1.67 × 10
−3.
Solving the energy equations simultaneously provides a solution for the PV solar module temperature. During the solution of a couple set of equations twice consecutively, the relative error within every field was equal to or decreased by 1.0 × 10
−6. Quantities of interest are extracted through post-processing. To ensure property conservation and correct physical behavior, examine the results and revise the model accordingly. As shown in
Figure 5, the study procedure diagram shows the steps involved in the current work.
3.4. Model Validation
Finite element methods were used to solve the equations related to the energy of the PV solar panel with Multiphysics CFD software from COMSOL ver. 6.1. Validation is required to ensure that the CFD model meets its intended use requirements. Researchers’ experimental and analytical results were well compared with CFD model results. Based on the present CFD model, the predicted PV module temperatures have been compared with the data under various weather conditions as shown in
Figure 6. A careful comparison has been made between the PV solar module temperatures resulting from the current CFD model with data from three experimental studies. The first dataset was collected from the experimental study presented by Koehl et al. [
39], in which the solar irradiation and the surrounding temperature in various climatic zones were analyzed to measure the temperature of PV modules. The second dataset was obtained from the experimental study conducted by Risser and Fuentes [
40], in which the researchers used intensive instrumentation installed on the PV solar panel and data were captured every minute. Finally, the third dataset was gathered from the experimental study conducted by Kurtz et al. [
41], in which the degradation of polymers in PV solar modules was studied under severe weather conditions with high solar irradiance, high surrounding temperatures, and inferior wind speeds.
The experimentally measured data and the numerical results computed through the CFD simulation model have a high degree of similarity. The present CFD model, as shown in
Figure 6, predicts a temperature rise that is consistent with observed temperature levels. According to the CFD model, the PV solar cell temperature variance between the current results and the literature-measured data is not more than two degrees Celsius, i.e., with an error factor of no more than four percent. Solar cells’ electrical efficiency decreases as a result of their high temperature. However, the small difference between the numerical results of the present CFD model and the experimentally measured results does not show a significant effect when it comes to calculating its reduction in efficiency.
4. Thermal Results and Discussion
Essentially, there is an inverse correlation between the PV cells’ temperature of the solar panel and the productivity of the PV solar panel, which is mainly determined by the amount of solar radiation and ambient air temperature.
Figure 7 shows the effect of changing solar radiation intensity and ambient temperature during daylight hours on the cells’ temperature distribution of the solar panel. PV solar panels are less likely to heat up if the air ambient temperature or solar radiation intensity decreases. A low air ambient temperature in the early morning improves natural convection and thermal radiation significantly. Likewise, the intensity of solar radiation, which represents the thermal energy falling on the solar panel, is low during sunrise and sunset hours. As a result, the solar panel has the lowest temperature of its cells at these times. The results show that due to more considerable heat transfer from the edges of the PV solar panel, the cells in the center of the solar panel are the ones with the highest temperature among the panel’s cells. Since the whole PV solar module is electrically connected in series, its performance is limited by the lowest-performing cell. As a result, the entire panel’s electrical efficiency is reduced to that of the central cells.
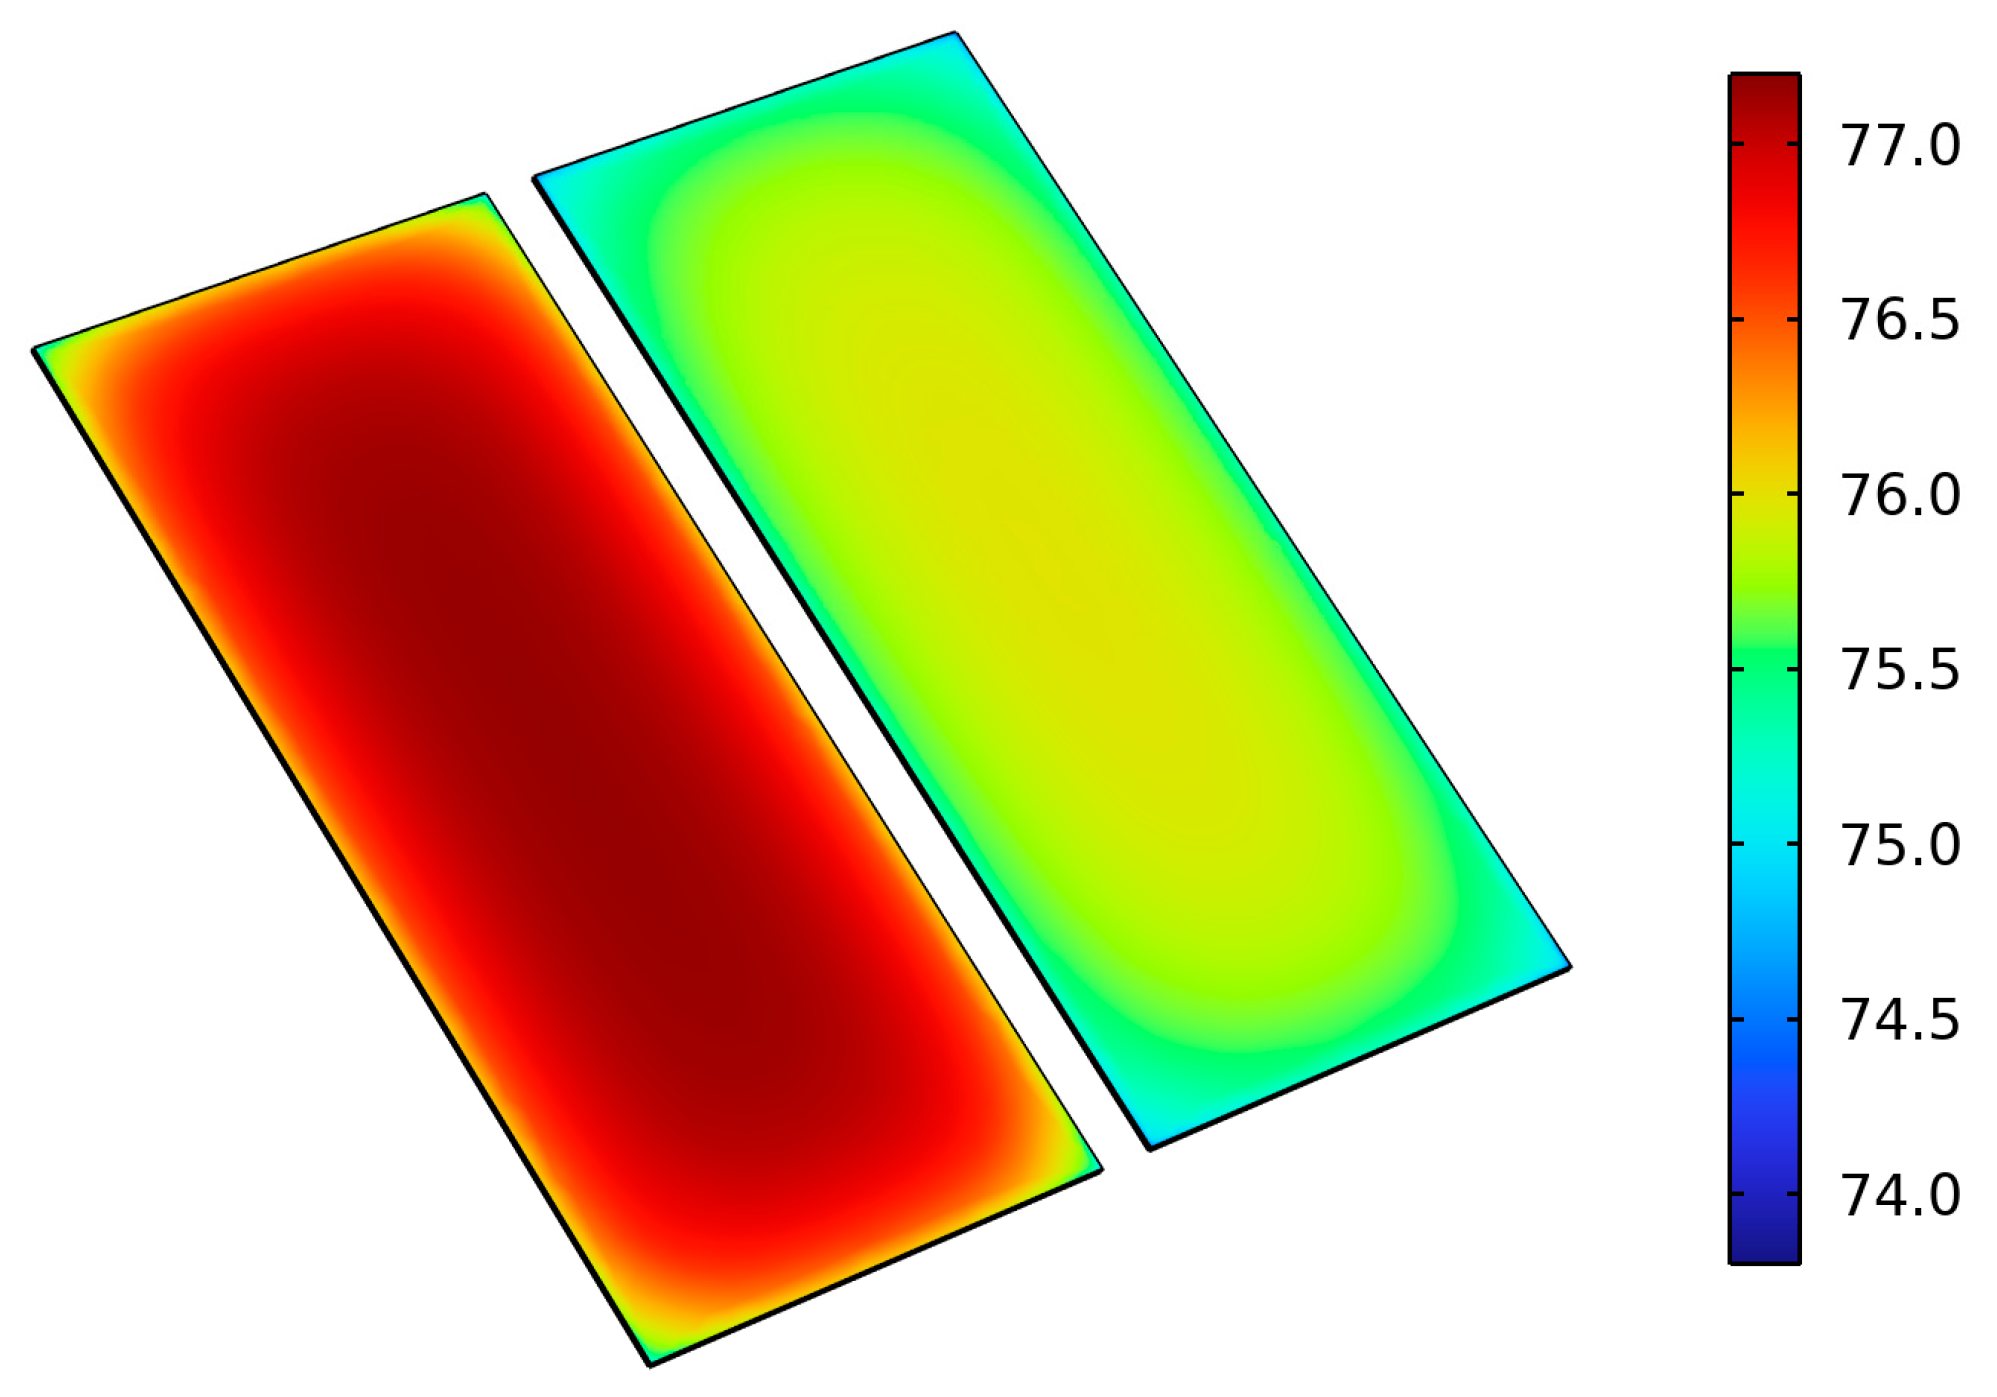
Figure 8 shows a comparison of the temperature distribution of solar panel cells for the base case and when using plasmonic Ag thin-film at the highest cells’ panel temperature reached during daylight. The results illustrate cells’ temperature was reduced by about 1.2 °C by plasmonic Ag thin-film technology. This is due to the high thermal conductivity of silver, which increases the transfer of heat from the solar cells in the solar panel to the surrounding atmosphere. To fully illustrate the results of the impact of this technology on the performance of the solar panel during daylight hours,
Figure 9 shows the PV cell layer average temperature for the base case and when using plasmonic Ag thin-film. The results of the figure show that the average solar cell temperature drops during daylight when using this technology, which improves the output power in addition to the efficiency of the solar panel. These results promise an improvement in the life of solar cells using plasmonic Ag thin-film technology due to the decrease in thermal stresses. The results clearly show the improvement in the solar panel at the highest temperature, which serves the PV solar panels in the current climate change.
Figure 10 represents the result of the effect of both the increase in the ambient temperature and the intensity of solar radiation. The figure shows that the improvement in the power enhancement of the solar cell is from 8:00 am to 2:00 pm, where there is a continuous increase in the value of solar irradiation and a decrease in the ambient temperature. On the other hand, the thermal improvement after 2:00 pm is minimal due to the increase in the ambient temperature and, consequently, the increase in the cell temperature, the increase in thermal losses, and the continuous decrease in the intensity of solar irradiation.
Figure 10 also shows the percentage of power enhancement during daylight hours when using plasmonic Ag thin-film technology. It can be noticed that about 0.48% of the proposed PV solar panel’s power is enhanced.
5. Optical and Electrical Power Results
This study presents a method that helps with thermal control in addition to efficiency improvement. Heat-induced efficiency losses are lessened by the small temperature drop (1.2 °C) due to the plasmonic thin-film integration. This factor is especially important for solar farms that are situated in hot climates. The thermal, optical, and electrical advantages set this study apart from other research that only looked at one or two of these aspects, in addition to the heat mitigation that is considered as a major problem in plasmonic nanoparticles solar cell in previous work.
The absorbed optical power by the cell, the output electrical power, and the solar cell’s efficiency are the main factors that must be taken into account when calculating the performance of a plasmonic thin-film solar cell. A detailed method for calculating the enhancement of absorbed optical power and output electrical power in watts, together with the required equations, is provided below step-by-step.
Watts per square meter (W/m
2) is the standard unit of measurement for the incident power (
Pin) (irradiance) on the solar cell. For instance, in full sunlight, the peak solar irradiation is 753.5 W/m
2 at 10:30 AM on 2 August 2023 [
38]. The optical characteristics of the plasmonic material, such as the amount of incident light absorbed by the thin-film and area of the solar cell, determine the absorbed power (
Pabs) as follows
where the area of the solar cell is extracted from
Table 3 [
42].
According to the enhancement in
Figure 10, the absorbed optical power with plasmonic thin-film Ag is increased by about 0.48%. Hence, the absorbed power with Ag
Pabs(with Ag) becomes
The plasmonic thin-film solar cell’s efficiency (
η), or the percentage of absorbed electricity that is transformed into electrical power, is then required. The material’s internal losses, the plasmonic structure’s quality, and the junction’s properties are some of the variables that affect this efficiency [
29].
It should be noted that ohmic losses in metals (Silver and Gold) are the main cause of Surface Plasmon Polaritons’ (SPPs’) attenuation in plasmonic thin-film solar cells, which has a substantial effect on the possible efficiency gains these structures may offer [
43]. SPPs are excited at the metal-dielectric interface in plasmonic solar cells, which improves the active layer’s absorption of light. SPPs are significantly attenuated by the intrinsic resistive (ohmic) losses seen in metals like gold and silver. Because of this attenuation, light trapping is less effective, which lowers the solar cell’s overall efficiency improvement.
To estimate in the proposed work how much power is lost and efficiency enhancement degraded due to the attenuation impacts, the attenuation of SPPs can be modeled as shown in Equation (22):
where
Enhancement(Actual) = 0.48%,
Ideal(Enhancement) = 2% (no attenuation losses α
SPP = 0), and
αSPP is an attenuation factor that reflects the fraction of SPP optical power lost owing to absorption and scattering.
The electrical output power (
Pout) is calculated using (23) [
29].
According to the enhancement in
Figure 10, the output electrical power with plasmonic thin-film Ag is increased by about 0.48% as compared to that without thin-film Ag. Thus, Equation (23) yields
The efficiency of the solar panel is extracted from
Table 3 [
42].
Table 4 shows the enhancement of absorbed optical power and output electrical power for the proposed plasmonic thin-film Ag solar cell depends on
Table 3 and Equations (20) and (22)–(24).
From
Table 4, it can be seen that the proposed PV panel offers enhancement in absorbed optical power and output electrical power as compared to the PV panel without plasmonic thin-film Ag technology. While plasmonic-based upgrades usually offer incremental benefits because of their wavelength-selective nature, absolute efficiency increases in solar cells are frequently targeted in the range of 1% to 2% or higher. The efficiency increases from plasmonic thin films typically range from 0.2% to 1.0%, which is consistent with the literature currently in publication. This confirms that the improvement is within the range of performance gains anticipated for this kind of technology [
44]. Plasmonic nanostructure integration is a stand-alone remedy, in addition to the other supplementary methods. Even a slight increase in efficiency can help optimize the system as a whole when paired with anti-reflective coatings, surface texturing, or sophisticated cooling techniques [
44].
The observed 0.48% power enhancement in the SPP-integrated photovoltaic (PV) module compared to the reference module is indeed lower than the efficiency improvements typically achieved by passive (2–5%) and active cooling techniques (5–15%). However, the use of Surface Plasmon Polaritons (SPPs) offers advantages beyond thermal management, justifying its implementation in addition to using passive and cooling techniques separately [
44]. By integrating incident light into plasmonic modes, SPPs enhance photon harvesting, solar panel thermal temperature, optical efficiency, and total output electrical efficiency. While traditional cooling techniques only address thermal degradation, SPPs instantly increase light absorption, a major limiting point in PV performance. By its nature, the SPP-based enhancement is a thermal cooling technique in addition to an optical enhancement method [
44]. When combined with passive or active cooling methods, it can yield a number of benefits that could raise overall efficiency gains. Additional mechanical components (such as heat sinks and fluid circulation) are commonly required for both passive and active cooling methods, which can complicate and make maintenance more challenging. After installation, the SPP layer is a durable, robust solution that requires no ongoing upkeep or energy. Thus, the SPP-based method contributes to optical enhancement and views a thermal cooling strategy as intrinsic, providing a distinct and complementary benefit, even though passive and active cooling strategies offer better thermal efficiency benefits. In the long run, integrating cooling techniques with SPP technology may result in a more efficient and sustainable PV system.
6. Comparison and Strengths
The proposed solar cell panel design has the following features when comparing with the previous work: utilization of thin-film Ag, studying of thermal, optical, and electrical aspects, experimental solar irradiance values, less complexity and cost reduction based on the geometry and shape of the proposed solar cell, manufacturing scalability, and fabrication complexity. All the previous literature used complex geometry and shape with gold material rather than silver, which limits the manufacturing process and increases fabrication complexity. Thus, higher cost is required for the previous methods as compared to the proposed design that uses thin-film geometry and shape as well as silver material, which simplifies manufacturing and fabrication, resulting in less cost economically.
The comparison that shows the strength points of this work with previous modern works is shown in
Table 5.
This study provides a new demonstration on the effect of plasmonic thin-film technology on solar cells. As part of future research, study of material composition, heat dissipation modeling, multi-wavelength performance analysis, light trapping, charge carrier dynamics, and other conditions are regarded among the major important directions in plasmonic solar cells to better explain the full impact of plasmonic effects on solar cell power and efficiency.


