Article

Study on the Dissolution Mechanism of Aviation Hydraulic Oil–Nitrogen Gas Based on Molecular Dynamics

1
School of Mechanical Engineering, Shaanxi University of Technology, Hanzhong 723001, China
2
Shaanxi Provincial “Four Main Bodies and One Union” University-Enterprise Joint Research Center for Aircraft Landing Gear Advanced Manufacturing and Aviation Component Performance Test, Shaanxi University of Technology, Hanzhong 723001, China
3
Engineering Research Center of Manufacturing and Testing for Landing Gear and Aircraft Structural Parts, Universities of Shaanxi Province, Hanzhong 723001, China
4
Shaanxi Key Laboratory of Advanced Manufacturing and Health Management for Aviation Components, Universities of Shaanxi Province, Hanzhong 723001, China
5
School of Materials Science and Engineering, Shaanxi University of Technology, Hanzhong 723001, China
6
School of Chemical and Environmental Sciences, Shaanxi University of Technology, Hanzhong 723001, China
*
Author to whom correspondence should be addressed.
Processes 2025, 13(5), 1564; https://doi.org/10.3390/pr13051564
Submission received: 25 March 2025 / Revised: 9 May 2025 / Accepted: 13 May 2025 / Published: 18 May 2025
(This article belongs to the Section Chemical Processes and Systems)

Abstract

:
The shock absorbers in the landing gear absorb and dissipate a significant amount of kinetic energy generated from impacts during the landing and taxiing phases to ensure the stability and safety of the aircraft. The nitrogen–oil binary system is a commonly used energy absorption medium in these shock absorbers. Nevertheless, the interplay of interfacial mass transfer dynamics, microscopic dissolution behavior, and pressure drop in the aviation hydraulic oil–N2 system under landing conditions necessitates further elucidation. Thus, we investigated the interfacial mass transfer characteristics of the oil–gas mixing process using molecular dynamics (MD) for analyzing the dissolution mechanism of N2 in the aviation hydraulic oil system. The results show that as system pressure and temperature increase, the degree of oil–gas mixing intensifies. Under conditions of 373 K, 35 MPa and 433 K, 20 MPa, the diffusion coefficient, interfacial thickness, and system energy reach their maximum values. An increase in system pressure facilitates the occurrence of oil–gas mixing until the interface disappears at the minimum miscibility pressure (MMP), with the obtained MMP value being 107 MPa. Finally, the solubility of N2 molecules in aviation hydraulic oil under different conditions was statistically analyzed, which is identified as the root cause of the pressure drop in the shock absorber’s gas chamber. This study innovatively applies molecular dynamics simulations to unveil, for the first time, the dissolution mechanism of N2 in aviation hydraulic oil at the molecular scale, overcoming experimental limitations in observing extreme pressure–temperature conditions. This research elucidates the behavior of aviation hydraulic oil and N2 under different thermodynamic conditions, making it easier to capture the patterns of phenomena that are difficult to observe in extreme environments. The research findings not only enhance the microscopic understanding of oil–gas mixing within the shock absorber but also provide valuable guidance for optimizing energy dissipation efficiency, improving damping characteristics, and enhancing safety in aircraft landing gear systems.

1. Introduction

The landing gear of modern aircraft typically utilizes oleo-pneumatic shock absorbers [1,2]. The cushioning characteristics of these shock absorbers are the most critical factor in determining the energy dissipation of the landing gear. This means that during taxiing, takeoff, and landing, both oil (aviation hydraulic oil) and gas (N2) are used simultaneously to absorb and dissipate impacts [3]. To prevent severe jolting and bouncing of the aircraft upon touchdown due to excessive landing speed, the shock absorbers in the landing gear are employed to absorb and dissipate the significant kinetic energy of the impacts experienced during the landing and taxiing phases [4,5].
The oleo-pneumatic shock absorber requires strict specifications for the volume and ratio of oil and gas filling. It is essential to provide the correct gas pressure and quantity of aviation hydraulic oil within the shock absorber to achieve optimal cushioning effects. In practical applications, an aircraft landing at high speeds can subject the shock absorber to severe compression [6]. Aviation hydraulic oil is compressed through the main oil orifice into the nitrogen chamber, where it undergoes intense heat exchange with the nitrogen. The instantaneous increase in pressure within the nitrogen chamber leads to thorough contact between the oil and gas under high-temperature and high-pressure conditions. This results in partial dissolution of N2 into the aviation hydraulic oil, causing the actual pressure in the nitrogen chamber to be lower than the ideal pressure. The reduction in pressure inside the nitrogen chamber, manifested by the non-compliant protruding length of the shock strut, will reduce the cushioning performance of the landing gear to a certain extent. In other types of oleo–gas hybrid cushioning devices, the phenomenon of reduced cushioning performance due to gas dissolution is not uncommon [7,8].
Figure 1 illustrates a comparison of the internal pressure changes in the shock absorber due to N2 dissolution under different inspection conditions of the aircraft landing gear. When the landing gear is on a jack, the supporting action of the jack ensures that the extension dimensions of the shock struts are identical (H1 = H2). However, due to N2 dissolution after landing, it is found that P2 < P1. When the landing gear is landed, the dissolution of N2 after landing causes a decrease in the nitrogen chamber pressure, and this effect can be reflected by the protruding length H of the shock strut. Upon inspection, it is observed that P4 = P3, but H4 < H3, indicating that a reduction in the internal nitrogen chamber pressure of the shock absorber results in a decrease in the protruding length H of the shock strut.
Among the factors affecting the decrease in internal pressure of the landing gear shock absorber, the most significant is the amount of N2 dissolved in aviation hydraulic oil. Aviation hydraulic oil can dissolve a certain quantity of N2. When the external pressure decreases to a certain level, the N2 in the aviation hydraulic oil is released in the form of bubbles, forming a large number of suspended bubbles within the oil, thereby affecting its fluidity. The cushioning performance of the landing gear depends on the physical state changes of N2 and aviation hydraulic oil within the shock absorber. Thus, investigating the air–liquid interface characteristics of N2 in aviation hydraulic oil is essential for elucidating the mechanisms of N2 dissolution and diffusion within the oil.
MD is a computational method based on classical mechanics, extensively utilized for simulating and investigating physical systems at the molecular and atomic scales. By simulating the motion of atoms and molecules under specific conditions, MD provides profound insights into the dynamic evolution of microscopic systems. The central concept involves solving classical mechanical equations to describe the motion of molecules or atoms under a given force field. Typically, MD simulations compute particle positions and velocities by integrating Newton’s equations [9,10]. A force field is a mathematical model that describes the interactions between particles, encompassing van der Waals forces, Coulombic forces, and elastic forces, among others. Through these force fields, MD can simulate intermolecular interactions and predict their motion. MD simulations have a broad range of applications, spanning multiple scientific and engineering disciplines, including materials science, biomedical research, chemical engineering, and nanotechnology [11,12,13,14]. However, the application of MD simulations is constrained by factors such as time scale, system size, and the accuracy of force fields. Future research may enhance simulation precision and efficiency by integrating other multiscale methods, such as quantum chemical calculations and finite element analysis.
In recent years, MD simulations have become a primary method for investigating the microscopic states of materials [15,16,17]. Molecular simulation techniques can effectively simulate and predict intermolecular interactions, thereby providing a deeper understanding of the diffusion behavior and solubility characteristics of N2 in oils. Zhang et al. [18] studied the solubility of CO2 in octane and its effect on octane swelling at temperatures of 323 K and 353 K and pressures ranging from 2 to 10 MPa using Monte Carlo simulations. They found that the dissolution of CO2 in octane is the main cause of octane expansion. Li et al. [19] analyzed the interfacial interactions between Bakken crude oil and injected gases, investigating the dissolution efficiency of gases in crude oil through parameters such as gas solubility, volume expansion coefficient, crude oil diffusion coefficient, and minimum miscibility pressure. Li et al. [20] used MD methods to study the solubility parameters and dissolution mechanisms of CO2 in resin systems, resin–asphaltene systems, and asphaltene systems under different temperature and pressure conditions. Their research revealed the dependence of CO2 dissolution on interaction energy, providing a scientific basis for the swelling of dissolved crude oil. Huang et al. [21] employed MD methods to study changes in the adsorption layer thickness, component adsorption ratio, interaction energy, and self-diffusion coefficients of fluids in organic and inorganic pores during three stages: CO2 injection, early production, and pressure reduction production. Zendehboudi et al. [11] systematically discussed the applications of mathematical modeling and simulation methods in chemical processes, petroleum and natural gas processes, and applied energy systems. They argued that complex processes require advanced mathematical tools for process development, identification, simulation and modeling, optimization, control, classification, clustering, prediction, and monitoring. Feng et al. [12] investigated the interactions between production gases with different CH4 proportions (0%, 25%, 50%, and 100%) and hydrocarbon oils and matrix phases using MD simulations. They found that a production gas containing 25% CH4 achieved almost the same displacement effect as pure carbon dioxide (CO2) injection. Seyyedattar et al. [9] used MD simulations to study CO2–oil swelling experiments and calculate the crude oil expansion factor. The results showed that the MD simulation model could successfully be used to study CO2–oil swelling behavior and accurately predict the expansion factor, with an average percentage error of only 6%. Wang et al. [22] used MD methods to study the miscibility process of different gases (CO2, N2, CH4, and C3H8) with crude oil in nanopores, analyzing the effects of gas type, crude oil polarity, and chain length on the miscibility process. They found that the involvement of CO2 made hydrocarbon gas phases and N2 phases more soluble. Yan et al. [23] explored the effects of driving forces and resistances in the oil–gas miscibility process on oil–gas miscibility, pointing out that the solubility of oil components in the injected gas should be evaluated based on the degree of oil–gas miscibility. Wang et al. [24] studied the diffusion and mass transfer processes of CO2 and crude oil during CO2 flooding using MD methods. The results indicated that CO2 is more likely to diffuse from the water phase to the oil phase, and a high gas–oil ratio can more effectively promote the diffusion and mass transfer rate of CO2 in the oil phase.
At present, domestic and international scholars’ research on the cushioning performance of landing gear mainly focuses on the drop-shock simulation experiments of landing gear and the optimization models of shock absorbers [25,26,27,28,29], with little consideration given to the impact of N2 dissolution on the cushioning performance of landing gear. Research on the dissolution of gas in oil mainly concentrates on establishing macroscopic solubility prediction models [30,31,32,33], with most studies being experimental in nature [34,35]. Due to the limitations of experimental conditions and the complexity of the oil phase system, directly observing the interaction mechanism between N2 and aviation hydraulic oil is quite challenging. MD simulations are computational methods utilized to study physical systems at the molecular and atomic scales and have been widely applied in areas such as liquid dynamics since the 1950s [36,37,38]. The classical molecular dynamics (MD) method is frequently employed to simulate the dissolution and miscibility behavior between CO2 and crude oil. Typically, a sandwich model is utilized in the simulation of the gas–oil interface system, with gas phases on both sides and oil in the middle. However, configurations with oil on both sides and gas in the middle are also possible [39,40]. This modeling approach is predicated on the fact that CO2 can dissolve in or even become miscible with crude oil at relatively low pressures. In contrast, N2 requires significantly higher pressures to achieve miscibility. However, during aircraft landing, the shock absorber experiences exceptionally high pressures, necessitating the consideration of N2–oil phase interactions. Molecular simulations offer comprehensive control over the components and conditions within the model, providing an atomistic-level simulation process that is both detailed and intuitive. This capability significantly aids in interpreting experimental results at the microscopic level.
Thus, this paper innovatively applies molecular dynamics simulation methods to the study of the microscopic mechanisms of oil–gas dissolution behavior within landing gear shock absorbers. By simulating the miscibility process of N2 in aviation hydraulic oil systems under different conditions, the paper systematically analyzes parameters such as oil–gas density distribution, interface thickness, interfacial tension, diffusion coefficient, and N2 solubility. It delves into the dissolution mechanism of N2 in aviation hydraulic oil at the molecular level, providing new insights into the mass transfer processes at the oil–gas interface. This study not only elaborates and analyzes the microscopic mechanisms of gas–oil dissolution that may restrict the buffering performance within landing gear shock absorbers but also provides a theoretical basis for the improvement of aviation hydraulic fluid in shock absorbers (such as an inhibitory solvent for gases including surfactants and nanoparticles) and the optimization of the mechanical design of shock absorbers.

2. Simulation Systems and Models

2.1. Simulation System

The No. 15 aviation hydraulic fluid is produced by the oil refinery of the Yumen Oilfield Branch of China National Petroleum Corporation. The final model, based on N2 and the components of aviation hydraulic oil listed in Table 1, was determined to be the commonly used “sandwich” configuration as referenced in the literature [41,42]. The dimensions of the model are shown in Figure 2. This configuration represents the gas–liquid interface model utilized in the study of interfacial interactions between oil and gas phases, ensuring the symmetry of the system [36,43]. Referring to previous work [44,45], the lengths in the X- and Y-directions are often equal, and the size is set to be greater than 40 Å. The size in the Z-direction is guaranteed to be large enough and six times or larger than in the Z-direction. This has been verified to avoid errors caused by size effects. Thus, our simulation box size is set to 50 × 50 × 300 Å3. MD simulations were conducted under various temperature and pressure conditions, reflecting the internal conditions of the shock absorber. The simulation box was filled with an equal number of N2 molecules at both ends according to the preset pressure, with aviation hydraulic oil molecules positioned at the center of the model. The quantity of N2 molecules was calculated based on the density at the corresponding temperature and pressure, as obtained from the experimental database of the National Institute of Standards and Technology (NIST) [46]. The density of aviation hydraulic oil was determined after a relaxation process under the NPT ensemble. The number of aviation hydraulic oil molecules was established based on the molar fractions of the oil components and the density of the oil.

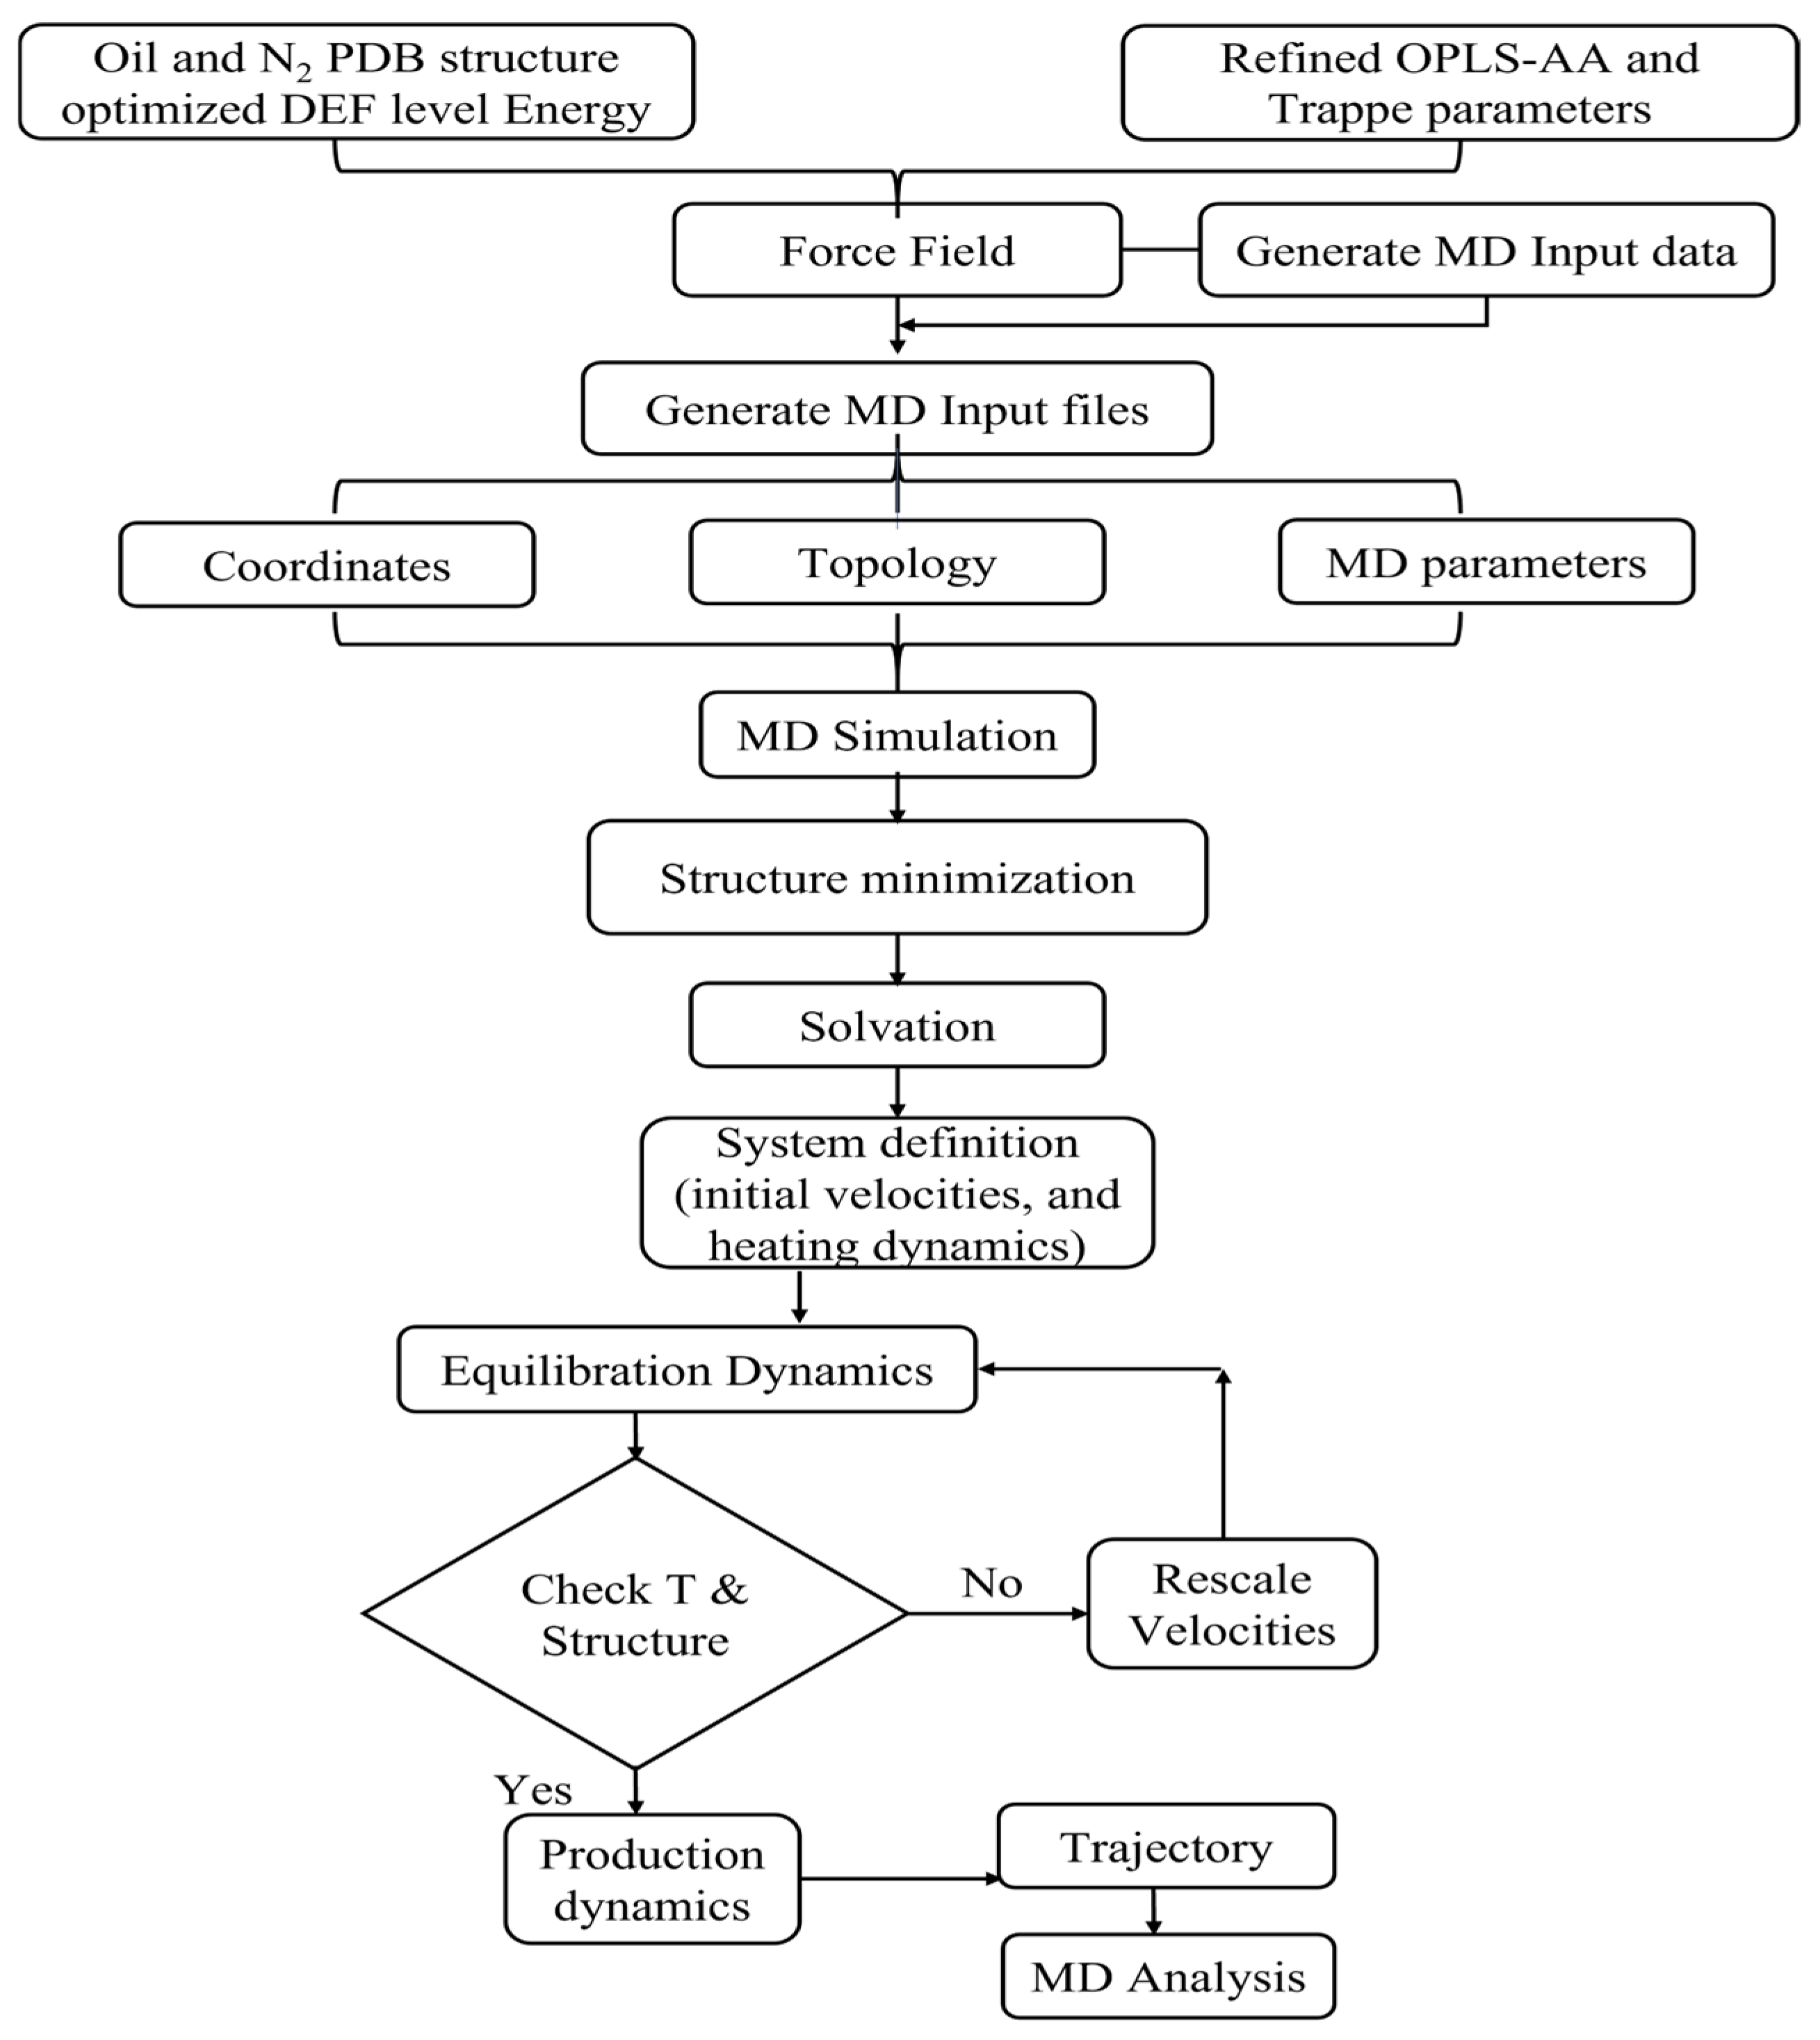
2.2. Simulation Details

The simulation technical roadmap is presented in Figure 3, and the design of the molecular simulation experiments is presented in Table S2. The MD simulations were conducted using the LAMMPS software (64-bit 2 Aug2023-MPI, Sandia National Laboratories, Albuquerque, NM, USA) [47]. Periodic boundary conditions were applied in all directions. Taking the X-direction as an example, let the position of the i-th atom be x i , and the left and right boundaries of the simulated box in the x-direction are 0 and L x . The position of the i atom in the X-direction is detected at each time step as follows: if x i < 0, then the value of x i is replaced with x i + L x . If x i L x , then the value of x i is replaced with x i L x , as seen in Equation (1).
x i = x i + L x   i f   x i < 0 x i L x     i f   x i > L x
The system pressure was altered by adjusting the number of N2 molecules, thereby simulating the internal pressure of the landing gear shock absorber under various conditions. The TraPPE-UA force field [48] was utilized for N2 molecules, while the OPLS-AA force field [49] was applied to oil molecules, and specific force field information for the model components is provided in Table S1. The TraPPE-UA force field is specially designed for gas–liquid equilibrium of complex multicomponent systems. The united-atom version of the force field, TraPPE-UA, has parameters for linear, branched, cyclic, and aromatic hydrocarbons and can accurately reproduce phase diagrams and critical points. In united-atom (UA) representations, hydrogen atoms are not explicitly modeled and are combined with the carbon atom to which they are bound in a single pseudo-atom interaction site [50,51]. The OPLS-AA force field has successfully been applied to different systems to predict energy of mixing, micellization process, surface tension of organic liquids, etc. [52,53]. Bond angles were described using a harmonic potential, and dihedral angles were represented using the OPLS model. The PPPM method was employed to account for long-range electrostatic forces with a precision of 10−5. The 12-6 Lennard–Jones potential model, incorporating polar terms, effectively considers both van der Waals and Coulombic forces, as shown in Equation (2) [54,55]. The cutoff radius for the force calculation was set at 14 Å. The Lorentz–Berthelot mixing rules were used to calculate the Lennard–Jones potential parameters for cross-interactions between different atom types in the system, as illustrated in Equation (3) [56].
ϕ r i j = 4 ε σ r i j 12 σ r i j 6 + C q i q j χ r i j r i j < r cut 0 r i j r cut
σ ij = σ i i + σ j j 2 ε i j = ε i i ε j j
In Equations (2) and (3), ε , σ , q i , q j , C , x , and r c u t represent the energy parameter, the length parameter, the charges of atoms and atoms, the electrostatic constants, the dielectric constants, the van der Waals forces, and the truncation radius of the short-range electrostatic force, respectively.
Throughout the simulation process, a Nose–Hoover thermostat is used to preserve temperature and prevent changes in the density of the oil phase under varying conditions. Previous simulations of the binary interface system indicated that the size of the simulated system influences both the interface system state and the transformation of the bulk phase [57,58]. Therefore, to ensure that accurate results were obtained for the interface system and the mass transfer between the two phases, large-scale simulations were deemed necessary. Above all, the system was equilibrated in the NPT ensemble for 11 ns (NPT ensemble 8 ns and NVT ensemble 3 ns) at normal temperatures and pressures to verify the accuracy of the simulation. As a test, we also carried out an 11 ns (NPT ensemble 8 ns and NVT ensemble 3 ns) MD simulation and compared the results with those of an 8 ns (NPT ensemble 5 ns and NVT ensemble 3 ns) MD simulation. The simulations gave similar results, indicating that 8 ns was long enough to achieve a stable interface structure and to capture the mass transfer effect of the binary system. A time step of 1 fs was selected, with atomic coordinate information output every 1000 steps, resulting in a total simulation duration of 11 ns. First, the simulation system reached a stable state after running for 8 ns under the NPT ensemble, forming a stable interface system. Then, the simulation system was performed for 3 ns under the NVT ensemble to maintain constant system temperature and volume, as well as statistical extraction. The simulation temperatures were set at 313, 343, 373, 403, and 433 K when the pressure was 20 MPa. The simulation pressures were chosen as 15, 20, 25, 30, and 35 MPa when the temperature was 373 K. The selection of basic temperature (373 K) and pressure (20 MPa) was based on prior studies [59,60]. After the 8 ns relaxation is complete, we calculated the root-mean-square deviation (RMSD) [61] of the system to ensure that the system has converged (details are shown in Figure S1).

3. Results and Discussion

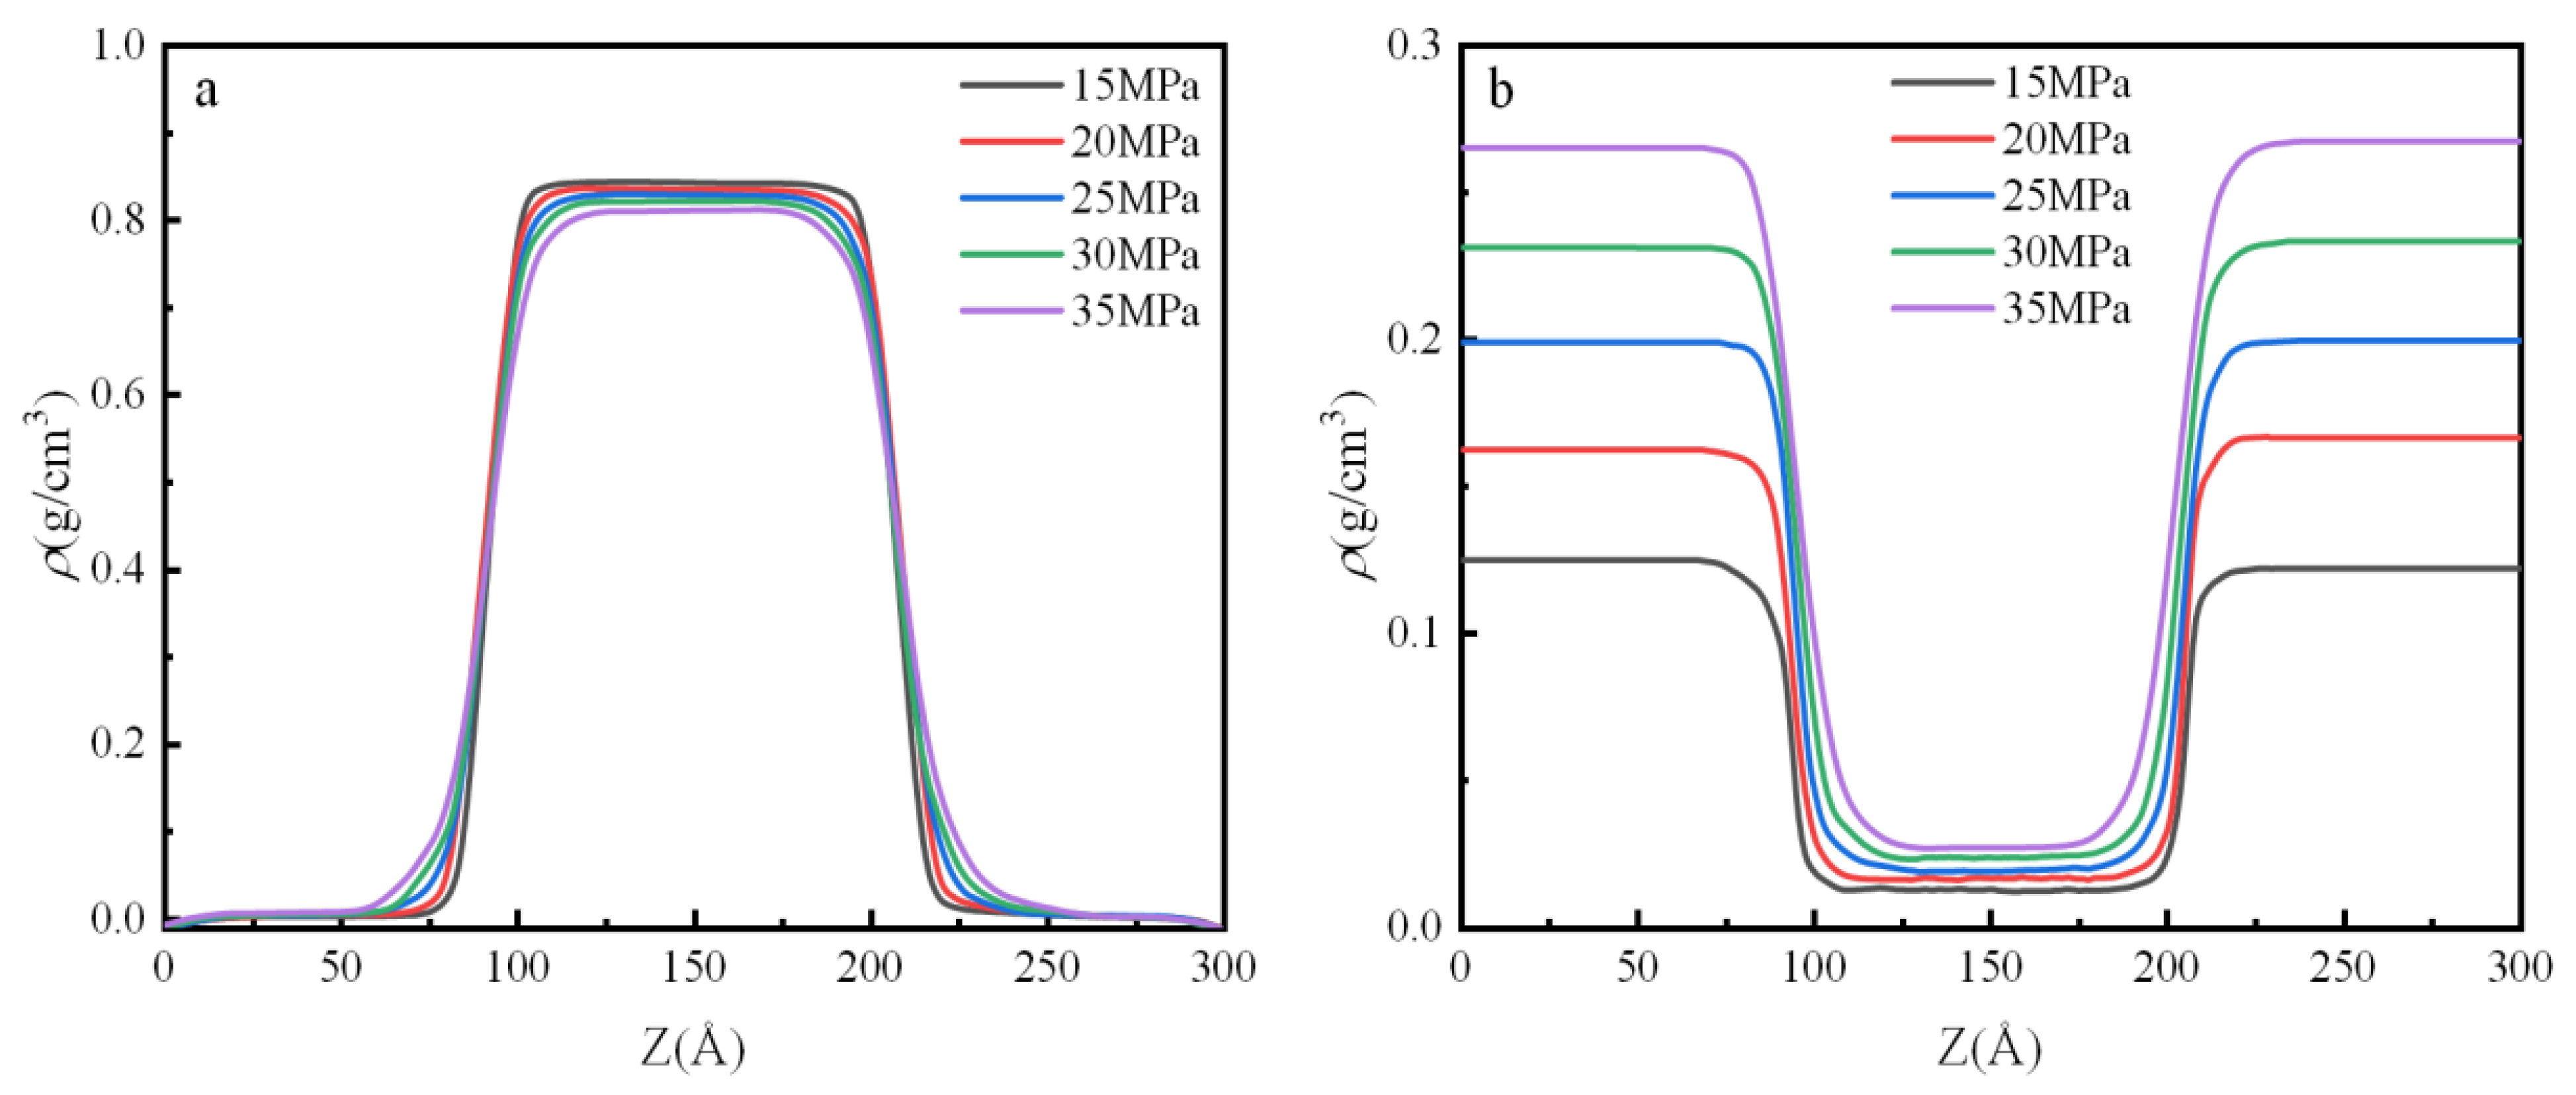
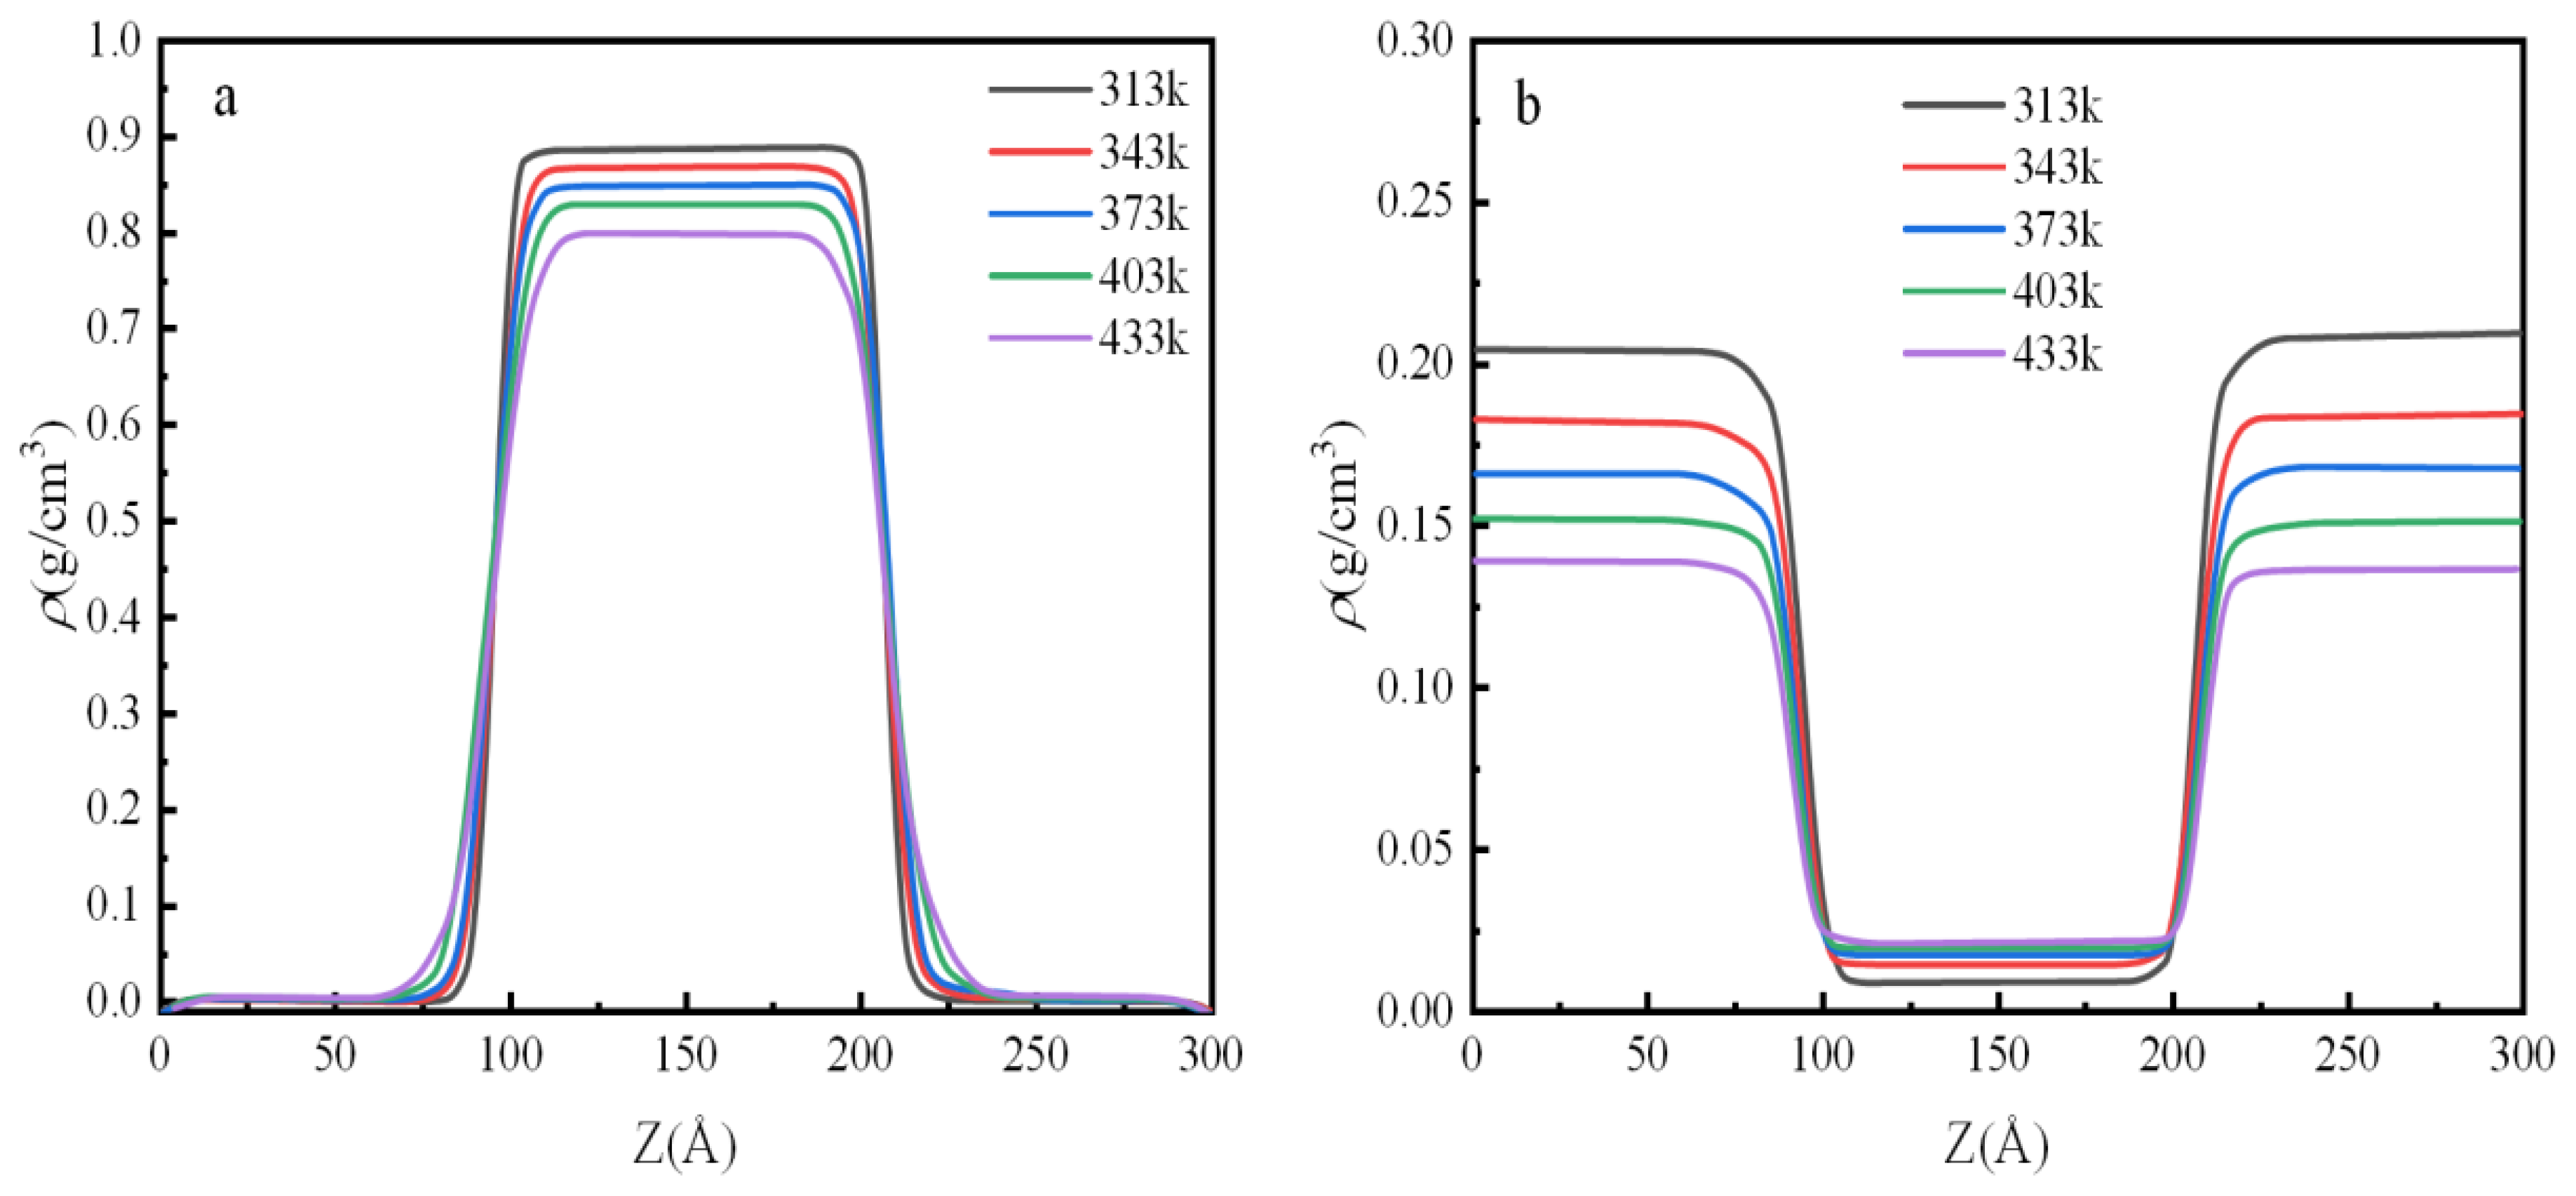
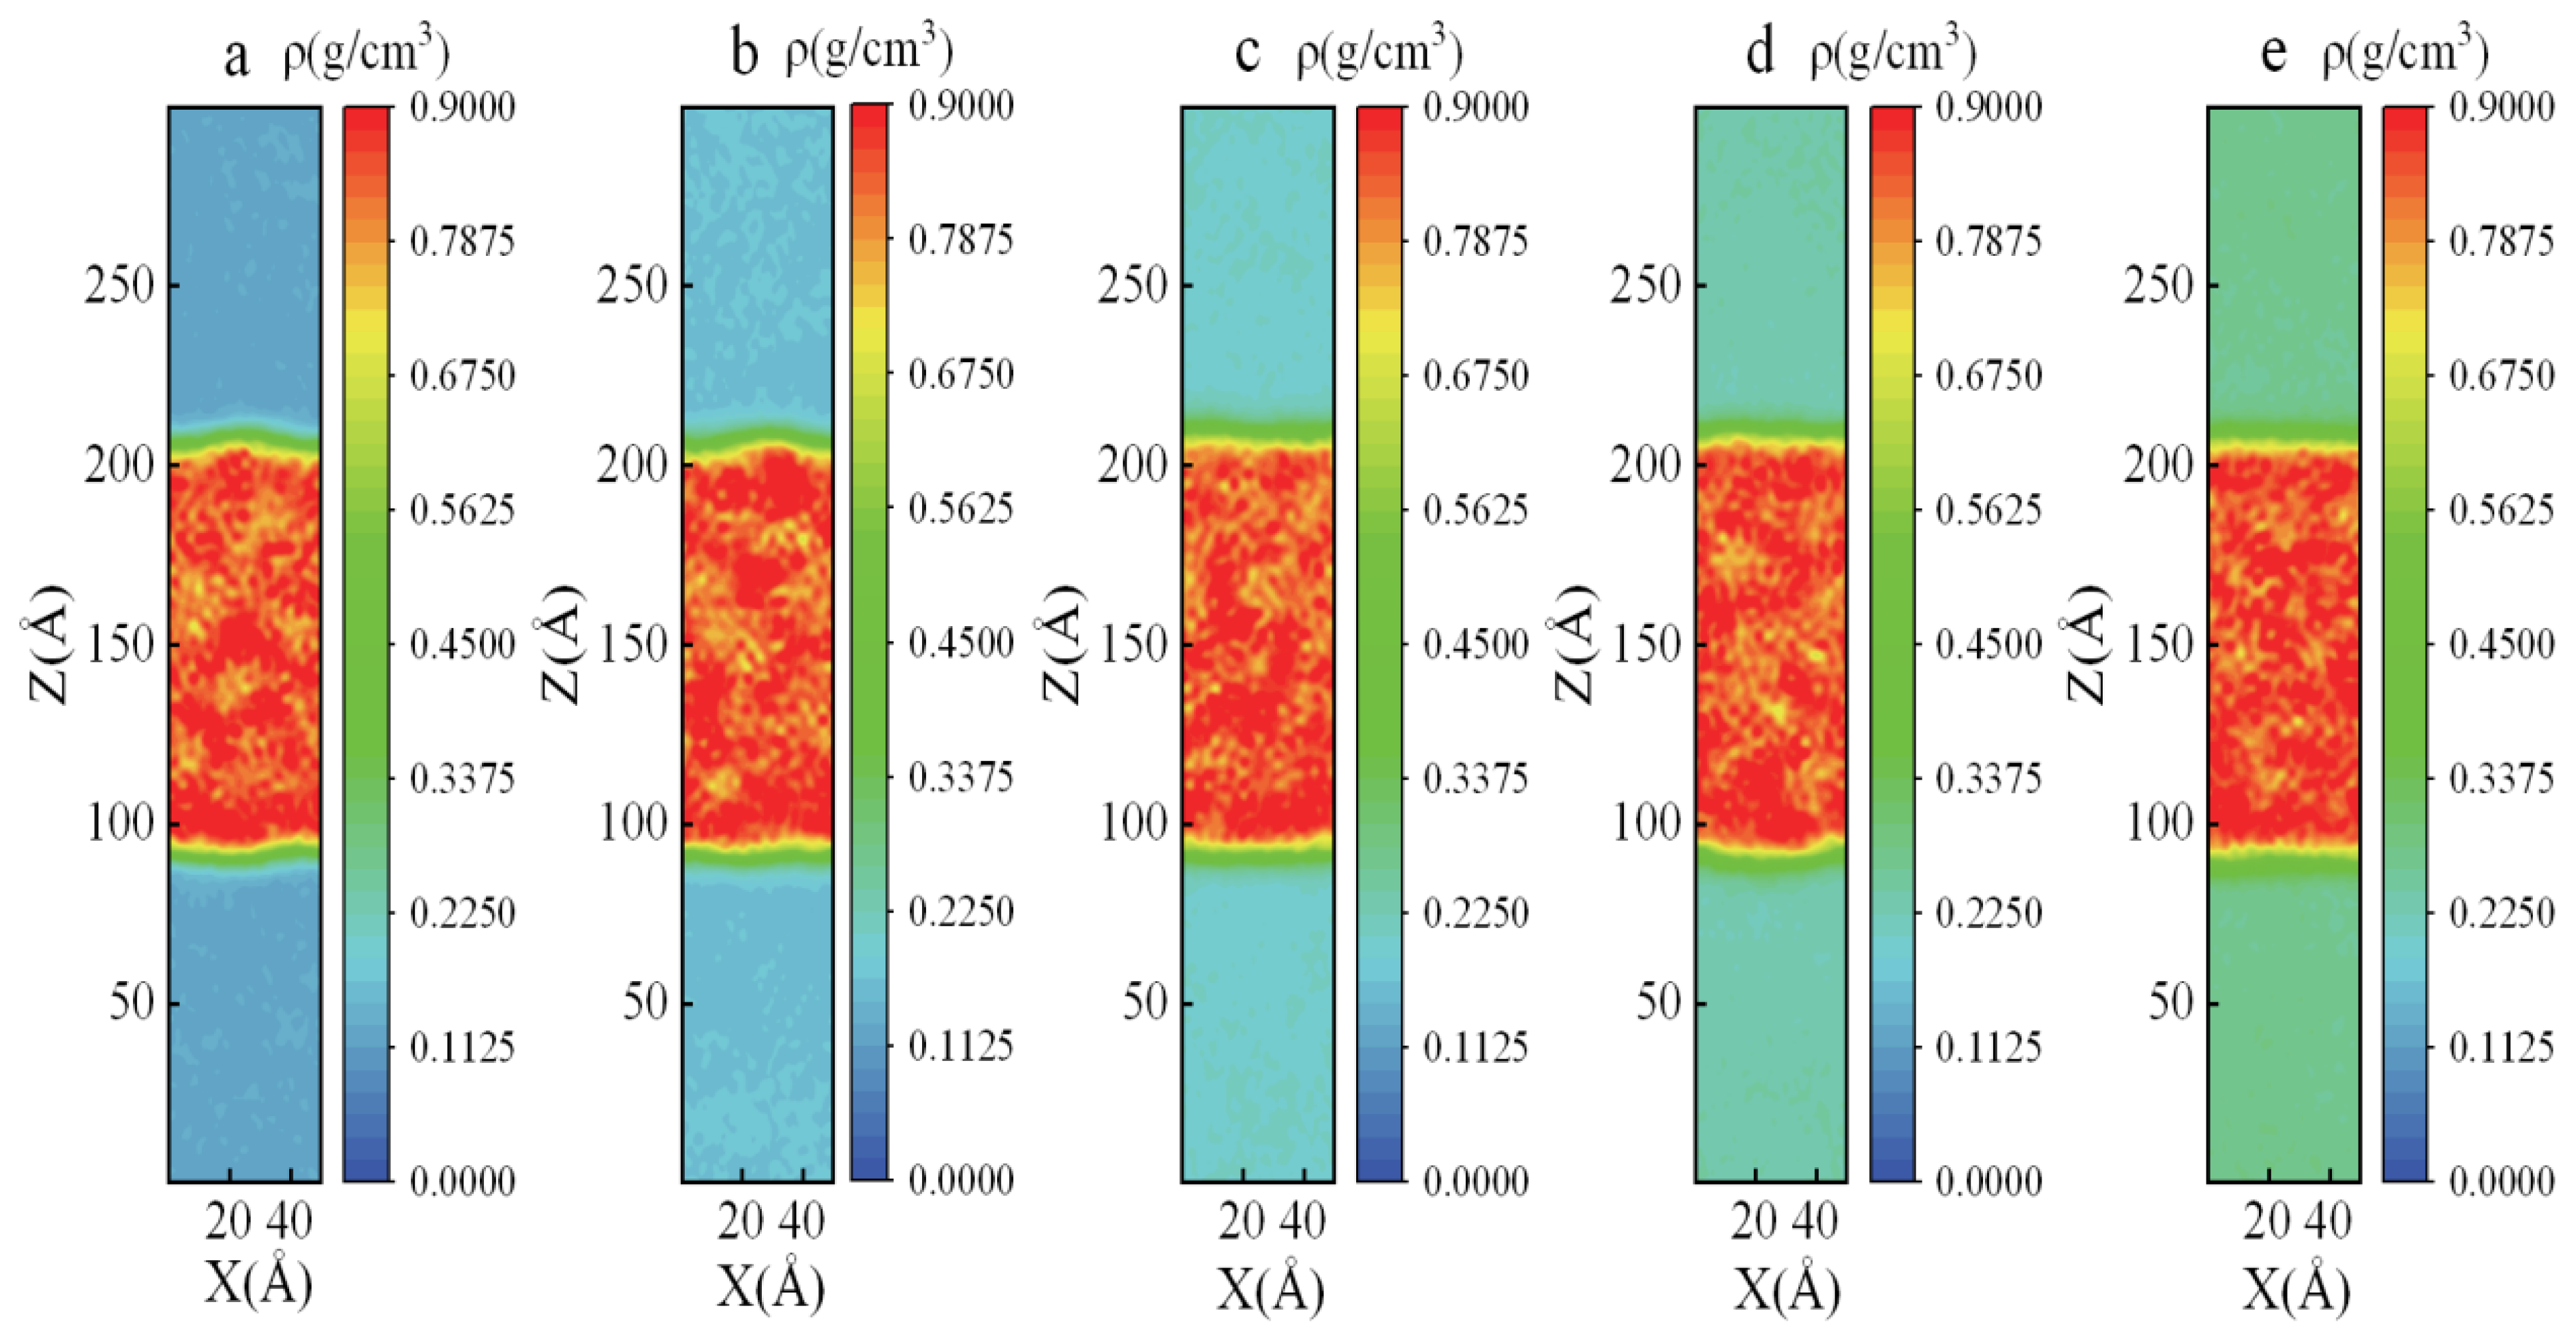
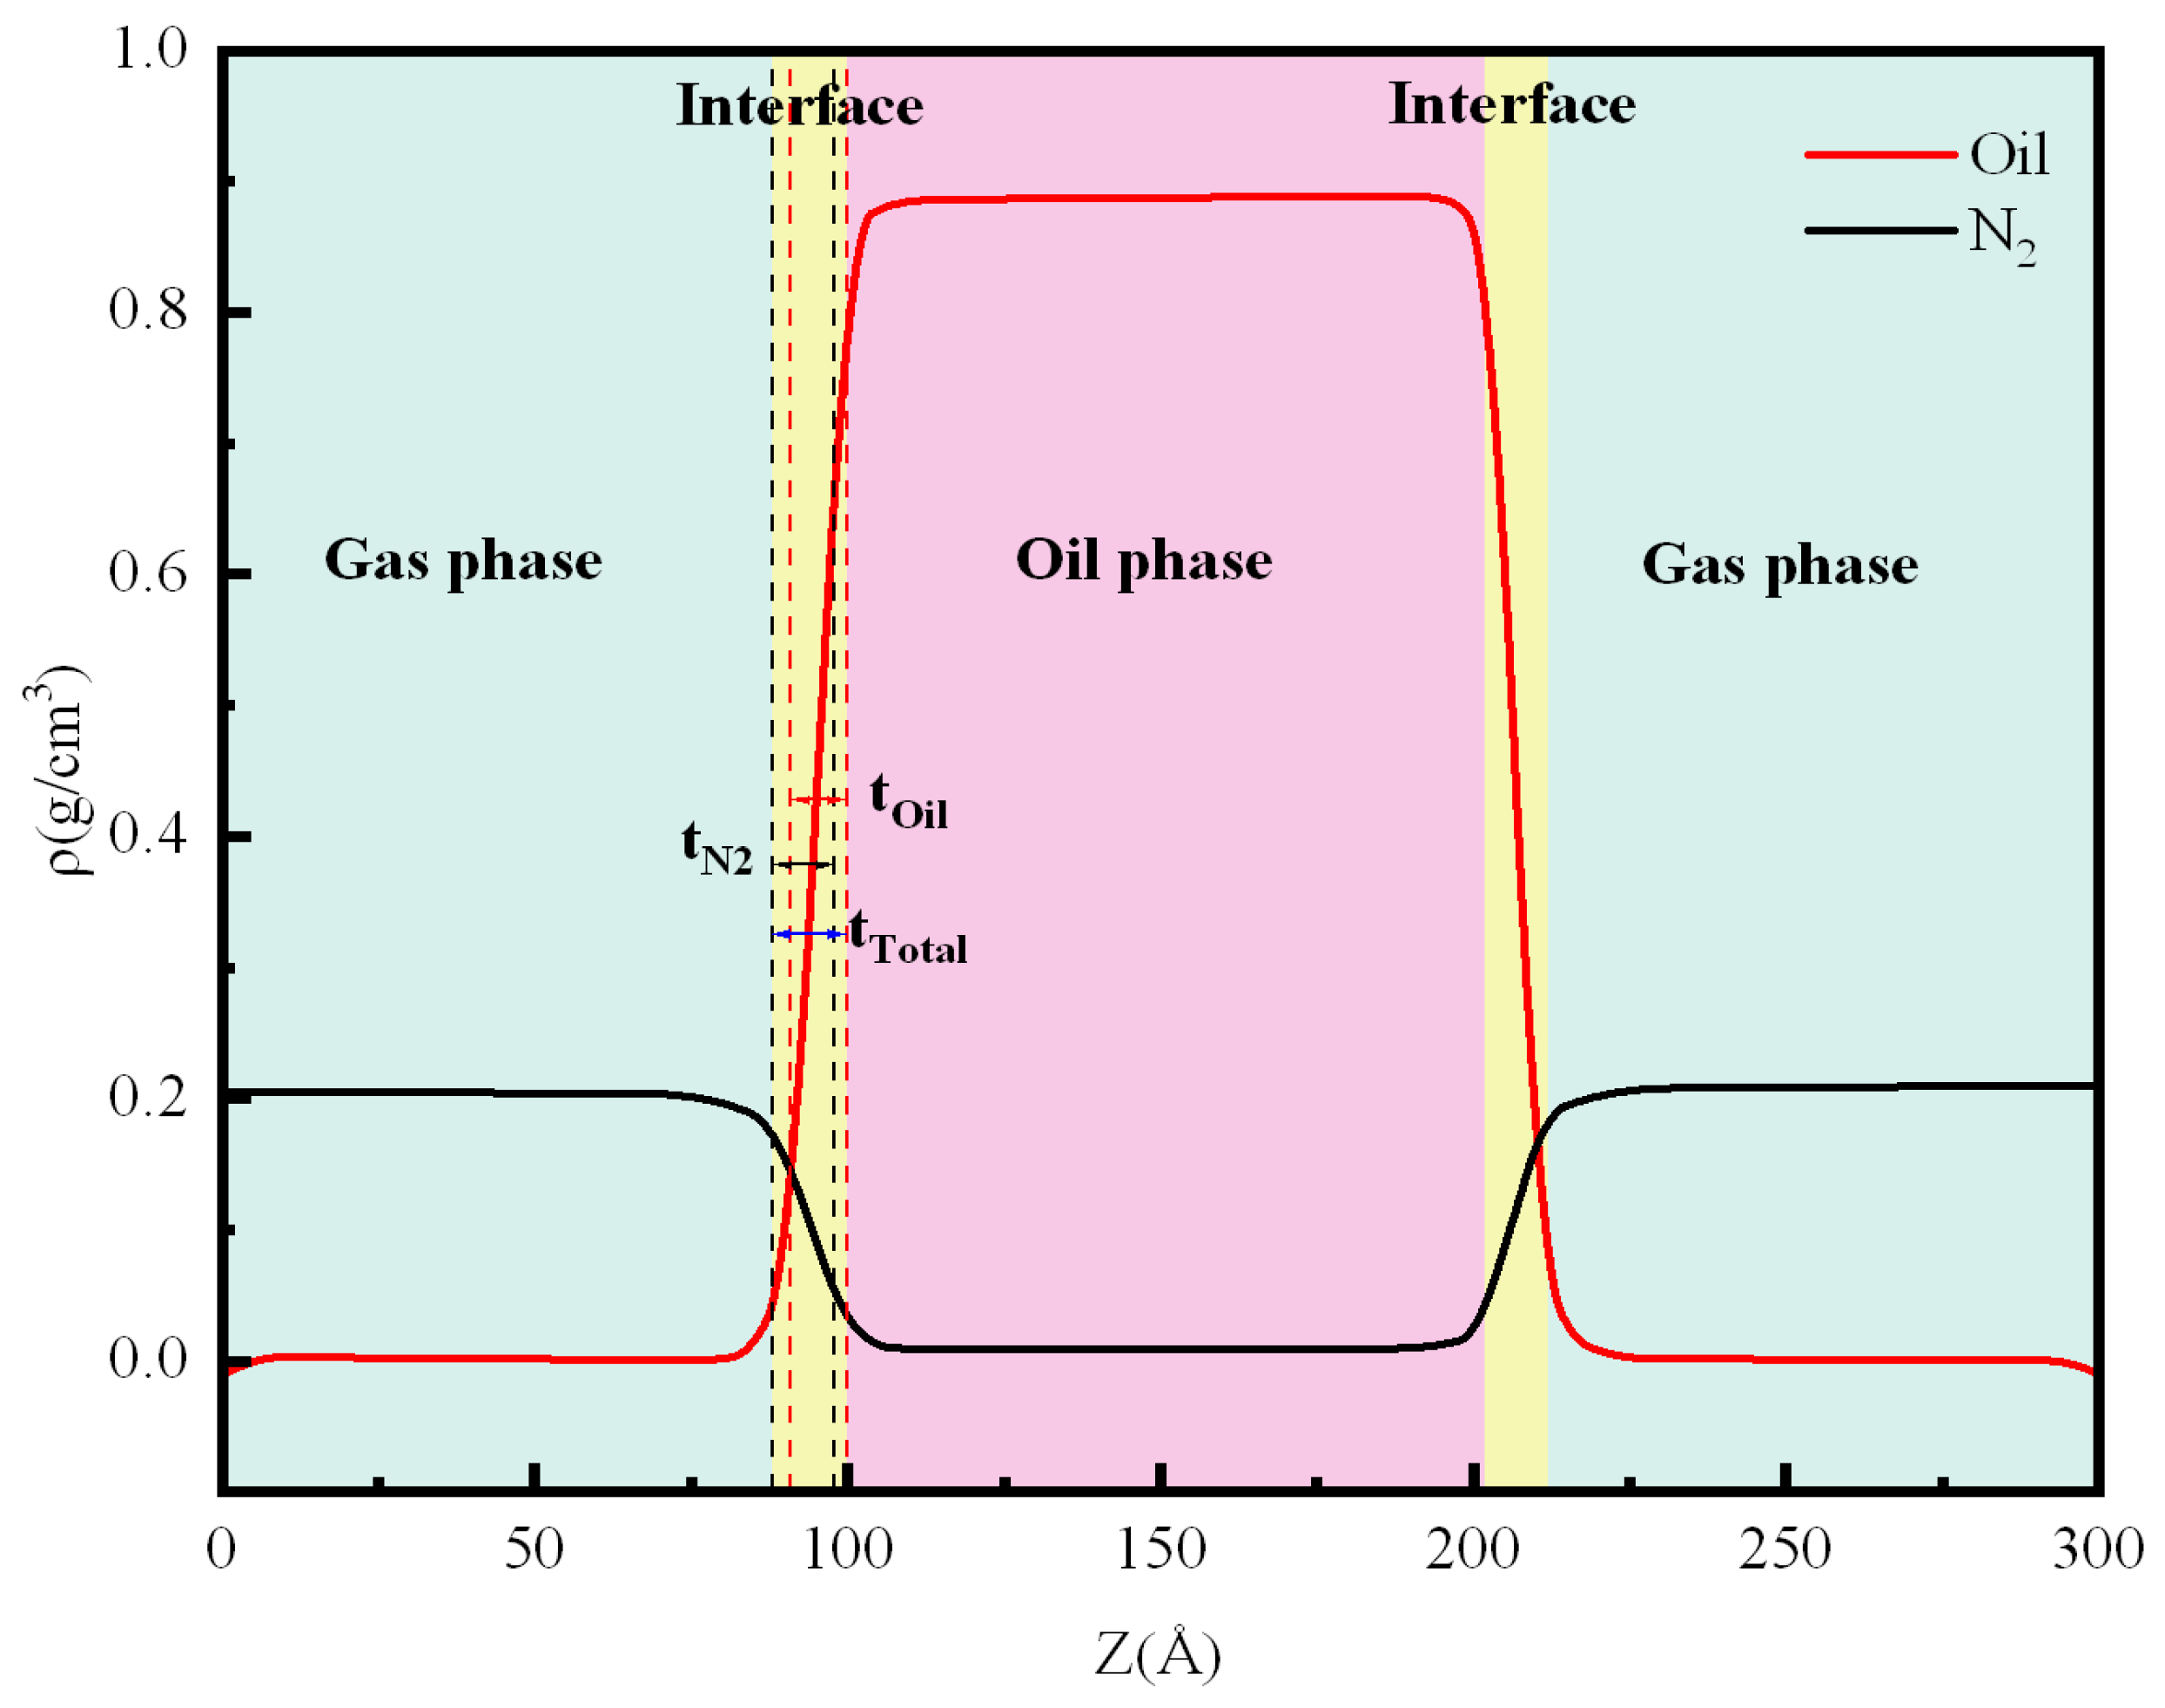
3.1. Density Distribution

Before data extraction, to prove that the system reaches convergence after 8 ns relaxation, we calculated the density at different moments (0.5, 1, 2, 3 ns) during the data extraction stage (lasting 3 ns), as shown in Table S3. The densities have not changed significantly and are very close to the reference value (from NIST) [46] and experimental value. Thus, in order to quantitatively analyze the mixing mechanism between oil and N2 in the shock absorber under different pressure conditions, we calculated the one-dimensional mass density variation along the Z-direction in the oil–gas system under different temperature and pressure conditions during data extraction (Figure 4 and Figure 5). As illustrated in Figure 4a, the density of aviation hydraulic oil decreases with an increase in the partial pressure of N2 within the system. Specifically, the density of aviation hydraulic oil decreases linearly from 0.844 g/m3 at 15 MPa to 0.812 g/m3 at 35 MPa (the density of N2 increases at a rate of −0.0016 g/m3 per MPa). This phenomenon suggests that during compression, the increase in N2 pressure within the shock absorber leads to the expansion of oil molecules. The mixing between the oil and gas phases intensifies, resulting in the displacement of oil molecules by the high-pressure gas, thereby reducing the density of the aviation hydraulic oil. Figure 4b demonstrates that as the pressure of N2 rises, so does the density of N2 within the aviation hydraulic oil, from 0.125 g/m3 at 15 MPa to 0.267 g/m3 at 35 MPa (the density of N2 increases at a rate of +0.0071 g/m3 per MPa), indicating that a higher N2 pressure enhances the solubility of N2 in the oil phase. Similarly, Figure 5a shows that with an increase in temperature, the volume of aviation hydraulic oil expands, leading to a decrease from 0.889 g/m3 at 313 K to 0.799 g/m3 at 433 K (the density of N2 increases at a rate of −0.00075 g/m3 per K) in its density. Figure 5b reveals that the density of N2 in the aviation hydraulic oil increases from 0.209 g/m3 at 313 K to 0.139 g/m3 at 433 K (the density of N2 increases at a rate of −0.00058 g/cm3 per K) with rising temperature, suggesting that higher temperatures facilitate the dissolution of N2 in the oil.
Figure 5 indicates that as pressure increases, the density of N2 decreases, while the density of aviation hydraulic oil remains relatively stable. At lower pressures, only a small number of oil molecules mix with N2, maintaining a distinct interface between the two phases. However, at higher pressures, the degree of oil–gas mixing intensifies, and the interface becomes more indistinct, reflecting thorough mixing under high-pressure conditions.
In order to more intuitively reflect the mass transfer effect and structural changes that induce pressure changes in the system during the dissolution of N2 and oil, the two-dimensional density plots (generated by the TK console module of VMD (v1.9.3, University of Illinois, Urbana-Champaign, Urbana, IL, USA) software [62]) of the binary system on the XZ plane under different temperature and pressure conditions were calculated. Figure 6 shows that as temperature rises, the densities of both N2 and aviation hydraulic oil significantly decrease. At lower temperatures, the system tends to be stable, with limited mixing between the oil and gas phases, preserving a clear interface. In contrast, at higher temperatures, the oil–gas mixture becomes more pronounced, with the interface becoming blurred, indicating that increased temperature leads to enhanced mixing. These results reflect the different characteristics of the oil and gas phases in MD simulations. Aviation hydraulic oil, with its chain-like molecular structure and strong intermolecular forces, exhibits significant density changes during compression and expansion processes (Figure 7). Consequently, N2, as a diatomic gas, exhibits substantial solubility and diffusivity.

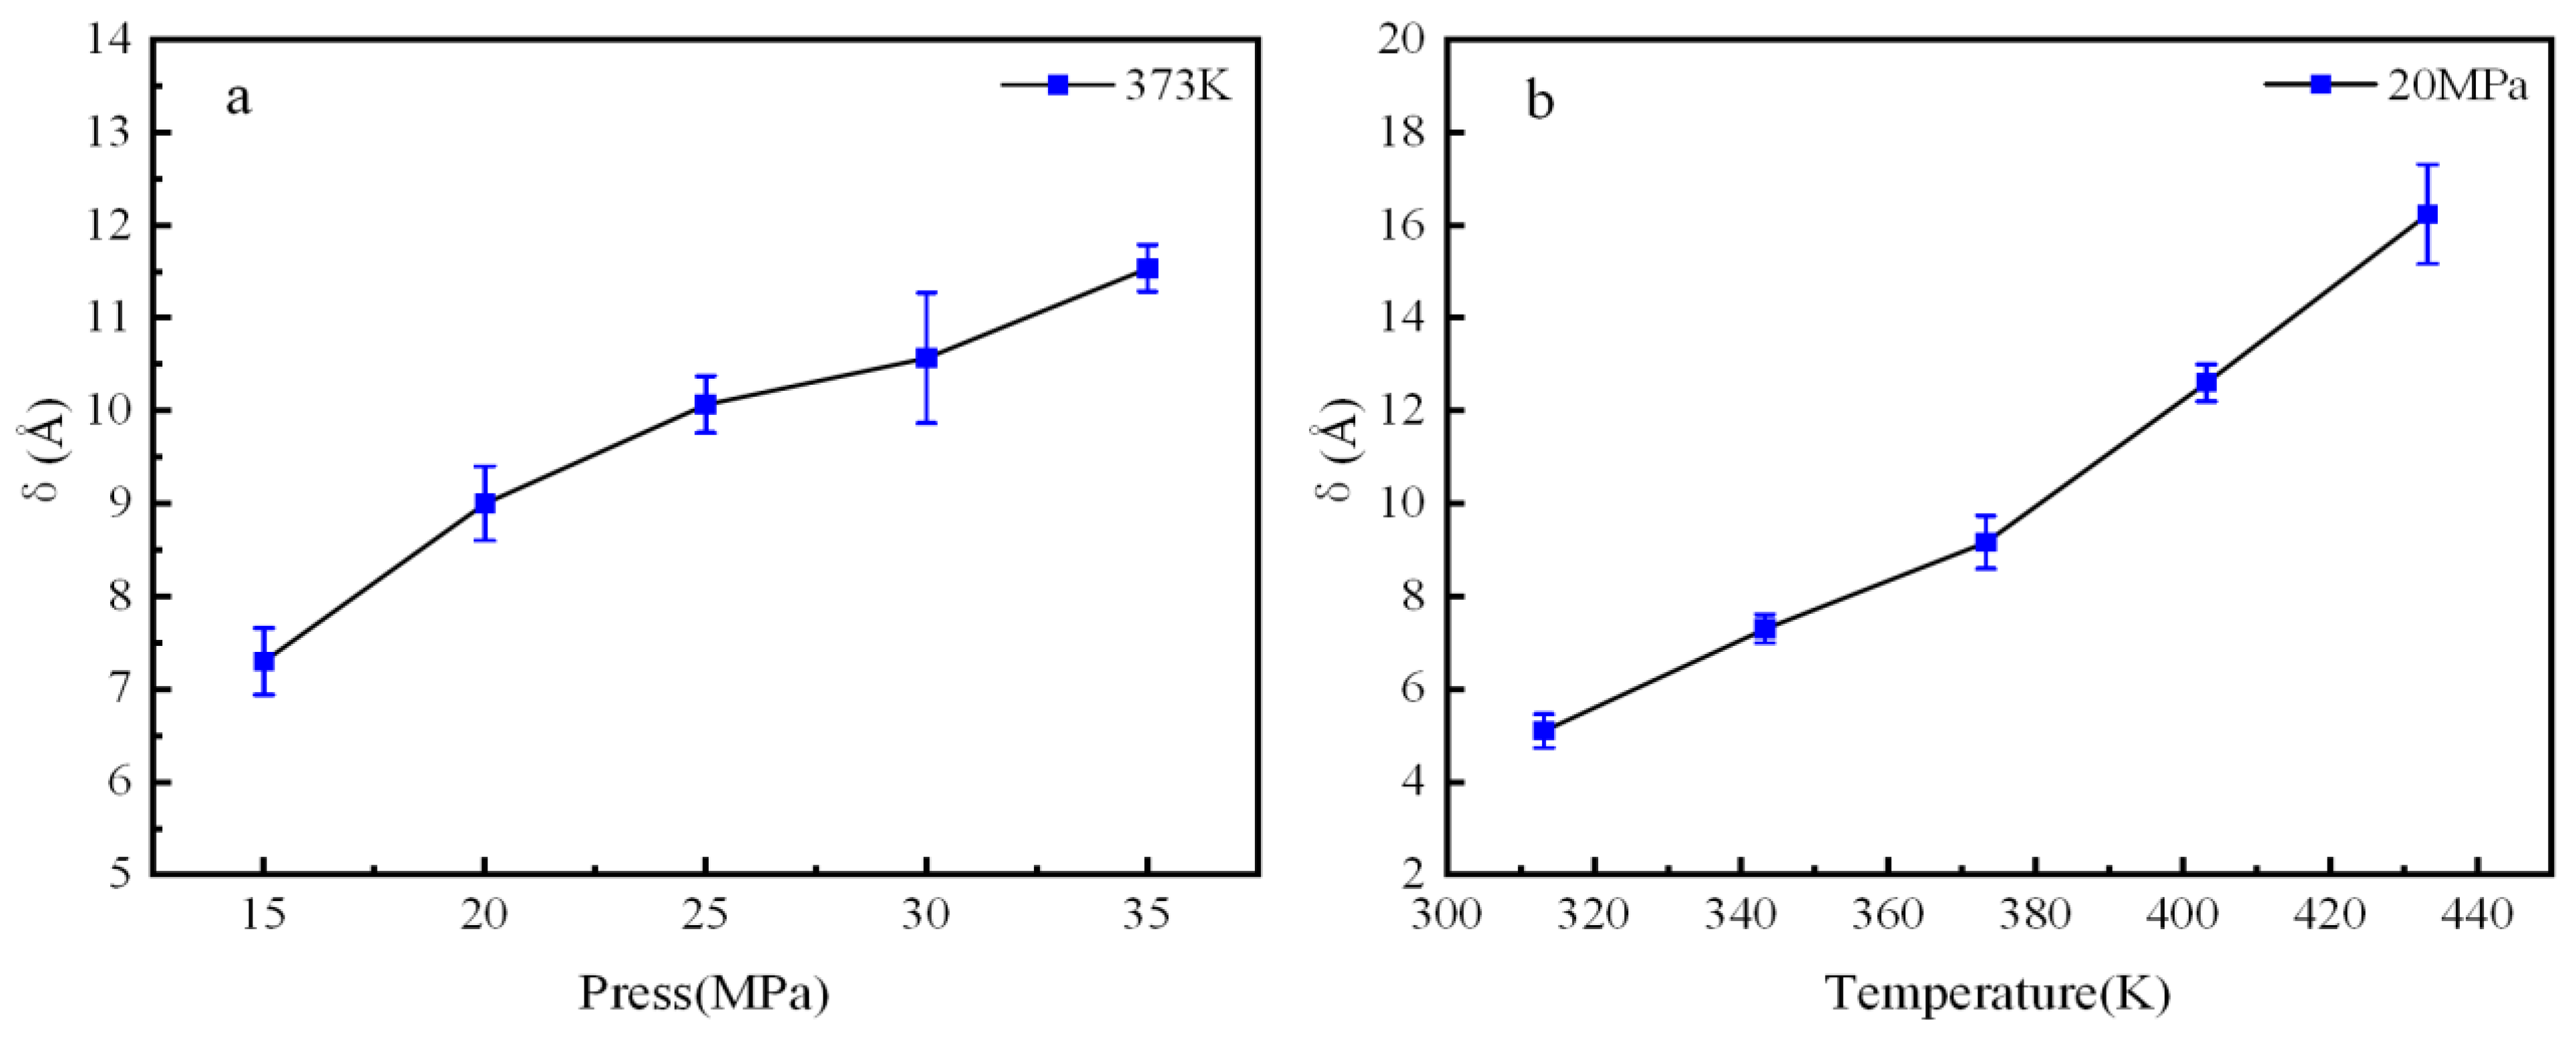
3.2. Interface Thickness

Based on the density distribution curves of the oil–gas two-phase system analyzed above, the position of the oil–gas interface and its thickness ( δ ) can be determined, allowing for a detailed description of the effects of different pressures and temperatures on the interface. The ‘10–90’ rule is employed to estimate the thickness of the interface, and the ‘10–90’ method serves as a valuable reference for evaluating the interfacial properties of gas–oil systems. It allows for the quantitative comparison of interfacial behavior under different conditions, which is crucial for understanding the effects of pressure and temperature on the system. The region along the interface, where the density ranges from 10% to 90% of the respective bulk phase densities, is used to ascertain the position of the oil–gas interface [63], as shown in Figure 8.
As can be observed from Figure 9, the interface thickness increases from 7.3 ± 0.36 to 11.53 ± 0.25 Å with pressure rise and from 5.1 ± 0.36 to 11.53 ± 0.25 Å with temperature rise. This is attributed to the diffusion of a greater number of N2 molecules into the aviation hydraulic oil, while simultaneously, an increased number of oil molecules move towards the nitrogen gas. The enhanced mixing of the oil–gas two-phase system results in a broader interface, indicating that high-temperature and high-pressure conditions are conducive to the mixing of the oil and gas phases.

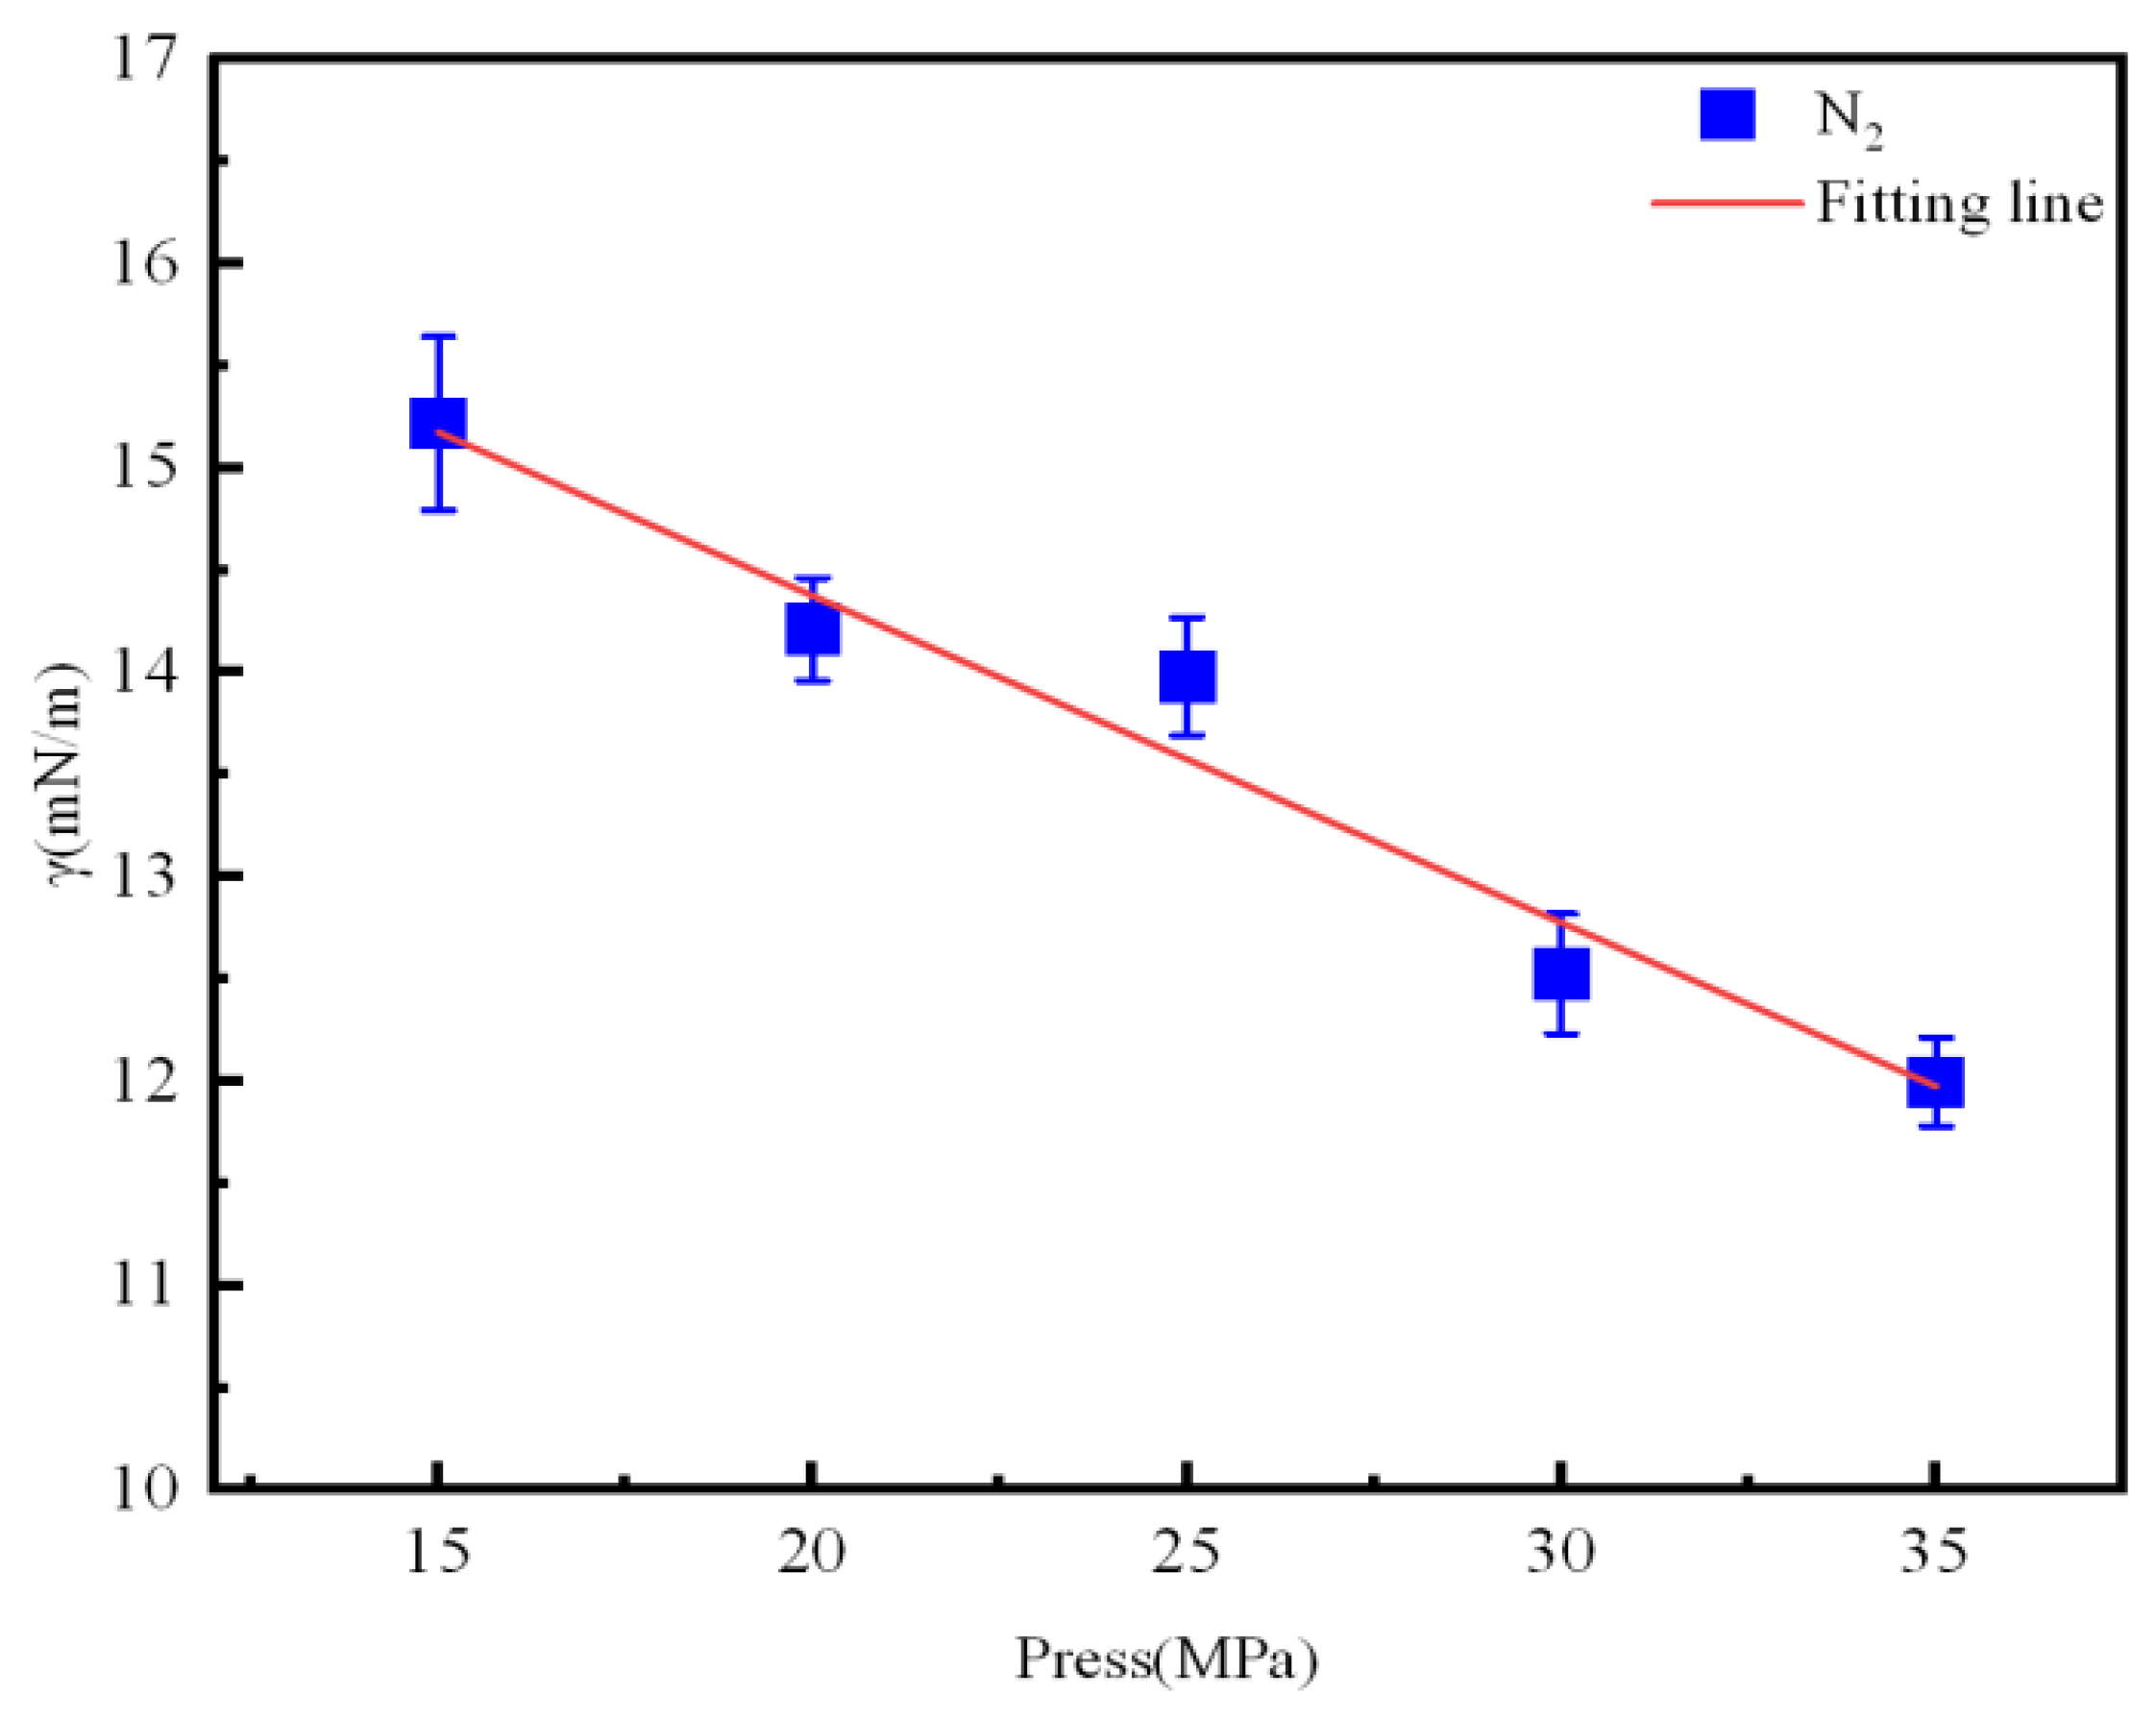
3.3. Interfacial Tension and MMP

Interfacial tension is a parameter that describes the strength of interactions between gas and oil phases. Lower interfacial tension typically indicates stronger solubility and better mixing effects. The MMP is the pressure at which the oil–gas interface disappears and the two phases achieve complete miscibility. When the interfacial tension is relatively low, the MMP is generally also low. In the study of oil–gas miscibility, the relationship between interfacial tension and MMP is of vital importance. It aids in understanding the mixing behavior between oil and gas, predicting outcomes, and optimizing the solubility of N2 in aviation hydraulic oil.
The interfacial tension at the oil–gas interface can be calculated using the Gibbs formula. The formula for calculating interfacial tension ( γ ) based on the pressure tensor is as follows [64]:
γ = 1 2 L z P z z P x x + P y y 2
In Equation (4), P i i ( i = x , y , z ) is the pressure tensor in different directions, and L z is the dimension of the box along the direction in the simulated system.
As can be observed from Figure 10, the interfacial tension decreases with an increase in pressure. This is because as the pressure of N2 increases, the density of aviation hydraulic oil decreases due to expansion, and the mixing between N2 and aviation hydraulic oil becomes more intimate, thereby reducing the interfacial tension. Theoretically, the interfacial tension is zero at the MMP; however, due to the difficulty in directly measuring the interfacial tension under completely mixed conditions, we employed the linear extrapolation method proposed by Orr and Jessen [65] to estimate the MMP. This method determines the MMP by linearly fitting the interfacial tension–pressure curve [66] and identifying the pressure at which the tension is zero. The red line in Figure 10 represents the linear fit, and its intersection with the X-axis provides the calculated MMP for N2 and aviation hydraulic oil, which is 107 MPa. The experimental MMP value between aviation hydraulic oil and N2 is 119 MPa, and the error is about 10%, which proves that the simulation is reliable to a certain extent [67]. Although the linear extrapolation method is widely used in theoretical and simulation studies, its limitations must be acknowledged. Owing to technological limitations, direct experimental validation of the MMP calculated for the N2–aviation hydraulic oil system under high-pressure conditions is not yet feasible. Future work will focus on experimentally verifying the calculated MMP to further enhance the reliability of the research findings. The calculated MMP of 107 MPa (Figure 10) indicates the threshold pressure required for complete oil–gas miscibility. Exceeding this pressure may lead to abrupt interface disappearance, causing unstable energy dissipation and potential hydraulic oil cavitation. This finding highlights the need to maintain operational pressures below MMP to ensure stable damping performance and avoid safety risks during extreme landing conditions.

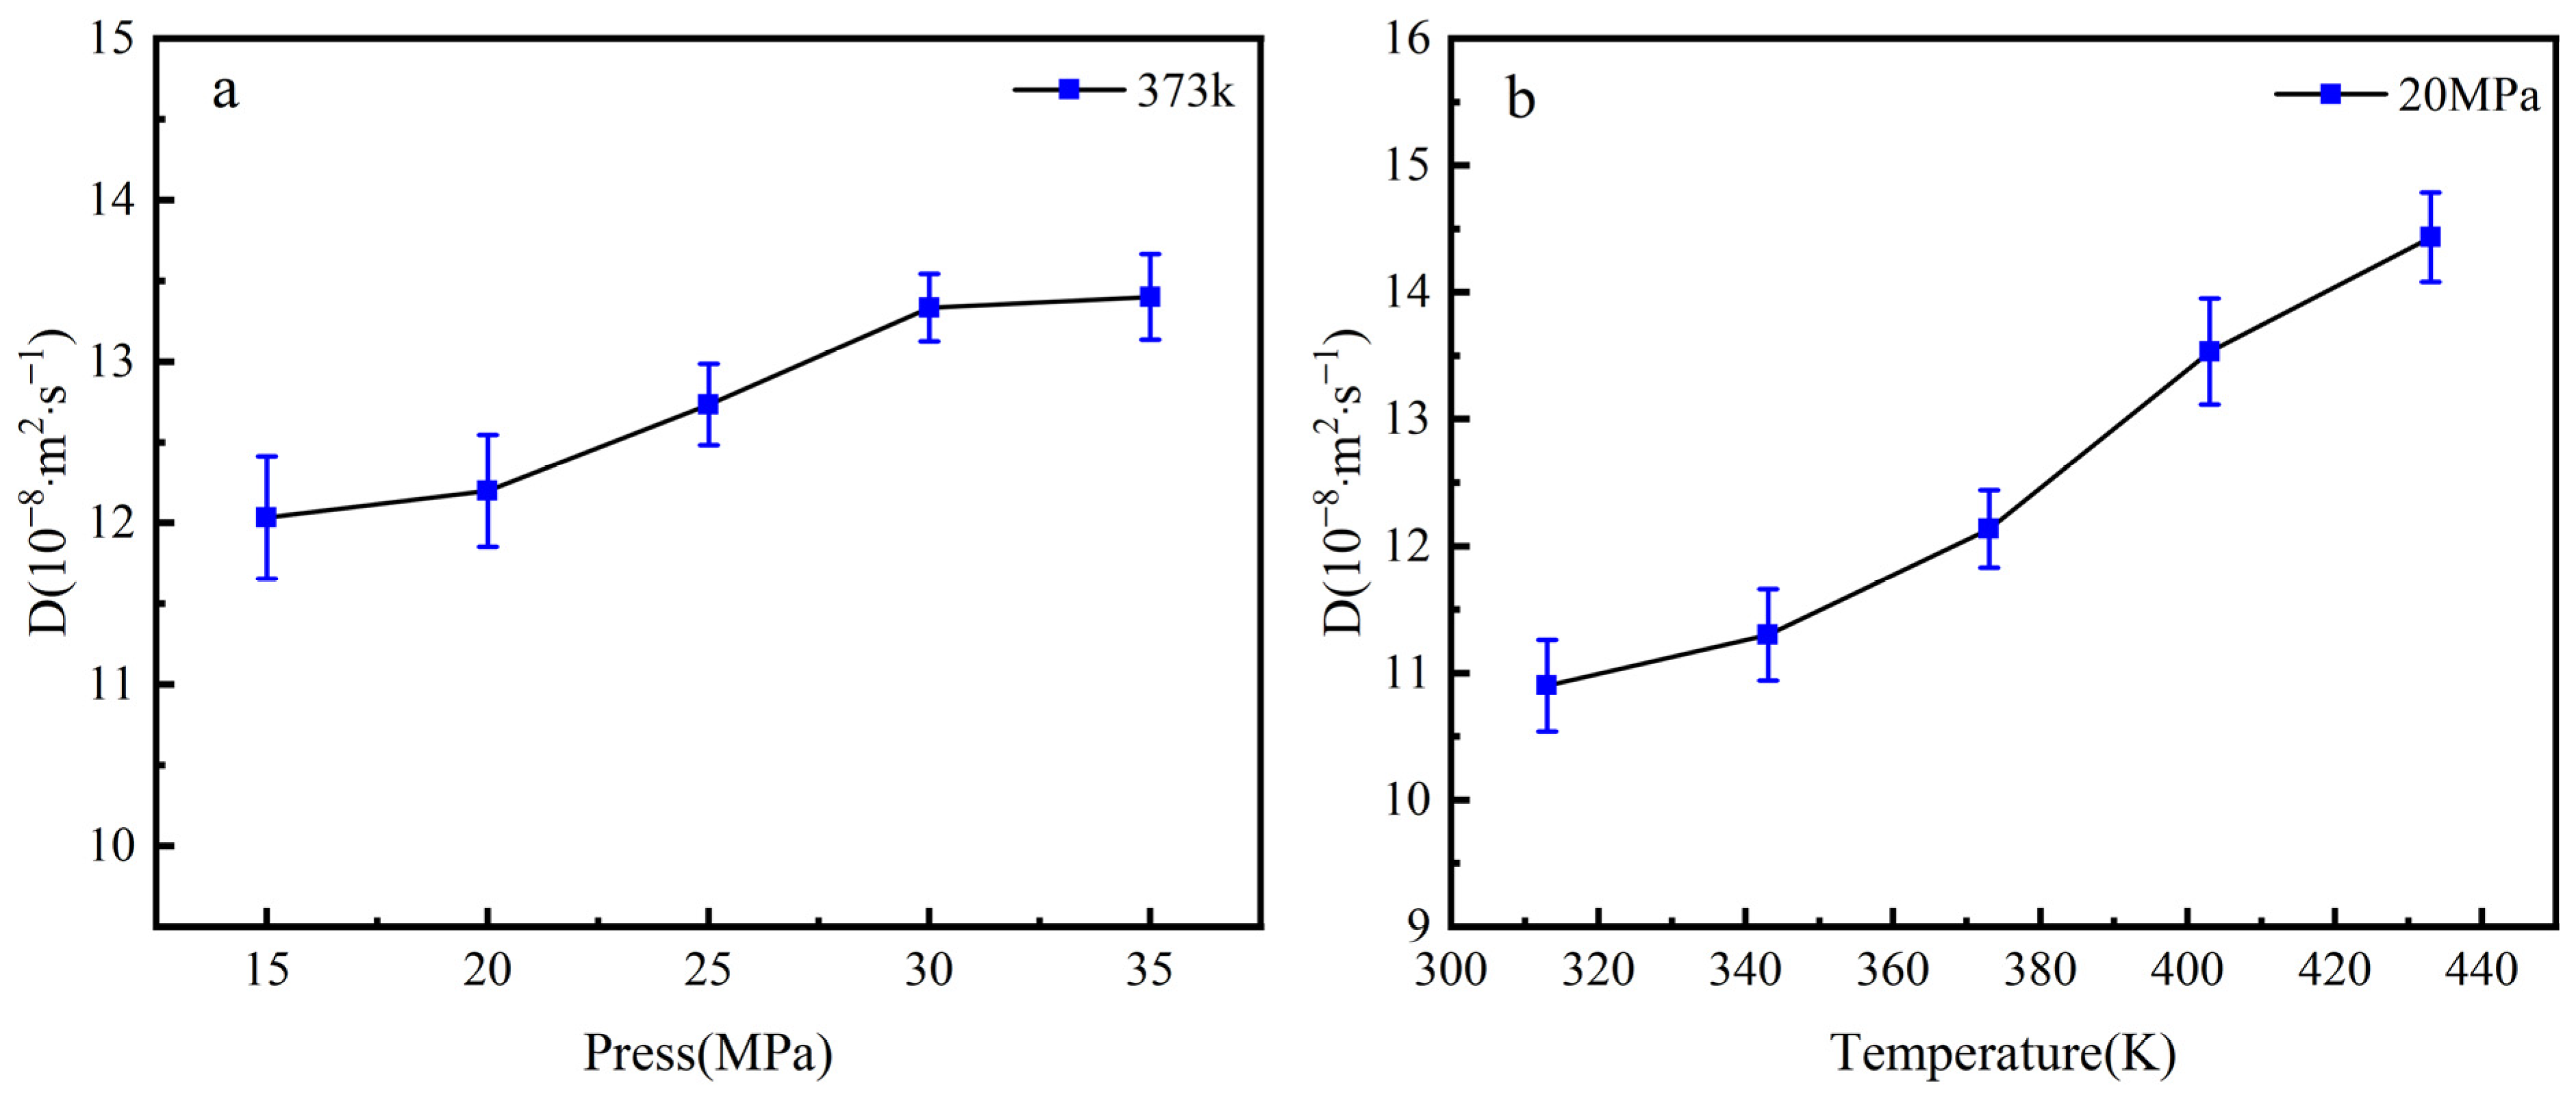
3.4. Diffusion Coefficient

The diffusion coefficient of N2 molecules in the oil–gas mixing process is a crucial parameter for quantifying mass transfer diffusion (the relative migration rate of one substance within another), directly affecting the solubility and mixing efficiency during the oil–gas mixing process. In the study of oil–gas miscibility, a higher diffusion coefficient generally facilitates the more rapid and uniform dissolution of gas into the liquid, thereby enhancing the mixing effect. A larger diffusion coefficient indicates that N2 has greater mobility within aviation hydraulic oil, which is beneficial for its entry into the oil phase and for increasing the degree of oil–gas mixing. Conversely, a lower diffusion coefficient makes it difficult for N2 to penetrate the oil phase, resulting in less noticeable oil–gas interactions. This process directly influences the physical properties of aviation hydraulic oil, such as viscosity, density, and fluidity, which are vital for the stability and performance of hydraulic systems. The diffusion coefficient ( D ) is obtained from the mean square displacement and Einstein’s equation [68,69] as follows:
D = 1 6 N l i m t d d t i = 1 N r i ( t ) r i ( 0 ) 2
In Equation (5), N is the number of particles, t is the simulation time, and r i ( t ) and   r i ( 0 ) are the position vectors of a particle i at the moment of t and 0 moment.
Figure 11a shows that the diffusion coefficient of N2 increases with increasing pressure. This is due to the increase in the density of N2 molecules, which leads to enhanced molecular collisions, thus intensifying the thermal motion and facilitating diffusion. Figure 11b shows that the diffusion coefficient of N2 increases with an increase in temperature. The increase in temperature leads to more intense molecular motion, lower oil viscosity, and wider molecular spacing, all of which are favorable for N2 diffusion into the oil phase. In addition, when the oil–gas mixing process is more pronounced, the increase in the thickness of the interface between the oil and gas results in less resistance in the direction perpendicular to the interface for the N2 molecules and more free space for diffusion. Thus, increases in temperature and pressure both facilitate the diffusion of N2 molecules.
The enhanced diffusion coefficient of N2 under high pressure (Figure 11a) implies faster gas dissolution into the oil phase, which directly affects the damping characteristics of the shock absorber. A higher diffusion rate improves the uniformity of energy distribution during impact absorption, thereby reducing localized stress concentrations and enhancing the structural integrity of the landing gear.

3.5. Influence of System Energy on Oil–Gas Miscibility

In the study of gas–oil mixtures, a higher system energy generally facilitates the dissolution of gas in the liquid phase, thereby enhancing the mixing effect between the two phases. Understanding system energy can provide insights into the microscopic mechanisms of gas–oil mixing and further elucidate the behavior of gas–oil mixtures.
To investigate the molecular mechanisms of oil–gas miscibility during the dissolution of N2, the oil–gas mixing process was analyzed from the perspective of system energy. Figure 12, Figure 13 and Figure 14 show that as pressure and temperature increase, the total energy of the system gradually rises, indicating enhanced oil–gas mixing. The total energy of the system consists of potential energy and kinetic energy. This is because the increase in pressure and temperature leads to more frequent interactions and collisions between N2 and oil molecules, thereby increasing the system’s potential and kinetic energies. These various forms of energy elucidate the mechanisms of oil–gas mixture dissolution under different temperatures and pressures from the perspective of system energy.
The molecular microscopic mechanism directly reflects the external energy conditions. As gas pressure increases, the total energy of the system gradually increases, and the degree of oil and gas mixing intensifies (Figure 11, Figure 12 and Figure 13). This is primarily due to the enhanced interaction between gas and oil molecules under higher pressure and temperature conditions. Specifically, N2 molecules, being nonpolar, mainly diffuse through van der Waals interactions with the oil molecules. These interactions, including both attractive and repulsive forces at the molecular level, become more pronounced at higher pressures and temperatures, leading to an increase in the system’s potential and kinetic energy. The increase in potential energy is largely attributed to the attractive van der Waals forces between the nitrogen molecules and the hydrocarbons in the oil. These forces encourage the nitrogen molecules to become more dissolved in the oil phase. Furthermore, at elevated temperatures, the kinetic energy of the molecules also increases, which promotes more frequent and intense collisions between nitrogen molecules and oil molecules. This further enhances the mixing process. While van der Waals forces dominate in the case of nitrogen and the oil molecules due to the non-polar nature of nitrogen, the oil’s hydrocarbon chains may also experience weak London dispersion forces, which enhance the solubility of N2 in the oil phase. The interaction between the gas and oil is thus a combination of these molecular forces, with van der Waals interactions being the primary contributor. Unlike polar gases (e.g., CO2), N2 is incapable of forming hydrogen bonds with the hydrocarbon chains in oil, a characteristic that fundamentally constrains its solubility to a certain degree. In summary, under high-pressure and temperature conditions, the van der Waals forces between nitrogen and the oil molecules increase, promoting more efficient mixing and dissolution of nitrogen in the oil. This molecular interaction mechanism significantly influences the solubility of nitrogen in aviation hydraulic oil.

3.6. Dissolution of N2 in Aviation Hydraulic Oil

After the relaxation was completed, the dissolution of N2 in the oil reached equilibrium. Thus, we counted the number of N2 molecules in the bulk region (the N2 region maintaining a density at 90% of its original level) in the oil–gas system and recorded it as N e g . Furthermore, the number of all N2 molecules is recorded as N g , and the number of oil molecules is recorded as N o . Then, the N2 solubility ( S ) was calculated by Equation (6).
S = N g N e g N g N e g + N o                  
The solubility of N2 in aviation oil under different temperature and pressure conditions is calculated, as shown in Table 2. SEXP is the experimental extrapolated value [70], SMD denotes the MD computed value, and N g N e g represents the number of N2 molecules dissolved in the oil phase (SEXP and SMD are nondimensional (nd) physical quantities).
The solubility of N2 in aviation hydraulic oil is a critical parameter for assessing the extent of N2 dissolution, directly influencing the outcome of gas–oil mixing and the performance of gas–oil shock absorbers. The solubility is closely related to factors such as temperature and pressure. Therefore, by investigating the solubility of N2, a deeper understanding of gas–oil mixing behavior can be achieved, providing theoretical support for the optimization of shock absorber performance.
To investigate the effect of different pressures and temperatures on the amount of N2 dissolved in aviation hydraulic oil, the number of N2 molecules dissolved in the oil was counted. The OVITO [71] software’s (v3.11.3, OVITO GmbH, Darmstadt, Germany) expression selection module was utilized to tally the number of N2 molecules within the region occupied by aviation hydraulic oil in the model, with the counting duration set at 1 ns and the number of frames at 1000. As shown in Table 2, the amount of dissolved N2 increases with rising pressure and temperature, which is consistent with the density distribution curves of N2 in the location occupied by aviation hydraulic oil presented in Figure 4b and Figure 5b. High temperature and high pressure facilitate the dissolution of N2 in aviation hydraulic oil, and the substantial dissolution of N2 is the primary cause of the reduced pressure in the gas cavity of the landing gear shock absorber. At ambient or low pressures, the solubility of N2 in oil decreases with increasing temperature, which is consistent with the general behavior of gases in liquids. However, in high-pressure closed systems, the fluid molecules are tightly packed, and pressure exhibits a high sensitivity to changes in system energy [72]. Consequently, an increase in temperature may lead to a rise in system pressure (as observed in the oil–gas system within closed shock absorbers of landing gear), thereby enhancing the solubility of gases in aviation hydraulic oil [73,74]. If the pressure-induced effect outweighs the negative influence of temperature on solubility, a net increase in gas solubility may occur. In the petroleum and natural gas industry, the mixing of gases and oil leads to the volume swelling of crude oil, with the swelling effect becoming more pronounced at higher temperatures [75,76]. This may be the key underlying mechanism for the solubility behavior of N2 under high-pressure conditions discussed in this study. More critically, at high temperatures, the density and viscosity of the oil decrease, and the free volume increases, providing more space for gas molecules (forming more ‘voids’), which facilitates the embedding of gas molecules. For long-chain hydrocarbons, high temperatures may cause the molecular chains to unfold, increasing non-polar interaction sites and further promoting the dissolution of N2 [77]. Li et al. [78] measured the gas volume solubility of N2 and natural gas in Daqing waxy crude oil within the temperature range of 50 °C to 65 °C. The results indicated that, at all tested temperatures, the solubility of N2 increased with rising temperature. Seyed Ali Madani [79] employed machine learning models to predict the solubility of N2 in normal alkanes. The findings indicated that under high-pressure and high-temperature conditions, the solubility of N2 increased with rising temperature. Experimental studies conducted by Doctor Li [80] revealed that gas solubility generally decreases with rising temperature, though exceptional cases exist, particularly under elevated temperature conditions where solubility may instead increase. Their results demonstrated that no simple universal rule governs the temperature dependence of gas solubility. Both Henry’s constant and thermal effects exhibit substantial variations depending on system-specific properties and temperature itself. Notably, under constant pressure conditions, nitrogen solubility in crude oil consistently increases with temperature elevation. Conversely, when temperature remains fixed, nitrogen solubility in crude oil shows proportional enhancement with pressure increment.
In summary, under high-pressure and high-temperature conditions, the solubility of N2 in oil behaves differently than in typical ambient conditions, primarily due to the complex interplay between pressure, temperature, and molecular interactions. This unique behavior highlights the importance of understanding gas–oil interactions in closed systems, such as shock absorbers, where pressure-induced effects can enhance gas solubility despite the general trend in decreasing solubility with rising temperature. These findings contribute to a deeper understanding of the thermodynamic properties and practical implications for oil and gas systems in extreme conditions.

4. Conclusions

This study employs molecular dynamics (MD) simulations to investigate the oil–gas mixing process within the shock absorber of a certain aircraft landing gear. The research examines the density distribution of the oil and gas phases, interfacial thickness, interfacial tension and MMP, diffusion coefficient, the influence of system energy on oil–gas mixing, and the solubility of N2 in aviation hydraulic oil under different thermodynamic conditions.
The simulation results indicate that as the internal pressure and temperature of the system increase, the interfacial thickness between the oil and gas phases grows, and the degree of mixing between these two phases also intensifies. Notably, when the gas pressure reaches a sufficiently high level, the mixing between the two phases becomes so thorough that the oil and gas are uniformly blended, and a distinct interface ceases to exist. Through linear fitting, the MMP was determined to be 107 MPa. The MMP represents the threshold pressure at which oil and gas achieve miscibility. A comprehensive understanding of the variation patterns and microscopic mechanisms of the MMP is of vital importance for the control and optimization of the oil–gas mixing process. The molecular mechanism underlying oil–gas miscibility was elucidated by analyzing the total system energy. As the system temperature and pressure rise, the total system energy correspondingly increases. This leads to more frequent collisions between oil and gas molecules, thereby enhancing the degree of mixing between the two phases. With an increase in system pressure, the diffusion coefficient of gas molecules perpendicular to the interface rises, resulting in higher gas and oil phase densities and a greater solubility of N2 in aviation hydraulic oil. Conversely, as the system temperature increases, the diffusion coefficient of gas molecules perpendicular to the interface also increases, while the gas phase density decreases and the oil phase density decreases, yet the solubility of N2 in aviation hydraulic oil still increases. The elevation of temperature and pressure is the fundamental cause of the substantial dissolution of gas within the landing gear shock absorber.
In summary, this study can provide valuable insights into the dissolution mechanism of N2 and oil in the shock absorber during aircraft take-off and landing and is of great significance to elucidate the interfacial mass transfer and pressure variation relationship between oil and gas phases in landing gear shock absorbers. Thus, it provides certain theoretical support for the optimization of shock absorption and energy absorption capacity of the reducer. By optimizing the oil–gas interaction through controlled pressure and temperature conditions, the energy dissipation efficiency and damping performance of the landing gear can be enhanced, contributing to the overall safety of aircraft during landing and taxiing.

Supplementary Materials

The following supporting information can be downloaded at: https://www.mdpi.com/article/10.3390/pr13051564/s1. Table S1: The σ (Å) and ϵ (kcal/mol) parameters for the components of the Aviation Hydraulic Oil No. 15 model. Table S2: Molecular simulation experimental design. Table S3: Density at different times during the data acquisition stage. Figure S1: The curves of N2, oil, and overall in the N2–oil system during relaxation.

Author Contributions

Methodology, Q.G.; software, Q.G.; investigation, H.Z.; writing—original draft, C.Z.; writing—review and editing, Q.G. and C.Z.; visualization, T.Z.; supervision, D.M. All authors have read and agreed to the published version of the manuscript.

Funding

This research was supported by the “Scientists + Engineers” research team of QINCHUANGYUAN PLATFORM (No.2022KXJ-139), and the Key industrial chain project of Shaanxi Province (No.2023-ZDLGY-28).

Data Availability Statement

The data presented in this study are available upon request from the corresponding author.

Acknowledgments

We sincerely thank the Shaanxi Provincial University Innovation Team—Aviation Material Processing and Aviation Parts Performance Testing Innovation Team for technical assistance.

Conflicts of Interest

The authors declare no conflicts of interest.

Abbreviations

The following abbreviations are used in this manuscript:
MDmolecular dynamics
MMPminimum miscibility pressure

References

  1. Ahmad, M.A.; Shah, S.I.A.; Shams, T.A.; Javed, A.; Rizvi, S.T.U.I. Comprehensive design of an oleo-pneumatic nose landing gear strut. Proc. Inst. Mech. Eng. Part G J. Aerosp. Eng. 2021, 235, 1605–1622. [Google Scholar] [CrossRef]
  2. Yu, W.; Zhang, C.; Peng, W.; Xuan, C.; Zhan, G. Analysis of Taxiing Performance of Single Strut Landing Gear Based on ISD. Mechanics 2023, 29, 486–493. [Google Scholar] [CrossRef]
  3. Pecora, R. A Rational Numerical Method for Simulation of Drop-Impact Dynamics of Oleo-Pneumatic Landing Gear. Appl. Sci. 2021, 11, 4136. [Google Scholar] [CrossRef]
  4. Jiao, F. Oil damping energy loss analysis of landing gear shock absorber. Proc. Inst. Mech. Eng. Part G J. Aerosp. Eng. 2019, 233, 3096–3106. [Google Scholar] [CrossRef]
  5. Fang, X.; Chen, H.; Han, Y.; Xie, X.; Wei, X.; Nie, H. Crashworthiness performance simulation and analysis of combined-type landing gear buffer. J. Aerosp. Eng. 2022, 35, 04022049. [Google Scholar] [CrossRef]
  6. Du, S.; Zhang, C.; Zhou, K.; Zhao, Z. Study of the two-phase flow characteristics of a damping orifice in an oleo-pneumatic shock absorber. Fluids 2022, 7, 360. [Google Scholar] [CrossRef]
  7. Yin, Y.; Rakheja, S.; Yang, J.; Boileau, P.-E. Characterization of a hydro-pneumatic suspension strut with gas-oil emulsion. Mech. Syst. Signal Process. 2018, 106, 319–333. [Google Scholar] [CrossRef]
  8. Yin, Y.; Rakheja, S.; Yang, J.; Boileau, P. Effects of entrapped gas within the fluid on the stiffness and damping characteristics of a hydro-pneumatic suspension strut. SAE Int. J. Commer. Veh. 2017, 10, 204–209. [Google Scholar] [CrossRef]
  9. Seyyedattar, M.; Ghamartale, A.; Zendehboudi, S.; Butt, S. Assessment of CO2-Oil swelling behavior using molecular dynamics simulation: CO2 utilization and storage implication. J. Mol. Liq. 2023, 379, 121582. [Google Scholar] [CrossRef]
  10. Hollingsworth, S.A.; Dror, R.O. Molecular Dynamics Simulation for All. Neuron 2018, 99, 1129–1143. [Google Scholar] [CrossRef]
  11. Zendehboudi, S.; Rezaei, N.; Lohi, A. Applications of hybrid models in chemical, petroleum, and energy systems: A systematic review. Appl. Energy 2018, 228, 2539–2566. [Google Scholar] [CrossRef]
  12. Feng, P.; Zhu, Y.; Zhao, K.; Gao, Y.; Liao, H.; Dai, Q.; Tang, Y.; Gou, K.; Zhu, X. Molecular dynamics simulation on the displacement behaviour of crude oil by CO2/CH4 mixtures on a silica surface. RSC Adv. 2024, 14, 6508–6520. [Google Scholar] [CrossRef] [PubMed]
  13. Xu, J.; Li, X.; Hou, C.; Wang, L.; Zhou, G.; Ge, W.; Li, J. Engineering molecular dynamics simulation in chemical engineering. Chem. Eng. Sci. 2015, 121, 200–216. [Google Scholar] [CrossRef]
  14. Ungerer, P.; Nieto-Draghi, C.; Lachet, V.; Wender, A.; di Lella, A.; Boutin, A.; Fuchs, A.H. Molecular simulation applied to fluid properties in the oil and gas industry. Mol. Simulat. 2007, 33, 287–304. [Google Scholar] [CrossRef]
  15. Zhu, H.; Zhang, S.; Li, X.; Ma, D.; Sun, X.; Wang, H.-Z.; Yan, Y.; Xu, J.; Yang, C. Molecular Dynamics Simulation Reveals Unique Rheological and Viscosity–Temperature Properties of Karamay Heavy Crude Oil. Energy Fuels 2021, 35, 7956–7966. [Google Scholar] [CrossRef]
  16. Zhang, W.; Feng, Q.; Wang, S.; Xing, X. Oil diffusion in shale nanopores: Insight of molecular dynamics simulation. J. Mol. Liq. 2019, 290, 111183. [Google Scholar] [CrossRef]
  17. Liu, J.; Yang, Y.; Sun, S.; Yao, J.; Kou, J. Flow behaviors of shale oil in kerogen slit by molecular dynamics simulation. Chem. Eng. J. 2022, 434, 134682. [Google Scholar] [CrossRef]
  18. Zhang, J.; Pan, Z.; Liu, K.; Burke, N. Molecular Simulation of CO2 Solubility and Its Effect on Octane Swelling. Energy Fuels 2013, 27, 2741–2747. [Google Scholar] [CrossRef]
  19. Li, C.; Pu, H.; Zhong, X.; Li, Y.; Zhao, J.X. Interfacial interactions between Bakken crude oil and injected gases at reservoir temperature: A molecular dynamics simulation study. Fuel 2020, 276, 118058. [Google Scholar] [CrossRef]
  20. Li, B.; Liu, G.; Xing, X.; Chen, L.; Lu, X.; Teng, H.; Wang, J. Molecular dynamics simulation of CO2 dissolution in heavy oil resin-asphaltene. J. CO2 Util. 2019, 33, 303–310. [Google Scholar] [CrossRef]
  21. Huang, T.; Cheng, L.; Cao, R.; Wang, X.; Jia, P.; Cao, C. Molecular simulation of the dynamic distribution of complex oil components in shale nanopores during CO2-EOR. Chem. Eng. J. 2024, 479, 147743. [Google Scholar] [CrossRef]
  22. Wang, P.; Li, X.; Tao, Z.; Wang, S.; Fan, J.; Feng, Q.; Xue, Q. The miscible behaviors and mechanism of CO2/CH4/C3H8/N2 and crude oil in nanoslits: A molecular dynamics simulation study. Fuel 2021, 304, 121461. [Google Scholar] [CrossRef]
  23. Yan, Y.; Jia, Z.; Geng, X.; Liang, D.; Hao, X.; Yang, Z.; Ding, B. Insight into miscibility mechanism of multiple components crude oil in CO2/CH4 by molecular dynamic simulation. J. Mol. Liq. 2024, 398, 124283. [Google Scholar] [CrossRef]
  24. Wang, S.; Cheng, Q.; Li, Z.; Qi, Y.; Liu, Y. Molecular Dynamics Study on the Diffusion Mass Transfer Behaviour of CO2 and Crude Oil in Fluids Produced via CO2 Flooding. Molecules 2023, 28, 7948. [Google Scholar] [CrossRef]
  25. Liu, J.; Zhang, D.; Tian, C.; Ma, W.; Xia, Z. A virtual parallel model for the buffer landing of multi-legged landing gear. Mech. Mach. Theory 2024, 200, 105724. [Google Scholar] [CrossRef]
  26. Shi, X.; Yu, A.; Nie, H.; Zhang, M.; Gui, X.; Yang, S.; Zheng, Y.; Liu, T. Effects of Pitch Stabilization Buffer on the Dynamic Performance of Frame-Type Landing Gear. Aerospace 2024, 11, 288. [Google Scholar] [CrossRef]
  27. Yan, S.; Xue, P.; Liu, L.; Zahran, M.S. Optimization of landing gear under consideration of vibration comfort for civil aircraft. Aircr. Eng. Aerosp. Technol. 2024, 96, 378–386. [Google Scholar] [CrossRef]
  28. Chao, C.; Botao, H.; Xiangming, C.; Yanan, C.; Chun, Z. Variable stroke fatigue test for aircraft landing gears. Proc. Inst. Mech. Eng. Part C J. Mech. Eng. Sci. 2024, 239, 2117–2128. [Google Scholar] [CrossRef]
  29. Zhang, Y.; Zhang, N.; Cui, B.; Guo, Q. Failure analysis and structural improvement of helicopter landing gear seals based on experiments and three-dimensional numerical simulation. Eng. Failure Anal. 2024, 163, 108596. [Google Scholar] [CrossRef]
  30. Bhattacherjee, R.; Botchway, K.; Pashin, J.C.; Chakraborty, G.; Bikkina, P. Developing statistical and machine learning models for predicting CO2 solubility in live crude oils. Fuel 2024, 368, 131577. [Google Scholar] [CrossRef]
  31. Zhang, J.; Guan, Y.; Li, T.; Yin, G. Solubility Variation and Prediction Model of CO2 in Water-Bearing Crude Oil. ACS Omega 2022, 7, 44420–44427. [Google Scholar] [CrossRef] [PubMed]
  32. Jin, H.; Jin, Z.; Kim, Y.-G.; Fan, C. Development of machine learning-based solubility models for estimation of Hydrogen solubility in oil: Models assessment and validation. Case Stud. Therm. Eng. 2023, 51, 103622. [Google Scholar] [CrossRef]
  33. Saajanlehto, M.; Uusi-Kyyny, P.; Alopaeus, V. Hydrogen solubility in heavy oil systems: Experiments and modeling. Fuel 2014, 137, 393–404. [Google Scholar] [CrossRef]
  34. Su, H.; Wang, H.; Li, D.; Zhang, D. Diffusion and Dissolution Behaviors of CO2, CH4, and N2 in Heavy Oil under High-Temperature and -Pressure Conditions: Insights into Heavy Oil Production via Multithermal Fluid Stimulation. Energy Fuels 2023, 37, 15753–15767. [Google Scholar] [CrossRef]
  35. Ding, C.; Fan, Y. Measurement of Diffusion Coefficients of Air in Silicone Oil and in Hydraulic Oil. Chin. J. Chem. Eng. 2011, 19, 205–211. [Google Scholar] [CrossRef]
  36. de Lara, L.S.; Michelon, M.F.; Miranda, C.R. Molecular dynamics studies of fluid/oil interfaces for improved oil recovery processes. J. Phys. Chem. B 2012, 116, 14667–14676. [Google Scholar] [CrossRef]
  37. Liu, F.; Gao, X.; Du, J.; Lin, L.; Hou, D.; Luo, J.; Zhao, J. Microscopic mechanism of enhancing shale oil recovery through CO2 flooding-insights from molecular dynamics simulations. J. Mol. Liq. 2024, 410, 125593. [Google Scholar] [CrossRef]
  38. Li, J.; Chen, D.; Sun, K.; Pan, R.; Tang, Y. Molecular dynamics simulation and experimental study of the rheological performance of graphene lubricant oil. Diam. Relat. Mater. 2024, 141, 110721. [Google Scholar] [CrossRef]
  39. Gong, H.; Lv, W.; Zhang, H.; Zhang, M.; Sun, H.; Xu, L.; Dong, M. The influence and mechanism of alkyl block polyethers on the interfacial tension and minimum miscibility pressure of CO2 and shale oil. Fuel 2024, 356, 129568. [Google Scholar] [CrossRef]
  40. Adam, A.M.; Bahamon, D.; Al Kobaisi, M.; Vega, L.F. Molecular dynamics simulations of the interfacial tension and the solubility of brine/H2/CO2 systems: Implications for underground hydrogen storage. Int. J. Hydrogen Energy 2024, 78, 1344–1354. [Google Scholar] [CrossRef]
  41. Zhang, Y.; Cui, M.; Xin, G.; Li, D. Microscopic insights on the effects of flue gas components on CH4–CO2 replacement in natural gas hydrate. Gas Sci. Eng. 2023, 112, 204947. [Google Scholar] [CrossRef]
  42. Yan, S.; Zang, H.; Yang, S.; Liu, Z.; Li, Y.; Du, D. Exploration of the interfacial tension variation behavior in different CO2/oil systems based on experimental and molecular dynamics simulation studies. J. Mol. Liq. 2024, 415, 126312. [Google Scholar] [CrossRef]
  43. Mohammed, S.; Mansoori, G.A. Effect of CO2 on the Interfacial and Transport Properties of Water/Binary and Asphaltenic Oils: Insights from Molecular Dynamics. Energy Fuels 2018, 32, 5409–5417. [Google Scholar] [CrossRef]
  44. Van Rooijen, W.; Habibi, P.; Xu, K.; Dey, P.; Vlugt, T.; Hajibeygi, H.; Moultos, O. Interfacial tensions, solubilities, and transport properties of the H2/H2O/NaCl system: A molecular simulation study. J. Chem. Eng. Data 2023, 69, 307–319. [Google Scholar] [CrossRef]
  45. Xu, J.; Zhang, Y.; Chen, H.; Wang, P.; Xie, Z.; Yao, Y.; Yan, Y.; Zhang, J. Effect of surfactant headgroups on the oil/water interface: An interfacial tension measurement and simulation study. J. Mol. Struct. 2013, 1052, 50–56. [Google Scholar] [CrossRef]
  46. Lemmon, E.W.; Huber, M.L.; McLinden, M.O. NIST Standard Reference Database 23. Available online: https://webbook.nist.gov/chemistry/fluid/ (accessed on 10 January 2025).
  47. Plimpton, S. Fast parallel algorithms for short-range molecular dynamics. J. Comput. Phys. 1995, 117, 1–19. [Google Scholar] [CrossRef]
  48. Potoff, J.J.; Siepmann, J.I. Vapor–liquid equilibria of mixtures containing alkanes, carbon dioxide, and nitrogen. AIChE J. 2001, 47, 1676–1682. [Google Scholar] [CrossRef]
  49. Khalaf, M.H.; Mansoori, G.A. Asphaltenes aggregation during petroleum reservoir air and nitrogen flooding. J. Petrol. Sci. Eng. 2019, 173, 1121–1129. [Google Scholar] [CrossRef]
  50. Ramirez Hincapie, M.L.; Narayanan Nair, A.K.; Che Ruslan, M.F.A.; Yang, Y.; Sun, S. Bulk and Interfacial Properties of the Alkane+ Nitrogen System. J. Chem. Eng. Data 2022, 67, 3138–3145. [Google Scholar] [CrossRef]
  51. Morrow, B.H.; Harrison, J.A. Interfacial Properties of Linear Alkane/Nitrogen Binary Mixtures: Molecular Dynamics Vapor–Liquid Equilibrium Simulations. J. Phys. Chem. B 2022, 126, 4379–4388. [Google Scholar] [CrossRef]
  52. Wang, S.; Wang, J.; Liu, H.; Liu, F. Impacts of polar molecules of crude oil on spontaneous imbibition in calcite nanoslit: A molecular dynamics simulation study. Energy Fuels 2021, 35, 13671–13686. [Google Scholar] [CrossRef]
  53. Sen, W.; Qihong, F.; Ming, Z.; Shuangfang, L.; Yong, Q.; Tian, X. Molecular dynamics simulation of liquid alkane occurrence state in pores and slits of shale organic matter. Pet. Explor. Dev. 2015, 42, 844–851. [Google Scholar] [CrossRef]
  54. Hong, X.; Yu, H.; Xu, H.; Wang, X.; Jin, X.; Wu, H.; Wang, F. Competitive adsorption of asphaltene and n-heptane on quartz surfaces and its effect on crude oil transport through nanopores. J. Mol. Liq. 2022, 359, 119312. [Google Scholar] [CrossRef]
  55. Guo, L.; Tang, G.; Kumar, S. Droplet morphology and mobility on lubricant-impregnated surfaces: A molecular dynamics study. Langmuir 2019, 35, 16377–16387. [Google Scholar] [CrossRef]
  56. Chen, J.; Mi, J.-G.; Chan, K.-Y. Comparison of different mixing rules for prediction of density and residual internal energy of binary and ternary Lennard–Jones mixtures. Fluid Phase Equilibria 2001, 178, 87–95. [Google Scholar] [CrossRef]
  57. Liu, Z.-Y.; Wang, C.; Zhou, H.; Wang, Y.; Zhang, L.; Zhang, L.; Zhao, S. Characterizing the impact of surfactant structure on interfacial tension: A molecular dynamics study. J. Mol. Model 2017, 23, 112. [Google Scholar] [CrossRef]
  58. Li, J.; Peng, B.; Xiong, J.; Luo, D.; Li, X.; He, J.; Zhang, H. Molecular dynamics simulation of BS12 and SDS mixed adsorption at the CO2-water interface: Evaluation of interfacial elasticity and permeability. Fuel 2025, 393, 135005. [Google Scholar] [CrossRef]
  59. Lou, R.; Zhe, S.; Lu, D.; Huang, L. Oleo-pneumatic mixed shock absorber landing pressure analysis of landing Gear. Adv. Aeronaut. Sci. Eng. 2020, 11, 380–386. [Google Scholar] [CrossRef]
  60. Huang, H.; Mang, Y.; Sun, Y.; Pei, X. Test and Analysis of YH-15 Aviation hydraulic oil viscosity-temperature characteristics. Ord. Ind. Autom. 2015, 34, 42–43. [Google Scholar] [CrossRef]
  61. Filipe, H.A.; Loura, L.M. Molecular dynamics simulations: Advances and applications. Molecules 2022, 27, 2105. [Google Scholar] [CrossRef]
  62. Humphrey, W.; Dalke, A.; Schulten, K. VMD: Visual molecular dynamics. J. Mol. Graph. 1996, 14, 33–38. [Google Scholar] [CrossRef]
  63. Gao, S.; Bao, X.; Yu, L.; Wang, H.; Li, J.; Chen, X. Molecular dynamics study of “quasi-gemini” surfactant at n-decane/water interface: The synergistic effect of hydrophilic headgroups and hydrophobic tails of surfactants on the interface properties. Colloids Surf. A Physicochem. Eng. Asp. 2022, 634, 127899. [Google Scholar] [CrossRef]
  64. Xiao, H.; Zhen, Z.; Sun, H.; Cao, X.; Li, Z.; Song, X.; Cui, X.; Liu, X. Molecular dynamics study of the water/n-alkane interface. Sci. China Chem. 2010, 53, 945–949. [Google Scholar] [CrossRef]
  65. Orr, F.M.; Jessen, K. An analysis of the vanishing interfacial tension technique for determination of minimum miscibility pressure. Fluid Phase Equilibria 2007, 255, 99–109. [Google Scholar] [CrossRef]
  66. Nobakht, M.; Moghadam, S.; Gu, Y. Determination of CO2 Minimum Miscibility Pressure from Measured and Predicted Equilibrium Interfacial Tensions. Ind. Eng. Chem. Res. 2008, 47, 8918–8925. [Google Scholar] [CrossRef]
  67. Yu, H.; Li, S.; Li, J.; Zhu, S.; Sun, C. Interfacial mass transfer characteristics and molecular mechanism of the gas-oil miscibility process in gas flooding. Acta Phys.-Chim. Sin 2020, 38, 2006061. [Google Scholar] [CrossRef]
  68. Wen, B.; Sun, C.; Bai, B.; Gatapova, E.Y.; Kabov, O.A. Ionic hydration-induced evolution of decane–water interfacial tension. Phys. Chem. Chem. Phys. 2017, 19, 14606–14614. [Google Scholar] [CrossRef]
  69. Zhang, J.; Tang, C.; Qiu, Q.; Yang, L. Effect of water on the diffusion of small molecular weight acids in nano-SiO2 modified insulating oil. J. Mol. Liq. 2020, 314, 113670. [Google Scholar] [CrossRef]
  70. Huang, M.; Zhao, Z.; Liu, J.; Chen, X.; Guo, H. Study on Dissolution Characteristics of Nitrogen in Oil-gas Mixed Buffer. Technol. Dev. Chem. Ind. 2022, 51, 35–40. [Google Scholar] [CrossRef]
  71. Stukowski, A. Visualization and analysis of atomistic simulation data with OVITO—The Open Visualization Tool. Modell. Simul. Mater. Sci. Eng. 2009, 18, 015012. [Google Scholar] [CrossRef]
  72. Wilhelm, E.; Battino, R.; Wilcock, R.J. Low-pressure solubility of gases in liquid water. Chem. Rev. 1977, 77, 219–262. [Google Scholar] [CrossRef]
  73. Frolich, P.K.; Tauch, E.; Hogan, J.; Peer, A. Solubilities of gases in liquids at high pressure. Ind. Eng. Chem. 1931, 23, 548–550. [Google Scholar] [CrossRef]
  74. Tileuberdi, N.; Mashrapova, M.; Toktarbay, Z. A review on nitrogen flooding for enhanced oil recovery. ES Mater. Manuf. 2023, 22, 968. [Google Scholar] [CrossRef]
  75. Zhang, X.; Li, L.; Su, Y.; Da, Q.; Fu, J.; Wang, R.; Chen, F. Microfluidic investigation on asphaltene interfaces attempts to carbon sequestration and leakage: Oil-CO2 phase interaction characteristics at ultrahigh temperature and pressure. Appl. Energy 2023, 348, 121518. [Google Scholar] [CrossRef]
  76. Hao, H.; Xian, B.; Peng, M.; Deng, S.; Cheng, L.; Wu, H.; Gao, X.; Qu, M.; Zhao, K. Study of Different Gas Floodings on Minimum Miscibility Pressure and Oil Recovery in a Low-Permeability Reservoir with Medium Viscous Oil. ACS Omega 2025, 10, 9426–9440. [Google Scholar] [CrossRef]
  77. Wang, S.; Cheng, Q.; Gan, Y.; Li, Q.; Liu, C.; Sun, W. Effect of wax composition and shear force on wax aggregation behavior in crude oil: A molecular dynamics simulation study. Molecules 2022, 27, 4432. [Google Scholar] [CrossRef]
  78. Li, H.Y.; Zhang, Y.; Wang, H. Gas Solubility Measurement for Waxy Crude Oil Saturated with Nitrogen and Natural Gas. Adv. Mater. Res. 2011, 339, 603–606. [Google Scholar] [CrossRef]
  79. Madani, S.A.; Mohammadi, M.-R.; Atashrouz, S.; Abedi, A.; Hemmati-Sarapardeh, A.; Mohaddespour, A. Modeling of nitrogen solubility in normal alkanes using machine learning methods compared with cubic and PC-SAFT equations of state. Sci. Rep. 2021, 11, 24403. [Google Scholar] [CrossRef]
  80. Wu, H. Study on Rheological Property of Oil and Gas System Under High Pressure and Gas Solubility in Crude Oil. Ph.D. Thesis, China University of Petroleum, Beijing, China, 2024. [Google Scholar]
Figure 1. Diagram of pressure drop inside the buffer.
Processes 13 01564 g001
Figure 2. Simulation model of oil–gas miscible process.
Processes 13 01564 g002
Figure 3. Simulation technical rute diagram.
Processes 13 01564 g003
Figure 4. Density distribution curve of (a) aviation hydraulic oil and (b) N2 with pressure changes (15, 20, 25, 30, and 35 MPa) at 373 K temperature.
Processes 13 01564 g004
Figure 5. Density distribution curve of (a) aviation hydraulic oil and (b) N2 with temperature change (313, 343, 373, 403, and 433 K) at 20 MPa pressure.
Processes 13 01564 g005
Figure 6. Two-dimensional density cloud map of N2 and aviation hydraulic oil successively changing with pressure: (a) 15, (b) 20, (c) 25, (d) 30, and (e) 35 MPa at 373 K temperature.
Processes 13 01564 g006
Figure 7. Two-dimensional density cloud map of N2 and aviation hydraulic oil successively changing with temperature: (a) 313, (b) 343, (c) 373, (d) 403, and (e) 433 K at 20 MPa pressure.
Processes 13 01564 g007
Figure 8. Schematic diagram of the oil and gas interface.
Processes 13 01564 g008
Figure 9. (a) The relationship between the interface thickness and the pressure (15, 20, 25, 30, and 35 MPa) at 373 K temperature. (b) The relationship between the interface thickness and the temperature (313, 343, 373, 403, and 433 K) at 20 MPa pressure.
Processes 13 01564 g009
Figure 10. Interfacial tension at 373 K temperature under different pressures (15, 20, 25, 30, and 35 MPa).
Processes 13 01564 g010
Figure 11. (a) The relationship between the diffusion coefficient of N2 perpendicular to the interface and the pressure (15, 20, 25, 30, and 35 MPa) at 373 K temperature (b) The relationship between the diffusion coefficient of N2 perpendicular to the interface and the temperature (313, 343, 373, 403, and 433 K) at 20 MPa pressure.
Processes 13 01564 g011
Figure 12. (a) Total energy of the system at 373 K temperature under different pressures (15, 20, 25, 30, and 35 MPa). (b) Total energy of the system at 20 MPa pressure under different temperatures (313, 343, 373, 403, and 433 K).
Processes 13 01564 g012
Figure 13. (a) Kinetic energy of the system at 373 K temperature under different pressures (15, 20, 25, 30, and 35 MPa). (b) Kinetic energy of the system at 20 MPa pressure under different temperatures (313, 343, 373, 403, and 433 K).
Processes 13 01564 g013
Figure 14. (a) Potential energy of the system at 373 K temperature under different pressures (15, 20, 25, 30, and 35 MPa). (b) Potential energy of the system at 20 MPa pressure under different temperatures (313, 343, 373, 403, and 433 K).
Processes 13 01564 g014
Table 1. The model components of aviation hydraulic oil No. 15.
Chemical CompoundMolecular FormulaPercentage/%
2-Dodecen-1-ylsuccinic anhydrideC16H26O325.09
Undec-10-ynoic acid, tetradecyl esterC25H46O211.77
2-Hexyl-1-decanolC16H34O11.36
phytolC20H40O10.67
Tetradecyl chloroacetateC16H31ClO28.63
Decyl methacrylateC17H32O28
Eicosyl vinyl carbonateC23H44O36.92
2-Methyldecyl acrylateC14H26O5.44
Pentadecyl 2-chloroacetateC17H33CLO25.09
2(1H)-Benzocyclooctenone, decahydro-4a-methylC13H22O4.53
Butylated HydroxytolueneC15H24O2.49
Table 2. SEXP, SMD, and N g N e g under different pressure and temperature conditions.
Pressure
(MPa)
Temperature (K)NegNeg
(Number)
SMD
(nd)
SEXP
(nd)
Error
(%)
15373450.08120.07952.1
20980.16150.15832.0
251460.22190.21194.7
301920.27230.28905.8
352440.32110.31113.2
20313530.08990.08723.1
343770.12850.13273.2
373980.16150.15832.0
4031290.20510.19883.2
4331620.25000.26114.3
Disclaimer/Publisher’s Note: The statements, opinions and data contained in all publications are solely those of the individual author(s) and contributor(s) and not of MDPI and/or the editor(s). MDPI and/or the editor(s) disclaim responsibility for any injury to people or property resulting from any ideas, methods, instructions or products referred to in the content.

