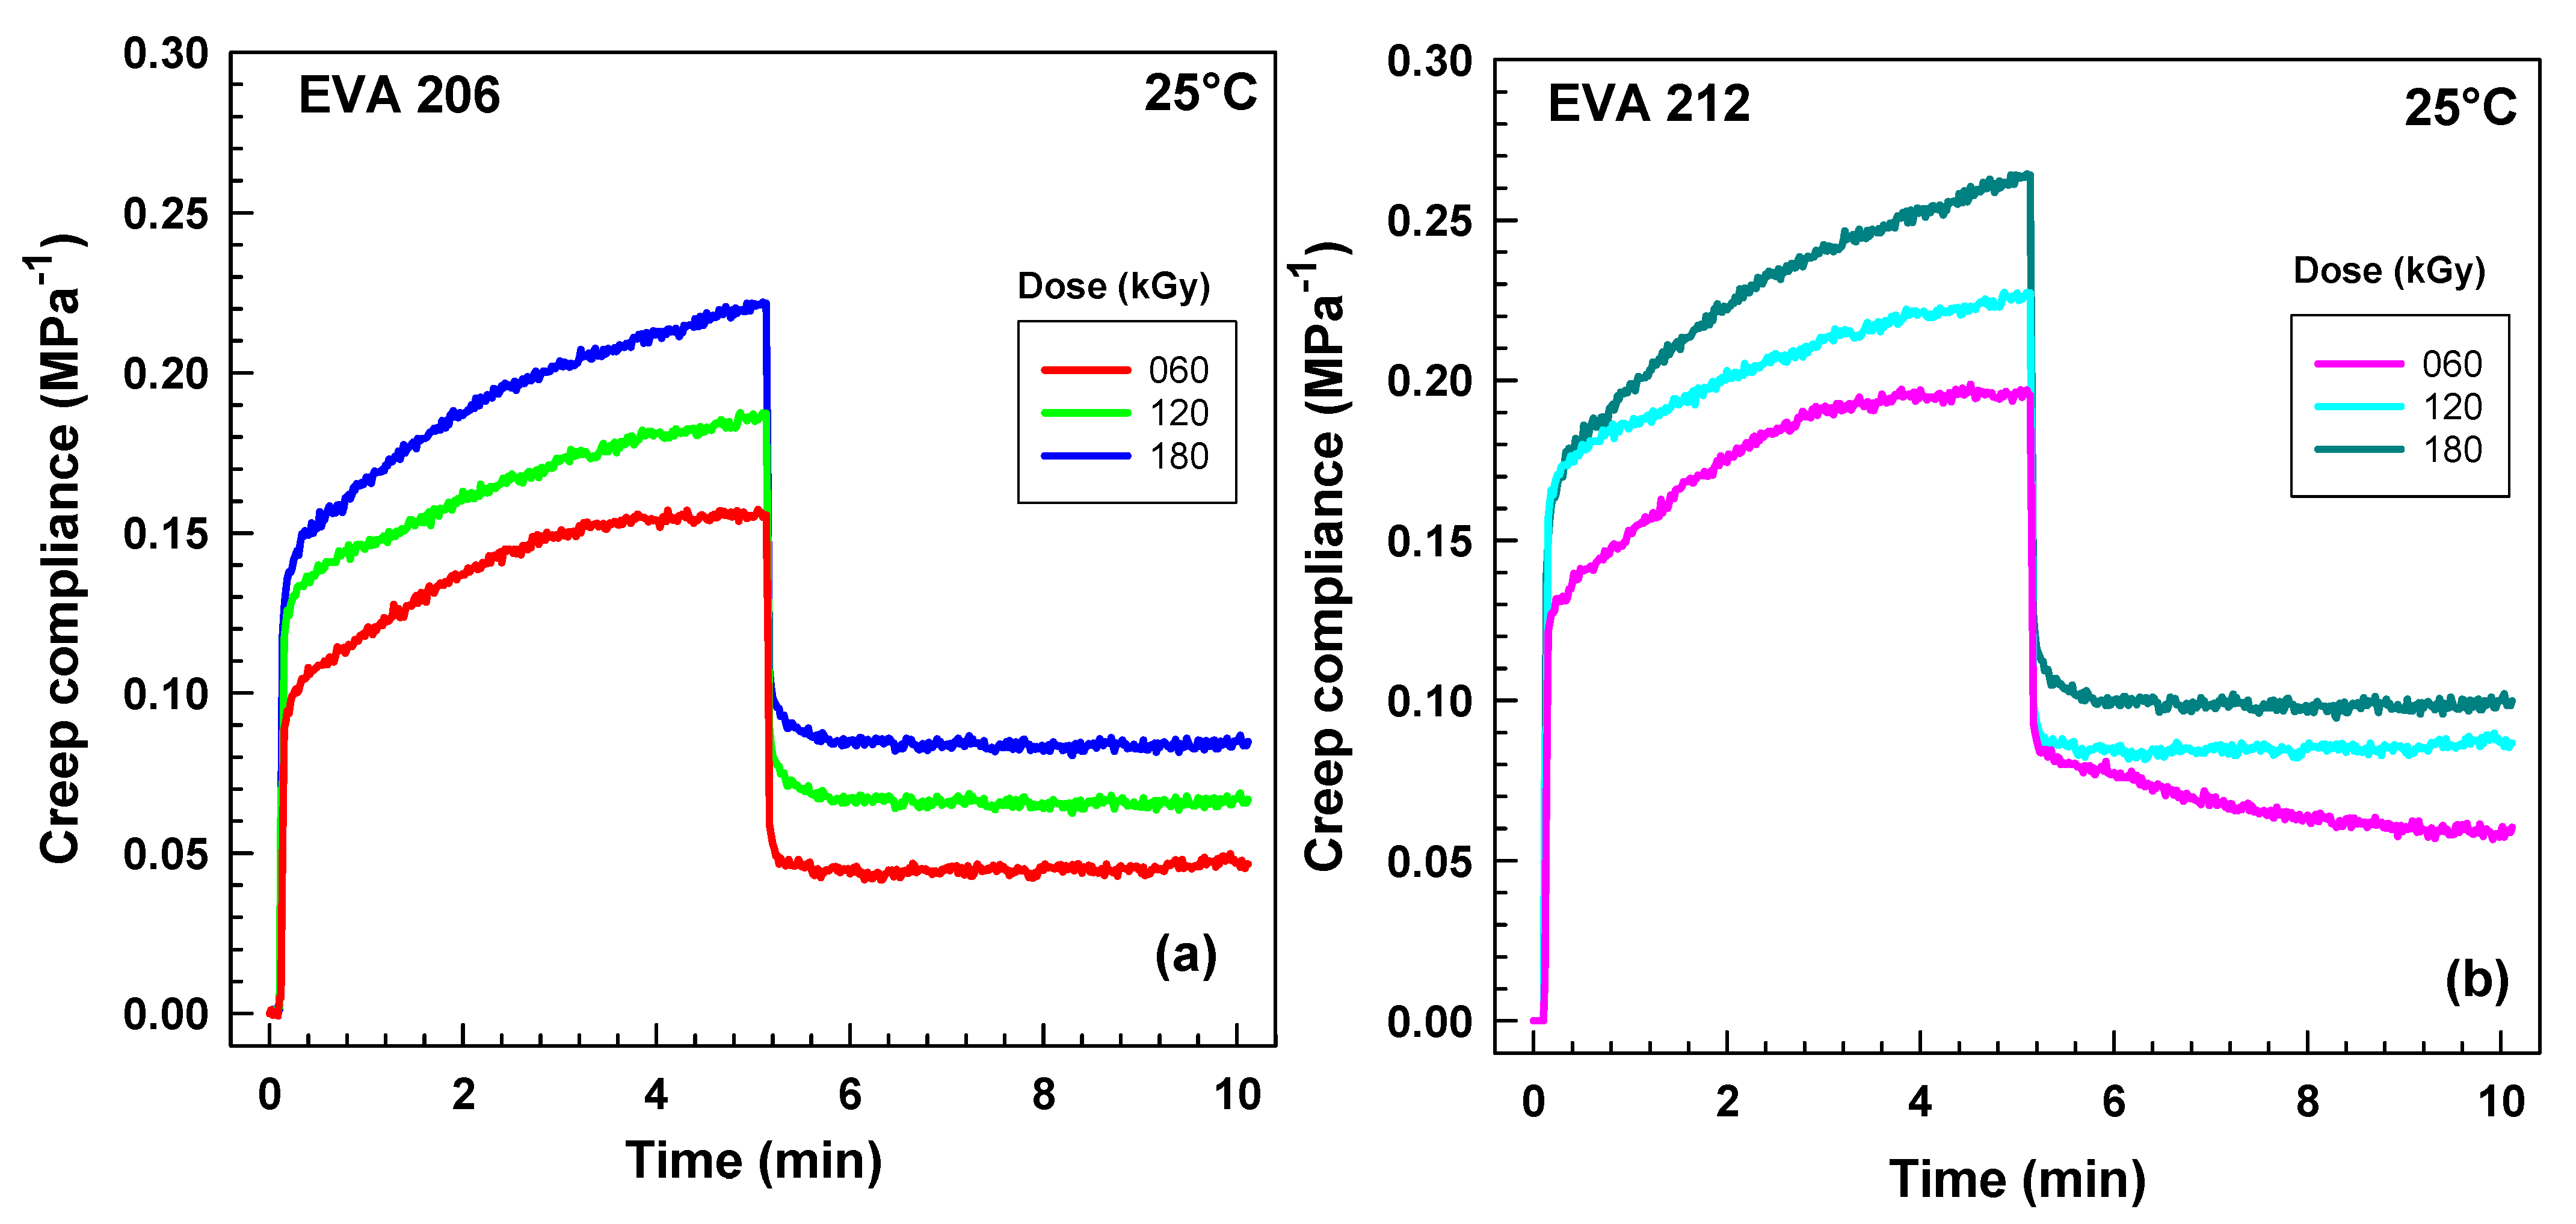
3.3. Room-Temperature Creep Compliance
Figure 7 displays creep compliance curves at room temperature. Notably, EVA 212 exhibits higher creep compliance values. This can be attributed to its higher amorphous phase content, making the material softer and more prone to deformation under stress. A surprising finding is the increased creep for higher irradiation levels, a trend opposite to that observed at 150 °C (see
Figure 8 and
Figure 9).
This phenomenon is likely due to the coexistence of a physical network alongside the chemical network. While tests at 150 °C primarily detect the chemical network, at 25 °C, a much stronger physical network formed by crystal lamellae plays a dominant role. These crystal lamellae effectively hold the amorphous chains together during stretching. However, electron beam irradiation appears to cause damage to these crystal lamellae, as evidenced by decreased crystallinity measured using differential scanning calorimetry (DSC) and wide-angle X-ray diffraction (WAXD). For instance, WAXD analysis of EVA 206 showed crystallinity values of , , and for irradiation doses of 60, 120, and 180 kGy, respectively. Similarly, DSC measurements yielded crystallinity values of , , and for the same doses.
Electron beam irradiation of EVA can induce both crosslinking and chain scission, thereby affecting its molecular weight. In pristine semicrystalline EVA, higher-molecular-weight chains form more entanglements, acting as physical crosslinks that resist creep [
41]. Additionally, long-molecular-weight amorphous chains serve as tie molecules, crucial for stress transfer between crystalline lamellae and enhancing creep resistance. However, e-beam-induced chain scission reduces the average molecular weight, leading to fewer entanglements and a decrease in the number and effectiveness of tie molecules. This results in weakened interlamellar connections and an increased mobility of shorter chains, ultimately making the EVA more susceptible to creep and increasing its creep compliance.
Consequently, while irradiated EVA demonstrates improved creep resistance at elevated temperatures, it exhibits higher creep values at room temperature. When selecting between irradiated and virgin material, a material engineer must consider both aspects: the enhancement in creep resistance at higher temperatures and the reduction in creep resistance at lower temperatures.
3.4. High-Temperature Creep Compliance
Figure 8 shows the creep compliance of EVA 212 as a function of time for three radiation levels (60, 120, 180 kGy). The highest creep was detected for the lowest irradiation (60 kGy). With increasing radiation level, creep compliance gradually decreases. This result implies effective crosslinking. These results are consistent with the findings of Dutta et al. who observed a significant decrease in creep of EVA/TPU blends after crosslinking by electron beam radiation [
42]. Auhl et al. observed the same trend for a higher radiation level of long-chain branched polypropylene by electron beam irradiation [
30].
Figure 9 illustrates creep compliance curves for EVA 206 and EVA 212, both irradiated at a level of 180 kGy. The instantaneous creep compliance
, represented by a spring element in the model, was approximately 4.9 MPa
−1 for EVA 206 and about 3.9 MPa
−1 for EVA 212. The subsequent creep behavior is described by a fully reversible viscoelastic Kelvin model (a parallel arrangement of a spring and a dashpot) and an irreversible viscous flow represented by a separate dashpot. After a period of 5 min, the total creep compliance values reached 12.1 MPa
−1 for EVA 206 and 8.3 MPa
−1 for EVA 212.
Both the instantaneous creep compliance and the creep compliance after five minutes are lower for EVA 212. This finding indicates a higher degree of crosslinking in EVA 212 compared to EVA 206 under these conditions. This result for EVA aligns well with our previous findings for ethylene-octene copolymers (with 17, 30, and 38 wt.% octene contents) [
43], where ethylene copolymers with a higher comonomer content exhibited lower creep compliance after a specific time. This can be attributed to the increased amount of the amorphous phase in those copolymers [
17].
When we read the values of creep compliance after 5 min shown in
Figure 10, we can plot them as a function of dose. As illustrated in
Figure 10, irradiation causes an exponential decay of these values with increasing irradiation. All the values are lower for EVA 212, indicating higher crosslinking.
The creep data were analyzed with the help of four- and six-parameter models. Initially, we tested the creep at room temperature, but the results were not conclusive.
In semicrystalline polymers, such as EVA, the crystalline lamellae constrain the amorphous chains at room temperature, and the crosslinking to lower levels is not easily detected. Therefore, our experiments were also carried out at an elevated temperature (150 °C) above the melting point of EVA. At elevated temperature, there are no crystal lamellae and the material is held together only by crosslinking. Shear creep testing was selected over tensile creep due to the expectation of lower crosslink densities, as shear deformation provided more sensitive measurements in this context.
Various mechanical models used to describe system deformation in such tests vary from basic approaches like springs or dashpots to more comprehensive ones involving numerous components [
44]. In this study, the viscoelastic behavior of the copolymers was characterized by fitting the creep compliance
values, obtained over a 300 s interval (0 < t < 300 s) and presented in
Figure 11, to both four-parameter (Equation (1)) and six-parameter (Equation (2)) models.
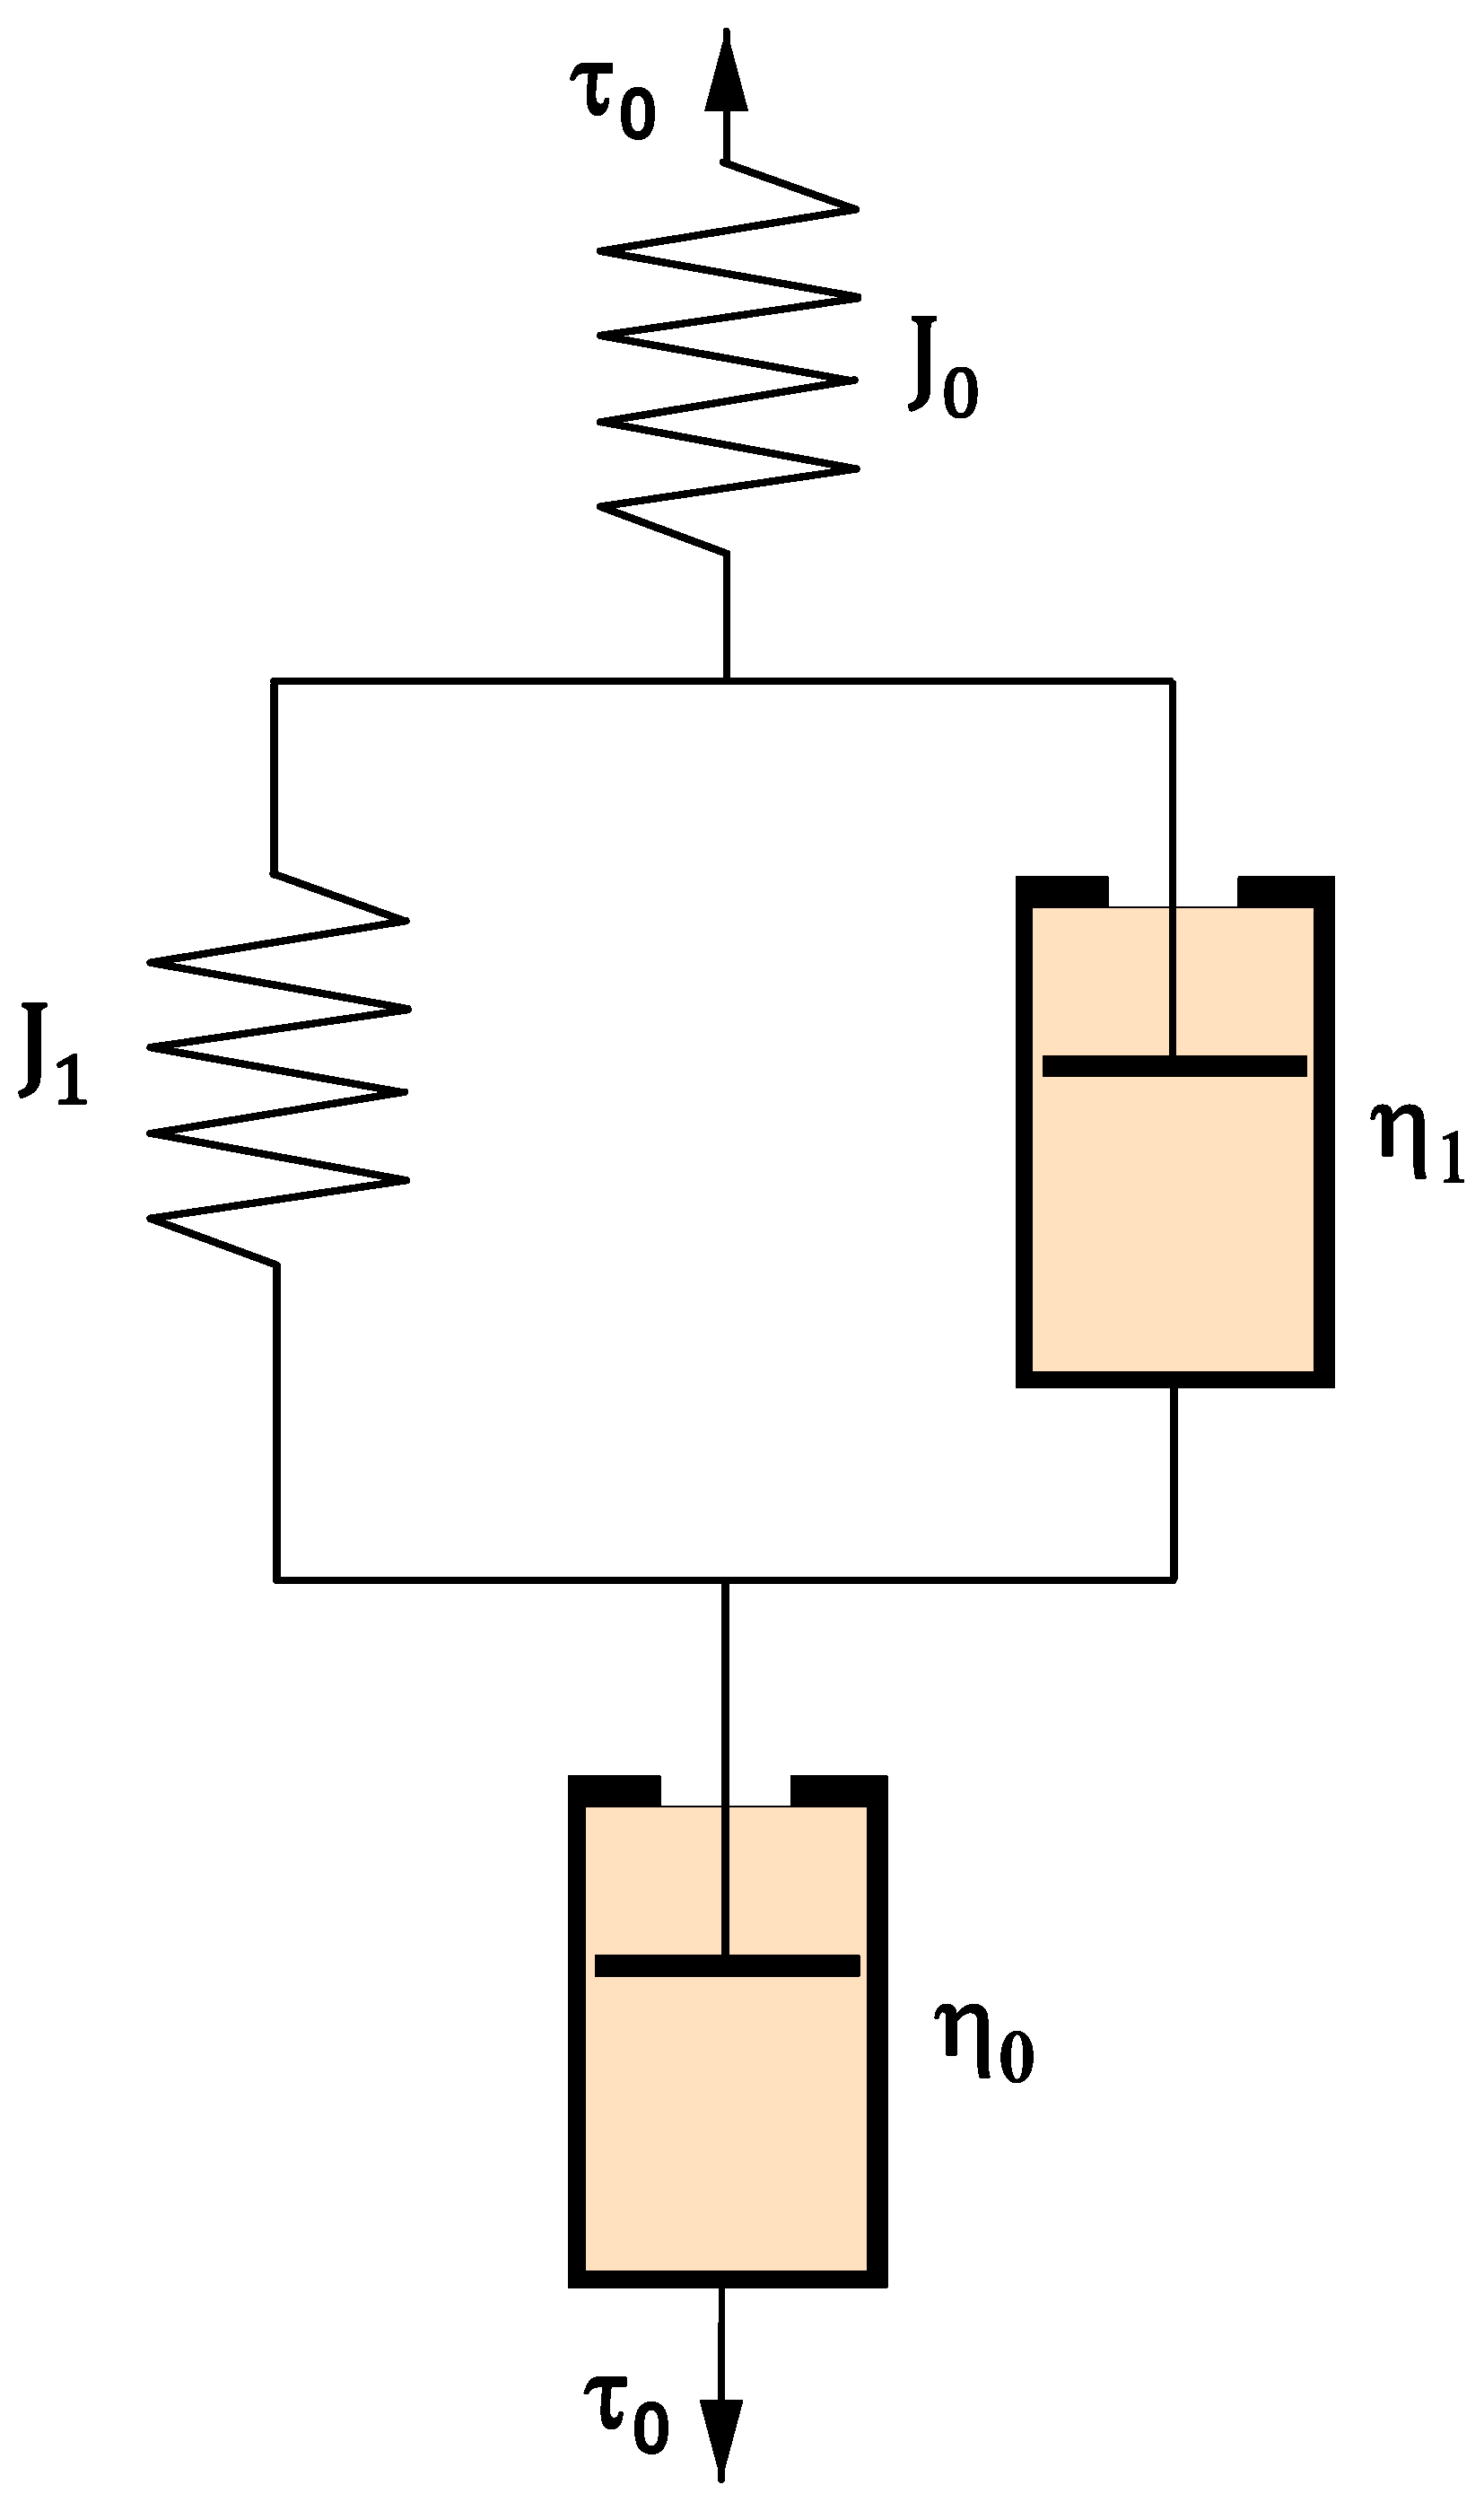
The model consists of springs with creep compliance as elastic elements and of dashpots with viscosity as a viscous element.
represents the instantaneous shear compliance of the spring and describes the viscosity of the dashpot of the Maxwell model. represents the slowed compliance of a spring and describes the slowed compliance of a dashpot for the Kelvin–Voight model.
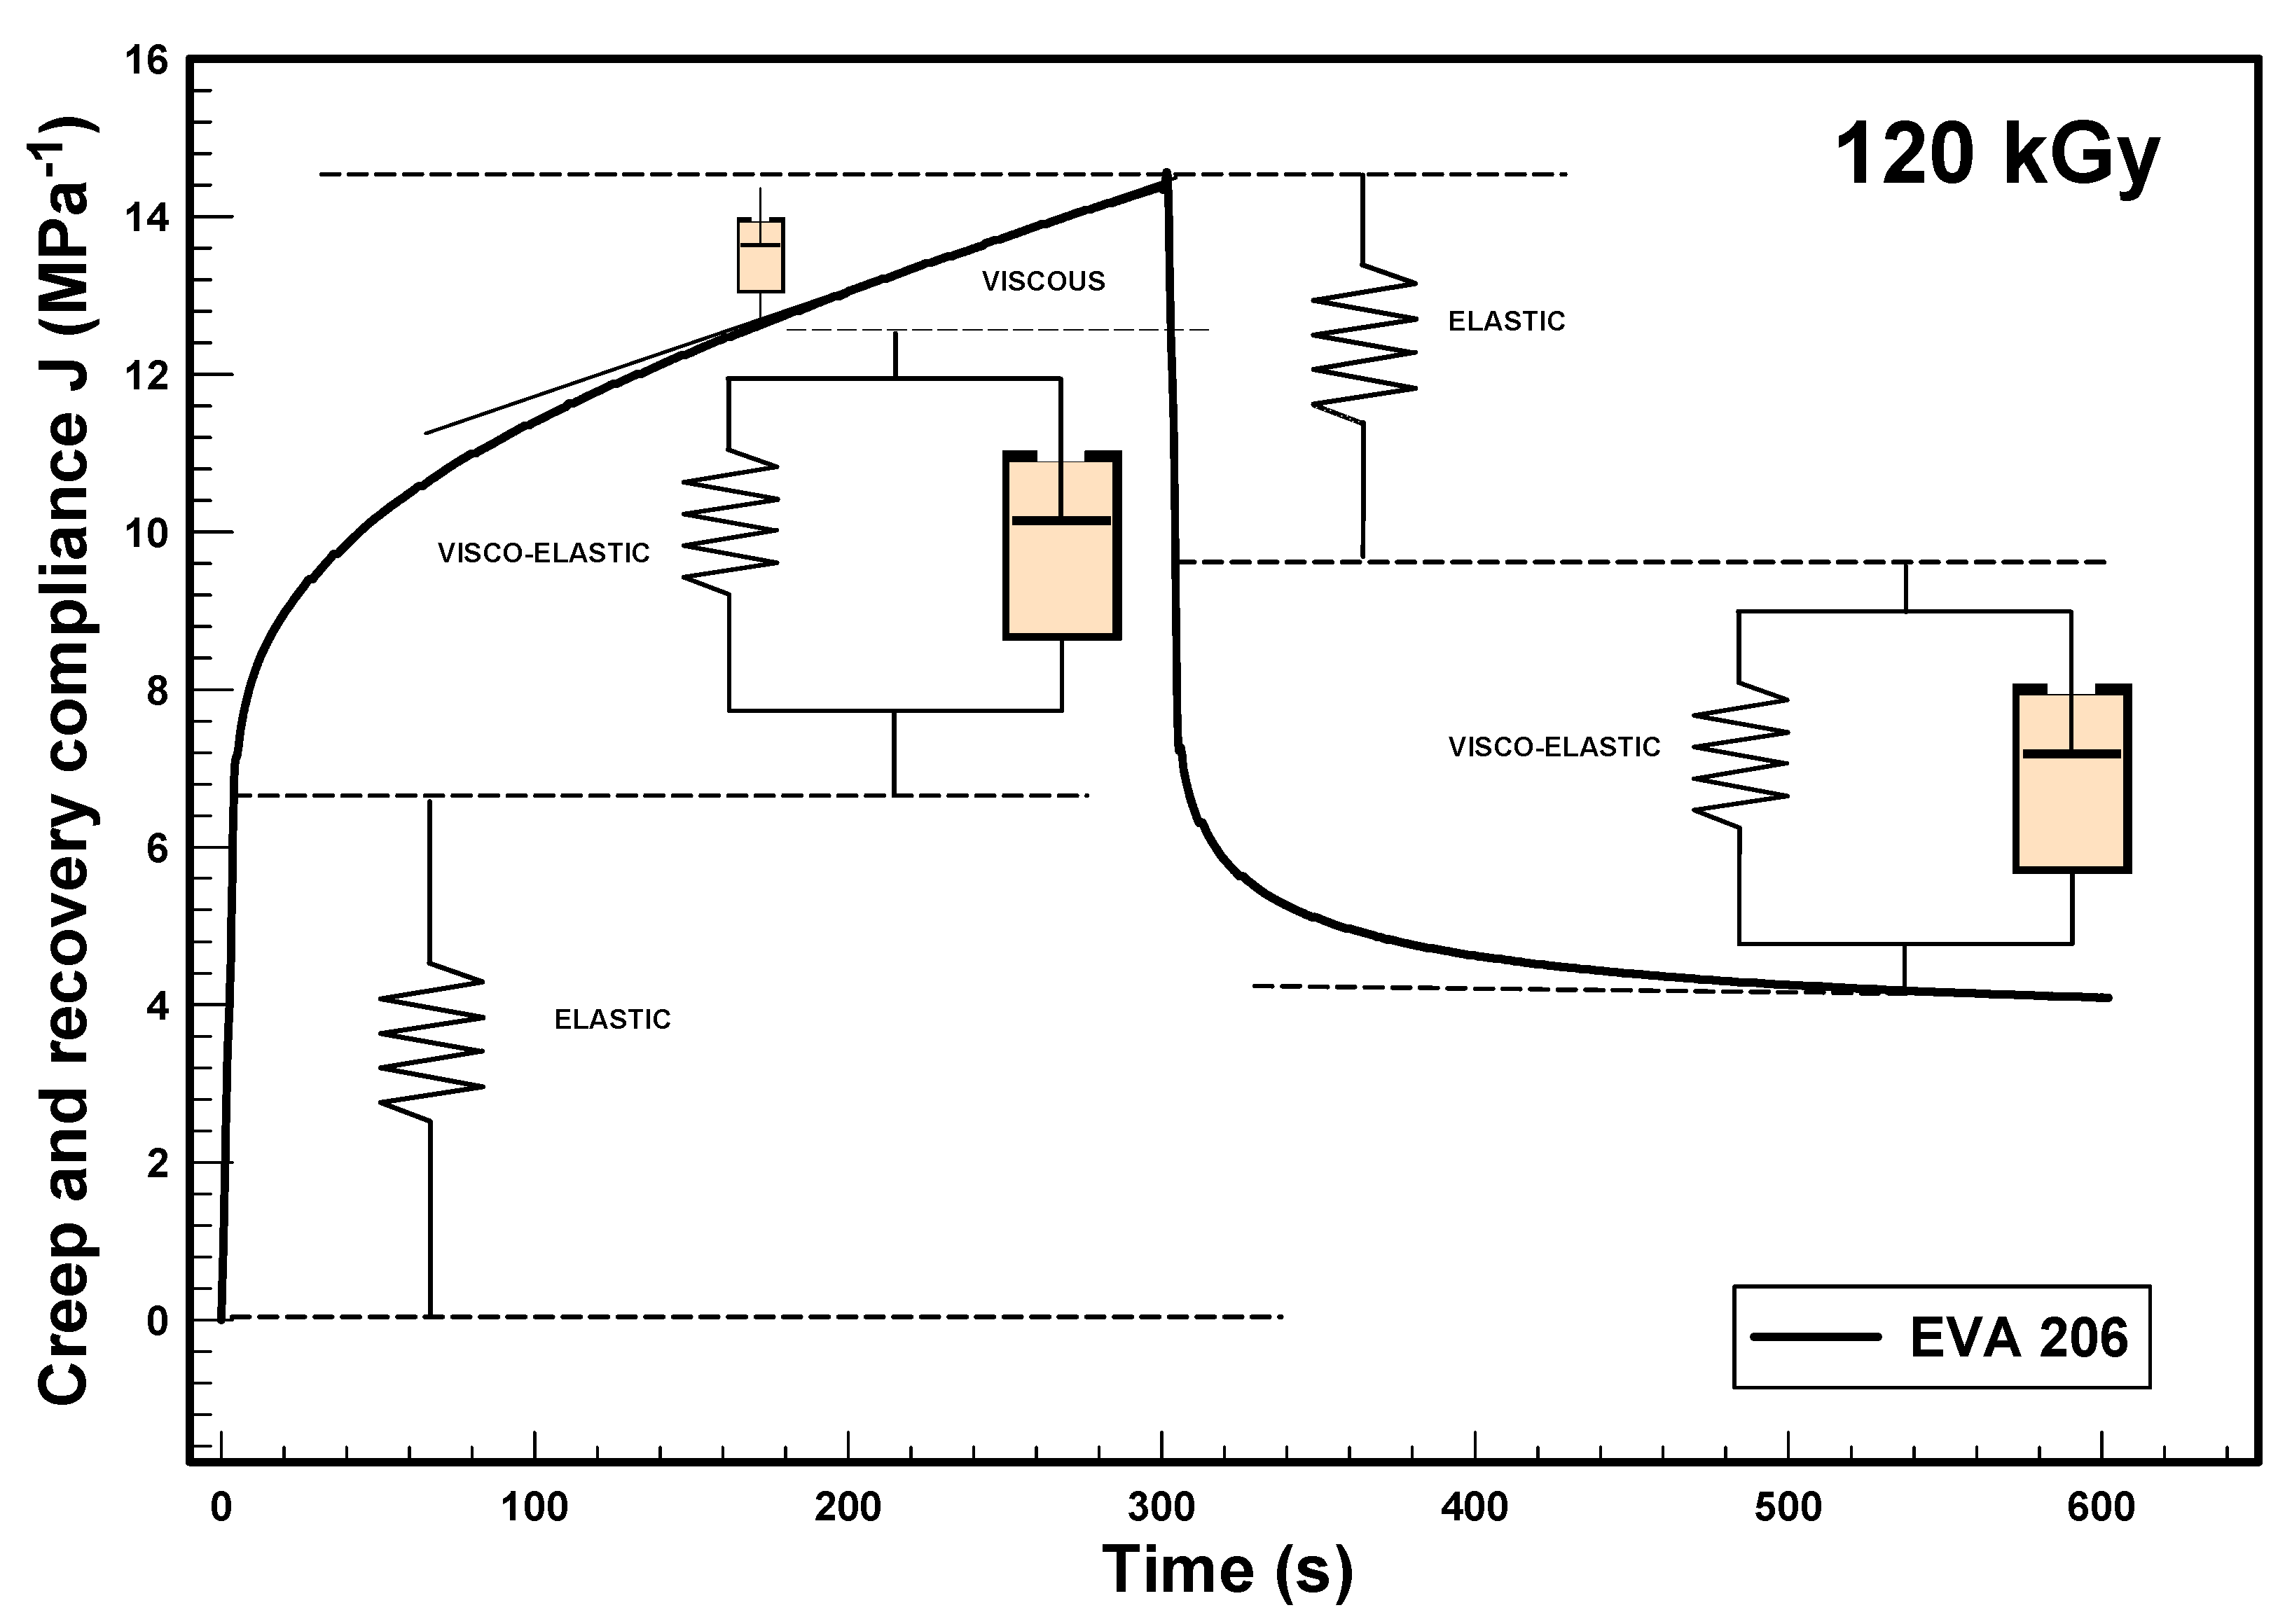
The experimental results from the creep and recovery tests, explained by the four-parameter model, are shown in
Figure 11. The creep starts with instantaneous elastic deformation, represented by a spring with shear compliance
. This is followed by slower viscoelastic behavior, described by a Kelvin model with a spring (elasticity) and dashpot (viscosity). The final part of the curve shows viscous flow, leading to irreversible deformation. After five minutes, the stress was released, and the specimen attempted to move back to the original shape. The initial recovery was fast, described by the elastic spring model, followed by slower viscoelastic movement. The viscous flow caused permanent deformation, so the sample could not fully return to its original shape. This creep and recovery curve represents EVA 206-120 kGy.
Figure 12 shows creep development over time. The curve was fitted with four- (
Figure 12a) and six-parameter (
Figure 12b) models for a more detailed description of viscoelastic behavior. Creep compliance data (represented by open circles) and the fitted curves (solid-colored lines) are shown for the EVA copolymer at 150 °C. The applied shear stress was 5 kPa (within the linear viscoelastic limit). The fitted curve used a four-parameter Burger’s model and six-parameter model.
The six-parameter curve visibly fits the experimental data better. This is because the curve for the six-parameter model passes through the first data point and more accurately follows the overall shape of the experimental points. In contrast, the four-parameter model curve ignores the first data point and does not pass through the center of the experimental points. By designing the experiments and providing the corresponding data for the response variables from the “lack-of-fit” test, the coefficient of determination (R-squared or
) was calculated for both models. The
values, presented in
Table 2,
Table 3,
Table 4 and
Table 5 confirm the visual observations. For instance, the six-parameter model applied to EVA 212 irradiated at 60 kGy (
Table 5) yielded an
value of 0.9997, indicating an excellent fit. In contrast, the four-parameter model (
Table 3) resulted in a lower
value (e.g., 0.9972), suggesting a less accurate representation of the experimental data.
At 180 kGy, the zero-shear viscosity
of EVA 212 is much higher than that of EVA 206 (100.2 Pa·s vs. 53.9 Pa·s, as shown in
Table 2 and
Table 3, respectively). This increase in viscosity with radiation dose is attributed to the increase in molar mass due to crosslinking (a characteristic rheological response of polymeric systems). The developing crosslink network restricts polymer flow at elevated temperatures.
For both EVA copolymers, the creep compliance parameters
,
, and
decrease with increasing radiation dose. In the four-parameter model, the slowing time
exhibits a linear decrease with radiation dose. Similarly, in the six-parameter model,
decreases linearly with radiation dose. However,
in the six-parameter model shows an increase with radiation dose. The viscosity parameters
,
, and
and shear moduli
,
, and
presented in
Table 2,
Table 3,
Table 4,
Table 5,
Table 6 and
Table 7 consistently increase with radiation dose across all samples.
Parameters , , and decrease with dose. Parameters , , , and increase with dose. This trend was observed for both copolymers.
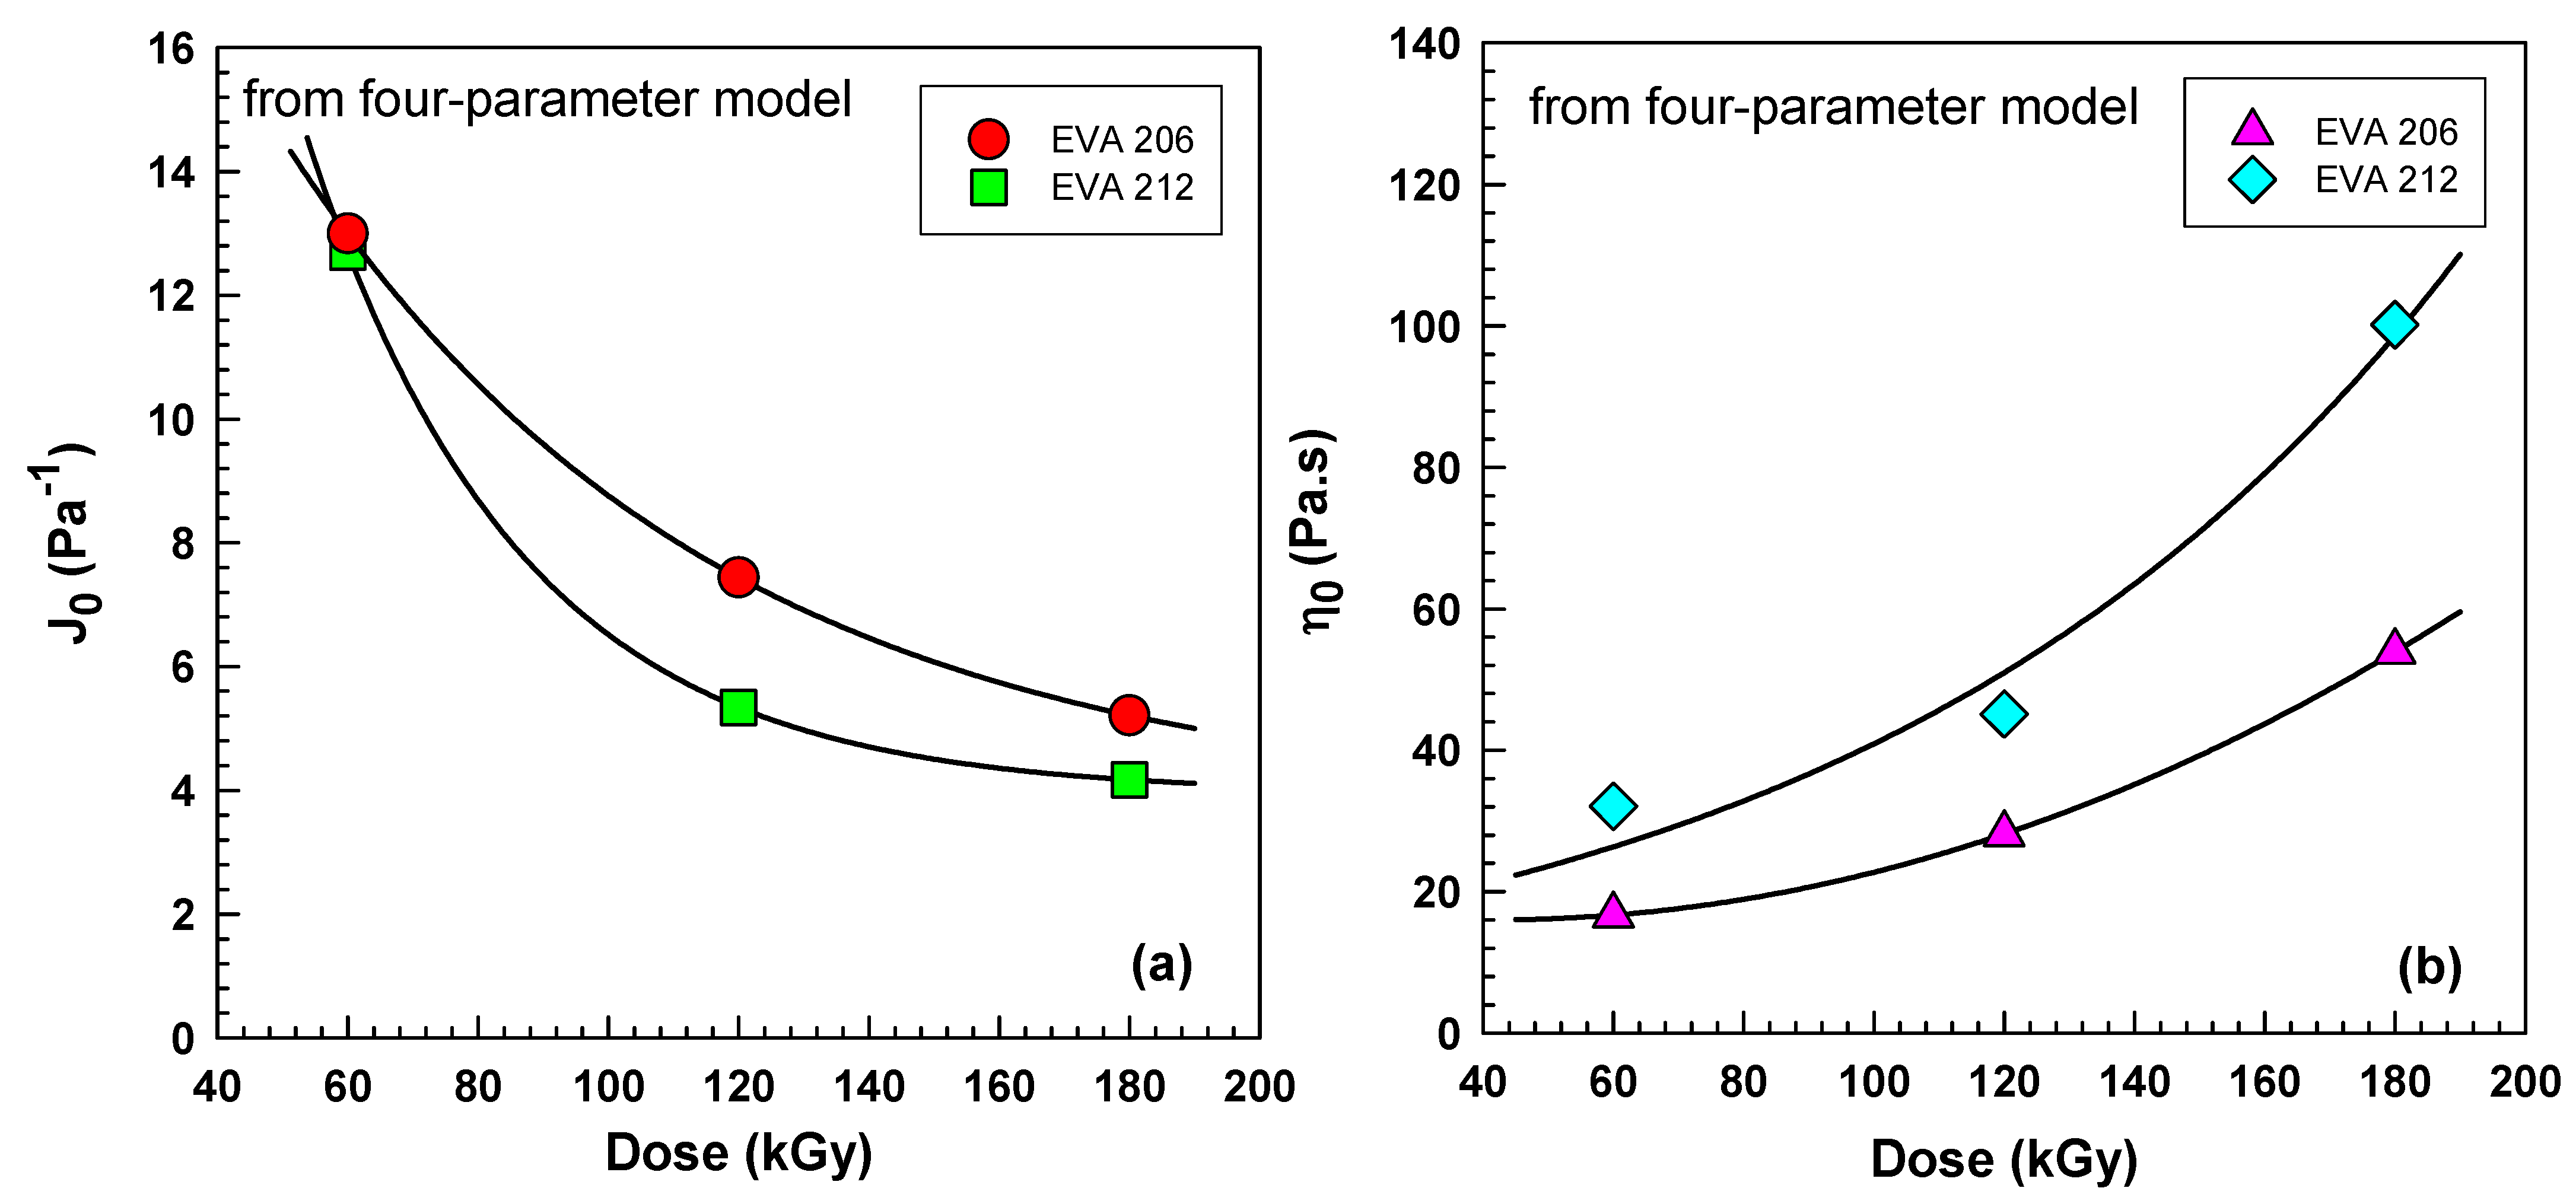
Figure 13 illustrates parameters derived from a quantitative analysis of experimental creep data obtained at 150 °C. Instantaneous creep compliance
(see
Figure 13a) represented by a spring in the model corresponds to the immediate deformation upon the application of stress. Although termed “instantaneous”, this initial deformation took approximately 3 s in the experiment and is directly related to the degree of crosslinking. A higher level of crosslinking restricts significant rapid stretching, resulting in a lower
. As shown,
decreases exponentially with increasing irradiation dose and is lower for EVA 212.
Zero-shear viscosity
(see
Figure 13b), represented by a dashpot in the model, signifies the material’s resistance to a continuous, irreversible flow over time. A higher
indicates a greater resistance to flow and ultimately leads to a smaller overall creep compliance. The data reveal that
increases with increasing irradiation dose and is higher for EVA 212.
The lower instantaneous creep compliance and higher zero-shear viscosity observed for EVA 212 suggest a higher degree of crosslinking in this material compared to EVA 206 under the tested conditions.
The four-parameter viscoelastic model contains a Kelvin model, which describes the time-dependent viscoelastic behavior of the material. The Kelvin model consists of a spring and a dashpot connected in parallel. The spring element represents the elastic component, allowing for deformation up to a certain limit, while the dashpot represents the viscous component, resisting the rate of deformation. Upon removal of the stress, the Kelvin model predicts a complete recovery to the original shape.
In this context, the spring’s stiffness, represented by the parameter
(viscoelastic shear modulus—
Figure 14a), indicates the material’s resistance to deformation. Similarly, the parameter
(viscoelastic shear viscosity—
Figure 14b) represents the material’s resistance to the rate of deformation. Higher values of both
and
signify a greater resistance to creep and are directly related to the level of crosslinking within the material. Increased crosslinking leads to higher values for both parameters.
Figure 14 demonstrates that the viscoelastic shear modulus
increases almost linearly with increasing irradiation dose and is higher for EVA 212. Likewise, the viscoelastic shear viscosity
also increases with irradiation dose and is higher for EVA 212. These trends in both
and
suggest a higher level of crosslinking in EVA 212 compared to EVA 206.
Instantaneous creep
is much smaller for EVA 212 (for 60 kGy); its values are 15.43 for EVA 206 in
Table 4 vs. 11.01 for EVA 212 in
Table 5. The instantaneous jump
indicates the elastic property and is reversible upon the removal of the applied stress [
35]. At the same time,
values (modulus) are higher for EVA 212.
The coefficient of determination
values in
Table 4 and
Table 5 were much closer to 1 in comparison to the four-parameter model. Double the value of 0.9999 was attained. The six-parameter model fitted the experimental data better. Sharma et al. also observed a very good fit to the experimental data with the six-parameter model [
33].
3.6. High-Temperature Stress–Strain
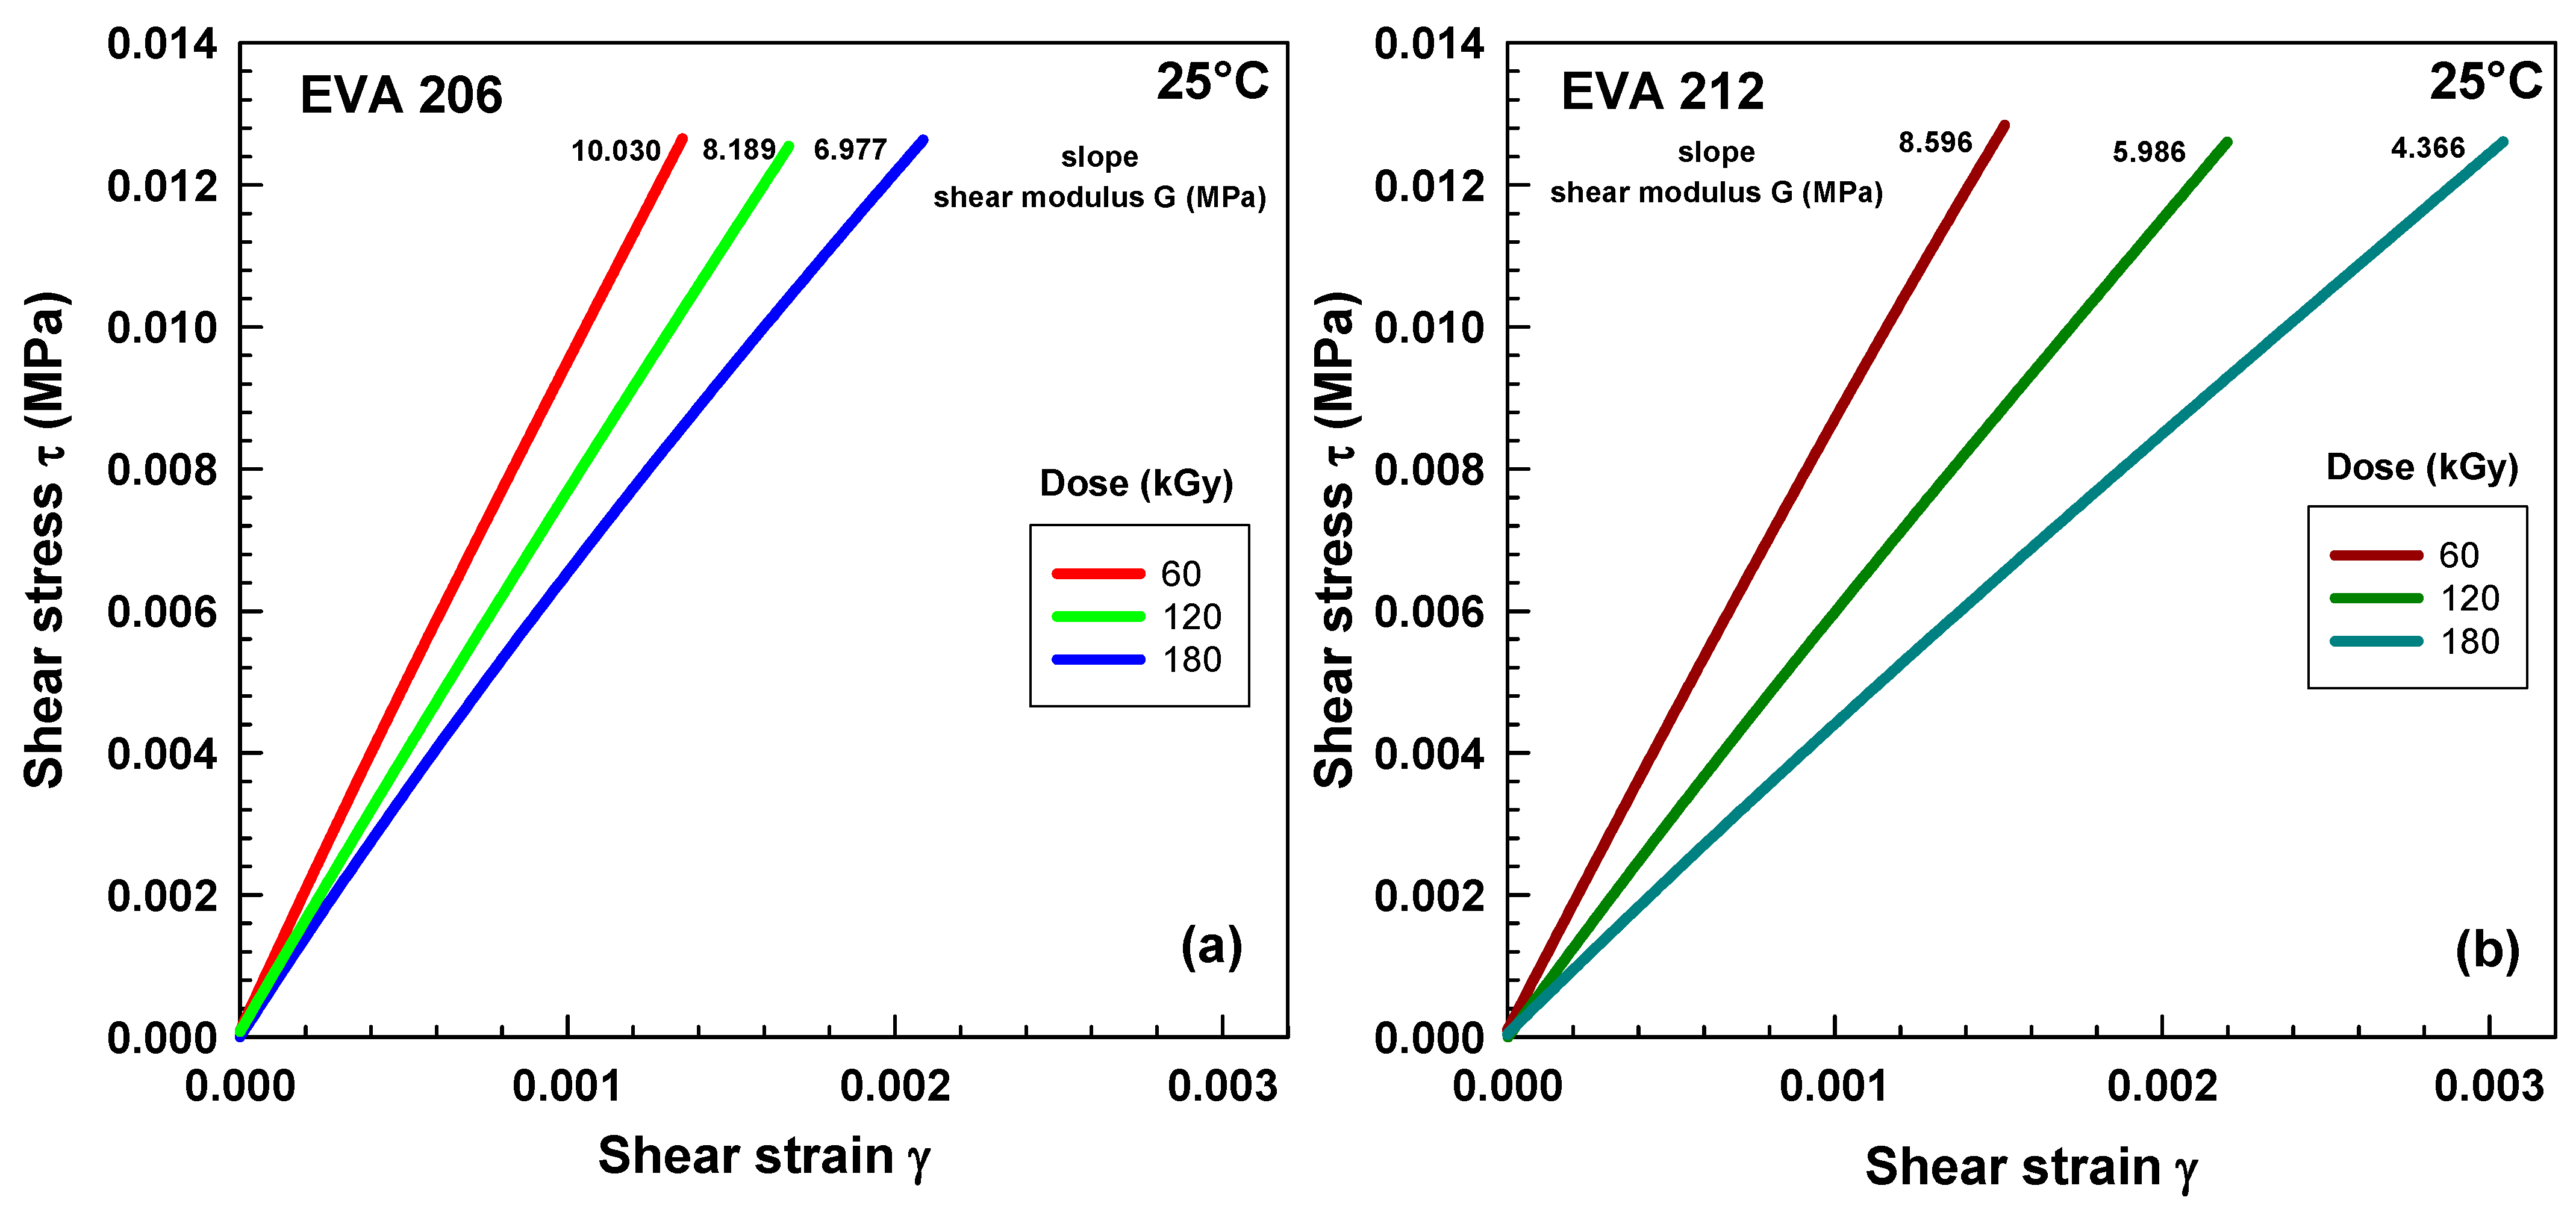
Stress–strain curves are illustrated in
Figure 16. A higher level of irradiation gives a higher slope (60, 120, and 180 kGy—red, green, and blue curves). Stress increases with a higher content of VA for the same strain, implying a higher modulus (compare light red to dark red, light green to dark green, and light blue to dark blue). The higher VA content causes a higher level of crosslinking, i.e., higher modulus.
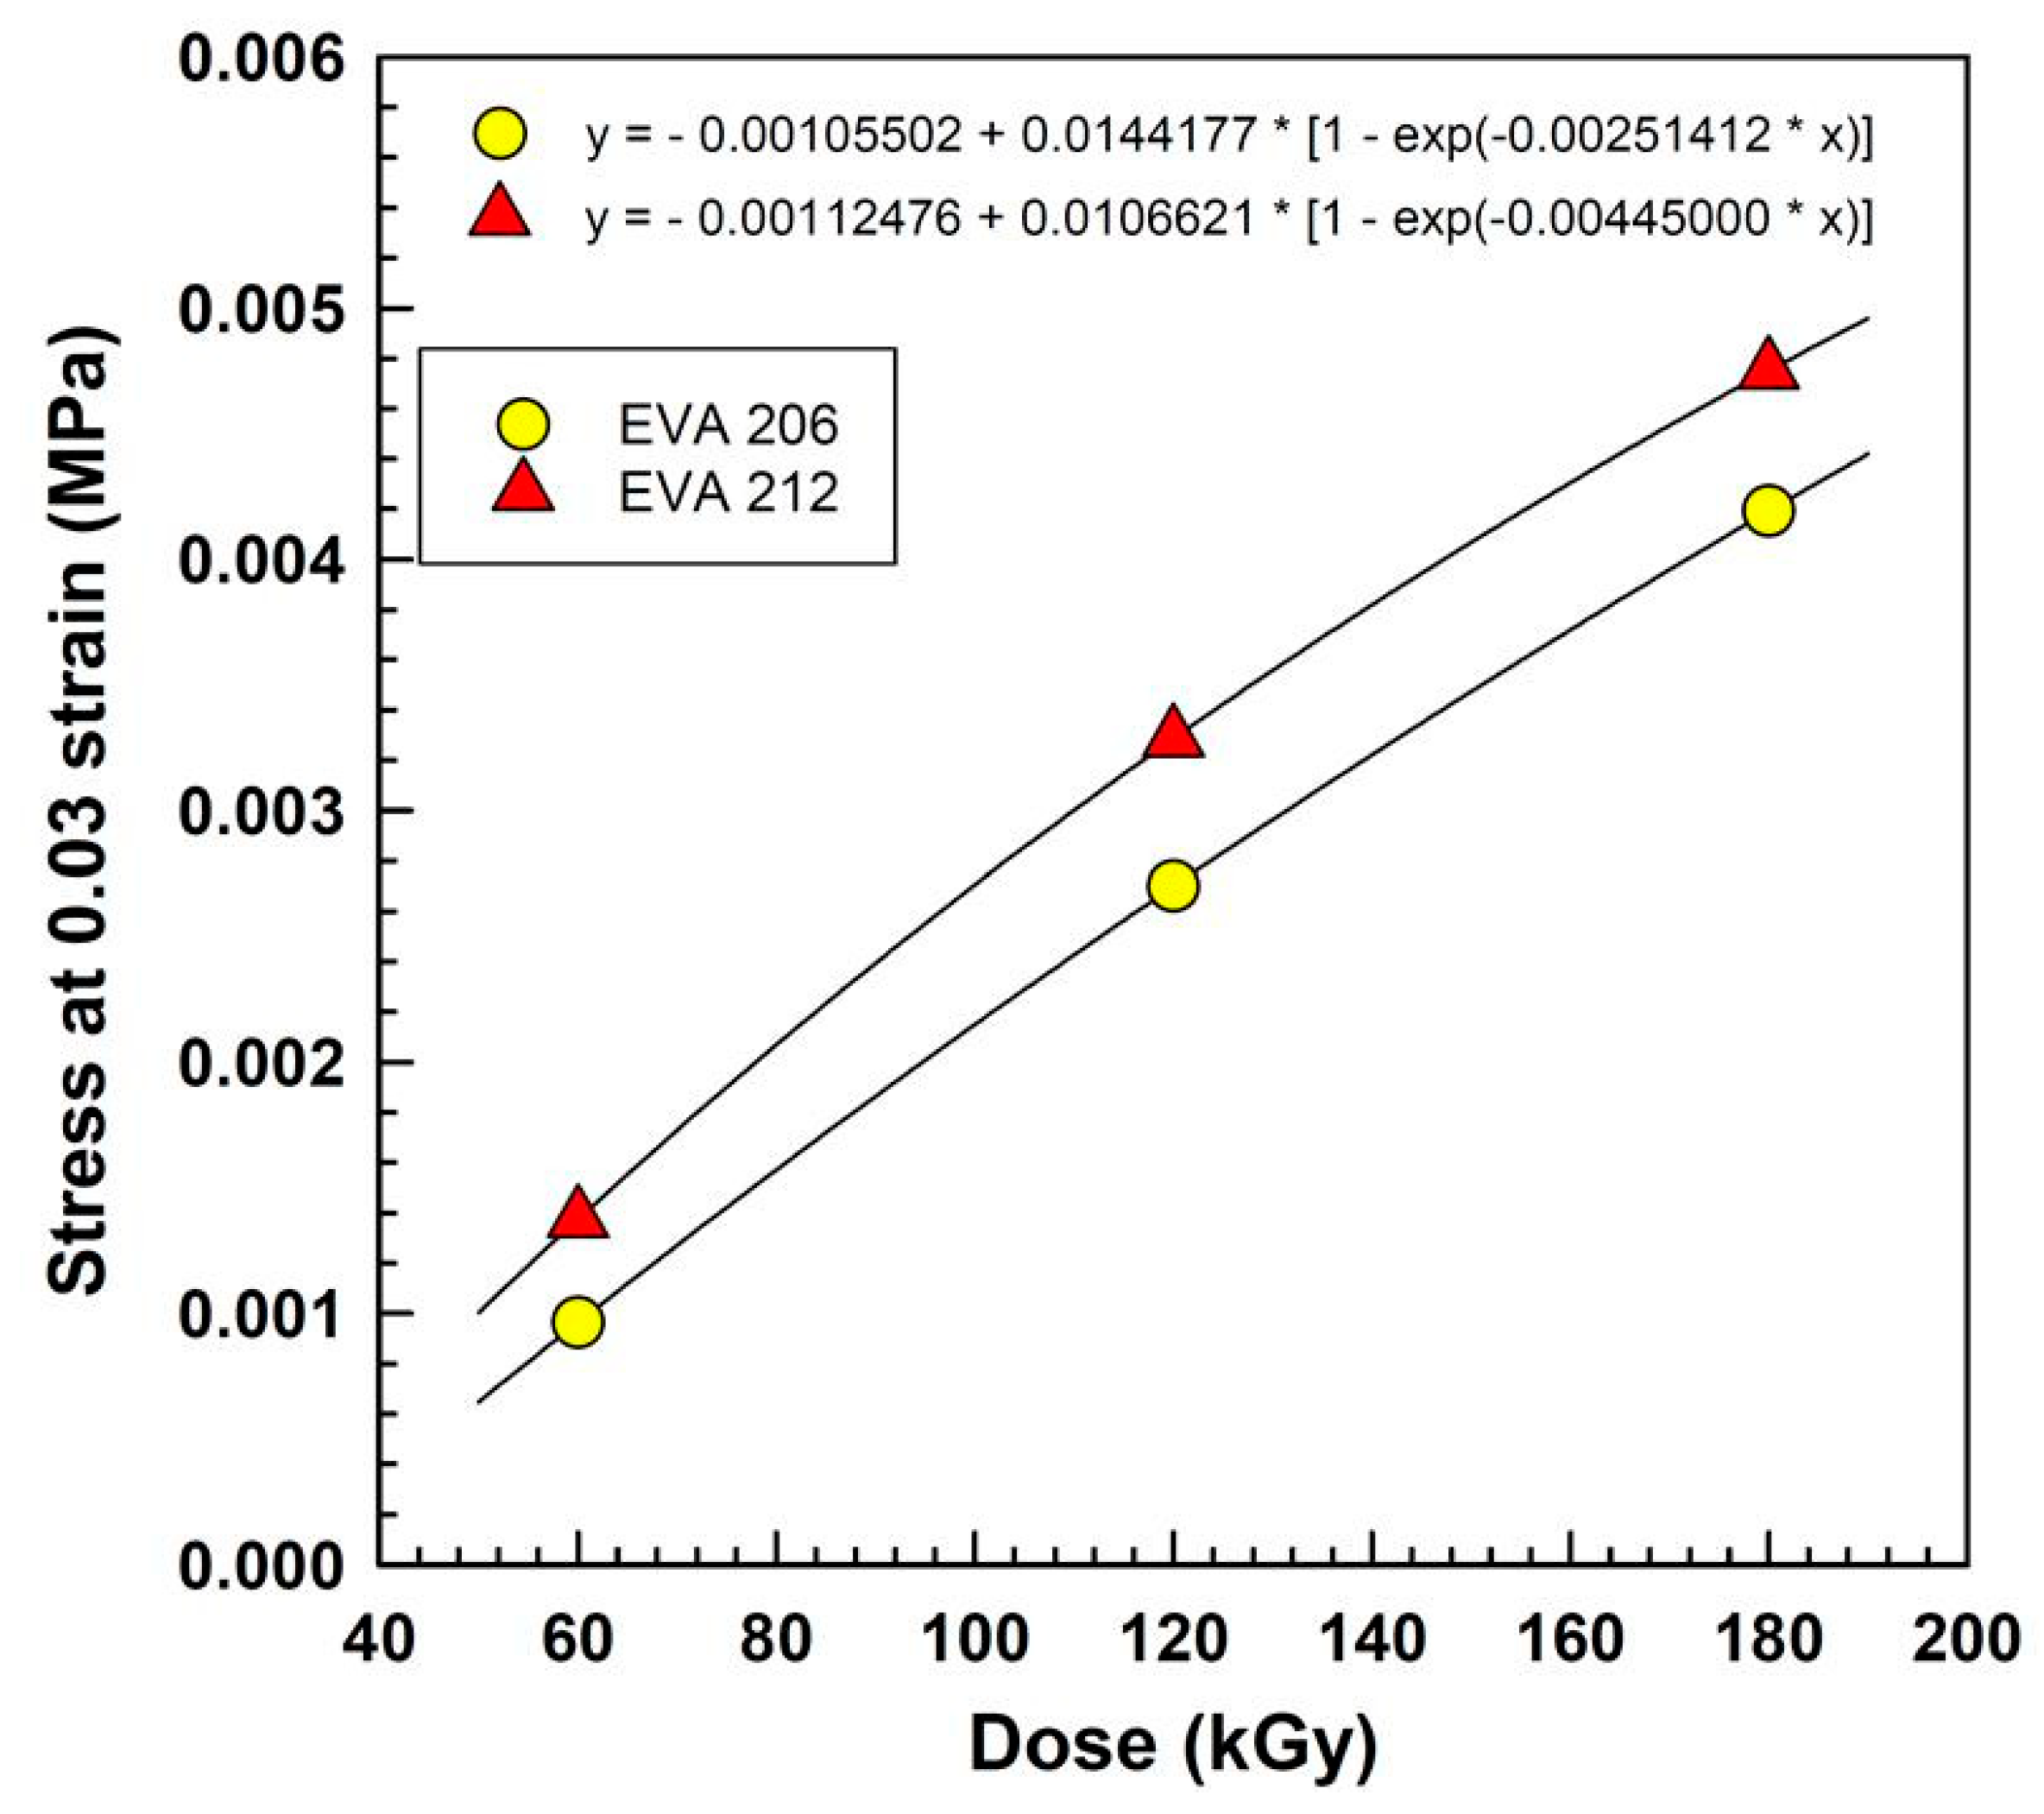
In the rubber industry, it is common practice to observe stress at 100 and at 300%, so-called M100 and M300. For plastics tested at room temperature, it is common to observe a slope at the initial part of the curve, i.e., Young’s modulus. Our measurement takes place at 150 °C, the sample is crosslinked, and its behavior during the stress–strain test resembles more rubber. Therefore, we chose to compare the stress values at a strain of 0.03 (
Figure 17). The differences are very clear using this method.
Figure 18 illustrates an increase in stress with dose. EVA 212 has higher levels of stress than EVA 206 does, corresponding well with higher crosslinking.
Figure 19a depicts the frequency sweep data of viscosity as a function of frequency in logarithmic form according to Equation (4). There are three lines representing three levels of radiation. With increasing frequency,
linearly decreases with
. With increasing radiation, the viscosities increase significantly, especially at low frequencies. This is the reason behind the increasing shear thinning parameter
listed as a slope of the lines.
Figure 19b shows the pre-exponential factor
increasing almost perfectly linearly with increasing irradiation level. Our data are in agreement with McNally et al. [
45], Durmus et al. [
38], Datta et al. [
46], and Shin et al. [
47].
Figure 20 illustrates the storage shear modulus
and loss modulus
as a function of frequency. Both moduli exhibit a linear increase with frequency when plotted on logarithmic coordinates.
Figure 20a shows the results for EVA 206 while
Figure 20b illustrates results for EVA 212.
In a typical entangled polymer system,
G′ is observed to be higher than
G″.
represents the elastic part of the modulus, which grows with increasing crosslinking. However, for the irradiated crosslinked system under investigation,
G″ values exceed those of
G′. The storage shear modulus (
G′) represents the elastic component, which increases with the degree of crosslinking. The
values are marginally elevated for EVA 212 at 60 kGy, potentially indicating a higher crosslinking density. These results are consistent with observations reported by Bai et al. [
48], Kraft et al. [
49], and Barron and Macosko [
50]. The slopes of the linear fits are lower for EVA 212, and the coefficients of determination
are approximately 0.999, with one instance reaching even 0.9999, signifying a strong correlation between the experimental data and the linear model. We have observed different trends for room temperature results compared to high temperature results. Therefore, we were compelled to search the literature and compare our results to other researchers. This comparison is listed in
Appendix C.


