Article

Electron Emission as a Tool for Detecting Fracture and Surface Durability of Tensile-Loaded Epoxy Polymers Modified with SiO2 Nanoparticles

Mechanical and Biomedical Engineering Institute, Riga Technical University, LV-1048 Riga, Latvia
*
Author to whom correspondence should be addressed.
Processes 2025, 13(5), 1546; https://doi.org/10.3390/pr13051546 (registering DOI)
Submission received: 2 April 2025 / Revised: 9 May 2025 / Accepted: 15 May 2025 / Published: 17 May 2025
(This article belongs to the Special Issue Composite Materials Processing, Modeling and Simulation)

Abstract

:
Epoxy polymers modified with nanoparticles are increasingly employed due to their enhanced performance in aggressive environments, characterized by mechanical stress, radiation exposure, and extreme temperatures. The mechanical failure of these polymers is attributed to the fracturing of atomic and molecular bonds, that subsequently excites electrons having the capability to be emitted from the nanolayer of the material. The present study demonstrates that the relationship between mechanical loading and electron emission over time serves as an indicator of surface loading and durability. By utilizing the Kinetic Nature of Solid Material Strength (KSMS) theory alongside near-threshold electron emission measurements, the article presents the behavior of epoxy polymers modified with SiO2 nanoparticles under tensile loading. The results indicate that as mechanical load is applied, photoelectron emission (PE) pulses emerge. Notably, the pulse spectrum highest frequency (fmax) correlates with the time of atomic fluctuations (τ), defined by τ = 1/fmax. Furthermore, ultraviolet (UV) irradiation of the nanoparticles prior to mixing with the polymer is shown to influence the parameter of KSMS responsible for local stress concentration. This suggests that PE is connected with the homogeneity of the composite too. The achieved results demonstrate that PE contactless measurements can be used to detect mechanical destruction of the epoxy polymer composite surface nanolayer, as well as to assess its durability and corresponding activation energy. The results presented in the article may contribute to the development of more reliable epoxy polymer composites and durability measurements of their mechanically loaded surface layer or nanofilms.

1. Introduction

Various processes utilize epoxy polymers modified with nanoparticles (EPNs). The enhanced properties of EPNs make them valuable for different applications, such as self-healing materials [1], drug delivery [2], shape memory materials [3], corrosion resistance enhancement [4], mechanically loaded materials [5], etc. EPNs have been the subject of sustained research interest, as demonstrated by the steady annual increase in related publications (Figure 1a). Notably, significant attention has been given to the strength of EPNs, with the proportion of publications on this topic rising from 20% to 45% over the past decade (Figure 1b).
The surface behavior of mechanically loaded materials is critically important, as surface defects act as stress concentrators that locally amplify mechanical stress. As a result, the presence and evolution of surface defects significantly affect the material’s durability. Monitoring the degradation of the surface nanolayer is challenging because any physical contact with the surface can potentially alter or accelerate the damage. Therefore, detecting nanolayer destruction should be performed using non-contact techniques to ensure accurate and non-intrusive assessment.
Epoxy polymers are composed of atoms bonded through covalent interactions [6]. When chemical bonds break, the material’s electrical properties change, and the electron system becomes excited. For instance, dielectric permittivity and electrical conductivity are affected [7], and phenomena such as luminescence [8] and electron emission may occur [8,9]. It is well known that dielectric permittivity and electrical conductivity inform us about material bulk-surface system properties [10]. Luminescence can originate from both the surface and the bulk [11]. However, to specifically characterize the nanosized surface layer, only electrons emitted from this nanolayer can provide relevant information about bond rupture. The energy of electrons that are excited due to bond breaking can reach up to approximately 10 eV [12], resulting in a mean free path of electrons within the solid of about 10–100 nm [13]. These electrons may be emitted directly or become temporarily trapped in localized states within the polymer matrix before being released later [14]. Trapped electrons can be stimulated to emit using photons, leading to photoelectron emission (PE). To preferentially emit electrons from localized states above the valence band, the photon energy must be close to the material’s work function (that is, the energy barrier required for electron emission [15]), typically a few eV [16]. As a result, PE electrons are emitted predominantly from the surface layer of the material, which has a thickness in the range of 10–100 nm [13].
Based on the information given above, one may predict that bond rupture due to mechanical loading could trigger a pulse of the PE current.
The emission of electrons has been observed in previous studies [8,9], where PE pulses were detected in continuously tensed EPNs [9]. The pulses of the PE current (I) began at the elastic deformation and continued until the full destruction of the material. The pulses were associated with the breaking of atomic bonds on the surface. The photon energy applied to excite electrons was less than 6 eV [9], and the mean free path of these electrons was estimated to be around 10–100 nm [13], indicating that the emission originated from a surface nanolayer with the same thickness. Since PE measurements do not require physical contact with the surface, this technique does not mechanically influence the fragile nano-layer/film under examination, preserving its integrity. As a result, PE enables contactless detection of nanolayer degradation without influencing the process itself—an advantage that is not achievable with contact-based techniques such as mechanical probes or electrical wiring.
When pulling electric fields are applied, all emitted electrons can be collected and directed to a detector [8,9], which is capable of detecting individual electrons. Consequently, every electron emitted due to bond breaking within the nanolayer with a thickness equal to the electron mean free path can be detected. This means that each bond break is registered. Therefore, PE measurements offer a uniquely high sensitivity, potentially allowing for the detection of individual bond break events.
The theory of the Kinetic Nature of Solid Material Strength (KSMS) [17,18,19] proves that the durability of the material strongly depends on the applied stress (σ). The latter is limited by the atomic bond breaking, which occurs as a thermally activated process. External forces acting on the material influence the bonds and therefore alter the activation energy required to shift atoms from their equilibrium positions. The shift of the atom is a result of its fluctuation. The average time interval (τ) between two consequent fluctuations is directly proportional to the durability of the material. The fluctuation is a thermally activated phenomenon and τ is given as follows [17]:
τ = τ 0 e x p U σ k T
U σ = U 0 γ σ
τ0—time constant (τ0 ≈ 10−13 s [17]), U(σ)—activation energy (U(σ) ≈ 1 eV [17], k—Boltzmann constant, T—temperature, U0—initial activation energy (when σ = 0), γ-coefficient which characterizes internal concentrations of stress [17]; for epoxy polymers, γ ≈ (−0.37…0.55) eV/MPa [6].
Following (1)
ln τ = ln τ 0 + U 0 k T γ σ k T
The information described above motivates research into the potential use of PE as a method for contactless assessment of the durability of the surface nanolayer of the continuously tensed EPNs. The research is expected to establish a connection between the constantly increasing stress applied to the material, its pulsating PE over time, and τ.
While the measurement of σ is a conventional procedure, τ may be estimated due to the detection of the PE pulses appearing as the result of the breaking of the bonds during loading. Following (2), a linear correlation between the measured σ and ln(τ) obtained because of PE is expected.
No studies have explored this approach. To pursue it, measurements of σ over time and PE current pulses would need to be obtained. There is no indication in the available literature that the research to connect PE, σ and τ has been undertaken. The current article aims to investigate, for the first time, the potential for photoelectron emission to serve as an indicator of the durability of the surface nanolayer of continuously tensed EPNs by establishing a linear correlation between σ and ln (τ). The achieved results may contribute to the development of more reliable epoxy polymer composites and durability measurements of their mechanically loaded surface layer and nanofilms.

2. Materials and Methods
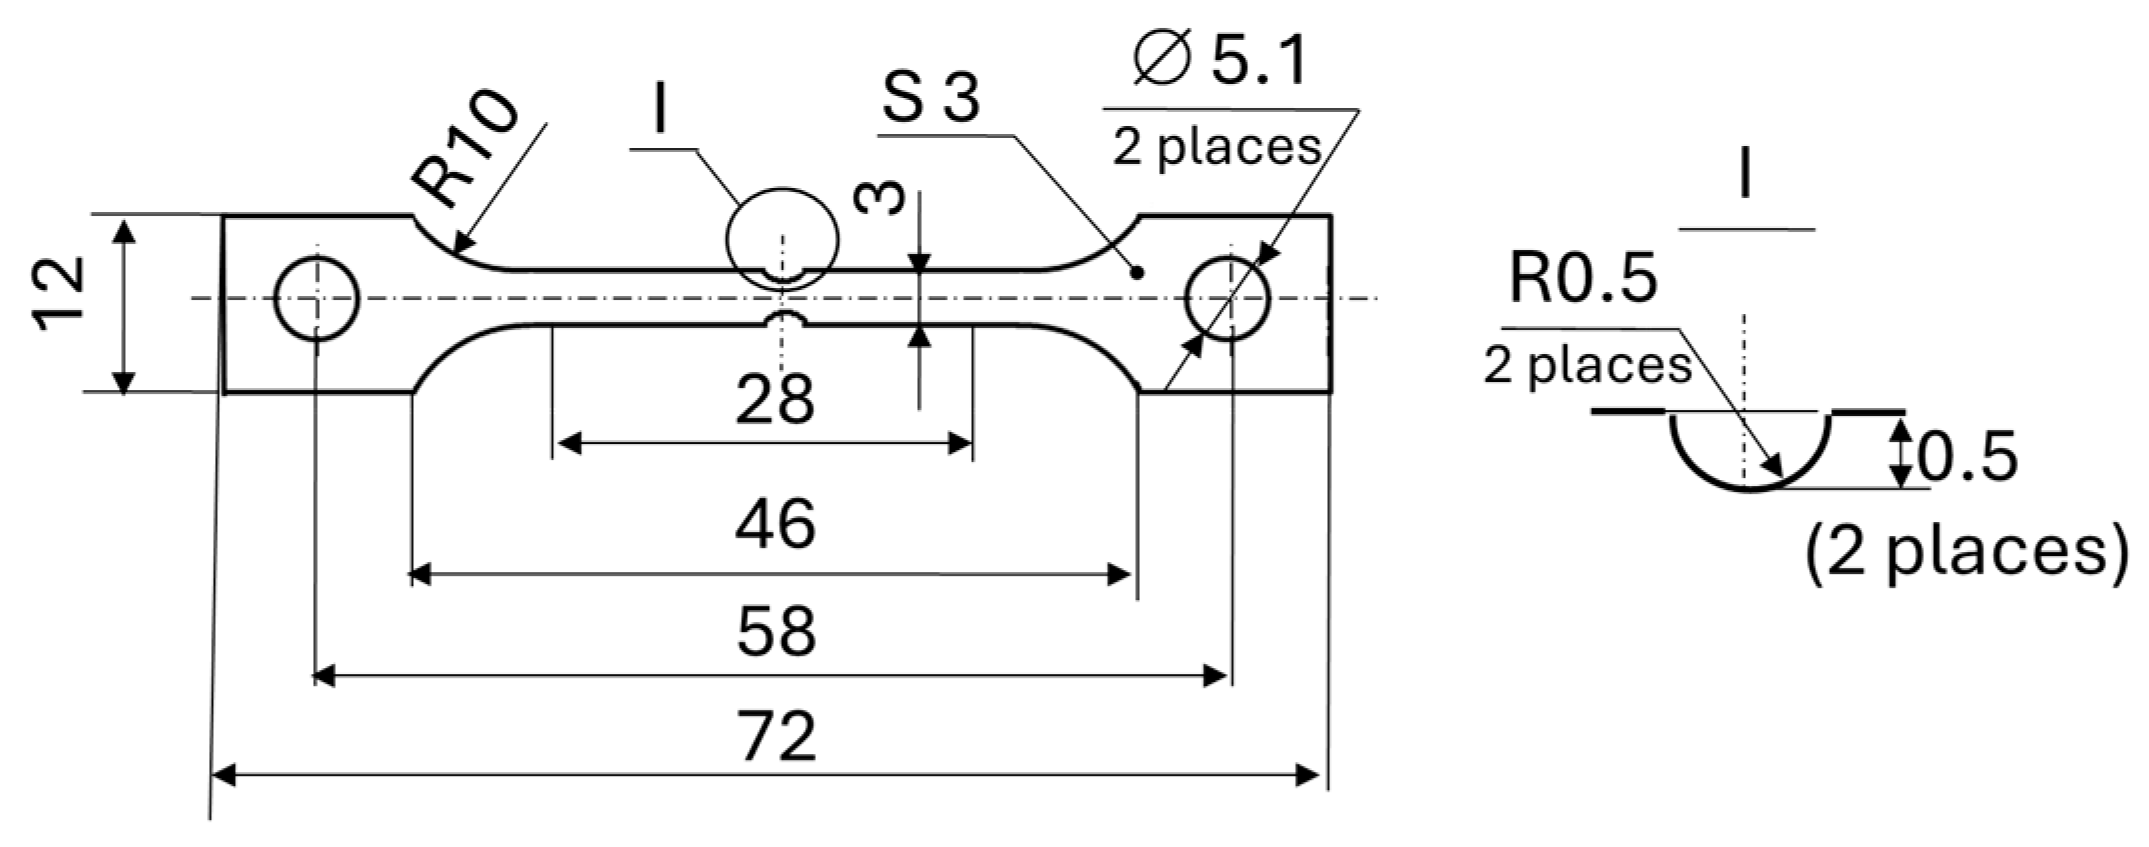
The specimens, tensile loading and detection of PE were performed as described in [9].

2.1. Specimens

The specimens, sized as shown in Figure 2, were prepared for tensile testing.
The cut shown in Figure 2 (illustrated on the right) was designed to ensure that the specimen would fail at that specific location. The light beam used for PE also illuminated the cut, enabling emission to be detected precisely at the point of specimen failure.
For the preparation of EPN specimens, Huntsman Epoxy Resin Araldite LY 1564 (Hunstman, Fraubrunnen, Switzerland) [20], Hardener Aradur 3486 (Masterbond, Hackensack, NJ, USA) [21], and SiO2 nanoparticle (NP) powder (reference number 637238, a particle size range of 10–20 nm).from Sigma-Aldrich (St Louis, MO, USA).
To verify that the mechanical properties of the specimens influence the expected correlation (1) identified using PE, the nanoparticles were irradiated with ultraviolet (UV) light before being mixed with the resin and hardener. As noted in [9], UV irradiation of NPs alters the elasticity modulus, which is directly influenced by the forces acting between the atoms or molecules of the material. UV exposure modifies the surface charge of the nanoparticles [9], which in turn affects the adhesion forces between the particles and the epoxy matrix. According to adhesion theory [22], these changes in the surface charge of NPs should result in alterations to the coefficient γ and, consequently, the value of τ (as described in Formula (1)), reflecting the UV-induced modification of NPs.
The UV irradiation was delivered as described in [9]. The Hamamatsu Photonics UV light source Lightningcure LC5 equipped with the Hamamatsu L8251 Mercury-Xenon (200 W) tube (manufacturer: Hamamatsu, Hamamatsu, Japan) radiated in a wavelength range of 220–700 nm. The NP powder was located at a distance 30 cm from the source and was exposed for 0–60 min with a flow ~4 W/cm2 at room conditions.
The epoxy resin, hardener and nanoparticles were mixed in the following weight proportions: 72.8%, 24.7%, and 2.5%, respectively. The components were thoroughly mixed using a glass stirring rod for 15 min under room conditions. Air bubbles that formed during mixing were removed by subjecting the mixture to a vacuum (Ozito 12 V Air Compressor, manufacturer Ozito, Dandenong, Australia) for 15 min at a vacuum pressure of 8.10−4 Pa.
The prepared mixture was then cast into a silicone mold, forming a square shape (156 × 25 cm2) with a thickness of 5 mm. After 72 h of curing at room temperature, the hardened compound plates were removed from the mold. The specimens were cut from these plates using a CNC milling machine (BLIN model BL-S360, manufacturer: Ningbo Blin Machinery, Piatek, Poland), with a milling cutter diameter of 2 mm having a rotation speed of 3000 rpm. Before measurement, the specimens were consequently washed in distilled water and ethanol for 2 min each. More details on the specimen preparation process are described in [9].

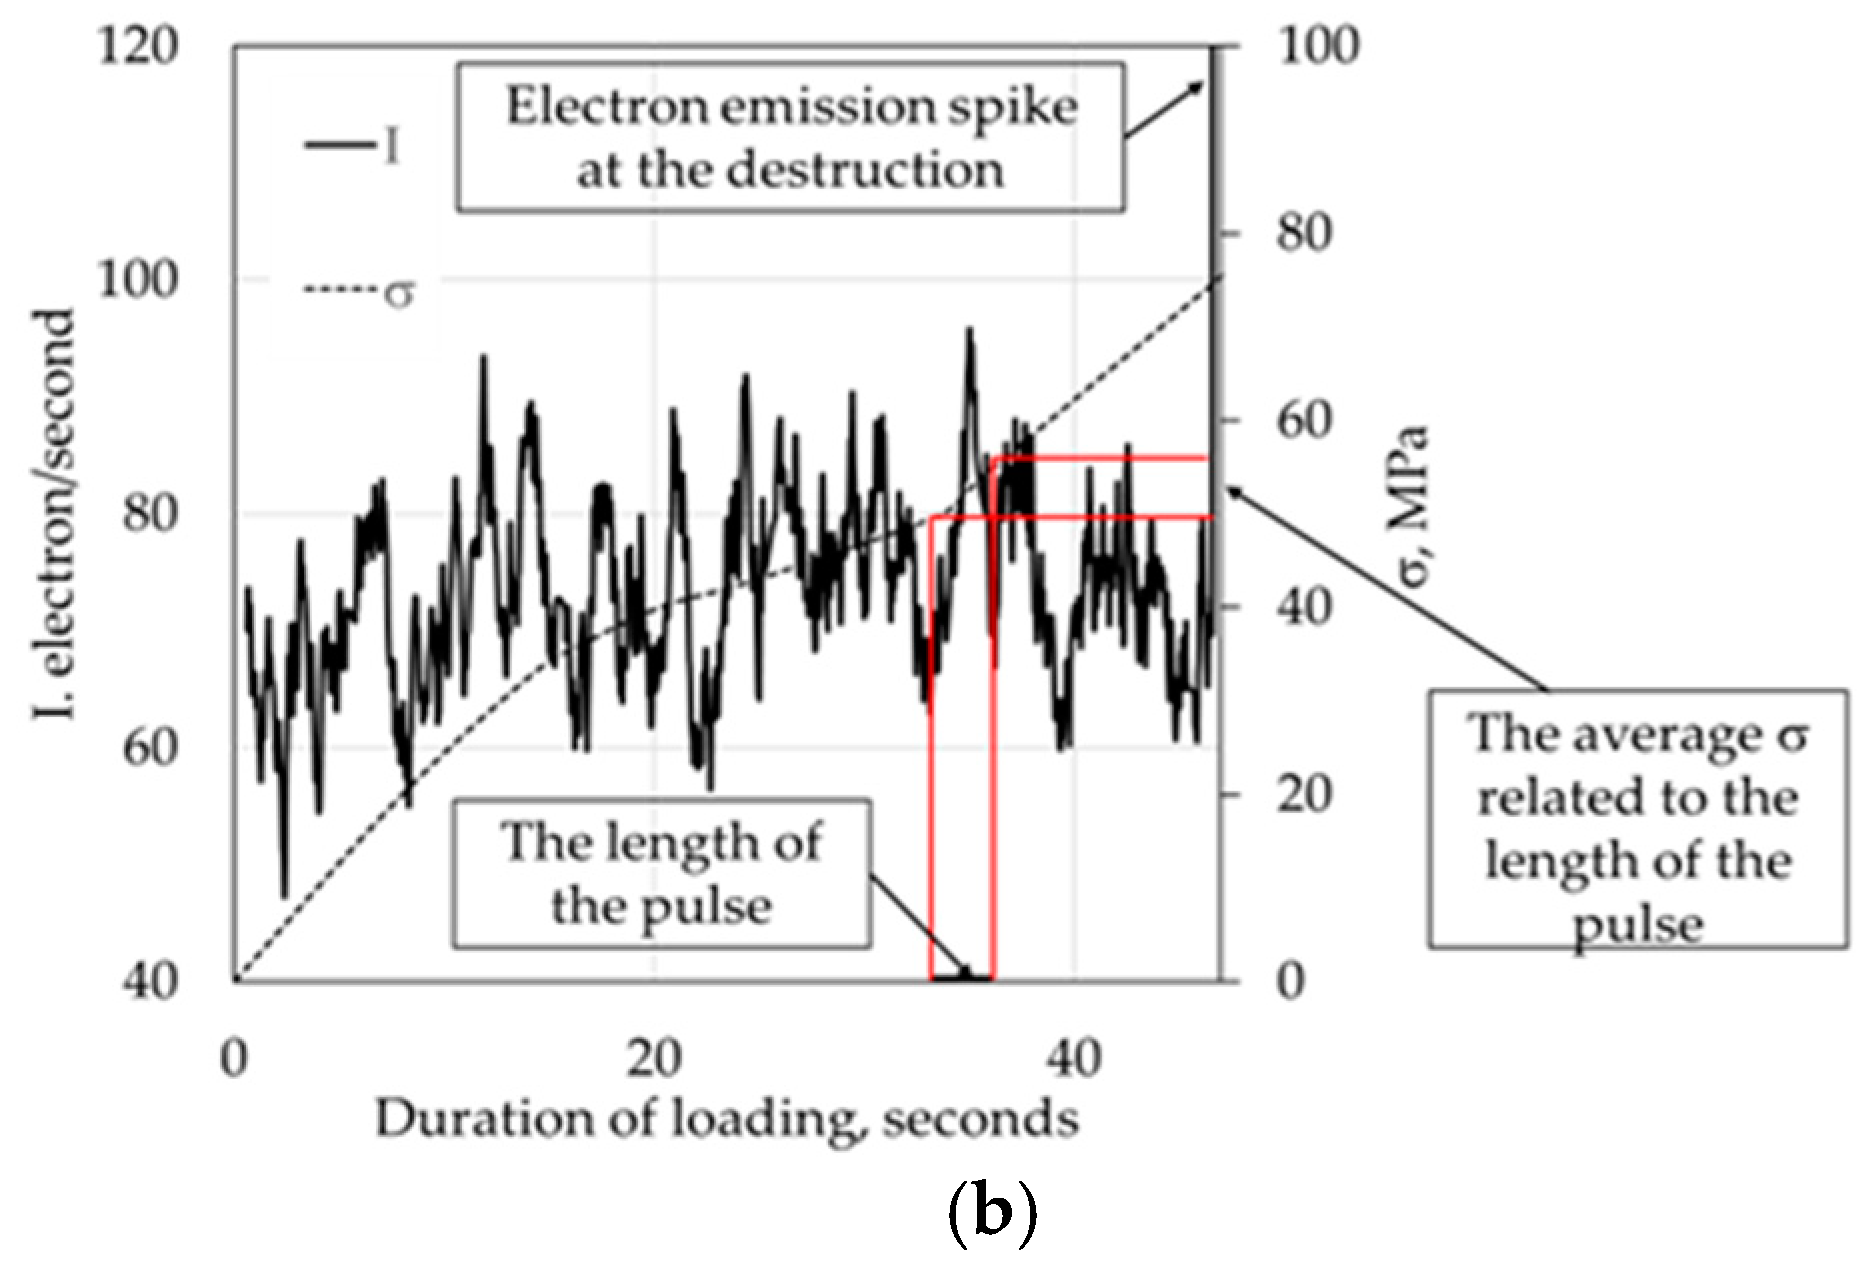
2.2. Tensile Loading and PE Detection

The tensile testing and PE detection techniques used were the same as those described in [8]. Both loading and PE detection were performed simultaneously at room temperature within a vacuum chamber (at a pressure of 10−2 Pa) of a hand-modified KIRGISTAN machine (manufacturer Machinery plant, Bishkek, Kyrgyzstan).
The tensile loading rate was set to 120 mm/h. PE was detected using the VEU-6 secondary electron multiplier (manufactured in Russia), which operates with a threshold of 10−19 A in single-electron counting mode. The signal from the detector was amplified and recorded by the Robotron 20046 radiometer (VEB Robotron, Dresden, Germany). PE was measured from the cut area (Figure 2).
To escape photoelectrons, light was supplied by the Hamamatsu Photonics Lightningcure LC5, equipped with a Hamamatsu L8251 Mercury-Xenon lamp (200 W, manufacturer: Hamamatsu, Hamamatsu, Japan). The light was filtered through an edge glass filter, which only transmits photons having the energy below a certain level [23]. The BS-12 glass edge filter (manufacturer: Photon TechSystem, Saransk, Russia) was used. The filter delivered photons with the highest energy of approximately 5.6 eV, which is close to the electron work function of the tested polymer (5.3 eV) [9].
The electric field ~ 102 V/cm was employed to collect emitted electrons and direct them to the detector. The design of the KIRGISTAN vacuum chamber, used for both loading and PE measurements, is described in more detail in [9].
Relative elongation (ε) and the value of σ were estimated as follows:
ε = l/L, σ = F/S
where l—measured deformation, L—standard length assumed as 11.3 (S)1/2 [24] (L = 28 mm), S—cross-section of the destruction location (S = 6 mm2 at the cut), F—applied load.
PE was detected over the loading range where σ and ε were approximately proportional. Figure 3a demonstrates a typical σ = f(ε) diagram measured concurrently with the detection of PE pulses (Figure 3b).
Figure 3b demonstrates that PE pulses are detectable even during elastic deformation (loading duration < 20 s). This suggests the destruction of bonds in the surface layer, leading to the emission of electrons.

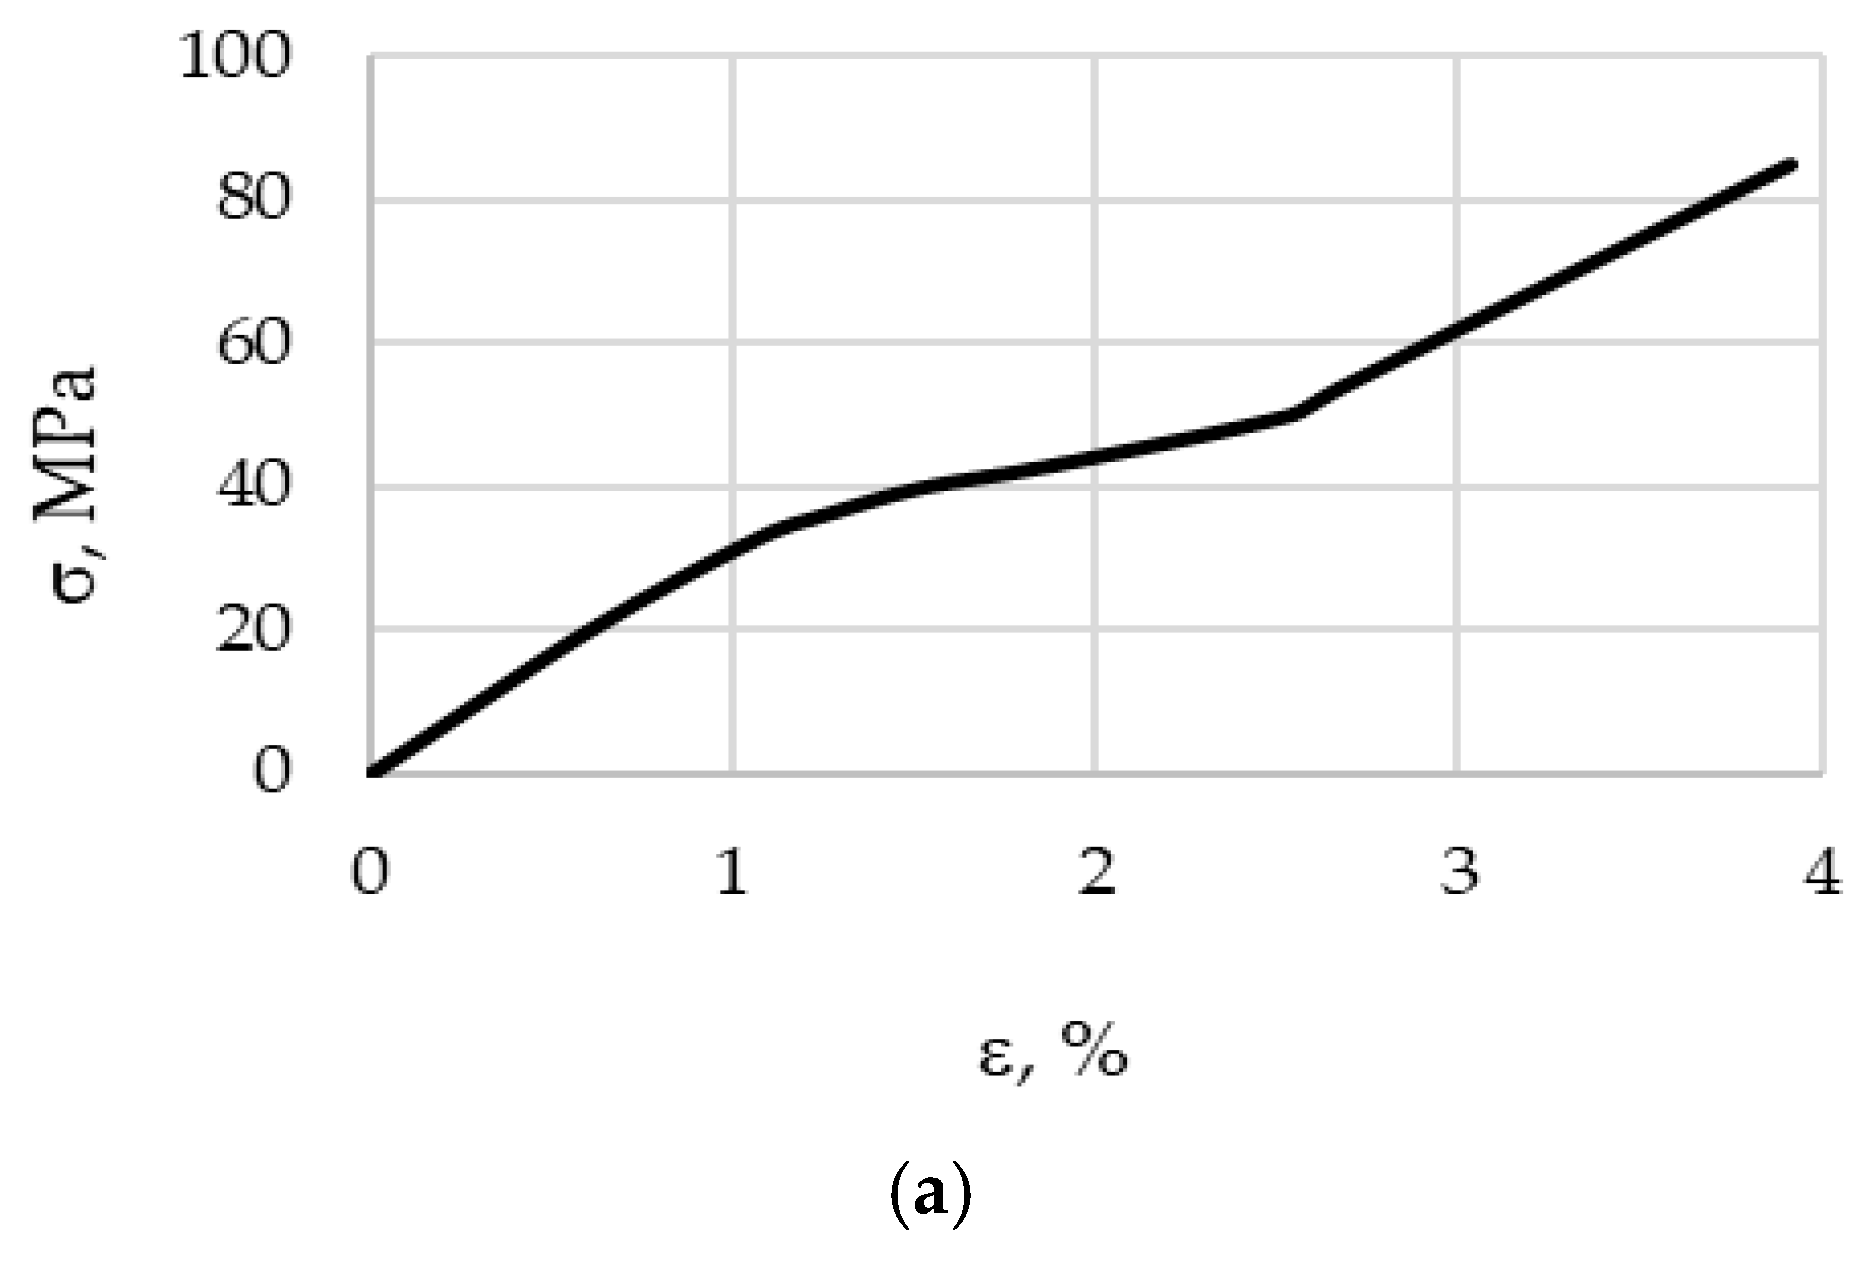
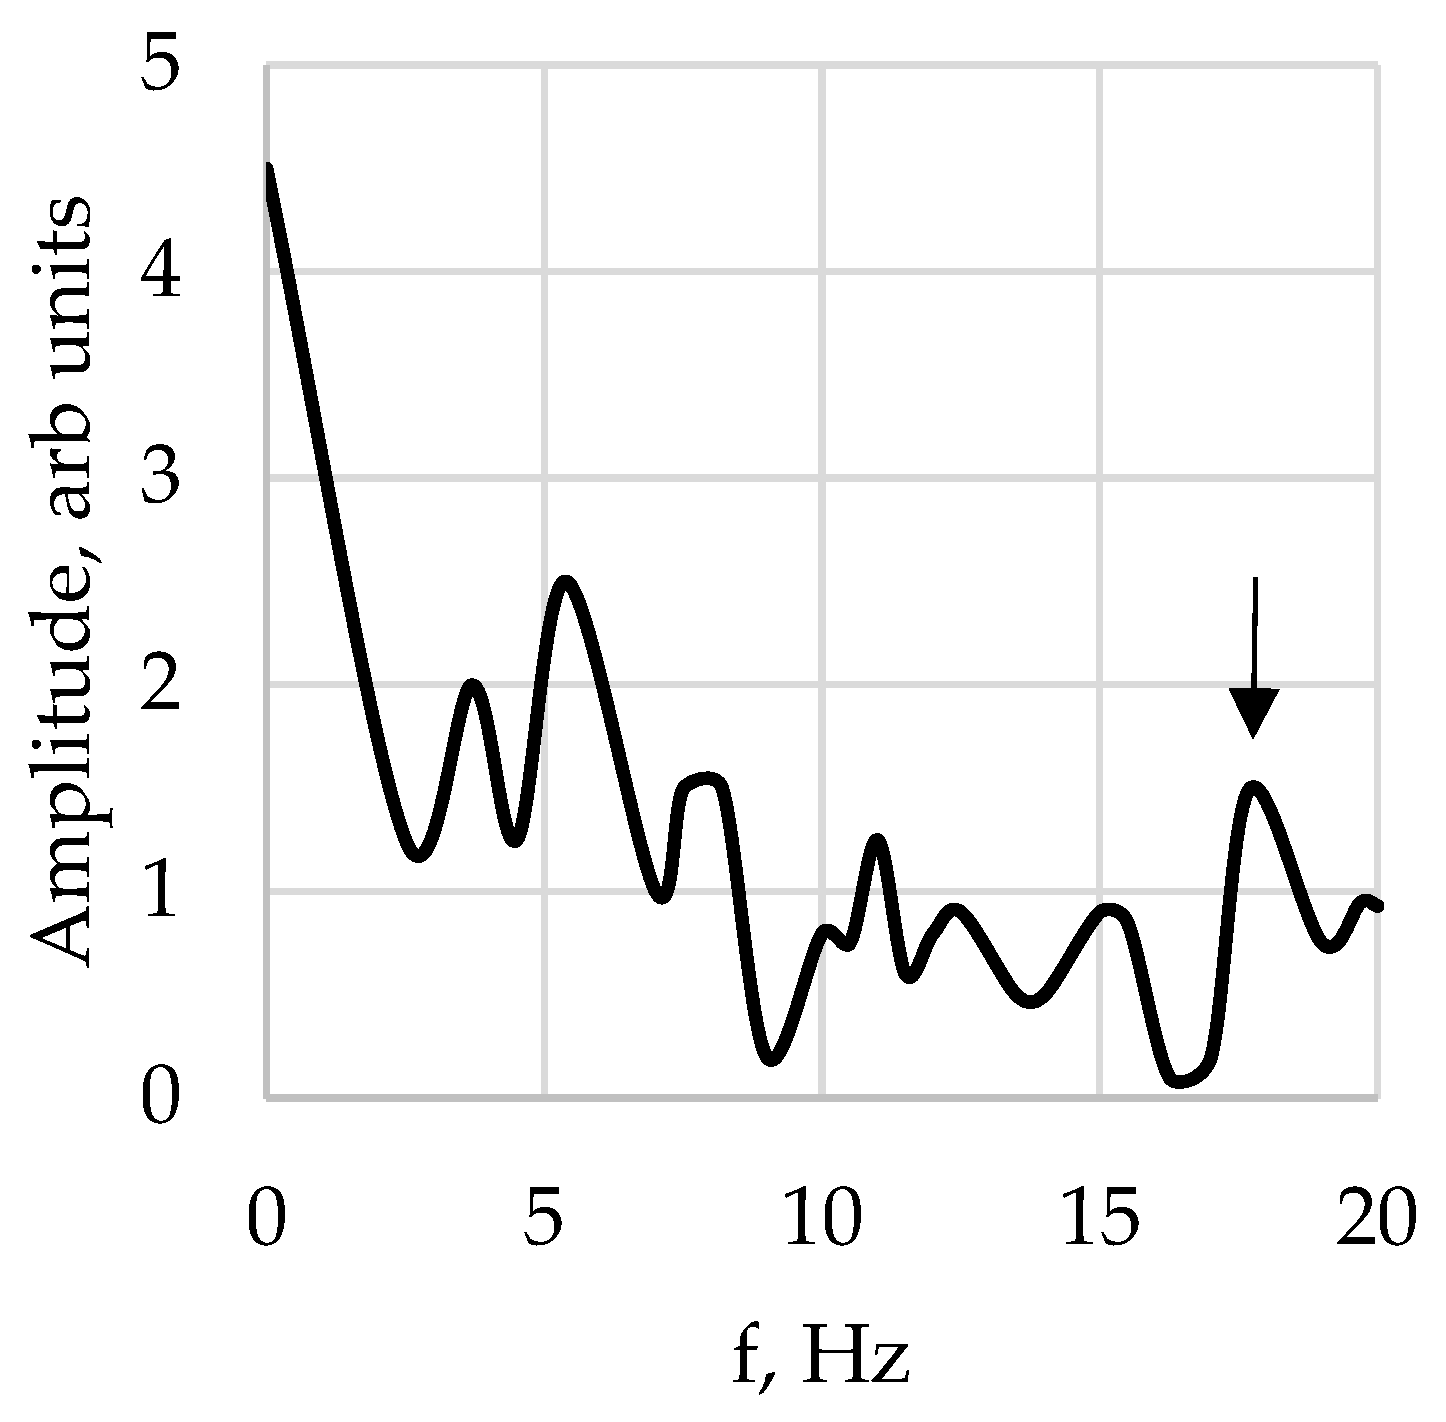
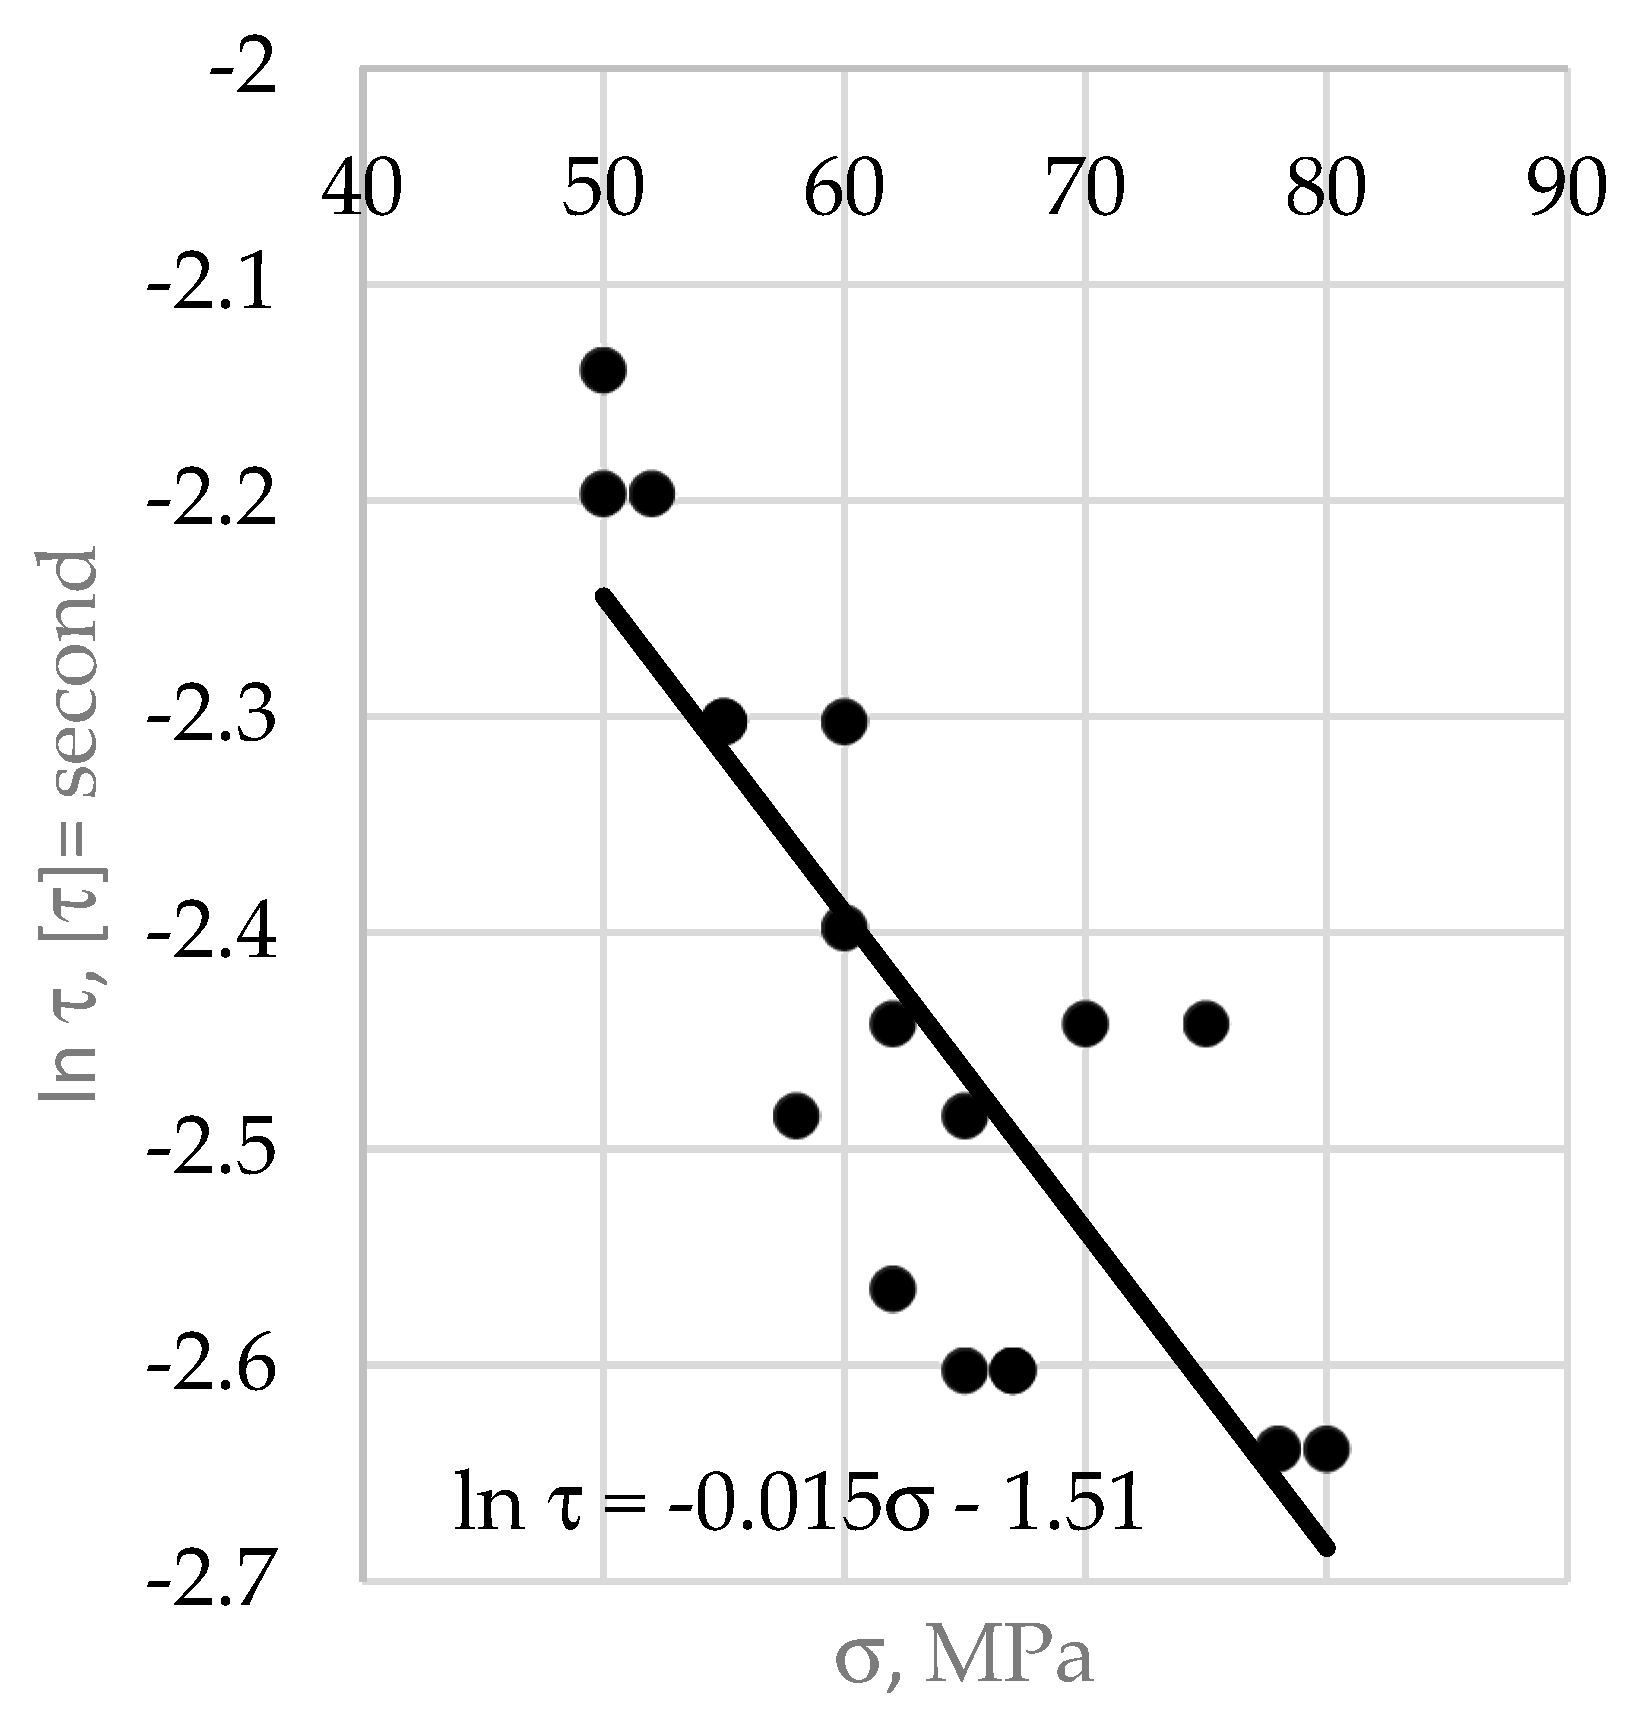
2.3. Estimation of τ and Building of τ-σ Diagram

The atomic bonds in the loaded specimen break at random locations and times. As a result, the PE pulse emitted from the surface layer contains electrons that escape at random intervals and from various locations. However, the weakest bond breaks first, followed by the next weakest, etc. The shortest time interval, Δt, between electron “flashes” characterizes the bond’s durability, i.e., τ ≈ Δt.
To estimate Δt, each current pulse (I) detected over time (t) during loading was expanded into a Fourier series, and the highest frequency (fmax) of the spectrum was determined (Figure 4). The value of Δt was then calculated as Δt = 1/fmax. The Fourier transform was performed using Origin 2018 software (OiringLab corporation, Northampton, MA, USA) To relate τ to σ, the latter was estimated as the average value for each PE pulse (Figure 3b).

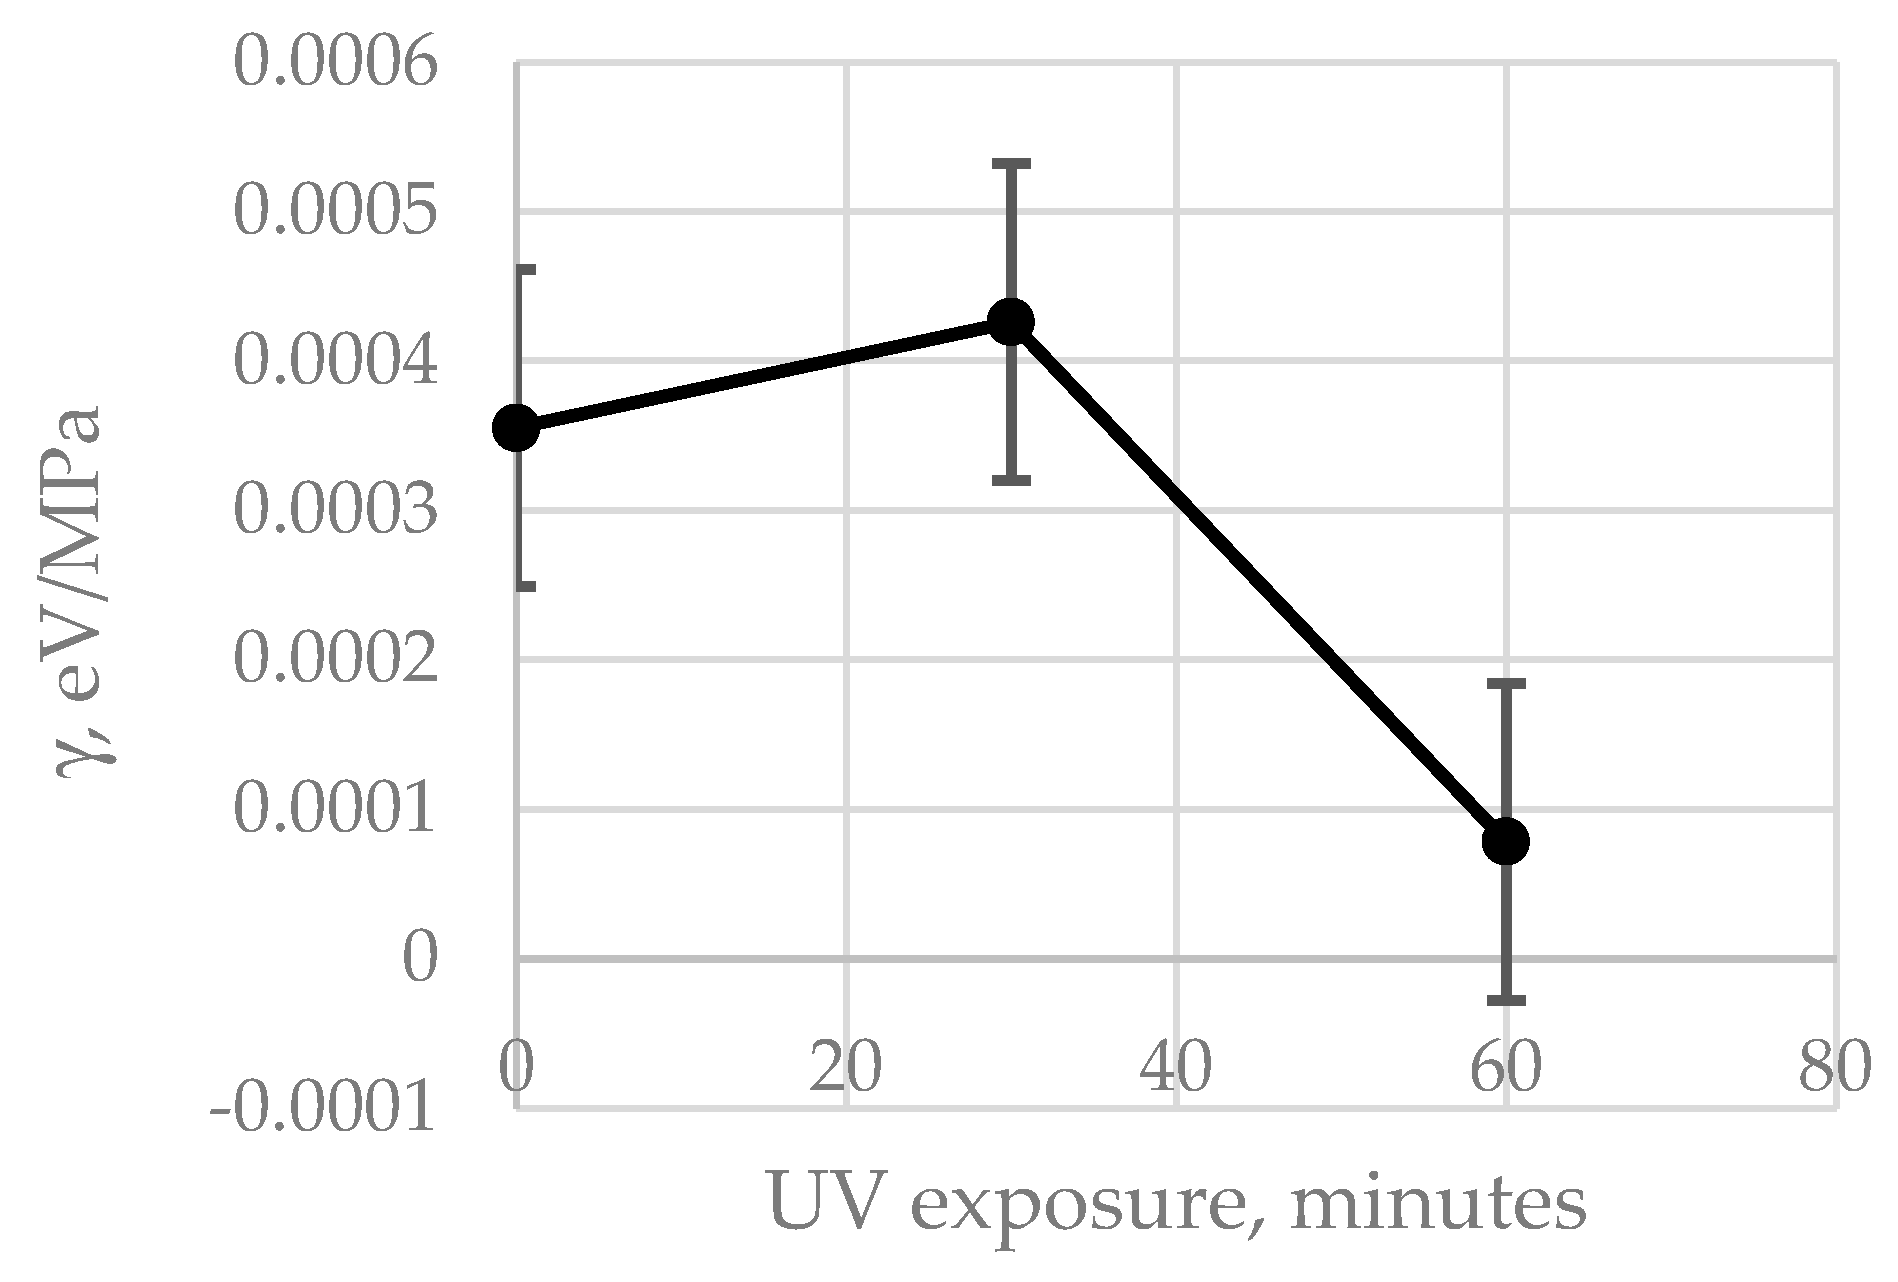
3. Results and Discussion

Figure 5 illustrates an example of the graph ln (τ)~σ, derived from the measurements and data processing described above. Linear regression was used to validate Equation (2). Before using the linear regression equations, their validity was assessed based on linearity using the correlation coefficient. For example, Figure 5 demonstrates that the data yielded a linear correlation coefficient of 0.82 with a significance of 99% [25]. Therefore, the equation was deemed appropriate and was used for further calculations.
By comparing the regression equation in Figure 5 with (2), the coefficient γ can be estimated as follows:
γ = 0.015   k T .
Under room-temperature conditions, kT =0.026 eV [26], and therefore γ= 3.9 10−4 eV/MPa. This value is within the range of γ noted in [6].
The magnitudes of U are estimated using the Formula (1):
U σ = k T ( ln τ ln τ 0 )
Using data on σ and ln τ from Figure 5, U(σ) is equal to (0.84…0.85) eV, which is in agreement with the above-indicated value of U(σ) ~ 1 eV.
Figure 6 shows that UV irradiation of NPs used to modify the epoxy polymer affects γ. Specifically, γ decreases when UV exposure exceeds 30 min. According to Formula (1), this results in an increase in the activation energy U(σ), and the durability τ tends to rise.
Because γ is directly related to the overstress coefficient q (q = σloc/σ, where σloc is the local true stress at the site of failure, and σ is the mean stress) [17], a decrease in γ after more than 30 min of UV exposure indicates that the irradiated particles make the composite more homogeneous. Reducing the number of overstress centers diminishes the probability of local damage. This is in accordance with [9], which demonstrated an increase in the elasticity module of the same composite when the particles were irradiated with UV.
The results confirm that Equation (1) and KSMS are applicable for assessing the durability of the surface nanolayer of the epoxy polymer with embedded NPs.

4. Conclusions

  • Near-threshold photoelectron emission pulses can be used for contactless detection of fractures in the surface nanolayer (10–100 nm thick epoxy polymer modified with SiO2 nanoparticles).
  • The degradation of the mechanically loaded EPNs over time can be assessed by processing PE pulses to estimate the durability of the polymer’s chemical bonds.
  • The Kinetic Nature of Solid Material Strength theory is applicable for estimating the durability of the surface nanolayer of tensely loaded EPNs.
  • SiO2 nanoparticles exposed to ultraviolet radiation and used to modify the epoxy polymer can enhance its durability.

Author Contributions

Conceptualization: Y.D.; Methodology: Y.D.; Investigation: A.E.C. and S.K.; Visualization: A.E.C. and S.K.; Writing—original draft preparation: A.E.C. and S.K.; Writing—review and editing: Y.D. All authors have read and agreed to the published version of the manuscript.

Funding

This research received no external funding.

Data Availability Statement

The original contributions presented in this study are included in the article. Further inquiries can be directed to the corresponding author(s).

Acknowledgments

The authors are indebted to Igors Kozaks for the mechanical processing of the specimens and taking care about the equipment.

Conflicts of Interest

The authors do not have any conflict of conflicts of interest. The authors do not have any personal circumstances or interest that may be perceived as inappropriately influencing the representation or interpretation of reported research results. The funders had no role in the design of the study; in the collection, analyses, or interpretation of data; in the writing of the manuscript; or in the decision to publish the results.

Abbreviations

The following abbreviations are used in this manuscript:
EPNsEpoxy polymer modified with nanoparticles
EPNSsPublications connected the strength of epoxy polymers modified with nanoparticles
KSMSKinetic Nature of Solid Material Strength theory
NPsNanoparticles
PEPhotoelectron emission

References

  1. Du, G.; Li, Q.; Zhou, F.; Zhang, X. Self-lubricating and wear self-healing of polymer composites reinforced with bifunctional mesoporous silica nanocontainers. Tribol. Int. 2025, 207, 110602. [Google Scholar] [CrossRef]
  2. Lin, Y.; Wang, B. pH-responsive paclitaxel prodrug encapsulated in a polypeptide-chitosan polymer delivery system for osteosarcoma treatment. Carbohydr. Res. 2025, 551, 109414. [Google Scholar] [CrossRef] [PubMed]
  3. Collado, I.; Vázquez-López, A.; Fernández, M.; de la Vega, J.; Jiménez-Suárez, A.; Prolongo, S.G. Nanocomposites of sequential dual curing of thiol-epoxy systems with Fe3O4 nanoparticles for remote/in situ applications: Thermomechanical, shape memory, and induction heating properties. Adv. Compos. Hybrid Mater. 2025, 8, 199. [Google Scholar] [CrossRef]
  4. Rezaei, M.A.; Naderi, R.; Mahdavian, M. Dopamine-loaded carbon hollow spheres: A novel approach for enhanced active corrosion protection in polymer coatings. Prog. Org. Coat. 2025, 201, 109115. [Google Scholar] [CrossRef]
  5. Boobalan, V.; Sathish, T.; Madan Ananda Kumar, L. Enhancing the morphological and mechanical performances of basalt/glass fiber/polymer composites modified with hybrid MWCNTs and SiO2 nanoparticles. Interactions 2025, 246, 30. [Google Scholar] [CrossRef]
  6. Voronkov, A.G.; Yartzev, V.P. Epoxy Polymers for Repairing and Protection of Building Constructions; Tambov State Technical University: Tambov, Russia, 2006; Volume 68. [Google Scholar]
  7. Zhang, W.J.; Du, B.X.; Liang, H.C. Mechanical Stress Affecting Dielectric Properties of Epoxy Resin. IEEE Trans. Dielectr. Electr. Insul. 2024, 31, 2255–2258. [Google Scholar] [CrossRef]
  8. Dekhtyar, Y.; Kawaguchi, Y.; Arnautov, A. Failure and relaxations of carbon fibre-reinforced plastic tested by exoemission and luminescence methods. Int. J. Adhes. Adhes. 1997, 17, 75–78. [Google Scholar] [CrossRef]
  9. Dekhtyar, Y.; Kronberga, S.; Romanova, M. Towards polymer composite reinforced by electrically charged nanoparticles. Int. J. Adhes. Adhes. 2019, 91, 19–22. [Google Scholar] [CrossRef]
  10. Kittel, C. Introduction to Solid State Physics; Wiley: Hoboken, NJ, USA, 2004; 704p. [Google Scholar]
  11. Williams, F.E. Solid-state Luminescence. Adv. Electron. Electron Phys. 1953, 5, 137–168. [Google Scholar]
  12. Zakrevskii, V.A.; Pakhotin, V.A. Mechanical emissions by polymers. Polym. Sci. U.S.S.R. 1975, 17, 653–657. [Google Scholar] [CrossRef]
  13. Ibach, H. (Ed.) Electron Spectroscopy for Surface Analysis; Springer: New York, NY, USA, 1977. [Google Scholar]
  14. Zakrevskii, V.A. Electron emission during deformation of polymers. Makromol. Chem. 1991, 41, 25–37. [Google Scholar] [CrossRef]
  15. Jensen, K. Introduction to the Physics of Electron Emission; John Wiley & Sons Ltd.: Hoboken, NJ, USA, 2018. [Google Scholar]
  16. Work Function. Available online: https://en.wikipedia.org/wiki/Work_function (accessed on 5 May 2025).
  17. Regel, V.R.; Slutsker, A.I.; Tomashevskii, E.E. The Kinetic Nature of the Strength of Solids. Sov. Phys. Uspekhi 1972, 15, 45–65. [Google Scholar] [CrossRef]
  18. Regel, V.R. Research on the physics of strength of composites (A review). Mech. Compos. Mater. 1980, 15, 684–701. [Google Scholar] [CrossRef]
  19. Zhurkov, S.N. Kinetic concept of the strength of solids. Int. J. Fract. 1984, 26, 295–307. [Google Scholar] [CrossRef]
  20. Araldite® LY 1564. Available online: https://coatings.specialchem.com/product/r-huntsman-araldite-ly-1564 (accessed on 14 May 2025).
  21. Advanced Materials. Available online: https://www.swiss-composite.ch/pdf/t-Araldite-LY1564-Aradur3486-3487-e.pdf (accessed on 20 March 2025).
  22. Derjaguin, B.V.; Landau, L.D. Theory of the Stability of Strongly Charged Lyophobic Sols and of the Adhesion of Strongly Charged Particles in Solutions of Electrolytes. Acta Physic. Chim. 1941, 14, 633–642. [Google Scholar] [CrossRef]
  23. Introduction to Edge Filters. Available online: https://www.idex-hs.com/resources/intro-to-optical-filters/intro-to-edge-fil-303 ters?utm_source=lfw&utm_medium=personifai&utm_campaign=springcampaign#:~:text=What%20is%20an%20Edge%20opti-304 cal,wavelength%2C%20while%20blocking%20lower%20wavelengths (accessed on 7 May 2025).
  24. Tensile Testing. Available online: https://en.wikipedia.org/wiki/Tensile_testing (accessed on 28 March 2025).
  25. Table of Critical Values: Pearson Correlation. Available online: https://www.statisticssolutions.com/free-resources/directory-of-statistical-analyses/pearsons-correlation-coefficient/table-of-critical-values-pearson-correlation (accessed on 20 March 2025).
  26. KT (Energy). Available online: https://en.wikipedia.org/wiki/KT_(energy) (accessed on 28 March 2025).
Figure 1. (a) The annual number of publications (SCOPUS database) that responded to the keywords “epoxy + polymer + nanoparticle” (EPN) and “epoxy + polymer + nanoparticle + strength” (EPNS). (b) The contribution of EPNS to EPN (EPNS/EPN).
Processes 13 01546 g001
Figure 2. Specimen for the tensile test. Dimensions are in millimeters ±0.05 mm.
Processes 13 01546 g002
Figure 3. Typical diagrams of loading (a) and PE current pulses (b); red lines show an example estimating the average value of σ related to the pulse length.
Processes 13 01546 g003aProcesses 13 01546 g003b
Figure 4. Typical Fourier spectrum of the detected pulse of I. The arrow indicates the peak of fmax chosen to estimate τ.
Processes 13 01546 g004
Figure 5. The correlation of ln τ with σ.
Processes 13 01546 g005
Figure 6. Influence of exposure of NPs to UV on the coefficient γ.
Processes 13 01546 g006
Disclaimer/Publisher’s Note: The statements, opinions and data contained in all publications are solely those of the individual author(s) and contributor(s) and not of MDPI and/or the editor(s). MDPI and/or the editor(s) disclaim responsibility for any injury to people or property resulting from any ideas, methods, instructions or products referred to in the content.

