Article

Improving Indoor Thermal Comfort and Air-Conditioning Management in Representative Primary Schools in Southern China

1
Graduate School of Science and Engineering, Saga University, Saga 840-8502, Japan
2
Faculty of Science and Engineering, Saga University, Saga 840-8502, Japan
*
Author to whom correspondence should be addressed.
Processes 2025, 13(5), 1538; https://doi.org/10.3390/pr13051538
Submission received: 13 March 2025 / Revised: 20 April 2025 / Accepted: 8 May 2025 / Published: 16 May 2025
(This article belongs to the Special Issue Sustainable Development of Energy and Environment in Buildings)

Abstract

:
This study aims to optimize indoor thermal environment assessment methods for primary school classrooms in regions with hot summers and cold winters, enhancing air-conditioning management efficiency and accuracy. Given the complexity of Predicted Mean Vote (PMV) calculations and its reduced accuracy under high temperature and humidity, this research explores the use of Thermal Sensation Vote (TSV) as a simpler alternative. Field measurements and subjective assessments were conducted to analyze the relationship between TSV and PMV, leading to a regression model linking predicted TSV (TSVp) with temperature and humidity. Results indicate that temperature and humidity significantly impact TSV, with regression coefficients of 0.499 and 0.055, respectively. Furthermore, when TSV is ≥1, the proportion of PMV of ≥0.5 remains stable, validating TSVp as a reliable indicator. Based on these findings, energy-efficient air-conditioning management strategies are proposed, recommending a temperature setting of 28 °C for thermal comfort. This study provides insights into climate control strategies in educational buildings, promoting sustainable development.

1. Introduction

People spend a substantial portion of their time indoors. For example, according to NHAPS, people in developed countries spend approximately 87% of their time indoors, making the quality of the indoor thermal environment crucial for both physical health and cognitive performance [1]. Historically, improving indoor thermal conditions has relied on meticulous architectural design, incorporating elements such as building orientation, courtyards, and ventilation strategies. However, rapid urbanization has led to increasingly complex relationships between buildings and human activities, necessitating more systematic approaches to indoor climate control.
China’s vast geographical expanse results in diverse climatic conditions, categorized into five zones: severe cold, cold, hot summer and cold winter, hot summer and warm winter, and temperate [2]. Building standards in China are partially centralized, with key performance indicators mandated nationally but design parameters adjusted by regional climate zones. Each zone imposes unique thermal design requirements, particularly in the hot summer and cold winter region, characterized by humid summers and damp winters [3]. Architectural thermal design must balance summer heat mitigation with adequate winter insulation. This dual challenge necessitates a nuanced understanding of indoor thermal dynamics to ensure optimal comfort year round [4,5]. Recent thermal comfort studies have explored diverse climatic conditions in China. For instance, Yi et al. compared outdoor comfort between urban villages and formal communities in Shenzhen, highlighting regional thermal adaptation [6]. Similarly, Sun et al. conducted a systematic review of thermal environments in Chinese residential buildings, but found that most studies emphasize temperature while overlooking the critical role of humidity [7]. This research gap is especially relevant in hot–humid classrooms where humidity significantly affects TSV. In particular, educational buildings, which accommodate children and youth for long periods, present unique challenges for maintaining thermal comfort.
According to the 2022 National Education Development Statistics Bulletin [8], China is home to a total of 518,500 educational institutions across various levels and types. This includes 289,200 kindergartens, 149,100 primary schools, 52,500 junior high schools, 22,200 high schools, and 3013 higher education institutions. Educational buildings constitute a unique category of architecture, specifically designed to create an environment that promotes learning [9]. It is widely recognized that educational systems worldwide encompass multiple levels, with individuals dedicating varying amounts of time to learning activities based on their age [10]. From early childhood education to higher education, individuals aged 2 to 26 spend a substantial portion of their active hours in educational environments [11,12]. According to MOE statistics, primary students typically spend over 30 h per week in classrooms. Within these settings, students are required to maintain a high degree of concentration as they engage in the acquisition of new knowledge, the refinement of their skills, and the enhancement of their analytical thinking capabilities [13]. The proficiency with which an individual develops these competencies directly correlates with their depth of understanding, which can significantly influence their life trajectory [14]. Consequently, educational facilities, particularly classrooms, should be equipped with features that promote a dynamic atmosphere conducive to enriching the educational experience [15,16]. A substantial body of research, dating back to the 1960s, has established a significant correlation between the thermal conditions and air quality within classrooms and both the academic performance and overall well-being of students [17,18,19].
The lack of specific standards governing thermal environments in educational facilities and classroom settings necessitates that designers and architects utilize existing guidelines such as ISO-7730, EN15251, and ASHRAE 55 as reference materials [20,21,22]. A review of the pertinent literature indicates that architects and engineers are adopting design strategies for educational institutions that are analogous to those employed for other public buildings [23,24,25]. In the realm of thermal comfort research, it is widely recognized that the databases associated with ASHRAE-55, ISO-7730, and EN 15251 standards are utilized as benchmarks for assessing the comfort levels of healthy adults in public buildings globally [26,27,28]. Numerous investigations conducted in both air-conditioned and naturally ventilated classrooms have revealed that students often report dissatisfaction with the thermal conditions present in these educational environments [29,30]. This discontent has been documented in classrooms across both developing and developed nations [31,32]. At each educational level, the instructional environment and objectives are structured to facilitate the acquisition of specific skills by students. In alignment with the skill requirements pertinent to each stage of schooling, tailored curricula are developed to enhance students’ systematic thinking and physical activity [33,34]. Furthermore, when establishing energy conservation objectives, it is crucial to ensure that the thermal comfort of students is not compromised [35,36].
Currently, thermal comfort guidelines tailored for educational settings remain limited, making it necessary to reference general public building standards. This study focuses on the indoor thermal environment of elementary school classrooms in regions characterized by hot summers and cold winters, addressing pertinent issues related to this context. While previous studies have investigated classroom thermal comfort, most have focused on adult occupants, laboratory conditions, or comprehensive PMV-based models. This study proposes a simplified method targeting seated students in natural classroom settings, aiming to guide real-time decision-making using only ambient data. Through the implementation of a questionnaire survey and the collection of field data, the research calculates the correlation between students’ TSV during the summer and various factors, including temperature and humidity. Based on these analyses, the article presents guidelines for the energy-efficient use of air conditioning under varying climatic conditions, with the aim of enhancing comfort while minimizing energy consumption and providing a rational reference and methodology for future research endeavors.

2. Research Subjects Selection and Experimental Methods

2.1. Research Location and Description of the Experiment

This study was conducted in primary school classrooms in China’s hot summer and cold winter region, specifically in Cixi, Zhejiang Province, which exhibits typical characteristics of hot and humid summers and cold and damp winters. The hot summer period in this region typically extends from June to September, while the cold winter months occur from December to February, based on historical meteorological records.
Through field visits and investigations, the current conditions of primary and secondary school classrooms in regions with hot summers and cold winters were examined and analyzed. Relevant data were collected and organized to systematically summarize the basic information of the surveyed buildings, their structural conditions, and the indoor thermal comfort. Additionally, a selection of representative classrooms in the surveyed schools were subjected to hourly indoor thermal environment measurements during summer to identify the distribution characteristics of indoor thermal environment parameters. The basic climate information of Cixi is shown in Table 1. The basic information of the school is shown in Table 2 and Figure 1.

2.2. Survey Questionnaire for Indoor Thermal Comfort in Primary School

The research presented in the study titled “Indoor Air Quality and Thermal Environment in Classrooms of an Elementary School During Summer Season Before/After Installing Air Conditioner” utilized a survey questionnaire to investigate thermal comfort within elementary school settings [37,38]. Given that younger students may lack the capacity for accurate and independent assessments, the study focused on classrooms occupied by senior students from various floors, specifically those situated on the east and west sides of the building. This approach was adopted to maintain the integrity of the experimental design and ensure the comparability of the data collected while preserving the original classroom configurations and student populations. The study object is the classroom on the west side of the top floor of the school.
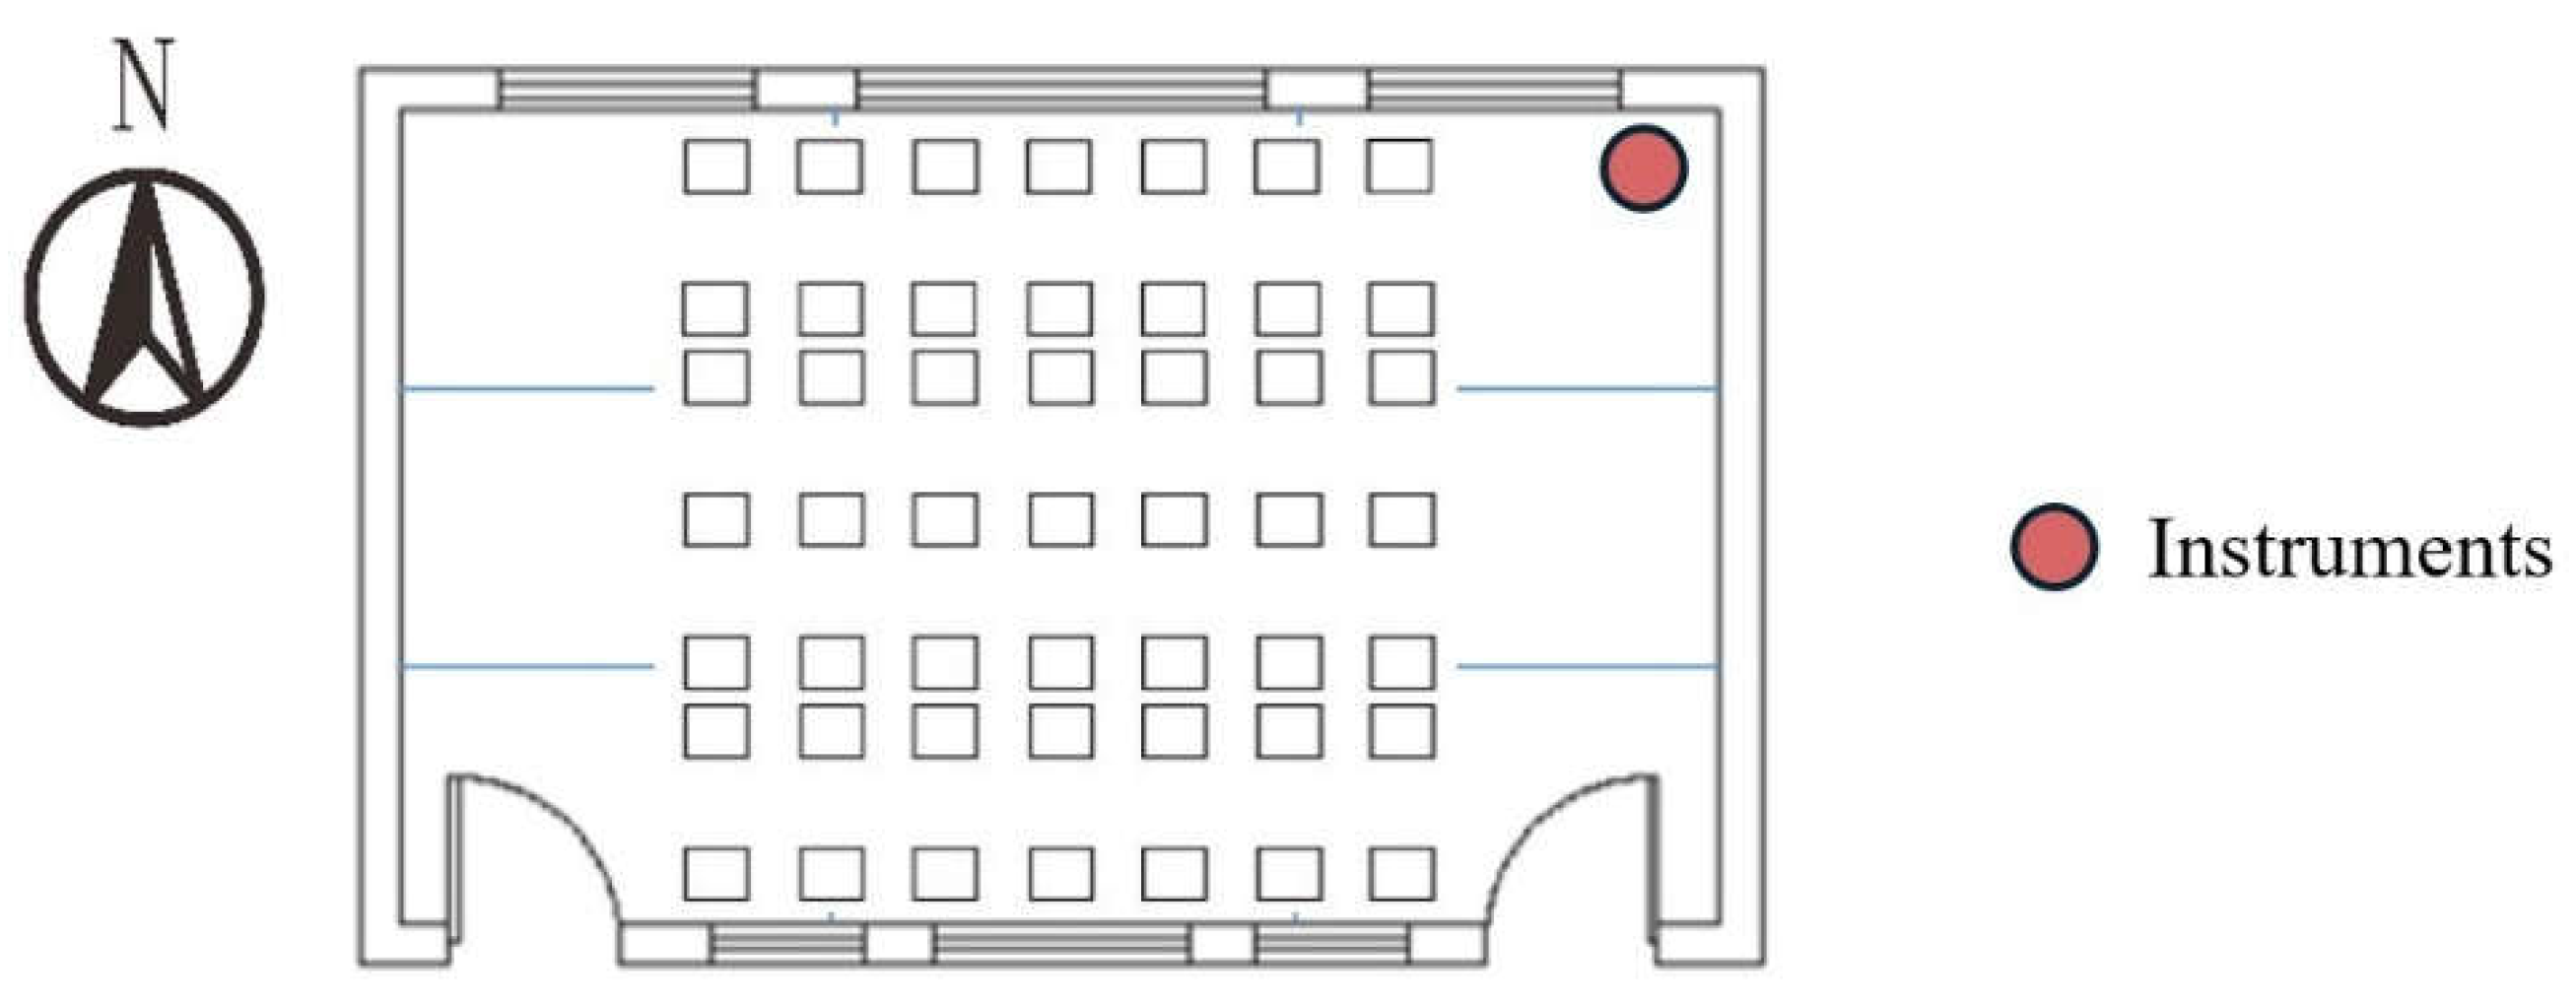
To accurately reflect the thermal environment of the classrooms in their natural state, the study retained the original classroom layouts and standardized facility usage, following consultations with the classroom administrators (teachers) regarding habitual usage patterns. All thermal comfort surveys were conducted during regular class periods, ensuring students were in a rested, seated condition. The seating arrangements adhered to the pre-existing classroom configurations, with windows being closed during instructional periods, opened during breaks, and closed again from after school until the start of the next school day. Additionally, curtains were kept open during school hours and closed after school. The ceiling fans operated at a speed of 140 revolutions per minute. The layout of the classroom is shown in Figure 2 and Table 3. The classrooms faced south and had operable windows on one long side, with the opening area accounting for approximately 30% of the wall surface.
The primary objective of this research was to evaluate students’ experiences of thermal comfort within the classroom setting through the administration of questionnaires. The distribution of respondents was relatively balanced in terms of gender, with participants predominantly aged between 12 and 13 years. During the survey, students typically wore short-sleeve school uniforms, with an estimated Clo value of 0.5. The detailed contents of the paper-based questionnaire are presented in Table 4. A total of 660 valid questionnaire responses were collected, and the data were used to evaluate students’ thermal sensation in different seating areas. Among them, 315 are from girls and 345 are from boys. A simplified 4-point scale was used to ensure understanding among primary school students. The trade-off was accepted to improve response reliability. Prior research suggests that simplified scales can be appropriate for younger populations [37]. Table 5 shows the TSV index for each response.

2.3. Measurement of Indoor Thermal Environment in Primary School

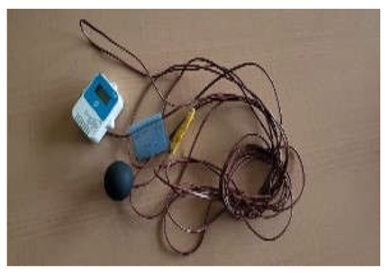
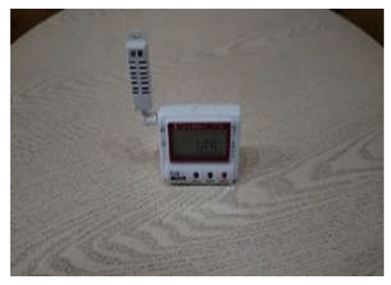
The parameters for on-site data collection primarily encompass indoor and outdoor air temperature, relative humidity, globe temperature, carbon dioxide concentration, and wind speed. In light of the summer and winter vacation schedule in Chinese primary schools, the data collection was strategically planned for the period immediately preceding the vacation. The on-site data collection took place from 17 June to 21 June 2024, targeting the classroom as well as outdoor environments. To enhance the representativeness of the experiment and to consider the potential effects on younger students, the selected classroom is on the west side of the top floor of the school. The selection of data collection points was informed by an on-site questionnaire survey, which identified locations exhibiting the least indoor thermal comfort. All instruments were factory-calibrated and met the ISO 7730 standard. The measurement accuracy was ±0.5 °C for temperature, ±3% for relative humidity, and ±50 ppm for CO2 sensors. Following ASHRAE guidelines, sensors were installed at a height of 1.1 m from the floor. Prior to the field measurements, all instruments underwent an additional calibration procedure to ensure data precision and experimental reliability. The data were collected at two-minute intervals. The specific measurement instruments utilized are detailed in Table 6.
Table 7 presents fundamental data regarding classroom dimensions and per capita density. It is important to note that the total area of the classroom encompasses the floor space occupied by the teacher’s podium, as well as the front and back corridors and other equipment. Consequently, the actual area available for student use is approximately 10 square meters less than the total measured classroom area. Accordingly, this study calculates per capita density based on the area that is effectively utilized by the students.

2.4. Introduction to Human Thermal Comfort and Calculation Methods

Human thermal comfort refers to the satisfaction of an individual with the thermal environment. It is a complex phenomenon influenced by air temperature, relative humidity, air velocity, clothing insulation, and metabolic rate. Achieving thermal comfort is crucial for well-being, productivity, and overall satisfaction in indoor spaces.
Indicators for evaluating environmental thermal comfort include the effective temperature index (ET), the new effective temperature (ET*), the standard effective temperature (SET*), and the predictive thermal comfort index (PMV). PMV is the most representative, including many factors related to human thermal comfort, and is the most comprehensive and widely used indoor thermal environment evaluation index at present.
The thermal comfort method is based on extensive research conducted by Fanger on healthy adult subjects in controlled laboratory environments [39,40]. He established the PMV-PPD method based on the thermal comfort model, which assumes that all subjects worldwide react similarly or identically in all buildings and under all climate conditions [41].
The formula of Predicted Mean Vote (PMV):
P M V = ( 0.303   ×   exp ( 0.036   ×   q M )   +   0.028 )   ×   ( ( q M q W )     3.05   ×   10 3   ×   ( 5733     6.99   ×   ( q M q W )     P a )     0.42   ×   ( ( q M q W )     58.15 )     1.7   ×   10 55   ×   q M ×   ( 5867     58 )     0.0014   ×   q M ×   ( 34     T a )     3.96   ×   10 8   ×   f c l ×   ( ( T c l + 273 ) 4     ( T r + 273 ) 4     f c l ×   h c ×   ( T c l   t a ) )
q M : the metabolic rate, in watts per square meter [W/ m 2 ]
q W : the effective mechanical pow, in watts per square meter [W/ m 2 ]
I c l : the clothing insulation, in watts per square meter [ m 2 ·K/W]
f c l : the clothing surface area factor
t a : the air temperature, in degrees Celsius [° C]
T r : the mean radiant temperature, in degrees Celsius [° C]
t g : the global temperature [° C]
T c l : the clothing surface temperature, in degrees Celsius [° C]
v a r : the relative air velocity, in meters per second [m/s]
h c : the convective heat transfer coefficient [W/( m 2 ×K)]
P a : the partial vapor pressure [Pa]

2.5. Application of Multiple Linear Regression Analysis in TSV Relationship Modeling

Multiple Linear Regression (MLR) is a common statistical modeling method used to describe the influence of multiple independent variables (independent variables) on dependent variables (dependent variables). Its mathematical model form is as follows:
Y = β0 + β1X1 + β2X2 + …… + βnXn + ϵ
where
  • Y is the dependent variable, representing the predicted value of the study object (in this study, it is TSV).
  • X1, X2, …… Xn are the independent variables that may influence TSV (e.g., temperature, humidity).
  • β0 is the intercept, indicating the predicted value when all independent variables are zero.
  • β1, β2, …, βn are the regression coefficients, representing the influence of each independent variable on the dependent variable.
  • ϵ is the random error term, capturing the variability that cannot be explained by the independent variables.
In this study, Multiple Linear Regression is employed to explore the effects of temperature and humidity on students’ TSV and to establish a predictive model for thermal comfort in educational buildings.

3. Results and Analysis

This study employs a comprehensive methodology to systematically assess the thermal environment of primary school classrooms situated in regions of China characterized by hot summers and cold winters. Utilizing established standards and specifications, relevant calculations were conducted to ascertain the prevailing thermal conditions. Following the completion of these calculations, a thorough analysis was undertaken to gain a comprehensive understanding of the current thermal environment. The primary objective of this research is to yield authentic, reliable, and pertinent conclusions. By integrating the results from questionnaires and empirical data collected from primary school students in southern China, this study elucidates the relationship between Predicted Mean Vote (PMV) and Thermal Sensation Vote (TSV). Furthermore, this study calculates the correlation between the TSV of students during the summer and various factors, including temperature, humidity, and proximity to walls. Building upon these findings, this paper proposes guidelines for the energy-efficient use of air-conditioning systems under varying climatic conditions, with the intention of providing a sound reference and methodologies for future investigations.

3.1. Results and Analysis of Survey Questionnaire

This study investigates the effects of temperature fluctuations, solar radiation, and humidity on indoor thermal conditions, specifically focusing on students’ thermal comfort within a summer classroom setting. The research was conducted over a five-day period from 17 June to 21 June 2024, and concentrated on three distinct time intervals: morning, noon, and afternoon. The primary objective of the administered questionnaire was to evaluate the thermal sensations experienced by students during these time frames. Additionally, the study aimed to analyze variations in thermal comfort levels with and without the use of air conditioning. Participants were prompted to report their thermal perceptions at 9 am, 12 pm, and 4 pm. Throughout the five-day duration, a total of 15 questionnaires were distributed across designated classrooms, resulting in the collection of 658 data points. It is noteworthy that air conditioning was utilized on the afternoon of 19 June and during both the morning and afternoon sessions on 21 June.
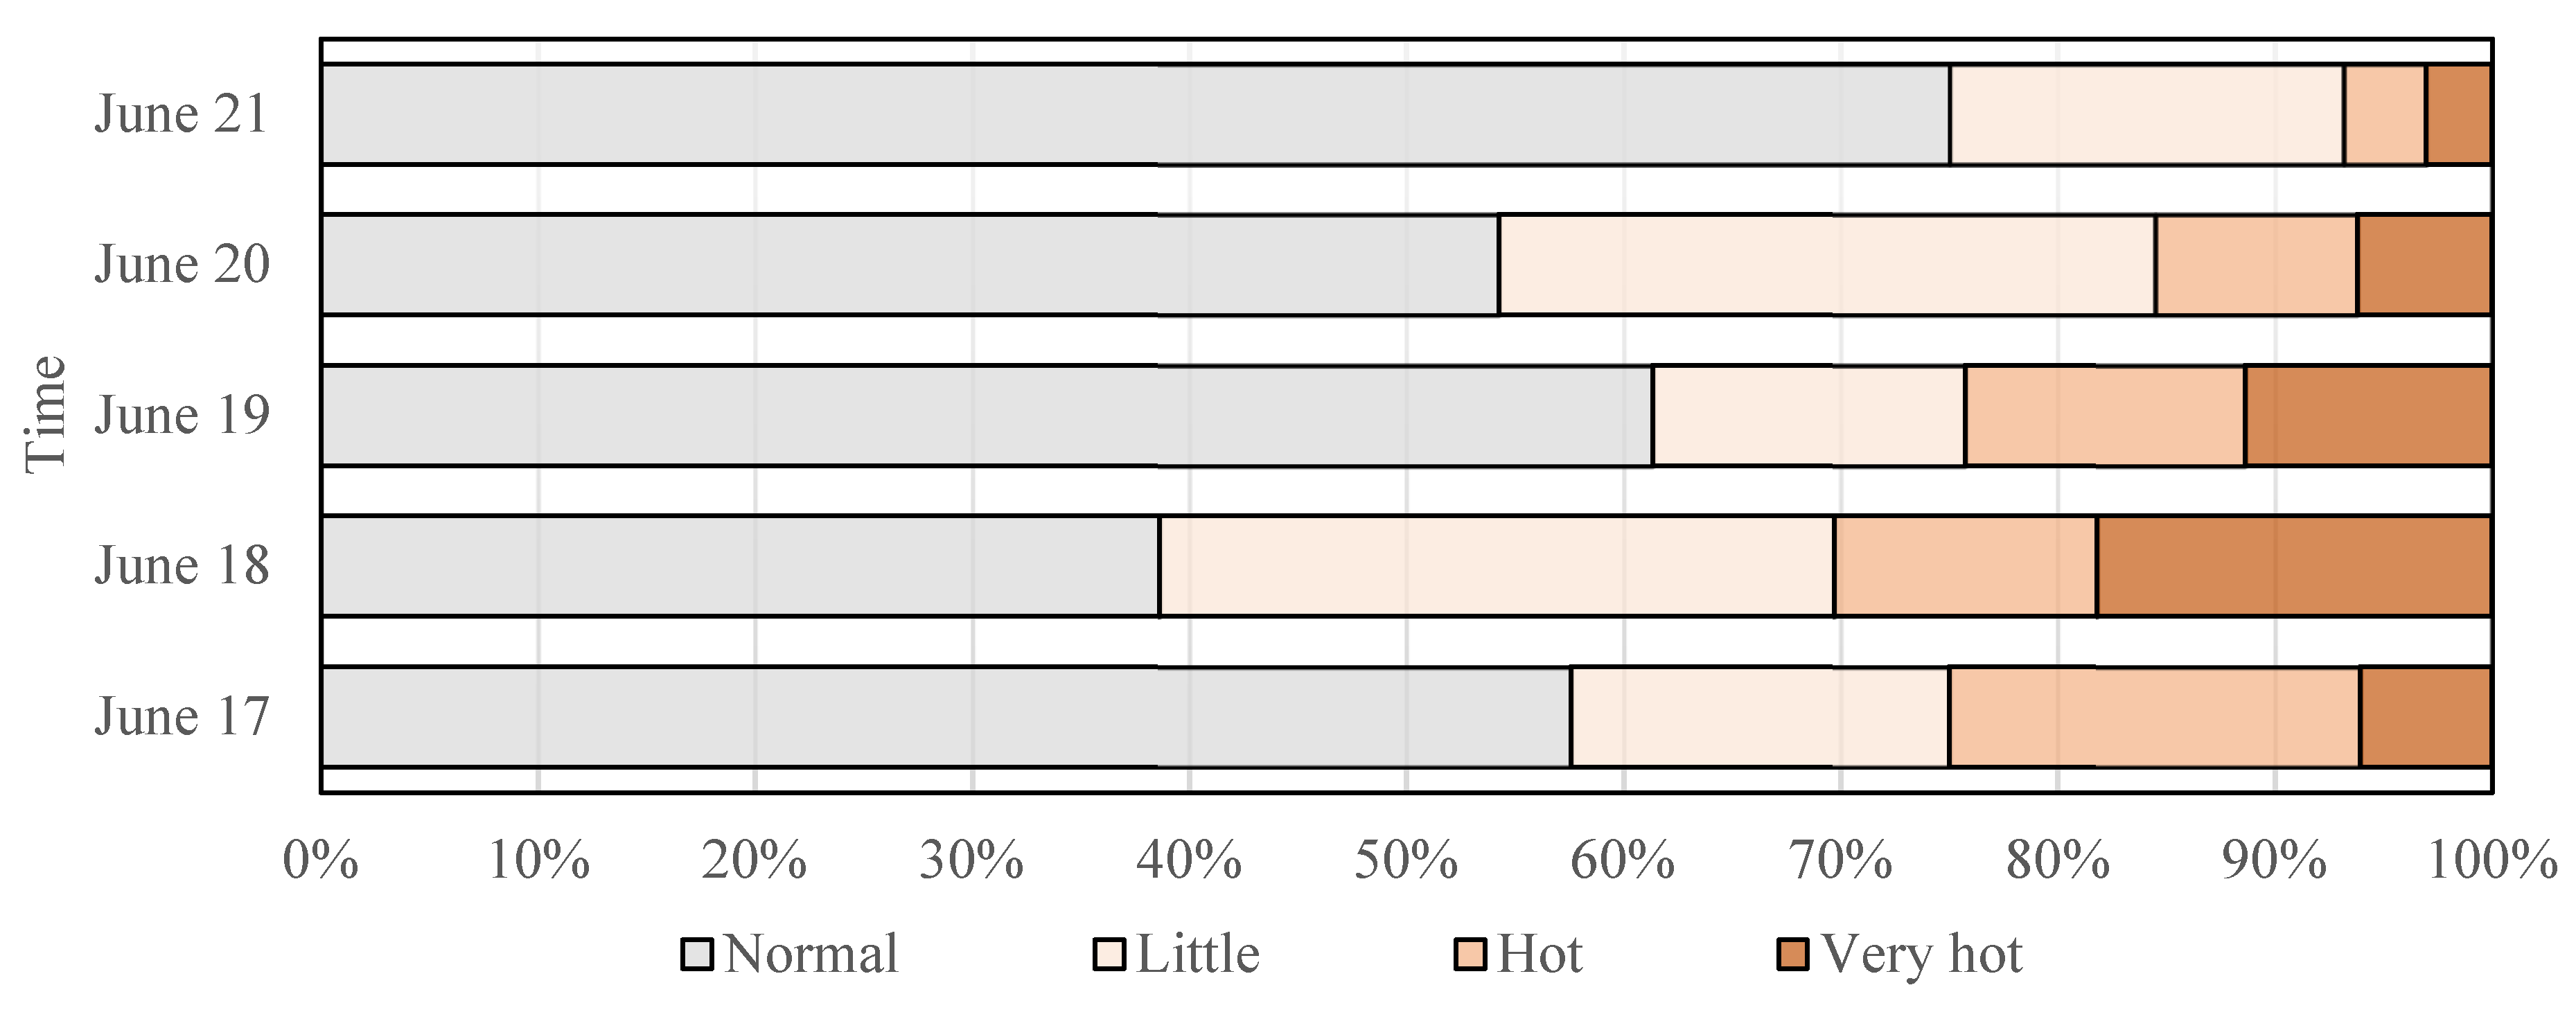
According to the results of 15 questionnaire surveys shown in Figure 3, it can be observed that the indoor thermal environment in the morning is the most ideal time of the day. In the case of no refrigeration equipment, from the noon period to the afternoon school, the thermal discomfort in the classroom is generally higher.
As illustrated in Table 8, the data on indoor and outdoor temperature and humidity collected from 17 June to 21 June indicate that air-conditioning units were operational during the afternoon of 19 June and the morning and afternoon of 21 June, whereas fans were utilized solely for cooling purposes during the remaining periods.
Figure 4 presents the findings from a daily questionnaire administered over a five-day interval, illustrating variations in thermal comfort levels. When analyzed in conjunction with the indoor and outdoor temperature and humidity data detailed in Table 7, it can be inferred that temperature serves as the primary determinant influencing the indoor thermal comfort of students in this region, while humidity also exerts a notable effect on thermal comfort.
Figure 5 presents the findings of a thermal comfort assessment conducted among students occupying various seats over a five-day duration. The data indicated that students seated in the central area of the classroom reported significantly higher levels of thermal comfort in comparison to their counterparts seated near the windows.
The thermal comfort distribution patterns presented in Figure 5 reflect significant spatial variability across the classroom. These variations were derived from the questionnaire-based TSV responses, with darker red tones indicating higher thermal discomfort. As shown in the figures, the northwest corner consistently exhibits higher concentrations of thermal dissatisfaction among students.
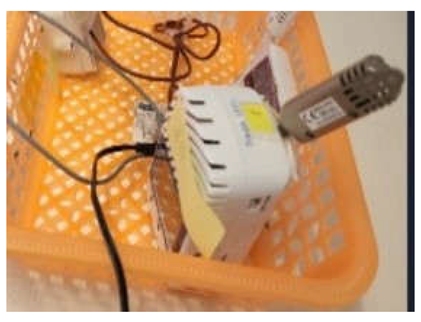
According to the results from both the questionnaire survey (Figure 4) and spatial analysis (Figure 5), this uneven distribution suggests that the positioning of measurement instruments plays a critical role in accurately representing classroom thermal conditions. In this study, the northwest area was identified as having relatively poor thermal performance, possibly due to its exposure to afternoon sunlight, limited cross-ventilation, or obstruction by surrounding structures. To capture more representative data while minimizing classroom disruption, the instrument was placed in this zone. Notably, this corner is also less trafficked by students, thereby reducing the risk of interference with data collection equipment. The site is shown in Figure 6.

3.2. Results and Analysis of Measurement Data of Summer

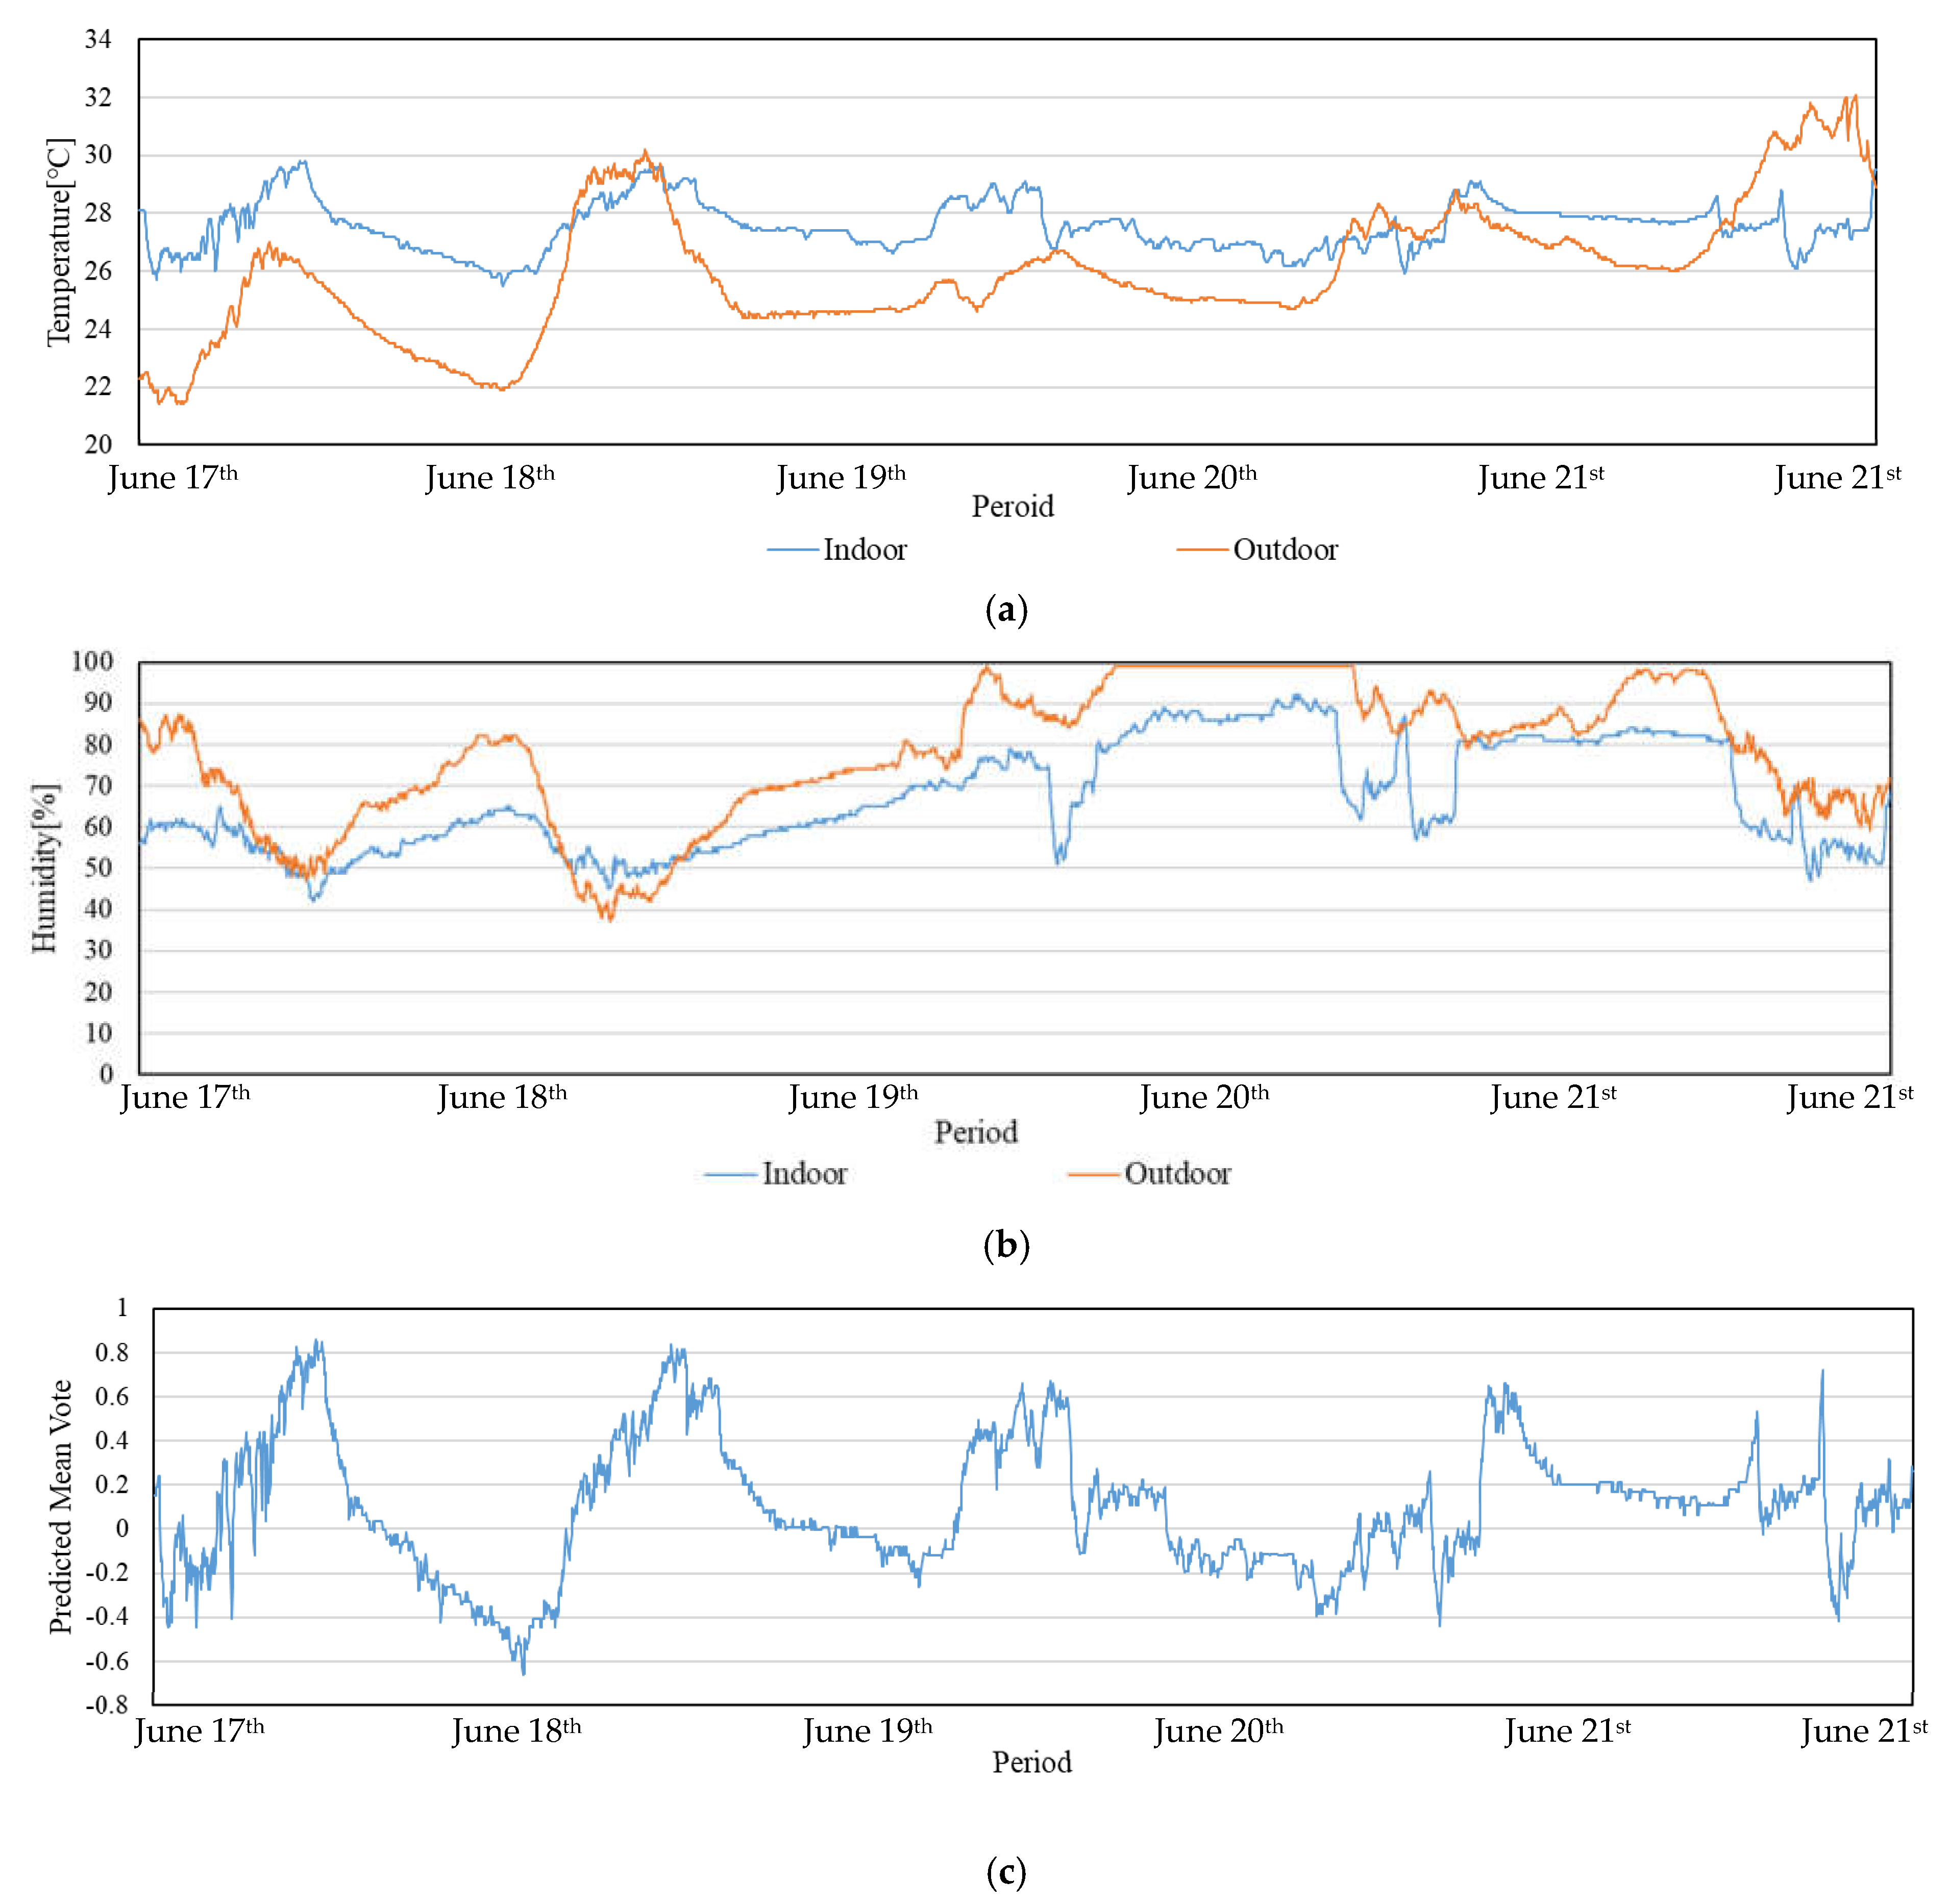
The data collection during the summer is shown in Figure 7.
An analysis of the indoor and outdoor temperature and humidity data collected on 18 June and 20 June revealed that the administrator did not engage the air-conditioning system on the 18th, despite the presence of elevated temperatures and low humidity levels. Conversely, on 20 June, the air conditioning was utilized in conditions characterized by low temperatures and high humidity. This observation underscores the significant impact of humidity on the indoor thermal environment. Notably, discrepancies were identified between the actual results and the PMV outcomes, suggesting a divergence between the TSV and PMV metrics. Furthermore, management opted to activate the air-conditioning system during the afternoon of 20 June and throughout 21 June, a decision that was closely linked to the marked increase in PMV values under conditions of high temperature and humidity. This occurrence substantiates the strong relationship between TSV and PMV.

3.3. Relationship Between PMV and TSV in Primary School Classrooms

Thermal Sensation Vote (TSV) and Predicted Mean Vote (PMV) are two widely used indicators for assessing indoor thermal comfort. PMV is calculated using Fanger’s heat balance equation, while TSV is obtained through subjective assessments of occupants. Understanding the relationship between these two indices is essential for evaluating classroom thermal environments, especially in hot summer and cold winter regions.
Data analysis shows that when TSV ≥ 1 (Hot and Very Hot), the proportion of PMV ≥ 0.5 is almost identical, as shown in Figure 8. This consistency indicates that TSV can serve as a reliable alternative to PMV in assessing thermal comfort when environmental monitoring data are unavailable. Moreover, correlation analysis reveals a statistically significant relationship (p < 0.05) between the two indices shown in Table 9, confirming the high consistency between students’ subjective thermal perceptions and the calculated PMV values.
Moreover, it is important to highlight that the process of collecting data required for PMV calculation is relatively complex and labor-intensive, often requiring multiple environmental parameters that are difficult to obtain in many practical settings. In contrast, TSV is significantly easier to collect, as it is derived directly from occupants’ subjective responses. Given these practical constraints, this study aims to use TSV as a more accessible substitute for PMV, enabling a simplified assessment of indoor thermal environments based on ambient temperature and humidity.

3.4. Multiple Regression Analysis of TSV-Based Temperature and Humidity

To further improve the accuracy of TSV prediction, a refined multiple regression model was established based on the latest dataset. The updated regression equation is as follows:
TSVp = −17.120 + 0.499T + 0.055H
where
  • T represents indoor temperature (°C);
  • TSVp represents predicted TSV;
  • H represents indoor relative humidity (%).
Table 10 and Table 11 list in detail the correlation coefficients between TSV and temperature and humidity derived from the collected data and a corresponding analysis and discussion based on these derived results was carried out.
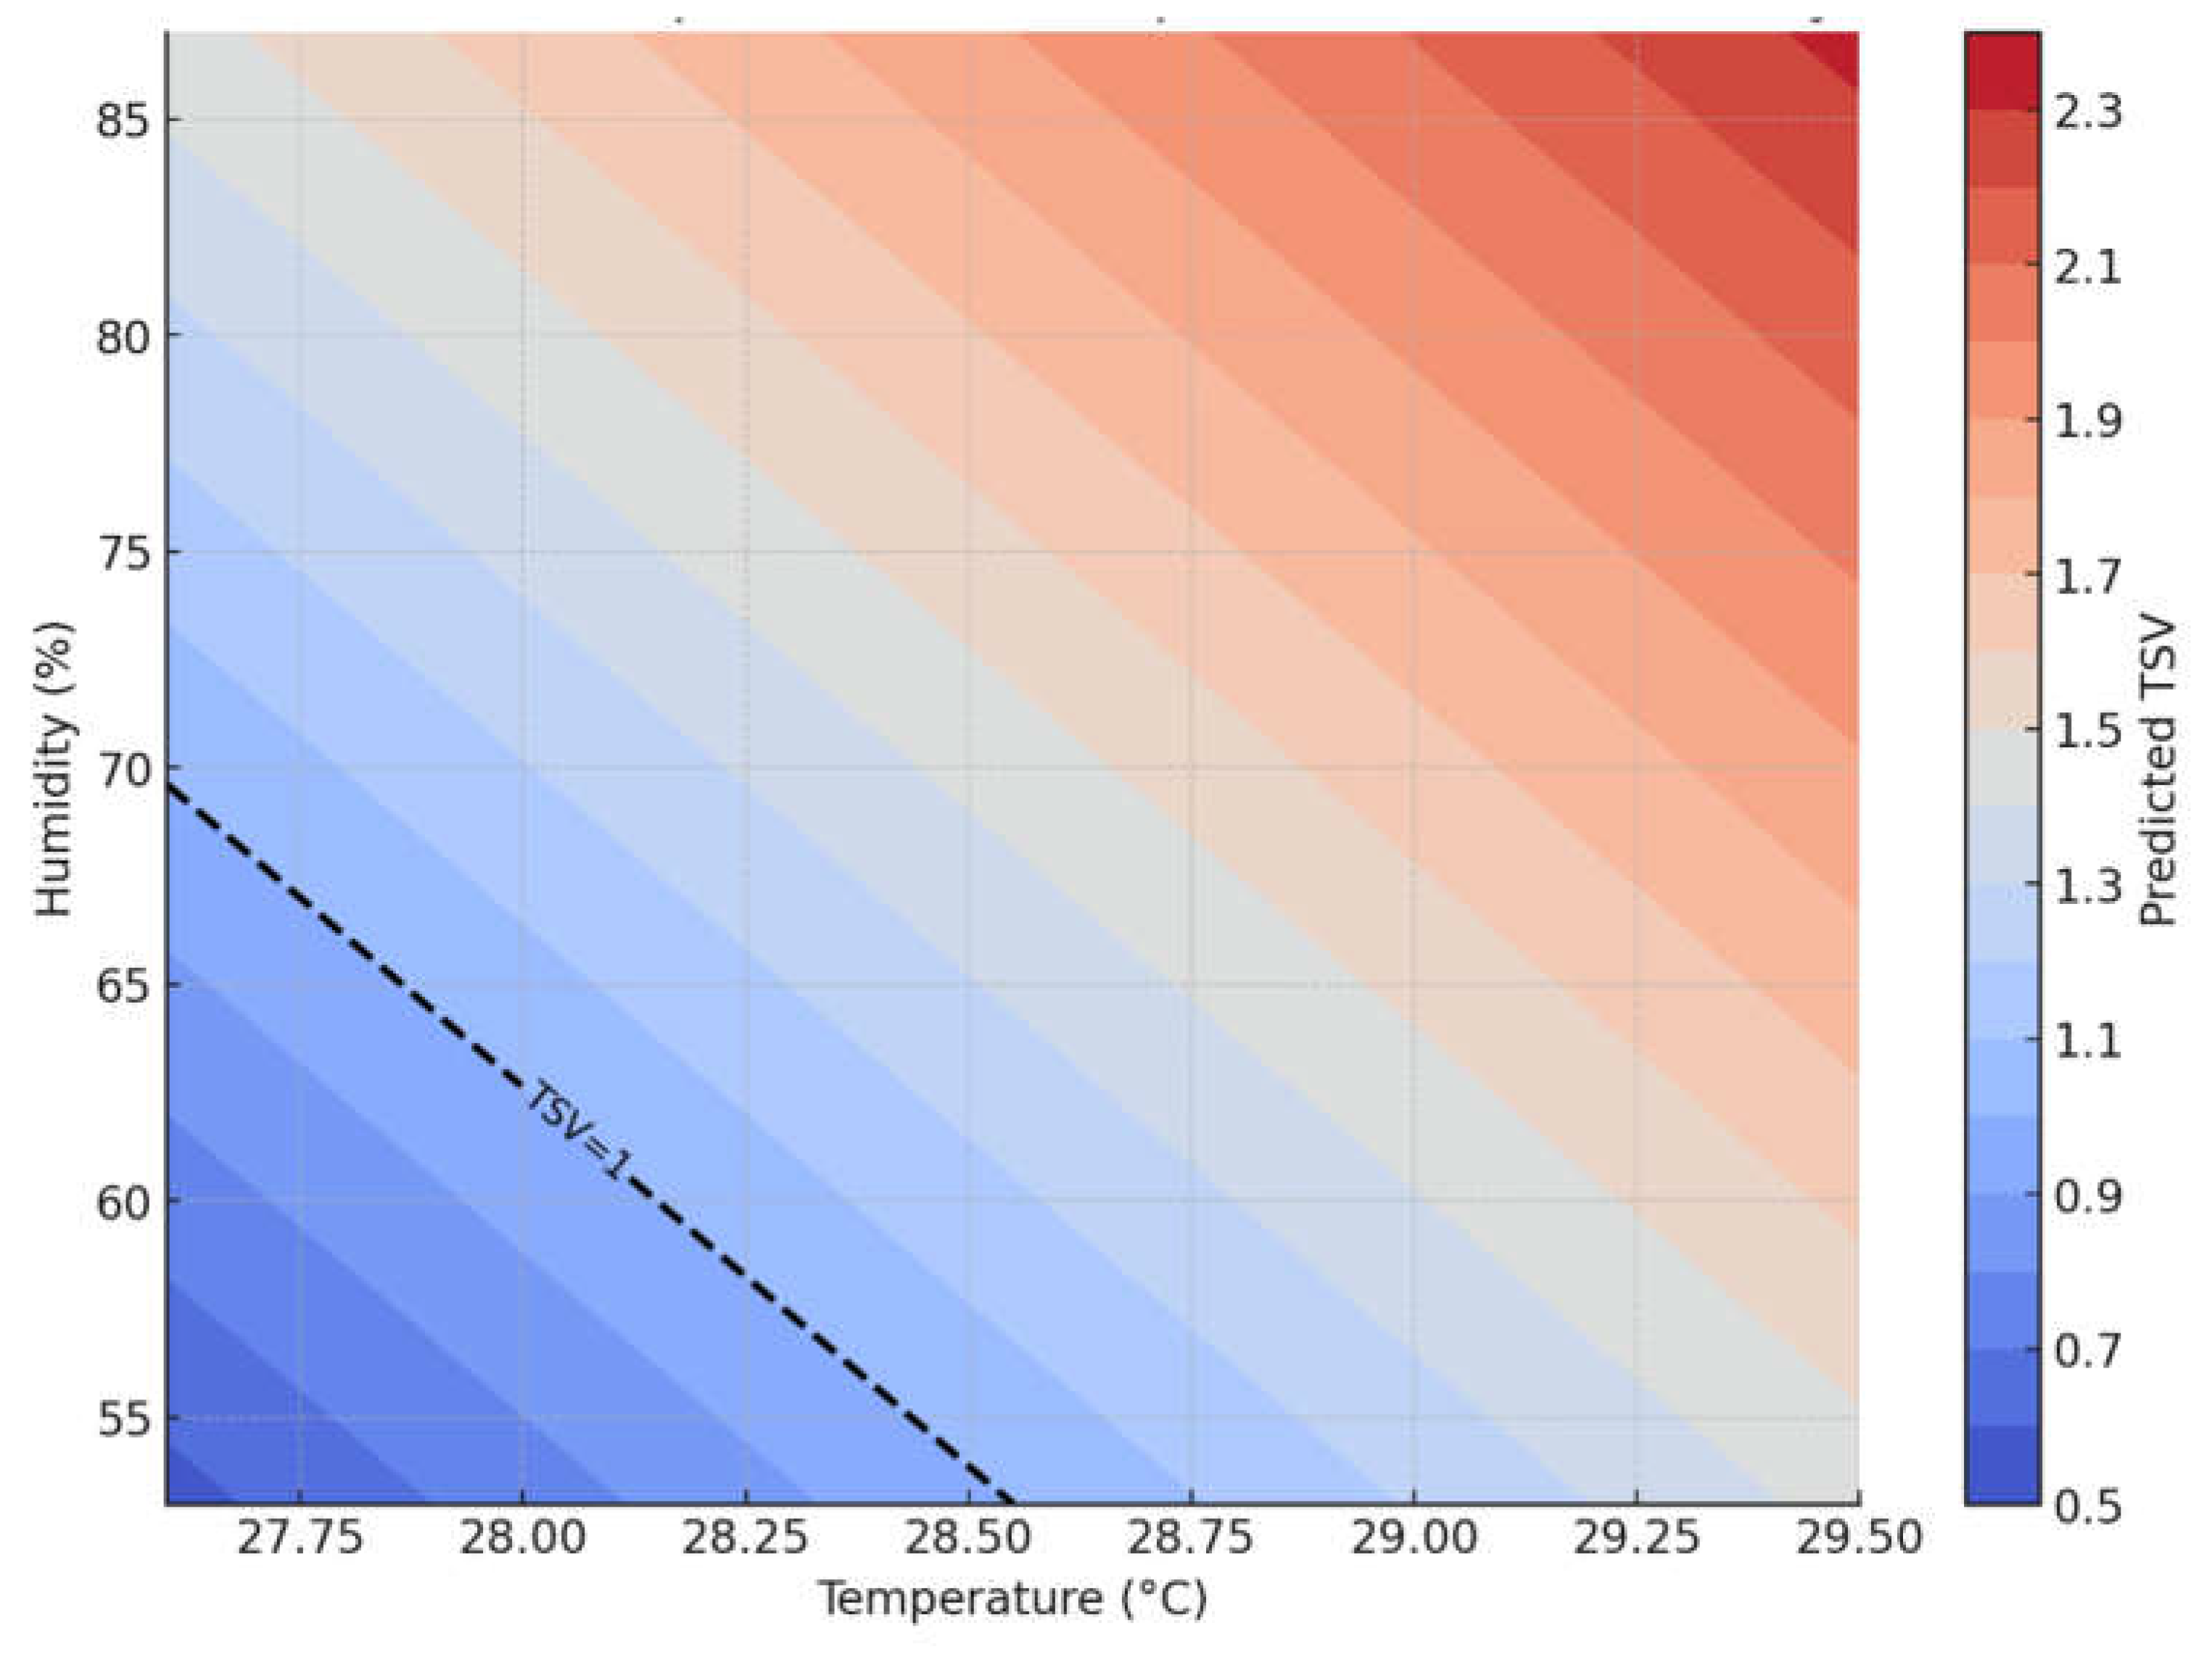
The regression results demonstrate that both temperature and humidity have a statistically significant impact on TSV, indicating that an increase of 1 °C in temperature leads to an average TSV rise of 0.499 and suggesting that a 1% increase in humidity results in an average TSV increase of 0.055. Adjusted R2 was calculated to assess the model’s explanatory strength (R2adj = 0.281). Multicollinearity was checked using the variance inflation factor, and all predictors had VIF < 2, indicating no multicollinearity concerns. Figure 9 illustrates this relationship in the form of the contour map.
It is worth clarifying that the purpose of this study was not to model the relationship between PMV and TSV directly, but rather to construct a regression model linking TSV with key environmental parameters such as air temperature and relative humidity. While TSV is an ordinal variable by nature, we adopted a linear regression approach by treating it as a quasi-continuous outcome. This simplification facilitates interpretability and practical application and has been applied in prior thermal comfort studies. PMV was not used as an input variable in our regression model, but served as a comparative benchmark to evaluate subjective and predicted thermal sensations across different thermal conditions.
The higher coefficient of temperature reaffirms its dominant role in shaping thermal comfort perceptions, aligning with existing studies on thermal sensation in indoor environments. While humidity exhibits a lower impact compared to temperature, its significant p-value confirms its role in modifying thermal sensation, particularly in high-humidity conditions. The revised regression model provides an accessible method for TSV estimation using only temperature and humidity data. This offers a practical alternative to the complex PMV model, which requires additional parameters such as air velocity, clothing insulation, and metabolic rate.

3.5. Guidelines for Air-Conditioning Use in Summer Based on TSV Regression Analysis

Indoor thermal comfort is significantly affected by outdoor weather conditions. Based on the collected data and the TSV regression model, summer days can be categorized into three types—rainy days, cloudy days, and sunny days—with corresponding humidity levels and TSV thresholds.
Climate Ranges Observed in Field Data: (1) High-humidity rainy days (71–87%)—Even at lower temperatures, high humidity can cause discomfort. Dehumidification should be prioritized along with cooling. (2) Cloudy days (58–70%)—Moderate humidity levels allow for relatively stable thermal comfort, requiring standard air-conditioning operation. (3) Sunny days (47–58%)—Lower humidity enables higher acceptable temperatures before discomfort is reported. (4) Air-conditioned environments (54–75%)—Based on measured data, when air conditioning is used, the indoor humidity typically remains in this range. Maintaining this humidity range is recommended to keep TSV below 1.
Based on the TSV regression model, the recommended temperature settings are adjusted to ensure indoor thermal comfort shown in Table 12 and Table 13 while minimizing energy consumption.
Temperature Adjustment Based on Humidity: Since humidity affects TSV, air conditioning should not only focus on cooling but also on dehumidification. During rainy days, despite lower temperatures, high humidity can make occupants feel warmer than indicated by the air temperature.
Energy Efficiency Considerations: The recommended temperature setting of 28 °C ensures a balance between energy savings and comfort, aligning with sustainable cooling strategies.
Dynamic Control Strategy: For real-time adjustments, incorporating smart thermostats and humidity sensors can optimize air-conditioning settings based on actual indoor conditions, further enhancing thermal comfort and efficiency.
The proposed TSV prediction model is designed for seamless integration into smart control systems in classrooms. Because it relies solely on temperature and humidity sensors, the model can be applied across a variety of school environments, including naturally ventilated, mechanically cooled, and mixed-mode systems. Its simplicity allows it to function as a real-time feedback mechanism, maintaining optimal indoor thermal conditions with minimal technical complexity.
Based on this model, a recommended temperature setpoint of 28 °C was derived by solving the regression equation at a TSV value of 1, which corresponds to the threshold of neutral or slightly warm thermal sensation as reported by students. This temperature represents the point at which the majority of students perceived the classroom environment as thermally acceptable and free from discomfort.
Notably, the 28 °C setpoint also aligns with internationally recognized thermal comfort guidelines, such as ASHRAE Standard 55 and ISO 7730, both of which suggest an operative temperature range of 23 °C to 28 °C for naturally ventilated spaces in summer conditions.
Grounded in empirical data and aligned with global standards, this temperature control recommendation provides a practical reference for optimizing air-conditioning use in classrooms. It offers a promising balance between maintaining student comfort and improving energy efficiency, while also supporting the future development of smart, climate-responsive educational environments.

4. Conclusions

This study underscores the urgent need to establish thermal comfort standards tailored to educational buildings across diverse climate zones through a systematic investigation of the indoor thermal environment in primary school classrooms located in China’s hot summer and cold winter regions, aiming to optimize energy-efficient climate control strategies while safeguarding students’ thermal comfort. The research was conducted through a combination of field measurements and subjective questionnaire surveys to establish a comprehensive relationship between Thermal Sensation Vote (TSV) and Predicted Mean Vote (PMV).
  • The results indicate that when TSV ≥ 1 (Hot or Very Hot), the proportion of PMV ≥ 0.5 is nearly identical. This demonstrates that TSV can effectively substitute PMV in evaluating indoor thermal comfort when environmental monitoring data are unavailable. TSV is derived directly from students’ subjective thermal perceptions, making it a more accessible and practical metric for assessing classroom thermal environments.
  • To further improve the accuracy of TSV prediction, a refined multiple regression model was developed using the most recent dataset. The model confirmed that each 1 °C increase in indoor air temperature led to an approximate rise of 0.50 units in Thermal Sensation Vote, while each 1% increase in relative humidity contributed an additional 0.055 units. This indicates that temperature is the dominant factor influencing thermal perception, with humidity playing a notable secondary role. The model was particularly suited to summer conditions in hot summer and cold winter climate zones, providing a practical and efficient alternative to conventional PMV calculations.
  • Building upon these findings, practical guidelines for air-conditioning usage were proposed to balance thermal comfort and energy efficiency. Temperature adjustment based on humidity is especially critical: although air temperature is the primary factor, high humidity—especially on rainy days—can make occupants feel warmer than the measured temperature suggests. Therefore, air-conditioning systems should not only provide cooling but also integrate dehumidification functions. To support this approach, a dynamic control strategy is recommended, incorporating smart thermostats and humidity sensors to enable real-time adjustment of indoor conditions. This ensures better responsiveness to occupant comfort while promoting sustainable energy use. For example, a recommended setpoint of 28 °C has been shown to provide a reasonable balance between thermal comfort and energy conservation, particularly when combined with active humidity control.
Although this study provides a valuable reference for evaluating thermal comfort in educational buildings, certain limitations remain. Future research should (1) expand the sample size to include a broader range of educational institutions in various climate zones. (2) Investigate the effects of air velocity and clothing insulation on TSV to refine the regression model. (3) It is essential to not only focus on the climatic conditions during the summer season but also to take into account the climatic variations across all four seasons. (4) Future studies could consider students’ multi-sensory influences on thermal perception (e.g., color hue, acoustics, daylighting, prior nutrition) [42]. This study provides a scientific basis for improving thermal comfort and energy-saving strategies in educational buildings. It is hoped that future research will further refine existing thermal comfort prediction models and facilitate the practical implementation of energy-efficient optimization strategies.

Author Contributions

Y.S.: Writing—Original Draft, Software, Methodology, Investigation, Formal Analysis, and Data Curation. W.A.: Formal Analysis and Data Curation. S.K. and K.N.: Writing—Review and Editing and Supervision. All authors have read and agreed to the published version of the manuscript.

Funding

This research received no external funding.

Institutional Review Board Statement

This research does not present any conflicts of interest and was approved by the school administration, and informed consent was obtained from all participants and their legal guardians prior to data collection. The survey was conducted anonymously in accordance with local research ethics standards. All the author consent to the publication of their profile pictures.

Data Availability Statement

Datasets generated during the current study are available from the corresponding author upon reasonable request.

Conflicts of Interest

The authors declare that they have no known competing financial interests or personal relationships that could have appeared to influence the work reported in this paper.

References

  1. Klepeis, N.E.; Nelson, W.C.; Ott, W.R.; Robinson, J.P.; Tsang, A.M.; Switzer, P.; Behar, J.V.; Hern, S.C.; Engelmann, W.H. The National Human Activity Pattern Survey (NHAPS): A resource for assessing exposure to environmental pollutants. J. Expo. Sci. Environ. Epidemiol. 2001, 11, 231–252. [Google Scholar] [CrossRef]
  2. Schweizer, C.; Edwards, R.D.; Bayer-Oglesby, L.; Gauderman, W.J.; Ilacqua, V.; Jantunen, M.J.; Lai, H.K.; Nieuwenhuijsen, M.; Künzli, N. Indoor timemicroenvironment-activity patterns in seven regions of Europe. J. Expo. Sci. Env. Epidemiol. 2006, 17, 170–181. [Google Scholar] [CrossRef]
  3. Li, J.; Wang, F. Applied research on energy-saving technology of buildings in hot summer and cold winter regions of China. Appl. Mech. Mater. 2014, 672–674, 1806–1810. [Google Scholar] [CrossRef]
  4. Liu, J. Research on Indoor Thermal Environment and Human Thermal Comfort of Naturally Ventilated Buildings in Hot Summer and Cold Winter Regions. Master’s Thesis, Chongqing University, Chongqing, China, 2007. (In Chinese) [Google Scholar] [CrossRef]
  5. Ye, X.; Zhou, Z.; Lian, Z.; Wen, Y.; Zhou, Z.; Jiang, C. Study on thermal comfort of neutral ventilated buildings in different city. Build. Energy Effici. 2007, 35, 55–57. (In Chinese) [Google Scholar] [CrossRef]
  6. Yi, T.; Wang, H.; Liu, C.; Li, X.; Wu, J. Thermal comfort differences between urban villages and formal settlements in Chinese developing cities: A case study in Shenzhen. Sci. Total Environ. 2023, 856, 158283. [Google Scholar] [CrossRef]
  7. Sun, Y.; Zhang, C.; Zhao, Y.; Li, J.; Ma, Y.; Zhu, C. A systematic review on thermal environment and thermal comfort studies in Chinese residential buildings. Energy Build. 2023, 291, 113134. [Google Scholar] [CrossRef]
  8. Ministry of Education of the People’s Republic of China. National Statistical Bulletin on the Development of Education of 2022; Ministry of Education of the People’s Republic of China: Beijing, China, 2023. [Google Scholar]
  9. Zomorodian, Z.S.; Tahsildoost, M.; Hafezi, M. Thermal comfort in educational buildings: A review article. Renew. Sustain. Energy Rev. 2016, 59, 895–906. [Google Scholar] [CrossRef]
  10. Djongyang, N.; Tchinda, R.; Njomo, D. Thermal comfort: A review paper. Renew. Sustain. Energy Rev. 2010, 14, 2626–2640. [Google Scholar] [CrossRef]
  11. Wargocki, P.; Wyon, D.P. Providing better thermal and air quality conditions in school classrooms would be cost-effective. Build. Environ. 2013, 59, 581–589. [Google Scholar] [CrossRef]
  12. Lee, M.C.; Mui, K.W.; Wong, L.T.; Chan, W.Y.; Lee, E.W.M.; Cheung, C.T. Student learning performance and indoor environmental quality (IEQ) in air-conditioned university teaching rooms. Build. Environ. 2012, 49, 238–244. [Google Scholar] [CrossRef]
  13. Yang, Z.; Becerik-Gerber, B.; Mino, L. A study on student perceptions of higher education classrooms: Impact of classroom attributes on student satisfaction and performance. Build. Environ. 2013, 70, 171–188. [Google Scholar] [CrossRef]
  14. De Giuli, V.; Da Pos, O.; De Carli, M. Indoor environmental quality and pupil perception in Italian primary schools. Build. Environ. 2012, 56, 335–345. [Google Scholar] [CrossRef]
  15. Mishra, A.K.; Ramgopal, M. Thermal comfort field study in undergraduate laboratories—An analysis of occupant perceptions. Build. Environ. 2014, 76, 62–72. [Google Scholar] [CrossRef]
  16. Turunen, M.; Toyinbo, O.; Putus, T.; Nevalainen, A.; Shaughnessy, R.; Haverinen-Shaughnessy, U. Indoor environmental quality in school buildings, and the health and wellbeing of students. Int. J. Hyg. Environ. Health 2014, 217, 733–739. [Google Scholar] [CrossRef]
  17. de Dear, R.J.; Akimoto, T.; Arens, E.A.; Brager, G.; Candido, C.; Cheong, K.W.D.; Li, B.; Nishihara, N.; Sekhar, S.C.; Tanabe, S.-I.; et al. Progress in thermal comfort research over the last twenty years. Indoor Air 2013, 23, 442–461. [Google Scholar] [CrossRef]
  18. Auliciems, A. Thermal requirements of secondary schoolchildren in winter. J. Hyg. 1969, 67, 59–65. [Google Scholar] [CrossRef]
  19. van Hoof, J. Forty years of Fanger’s model of thermal comfort: Comfort for all? Indoor Air 2008, 18, 182–201. [Google Scholar] [CrossRef]
  20. Yang, L.; Yan, H.; Lam, J.C. Thermal comfort and building energy consumption implications—A review. Appl. Energy 2014, 115, 164–173. [Google Scholar] [CrossRef]
  21. Yau, Y.; Chew, B. A review on predicted mean vote and adaptive thermal comfort models. Build. Serv. Eng. Res. Technol. 2012, 35, 23–35. [Google Scholar] [CrossRef]
  22. Huang, K.-T.; Huang, W.-P.; Lin, T.-P.; Hwang, R.-L. Implementation of green building specification credits for better thermal conditions in naturally ventilated school buildings. Build. Environ. 2015, 86, 141–150. [Google Scholar] [CrossRef]
  23. Babaharra, O.; Choukairy, K.; Faraji, H.; Khallaki, K.; Hamdaoui, S.; Bahammou, Y. Thermal performance analysis of hollow bricks integrated phase change materials for various climate zones. Heat Transf. 2024, 53, 2148–2172. [Google Scholar] [CrossRef]
  24. Martinez-Molina, A.; Boarin, P.; Tort-Ausina, I.; Vivancos, J.-L. Post-occupancy evaluation of a historic primary school in Spain: Comparing PMV, TSV and PD for teachers’ and pupils’ thermal comfort. Build. Environ. 2017, 117, 248–259. [Google Scholar] [CrossRef]
  25. Huang, K.T.; Hwang, R.L. Parametric study on energy and thermal performance of school buildings with natural ventilation, hybrid ventilation and air conditioning. Indoor Built Environ. 2016, 25, 1148–1162. [Google Scholar] [CrossRef]
  26. EN 15251:2007; Indoor Environmental Input Parameters for Design and Assessment of Energy Per-Formance of Buildings Addressing Indoor Air Quality, Thermal Environment, Lighting and Acoustics. Comité European de Normalisation: Brussels, Belgium, 2007.
  27. EN ISO 7730:2005; Ergonomics of the Thermal Environment—Analytical Determination and Interpretation of Thermal Comfort Using Calculation of the Pmv and Ppd Indices and Local Thermal Comfort Criteria. ISO: Geneva, Switzerland, 2005.
  28. ANSI/ASHRAE Standard 55-2013; Thermal Environmental Conditions for Human Occupancy. ASHRAE: Peachtree Corners, GA, USA, 2013.
  29. Yun, H.; Nam, I.; Kim, J.; Yang, J.; Lee, K.; Sohn, J. A field study of thermal comfort for kindergarten children in Korea: An assessment of existing models and preferences of children. Build. Environ. 2014, 75, 182–189. [Google Scholar] [CrossRef]
  30. Liang, H.-H.; Lin, T.-P.; Hwang, R.-L. Linking occupants’ thermal perception and building thermal performance in naturally ventilated school buildings. Appl. Energy 2012, 94, 355–363. [Google Scholar] [CrossRef]
  31. Auliciems, A. Classroom performance as a function of thermal comfort. Int. J. Biometeorol. 1972, 16, 233–246. [Google Scholar] [CrossRef] [PubMed]
  32. Auliciems, A. Warmth and comfort in the subtropical winter: A study in brisbane schools. J. Hyg. 1975, 74, 339–343. [Google Scholar] [CrossRef]
  33. Humphreys, M. A study of the thermal comfort of primary school children in summer. Build. Environ. 1977, 12, 231–239. [Google Scholar] [CrossRef]
  34. Kwok, A.G. Thermal comfort in tropical classrooms. ASHRAE Trans. 1998, 104, 1031–1050. [Google Scholar]
  35. Lewis, R. A survey of metaheuristic-based techniques for university timetabling problems. OR Spectr. 2007, 30, 167–190. [Google Scholar] [CrossRef]
  36. Qu, R.; Burke, E.K.; McCollum, B.; Merlot, L.T.G.; Lee, S.Y. A survey of search methodologies and automated system development for examination timetabling. J. Sched. 2008, 12, 55–89. [Google Scholar] [CrossRef]
  37. Go, I. Indoor Air Quality and Thermal Environment in Classrooms of An Elementary School during Summer Season before/after Installing air Conditioner. J. Environ. Eng. 2009, 74, 877–882. [Google Scholar] [CrossRef]
  38. Kaihara, N.; Hayashi, M.; Kim, H.; Osawa, H.; Bando, M.; Kobayashi, K.; Honma, Y.; Yan, S.; Kikuta, K.; Hayama, H. State of indoor thermal environment in special nursing homes for the elderly: Measurement of indoor temperature and humidity, and analysis of humidity control in winter in cold regions. J. Environ. Eng. (Trans. AIJ) 2018, 83, 267–276. [Google Scholar] [CrossRef]
  39. Fanger, P.O. Thermal Comfort: Analysis and Applications in Environmental Engineering; Danish Technical Press: Copenhagen, Denmark, 1970. [Google Scholar]
  40. Ole Fanger, P.; Toftum, J. Extension of the pmv model to non-air-conditioned buildings in warm climates. Energy Build. 2002, 34, 533–536. [Google Scholar] [CrossRef]
  41. Cheung, T.; Schiavon, S.; Parkinson, T. Analysis of the accuracy on thermal sensation models using ASHRAE Global Thermal Comfort Database II. Build. Environ. 2019, 153, 205–217. [Google Scholar] [CrossRef]
  42. Mazzone, A.; Khosla, R. Socially Constructed or Physiologically Informed? Placing Humans at the Core of Understanding Cooling Needs. Energy Res. Soc. Sci. 2021, 81, 102088. [Google Scholar] [CrossRef]
Figure 1. (a) Locations of on-site measurements and (b) the photo of the school outside.
Processes 13 01538 g001
Figure 2. The layout of the classroom.
Processes 13 01538 g002
Figure 3. Analysis of thermal comfort questionnaire.
Processes 13 01538 g003
Figure 4. Thermal comfort questionnaire survey daily data.
Processes 13 01538 g004
Figure 5. The TSV of each seat in three periods in five days. (a) The TSV of each seat is 9:00 am, 12:00 am, and 16:00 pm on 17 June. (b) The TSV of each seat is 9:00 am, 12:00 am, and 16:00 pm on 18 June. (c) The TSV of each seat is 9:00 am, 12:00 am, and 16:00 pm on 19 June. (d) The TSV of each seat is 9:00 am, 12:00 am, and 16:00 pm on 20 June. (e) The TSV of each seat is 9:00 am, 12:00 am, and 16:00 pm on 21 June.
Processes 13 01538 g005
Figure 6. The place of the instruments site in the classroom.
Processes 13 01538 g006
Figure 7. The thermal data of the classroom and outdoors. (a) Temperature of indoors and outdoors. (b) Humidity of indoors and outdoors. (c) Predicted Mean Vote of the classroom.
Processes 13 01538 g007
Figure 8. The data analysis of TSV and PMV in the daytime. (a) The percent of TSV of students in the classroom in the daytime. (b) The percent of PMV of classroom in daytimes.
Processes 13 01538 g008
Figure 9. Predicted TSV contour map based on temperature and humidity.
Processes 13 01538 g009
Table 1. Information on the climate of Cixi.
SeasonClimateAverage Temperature (Last Decade)
SpringHumid and sunnyHighest: 23 °C, Lowest: 9 °C
SummerHumid, chilly, and cloudyHighest: 33 °C, Lowest: 22 °C
AutumnHumid and chillyHighest: 28 °C, Lowest: 17 °C
WinterHumid and sunnyHighest: 16 °C, Lowest: 4 °C
Table 2. Basic information of the school.
School NameA
Student Numbers2975
StructureRC
CompletionYear: 2008
Floors4
Cooling SystemFan and air-conditioner
Ventilation SystemNot available
Table 3. Information of two school classrooms.
FacilityNumberMaterials/Type
Window6Double Low-E
Electric Fans4Ceiling
Air Conditioner1Wall-mounted
Desk45Metal and Wood
Chair45Metal and Wood
Ventilation SystemNot availableAirflow relied on manual window opening
Table 4. Survey questionnaire.
QuestionOptions
1. Please select your seat in the figure below.Processes 13 01538 i001
2. Sex□ Male   □ Female
3. Do you feel hot in the classroom during the summer?Processes 13 01538 i002
4. Do you often feel that the air in the classroom is humid and sticky?Processes 13 01538 i003
Table 5. TSV index with response.
TSV IndexResponse
00 star ≤ Response ≤ 1 star
11 star < Response ≤ 2 stars
22 stars < Response ≤ 3 stars
33 stars < Response ≤ 4 stars
Table 6. Information on measurement instruments.
Instrument NameInstrumentOn-Site PhotosMeasurement RangeMeasurement
Parameters
Tr-45
(Company: T&D Corporation, Tokyo, Japan)
Processes 13 01538 i004Processes 13 01538 i005Temp.: −20 °C–70 °CBlack Ball Temperature
Tr-72Ui
(Company: T&D Corporation, Tokyo, Japan)
Processes 13 01538 i006Processes 13 01538 i007Temp.: −20 °C–60 °C
Humidity: 0–100%
Air Temperature Humidity
Tr-76Ui
(Company: T&D Corporation, Tokyo, Japan)
Processes 13 01538 i008Processes 13 01538 i009Temp.: −20 °C–60 °C
Humidity: 0–100%
CO2: 0 ppm–9999 ppm
Air Temperature Humidity Carbon Dioxide Concentration
Anemometer
(Company: UNUO, Tokyo, Japan)
Processes 13 01538 i010Processes 13 01538 i011Speed: 0 m/s–20 m/sAir Velocity
Table 7. Information on measurement classrooms.
ClassroomSiteStudent Num.AreaPer Capita Density
SelectedFourth, West4436.48 m20.59 m2
Table 8. Indoor and outdoor temperature and humidity during the week.
DateMomentIndoor TemperatureIndoor HumidityAir-Conditioning Use
June 17th9:00 am26.4 °C61%Close
12:00 am28.0 °C61%Close
16:00 pm29.5 °C53%Close
June 18th9:00 am27.6 °C52%Close
12:00 am29.4 °C49%Close
16:00 pm29.0 °C53%Close
June 19th9:00 am28.5 °C69%Close
12:00 am28.6 °C79%Close
16:00 pm27.6 °C65%Open
June 20th9:00 am27.1 °C62%Close
12:00 am27.8 °C87%Open, then closed
16:00 pm28.6 °C82%Open, then closed
June 21st9:00 am27.6 °C60%Open
12:00 am28.6 °C68%Close
16:00 pm27.5 °C53%Open
Table 9. T-test analysis of the relationship between PMV and TSV.
StatisticVariable 1Variable 2
Mean 1.4039630.351209
Variance 1.4075570.082166
Observations656656
Pearson Correlation 0.205226-
Hypothesized Mean Difference0-
Degrees of Freedom 655-
t-Statistic 23.2055-
p (T <= t) One-Tail 1.06 × 10−87-
t Critical One-Tail 1.6472-
p (T <= t) Two-Tail 2.12 × 10−87-
t Critical Two-Tail 1.9636-
Table 10. Multiple Regression Analysis of TSV, temperature, and humidity.
StatisticValue
Multiple R 0.536
R Square 0.287
Adjusted R Square 0.279
Standard Error 1.083
Observations 190
Table 11. Regression coefficients analysis of TSV, temperature, and humidity.
VariableCoefficientStandard ErrorT-Statp-Value
Intercept −17.1203.669−4.3941.87 × 10−5
Temperature 0.4990.1234.0607.21 × 10−5
Humidity 0.0550.0068.5963.25 × 10−15
Table 12. Categorization of weather conditions and TSV thresholds based on TSV Regression Analysis.
Day Type Indoor Humidity Range Temperature at TSV = 1
Rainy ~87%26.7 °C~
Cloudy ~70%28.5 °C~
Sunny ~58%29.9 °C~
In Air-Con ~75%28.0 °C~
Table 13. Recommended opening temperature and air-conditioning temperature settings.
Day Type Sunny Cloudy Rainy
Recommended Opening Temperature 29.9 °C28.5 °C26.7 °C
Recommended Temperature Setting 28 °C28 °C28 °C
Disclaimer/Publisher’s Note: The statements, opinions and data contained in all publications are solely those of the individual author(s) and contributor(s) and not of MDPI and/or the editor(s). MDPI and/or the editor(s) disclaim responsibility for any injury to people or property resulting from any ideas, methods, instructions or products referred to in the content.