Article

Thermodynamic Method for Evaluating the Gas Adsorption-Induced Swelling of Confined Coal: Implication for CO2 Geological Sequestration

1
School of Intelligent Construction and Civil Engineering, Luoyang Institute of Science and Technology, Luoyang 471023, China
2
School of Civil Engineering and Architecture, Henan University of Science and Technology, Luoyang 471023, China
3
School of Earth and Environment, Anhui University of Science and Technology, Huainan 232001, China
*
Authors to whom correspondence should be addressed.
Processes 2025, 13(5), 1504; https://doi.org/10.3390/pr13051504
Submission received: 28 April 2025 / Revised: 11 May 2025 / Accepted: 12 May 2025 / Published: 14 May 2025

Abstract

:
Geological storage of CO2 in coal seam is an effective way for carbon emission reduction. Evaluating the adsorption-induced swelling behavior of confined coal is essential for this carbon emission reduction strategy. Based on the thermodynamic theory and the Gibbs adsorption model, a thermodynamic method for evaluating the gas adsorption-induced swelling behavior of confined coal was established. The influences of factors such as stress, gas pressure, and the state of gas on the adsorption-induced swelling behavior of confined coal were discussed. The predicted swelling deformation from the thermodynamic method based on the ideal gas hypothesis was consistent with the experimental result only under the condition of low-pressure CO2 (<2 MPa). The predicted swelling deformation from that method was larger than the experimental result under the condition of high-pressure CO2 (>2 MPa). However, the method based on the real gas hypothesis always had better prediction results under both the low- and high-pressure CO2 conditions. From the perspective of phase equilibrium and transfer, in the process of CO2 adsorption by the confined coal, gas molecules transfer from the adsorption site of high chemical potential to the low chemical potential. Taking the real gas as ideal gas will result in the surface energy increase in the established model. Consequently, the prediction result will be larger. Therefore, for geological storage of CO2 in coal seam, it is necessary to take the real gas state to predict the adsorption-induced swelling behavior of the coal. In the process of CO2 adsorption by the confined coal, when its pressure is being closed to the critical pressure, capillary condensation phenomenon will occur on the pore surface of the confined coal. This can make an excessive adsorption of CO2 by the coal. With the increase in the applied stress, the adsorption capacity and adsorption-induced swelling deformation of the confined coal decrease. Compared to N2 with CO2, the coal by CO2 adsorption always shows swelling deformation under the simulated condition of ultra-high-pressure injection. However, the coal by N2 adsorption will shows shrinking deformation due to the pore pressure effect after the equilibrium pressure. Taking the difference in the adsorption-induced swelling behavior and pore compression effect, N2 can be mixed to improve the injectivity of CO2. This suggests that CO2 storage in the deep burial coal seam can be carried out by its intermittent injection under high-pressure condition along with mixed N2.

1. Introduction

Geological storage of CO2 in coal seam has a dual effect of energy development and environmental protection [1,2,3,4]. During the process of CO2 injection to coal seam, the adsorption of CO2 by the coal pores will result in the swelling deformation of coal. Subsequently, the coal seam permeability will change dynamically for this adsorption-induced swelling behavior, which in turn influences the injectivity of CO2 [5,6]. In addition, the stress magnitudes of coal seam in different burial depths and structural positions are different [7]. Due to the difference in the stress applied on the coal, the gas adsorption-induced coal swelling behavior varies during CO2 injection [8].
In the former studies, either in the high-pressure or low-pressure injection conditions, it has been proved or assumed that there is the adsorption instead of the absorption occurring between the coal and the CO2 or N2. Along with the adsorption of gas by the coal, there is an adsorption-induced coal swelling behavior [9,10,11]. Some achievements have been reported about the gas adsorption-induced coal swelling behavior and its mechanism [5,6,8]. And some mathematical models were also established to evaluate the adsorption-induced coal swelling behavior. For instance, based on the principle of surface physical chemistry and elastic mechanics, a mathematical model was built [12]. From the perspective of energy conservation of thermal energy and elasticity during the process of gas adsorption by coal, a mathematical model for predicting the adsorption-induced swelling strain of coal was also established [13]. In addition, gas adsorption-induced coal swelling behaviors in consideration of the factors such as multi-component gases, coal rank, moisture content, and coal structure were also explored. Some meaningful results have been obtained [14,15,16,17,18]. However, CO2 adsorption by the coal seam under the in situ geological condition is a complex intercoupling process of stress, coal seam, and gas. The adsorption-induced coal swelling behavior is influenced by the coal mechanical property, stress, gas type, gas pressure, and gas state. Most of the above-mentioned mathematical methods do not consider the influences of those factors. Therefore, based on the thermodynamic theory and the Gibbs adsorption model, taking into consideration the energy conservation in the process of coal adsorption of gas, a thermodynamic method for evaluating the gas adsorption-induced swelling behavior of the confined coal was established, and its applicability for geological storage of CO2 in coal seam was also discussed.

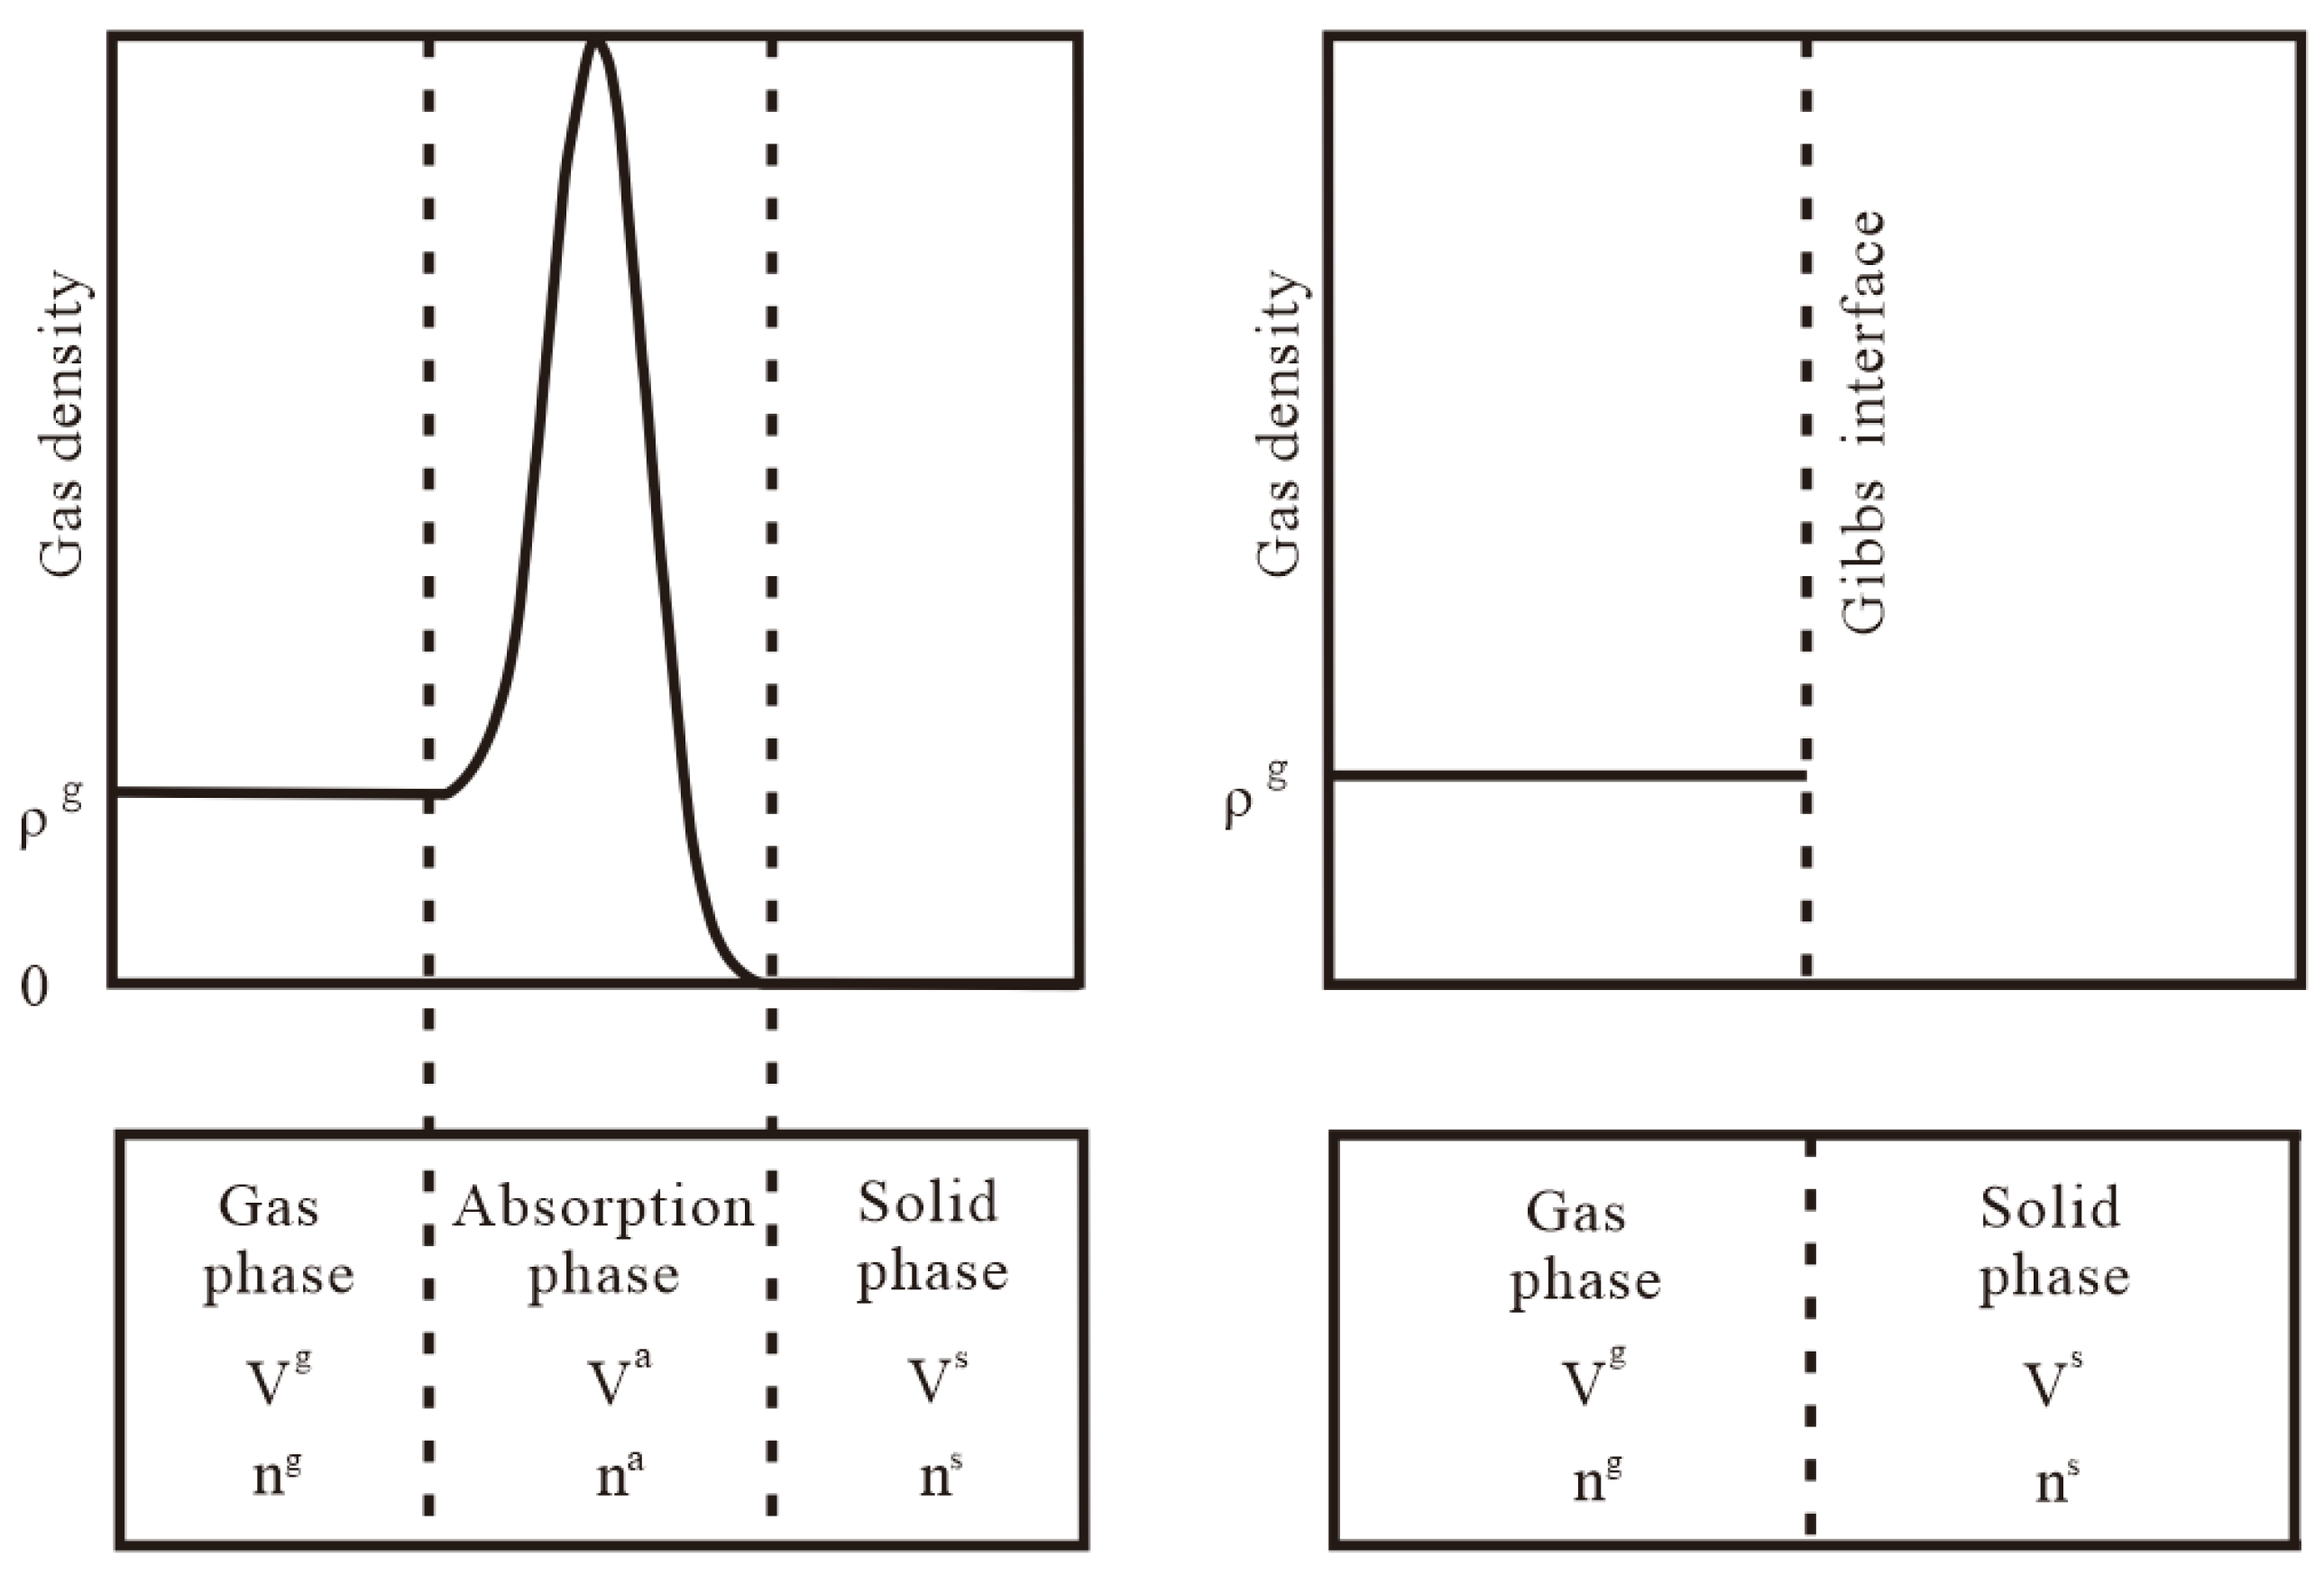
2. Establishment of the Thermodynamic Method

Interface phenomena refer to all the effects related to momentum, energy, and mass transfer, as well as physical and chemical interactions that occur at the interface of different phases [19]. The interaction force between molecules of different phases is in a certain range, which should be regarded as an interface phase with a certain thickness. Due to significant changes in gas density within a certain range of the adsorption interface, it is impossible to accurately determine where gas adsorption occurs. It was proposed to consider the interface of two-phase as a geometric plane without thickness (i.e., Gibbs interface). Then, the Gibbs model was derived. In the Gibbs model, the assumed zero position of excess adsorption on the adsorbent surface was selected as the Gibbs interface. The gas solid system between the CO2 and the confined coal is composed of three-phase material: gas phase, adsorption phase, and solid phase. Herein, the free CO2 molecule is the gas phase, the adsorbed CO2 molecule is the adsorption phase, and the confined coal is the solid phase. The Gibbs model is derived based on thermodynamic laws under constant temperature and pressure conditions. This model takes into consideration the macroscopic thermodynamic relationships during the adsorption process. Therefore, it is applicable to describe the gas solid adsorption phenomenon either for monolayer adsorption or multilayer adsorption. Using this model as a reference, the mathematical method can be established for evaluating the adsorption-induced swelling behavior of gas solid system between the CO2 and the confined coal.
According to the thermodynamics principles, the capacity property of the gas solid system consisted of the confined coal and the gas is constant which remains unchanged before and after gas adsorption by the confined coal [20]. For this gas solid adsorption system, under low-pressure adsorption conditions, the adsorbed gas can be considered as an ideal gas, its chemical potential can be written as:
μ g i d e a l = μ Θ g , T + R T ln p / p Θ
Under high-pressure adsorption conditions, the adsorbed gas is close to real gas whose chemical potential can be written as:
μ ( g ) r e a l = μ Θ ( g , T ) + R T ln ( p ~ / p Θ )
Among them, p ~ is the fugacity of gas; γ is the fugacity coefficient of real gas; p ~ = γ p .The gas only approaches the behavior of ideal gas at low-pressure condition ( p 0 ). At that condition, the ideal gas meets the relationship of p ~ = p . R is the thermodynamic constant.
To make the chemical potential of real gas have a simple expression form, the concept of fugacity was introduced. In the experiment of adsorption-induced swelling of confined coal, the gas pressure is greater than 0.1 MPa. The gas properties are different from the standard state. Therefore, introducing fugacity is of great significance for accurately calculating the chemical potential of the real gas at different pressures. Equations (1) and (2) show the chemical potential of the gas in the standard state. The standard state refers to the ideal state with a specified temperature and standard pressure of 0.1 MPa. Taking the standard state as a reference, the chemical potential of the gas molecule at other conditions can be obtained.
For the isothermal adsorption of the gas solid system, the temperature is constant. When single gas (i.g., N2 or CO2) is taken for experiment, the change of surface potential energy before and after gas adsorption by the confined coal can be expressed as follows:
d Φ = V a d P R T n i a d l n ( P ~ )
V a is the value of gas adsorption-induced swelling strain of the confined coal; n i a is the mole number of adsorbed gas, mol; i means N2 or CO2; T is absolute temperature, K.
According to the Equation (3), the following expression can be got for the real gas:
Φ r e a l = 0 p V a d P R T 0 p ~ ( n i a d ln P ~ )
If the gas under different pressures is always regarded as ideal gas, the change of the surface potential energy of confined coal by gas adsorption can be expressed as follows:
Φ i d e a l = 0 p V a d P R T 0 p ( n i a d ln P )
Based on the theory of interfacial chemistry, the gas adsorption-induced swelling deformation value of the confined coal is proportional to its surface energy reduction value. Thus, the surface energy change of the confined coal caused by gas adsorption is equal to its change in the elastic energy. Assuming that the confined coal is isotropic, the gas adsorption-induced swelling deformation shows a same linear strain in each direction. Then, the volume strain of the confined coal caused by gas adsorption can be expressed as follows: [21]
ε a d s . = 3 × ( φ S ρ s E s ) [ 2 ( 1 E s ) ( 1 + E s ) c x ] [ 3 5 E s 4 ( 1 2 E s ) c x ] ( 3 5 E s ) ( 2 3 c x )
Here, c = 1.2 , x = a / l , S is the specific surface area of the confined coal; φ is the unit specific surface energy; E s is the elastic modulus of coal skeleton. x represents the shape of the coal, if the coal has a circular pore, its value is 0.5.
According to elastic mechanics, the strain of confined coal induced by the gas pressure can be expressed as follows [22]:
ε p r e . = 1 E ( 1 2 υ ) Δ P
For the gas solid adsorption system, as the gas injected into the confined coal, the gas in the pore of coal can offset part of the stress applied on the coal. This will make a decrease in effective stress acting on the confined coal. According to Equation (7), the strain change of the confined coal caused by the dual action of the applied stress and gas pressure can be expressed as follows:
ε s t r . = 1 E ( 1 2 υ ) ( F α P )
Here, F is the applied stress, P is the gas pressure, and α is the pore pressure coefficient. Since the confined coal is not an ideal granular medium, its pore pressure coefficient is usually less than 1. The pore pressure coefficient is related to the coal structure, gas pressure, and applied stress. The effective pore pressure coefficients of coal at different gas pressure and stress conditions can be measured by injecting non-adsorbable helium to the confined coal.
From Equations (6) and (8), the strain of the confined coal caused by the surface energy change due to gas adsorption can be expressed as follows:
ε = 3 × ( φ S ρ s E s ) [ 2 ( 1 E s ) ( 1 + E s ) c x ] [ 3 5 E s 4 ( 1 2 E s ) c x ] ( 3 5 E s ) ( 2 3 c x ) 1 E ( 1 2 υ ) ( F α P )   = 3 × ( Φ ρ s E s ) [ 2 ( 1 E s ) ( 1 + E s ) c x ] [ 3 5 E s 4 ( 1 2 E s ) c x ] ( 3 5 E s ) ( 2 3 c x ) 1 E ( 1 2 υ ) ( F α P )
If the gas is regarded as real gas, the fugacity needs to be considered. Then, the adsorption-induced swelling deformation of the confined coal can be obtained from Equations (4) and (9) as follows:
ε r e a l = 3 × 0 p V a d P R T 0 p ~ ( n i a d ln P ~ ) ρ s E s · 2 1 E s 1 + E s c x 3 5 E s 4 1 2 E s c x 3 5 E s 2 3 c x 1 E ( 1 2 υ ) ( F α P )
Here, ε r e a l represents the adsorption-induced swelling deformation for real gas. If the gas is regarded as ideal gas, the fugacity is not considered. Then, the adsorption-induced swelling deformation of the confined coal can be obtained from Equations (5) and (9) as follows:
ε i d e a l = 3 × [ 0 p V a d P R T 0 p ( n i a d ln P ) ] ρ s E s 2 1 E s 1 + E s c x 3 5 E s 4 1 2 E s c x 3 5 E s 2 3 c x 1 E ( 1 2 υ ) ( F α P )
Here, ε i d e a l represents the adsorption-induced swelling deformation for ideal gas.

3. Experimental Method

3.1. Measurement of Gas Adsorption Capacity

In the laboratory experiment, the high-rank coal was used to measure its gas adsorption capacity and adsorption-induced swelling strain. The principal diagram of the experimental device is shown in Figure 1.
The measurement procedure of the gas adsorption content for the confined coal is explained in detail as follows. Firstly, before the experiment started the non-adsorbable gas of helium was used to obtain the dead volume of the experimental device. Then, a certain pressure of gas was injected into the reference cylinder with volume V 1 through the gas source in Part 1. Giving sufficient gas in the reference cylinder ensures the adsorption experiment. As the gas is injected into the reference cylinder, there is an initial gas pressure P 1 0 . The gas in the reference cylinder was used for the experiment. By controlling its pressure, the gas flows through pipeline 1 with volume V 1 and pipeline 2 with volume V 2 into the sample holding system with volume V 4 (Part 3). Then, the gas adsorption experiment for the confined coal begins. When the confined coal reaches its adsorption equilibrium, the gas pressure P t and temperature T in the reference cylinder are recorded. The amount of unadsorbed gas in the sample holding system can be obtained by the PRT equation. Then, the disappeared gas content can be obtained by subtracting the unadsorbed gas content from the original content. Accordingly, the Gibbs adsorption content can also be obtained. For the gas solid adsorption system, there are three phases: gas phase, adsorption phase, and solid phase. The density of the adsorption phase increases with the decrease in the distance between gas molecules and the pore surface of the confined coal. Gibbs assumes an ideal interface where the concentration of adsorbent on the surface is zero (Figure 2). By this ideal interface, the adsorption phase and gas phase are defined. Hence, the adsorption content measured by the volume method in this experiment is the Gibbs adsorption content. However, this adsorption content does not take into consideration the influence of the gas adsorption effect. It leads to the increase in the adsorption phase density. Accordingly, the absolute adsorption content can be obtained from the Gibbs adsorption content by Equation (12), which considers the adsorption phase density.
m 1 a = Δ m ( 1 ρ g ρ a ) 1
where m 1 a is the absolute adsorption content, mol/g; Δ m is the Gibbs excess adsorption content, mol/g; ρ g is the gas phase density, g/cm3; ρ a is the adsorption phase density, 1 g/cm3 for CO2.

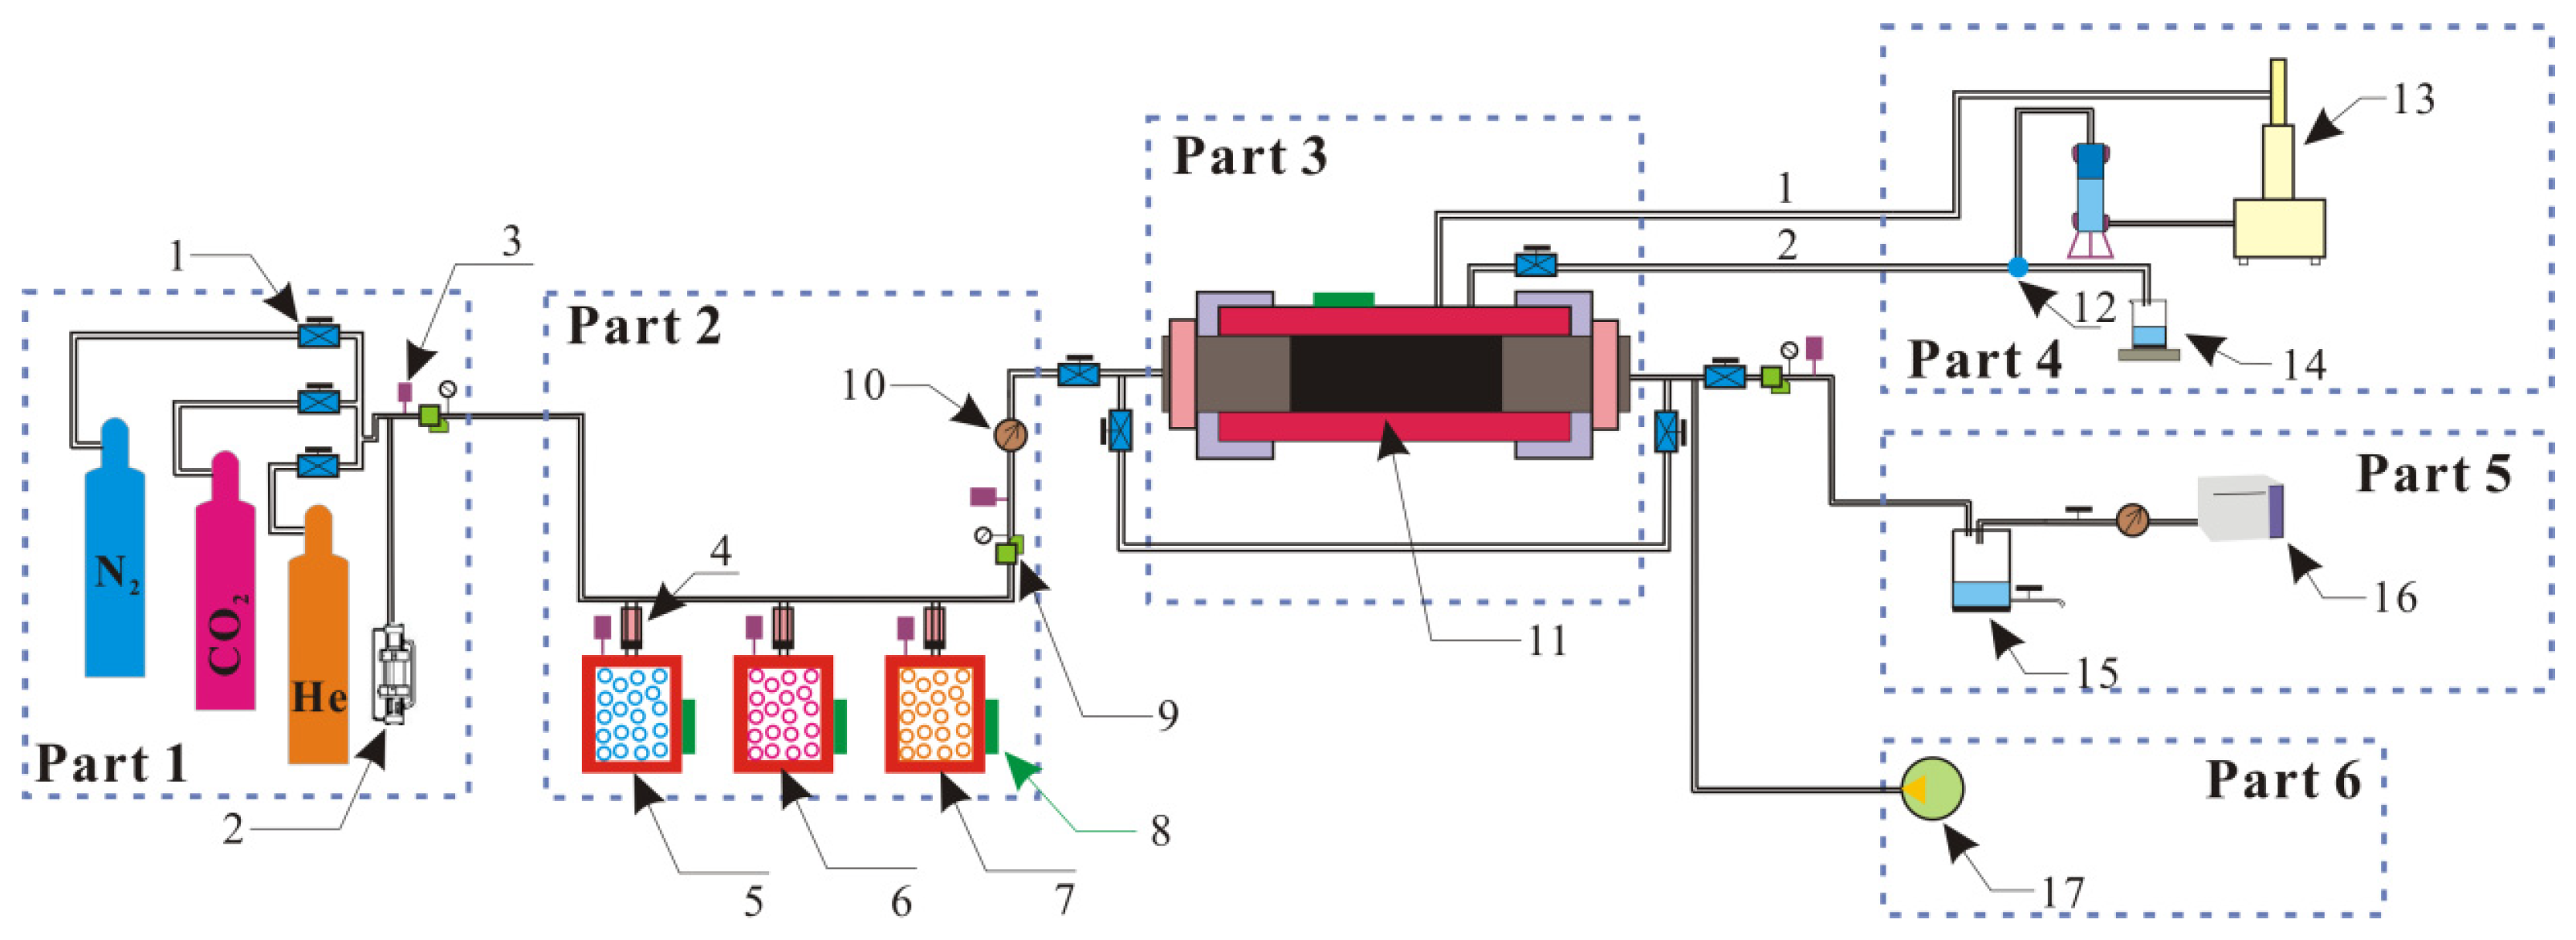
3.2. Strain Measurement of the Confined Coal

In the process of the gas adsorption content measurement, the strains of adsorption-induced swelling of the confined coal were also measured according to the following procedures: (i) two resistance strain gauges were fixed on the confined coal surface along the parallel and perpendicular directions of the long axis of a cylindrical sample. (ii) first, the coal was installed in the sample holding system, and then stress was applied, (iii) Helium gas was injected into the sample holding system and held for 10 h under the given temperature and pressure to check the device’s gas tightness, (iv) the pressure data were detected by the gas pressure sensor, aiming to ensure the air tightness of the device, (v) the acquisition frequency of the gas pressure sensor and strain data was set at 5 s to realize the synchronous acquisition of the gas pressure and strain data. The volumetric strain ( ε v ) was calculated from the axial strain ( ε 1 ) and the radial strain ( ε 2 ), as shown in Equation (13).
ε ν = ε 1 + 2 ε 2

4. Results and Discussions

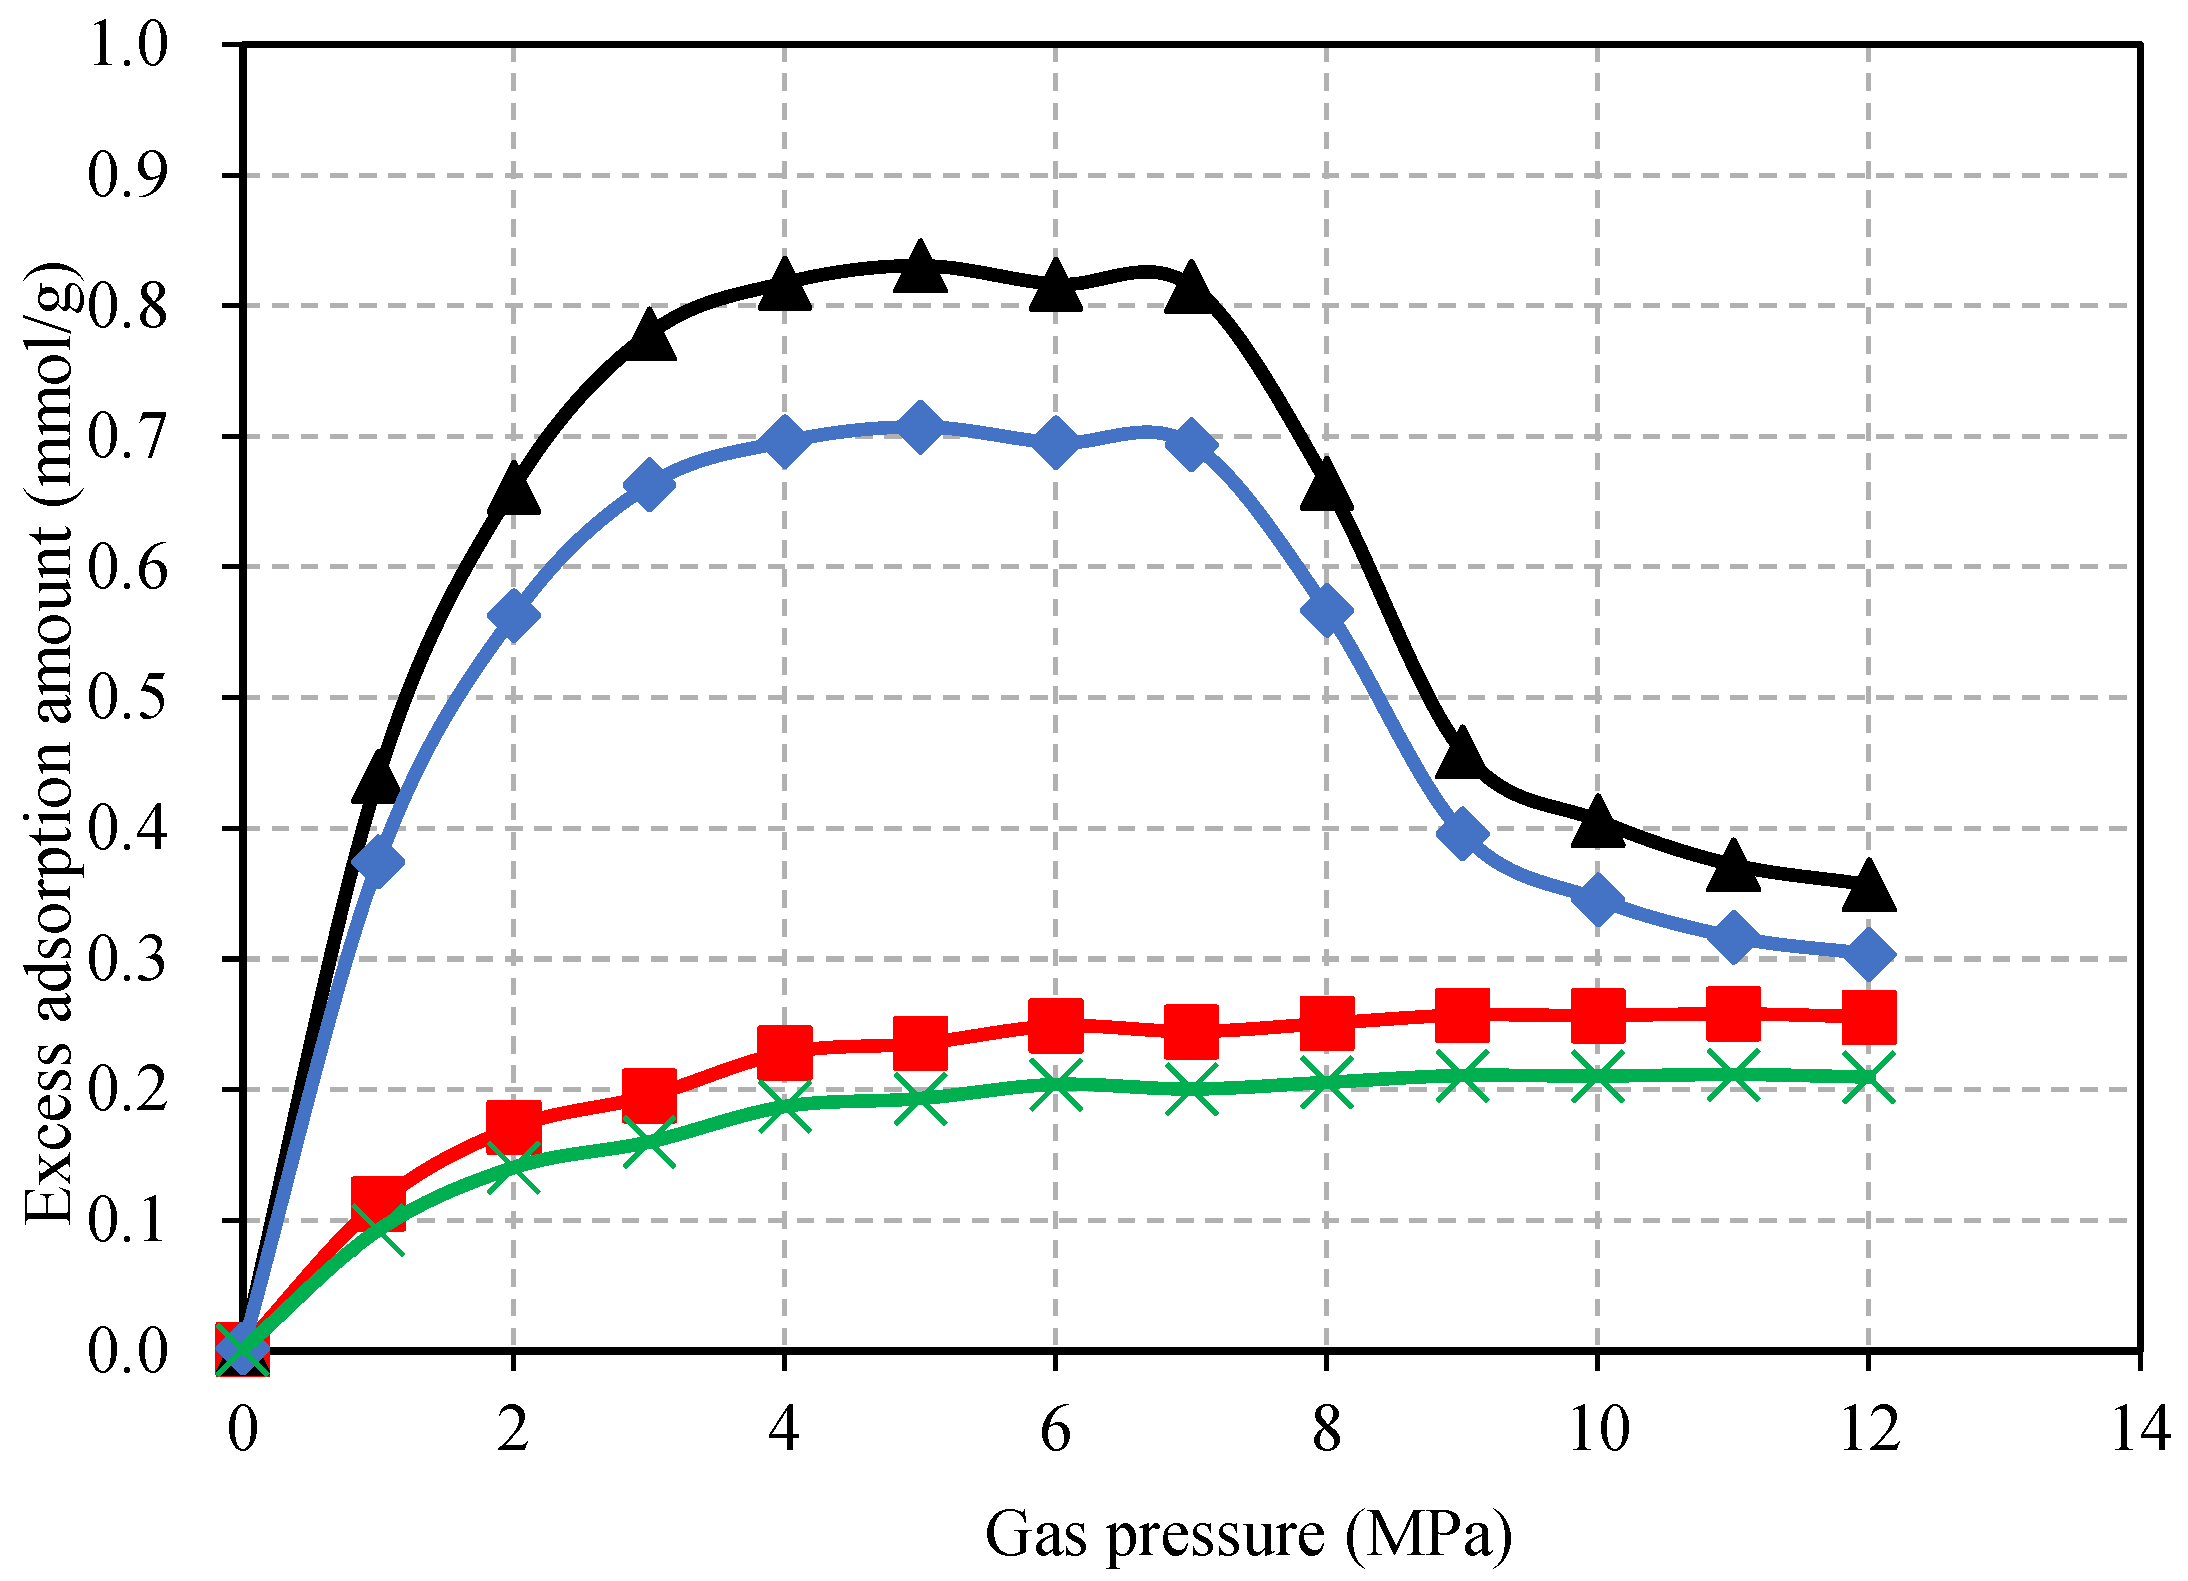
4.1. Gas Adsorption Content of the Confined Coal

Figure 3 shows the Gibbs excess adsorption amount of CO2 and N2 by the confined coal. It can be seen that, for CO2, when the gas pressure is greater than 7 MPa, the Gibbs excess adsorption amount decreases rapidly. However, for N2, the Gibbs excess adsorption amount did not show this trend. The explanation is that, for CO2, when the gas pressure is near or greater than its critical pressure (7.38 MPa), its density increases rapidly. Then, a phenomenon similar to capillary condensation will occur on the pore surface of the coal [23,24,25]. It will result in a decrease in the adsorption capacity measured by the volumetric method. According to Equation (12), the Gibbs excess adsorption amount is converted to absolute adsorption amount (Figure 4). It can be seen that, with the increase in the gas pressure, the absolute adsorption amount of CO2 by the confined coal continues to increase until reaching the adsorption saturation.
Table 1 shows the fitting results of the absolute adsorption amount based on the commonly used Langmuir adsorption model. For CO2, under the applied stress of 8 MPa on the coal, its adsorption capacity is 1.08 mmol/g. In contrast, under the applied stress of 10 MPa, its adsorption capacity is 0.86 mmol/g. With the increase in the applied stress, the adsorption capacity of the coal for CO2 decreases by 20.6%. There is a significant negative effect of the applied stress on the adsorption capacity of the coal. Under the applied stress, the internal pore and fracture system of the coal will be compressed. It will reduce the porosity and the adsorption site, which weakens the adsorption capacity of the coal [26,27,28]. The greater the applied stress, the greater the decrease in the adsorption capacity of the confined coal. For N2, under the applied stress of 8 MPa and 10 MPa, respectively, the adsorption capacity of the coal is 0.45 mmol/g and 0.38 mmol/g. With the increase in the applied stress, the adsorption capacity of the coal decreases by 15.6%. In comparison, the negative effect of the applied stress on the adsorption capacity of the coal is more significant for CO2 than N2. This may be because that there are all kinds of pores in the coal, such as the micropores, mesopores, and macropores. For different kinds of coal pores, their adsorption capacities differ greatly for CO2 and N2 [26]. With the increase in the applied stress, the number of pores or adsorption sites for CO2 adsorption decreased significantly.

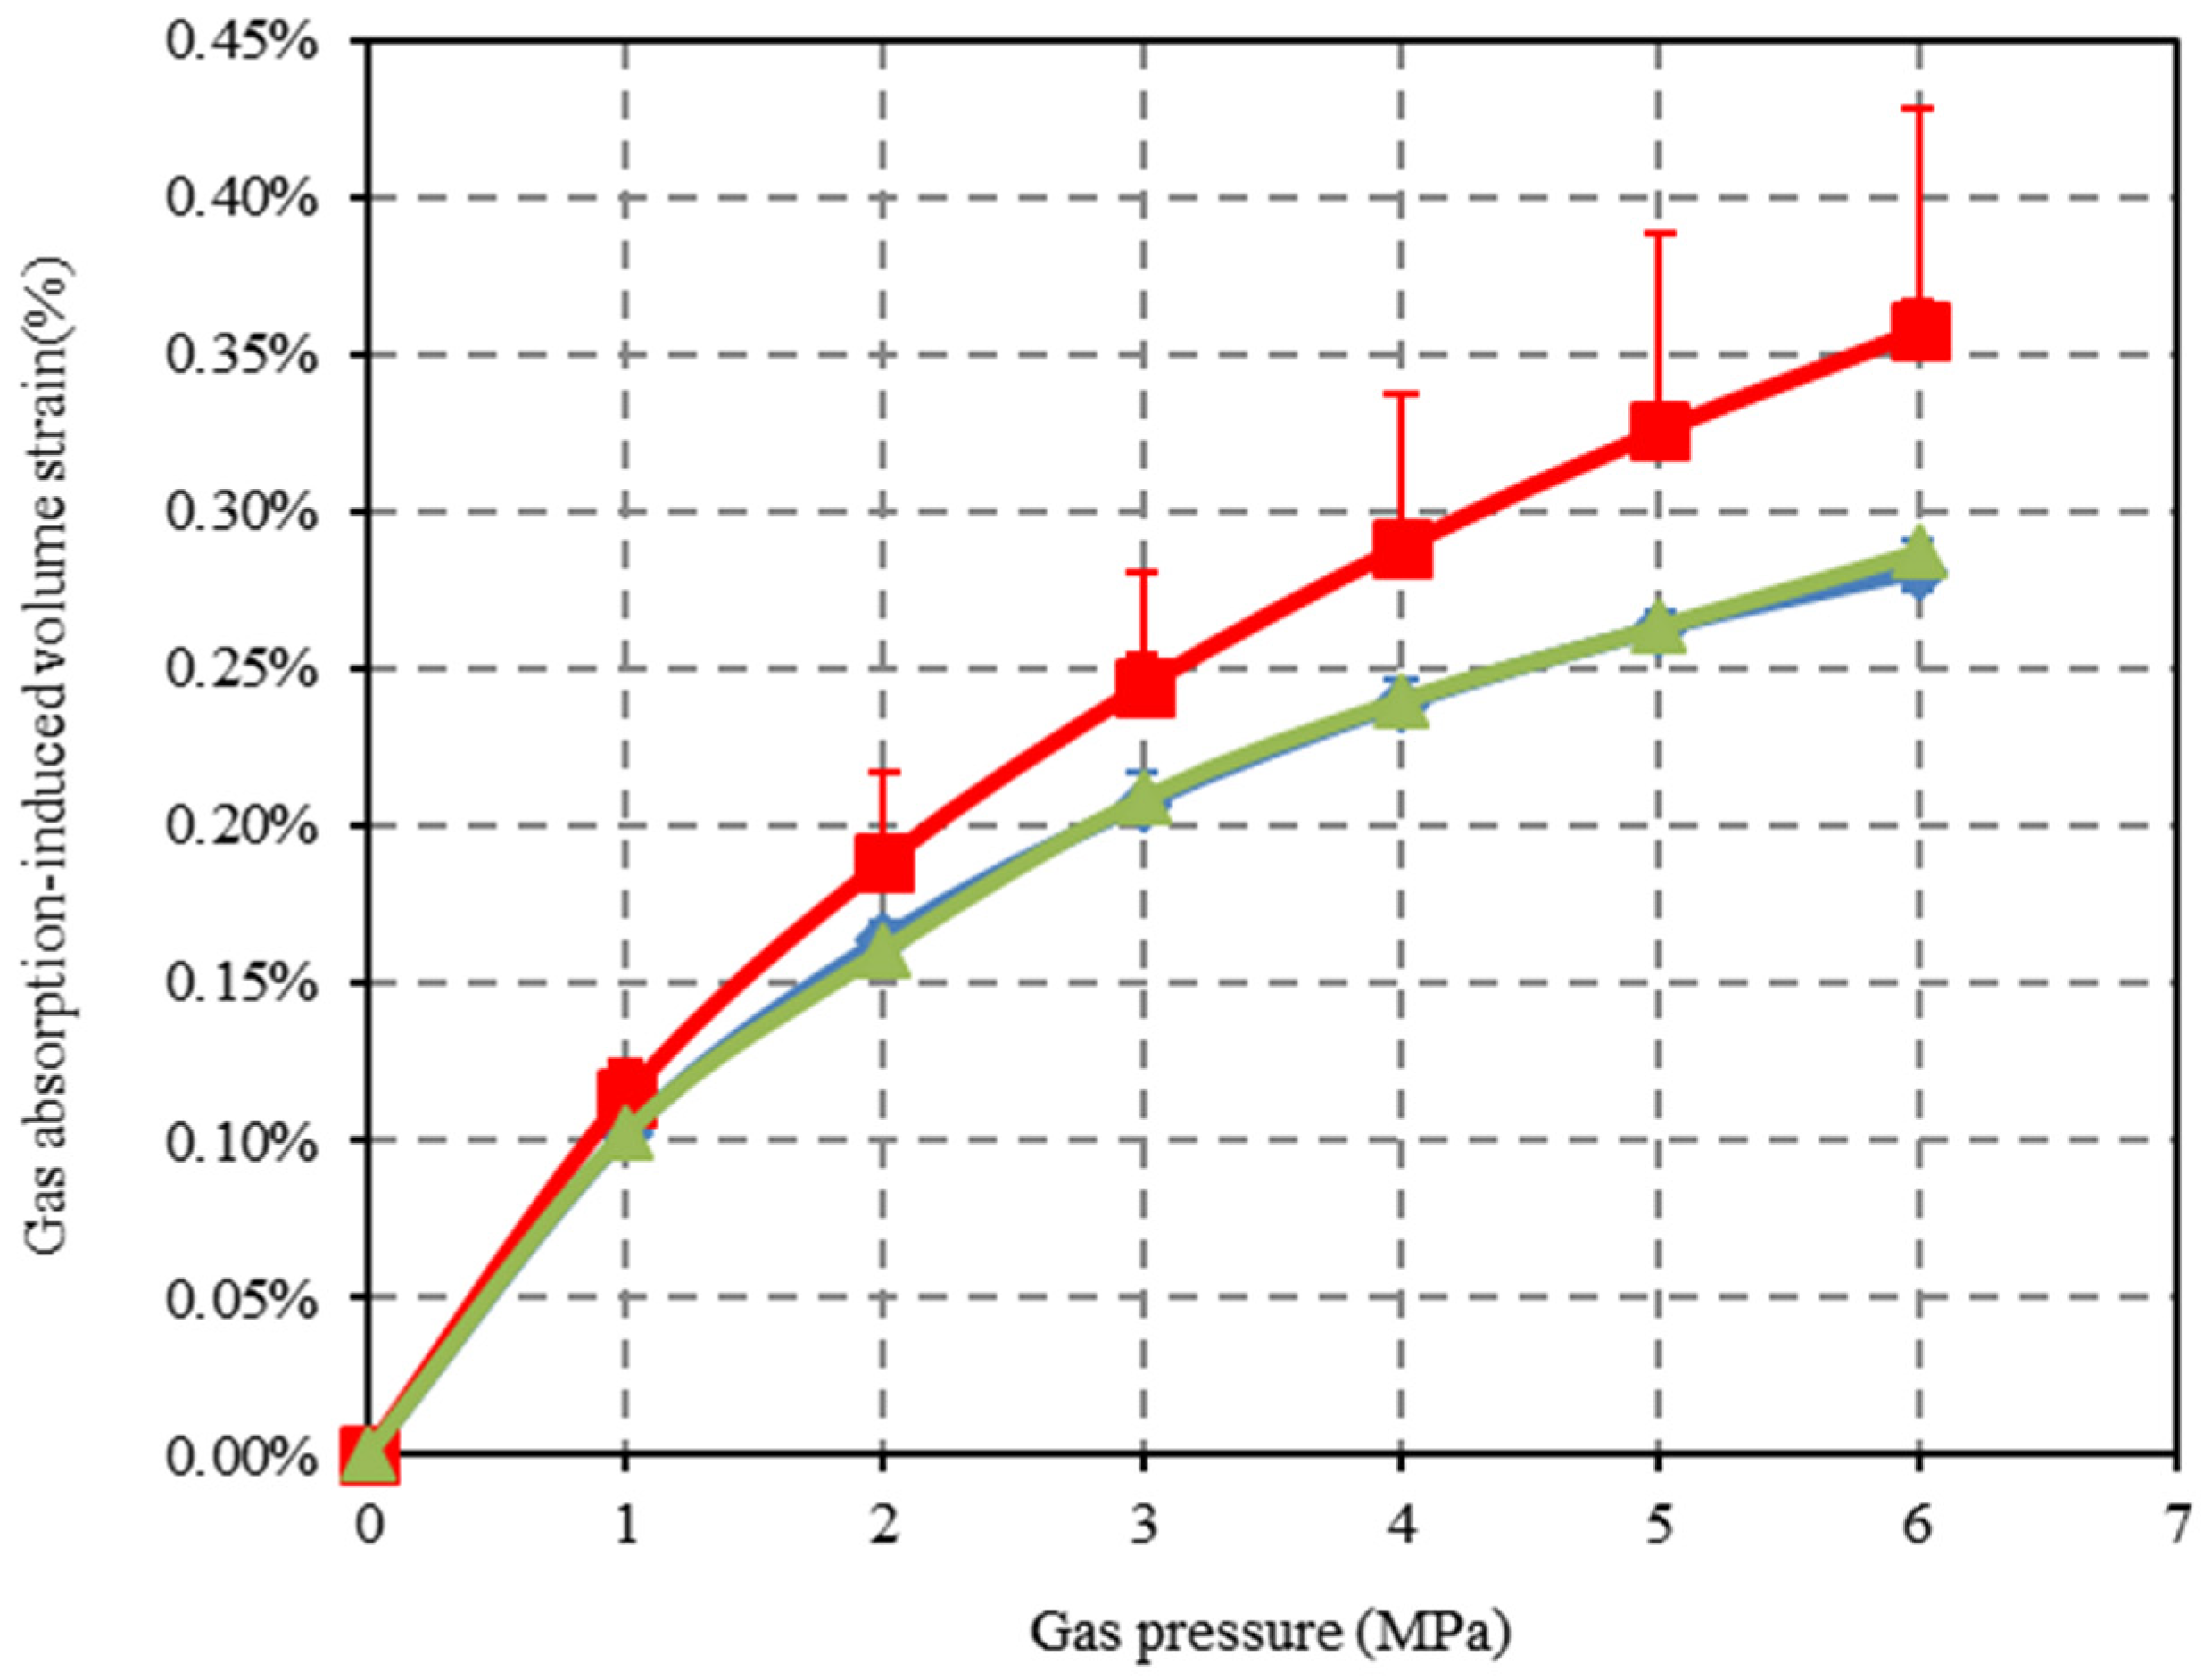
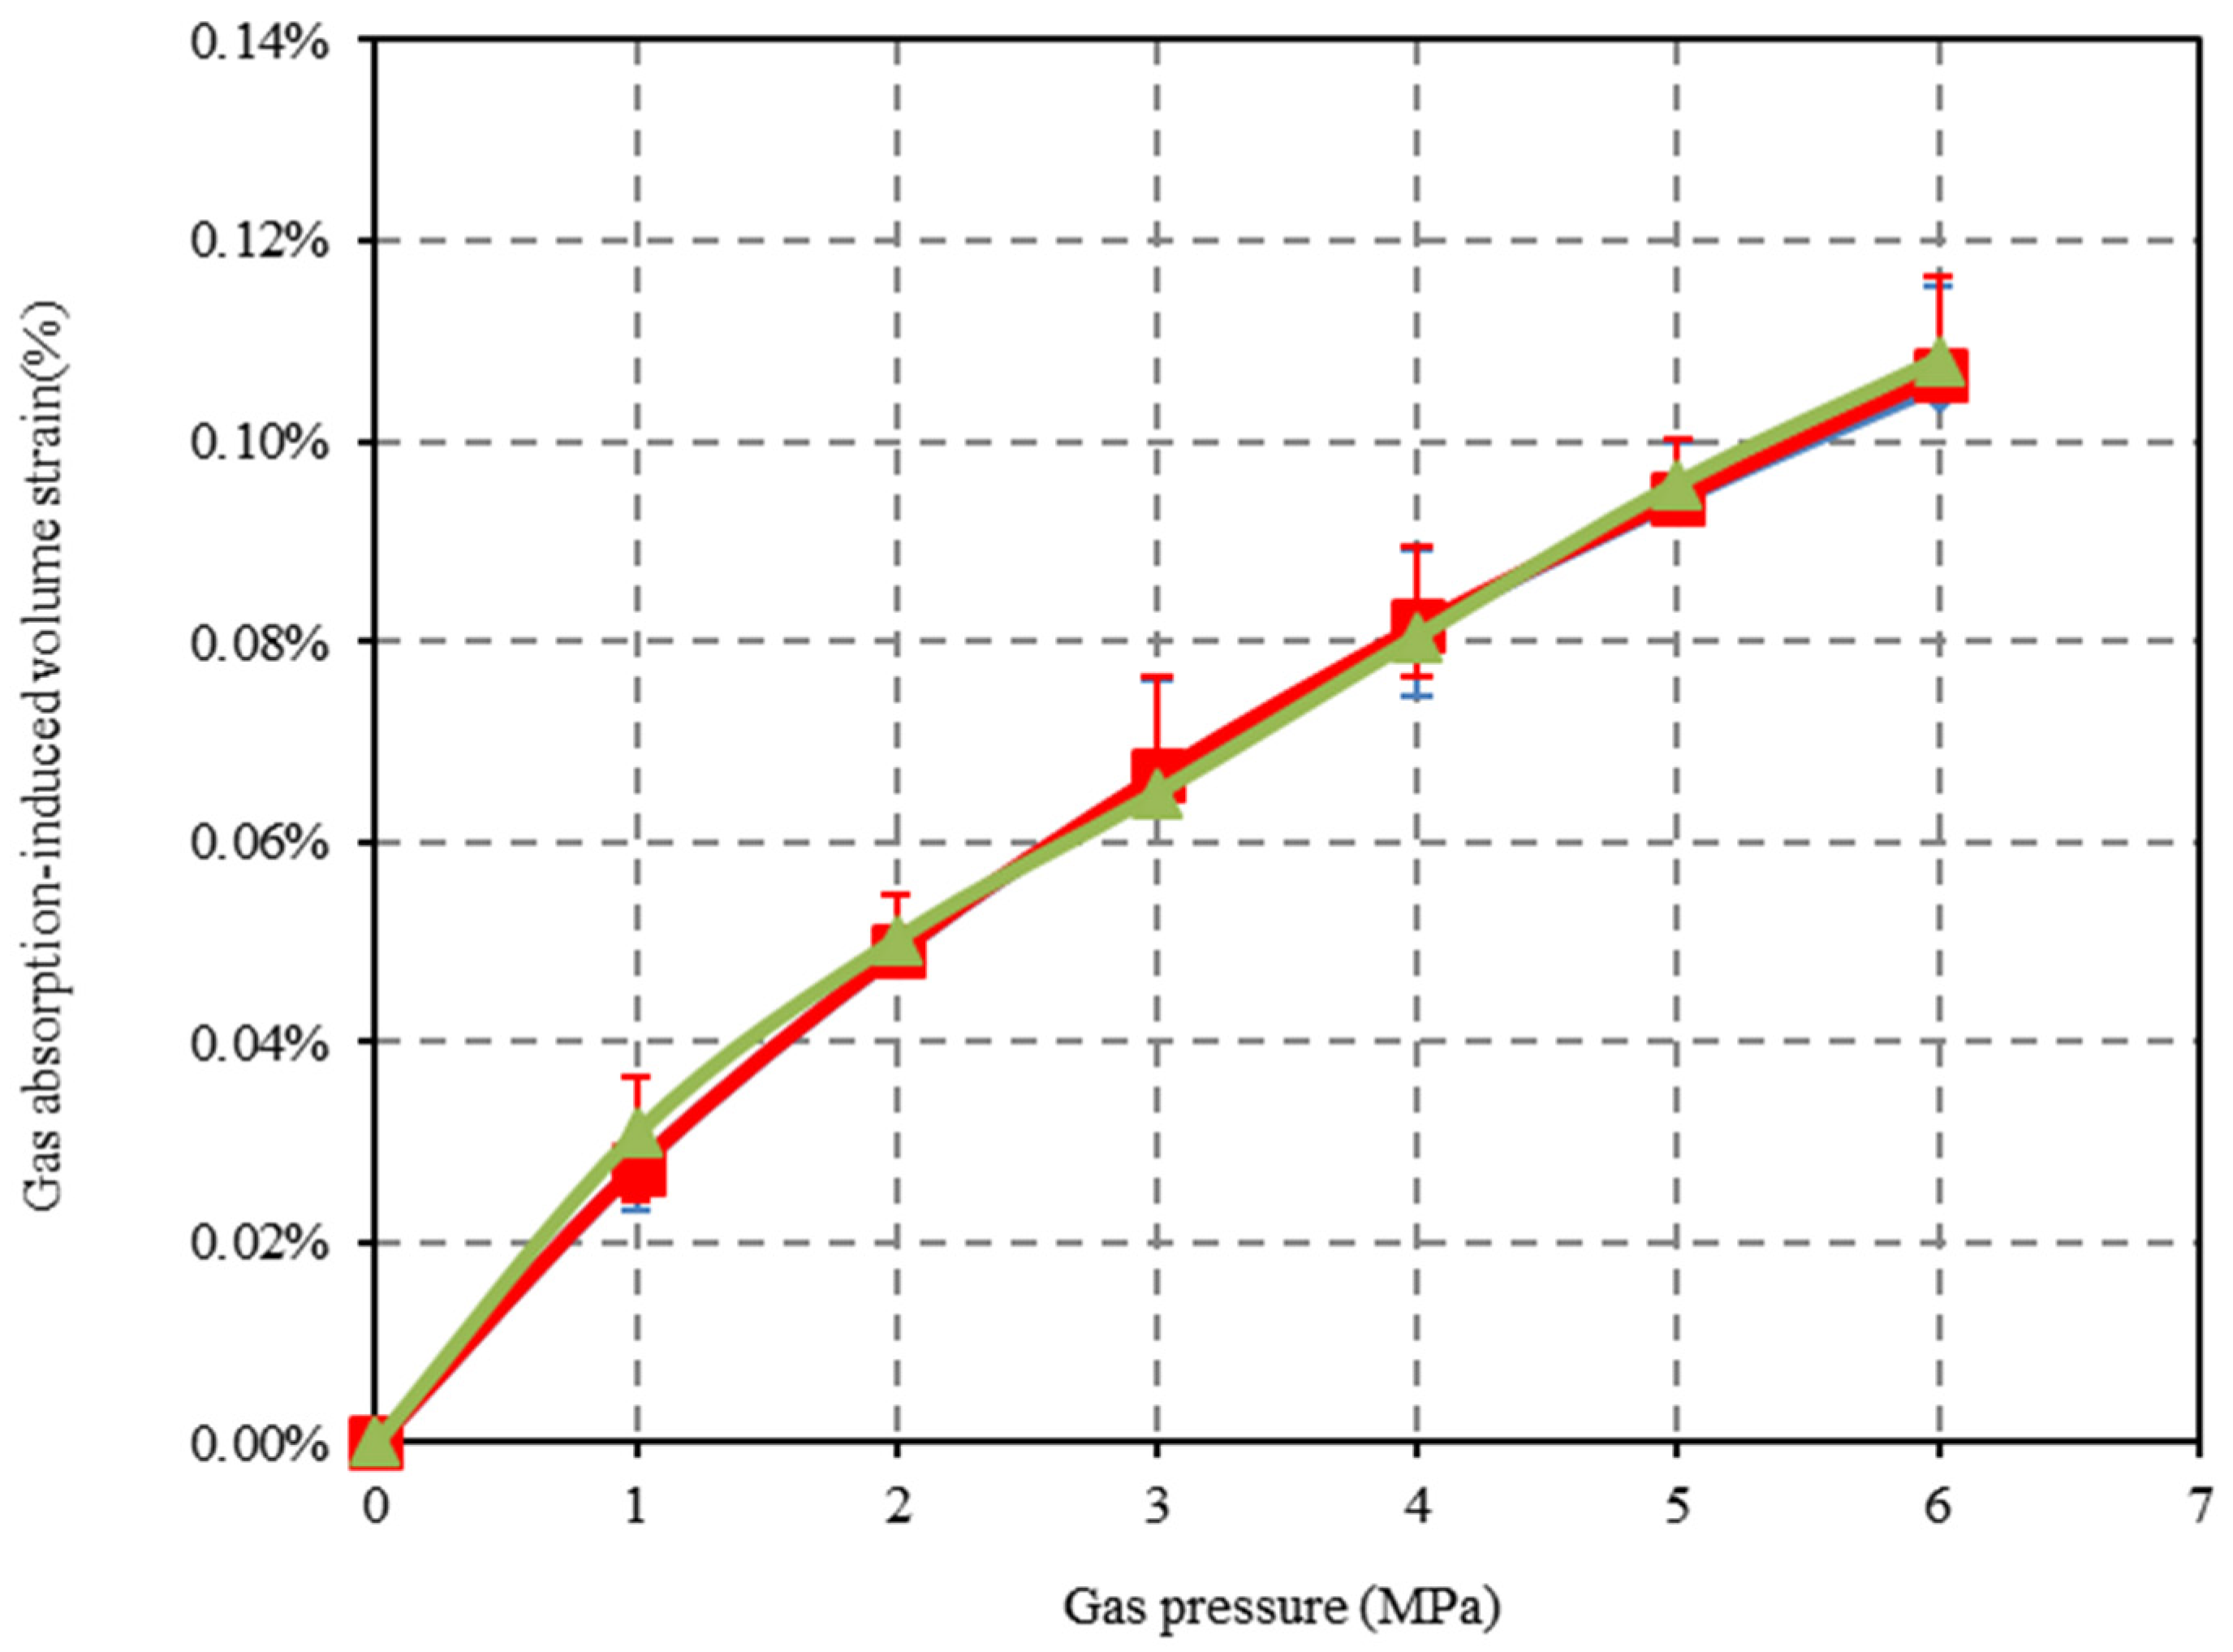
4.2. Gas Adsorption-Induced Deformation of the Confined Coal Under Applied Stress Condition

To verify the reliability of the established mathematical method for evaluating the adsorption-induced swelling behavior of the confined coal, the models with fugacity and without fugacity are both considered. The physicochemical parameters of CO2 and N2 are listed in Table 2 and Table 3. Taking into consideration the softening effect and dissolution effect of CO2 on the coal under high-pressure condition, the experiment under comparably low-pressure condition of 0 to 6 MPa was carried out [27]. The experimental results were compared with the predicted results by the established models. Table 4 shows the model parameters used in Equations (10) and (11), which are used to predict the adsorption-induced swelling strain of the confined coal.
Figure 5, Figure 6, Figure 7 and Figure 8 show the experimental and mathematical model-predictive strain value of the confined coal. For CO2, the mathematical model-predictive strain of Equation (10) is better than that of Equation (11) (Figure 5 and Figure 6). For N2, both Equations (10) and (11) have a good fitting effect (Figure 7 and Figure 8). The mathematical model of Equation (11) is based on the ideal gas hypothesis, which gives the predictive strain value consistent with the experimental value under the low-pressure condition (<2 MPa). The predictive strain value is higher than the experimental value under the high-pressure condition (>2 MPa). For example, under the condition of the gas pressure with 6 MPa, the experimental value of the adsorption-induced swelling strain of the confined coal is 0.373%. The mathematical model-predictive strain value of Equation (11) is 0.449%. The strain error reaches 20.36%. However, the value from Equation (10) based on the real gas is 0.380%. The strain error is only 1.87%.
As the adsorption process is exothermic, the adsorption phenomenon advances in the direction of entropy reduction. From the perspective of phase equilibrium, the gas molecules transfer from the adsorption sites of high chemical potential to the adsorption sites of low chemical potential [29,30,31]. Under the high-pressure condition, both the fugacity and the chemical potential of CO2 decrease significantly. If the gas is still regarded as an ideal gas, the chemical potential of gas molecules will be higher than that of the real gas. It will result in the increase in surface energy in the model. Eventually, a higher mathematical model-predictive strain value will be obtained.
However, for N2, its fugacity is changed less with the change of the gas pressure. The gas properties are close to the real gas under the low- and high-pressure conditions. Therefore, the strains predicted based on the ideal gas and real gas hypotheses are similar to the experimental results.

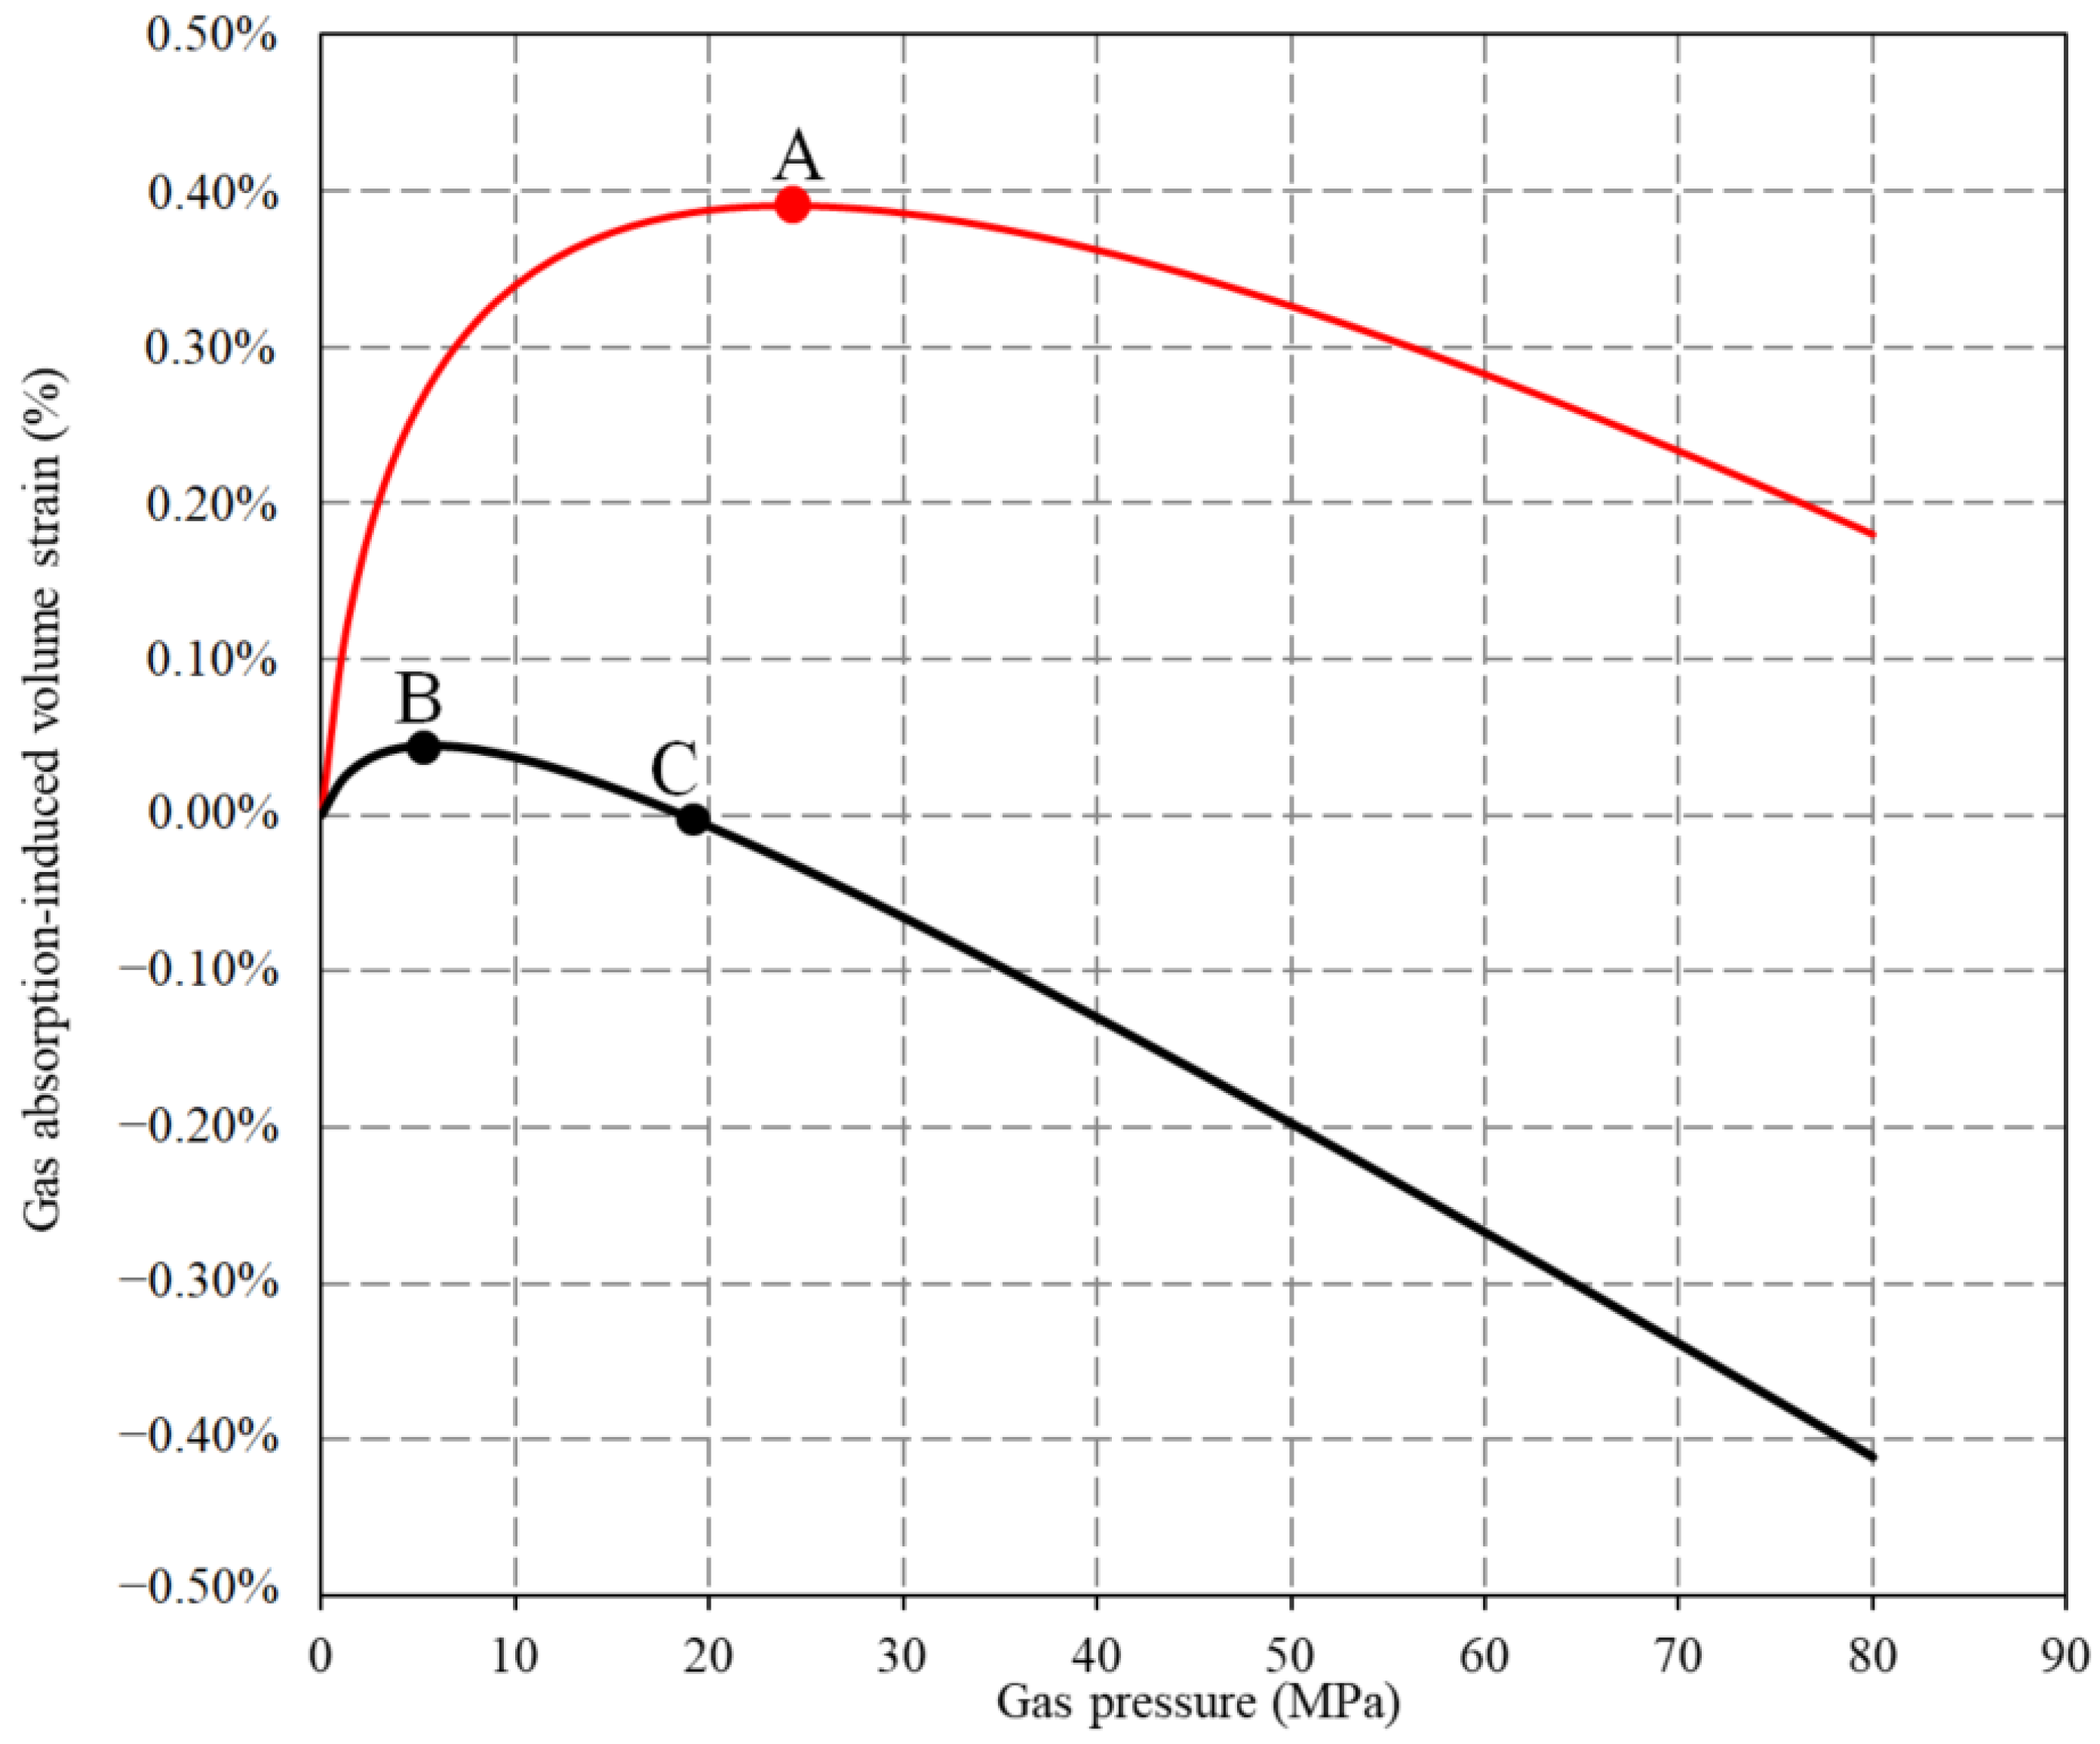
4.3. Gas Adsorption-Induced Deformation of the Confined Coal Under Ultra-High-Pressure Condition

For CO2 geological storage in deep unrecoverable coal seams, with the increase in burial depth, both the stress applied on the coal and the injection pressure of CO2 increases. Previous studies have shown that the adsorption-induced swelling behavior of the coal is a comprehensive result of the adsorption effect and the pore pressure effect [13,22]. Herein, the adsorption effect causes the swelling deformation, but the pore pressure effect causes the compression deformation. To investigate the deformation behavior of coal under ultra-high-pressure injection, the mathematical model of Equation (10) based on the real gas hypothesis was adopted to predict the strain of the coal (Figure 9). For CO2, there is a peaking strain gas pressure corresponding to point A (24 MPa). Before this pressure, with the increase in CO2 pressure, the deformation of coal continues to increase until it reaches the peak strain of 0.39%. After this pressure, with the increase in CO2 pressure, the deformation of coal begins to decrease. It means the gas adsorption-induced swelling deformation begins to decrease. Under the simulated ultra-high-pressure injection condition (<80 MPa), the deformation behavior of coal by CO2 adsorption is always dominated by the adsorption effect.
For N2, there is a peaking strain gas pressure corresponding to point B (5 MPa) and an equilibrium gas pressure corresponding to point C (18 MPa). Before the peaking strain gas pressure, the deformation of the confined coal increases with increased N2 pressure until it reaches the peak strain of 0.04%. After this pressure, the deformation of the confined coal begins to decrease. When the gas pressure is close to the equilibrium pressure, the influence of the adsorption effect and pore pressure effect on the deformation of coal is equal. Furthermore, as the gas pressure is greater than the equilibrium pressure, the deformation of the confined coal by N2 adsorption will be dominated by the pore pressure effect. With the increase in the gas pressure, the coal will appear shrinking deformation.
Compared to N2 with CO2, the coal by CO2 adsorption always shows the swelling deformation under the simulated condition of ultra-high-pressure injection. However, the coal by N2 adsorption at the condition of pressure more than the equilibrium pressure will shows shrinking deformation due to the pore pressure effect. This means that the permeability of the coal seam will be improved by N2 injection under the condition of the injection pressure being greater than its equilibrium pressure.

4.4. Implication for CO2 Geological Storage

Previous mathematical models, related to adsorption-induced swelling behavior of CO2 geological storage in coal seam, did not take into consideration the real state of the gas. The model based on the thermodynamic theory and the Gibbs adsorption model shows that for CO2 geological storage in coal seam, CO2 should be regarded as a real gas to predict gas adsorption-induced swelling strain. Under the condition of higher gas pressure (>2 MPa), the chemical potential of the real gas decreases significantly. If the real gas is regarded as an ideal gas, the surface energy in the prediction model will increase. This will result in a larger evaluated strain of CO2 adsorption-induced swelling by the coal seam. Then, an overestimated permeability damage will be given for the coal seam. Furthermore, the injectivity of CO2 into the targeted coal seam will be also misjudged. In the process of CO2 geological storage, with the increase in CO2 injection pressure, the adsorption capacity of CO2 by the coal seam increases continuously. Correspondingly, the storage capacity of CO2 by the coal seam increases continuously before its ultimate adsorption capacity.
With the increase in the buried depth, the stress applied on the coal seam increases. The stress-negative effect results in the decrease in CO2 adsorption capacity by the coal seam. This indicates that the CO2 storage capacity of coal seam is lower under the deep buried conditions compared with the shallow buried conditions. If CO2 geological storage is carried out in the deep buried unrecoverable coal seams, the structural parts with low stress such as fold wing, tectonic slope zone, and tectonic flexural end should be preferred in consideration.
The coal will continuously increase its swelling deformation with the injection of CO2 before the peaking strain gas pressure, and then it will decrease its swelling deformation after the peaking strain gas pressure. Moreover, in the process of CO2 injection to the coal seam containing with CH4, there is a replacement effect of CH4 by CO2. The higher the CO2 injection pressure, the easier the CH4 desorption from the coal [26]. Thus, CO2 geological storage in the deep buried coal seams can be carried out by high-pressure injection of more than the peaking strain gas pressure. This is not only helpful for CO2 injection into coal seam but also helpful to CH4 extrusion. Due to the pore compression effect, N2 can also be mixed to improve the injectivity of CO2. In addition, CO2 in the deep burial coal seam is in a supercritical state, which has an opening effect on the pore and fracture system of the coal [4]. This can improve the permeability of coal at a certain extent. Therefore, the injection well can be closed for some time after the high-pressure CO2 being injected into the coal seam. When the permeability of the coal is improved more or less due to the opening effect of supercritical CO2, the injection operation can be started again. That is, the CO2 geological storage in deep burial coal seam can be carried out by intermittent injection under high-pressure condition along with mixed N2.

5. Conclusions

(1)
In the process of CO2 adsorption by the confined coal, when the gas pressure is close to its critical pressure, the capillary condensation of CO2 will occur on the coal pore surface. This will result in an excessive adsorption of CO2. With the increase in the applied stress, the porosity and fracture aperture decrease. The applied stress has a negative effect on the adsorption capacity and the adsorption-induced swelling behavior of the confined coal. Compared with N2, the applied stress has a more obvious negative effect on CO2 for the adsorption-induced swelling behavior of the confined coal.
(2)
The prediction results of the established mathematical method based on the ideal gas hypothesis is consistent with the experimental result under the low-pressure condition for CO2 (<2 MPa). It is higher than the experimental result under the high-pressure condition (>2 MPa). However, the prediction model of the established mathematical method based on the real gas state has better prediction results under both low- and high-pressure conditions. If the real gas is regarded as an ideal gas, the prediction result of the adsorption-induced swelling deformation of the confined coal will be increased.
(3)
In the process of geological storage of CO2 in coal seam, it is necessary to take the real gas state to predict the adsorption-induced swelling strain of the coal seam. Otherwise, the permeability damage degree of the coal seam by CO2 injection will be overestimated. The injectivity of CO2 to the targeted coal seam will be misjudged. For CO2 geological storage in the coal seam, the structural parts with low stress such as fold wing, tectonic slope zone, and tectonic flexural end should be preferred in consideration. Intermittent injection of CO2 to the coal seam can be carried out under high-pressure condition with mixed N2.
(4)
In this paper, the model assumes a simplified geo-stress environment and does not account for factors like coal seam heterogeneity, varying porosity, and fracture distribution. In addition, the research focuses mainly on the short-term adsorption-induced swelling behavior under specific pressure and stress conditions. Long-term changes in permeability, fracture propagation, and gas storage potential over extended periods of CO2 injection are not considered. In the next study, these limitations will be considered.

Author Contributions

Z.D. and Q.H. were responsible for the experiments and the writing of this paper. T.C. and S.H. contributed to the drawing of figures in this paper. S.Y., F.G., and Y.D. provided language help. P.H. and N.L. helped collect the coal samples used in the experiment. Each author has contributed to this paper. All authors have read and agreed to the published version of the manuscript.

Funding

This work was aided by Training Plan for Young Backbone Teachers of Universities of Henan Province (No.2023GGJS164), Key Science and Technology Research Projects of Henan Province (No.242102320026), Natural Science Foundation of Henan Province (No.242300421255), and Henan Province Key Research and Development Project (No. 251111321500).

Data Availability Statement

The data presented in this study are available on request from the corresponding author.

Conflicts of Interest

The authors declare no conflicts of interest.

References

  1. Enobong, H.; Chukwuebuka, N.; Victor, O.H. Carbon capture, utilization, and storage (CCUS) technologies: Evaluating the effectiveness of advanced CCUS solutions for reducing CO2 emissions. Results Surf. Interfaces 2025, 18, 100381. [Google Scholar]
  2. Mwakipunda, G.C.; Wang, Y.; Mgimba, M.M.; Ngata, M.R.; Alhassan, J.; Mkono, C.N.; Yu, L. Recent advances in carbon dioxide sequestration in deep unmineable coal seams using CO2-ECBM technology: Experimental studies, simulation, and field applications. Energy Fuels 2023, 37, 17161–17186. [Google Scholar] [CrossRef]
  3. Fang, H.H.; Li, A.; Sang, S.X.; Gu, C.C.; Yang, J.; Li, L.L.; Liu, H.H.; Xu, H.J.; Huang, Y.H. Numerical analysis of permeability rebound and recovery evolution with THM multi-physical field models during CBM extraction in crushed soft coal with low permeability and its indicative significance to CO2 geological sequestration. Energy 2023, 262, 125395. [Google Scholar] [CrossRef]
  4. Hosseinzadeh, S.; Haghighi, M.; Salmachi, A.; Shokrollahi, A. Carbon dioxide storage within coal reservoirs: A comprehensive review. Geoenergy Sci. Eng. 2024, 241, 213198. [Google Scholar] [CrossRef]
  5. Karacan, C.Ö. Swelling-induced volumetric strains internal to a stressed coal associated with CO2 Sorption. Int. J. Coal Geol. 2007, 72, 209–220. [Google Scholar] [CrossRef]
  6. Day, S.; Fry, R.; Sakurovs, R.; Weir, S. Swelling of coals by supercritical gases and its relationship to sorption. Energy Fuels 2010, 24, 2777–2783. [Google Scholar] [CrossRef]
  7. Meng, Y.Y.; Yu, L.Y.; Yuan, L. Effects of bedding angle and confining pressure on the mechanical behavior, energy dissipation and micro damage evolution mechanism of layered rock mass under triaxial compression conditions. J. Mater. Res. Technol. 2025, 36, 1259–1272. [Google Scholar] [CrossRef]
  8. Karacan, C.Ö. Heterogeneous sorption and swelling in a confined and stressed coal during CO2 injection. Energy Fuels 2003, 17, 1595–1608. [Google Scholar] [CrossRef]
  9. Niu, Q.H.; Cao, L.W.; Sang, S.X.; Zhou, X.Z.; Wang, Z.Z.; Wu, Z.Y. The adsorption-swelling and permeability characteristics of natural and reconstituted anthracite coals. Energy 2017, 141, 2206–2217. [Google Scholar] [CrossRef]
  10. Ranathunga, A.S.; Perera, M.S.A.; Ranjith, P.G.; Rathnaweera, T.D.; Zhang, X.G. Effect of coal rank on CO2 adsorption induced coal matrix swelling with different CO2 properties and reservoir depths. Energy Fuels 2017, 31, 5297–5305. [Google Scholar] [CrossRef]
  11. Liu, Z.D.; Cheng, Y.P.; Wang, Y.K.; Wang, L.; Li, W. Experimental investigation of CO2 injection into coal seam reservoir at in-situ stress conditions for enhanced coalbed methane recovery. Fuel 2019, 236, 709–716. [Google Scholar] [CrossRef]
  12. Wu, S.Y.; Zhao, W.; Guo, Y.Y. Parametric correlation between expansion deformation of coal mass and adsorption thermodynamics. J. Northeast. Univ. Nat. Sci. 2005, 26, 683–686. [Google Scholar]
  13. Pan, Z.J.; Luke, D.C. A theoretical model for gas adsorption-induced coal swelling. Int. J. Coal Geol. 2007, 69, 243–252. [Google Scholar] [CrossRef]
  14. Zhou, J.P.; Xian, X.F.; Jiang, Y.D.; Gu, D.S.; Wang, C. A model of adsorption induced coal deformation based on thermodynamics approach. J. Chin. Coal Soc. 2011, 36, 468–472. [Google Scholar]
  15. Hol, S.; Spiers, C.J. Competition between adsorption-induced swelling and elastic compression of coal at CO2 pressures up to 100 MPa. J. Mech. Phys. Solids 2012, 60, 1862–1882. [Google Scholar] [CrossRef]
  16. Kang, J.Q.; Elsworth, D.; Fu, X.H.; Liang, S.; Chen, H. Contribution of thermal expansion on gas adsorption to coal sorption-induced swelling. Chem. Eng. J. 2022, 432, 134427. [Google Scholar] [CrossRef]
  17. Li, L.W.; Liu, X.F.; Nie, B.S.; Sun, H.T.; Jia, X.Q.; Zhang, C.P. Microstructural alterations of coal induced by interaction with sequestered supercritical carbon dioxide. Energy 2024, 304, 131912. [Google Scholar] [CrossRef]
  18. Shi, F.R.; Xie, H.P.; Li, M.H.; Deng, B.Z.; Shang, D.L.; Lu, J. Heterogeneous mechanical and sorption characteristics induced interaction among different components in coal: Experiment and simulation. Int. J. Rock Mech. Min. Sci. 2025, 188, 106064. [Google Scholar] [CrossRef]
  19. Tóth, J. Adsorption: Theory, modeling, and analysis. Am. Inst. Phys. Conf. Ser. 2002, 107, 206–213. [Google Scholar]
  20. Myers, A.L. Thermodynamics of adsorption in porous materials. AIChE J. 2002, 48, 145–160. [Google Scholar] [CrossRef]
  21. Scherer, G.W. Dilation of porous glass. J. Am. Ceram. Soc. 1986, 69, 473–480. [Google Scholar] [CrossRef]
  22. Levine, J.R. Model Study of the Influence of Matrix Shrinkage on Absolute Permeability of Coal Bed Reservoirs. Geol. Soc. Lond. Spec. Publ. 1996, 109, 197–212. [Google Scholar] [CrossRef]
  23. Khudaida, K.J.; Das, D.B. A numerical analysis of the effectsof supercritical CO2 injection on CO2 storage capacities of geological formations. Clean Technol. 2020, 2, 333–364. [Google Scholar] [CrossRef]
  24. Ren, B.; Sun, Y.H.; Bryant, S. Maximizing local capillary trapping during CO2 injection. Energy Procedia 2014, 63, 5562–5576. [Google Scholar] [CrossRef]
  25. Walter, P.L.; Verma, S.K.; Riverautrilla, J.; Davis, A. Densities, porosities and surface areas of coal macerals as measured by their interaction with gases, vapours and liquids. Fuel 1988, 67, 1615–1623. [Google Scholar]
  26. Du, Z.G.; Huang, Q.; Guo, J.J.; Gao, F.Q.; Du, Y.Q. The occurrence of nano- and micro-scale pores and their controls on the selective migration of gases in the coals of different ranks. Fuel 2020, 264, 116748. [Google Scholar] [CrossRef]
  27. Nie, B.; Liu, X.; Yang, L.; Meng, J.; Li, X. Pore structure characterization of different rank coals using gas adsorption and scanning electron microscopy. Fuel 2015, 158, 908–917. [Google Scholar] [CrossRef]
  28. Yao, S.P.; Jiao, K.; Zhang, K.; Hu, W.X.; Hai, D.; Li, M.C.; Pei, W.M. An atomic force microscopy study of coal nanopore structure. Chin. Sci. Bull. 2011, 56, 2706–2712. [Google Scholar] [CrossRef]
  29. Pini, R.; Ottiger, S.; Burlini, L.; Storti, G.; Mazzotti, M. Sorption of carbon dioxide, methane and nitrogen in dry coals at high pressure and moderate temperature. Int. J. Greenh. Gas Control 2010, 4, 90–101. [Google Scholar] [CrossRef]
  30. Cohan, L.H. Hysteresis and the capillary theory of adsorption of vapors. J. Am. Chem. Soc. 2002, 66, 98–105. [Google Scholar] [CrossRef]
  31. Perera, M.S.A.; Ranjith, P.G.; Choi, S.K.; Airey, D.; Weniger, P. Estimation of gas adsorption capacity in coal: A review and an analytical study. Int. J. Coal Prep. Util. 2012, 32, 25–55. [Google Scholar] [CrossRef]
Figure 1. The principal diagram of the experimental device. Note: The experimental device consists of six subsystems: gas source and gas pressurization system (Part 1), reference cylinder and gas pretreatment system (Part 2), sample holding system (Part 3), confining stress system (Part 4), gas composition testing system (Part 5), and vacuum pumping system (Part 6). Among them, 1—manual valve; 2—gas booster pump; 3—gas pressure sensor; 4—pneumatic valve; 5—N2 reference cylinder; 6—CO2 reference cylinder; 7—Helium reference cylinder; 8—electric heater; 9—pressure regulating valve; 10—gas flow meter; 11—coal sample; 12—liquid discharge control valve; 13—constant speed and constant pressure pump; 14—precision balance; 15—gas liquid separation tank; 16—gas chromatography; 17—vacuum pump. The pressure regulating valve is produced by TESCOM company in Elk River, MN, USA, which is sealed with an O-ring and has a good sealing effect. The gas pressure sensor is produced by Senas company in Guangzhou, China, gas pressure measurement range: 0~0.01–250 MPa, with accuracy up to 0.01 MPa. The reference cylinder can bear the maximum gas pressure of 40 MPa; the sample holding system can bear the maximum stress of 25 MPa.
Processes 13 01504 g001
Figure 2. The gas density profile at the gas–solid interface.
Processes 13 01504 g002
Figure 3. The Gibbs adsorption amount of the high-rank coal under applied stress. Black line: CO2 adsorption with applied stress of 8 MPa; Blue line: CO2 adsorption with applied stress of 10 MPa; Red line: N2 adsorption with applied stress of 8 MPa; Green line: N2 adsorption with applied stress of 10 MPa.
Processes 13 01504 g003
Figure 4. The absolute adsorption amount of the high-rank coal under applied stress. Black line: CO2 adsorption with applied stress of 8 MPa; Blue line: CO2 adsorption with applied stress of 10 MPa; Red line: N2 adsorption with applied stress of 8 MPa; Green line: N2 adsorption with applied stress of 10 MPa.
Processes 13 01504 g004
Figure 5. The CO2 adsorption-induced swelling strain of the high-rank coal with applied stress of 8 MPa. Blue line: the prediction value of Equation (10); Red line: the prediction value of Equation (11); Green line: the experimental value.
Processes 13 01504 g005
Figure 6. The CO2 adsorption-induced swelling strain of the high-rank coal with applied stress of 10 MPa. Blue line: the prediction value of Equation (10); Red line: the prediction value of Equation (11); Green line: the experimental value.
Processes 13 01504 g006
Figure 7. The N2 adsorption-induced swelling strain of the high-rank coal with applied stress of 8 MPa. Blue line: the prediction value of the Equation (10); Red line: the prediction value of the Equation (11); Green line: the experimental value.
Processes 13 01504 g007
Figure 8. The N2 adsorption-induced swelling strain of the high-rank coal with applied stress of 10 MPa. Blue line: the prediction value of the Equation (10); Red line: the prediction value of the Equation (11); Green line: the experimental value.
Processes 13 01504 g008
Figure 9. Adsorption-induced swelling deformation of the confined coal under simulated ultra-high-pressure condition. Red line: CO2, Black line: N2, Point A: peaking strain gas pressure for CO2, Point B: peaking strain gas pressure for N2, Point C: equilibrium gas pressure for N2.
Processes 13 01504 g009
Table 1. The fitting result of the adsorption parameter.
Fitting ModelApplied Stress
(MPa)
Gas TypeAdsorption Capacity nmax (mmol/g)Adsorption Constant
B (MPa−1)
n a = n max B p 1 + B p 8CO21.080.6830
100.860.6842
8N20.450.3234
100.380.3289
Table 2. The physicochemical parameters of CO2.
Temperature
(K)
Gas Pressure
(MPa)
Gas Density (kg/m3)Enthalpy (KJ/Kg)Entropy
(KJ/Kg/K)
FugacityFugacity CoefficientChemical Potential
(KJ/Kg)
Molar Mass
(g/mol)
303.200.000511.01Infinite0.00001.00000.0044
303.2118.352501.742.2990.95330.9534−195.2044
303.2238.837491.572.14381.81470.9074−158.3344
303.2362.211480.22.03952.58540.8618−138.0644
303.2489.759467.151.95233.2660.8165−124.6844
303.25124.02451.441.86913.85540.7711−115.1844
303.26171.44430.711.77794.34930.7249−108.2744
303.27266.56392.711.63674.7320.676−103.4444
303.28701.72284.041.27194.89240.6116−101.5344
303.29744.31276.321.24195.01160.5569−100.1544
303.210771.5271.621.2225.12830.5128−98.83744
303.211791.67268.361.20715.24780.47707−97.61844
303.212808.54265.701.19425.36350.44696−96.36944
Table 3. The physicochemical parameters of N2.
Temperature
(K)
Gas Pressure
(MPa)
Gas Density (kg/m3)Enthalpy (KJ/Kg)Entropy
(KJ/Kg/K)
FugacityFugacity CoefficientChemical Potential
(KJ/Kg)
Molar Mass
(g/mol)
303.200.00000.0000314.74Infinite0.00001.00000.000028.013
303.201.000011.127312.616.16730.99850.9985−1557.328.013
303.202.000022.275310.515.95511.99460.9973−1495.128.013
303.203.000033.427308.475.82832.98890.9963−1458.728.013
303.204.000044.569306.475.73653.98210.9955−1432.828.013
303.205.000055.686304.535.66414.97480.9950−1412.828.013
303.206.000066.761302.655.60395.96770.9946−1396.428.013
303.207.000077.778300.835.55216.96170.9945−1382.628.013
303.208.000088.723299.075.50677.95720.9947−1370.528.013
303.209.000099.580297.385.46608.95510.9950−1359.928.013
303.2010.000110.34295.755.42929.95610.9956−1350.428.013
303.2011.000120.98294.195.395510.9610.9964−1341.728.013
303.2012.000131.49292.705.364511.9700.99750−1333.828.013
Table 4. Parameters used to evaluate the adsorption-induced swelling strain of the confined coal.
Gas Pressure (MPa)Applied Stress
(MPa)
Gas TypeAbsolute Adsorption Content
(mol/g)
Coal   Skeleton   Density   ρ s
(g/cm3)
Adsorption Constant (MPa−1)Modulus of Elasticity (GPa) Poisson   Ratio   υ Effective
Stress
Coefficient
68CO21.011.50.684.50.320.92
10CO20.860.68
8N20.290.45
10N20.240.45
Note: coal skeleton density is replaced by the true density.
Disclaimer/Publisher’s Note: The statements, opinions and data contained in all publications are solely those of the individual author(s) and contributor(s) and not of MDPI and/or the editor(s). MDPI and/or the editor(s) disclaim responsibility for any injury to people or property resulting from any ideas, methods, instructions or products referred to in the content.

