Article

MBSE-Based Integration of Superplastic Forming Manufacturing Process Information for Customized Products

1
State Key Laboratory of Advanced Forming Technology & Equipment, Beijing National Innovation Institute of Lightweight Ltd., Beijing 101407, China
2
Pen-Tung Sah Institute of Micro-Nano Science and Technology, Xiamen University, Xiamen 361102, China
*
Author to whom correspondence should be addressed.
Processes 2025, 13(5), 1497; https://doi.org/10.3390/pr13051497
Submission received: 20 March 2025 / Revised: 28 April 2025 / Accepted: 5 May 2025 / Published: 13 May 2025

Abstract

:
Optimizing superplastic forming (SPF) process parameters is vital for improving production efficiency and addressing the growing complexity of product requirements in high-end manufacturing fields. Current optimization of SPF process parameters focuses on meeting product requirements, often overlooking constraints related to quality indicators, process, and equipment limitations. This paper proposes an optimization approach that integrates SPF manufacturing process information using model-based systems engineering and simulation validation techniques to establish a continuous mapping between product requirements, process parameters, and equipment control parameters. First, SPF is modeled using the systems modeling language to describe the relationships between processes and equipment. Then, the process parameters are extracted via object flow analysis and categorized according to shape and performance control. The key process parameters and impact indicators for meeting customized product requirements are identified using the analytic hierarchy process. Finally, orthogonal experimental design and process simulation are employed to optimize the parameters, with the results mapped onto the physical model to guide the equipment control parameter design. A case study demonstrates its feasibility and effectiveness in meeting customized products.

1. Introduction

Superplastic forming (SPF) is a metal hot forming technology that has irreplaceable advantages in processing complex structures and producing components with excellent mechanical properties [1]. It has become a critical process choice in high-end equipment fields, such as aerospace, automotive manufacturing, and medical devices [2,3]. With the ongoing trend of modern manufacturing towards high-end and customized production, the requirement to fulfill diverse and intricate product criteria is rising, thereby imposing tougher challenges on SPF technology [4]. SPF leverages the superplasticity of specific materials by applying gas pressure at a certain temperature, causing the sheet material to slide within the die cavity, thereby forming the internal geometric shape of the mold [5]. It is characterized by strong process flow and high process coupling. The design of SPF processes to meet product-specific requirements requires not only adherence to process specifications [6], but an analysis of raw materials and equipment information [7]. Traditional methods relying primarily on the engineers’ experience for process parameters selection and optimization fail to ensure design efficiency and quality. Therefore, efficiently meeting customized product requirements, shortening design cycles, and optimizing design processes have become key research focuses in the field of SPF technology.
Currently, the methods for optimizing SPF process parameters mainly focus on two aspects: (1) multi-objective optimization of the forming parameters based on experimental design [8] and (2) enhancing the accuracy and efficiency of forming through finite element simulation [9,10]. For example, Jiang et al. determined the optimal forming parameters for the SPF of a hollow double-layer structure in a 5A90 aluminum–lithium alloy, with the best elongation rate of 243.97%, and verified the process feasibility using finite element simulation [11]. Wu et al. optimized the SPF/DB process parameters for the TC31 titanium alloy X-type lattice structure, combining experiments and finite element simulation to analyze deformation and compression failure modes, revising the compressive strength theoretical model, and improving prediction accuracy [12]. Yasmeen et al. simulated the superplastic behavior of TA15 and proposed a viscoplastic constitutive model, which was validated through finite element analysis for its accuracy in SPF, providing guidance for optimizing the forming processes of complex components [13]. Additionally, the introduction of machine learning has provided new technological pathways for optimizing SPF process parameters [4,14]. Wu et al. applied an improved Kriging response surface model and a genetic algorithm to optimize the SPF process for the Kagome lattice structure of titanium alloys, significantly enhancing its compressive strength [15]. These studies have expanded the applicability of SPF and effectively supported decision-making in the SPF process design. However, these methods primarily focused on meeting the product quality requirements of SPF, with limited consideration given to the impact of equipment control parameters on process parameters during the production process. In actual production, equipment control parameters play a significant role in determining product quality. Even when using the same process to produce a product, differences in equipment control parameters may lead to variations in process parameters. Therefore, when formulating process parameters, solely considering product requirements may make it difficult to achieve reliable and rapid mass production. Conversely, focusing exclusively on equipment information may compromise the final product’s quality. As such, the design of the SPF process parameters needs to comprehensively consider both product requirements and equipment information, under the premise of meeting customized product requirements, to ensure reliable production and enhance product competitiveness.
The existing research on complex manufacturing processes not only focuses on the process design itself but places particular emphasis on the requirements for equipment conditions and design standards during the process design phase [16,17]. Addressing the issue of optimizing the manufacturing process parameters for electroplated copper foil, which previously only considered product requirements, Jiang et al. proposed a method that combines neural networks and genetic algorithms to derive the optimal process parameters that satisfy both equipment conditions and product requirements [18]. Schindel et al. introduced a structured selection method that can rapidly integrate technology and equipment components in the case of process changes [19]. Sabioni et al. proposed a linear programming model for reconfigurable product configuration and process planning, which helps minimize the manufacturing cost for customized requirements [20]. Qi et al. proposed an improved hierarchical genetic algorithm that addresses layout selection, process sequencing, and equipment selection, and applied collaborative optimization techniques to reduce production cycles [21]. These studies suggest that it is of great value to fully consider manufacturing process information during the early stages of process design [22,23]. For manufacturing processes, like SPF, which are highly process-dependent, strongly coupled, and highly reliant on equipment, product quality is influenced by both process parameters and equipment control parameters. With the increasing requirement for customized production, the structural and control complexity of SPF equipment is also increasing, which further intensifies the challenge of aligning process design with equipment capabilities. Therefore, effectively organizing information related to quality indicators, processes, and equipment to support the optimization of SPF process parameters remains a key challenge that needs to be addressed in this field.
Model-based systems engineering (MBSE), as a method for designing complex systems, effectively facilitates the exchange of information across various disciplines. By integrating all relevant information into a set of interrelated models, MBSE enables the system to be described and represented from different perspectives [24,25]. MBSE has made significant progress in fields such as digital twins [26], aircraft design [27], and electromechanical product development [28]. MBSE technology can support planning for key decision points, ensuring that decisions are made cautiously and rationally to maximize system value. Sinnwell et al. proposed a planning process based on MBSE, aiming to integrate product development and manufacturing system planning information through the MBSE approach [29]. Le et al. introduced an MBSE-based method to support automation customization and expansion, creating a system model for drug manufacturing to support chemical supply chain analysis [30]. Steimer et al. proposed a model-based design process for manufacturing systems based on systems modeling language (SysML), including a four-layer description structure, and envisioned its application in later planning and interface specification [31]. Mousavi et al. applied MBSE to model semiconductor supply chains, identified disruption issues, and laid the methodological foundation for quantitative analysis and disruption management [32]. The above analysis demonstrates that MBSE can support the systematic representation of process and the management of manufacturing process information.
Although MBSE has been successfully applied in various manufacturing domains, its application in the field of SPF remains underexplored. More broadly, many MBSE-based approaches remain confined to technical or academic domains, and their transition to industrial practice is still limited. This highlights the importance of technology transfer as a structured mechanism for moving scientific innovations toward practical adoption, particularly within the context of high-end sustainable manufacturing systems [33,34,35]. Given that SPF product quality is influenced by both process parameters and equipment control parameters, there is a critical need for a unified framework that can integrate diverse sources of information to enhance the capability for customized production. MBSE provides the necessary foundation for supporting information integration to address the key challenges in SPF parameter optimization. This paper presents a method for optimizing the process parameters and the equipment control parameters, assisted by MBSE-based representations of SPF manufacturing process information. The specific contributions are as follows:
(1)
An MBSE-based integration of SPF manufacturing process information, process parameter optimization, and simulation validation tools, providing a framework for solving customized SPF requirements.
(2)
Incorporate SPF manufacturing process information and customized product requirements simultaneously into the process parameter optimization process. A method is proposed for extracting key process parameters through object flow analysis, with key process parameters and impact indicators influencing customized product requirements determined by the analytic hierarchy process (AHP).
(3)
Utilize orthogonal experimental design and process simulation technology to obtain the optimal process parameter combination. Manufacturing process information is then mapped to the physical equipment model, enabling optimization of the equipment control parameters.

2. Optimization of Superplastic Forming Process Parameters Based on MBSE

2.1. Analysis of the Superplastic Forming Process Parameter Optimization Problem

The principle of SPF lies in utilizing the exceptional plastic deformation ability of materials under high temperature and low strain rate conditions to produce high-precision and complex-shaped metal components. A typical process is shown in Figure 1, where the material forming process exhibits high continuity. Key steps in the process include controlling furnace temperature and applying gas pressure, all of which ensure the forming quality of the final product. The SPF equipment primarily comprises units such as hydraulic presses, heating systems, and pneumatic systems, all of which are highly interdependent.
To enable the analysis of the manufacturing process information and to optimize the SPF process parameters, the core research lies in examining the close interrelation among quality indicators, process parameters, and equipment control parameters. Quality indicators define the criteria for evaluating product quality, process parameters respond to these criteria by influencing the reliability and outcome of the forming process, while equipment control parameters provide the foundational conditions necessary for stable operations. In the SPF manufacturing process, these interdependencies require the dynamic optimization of process parameters, ensuring they align with equipment capabilities and product quality requirements. Table 1 provides a systematic description of the manufacturing process information in SPF.
Based on the above definitions and contents of quality indicators, process parameters, and equipment control parameters, the following key challenges must be addressed for SPF process parameter optimization:
  • Identification of initial process parameters and their relationships with quality indicators and equipment control parameters. The SPF process is highly complex, with product quality influenced by multiple factors, including the direct effects of process parameters and the precise control of equipment control parameters. It is essential to construct a Quality–Process–Equipment mapping relationship. This mapping relationship reveals the interdependencies among quality indicators, process parameters, and equipment control parameters, providing a theoretical foundation for constraining, adjusting, and optimizing the SPF process parameters.
  • Determination of multi-quality-indicator optimization objectives and solutions for the process parameters. Optimizing the process parameters requires the integration of equipment control parameter constraints and product quality indicators to establish reasonable multi-objective optimization goals. These goals ensure that the optimized process parameters fall within the equipment’s operational capacity while meeting product quality requirements. The main steps of optimization involve identifying key influencing factors, utilizing the Quality–Process–Equipment mapping relationship, and applying constraints of the multi-quality-indicator to solve the process parameters. Designing an effective method to address these considerations is a critical technical challenge for achieving SPF process parameter optimization.

2.2. Methodological Framework

Based on the problem analysis in Section 2.1, this paper proposes a process parameter optimization method that integrates SPF manufacturing process information with customized product requirements within an MBSE environment. The method tracks the influence of requirements on both process parameters and equipment control parameters to minimize conflicts and redundancies in their design. The basic procedure is illustrated in Figure 2 and includes the following steps:
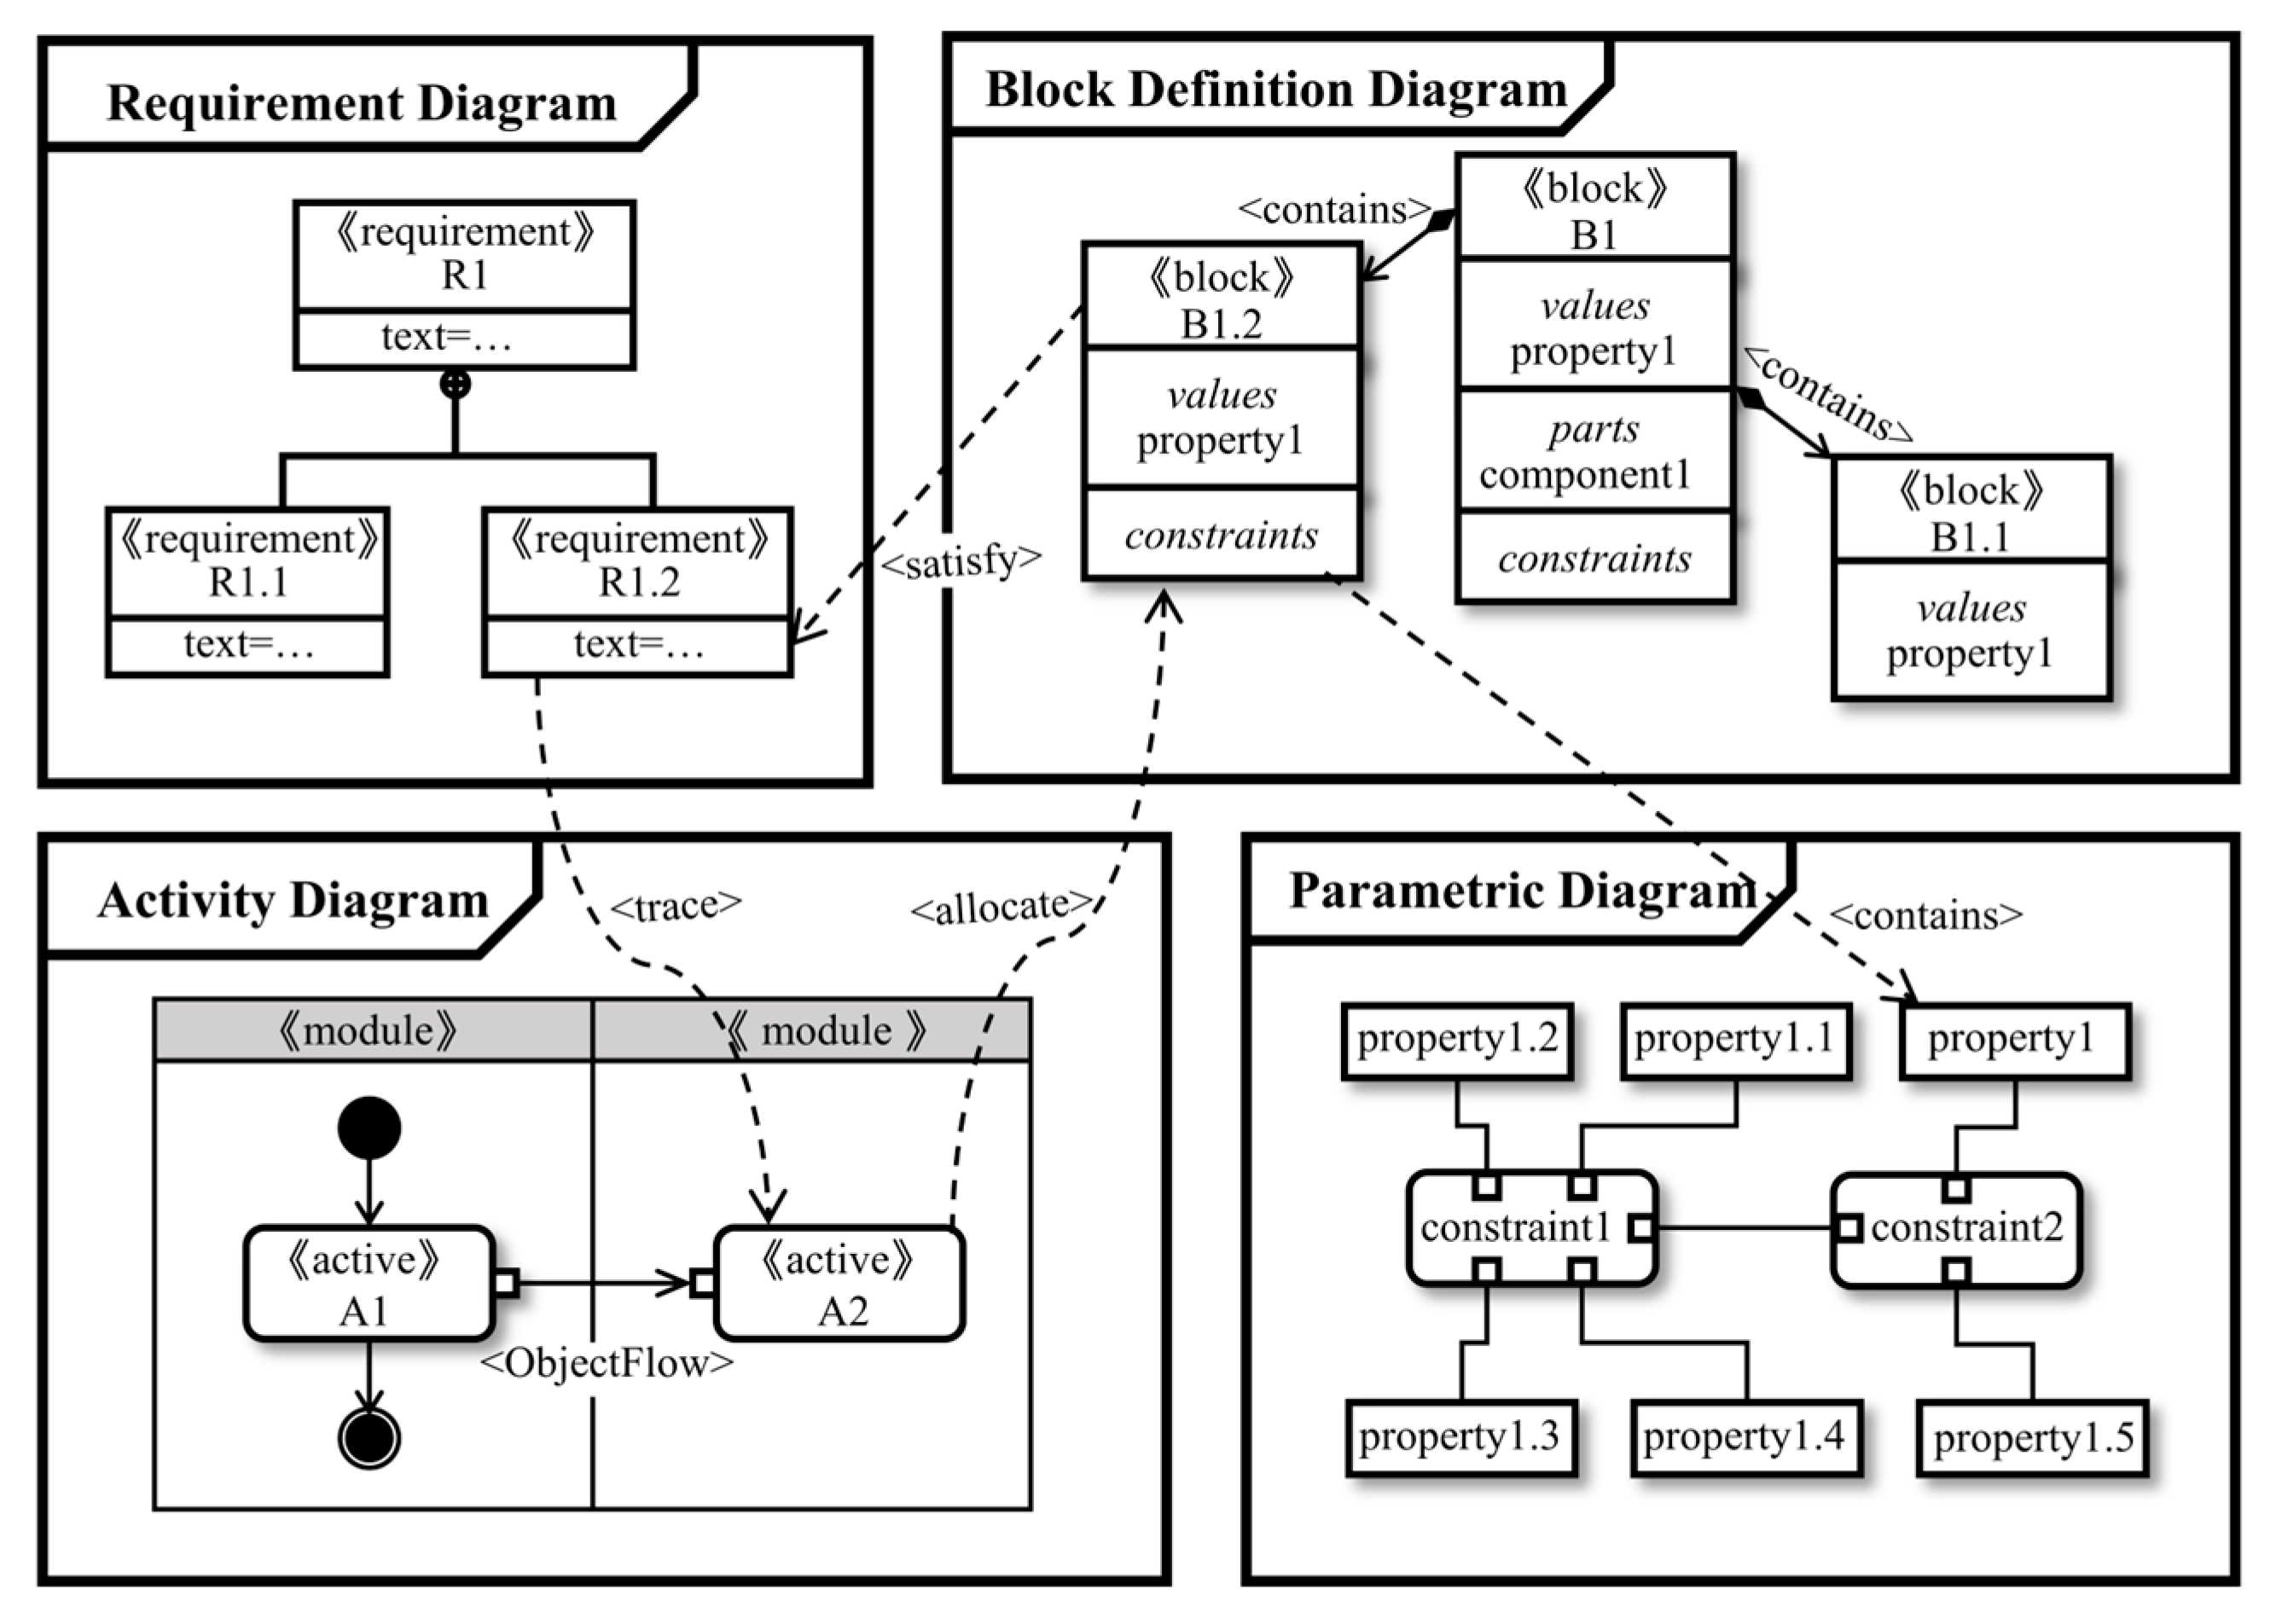
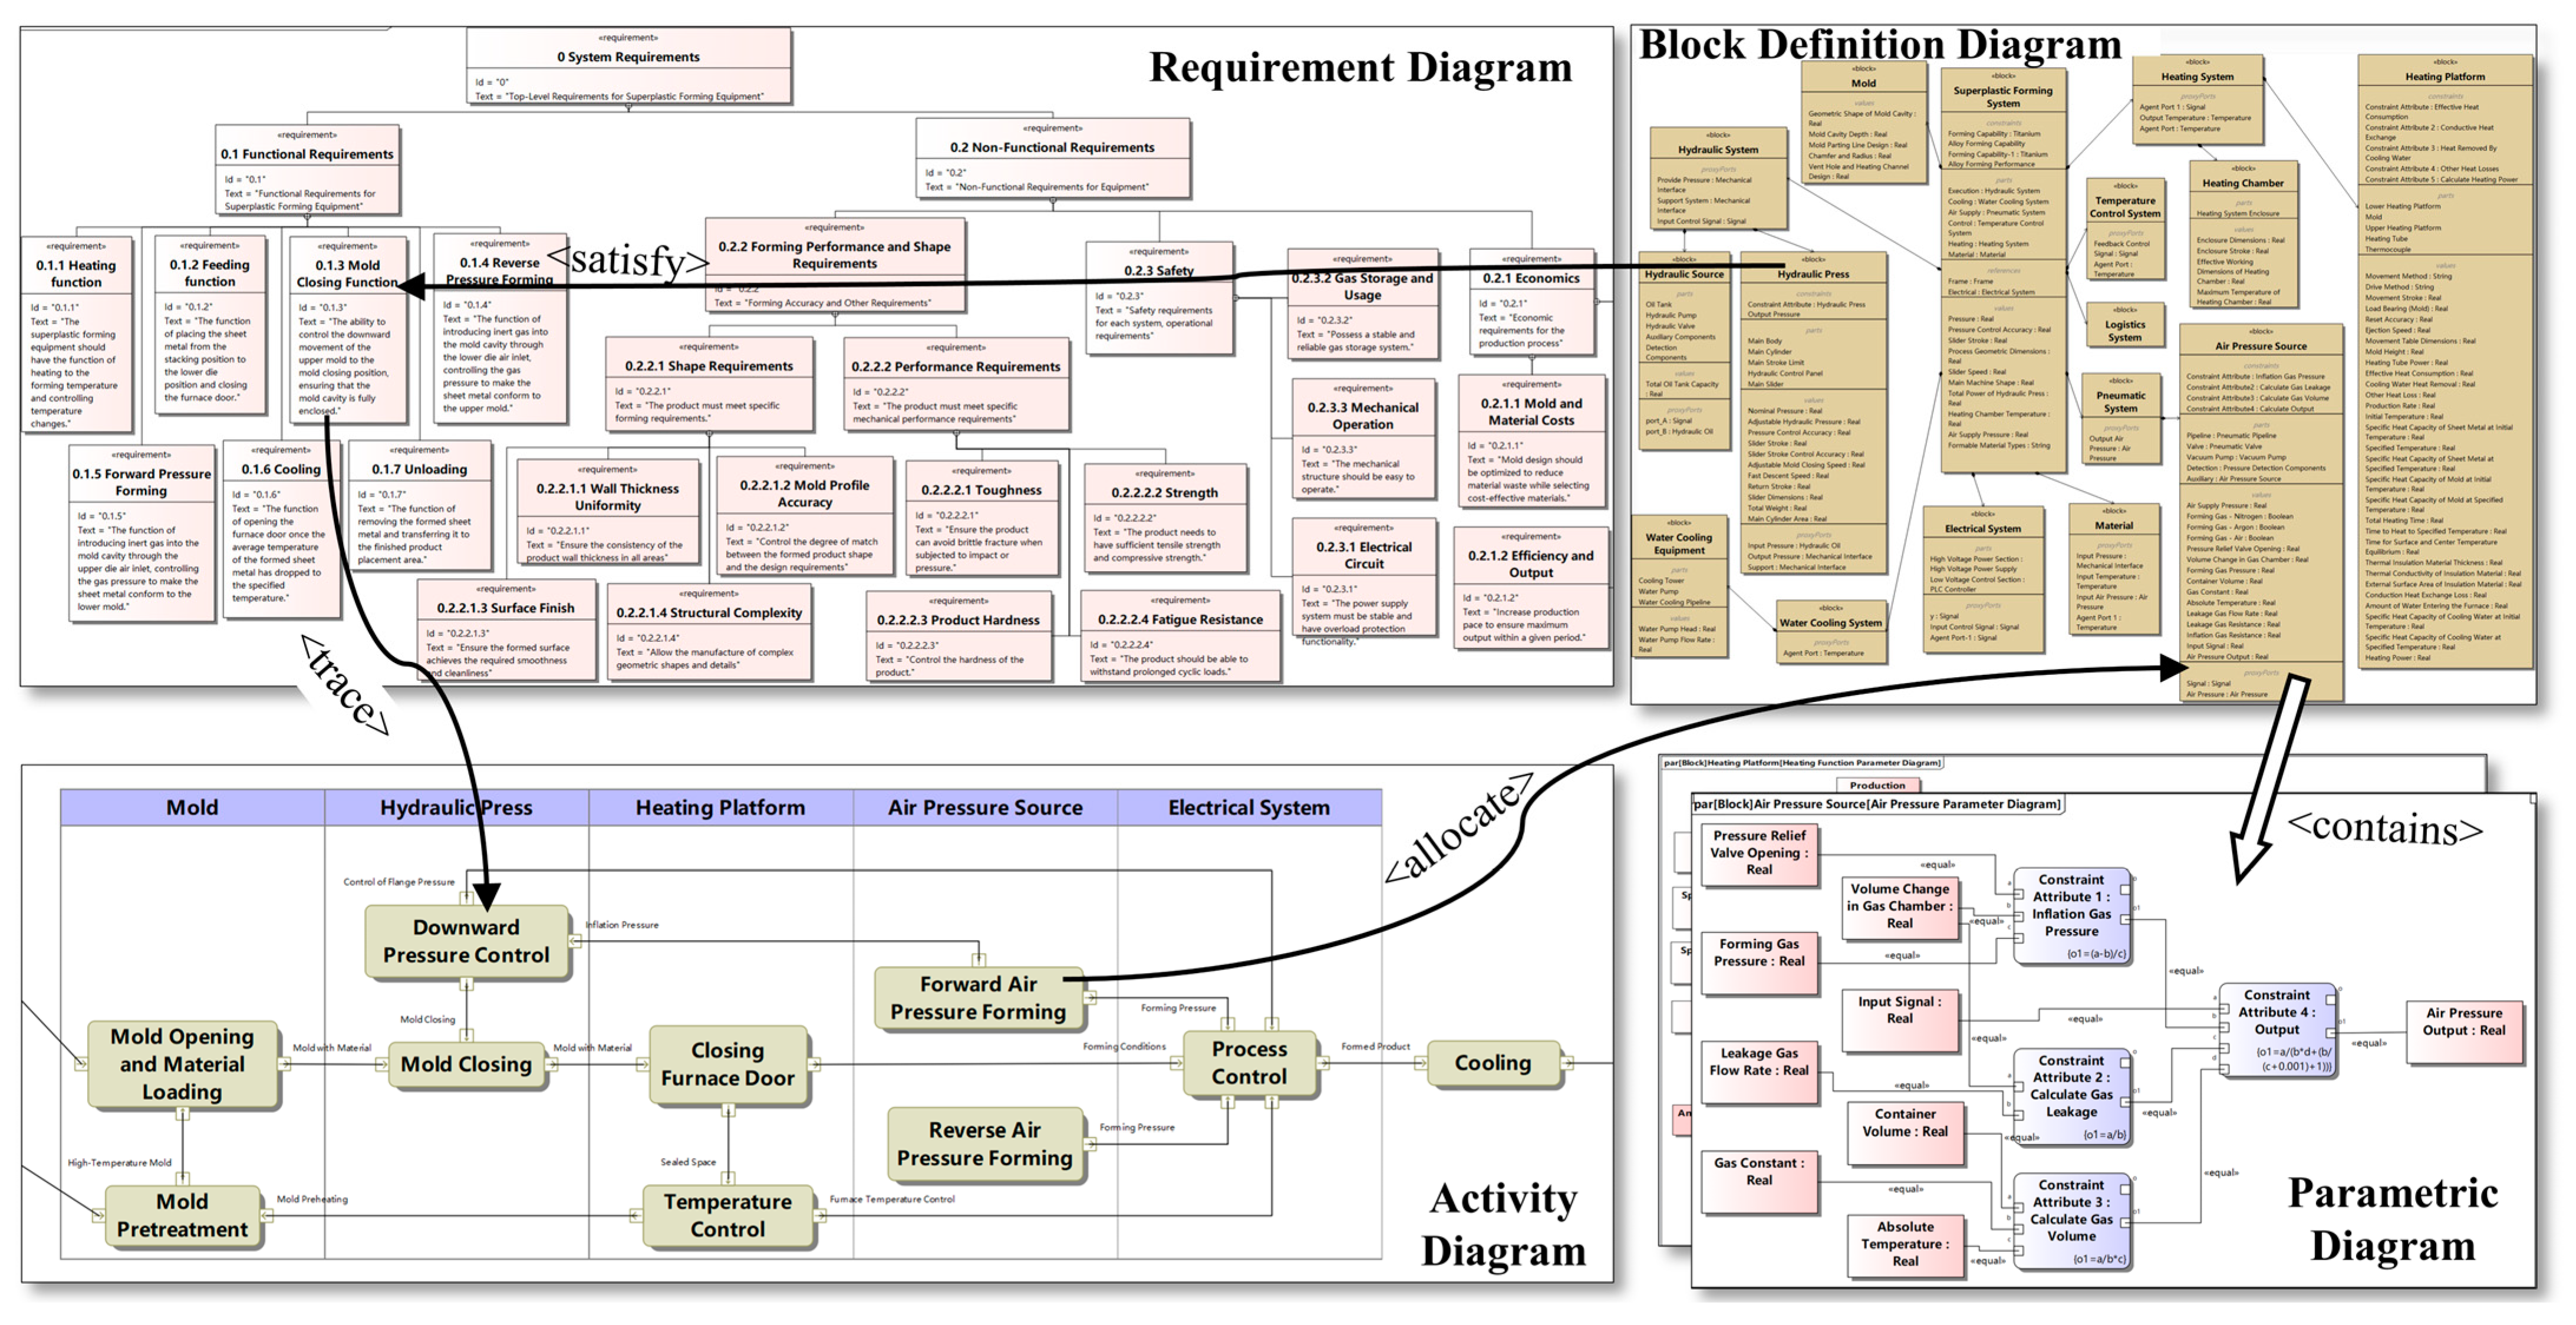
  • Model Construction and Requirements Analysis: The MBSE of SPF is developed using SysML, based on quality indicators, process, and equipment information. The product requirements are analyzed in relation to the SPF quality indicators, and the target optimization objectives are identified.
  • Process Parameter Extraction: By integrating the SPF activity diagram (ACT) and module diagram, the process parameters are comprehensively extracted based on the designed key parameter extraction flow. The key process parameters and the influencing indicators associated with the requirement indicators are identified through shape control and performance control standard, as well as the AHP, to clarify the design objectives.
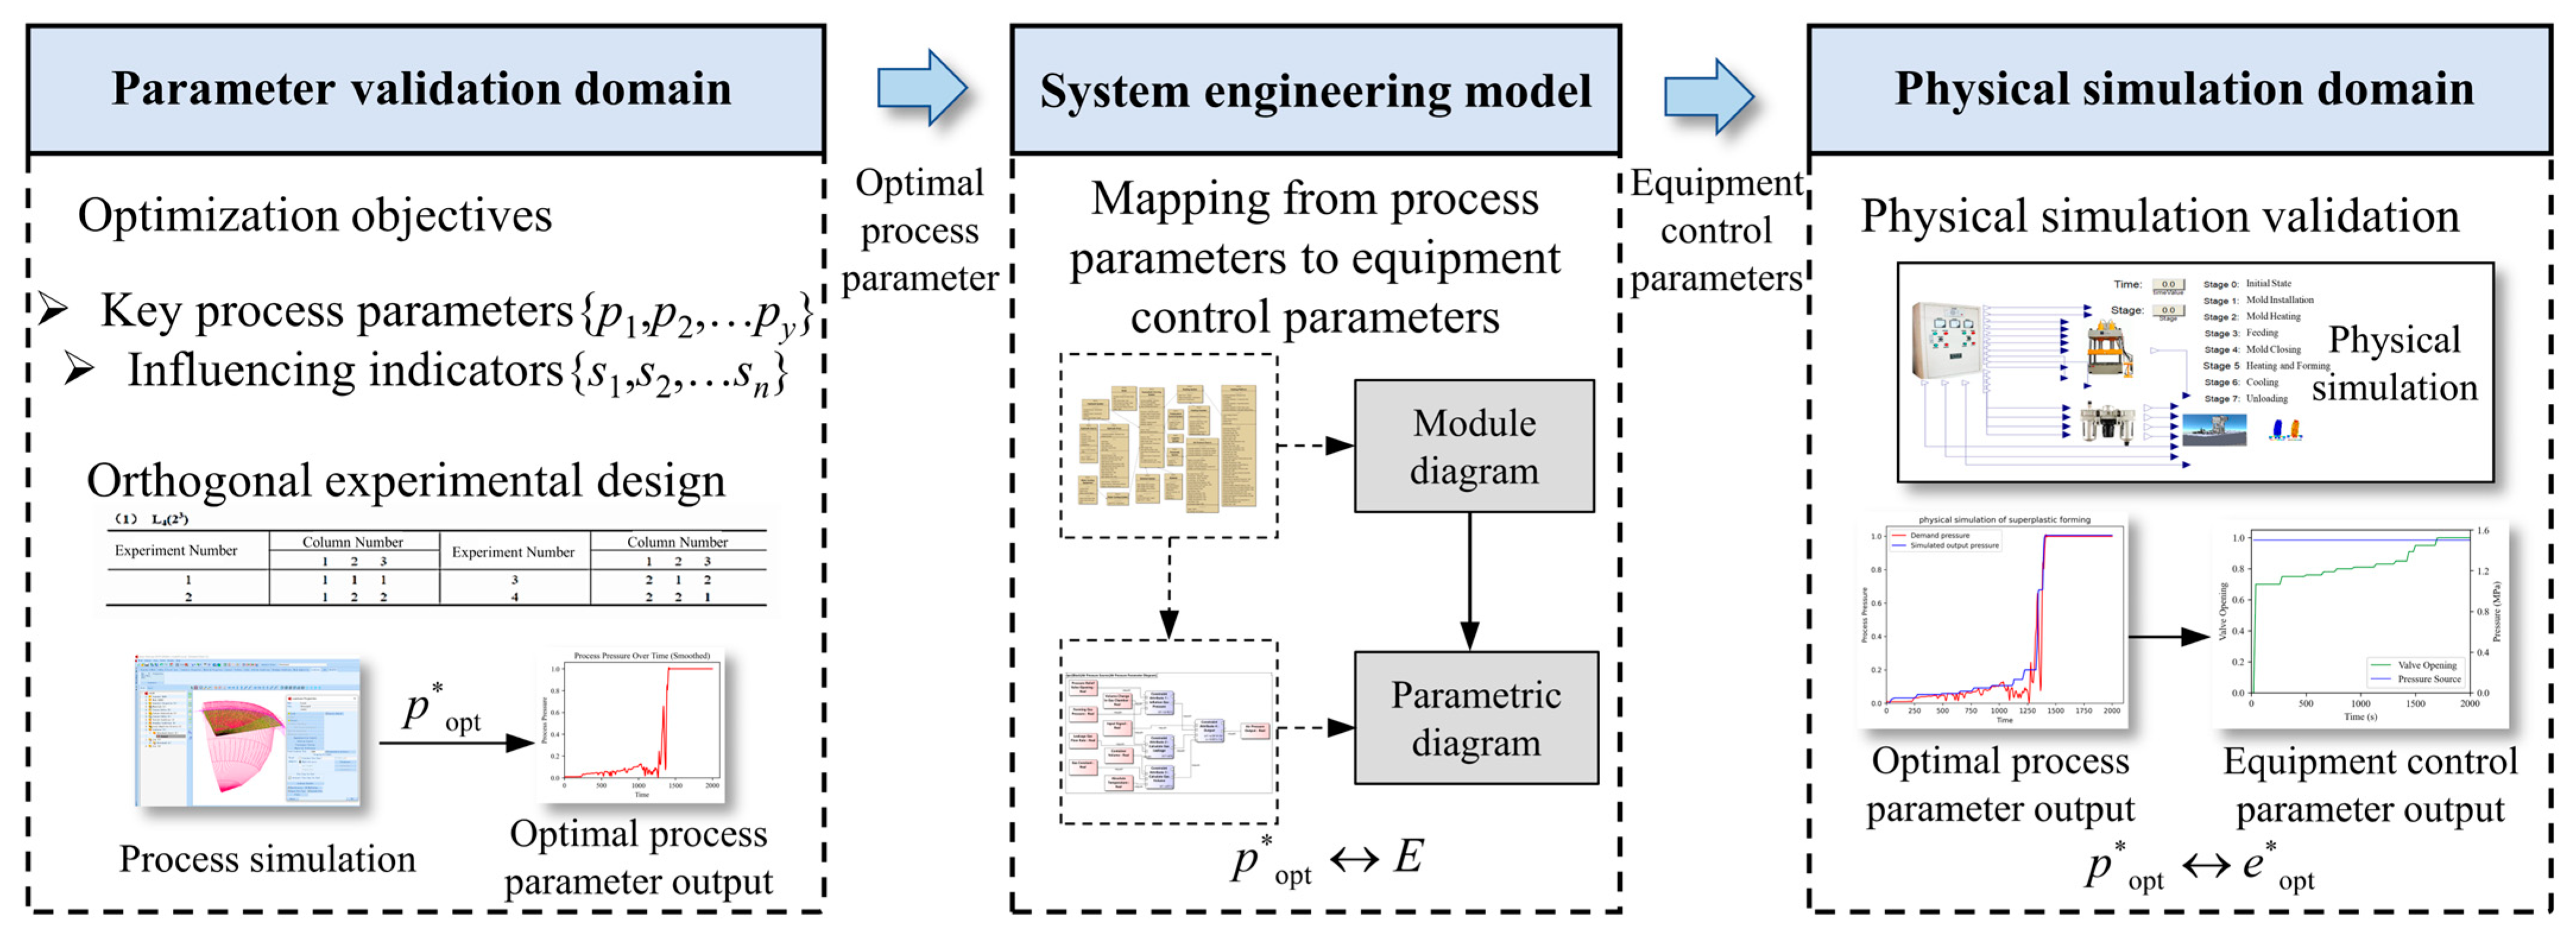
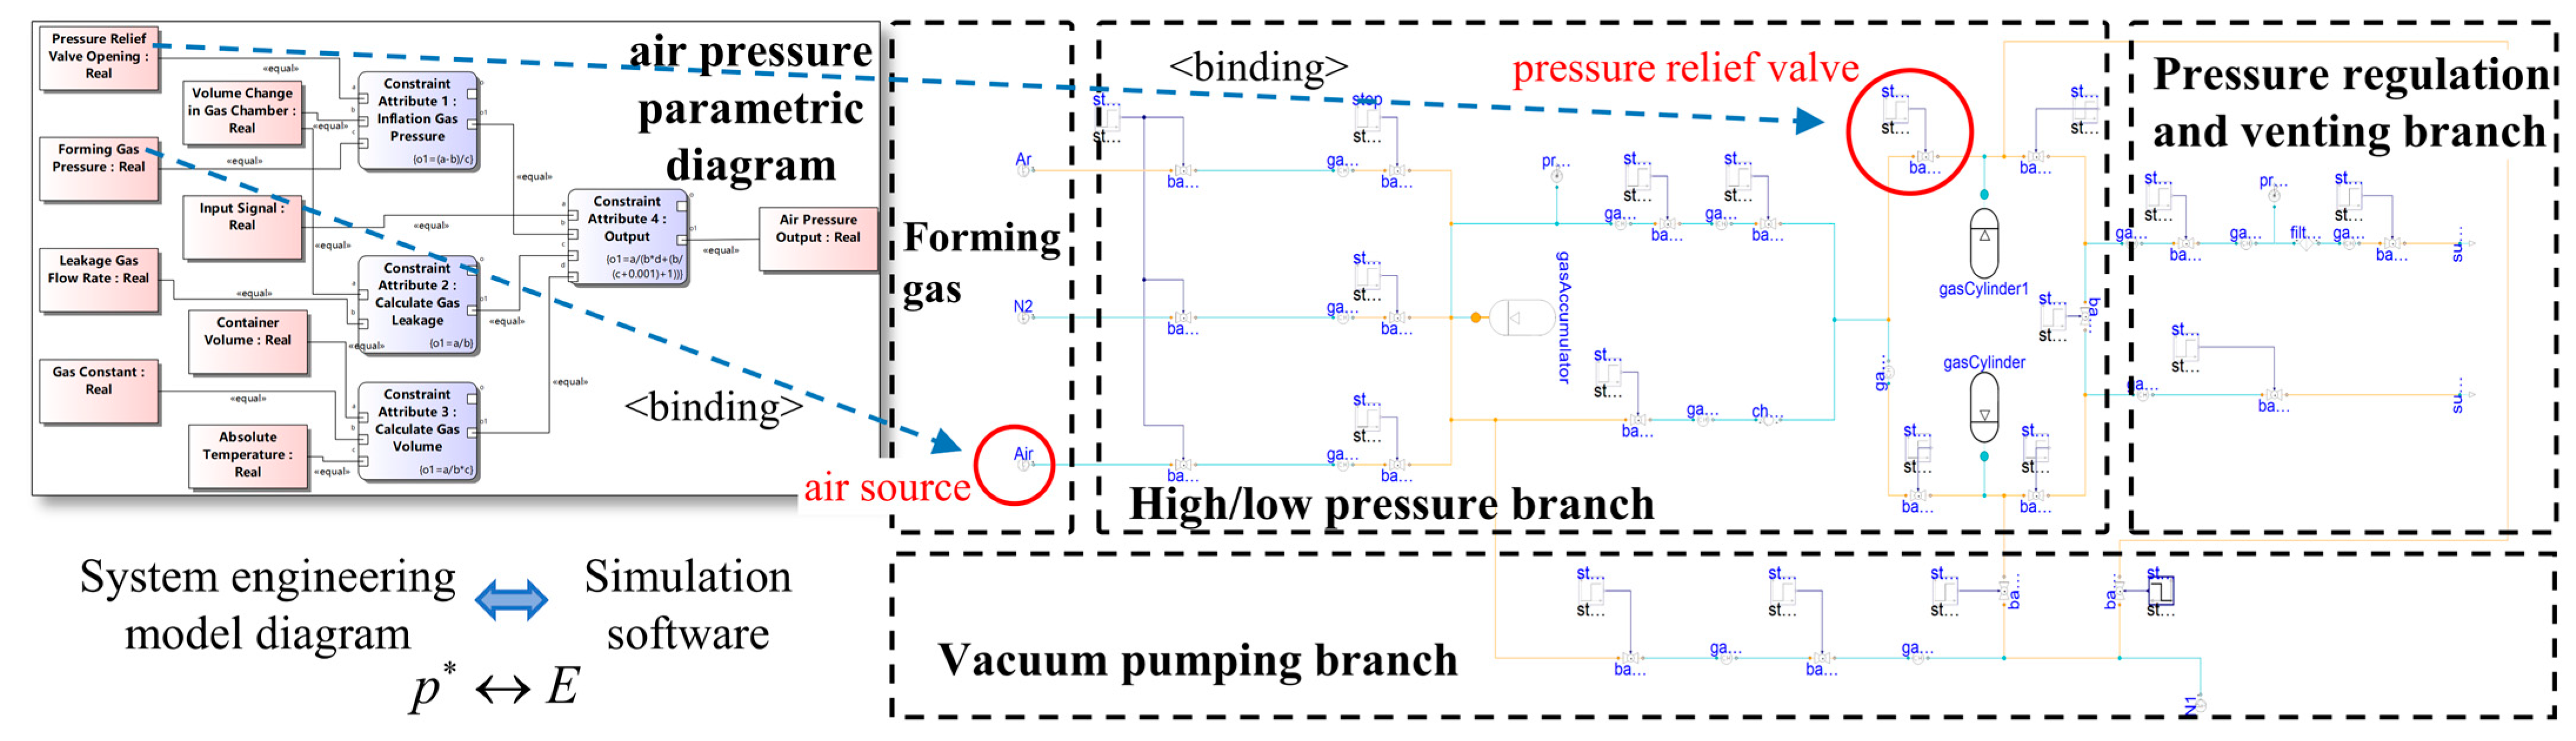
  • Optimization of Equipment Control Parameters: Orthogonal experimental design is employed, along with process simulation technology, to assess the adaptability of all process parameter schemes. This step provides guidance for the desired equipment performance. The results are then mapped to the physical model of the equipment using the SPF parametric diagram, completing the optimization of the equipment control parameters.

2.3. Model Construction and Requirements Analysis

2.3.1. Model Construction

The primary reason for introducing MBSE into the field of SPF manufacturing lies in its system modeling and global visualization capabilities, along with its provision of traceable engineering management methods [24]. MBSE facilitates knowledge extraction and design improvement. It enables designers to manage the complexity of the manufacturing process: on one hand, designers can use system modeling to describe the evolution of the manufacturing process from abstract to concrete; on the other hand, MBSE’s traceability ensures that process information at each stage is effectively transmitted. Combined with the use of the AHP to analyze the coupling of process parameters, MBSE allows for the identification of conflicts between process parameters early in the design phase, thus preventing design conflicts caused by inconsistent information.
In this paper, MBSE is developed using SysML, which supports the creation of system specifications, design, analysis, and verification information [36]. As shown in Figure 3, SysML represents the MBSE of SPF by utilizing various diagram types and the interrelationships between model elements to define key system components. Specifically, the requirement diagram is used to define quality indicators, the ACT represents process information, the block definition diagram describes equipment units, and the parametric diagram conveys equipment parameters and related constraints. The cross-relations between SysML model elements enable MBSE to be viewed from various perspectives, focusing on aspects such as SPF requirements, processes, and structures, thereby emphasizing the deep interconnection between process and equipment information.
The core purpose of MBSE is to represent the manufacturing process information of SPF, including the interconnections between processes, interactions among components, as well as the functions and physical properties that each component needs to fulfill.

2.3.2. Requirements Analysis

The extraction of quality indicators from the non-functional specifications in the SPF SysML requirement diagram involves classifying these indicators into two categories based on shape control and performance control standards. Shape control primarily refers to the control of the product’s geometric shape, including dimensional accuracy, shape integrity, and surface quality. Performance control pertains to the control of the product’s material properties, such as product toughness and product strength. To improve mapping efficiency and to simplify management, the quality indicators in the system specifications were categorized and organized, resulting in the SPF quality indicators table shown in Table 2.
By comparing the product requirements with the existing quality indicators, it is determined whether the product requirements are covered by the existing quality indicators. The analysis also focuses on whether the product requirements reflect specific demands related to shape control and performance control. Based on the results, the process or equipment control parameters are adjusted to meet the quality indicators.

2.4. Process Parameter Extraction and Analysis

The aforementioned work accomplishes the characterization of the manufacturing process information and the analysis of the product requirement. To comprehensively assess the potential impact of the requirement indicators on the process parameters and achieve an effective mapping from the requirements to the process parameters, the core task is to identify the key process parameters from all the SPF process parameters. However, the ubiquitous coupling phenomena between parameters during the production process may lead to a situation where fulfilling one requirement indicator affects other quality indicators, thus reducing the overall balance of the design outcomes. Therefore, the core task is divided into two parts: first, all relevant process parameters are comprehensively extracted through the ACT, and then the extracted process parameters are analyzed to identify the key process parameters and their influencing indicators.

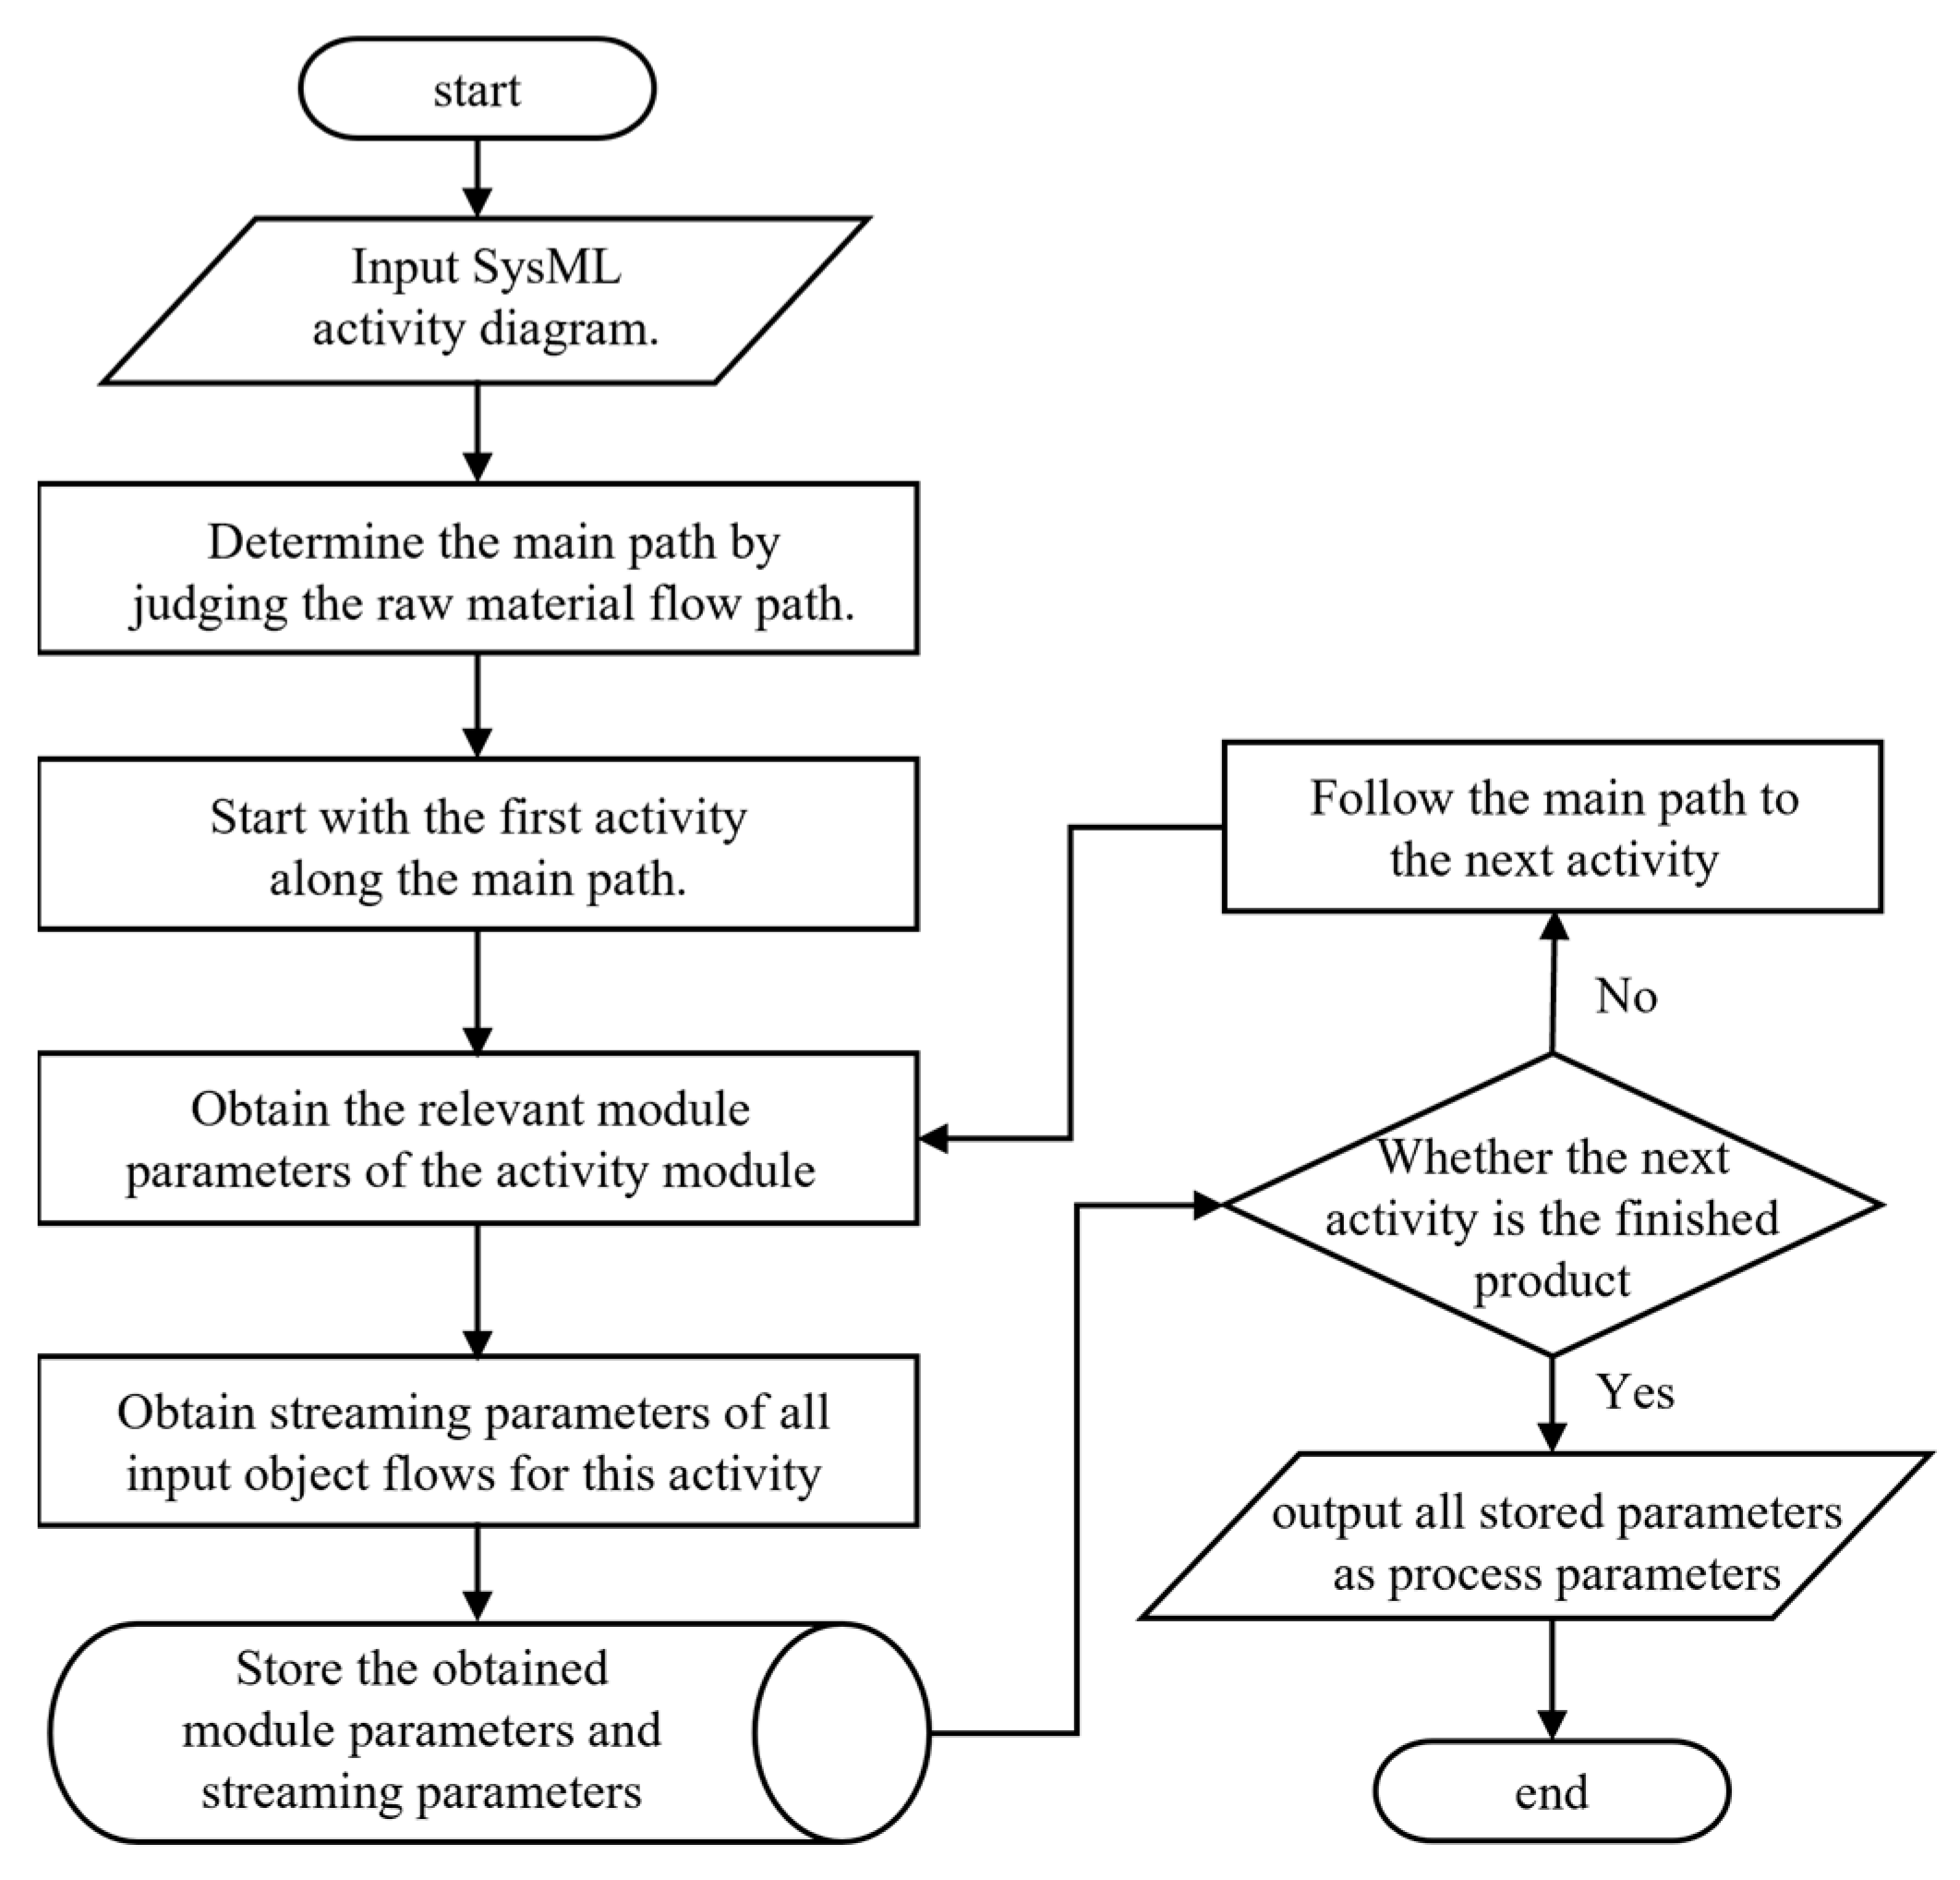
2.4.1. Process Parameter Extraction Based on Activity Diagram

In SysML, the ACT is a behavioral modeling representation based on object flow, which facilitates the input-to-output transformation through action sequences, similar to functional flow diagrams. The essence of the SPF process is to transform raw materials into products, making the ACT an ideal tool for describing the SPF process. The ACT not only depicts the steps and sequence of the SPF process but expresses the interrelationships between process activities through object flows, such as energy flows and material flows. For example, the material flow reflects the transfer path of the sheet metal through various processing stages until the finished product; energy flow, on the other hand, represents the transmission and conversion of energy, such as electricity or air pressure, between system modules. Additionally, the streaming parameters in the activity interactions describe the characteristics of the flow, including dynamic properties, such as flow direction, speed, intensity, and stability, providing a more comprehensive and precise description for modeling the process.
The ACT visually presents the process of the SPF equipment during production, as well as the involvement of equipment modules. A method is proposed for organizing and classifying process parameters through the ACT, as shown in the flowchart methodology in Figure 4. By focusing on the ACT, the flow path from raw material to finished product is observed from a global perspective. The raw material flow path is considered the main path, and all module parameters involved in the activities along this main path are classified as process parameters. Additionally, all object flows that enter the main path, along with their streaming parameter, are also treated as process parameters affecting the forming process. This paper designs a process parameter extraction flow based on this logic using the ACT.
In SPF manufacturing, due to the large number of process parameters involved, it is generally necessary to categorize these parameters. Categorizing the process parameters effectively simplifies the complexity, facilitates parameter management, and improves mapping efficiency. Specifically, classification reduces the matching range during the mapping process, thereby minimizing unnecessary parameter analysis. During the SPF manufacturing process, machining parameters have a relatively minor impact on the mechanical properties of the product. Referring to shape control and performance control in Table 2, the SPF process parameters are categorized into machining process parameters and thermochemical process parameters. Machining parameters refer to the forming parameters related to mold design and machining processes, while thermochemical process parameters refer to those associated with temperature and material heat treatment. This classification enables the mapping relationship between the SPF quality indicators and the process parameters to be described as follows:
S f S m = X X 0 X P s P c
where Sf represents the forming indicators, Sm represents the mechanical indicators, Ps represents the SPF machining process parameters, and Pc represents the SPF thermochemical process parameters. The SPF process parameters are Pl = [Ps, Pc].

2.4.2. Analysis of Key Process Parameters and Quality Indicators

After obtaining the quality indicators and process parameters, due to the varying impacts of the SPF process parameters on the required indicators, it is necessary to identify those process parameters and quality indicators that have a significant impact on the desired outcomes. The coefficient matrix in Equation (1) needs to be determined to clarify the influence weights between each parameter and the indicators. In this study, the AHP is used to calculate the weights.
The AHP is a multi-criteria decision analysis method that decomposes complex problems into sub-problems with a hierarchical structure. It combines subjective judgment and objective data to help decision-makers systematically weigh the importance of various factors. In the process of identifying key process parameters and influencing indicators based on customized product requirements, the AHP effectively calculates the weight relationships between quality indicators and process parameters in SPF by constructing a comparison matrix and performing consistency checks. For example, it can be used to assess the relative importance of forming temperature and mold clamping force on the surface smoothness indicator, thereby identifying and prioritizing the process parameters that most significantly affect forming quality. The specific process is as follows.
(1) Comparison Matrix Construction
The purpose of constructing the comparison matrix is to perform pairwise comparisons of the process parameters and determine the relative importance of each parameter with respect to the quality indicator si. The importance of the process parameters is quantified using a scale method for matrix elements, resulting in the formation of the comparison matrix. Taking Table 3 as an example, the structure of the comparison matrix is as follows.
In Table 3, xij represents the relative importance weight of process parameter Pi in comparison to process parameter Pj for a specific quality indicator si, which is assigned using the Saaty scale method.
(2) Eigenvector Calculation
The eigenvector of the comparison matrix is calculated using the equation X λ I w = 0 , where X is the comparison matrix obtained from Table 3, used for calculating the eigenvalue and eigenroot; I is the identity matrix; λ and w are the eigenvalue and eigenvector of the matrix, respectively. This is specifically represented as follows:
1 λ x 12 x 1 l x 21 1 λ x 2 l x l 1 x l 2 1 λ w 1 w 2 w r = 0
By using Equation (2), the maximum eigenvalue λmax of each comparison matrix can be obtained. The eigenvector w is then normalized to obtain the weight vector b = [ b 1 , b 2 , , b r ] T , where r represents the order of the matrix.
(3) Consistency Check
Since the evaluation of the importance of process parameters and quality indicators may be influenced by subjective factors, it is necessary to perform a consistency check to ensure the consistency of the comparison matrix. The consistency index CI is first calculated as follows:
CI = λ max r r 1
From Table 4, the corresponding average random consistency index RI can be obtained based on the order of the comparison matrix (3 to 11).
Finally, the consistency ratio (CR) is calculated using Equation (4). If CR < 0.1, the consistency of the comparison matrix is considered acceptable. Otherwise, the comparison matrix needs to be reconstructed.
CR = C I R I
After passing the consistency check, the weight vector of the quality indicators si are combined to form the coefficient matrix, as shown in Equation (5).
s 1 s 2 s f + m = b 11 b 1 l b n 1 b ij p 1 p 2 p s + c
where, bij represents the impact weight of quality indicator si on parameter pj.
When analyzing the impact of process parameters on quality indicators, optimization can be performed for the following two cases:
  • Weakly Influential Variables: Variables with a weaker influence can be selectively ignored, focusing optimization efforts on parameters with greater weights;
  • Low Coupling Effects: When the number of quality indicators is small and the coupling effects between parameters are low, more parameters can be optimized simultaneously.
Once the key process parameters are identified, a comprehensive analysis of all quality indicators should be conducted based on their mapping relationships, with priority given to those quality indicators with the highest weights. Specifically, the quality indicator corresponding to the maximum weight for each key process parameter should be considered to be a significantly influential indicator, and included in the subsequent optimization scope. Ultimately, by extracting and analyzing the process parameters, the key process parameters P* = {p1, p2, … py} and the influencing indicators S* = {s1, s2, …sn} for product requirements can be identified, providing guidance for process parameter optimization and adjustments to equipment control parameters.

2.5. Process Parameter Optimization

After extracting and analyzing the process parameters, the key parameters P* = {p1, p2, … py} and the influencing indicators S* = {s1, s2, … sn} for SPF requirement indicators can be obtained. To further achieve the optimal combination of process parameters and guide the optimization of equipment control parameters, a method combining orthogonal experiments and simulation techniques for equipment control parameter optimization is proposed within the MBSE environment. The optimization process is shown in Figure 5, where process parameters and equipment control parameters are jointly optimized through simulation software.

2.5.1. Process Parameter Optimization Based on Process Simulation and Orthogonal Experiments

The Taguchi orthogonal experiment is an efficient method for optimizing experimental designs, reducing the number of experiments, and identifying key influencing factors. It is widely applied in fields such as quality control and product design. The core advantage of orthogonal experiments lies in their ability to simplify experimental combinations under multi-factor interactions and yield effective optimization results. Multiple sets of process parameter combinations are generated through orthogonal experimental design to systematically evaluate the impact of each parameter group on target requirements, thereby selecting the optimal parameter combination that achieves the desired effect. In this study, the AHP is used to provide weight guidance for the orthogonal experiments, clarifying the relative importance of each process parameter in SPF, and thus rationally selecting experimental factors and level settings. The steps of the orthogonal experiment are as follows:
  • Determine the research factors and levels of indicators, and create an orthogonal experimental table.
  • Implement the experiment in conjunction with process simulation to obtain result data.
  • Evaluate the impact of each factor on the experimental results through range analysis.
  • Analyze the experimental results to obtain the optimal process parameter combination p*opt = {P*|S*(p) satisfies influencing indicators and target requirements}.

2.5.2. Equipment Control Parameter Optimization Based on Physical Simulation

In the MBSE method, the SysML parametric diagram is an extension of the module diagram, which intuitively expresses and analyzes the equipment control parameters involved in the process parameters and their constraint relationships. In this study, the equipment control parameters related to the optimal process parameter combination are located in PAR, capturing one or more design constraints. Based on these constraint relationships, the corresponding equipment control parameters E* = {e1, e2, … em} are determined, realizing the mapping of process parameters to the equipment control parameters. On the basis of this parameter mapping, physical simulation is used to verify and optimize the relevant equipment control parameters, ultimately generating the equipment control parameters e*opt = {E*|p*opt satisfies the optimal process parameter combination} that meet the output requirements of the optimal process parameter combination.

3. Case Study

3.1. Case Introduction

This study focuses on the 800T SPF equipment, which consists mainly of modules such as the hydraulic press, heating platform system, temperature control system, pneumatic system, and cooling system. This equipment is capable of meeting the forming requirements for various materials, including titanium alloys and aluminum alloys. The key technical parameters of the equipment are shown in Table 5.
The MBSE model for the 800T SPF, as shown in Figure 6, is built upon the SysML framework illustrated in Figure 3. This model not only demonstrates the interrelations among the internal elements but constructs the relationships between modeling elements across different diagrams. For example, the <satisfy> relationship between the hydraulic press and the mold closing function, the <trace> relationship between the mold closing function and the downforce control, and the <allocate> relationship between the air pressure forming and the air pressure source. The parametric diagrams shown include the air pressure parametric diagram, temperature parametric diagram, and others.
Taking the customized product requirements proposed by a certain company as an example, the product is a titanium alloy hemispherical part. The customized requirement list is organized as shown in Table 6. By comparing it with the requirement diagram in Figure 6, the unmet requirement indicator is identified as the thinning rate, which falls under the forming indicators within the quality indicators. A study on process parameter optimization is conducted for this indicator.

3.2. Mapping Product Requirements to Process Parameters

3.2.1. Process Parameter Extraction

By comparing and analyzing the product requirements from Section 3.1 with the quality indicators in the system engineering REQ, further research is conducted on the unmet thinning rate requirement for the hemispherical part. According to the framework proposed in Figure 2, it is necessary to extract the process parameters of the equipment to support the subsequent requirement-to-process parameter mapping through the AHP. As shown in Figure 7, the SysML ACT established for the SPF equipment represents the entire process from mold opening and material loading to cooling. The model includes key activities, such as heating, mold closure, reverse air pressure forming, forward air pressure forming, and cooling. The ACT clearly illustrates the sequential relationships between the processes of the studied 800T SPF equipment and their corresponding modules, using flow lines and activity partitions.
By following the process parameter extraction flowchart shown in Figure 4, as illustrated in Figure 7, for the main path, the mold opening and material loading activity belongs to the main path, and its influencing parameters are derived from the relevant variables inside the mold. By combining the module activity partitions, the mold module can be traced in the block definition diagram, and the structural parameters of the mold are output. For the branch path, taking the forming process control activity as an example, the forming process control activity involves the object flow of forming air pressure input from the forward air pressure forming activity, with the influencing parameter being the forming air pressure’s streaming parameters, i.e., the pressure and flow rate of the air pressure. Based on the method shown, all process parameters that influence the forming process in the ACT are comprehensively extracted, and the corresponding process parameters are organized. The extracted forming process parameters are further categorized and organized using the classification method in Equation (1). The resulting SPF process parameters are shown in Table 7.

3.2.2. Process Parameter Analysis

After completing the extraction and classification of the process parameters, a preliminary mapping relationship between the indicators and process parameters is established by combining the thinning rate and the quality indicators shown in Table 2. Since the thinning rate sr is considered a forming indicator, it is analyzed similarly to the wall thickness uniformity. Wall thickness uniformity focuses on the overall thickness distribution, while the thinning rate sr specifically examines the local thickness variation in specific areas. In the shape control and performance control standard, forming indicators are influenced by both the machining process parameters and the thermochemical processing parameters. As a result, a mapping matrix between the quality indicators s (composed of the thinning rate sr and the four metal forming indicators sf from Table 2) and the process parameters p (composed of six mechanical processing parameters ps and four thermochemical processing parameters pc from Table 7) is ultimately established as follows:
S f s r = b 11 b 1 , 10 b 51 b 5 , 10 P s P c
where bij represents the impact weight of the quality indicator si on the process parameter pj.
In the mapping matrix of Equation (6), the weight coefficients corresponding to the process parameters for the quality indicators are calculated using the AHP. Taking b5 as an example, we analyze how to obtain the specific values for b5 = [b5,1, b5,2, … b5,10]; b5 then represents the comparison matrix for the thinning rate sr with respect to each process parameter, as shown in Table 8. The scoring metrics in the comparison matrix reflect the relative importance of the process parameters pi and pj on the thinning rate in the forming outcome.
The pairwise comparison scores in Table 8 were obtained through a Delphi process involving eight senior SPF engineers. Each expert independently rated the relative importance of the process parameters using Saaty’s 1–9 scale. In the first round, only responses with consistent comparison matrices (CR < 0.1, as defined in Equations (2)–(4)) were accepted. In the following two rounds, experts reviewed the anonymized summary results and revised their judgments [37]. The final scores used in the comparison matrix were determined by selecting the most frequently chosen values among consistent expert responses.
Based on the thinning rate process parameter comparison matrix, the maximum eigenvalue λmax = 10.6 is calculated using Equation (2). The eigenvector w = [ 0.154 0.079 0.044 0.753 0.483 0.342 0.043 0.201 0.079 0.045   ] T is calculated by using Equation (3), the consistency index CI = 0.067 is calculated, and the corresponding RI is 1.49. The consistency ratio CR is found to be less than 0.1, meeting the consistency check requirement. Ignoring the very small weights in w and normalizing the vector, we obtain b5 = [b5,1, b5,2, … b5,10] = [0.079, 0, 0, 0.389, 0.249, 0.177, 0, 0.104, 0, 0]. The same calculation method is applied to the remaining bij values in Equation (6). Finally, the coefficient matrix can be obtained as follows:
b ij = 0.09 0.14 0 0.32 0.23 0.05 0 0.14 0.05 0 0.64 0.14 0 0 0.14 0 0 0.07 0 0 0 0 1 0 0 0 0 0 0 0 0.75 0 0 0.25 0 0 0 0 0 0 0.079 0 0 0.389 0.249 0.177 0 0.104 0 0
Based on the quality indicator and process parameter coefficient matrix, the key process parameters that significantly impact the thinning rate are selected as ps4 (preforming speed), ps5 (forming speed), and ps6 (forming air pressure). Through vertical analysis of the coefficient matrix, it is found that the most significant influencing indicator is sf1 (wall thickness uniformity). It is worth noting that, according to the matrix analysis, the main influencing parameters for sf2sf4 are not the aforementioned three key process parameters, and therefore, they are not considered to be significant influencing indicators. Since these three process parameters all belong to the machining processing parameters, their impact on the mechanical indicators is relatively small. According to the quality indicator and the process parameter mapping standard in Equation (1), the mechanical indicators are not considered to be significant influencing indicators for in-depth analysis. Ultimately, the key process parameters related to the thinning rate indicator are {ps4, ps5, ps6}, with the influencing indicator being {sf1}.

3.3. Mapping Process Parameters to Equipment Control Parameters

3.3.1. Process Parameter Optimization Based on Taguchi’s Orthogonal Experiment

In Section 3.2, through an analysis of the quality indicator and the process parameter coefficient matrix, the key process parameters significantly affecting the thinning rate (sr) were selected, including preforming speed (ps4), forming speed (ps5), and forming air pressure (ps6). Additionally, the wall thickness uniformity (sf1) is significantly influenced by these key process parameters and is thus a focus for further in-depth analysis.
In the multi-objective optimization of SPF, it is challenging to explicitly express the nonlinear relationship between process parameters and specific quality indicators. Therefore, it is necessary to combine orthogonal experiments with simulation techniques to optimize the process parameters.
During the process simulation, forming speed (ps5) is considered to be the forming strain rate, which is the derivative of strain with respect to time. The parameter levels were designed based on their AHP-derived weights, combined with practical considerations such as equipment constraints and engineering experience. Three levels were selected for each factor to represent low, medium, and high values within commonly applied process ranges, as shown in Table 9. This setup ensures sufficient observation of main effects and interaction trends, while maintaining computational efficiency. If interaction effects are not clearly distinguishable or if balancing quality indicators and influential factors prove to be challenging, more detailed level refinement may be considered based on the results.
In orthogonal experiments, the orthogonal table is often presented in tabular form. This experiment uses the L9.3.3 orthogonal experiment table, as shown in Table 10.
To verify the effect of the process parameters, as shown in Figure 8, this study uses MSC Marc software (2019 version) to simulate the SPF process. During the simulation, material parameters are set according to the physical properties of the Ti-6Al-4V titanium alloy, with the forming temperature set to 875 °C. Mold dimensions and boundary conditions, along with other parameters, are customized based on the requirements outlined in Table 6. The simulation analyzes the impact of different factor levels on the thinning rate of the SPF process in order to evaluate the effect of each process parameter.
Thinning rate and wall thickness uniformity are the quality indicators studied. To quantitatively analyze the relationship between process parameters and indicators, the wall thickness standard deviation is used to represent wall thickness uniformity. By extracting the thickness data of each unit node along the symmetry plane, the distribution of wall thickness can be obtained. Based on Equations (8) and (9), the thinning rate δ m a x and the wall thickness standard deviation X t at different parameter levels can be calculated as follows:
δ max = t 0 t min t 0
X t = 1 n 1   i = 1 n ( t i t ¯ ) 2
where t0 is the sheet metal output thickness, tmin is the minimum wall thickness at the thinnest part of the finished part, ti is the wall thickness of each unit on the symmetry plane, n is the number of units on the symmetry plane, and t - is the average wall thickness on the symmetry plane.
The orthogonal experiment results are shown in Table 11. Since wall thickness uniformity is expressed through the wall thickness standard deviation, the smaller the thinning rate and the wall thickness standard deviation, the better the forming effect. According to the simulation results, Levels 3, 4, 5, 8, and 9 all meet the requirement of a thinning rate less than 50%.
To further analyze the impact of each process parameter on the thinning rate and the wall thickness standard deviation, a range analysis was conducted for both the thinning rate and the wall thickness standard deviation, as shown in Table 12. For the thinning rate, the importance of the influencing factors, ranked from highest to lowest, is as follows: preforming speed (A) > forming speed (B) > forming air pressure (C). Among them, the preforming speed has the most significant effect on the thinning rate, followed by forming speed, with forming air pressure having the least impact. For wall thickness uniformity, the importance ranking of the influencing factors is as follows: forming speed (B) > preforming speed (A) > forming air pressure (C). The simulation results further confirm the rationality of the AHP. The optimal process parameter combination is identified as Experiment 3, which achieves the minimum wall thickness standard deviation while satisfying the thinning rate indicator. Specifically, this optimal combination consists of a preforming strain rate of 0.0005 s⁻1, a forming strain rate of 0.0015 s⁻1, and a forming air pressure of 1 MPa.

3.3.2. Optimization of Equipment Control Parameter Based on Physical Simulation

In the previous section, the results from orthogonal experiments and process simulations were used to obtain a set of process parameters that meet the customized product requirement. It is important to note that, due to the high compressibility of gases and potential issues with mold sealing performance, gas leakage may occur. Therefore, in actual operation, the strain rate control is primarily adjusted through the air pressure. In the SPF process, different stages require varying air pressures. By adjusting the rate of change in air pressure, precise control of the forming speed can be achieved. Among these, the maximum air pressure significantly affects the final molding effect, which in turn influences the product’s thinning rate and wall thickness uniformity.
Through analysis, it is determined that the optimal process parameters require controlling the forming air pressure. The SPF air pressure parametric diagram in Figure 6 can be located. As shown in the air pressure parametric diagram in Figure 9, the output air pressure’s constraint attributes are interrelated with the charging air pressure, gas leakage, and gas volume. Among these, the charging air pressure is further associated with the valve opening and forming air pressure. In this study, the physical model for SPF is constructed using the MWORKS.Sysplore platform. The forming gas is set to air, and the simulation parameters are configured to reflect realistic production conditions: the pressure regulator output ranges from 0 to 1 MPa, the back-pressure valve is controlled within 0 to 1 MPa, and the forming pressure is set in the range of 0 to 5 MPa. Additionally, the buffer tank volume is configured as 3 L. Figure 9 illustrates the air pressure simulation model, where the valve opening and forming air pressure correspond specifically to the pressure relief valve and the air pressure source component.
Through MSC Marc simulation, when the process parameters from Experiment 3 (preforming strain rate of 0.0005 s−1, maximum forming strain rate of 0.0015 s−1, and forming air pressure of 1 MPa) are applied, a pressure curve during the forming process, as shown in Figure 10a, can be obtained. This pressure curve will guide the subsequent optimization of the equipment control parameters.
In the air pressure simulation model, the equipment control parameters are adjusted to achieve the desired output pressure. The simulation results, shown in Figure 10a, demonstrate that the output pressure from the physical simulation closely matches the pressure curve obtained from the process simulation. Both exhibit a stepwise increase in air pressure, which then rapidly jumps to the maximum pressure of 1 MPa at a certain stage. Additionally, Figure 10b presents the pressure relief valve control curve and the output pressure curve of the air source. The hysteresis effect shown in the pressure relief valve control curve provides an important basis for achieving precise equipment control of the process parameters. The combined equipment control parameters of the pressure relief valve and air pressure source form the key design foundation for meeting customized product requirements and effectively support the optimization of the thinning rate indicator.

3.4. Results and Discussion

We validated the feasibility and effectiveness of the proposed MBSE-based optimization method for SPF in the context of customized products. Unlike traditional approaches that focus solely on optimizing parameters to meet product performance, our method incorporates the principles of MBSE to integrate actual manufacturing activities and equipment-related constraints into the optimization process. By employing SysML modeling and object flow analysis, the mapping relationships between process parameters and equipment control parameters were clearly defined
Using a hemispherical part as a representative example, this study focused on minimizing the thinning rate as the primary quality objective based on user requirements. The influence of various process parameters was quantitatively analyzed through parameter extraction in conjunction with the AHP method. The results showed that the preforming strain rate and the forming strain rate are the key factors affecting the forming quality. These findings are consistent with the prior research [38,39], demonstrating the accuracy and applicability of the proposed method in identifying critical parameters. An orthogonal experimental design combined with simulation techniques was employed to jointly optimize the key process parameters. The final parameter set met the required forming quality, achieving a thinning rate of 0.495, in line with the customer’s customization requirements. Meanwhile, the wall thickness standard deviation was controlled at 0.605 mm, ensuring balanced consideration of quality indicators. Based on the simulation results of the optimal process parameters as the control target, the key process parameters were translated into equipment control parameters for the pressure relief valve and pneumatic source, providing actionable guidance for practical manufacturing.
Compared to conventional optimization processes based solely on The design of experiments and the finite element methods, which are typically oriented toward product performance, the proposed method helps narrow down the parameter space and improves the efficiency of key parameter identification. Moreover, it bridges simulation with physical system control, making it well-suited for customized manufacturing scenarios where demand variability and high control precision are common. The optimization method demonstrates applicability not only to the forming equipment and materials in the present case study, but shows adaptability to various types of SPF equipment, other superplastic materials (e.g., Ti and Mg alloys), and diverse quality indicator requirements during the forming process of customized products. The method exhibits excellent generalizability and scalability.
However, certain limitations should be acknowledged. The identification of key process parameters through the AHP relies on the experience and judgment of engineers, which may increase the workload and introduce subjectivity in scenarios involving frequent or large-scale customization. Additionally, the complexity of the MBSE modeling process may pose adoption challenges for small and medium-sized enterprises lacking digital engineering expertise.

4. Conclusions

This paper addresses the challenge of diversified product customization by optimizing process parameters and equipment control parameters using MBSE technology. The main contributions include the following:
(1)
This paper proposes a method to optimize process parameters and equipment control parameters by integrating SPF manufacturing process information with customized product requirements. Using MBSE to organize requirements, processes, and equipment information, and combining it with a physical simulation, the method traces the impact of product requirements on process parameters and equipment control parameters. This standardized approach facilitates meeting customized product requirements in complex manufacturing processes.
(2)
Guided by the proposed framework, a hemispherical part case study was conducted to optimize the process parameters for customized product requirements. The research developed the MBSE of SPF, enabling the mapping of product requirements to process parameters. Process parameters were decoupled using the AHP, and optimized combinations were identified through orthogonal experiments and MSC Marc simulations. The optimization results were further mapped to the equipment physical model, and the obtained equipment control parameters met the customized product requirements.
The framework proposed in this paper highlights the advantages of MBSE technology in addressing complex product customization and validates its feasibility for optimizing process parameters and equipment control parameters.
Further research is needed. This method could serve as a basis for exploring the integration of advanced data-driven analysis or intelligent modeling techniques, especially in scenarios involving nonlinear or strongly coupled manufacturing processes. Additionally, while this study focuses on quality indicators, future research should expand MBSE applications to equipment design. By integrating advanced manufacturing technologies, MBSE could better support the digital and intelligent transformation of advanced manufacturing.

Author Contributions

Conceptualization, X.Z. and S.W.; methodology, X.Z. and W.Y.; software, X.Z., B.W. (Boya Wang), B.W. (Bo Wang) and F.Z.; formal analysis, L.W. and S.L.; investigation, B.W. (Boya Wang) and G.Z.; resources, C.X.; data curation, A.Z.; writing—original draft, H.G.; writing—review and editing, W.Y. and L.H.; visualization, C.X. and B.W. (Bo Wang); supervision, L.H.; project administration, S.W. All authors have read and agreed to the published version of the manuscript.

Funding

This research was supported by the National Science and Technology Major Project of China under Grant No. 2024ZD0714901.

Data Availability Statement

The original contributions presented in this study are included in the article; further inquiries can be directed to the corresponding author.

Acknowledgments

The authors sincerely appreciate the senior engineers from Beijing National Innovation Institute of Lightweight Ltd. for their valuable insights and professional expertise. Their extensive experience and practical knowledge have significantly contributed to the development of this work.

Conflicts of Interest

Author Xingwei Zhou, Wanran Yang, Shaozong Wang, Boya Wang, Le Wu, Chengyue Xiong, and Ailing Zou were employed by the company Beijing National Innovation Institute of Lightweight Ltd. The remaining authors declare that the research was conducted in the absence of any commercial or financial relationships that could be construed as a potential conflict of interest.

Abbreviations

The following abbreviations are used in this manuscript:
SPFSuperplastic forming
AHPAnalytic hierarchy process
MBSEModel-based systems engineering
ACTActivity diagram

References

  1. Du, Z.; Jiang, S.; Zhang, K.; Lu, Z.; Li, B.; Zhang, D. The Structural Design and Superplastic Forming/Diffusion Bonding of Ti2Alnb Based Alloy for Four-Layer Structure. Mater. Des. 2016, 104, 242–250. [Google Scholar] [CrossRef]
  2. Akula, S.P.; Ojha, M.; Rao, K.L.; Gupta, A.K. A Review on Superplastic Forming of Ti-6Al-4V and Other Titanium Alloys. Mater. Today Commun. 2023, 34, 105343. [Google Scholar] [CrossRef]
  3. Barnes, A.J. Superplastic Forming 40 Years and Still Growing. J. Mater. Eng. Perform. 2007, 16, 440–454. [Google Scholar] [CrossRef]
  4. Piccininni, A.; Sorgente, D.; Palumbo, G. GA-Based Optimization to Control the Thickness Distribution in Components Manufactured via Superplastic Forming. J. Manuf. Process. 2023, 86, 126–135. [Google Scholar] [CrossRef]
  5. Giuliano, G.; Polini, W. Optimal Design of Blank Thickness in Superplastic AZ31 Alloy to Decrease Forming Time and Product Weight. Int. J. Adv. Manuf. Technol. 2022, 118, 2153–2162. [Google Scholar] [CrossRef]
  6. Tran, R.; Reuther, F.; Winter, S.; Psyk, V. Process Development for a Superplastic Hot Tube Gas Forming Process of Titanium (Ti-3Al-2.5V) Hollow Profiles. Metals 2020, 10, 1150. [Google Scholar] [CrossRef]
  7. Li, T.; Yuan, M.; Qu, Y.; Zhang, S.; Li, B.; Zhou, Y. Temperature Field Analysis of Heating Furnace of Superplastic Forming Equipment Based on Thermal Resistance Network Model. In Proceedings of the International Conference on Guidance, Navigation and Control, ICGNC 2022, Harbin, China, 5–7 August 2022; Springer Science and Business Media Deutschland GmbH: Harbin, China, 2023; Volume 845, pp. 2227–2237. [Google Scholar]
  8. Yang, J.; Wu, J.; Zhang, Q.; Han, R.; Wang, K. The Simple Hyperbolic-Sine Equation for Superplastic Deformation and Parameters Optimization. J. Mater. Res. Technol.-JMRT 2020, 9, 10819–10829. [Google Scholar] [CrossRef]
  9. Zhang, T.; Sha, H.; Li, L.; Gong, H. Study of Macroscopic Defects of Four-Layer Structure of Ti-6Al-4V During Superplastic Forming/Diffusion Bonding. Int. J. Precis. Eng. Manuf. 2021, 22, 27–39. [Google Scholar] [CrossRef]
  10. Du, Z.; Zhang, K. The Superplastic Forming/Diffusion Bonding and Mechanical Property of TA15 Alloy for Four-Layer Hollow Structure with Squad Grid. Int. J. Mater. Form. 2021, 14, 1057–1066. [Google Scholar] [CrossRef]
  11. Jiang, S.; Jia, Y.; Lu, Z.; Shi, C.; Zhang, K. Superplastic Forming/Diffusion Bonding Without Interlayer of 5A90 Al-Li Alloy Hollow Double-Layer Structure. J. Mater. Eng. Perform. 2017, 26, 4265–4273. [Google Scholar] [CrossRef]
  12. Wu, D.; Chen, M.; Fan, R.; Xiao, W.; Wu, Y. Parameter Optimization and Compressive Property of the TC31 Titanium Alloy X-Type Lattice Structure by the Superplastic Forming/Diffusion Bonding Process. Arch. Civ. Mech. Eng. 2023, 23, 137. [Google Scholar] [CrossRef]
  13. Yasmeen, T.; Shao, Z.; Zhao, L.; Gao, P.; Lin, J.; Jiang, J. Constitutive Modeling for the Simulation of the Superplastic Forming of TA15 Titanium Alloy. Int. J. Mech. Sci. 2019, 164, 105178. [Google Scholar] [CrossRef]
  14. Yang, J.; Wu, J.; Yang, D.; Wang, Q.; Wang, K.; Zhang, Z.; Wang, M.; Muzamil, M. A Modified Constitutive Model With Grain Rotation for Superplastic Forming of Ti-6Al-4V Alloy. J. Eng. Mater. Technol.-Trans. ASME 2020, 142, 021006. [Google Scholar] [CrossRef]
  15. Wu, D.; Wu, Y.; Chen, M.; Fan, R.; Yan, K.; Xiao, W. Structural Optimization and Experimental Study on the Ti-Alloy Kagome Structure Formed by the Superplastic Forming/Diffusion Bonding Process. J. Sandw. Struct. Mater. 2024, 26, 303–316. [Google Scholar] [CrossRef]
  16. Zaman, U.K.U.; Siadat, A.; Rivette, M.; Baqai, A.A.; Qiao, L. Integrated Product-Process Design to Suggest Appropriate Manufacturing Technology: A Review. Int. J. Adv. Manuf. Technol. 2017, 91, 1409–1430. [Google Scholar] [CrossRef]
  17. Von, D.N.; Martin, P. Product Design-Process Selection-Process Planning Integration Based on Modeling and Simulation. Int. J. Adv. Manuf. Technol. 2015, 77, 187–201. [Google Scholar]
  18. Jiang, H.; Huang, K.; Zhou, Z.; Miao, D.; Chen, F.; Gao, J.; Yang, X.; Zhu, Y. Optimization of Electrolytic Copper Foil Manufacturing Process Parameters by Integrating Equipment Status and Product Requirements. Hsi-Chiao Tung Ta Hsueh/J. Xi’an Jiaotong Univ. 2024, 58, 179–190. [Google Scholar]
  19. Schindel; Polyakova; Harding, D.R.; Weinhold; Stenger; Grünewald, M.; Bramsiepe. General Approach for Technology and Process Equipment Assembly (PEA) Selection in Process Design-Web of Science Core Collection. Chem. Eng. Process.-Process Intensif. 2021, 159, 108223. [Google Scholar] [CrossRef]
  20. Sabioni, R.C.; Daaboul, J.; Le Duigou, J. Joint Optimization of Product Configuration and Process Planning in Reconfigurable Manufacturing Systems. Int. J. Ind. Eng. Manag. 2022, 13, 58–75. [Google Scholar] [CrossRef]
  21. Qi, D.; Zhang, S.; Liu, M.; Lei, Y. An Improved Hierarchical Genetic Algorithm for Collaborative Optimization of Manufacturing Processes in Metal Structure Manufacturing Systems. Adv. Mech. Eng. 2017, 9, 1687814017692288. [Google Scholar] [CrossRef]
  22. Park, K.T.; Lee, J.; Kim, H.-J.; Noh, S. Digital Twin-Based Cyber Physical Production System Architectural Framework for Personalized Production. Int. J. Adv. Manuf. Technol. 2020, 106, 1787–1810. [Google Scholar] [CrossRef]
  23. Zaman, U.K.U.; Rivette, M.; Siadat, A.; Mousavi, S.M. Integrated Product-Process Design: Material and Manufacturing Process Selection for Additive Manufacturing Using Multi-Criteria Decision Making. Robot. Comput.-Integr. Manuf. 2018, 51, 169–180. [Google Scholar] [CrossRef]
  24. Madni, A.M.; Sievers, M. Model-Based Systems Engineering: Motivation, Current Status, and Research Opportunities. Syst. Eng. 2018, 21, 172–190. [Google Scholar] [CrossRef]
  25. Yang, B.; Qiao, L.; Zhu, Z.; Wulan, M. A Metamodel for the Manufacturing Process Information Modeling. In Proceedings of the 9th International Conference on Digital Enterprise Technology—Intelligent Manufacturing in the Knowledge Economy Era; Li, Y., Gao, J., Maropoulos, P., Eds.; Elsevier Science Bv: Amsterdam, The Netherlands, 2016; Volume 56, pp. 332–337. [Google Scholar]
  26. Madni, A.M.; Madni, C.C.; Lucero, S.D. Leveraging Digital Twin Technology in Model-Based Systems Engineering. Systems 2019, 7, 7. [Google Scholar] [CrossRef]
  27. Lyu, W.; Yang, Y.; Miao, J.; Cao, S.; Kong, L. Architecture Preliminary Design and Trade-Off Optimization of Stratospheric Airship Based on MBSE. Aerospace 2024, 11, 582. [Google Scholar] [CrossRef]
  28. Chu, C.; Zhang, C.; Yin, C. Synchronous Integration Method of Mechatronic System Design, Geometric Design, and Simulation Based on SysML. Comput.-Aided Des. 2024, 174, 103735. [Google Scholar]
  29. Sinnwell, C.; Hasse, A.; Fischer, J.; Aurich, J.C. Collaborative planning of manufacturing systems using a model-based, PLM-supported design process. AT-Automatisierungstechnik 2018, 66, 406–417. [Google Scholar] [CrossRef]
  30. Le, Q.; Feingold, J.; Glandorf, W.; Kent, J.; Sherman, R.; Ferri, J.K.K. Model-Based Systems Engineering Approaches to Chemicals and Materials Manufacturing. AICHE J. 2023, 69, e18114. [Google Scholar] [CrossRef]
  31. Steimer, C.; Fischer, J.; Aurich, J.C. Model-Based Design Process for the Early Phases of Manufacturing System Planning Using SysML. In Proceedings of the Complex Systems Engineering and Development; Shehab, E., Tomiyama, T., Lockett, H., Salonitis, K., Roy, R., Tiwari, A., Eds.; Elsevier Science Bv: Amsterdam, The Netherlands, 2017; Volume 60, pp. 163–168. [Google Scholar]
  32. Mousavi, B.A.; Heavey, C.; Azzouz, R.; Ehm, H.; Millauer, C.; Knobloch, R. Use of Model-Based System Engineering Methodology and Tools for Disruption Analysis of Supply Chains: A Case in Semiconductor Manufacturing. J. Ind. Inf. Integr. 2022, 28, 100335. [Google Scholar] [CrossRef]
  33. Craiut, L.; Bungau, C.; Negru, P.A.; Bungau, T.; Radu, A.-F. Technology Transfer in the Context of Sustainable Development—A Bibliometric Analysis of Publications in the Field. Sustainability 2022, 14, 11973. [Google Scholar] [CrossRef]
  34. Eidlisz, J.; von Simson, I.; Gold-von Simson, G. Exploring the Current State of Technology Transfer in the United States: Perspectives and Improvement Strategies from the Experts. Front. Res. Metr. Anal. 2024, 9, 1376185. [Google Scholar] [CrossRef] [PubMed]
  35. Craiut, L.; Bungau, C.; Bungau, T.; Grava, C.; Otrisal, P.; Radu, A.-F. Technology Transfer, Sustainability, and Development, Worldwide and in Romania. Sustainability 2022, 14, 15728. [Google Scholar] [CrossRef]
  36. Friedenthal, S. A Practical Guide to SysML: The Systems Modeling Language; Morgan Kaufmann: Burlington, MA, USA, 2014; ISBN 978-0-12-800202-5. [Google Scholar]
  37. Chang, C.-W.; Wu, C.-R.; Chen, H.-C. Using Expert Technology to Select Unstable Slicing Machine to Control Wafer Slicing Quality via Fuzzy AHP. Expert Syst. Appl. 2008, 34, 2210–2220. [Google Scholar] [CrossRef]
  38. Madarapu, A.; Babu, J.; Ramana, M.V. Experimental Evaluation of Normalized Thickness Variation of Superplastic Cone Forming. In Proceedings of the Materials Today-Proceedings; Elsevier: Amsterdam, The Netherlands, 2022; Volume 49, pp. 2335–2341. [Google Scholar]
  39. Jordaan, M.S.; Kok, S. Material Model Calibration for Superplastic Forming. Inverse Probl. Sci. Eng. 2019, 27, 589–607. [Google Scholar] [CrossRef]
Figure 1. A typical superplastic forming process.
Processes 13 01497 g001
Figure 2. The proposed methodology framework for integrating manufacturing process information based on model-based systems engineering to meet product requirements. Note: values marked with an asterisk (*) represent parameters specific to individual product requirements.
Processes 13 01497 g002
Figure 3. The principles of developing model-based systems engineering using systems modeling language.
Processes 13 01497 g003
Figure 4. Flowchart for process parameters extraction based on the activity diagram.
Processes 13 01497 g004
Figure 5. Equipment control parameter optimization method based on physical model. Note: values marked with an asterisk (*) represent parameters specific to individual product requirements.
Processes 13 01497 g005
Figure 6. Model-based systems engineering model of the 800T superplastic forming equipment constructed.
Processes 13 01497 g006
Figure 7. Superplastic forming process parameter extraction method using the activity diagram and the block definition diagram.
Processes 13 01497 g007
Figure 8. MSC Marc superplastic forming simulation: (a) initial simulation state and interface; (b) simulation result state.
Processes 13 01497 g008
Figure 9. Superplastic forming process parameters corresponding to equipment control parameters. Note: values marked with an asterisk (*) represent parameters specific to individual product requirements.
Processes 13 01497 g009
Figure 10. Physical simulation results of superplastic forming: (a) demand pressure output curve and simulation output pressure curve; (b) equipment control parameters of the pressure relief valve and air pressure source.
Processes 13 01497 g010
Table 1. A specific description of the superplastic forming manufacturing process information.
Parameter CategorySpecific Description
Quality Indicators
(s1, s2, s3sn)
These refer to specific metrics for evaluating the final product’s quality. Examples include wall thickness uniformity, surface accuracy, surface finish, structural complexity, toughness, strength, and hardness.
Process Parameters
(p1, p2, p3py)
These are the process conditions that influence the forming quality and efficiency during SPF, directly determining the reliability of the process and product quality. Examples include mold geometry, mold clamping force, forming air conditions, preforming speed, and forming speed.
Equipment Control Parameters
(e1, e2, e3em)
These reflect the state parameters of equipment operation to ensure the smooth execution of the forming process. Examples include mold dimensions, furnace door parameters, hydraulic pump parameters, hydraulic valve parameters, and heating tube parameters.
Table 2. Classification of superplastic forming quality indicators based on shape control and performance control standards.
CategoryIndicator
sf: Forming indicatorssf1 (Wall Thickness Uniformity), sf2 (Mold Profile Accuracy)
sf3 (Surface Finish), sf4 (Structural Complexity)
sm: Mechanical indicatorssm1 (Product Toughness), sm2 (Product Strength)
sm3 (Product Hardness), sm4 (Product Fatigue Resistance)
Table 3. Pairwise comparison matrix of process parameters.
siP1P2Pl
P11x12x1l
P2x211x2l
1
Plxl1xl21
Table 4. RI Constants used in the consistency check of the analytic hierarchy process method.
Order34567891011
R.I.0.580.901.121.241.321.411.451.491.51
Table 5. Key technical parameters of the 800T superplastic forming equipment.
ItemUnitParameter
PressureNominal forcekN8000
Return forcekN700
Slider stroke control accuracymm2
Maximum mold installation heightmm[200, 800]
Heating chamber temperatureMaximum working temperature°C980
Heating rate°C/h[80, 120]
Supply air pressureMPa[0, 5]
Table 6. Customized product requirement list for hemispherical part.
AttributeConditionValue
Product diameter size/650 mm
Material/Ti-6Al-4V titanium alloy
Material strength index90% of raw material
Raw material thickness/6 mm
Thinning rate50%
Table 7. Classification of superplastic forming process parameters based on shape control and performance control standards.
CategoryProcess ParameterAssociated Activity (Output Parameter)
ps: Machining Process Parametersps1 (Mold Geometry Parameters)Mold Opening and Loading (Structural Parameter)
ps2 (Mold Clamping Force)Downward Pressure Control (Streaming Parameter)
ps3 (Forming Air Conditions)Closing Furnace Door (Structural Parameter)
ps4 (Preforming Speed)Reverse Air Pressure Forming (Streaming Parameter)
ps5 (Forming Speed)Forward Air Pressure Forming (Streaming Parameter)
ps6 (Forming Air Pressure)Forward Air Pressure Forming (Streaming Parameter)
pc: Thermochemical Processing Parameterspc1 (Mold Preheating Parameters)Mold Pre-treatment (Streaming Parameter)
pc2 (Forming Temperature)Temperature Control (Streaming Parameter)
pc3 (Temperature Uniformity)Process Control (Structural Parameter)
pc4 (Cooling Method)Product Cooling (Structural Parameter)
Table 8. Process parameter comparison matrix for thinning rate indicator.
srps1ps2ps3ps4ps5ps6pc1pc2pc3pc4
ps11351/91/61/451/235
ps21/3131/61/61/521/412
ps31/51/311/91/71/611/51/21
ps49691239889
ps56671/2128458
ps64561/31/217347
pc11/51/211/91/81/711/51/31
pc22451/81/41/35145
pc31/3121/81/51/431/412
pc41/51/211/91/81/711/51/21
Table 9. Orthogonal experiment factor level table.
LevelA: Preforming Strain Rate s−1B: Forming Strain Rate s−1C: Forming Air Pressure MPa
10.00050.00050.6
20.00100.00101
30.00150.00151.4
Table 10. Orthogonal experiment design table.
Experiment No.Factor Levels and Values
A: Preforming Strain Rate s−1B: Forming Strain Rate s−1C: Forming Air Pressure MPa
10.00050.00050.6
20.00050.00101.4
30.00050.00151
40.00100.00051.4
50.00100.00101
60.00100.00150.6
70.00150.00051
80.00150.00100.6
90.00150.00151.4
Table 11. Orthogonal experiment results of superplastic forming.
Experiment No.Factor Levels and ValuesThinning RateWall Thickness Standard Deviation mm
ABC
10.00050.00050.60.5020.629
20.00050.00101.40.5190.656
30.00050.001510.4950.605
40.00100.00051.40.4720.632
50.00100.001010.4910.638
60.00100.00150.60.5010.512
70.00150.000510.5030.684
80.00150.00100.60.4970.674
90.00150.00151.40.4990.629
Table 12. Range analysis of orthogonal experimental results for thinning rate and wall thickness standard deviation.
ParameterThinning Rate RangeWall Thickness Standard Deviation Range mm
ABCABC
K11.5161.4771.5001.8901.9451.815
K21.4641.5071.4891.7821.9681.927
K31.4991.4951.4901.9511.7461.917
k10.5050.4920.5000.6300.6480.605
k20.4880.5020.4960.5940.6560.642
k30.5000.4980.4970.6500.5820.639
R0.0170.0100.0040.0560.0740.037
Disclaimer/Publisher’s Note: The statements, opinions and data contained in all publications are solely those of the individual author(s) and contributor(s) and not of MDPI and/or the editor(s). MDPI and/or the editor(s) disclaim responsibility for any injury to people or property resulting from any ideas, methods, instructions or products referred to in the content.

