Article

Numerical Investigation of Energy Efficiency and Remediation Performance of Steam Injection via Horizontal Wells for Soil Xylene Pollution

by
Yuchao Zeng
1,2,3,
Lixing Ding
1,
Haizhen Zhai
2,* and
Bin He
3
1
College of Mechanical and Electrical Engineering, Zhongkai University of Agriculture and Engineering, Guangzhou 510225, China
2
Guangzhou Institute of Energy Conversion, Chinese Academy of Sciences, Guangzhou 510640, China
3
Institute of Eco-Environmental and Soil Science, Guangdong Academy of Sciences, Guangzhou 510650, China
*
Author to whom correspondence should be addressed.
Processes 2025, 13(5), 1491; https://doi.org/10.3390/pr13051491
Submission received: 14 February 2025 / Revised: 8 May 2025 / Accepted: 11 May 2025 / Published: 13 May 2025
(This article belongs to the Topic Advanced Heat and Mass Transfer Technologies)

Abstract

:
Soil organic pollution poses a significant threat to agricultural safety in China, underscoring the critical importance of developing efficient remediation technologies for soil environmental protection. Steam injection, a promising method for removing organic pollutants from soil, has yet to be thoroughly investigated in terms of its energy efficiency. A novel steam injection system with horizontal wells is proposed to remediate soil xylene pollution, and a corresponding numerical model is established and solved through TOUGH2-T2VOC codes. The energy efficiency characteristics and main influencing factors of the system are analyzed. The results demonstrate that steam injection is an effective method to remediate xylene pollution. It is evaluated that during the first 1.5 years of the 5-year operation period, production xylene saturation gradually decreases from 0.3 to 0.05, and the production xylene mass flow rate gradually decreases from 0.179 kg/s to 2.448 × 10⁻⁴ kg/s. Pump power consumption gradually increases from 17.23 kW to 30.67 kW, while energy efficiency gradually decreases from 7.73 × 10⁻⁴ kg/kJ to 1.00 × 10⁻⁶ kg/kJ. Sensitivity analyses indicate that the main factors affecting the xylene mass flow rate are formation permeability, production pressure and the initial xylene saturation, and the main factors affecting energy efficiency are the steam injection flow rate, formation permeability, production pressure and initial xylene saturation. This has significant practical significance for the optimal design of the steam injection remediation scheme for soil organic pollution.

1. Introduction

1.1. Background

Soil is an important material foundation for human social production activities, and it is also a kind of indispensable natural resource that is difficult to regenerate [1,2]. Soil has the function of acting as a sink for environmental pollution; toxic and harmful chemicals in soil migrate and transform through the atmosphere and water bodies, which can endanger the survival and reproduction and life safety of human beings and animals. A large amount of volatile organic compounds (VOCs) that are discharged and leaked in the process of production, storage and use in petrochemical, coal chemical and gas stations cause serious pollution to plants and surrounding soil [3,4,5,6]. Due to the seriousness of soil pollution and the difficulty of its remediation, as well as the urgency of and demand for the remediation of contaminated soil, the remediation of contaminated soil has become a hot and challenging area of environmental science [1,2,4,5].
Soil pollution in our country has begun to threaten the sustainable utilization of land resources and the ecological security of agricultural products [2,7]. Chinese farmland polluted by organic pollutants has reached 3.6 × 10⁷ hectares, of which 1.6 × 10⁷ hectares are polluted by pesticides, and the pesticide residue has exceeded the standard rate of major agricultural products and is as high as 16–20% [4]. The national annual loss of grain due to soil pollution has reached 1.2 × 10¹⁰ kg [4]. Soil pollution can reduce the quality of agricultural products, harm human health, and lead to air and water environmental pollution, so it is of great practical significance to study soil pollution control and remediation technology.
Soil pollution remediation refers to the use of physical, chemical and biological methods to transfer, absorb, degrade and transform pollutants in soil to reduce their concentrations to acceptable levels or to transform toxic and harmful pollutants into harmless substances [4,5,6]. According to the principle of remediation, it can be divided into physical, chemical and biological methods. The physical methods mainly include solution leaching, solidification stabilization, freeze–thaw, electrodynamic and heat injection. The chemical methods mainly include oxidation methods, reduction methods and soil conditioner dosing technology [8]. Bioremediation is the main body of soil pollution remediation, including microbial remediation, phytoremediation and animal remediation, and the most widely used is microbial and phytoremediation technology [4,9].

1.2. Research Status

Benzene series in soil is a kind of special soil pollution substance with stable chemical properties and different characteristics and potential to harm to other pollutants. Benzene series pollution is volatile, toxic, and difficult to degrade and control [10]. These pollutants not only threaten groundwater resources but also can change soil characteristics and harm crops, and they are listed as some of the most dangerous toxic pollutants in the environment that should be controlled first. The thermal injection remediation technology of physical remediation methods has the advantages of requiring less investment and can be used in soil and groundwater pollution remediation at the same time, and it has become a research hotspot of benzene series in situ pollution remediation technology [11,12,13,14]. Heat injection is an effective method used to remove benzene series from soil. Its principle is to reduce the viscosity of non-aqueous phase liquids (NAPLs), improve flow ability, and drive NAPLs to flow toward the production well; it can also significantly shorten the remediation time. The history of the petroleum industry shows that steam injection is an effective method used to improve heavy oil recovery, so it has been studied and applied more and more in recent years. Zhu took soil polluted by benzene series as the research object, analyzed the influence of heating power and heating time on the removal rate of benzene series, and proved that the gas phase extraction removal efficiency of benzene series in soil could be effectively improved by heating [15]. Taking the soil of the actual contaminated site as the object, the optimum operating conditions for the remediation of soil contaminated by benzene series were studied via a small-scale experiment by He et al. [6]. The results showed that the removal rate of benzene and xylene in the contaminated soil could reach 99% after the optimal operating conditions were used to treat the contaminated soil with a radius of 6 m in a heating well for 28 days. Taking six volatile benzene series as target pollutants, Li et al. [16] investigated the effects of soil temperature and steam heating power on the removal of these pollutants and the characteristics of the removal process. Huang et al. [17] analyzed the current development and application prospects of steam injection technology by combining the characteristics of organic pollution in China. However, the performance characteristics and energy efficiency of this method for the remediation of NAPL pollution in soil are less studied at present. In this work, we take o-xylene as the target pollutant and use a numerical method to analyze the performance characteristics and energy efficiency of steam injection through horizontal wells to remove pollution, so as to lay the foundation for the further improvement and application of this method in the future. In addition, the use of this technology is controversial because high temperatures can degrade soil structure, organic matter or microbial communities, reducing soil fertility, and VOCs also can be promoted, which can lead to secondary air pollution [5]; thus, the further refinement of this technology will still require a lot of work in the future.

1.3. Research Objectives

The research objectives of this work are to analyze the performance characteristics of the steam injection method through horizontal wells to remediate xylene-contaminated soil, evaluate the main factors affecting the purification efficiency of the system, and further improve and perfect the steam injection method to remediate xylene-contaminated soil. The research results will provide a theoretical basis for the remediation of xylene pollution in soil by steam injection in the future.

2. Horizontal Well Steam Injection–Production Design

2.1. Horizontal Well System

At present, in the remediation of soil and groundwater pollution, the typical well layout method is to surround the contaminated area with 4 to 6 vertical injection wells and place the extraction well at the center [18,19]. With the development of drilling technology, horizontal wells are widely used in oil, gas and geothermal industries for they can significantly increase the contact area, which improves the controlling volume of wells [20,21,22,23,24,25,26,27]. Compared to vertical wells, horizontal well technology can obtain a higher energy production rate and lower flow impedance, which can significantly improve the energy efficiency of the system. However, at present, there are few studies on the use of horizontal well technology in soil and groundwater pollution remediation. With the development of well drilling and completion technology, it is possible to improve and enhance soil and groundwater pollution remediation efficiency with horizontal wells.
Based on the experience of the oil, gas and geothermal industries, three horizontal wells are used in this work, with one injection well located at the bottom and the other two production wells located at the top. Steam was injected into the xylene-polluted soil layer from the injection well and drove xylene toward the production well. The structure of the system is shown in Figure 1. When the steam drives xylene to flow toward the production well, the polluted soil layer experiences heat and mass transfer with the overburden and underburden layer, so the thickness of the upper and lower layer needs to be large enough to fully consider the influence of the injection and production in the xylene-polluted layer during the operation period.
Based on the experience of the oil, gas and geothermal industries, the thickness of the NAPL-containing layer is considered to be 40 m, and the thickness of the upper and lower layers is 20 m, respectively. The horizontal distance between the two production wells is 100 m. The conceptual model of the system is shown in Figure 1. The simulation results show that the model area is close to a typical soil pollution area, which makes the results valuable for application. Eight perforations are uniformly arranged around the horizontal well to inject steam and produce fluid into or out of the soil NAPL layer through perforation [20,21,22,23,24]. According to the experience of oil, gas and geothermal industries, this perforating method can effectively meet the production requirements [20].

2.2. Injection–Production Method

At the injection well, the mass flow rate of injected steam remains unchanged. An injection pump is installed on the surface and connected to the horizontal injection well through a vertical well to achieve fixed mass flow injection. For the production well, it is operated at a fixed production pressure, P0, below the original formation pressure to maintain production, and the production fluid reaches the surface for collection and processing. According to the experience of oil, gas and geothermal industries, this kind of injection–production mode can maintain long-term stable operations, which is an ideal operation mode with high safety and reliability.

3. Numerical Model

3.1. Simulation Tool

In this work, the TOUGH2-T2VOC code is used for simulation. The software uses the integral finite difference method to solve mass conservation, momentum conservation and energy conservation equations of water, air and VOCs [28,29]. Its accuracy and reliability have been proved in many aspects. Detailed information about the software and modules, including the governing equations of the model and the solution methods, can be found in the software’s user manual [28,29].

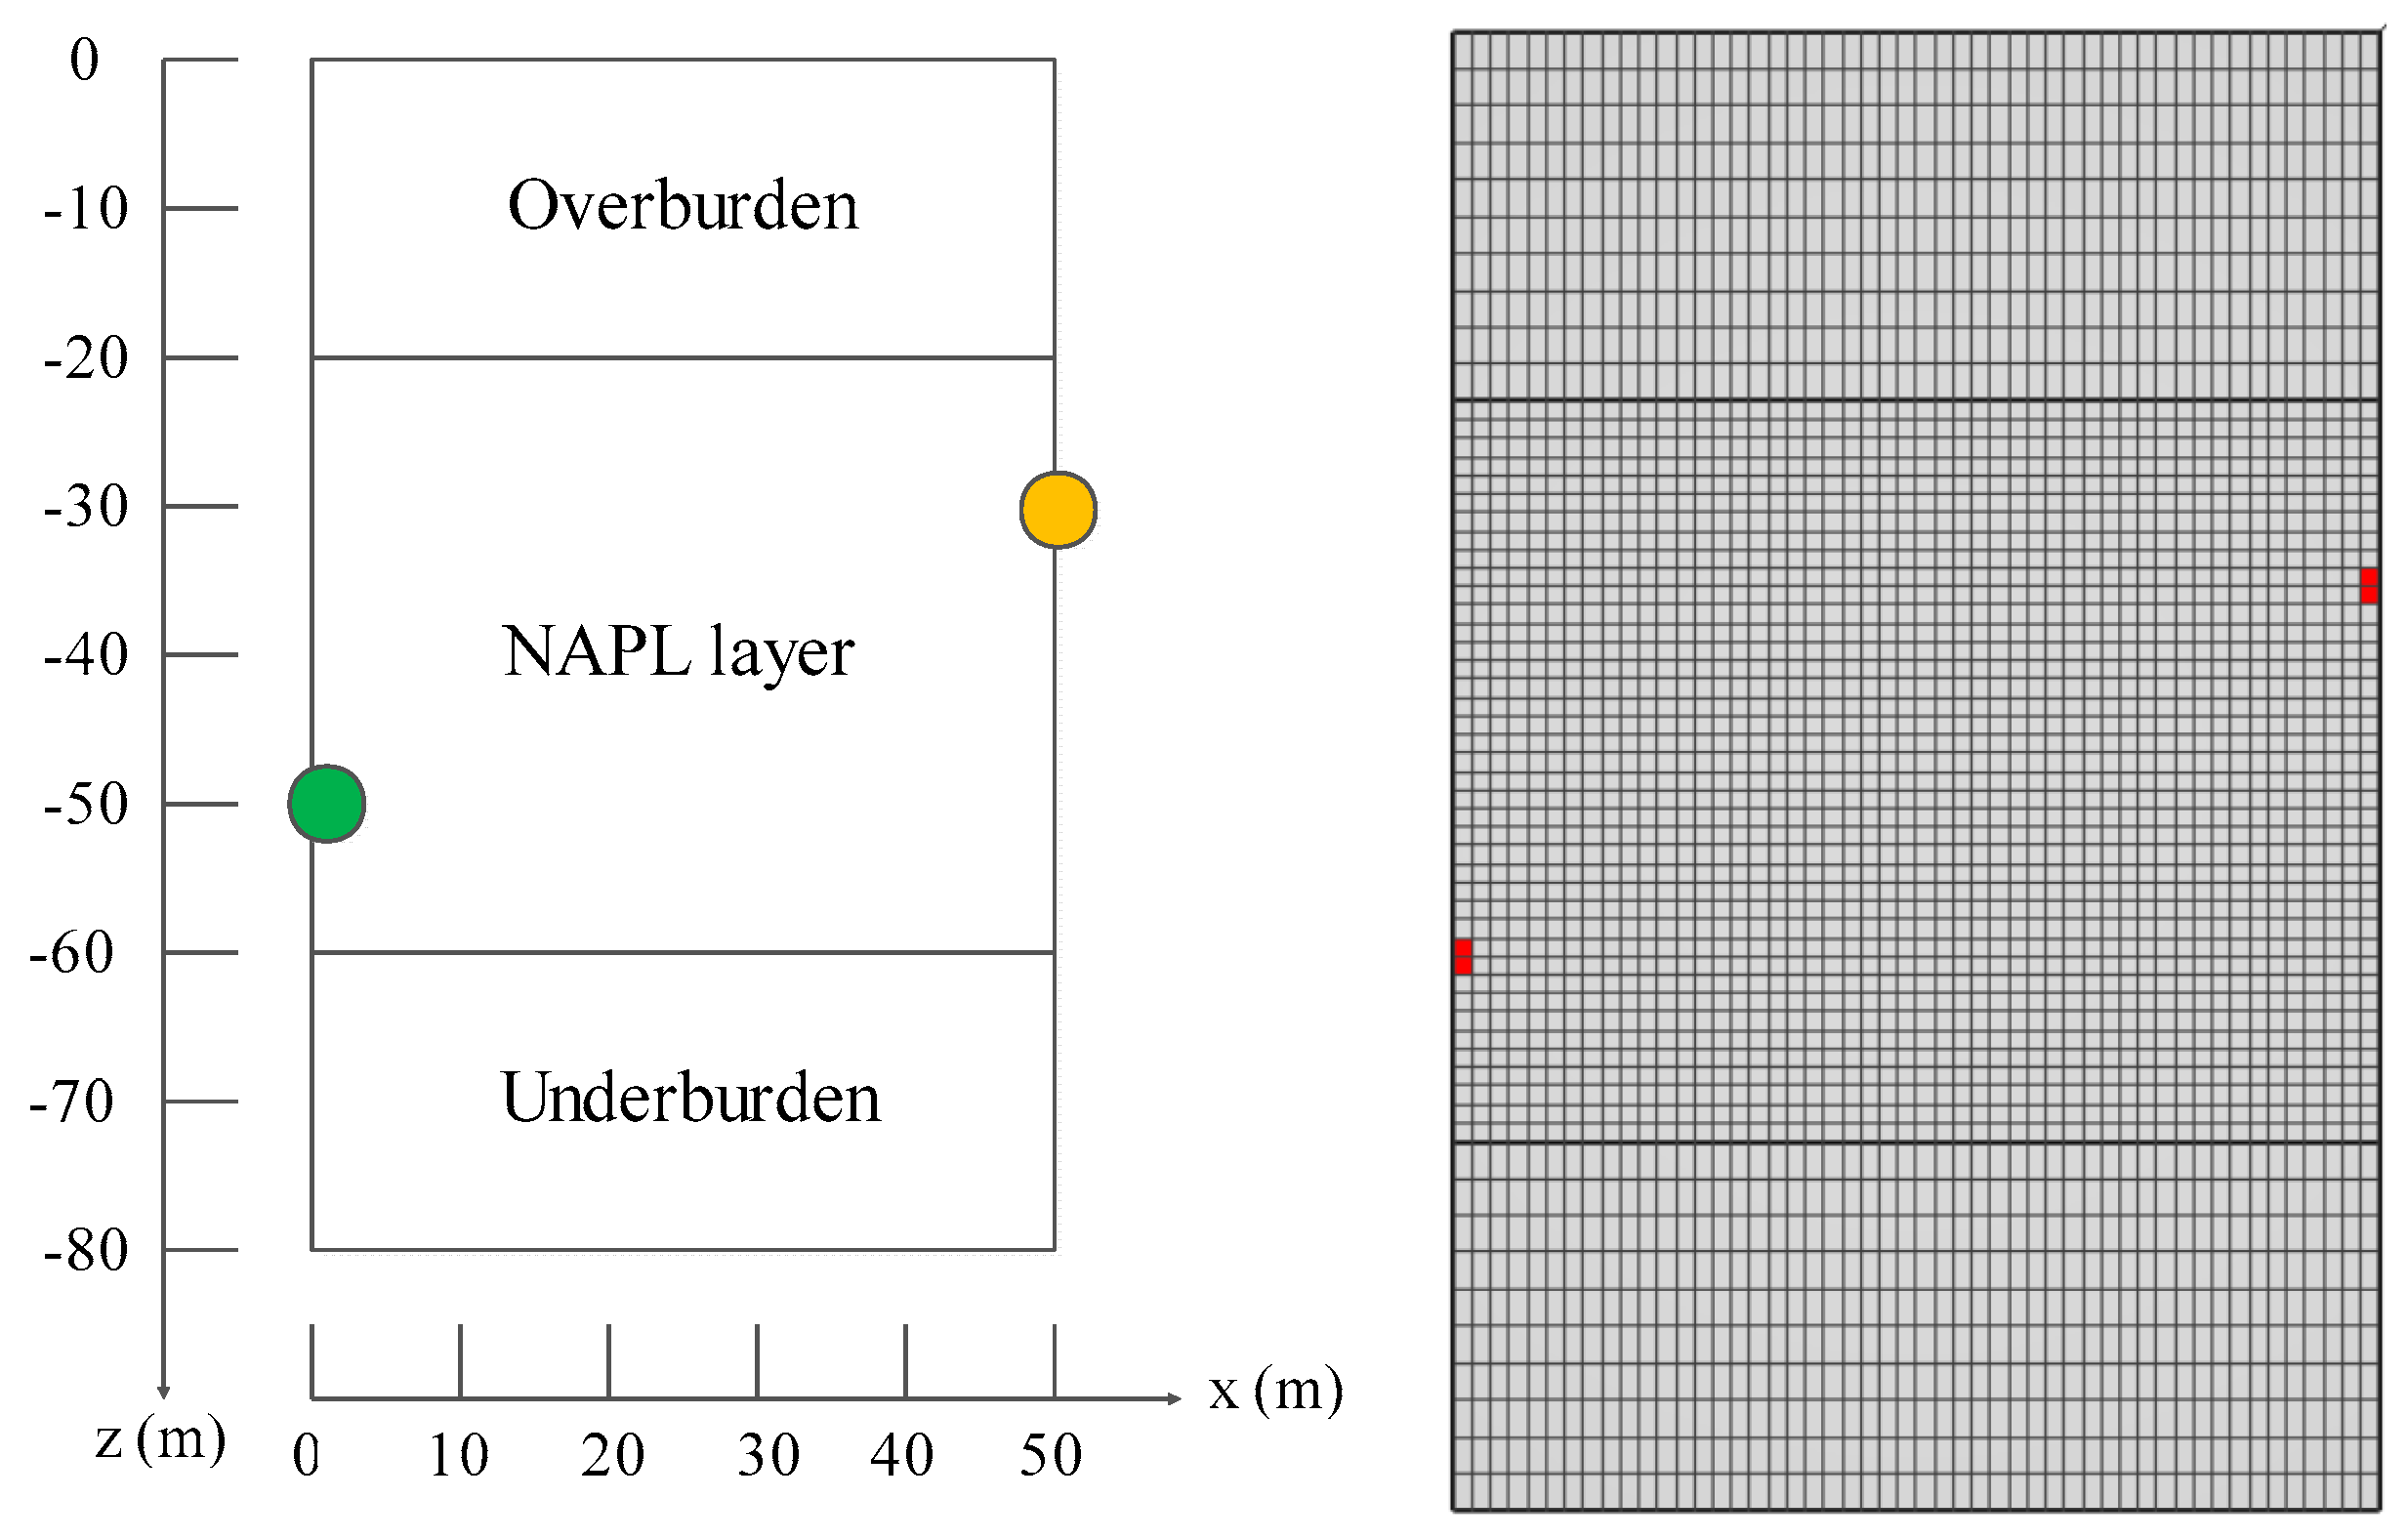
3.2. Conceptual Model

Due to symmetry (Figure 1), only half of the system needs to be simulated. In the x direction, the length of the simulated region is 50 m. It is assumed that the variation in each physical quantity along the horizontal well is negligible, so the simulation area is simplified from a 3D problem to a 2D problem, and 1 m thickness in the y direction is taken as the study area. In the vertical z direction, the simulated area is divided into the overburden layer, NAPL layer and underburden layer, in which the thickness of the NAPL layer is 40 m and the thickness of the upper and lower layers is 20 m. We assume that the top of the overburden layer is at z = 0 m, the injection well is at z = −50 m, and the production well is at z = −30 m. Due to the dramatic changes in flow and heat transfer around the well, the NAPL layer was evenly divided into 40 grids of 40 m thickness, and each grid height was 1 m, while the upper and lower layers were evenly divided into 10 grids of 2 m height, respectively. It is evenly divided into 50 grids in the x direction, each of which is 1 m in length. After such divisions, there are 60 × 50 = 3000 grids in the whole simulation area, as shown in Figure 2. According to previous research experience, a 1 m × 1 m grid of the NAPL layer can obtain sufficiently accurate numerical solutions.
In the reference case, the injected steam temperature is 100 °C, and the corresponding specific enthalpy is about 2.676 × 10⁶ J/kg. The injection flow rate of 8.0 × 10⁻⁴ kg/s was evenly distributed over the two meshes where the well perforated. Due to symmetry, each mesh represented the flow rate of two perforations, and the injection flow rate of each mesh was 4.0 × 10⁻⁴ kg/s. The bottom hole pressure of the production well is 8.0 × 10⁴ Pa, and the production index is 2.0 × 10⁻¹² m3. The physical property parameters of other soils used in the simulation are listed in Table 1, and the values of most physical property parameters are derived from the literature [29]. The three-phase relative permeability model used is Stone’s three-phase permeability model, and the capillary force model is the Parker model. The model formula is shown in the user manual of T2VOC [29], and the parameters are listed in Table 1. The VOC used in the calculation is o-xylene, and its physical property parameters are shown in the literature [29].

3.3. Initial and Boundary Conditions

In Figure 2, the topmost and bottommost boundaries are fixed pressure and temperature boundaries, which are fixed as the initial values to consider the seepage and heat transfer of the simulation area. Due to symmetry, the left and right boundaries in Figure 2 are impermeable, adiabatic boundaries. In the simulation area, the soil was connected to the atmosphere, the initial pressure was 101,325 Pa, and the initial temperature was 22 °C. For the NAPL layer, the three phases of xylene, water and air coexist initially. Xylene saturation is 0.3, water saturation is 0.4, and air saturation is 0.3. The overburden and underburden layers do not contain xylene initially, with a water saturation of 0.4 and air saturation of 0.6.

4. Simulation Results and Analysis

4.1. The Reference Case

As shown in Table 1, in the reference case, the initial saturation of xylene of the NAPL layer is 0.3, and the liquid water saturation is 0.4. The overburden and underburden layers do not contain xylene. The injection steam mass flow rate of the simulation domain is 8.0 × 10⁻⁴ kg/s, with a steam specific enthalpy of 2.676 × 10⁶ J/kg, about 100 °C. In this study, the operation time of injection steam is 5 years. Assuming that the horizontal well is 50 m long, the fluid mass produced in the study area is 100 times the mass flow rate produced in the simulation domain.

4.2. Production Fluid Saturation

Figure 3 shows the variation in production fluid saturation over the 5-year remediation period. Figure 1 shows that the actual time spent to remediate the NAPL layer pollution is about 1.5 years, during which xylene in the NAPL layer is gradually produced from the production well, and the production VOC saturation gradually decreases from the initial 0.30 value to a final value 0.04. When injected steam meets low-temperature soil, part of the steam liquefies rapidly, making the saturation of produced water increase rapidly from 0.4 to 0.59 in the initial period. With the increase in injected steam, part of the liquid water vaporizes into a gaseous state, and the saturation of produced water decreases from 0.59 to 0.56 and is kept stable. This variation is consistent with the production gas saturation. Overall, for the xylene-polluted soil layer, continuous steam injection is required for more than 1.5 years to remove pollutants from the soil (O is the VOC phase, that is, the NAPL phase).

4.3. Production Mass Flow Rate and Production Temperature

Because the top of the overburden layer and the bottom of the underburden layer are open-boundary conditions with constant pressure and temperature, the mass flow rates of injected fluid and produced fluid in the simulation domain are not equal. The injected steam mass in the simulation domain is 8.0 × 10⁻⁴ kg/s, so the injection mass flow rate of the whole system is q = 8.0 × 10⁻² kg/s. Figure 4 shows the evolution of the mass flow rate and temperature of the production well over the 5-year remediation period. During the remediation stage of the first 1.5 years, the production mass flow rate gradually decreased from 0.45 kg/s to 3.7 × 10⁻³ kg/s, after which it remained essentially unchanged. According to the relationship between injection and production mass flow rate, it can be estimated that the proportion of fluid loss to the outside of the simulation domain in a steady state is WL = 1 − 0.37/8 = 95.38%. The production temperature was maintained at an initial temperature of 22 °C for the first 3 years and increased slightly due to the steam heating effect.

4.4. Injection Pressure and Pump Power Consumption

The injection–production system designed in this study requires an injection pump to inject steam, while the production well requires a vacuum pump to extract fluid. The injected steam mass flow rate and specific enthalpy of the injection pump are fixed, the injection well depth h1 = 50 m, so the injection pump power consumption WP1 can be calculated as seen in Equation (1), where qinj is the injection mass flow rate and the reference case is qinj = 8.0 × 10⁻² kg/s. Pinj is the injection pressure, ρinj = 0.590 kg/m3 is the injected steam density, g is the acceleration of gravity, which is 9.80 m/s2, and ηp = 80% is the pump efficiency [15].
W p 1 = q inj ( P inj ρ inj g h 1 ) ρ inj η p
The vacuum pump extracts fluid from the NAPL layer, and its power WP2 can be calculated as seen in Equation (2), where qout is the mass flow rate of the produced fluid, as shown in Figure 4. ρout is the density of the produced fluid, which can be calculated according to Equation (3), and ρO, ρG and ρW are, respectively, the density of the VOC, gas and water under the pressure and temperature of the production well. According to the calculated results, the density of the VOC phase changed little in 5 years, with an average value of 878.1 kg/m3. The gas phase density also changed little, with an average value of 0.98 kg/m3. The production pressure is 8.0 × 10⁴ Pa and the production temperature is 22 °C, according to which the density of the water phase can be estimated to be 997.76 kg/m3. h2 is the production well depth, h2 = 30 m. P0 is the bottom-hole pressure of the production well, P0 = 8.0 × 10⁴ Pa. According to Equations (1) and (2), the total pump power Wp consumed by the system can be calculated with Equation (4), which shows that Wp is only a function of injection pressure Pinj because other parameters in the formula are known and are fixed values.
W p 2 = q out ( ρ out g h 2 P 0 ) ρ out η p
ρ out = ρ O S O + ρ G S G + ρ W S W
W p = W p 1 + W p 2
Figure 5 shows the evolution of injection pressure and pump power consumed by the system over the 5-year period. According to Equations (1)–(4), the pump power increases gradually with an increase in injection pressure. In the remediation stage of the first 1.5 years, the injection pressure gradually increased from 101.35 kPa to 171.24 kPa, and the corresponding pump power increased from 17.23 kW to 28.98 kW. After that, the injection pressure continued to increase from 171.24 kPa to 181.23 kPa, and the corresponding pump power gradually increased from 28.98 kW to 30.67 kW. There is water, NAPLs and gas in the formation at the same time, and the viscosity of water and NAPLs decreases with the increase in temperature, while the viscosity of gas increases with the increase in temperature. With the injection of steam into the formation, the gas content in the formation increases, the NAPLs decrease, and the relative content of water changes little. As a result, the formation temperature increases under the heating of steam, which makes the gas viscosity between the injection well and the production well increase, and this further increases the injection pressure and flow impedance, thus increasing energy consumption.

4.5. Production VOC Mass Flow Rate and Energy Efficiency

Based on the production fluid saturation (Figure 2) and the production mass flow rate (Figure 3), the mass flow rate of the produced VOC can be calculated through Equation (5):
M O = ρ O S O ρ O S O + ρ G S G + ρ W S W M pro
where Mpro is the total mass flow rate of the production fluid. The total energy Wt input by the system is the sum of pump power consumption Wp and the heat energy Hinj input by the injected steam, as shown in Equation (6), where hinj is the specific enthalpy of injected steam.
W t = W p + H inj = W p + q inj h inj
The energy efficiency of the system is defined as the ratio of the mass flow rate of production VOC pollutants to the total energy consumed by the system, as shown in Equation (7).
η = M O W t
Figure 6 shows the evolution of the production VOC mass flow rate and energy efficiency over the 5-year period. During the first 1.5 years of remediation, the mass flow rate of VOCs decreased from 0.179 kg/s to 2.799 × 10⁻⁴ kg/s, and the corresponding energy efficiency decreased from 7.73 × 10⁻⁴ kg/kJ to 1.16 × 10⁻⁶ kg/kJ. After the maintenance stage, the mass flow rate of VOCs decreased from 2.799 × 10⁻⁴ kg/s to 2.448 × 10⁻⁴ kg/s, and the corresponding energy efficiency decreased from 1.16 × 10⁻⁶ kg/kJ to 1.00 × 10⁻⁶ kg/kJ. It can be seen that in the initial stage of steam injection, the mass flow rate of VOCs is at its highest because xylene content in the formation is at its highest at the initial moment, which leaves the formation quickly under steam drive. After that, the mass flow rate of VOCs decreases gradually. According to Equation (6), the total input energy of the system increases, while the mass flow rate of VOCs decreases; therefore, the energy efficiency of the system decreases.

4.6. Spatial Distribution of Xylene Saturation

Figure 7 shows the evolution of the spatial distribution of xylene saturation over the 5-year period. Before steam injection, xylene is only distributed in the NAPL layer with a saturation of 0.3. After steam injection, a zero-xylene saturation zone is formed around the injection well, which gradually expands toward the production well with steam injecting. Between the zero saturation zone and the 0.3 saturation zone, a high saturation column is formed with a maximum saturation of 0.45. This is the result of steam driving xylene toward the production well. The area containing xylene in the formation is driven by steam and moves toward the underburden layer, gradually approaching the bottom boundary, while no xylene enters the overburden layer. With the continuous injection of steam, the 0 saturation area around the injection well gradually expands, and xylene saturation in the formation gradually decreases, which means that xylene is gradually driven away from the soil.

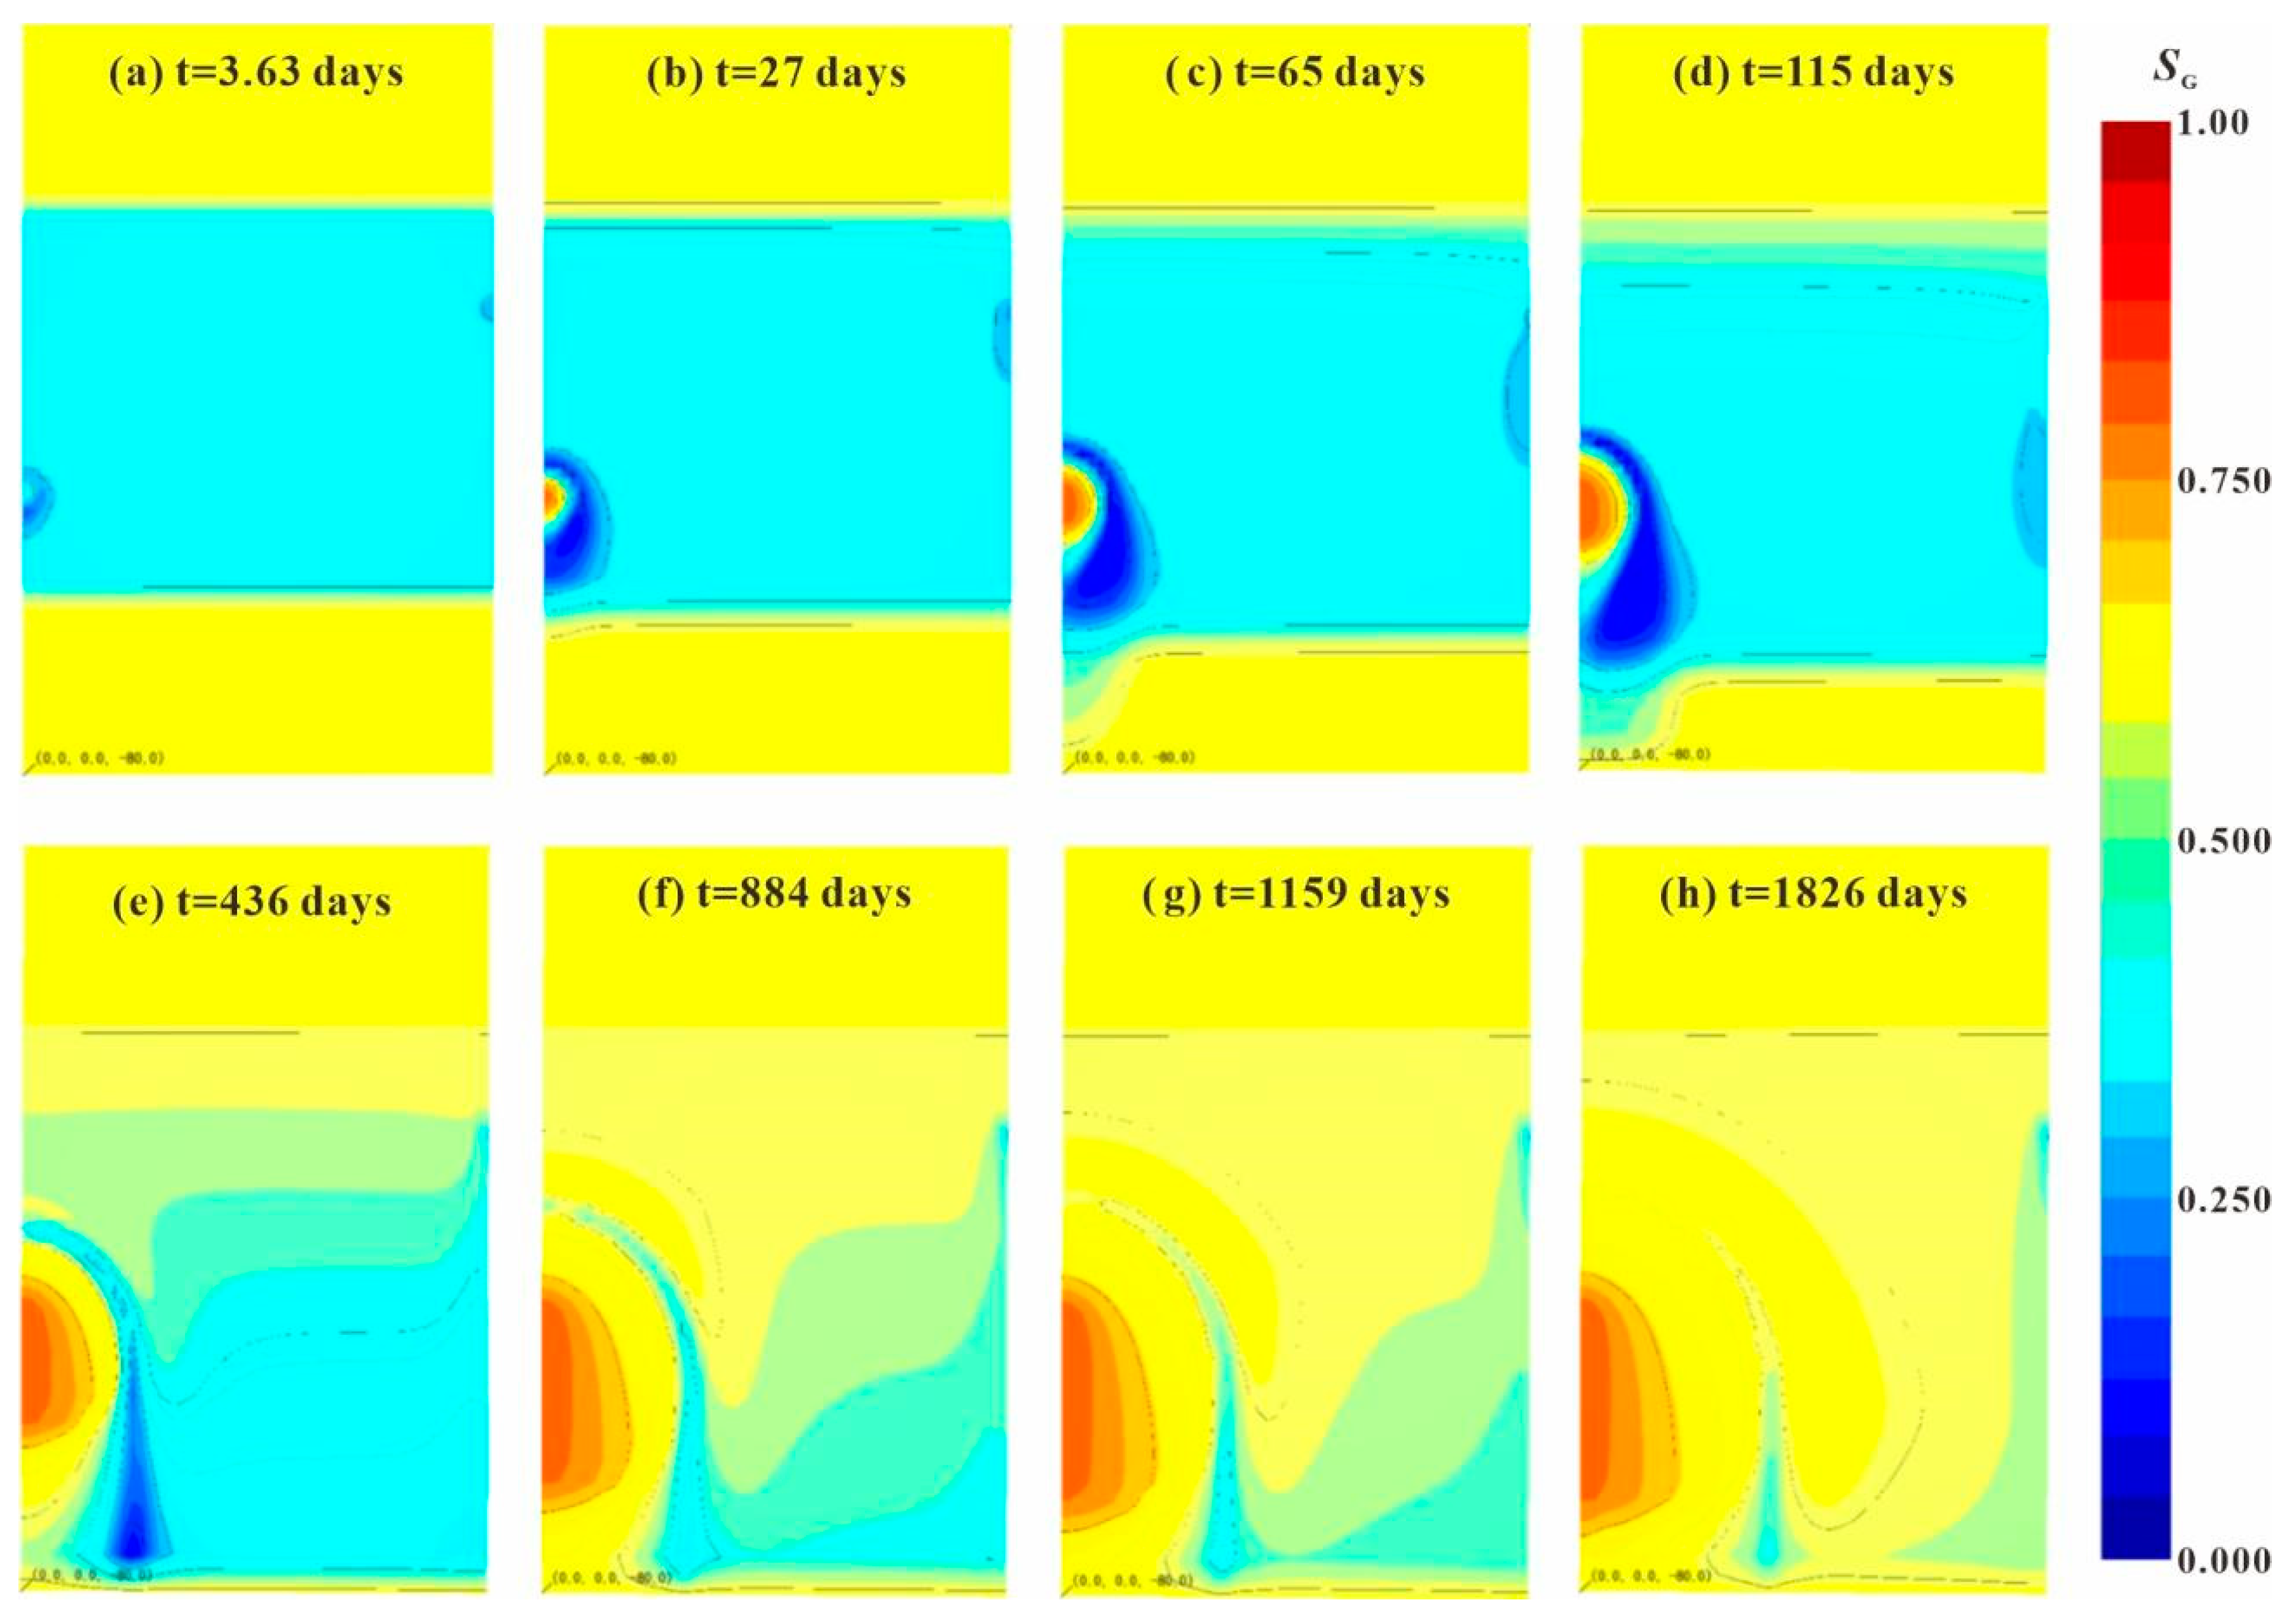
4.7. Spatial Distribution of Gas Saturation

Figure 8 shows the evolution of the spatial distribution of gas saturation over the 5-year period. The initial gas saturation of the NAPL layer is 0.3, and the initial gas saturation in the overburden and underburden layers is 0.6. The gas in the formation contains three components, water vapor, air and VOC vapor, of which water vapor and air are the main components. After steam injection begins, a highly saturated vapor zone is formed around the injection well. With steam injection, this zone expands, driving xylene and gas to the production well. Outside the highly saturated steam zone, the steam encounters low-temperature soil and rapidly liquefies to form a low-gas saturation region. With the steam injection, the high-gas saturation area around the injection well and the low-gas saturation area around the injection well expand over time, and the gas saturation in the NAPL layer gradually increases, which means that xylene in the NAPL layer is gradually expelled. With the increase in injected steam, the gas content in the NAPL layer gradually increases and finally approaches the gas saturation in the overburden and underburden layers. Because the gas viscosity increases with the increase in temperature, the flow impedance in the system gradually increases, and the injection pressure gradually increases. This is consistent with the rule revealed by Equations (1)–(4).

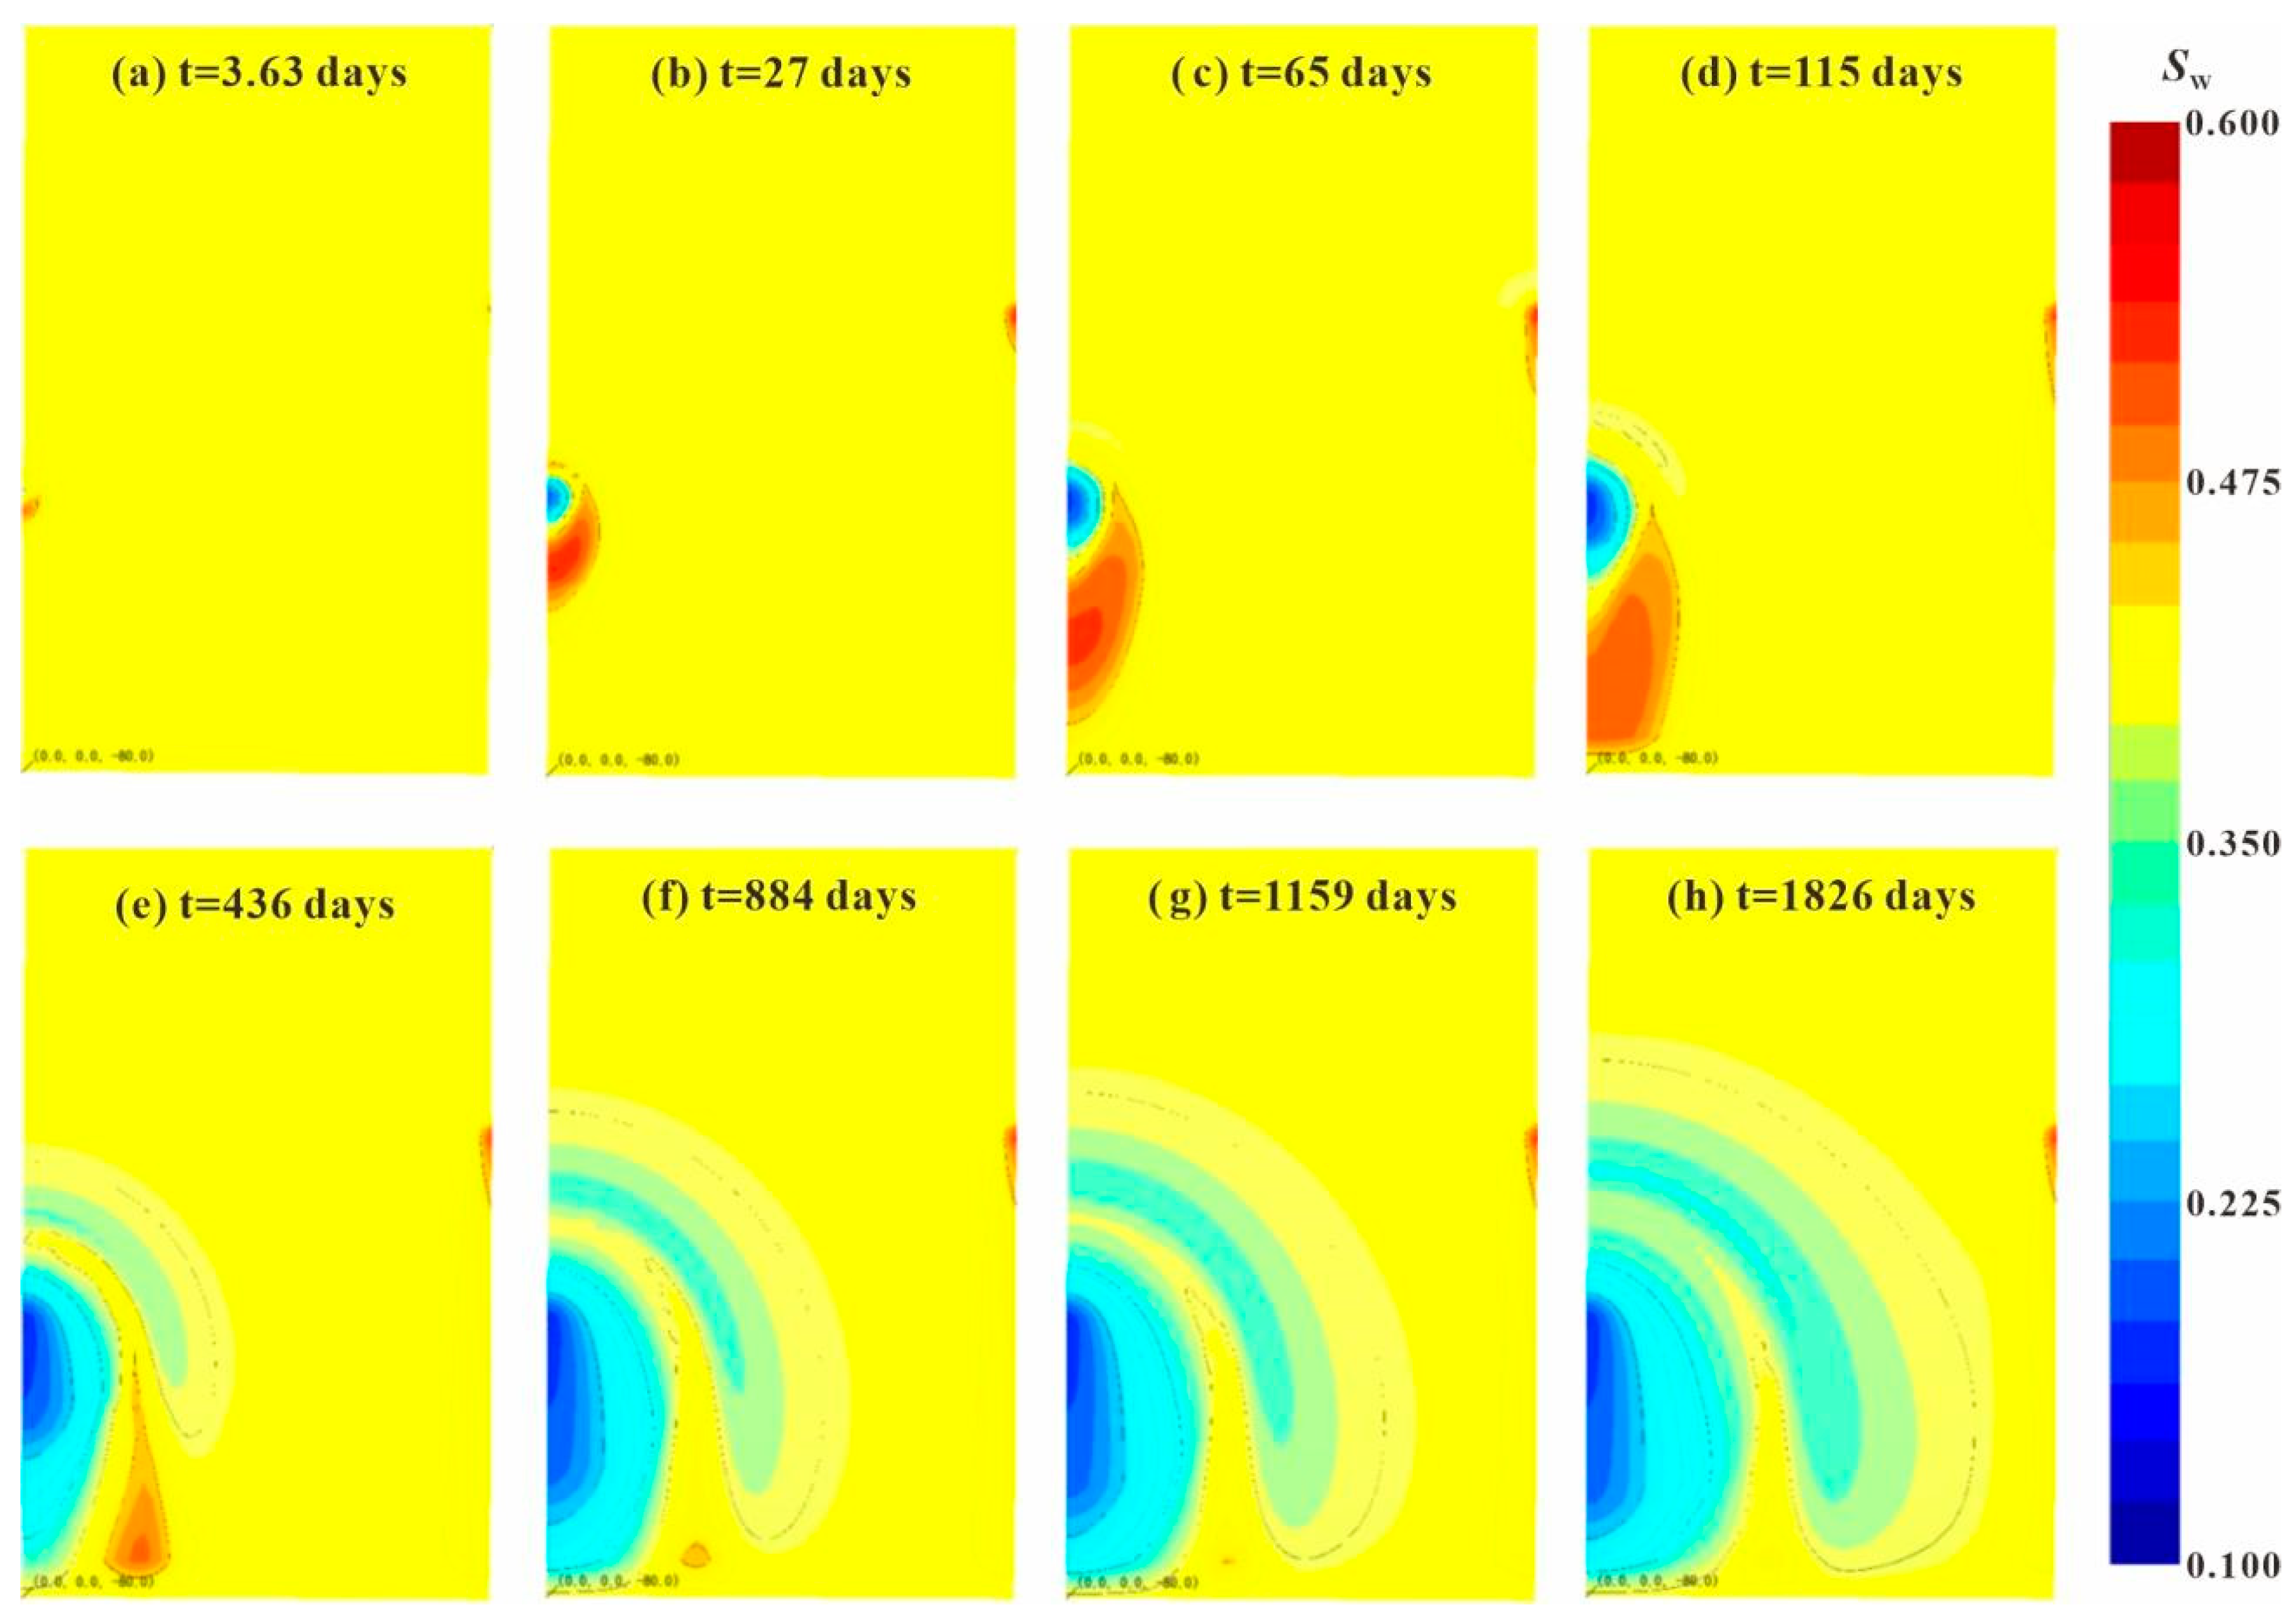
4.8. Spatial Distribution of Water Saturation

Figure 9 shows the evolution of the spatial distribution of water saturation over the 5-year period. The initial water saturation of the NAPL layer, overburden layer and underburden layer is 0.4. After steam injection begins, as most of the steam remains gaseous and is expelled by the gas, a low-water saturation zone forms around the production well, which is below the initial formation water saturation of 0.4. A high-water saturation zone is formed around this low-water saturation zone because the injected steam encounters cold soil and rapidly liquefies, and its water saturation is highest in the formation. With steam injection, the region of high water saturation increases gradually, which means that the injected steam is continuously liquefied in cold soil. After t = 115 days, the liquid water is heated up by steam and gradually vaporized, and the high-water saturation area gradually decreases until it disappears, while the low-water saturation area around the injection well gradually expands, and the water saturation in the formation gradually decreases, indicating that xylene in the NAPL formation is gradually expelled.

4.9. Spatial Distribution of Temperature

Figure 10 shows the evolution of the spatial distribution of temperature over the 5-year period. Three temperature zones are formed after the injection of steam [18,30]. (1) The “steam zone” is an approximate isothermal zone near the injection well, in which the steam drives the distillation of contaminants. (2) The “variable temperature zone” is formed by the concentration of steam and pollutants after the downstream temperature is reduced. (3) The “normal temperature zone” is the formation temperature zone, including flowing water and free-phase pollutants. When the injected steam meets the cold soil layer, part of the steam liquefies rapidly and releases latent heat. Considering that the specific heat capacity of soil is smaller than that of water, the local temperature gets higher than the steam temperature. With the continuous injection of steam, the high-temperature area gradually expands, the temperature of the formation heated by steam gradually increases, and the viscosity of xylene gradually decreases and it is gradually separated from the polluted soil under the expulsion of the injected steam.

4.10. Spatial Distribution of Pressure

Figure 11 shows the evolution of the spatial distribution of pressure over the 5-year period. Since the production pressure is maintained at 8.0 × 10⁴ Pa, the pressure around the production well remains essentially the same. The continuous steam injection increases the pressure around the injection well, creating a high-pressure zone. As steam is injected, this high-pressure zone gradually expands, representing the gradual diffusion of steam through the formation. As the injection pressure gradually increases while the production pressure remains unchanged, the pressure gradient in the formation gradually increases due to the gradual increase in gas saturation and viscosity in the formation. The increasing high-pressure area around the injection well indicates that xylene is gradually expelled from the soil, and the steam injection method is an effective method to remove xylene pollution.

5. Discussion

To achieve better remediation performance and higher energy efficiency, it is necessary to evaluate the effects of key parameters of the horizontal well steam-driving system. In this work, the influence of the following five parameters on the remediation performance of xylene pollution are studied: injection steam temperature Tinj, injection flow rate q, formation permeability k, production pressure P0 and xylene initial saturation SO0. Based on the reference case, only one parameter is changed at a time, while the other parameters remain unchanged, so there are five cases: (a) increase injection temperature Tinj from 100 °C to 125 °C (injection specific enthalpy hinj from 2.676 × 10⁶ J/kg to 2.727 × 10⁶ J/kg); (b) increase injection flow rate q from 8.0 × 10⁻² kg/s to 1.2 × 10⁻¹ kg/s; (c) increase formation permeability k from 2.5 × 10⁻¹³ m2 to 5.0 × 10⁻¹³ m2; (d) reduce bottom-hole production pressure P0 from 8.0 × 10⁴ Pa to 4.0 × 10⁴ Pa; and (e) increase the initial saturation SO0 of xylene from 0.3 to 0.5. Figure 12, Figure 13, Figure 14 and Figure 15 show the influence of the above five parameters on production VOC saturation SO, production VOC mass flow rate MO, pump power consumption Wp and energy efficiency η.

5.1. Sensitivity of Production VOC Saturation to Various Parameters

Figure 12 shows the sensitivity of production VOC saturation to various parameters. Line a in Figure 12 shows that increasing steam injection temperature Tinj has a weak effect on the production VOC saturation. Although increasing the injection temperature essentially increases the heat injection rate, the calculation results show that this has little effect on the production VOC saturation. Line b in Figure 12 shows that increasing steam injection flow rate q increases xylene saturation from 0.3–0.04 to 0.3–0.05 in the remediation stage, but it has little effect on xylene saturation in the maintenance stage. This is because a higher steam injection flow rate increases the speed at which steam drives xylene away from the soil, and therefore, the remediation stage is shortened under the same conditions. Line c in Figure 12 shows that increasing formation permeability k increases VOC saturation in the initial remediation stage, greatly shortens the remediation time, and significantly reduces xylene saturation in the maintenance stage. Higher permeability increases the speed of steam passing through the formation and achieves a better driving effect. Line d in Figure 12 shows that lowering bottom-hole production pressure P0 has little effect on xylene saturation in the remediation stage but reduces xylene saturation in the maintenance stage to 0. Among the six cases studied, only Case d can completely reduce production VOC saturation to 0. This is because a lower production pressure increases the pumping effect of the production well and expands the control range of the production well; therefore, it is beneficial to expel xylene from the soil. Line e in Figure 12 shows that increasing initial saturation SO0 increases production VOC saturation in the remediation stage, but it has little effect on production VOC saturation in the maintenance stage. Higher xylene content increases the efficiency of steam expulsion, and production VOC saturation can be improved naturally under the same conditions. In summary, the steam injection flow rate, formation permeability, production pressure and initial xylene saturation have significant effects on production VOC saturation, while steam injection temperature has limited effects. Within a certain range, increasing the steam injection flow rate increases production VOC saturation during the remediation stage, increasing the formation permeability shortens the remediation time, reducing the production pressure decreases production VOC saturation during the maintenance stage, and increasing the initial xylene saturation significantly increases production VOC saturation during the remediation stage.

5.2. Sensitivity of Production VOC Mass Flow Rate to Various Parameters

Figure 13 shows the sensitivity of the production VOC mass flow rate to various parameters. Line a in Figure 13 shows that increasing the steam injection temperature Tinj has a slight impact on the production VOC mass flow rate. Although the higher injection temperature increases the injection heat in the formation, the results show that this effect only has a very limited effect on the xylene mass flow rate. Line b in Figure 13 shows that increasing steam injection flow rate q has a weak effect on the production VOC mass flow rate. Although a larger injection flow rate can increase the driving force of xylene, the three-phase saturation in the produced fluid is relatively variable, and the results show a slight effect on the production VOC mass flow rate. Line c in Figure 13 shows that increasing formation permeability k increases the xylene production mass flow rate, which is in accordance with a previous study [16,18]. Line c in Figure 12 shows that increasing permeability can increase xylene saturation in the initial stage and shorten the remediation time, which is consistent with the increase in the VOC mass flow rate in Line c in Figure 13. Xylene saturation is low in the maintenance stage, but the mass flow rate is high. This effect is caused by the inconsistency between the saturation distribution and the mass flow distribution due to changes in the saturation and density of the production fluid. Line d in Figure 13 shows that reducing bottom-hole production pressure P0 significantly increases the production VOC mass flow rate in the remediation stage and can effectively remove most of the xylene in the soil, so that the production mass flow rate is reduced to 0. This is because a lower production pressure significantly enhances the well’s suction ability, allowing xylene to be extracted quickly. Line e in Figure 13 shows that increasing the initial saturation of xylene SO0 increases the mass flow rate of xylene in the remediation stage, but it has little impact on the maintenance stage. This is because higher xylene content enhances the steam driven effect, which can expel more xylene from the soil. Overall, formation permeability, production pressure and the initial saturation of xylene have significant effects on the production VOC mass flow rate. Increasing the formation permeability, lowering the production pressure or increasing the initial xylene saturation can improve the xylene mass flow rate, but increasing the injection temperature or increasing the injection steam flow rate has little effect.

5.3. Sensitivity of Pump Power Consumption to Various Parameters

Figure 14 shows the sensitivity of pump power consumption to various parameters. Line a in Figure 14 shows that increasing steam injection temperature Tinj has a slight effect on the pump power. Although the higher injection temperature increases the viscosity of the gas in the formation, the simulation results show little effect on the pump power. Line b in Figure 14 shows that increasing steam injection flow rate q significantly increases the pump power consumption from 17.23–30.67 kW to 25.80–55.02 kW. According to Equation (1), the power consumed by the injection pump increases significantly with the increase in the injection flow rate, which makes the pump power consumption increase significantly. Line c in Figure 14 shows that increasing formation permeability k significantly reduces the pump power from 17.23–30.67 kW to 17.23–24.47 kW. Higher formation permeability significantly improves steam flow conditions, reduces flow impedance, and thus significantly reduces pump power consumption. Line d in Figure 14 shows that reducing production pressure P0 has little effect on pump power. Although the lower production pressure improves the suction capacity of the fluid and increases the mass flow rate of the production fluid, it shows little effect on pump power consumption. Line e in Figure 14 shows that increasing the initial saturation of xylene SO0 has a slight effect on pump power consumption. Although higher initial xylene saturation increased pump power consumption at the initial stage, the pump power soon decreased to the initial saturation level of 0.3. Overall, the pump power consumption of the system within the study’s scope is mainly affected by the injection flow rate and formation permeability. Increasing the injection flow rate significantly increases pump power consumption, while increasing formation permeability significantly reduces pump power consumption. Moreover, the injection temperature, production pressure and initial xylene saturation have slight effects on pump power consumption.

5.4. Sensitivity of Energy Efficiency to Various Parameters

Figure 15 shows the sensitivity of energy efficiency to various parameters. Line a in Figure 15 shows that increasing steam injection temperature Tinj has a slight effect on energy efficiency. As mentioned above, increasing the steam temperature only has a limited effect on both the xylene mass flow rate and pump power consumption, which results in a slight effect on the energy efficiency of the system. Line b in Figure 15 shows that increasing steam injection flow rate q reduces the energy efficiency of the system from 7.73 × 10⁻⁴–1.00 × 10⁻⁶ kg/kJ to 5.15 × 10⁻⁴–6.59 × 10⁻⁷ kg/kJ. This is because a higher injection flow rate has little effect on the xylene mass flow rate but significantly increases pump power consumption, which significantly reduces energy efficiency, according to Equation (7). Line c in Figure 15 shows that increasing formation permeability k increases energy efficiency from 7.73 × 10⁻⁴–1.00 × 10⁻⁶ kg/kJ to 7.85 × 10⁻⁴–2.08 × 10⁻⁶ kg/kJ. This is because higher formation permeability increases the mass flow rate of xylene while significantly reducing pump power consumption, which, according to Equation (7), significantly improves energy efficiency. Line d in Figure 15 shows that reducing bottom-hole production pressure P0 increases the energy efficiency of the system from 7.73 × 10⁻⁴–1.00 × 10⁻⁶ kg/kJ to 2.50 × 10⁻³–0 kg/kJ. This is because lower production well pressure significantly increases the xylene mass flow rate and has little effect on pump power consumption, thus significantly improving energy efficiency. Line e in Figure 15 shows that increasing the initial saturation of xylene SO0 increases the energy efficiency of the system from 7.73 × 10⁻⁴–1.00 × 10⁻⁶ kg/kJ to 2.74 × 10⁻³–1.00 × 10⁻⁶ kg/kJ. This is because higher xylene initial saturation increases the xylene mass flow rate with only a slight effect on pump power consumption and therefore significantly increases energy efficiency. Overall, energy efficiency is significantly affected by the steam injection flow rate, formation permeability, production pressure and initial xylene saturation. Increasing formation permeability, reducing production pressure and increasing the initial xylene saturation significantly improves energy efficiency, while increasing injection flow rate significantly reduces energy efficiency. The injection steam temperature has a slight effect on energy efficiency.

6. Conclusions

In this study, a conceptual model for the remediation of xylene pollution by steam injection in soil through three horizontal wells is proposed, and a numerical model of the system is established. The energy efficiency characteristics of the remediation of xylene pollution by steam injection are investigated. In addition, the main factors affecting remediation performance are analyzed. Based on the modeling results and analyses, the main conclusions are as follows:
(1)
In the reference case, the 5-year operation period can be divided into two stages: the remediation stage and maintenance stage. The production VOC saturation decreases gradually during the remediation stage and remains at a low value during the maintenance stage. During the first 1.5 years of remediation, the production mass flow rate gradually decreases from 0.45 kg/s to 3.7 × 10⁻³ kg/s and then remains unchanged. The production temperature is maintained at the initial soil temperature for 3 years and slightly increases afterwards.
(2)
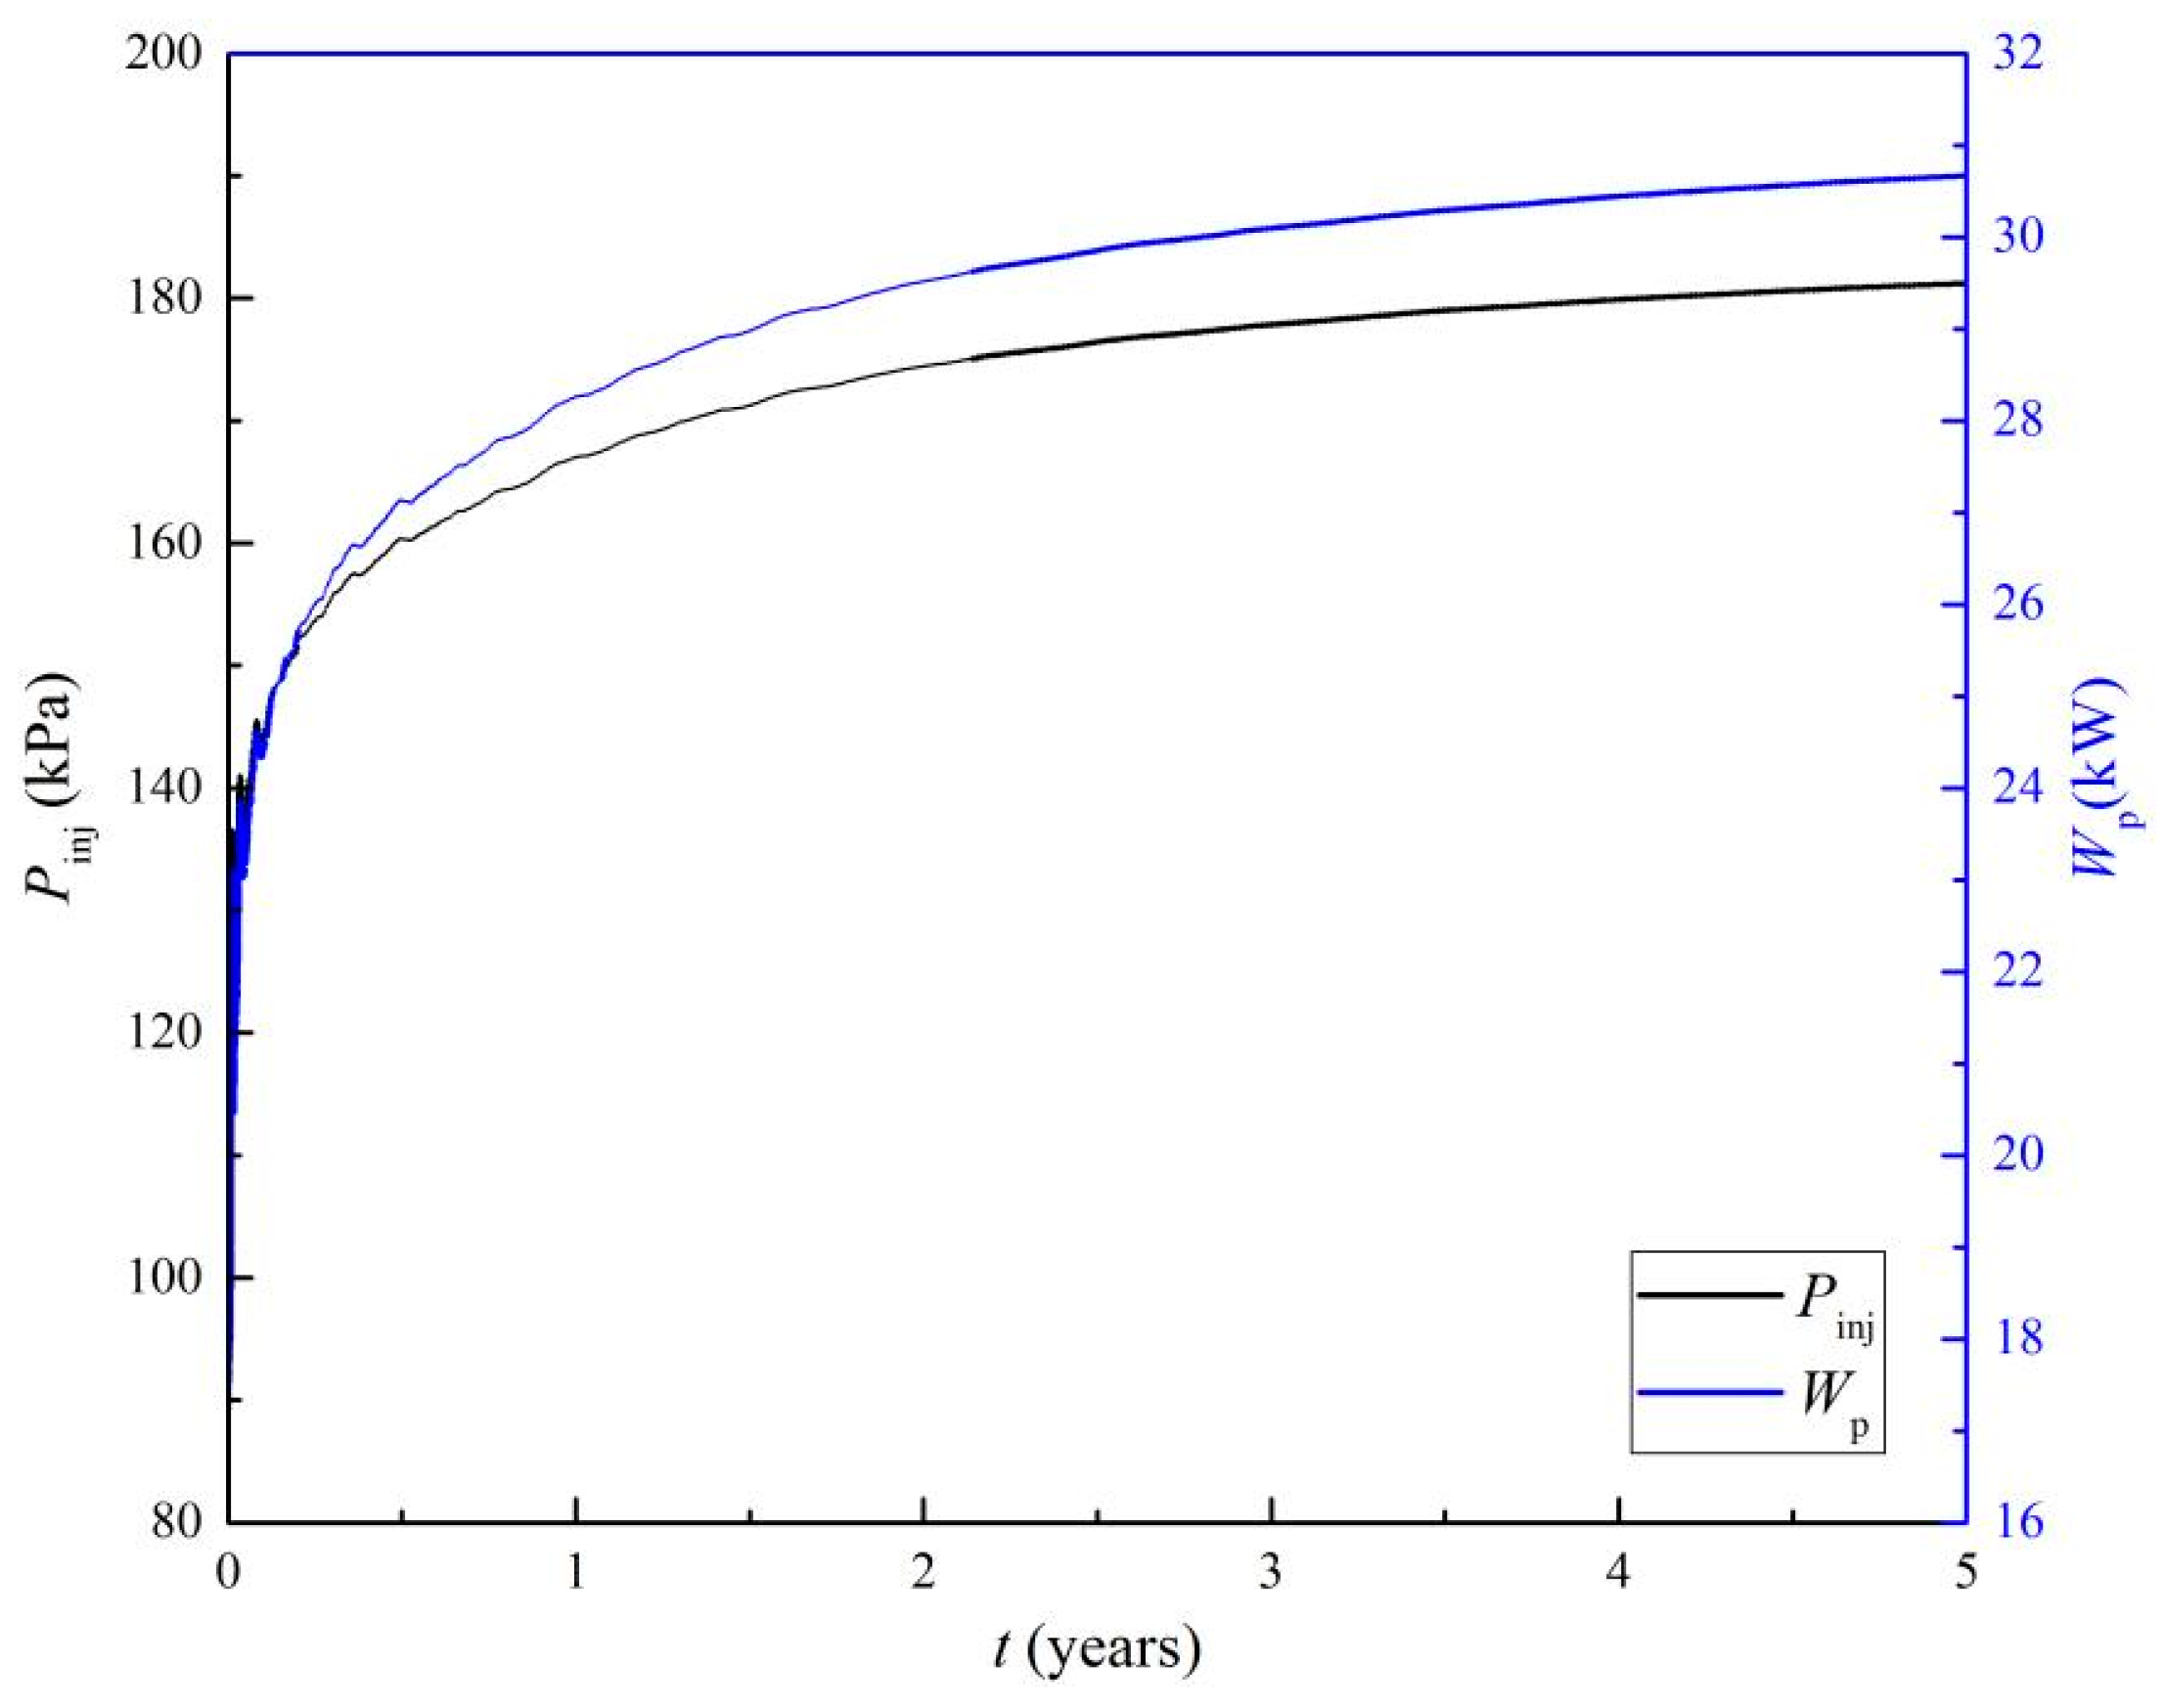
Injection pressure and pump power increase gradually. With the continuous injection of steam into the formation, the formation temperature increases, and the gas content and viscosity increases, which increases the injection pressure and pump power.
(3)
The production VOC mass flow rate and energy efficiency decreases gradually. In the initial stage of steam injection, the VOC production rate is at its highest because the initial xylene content is at its highest and can be driven out of the formation quickly. After that, the xylene production rate decreases with steam injection. The total input energy of the system gradually increases, while the VOC mass flow rate decreases, so the energy efficiency of the system decreases.
(4)
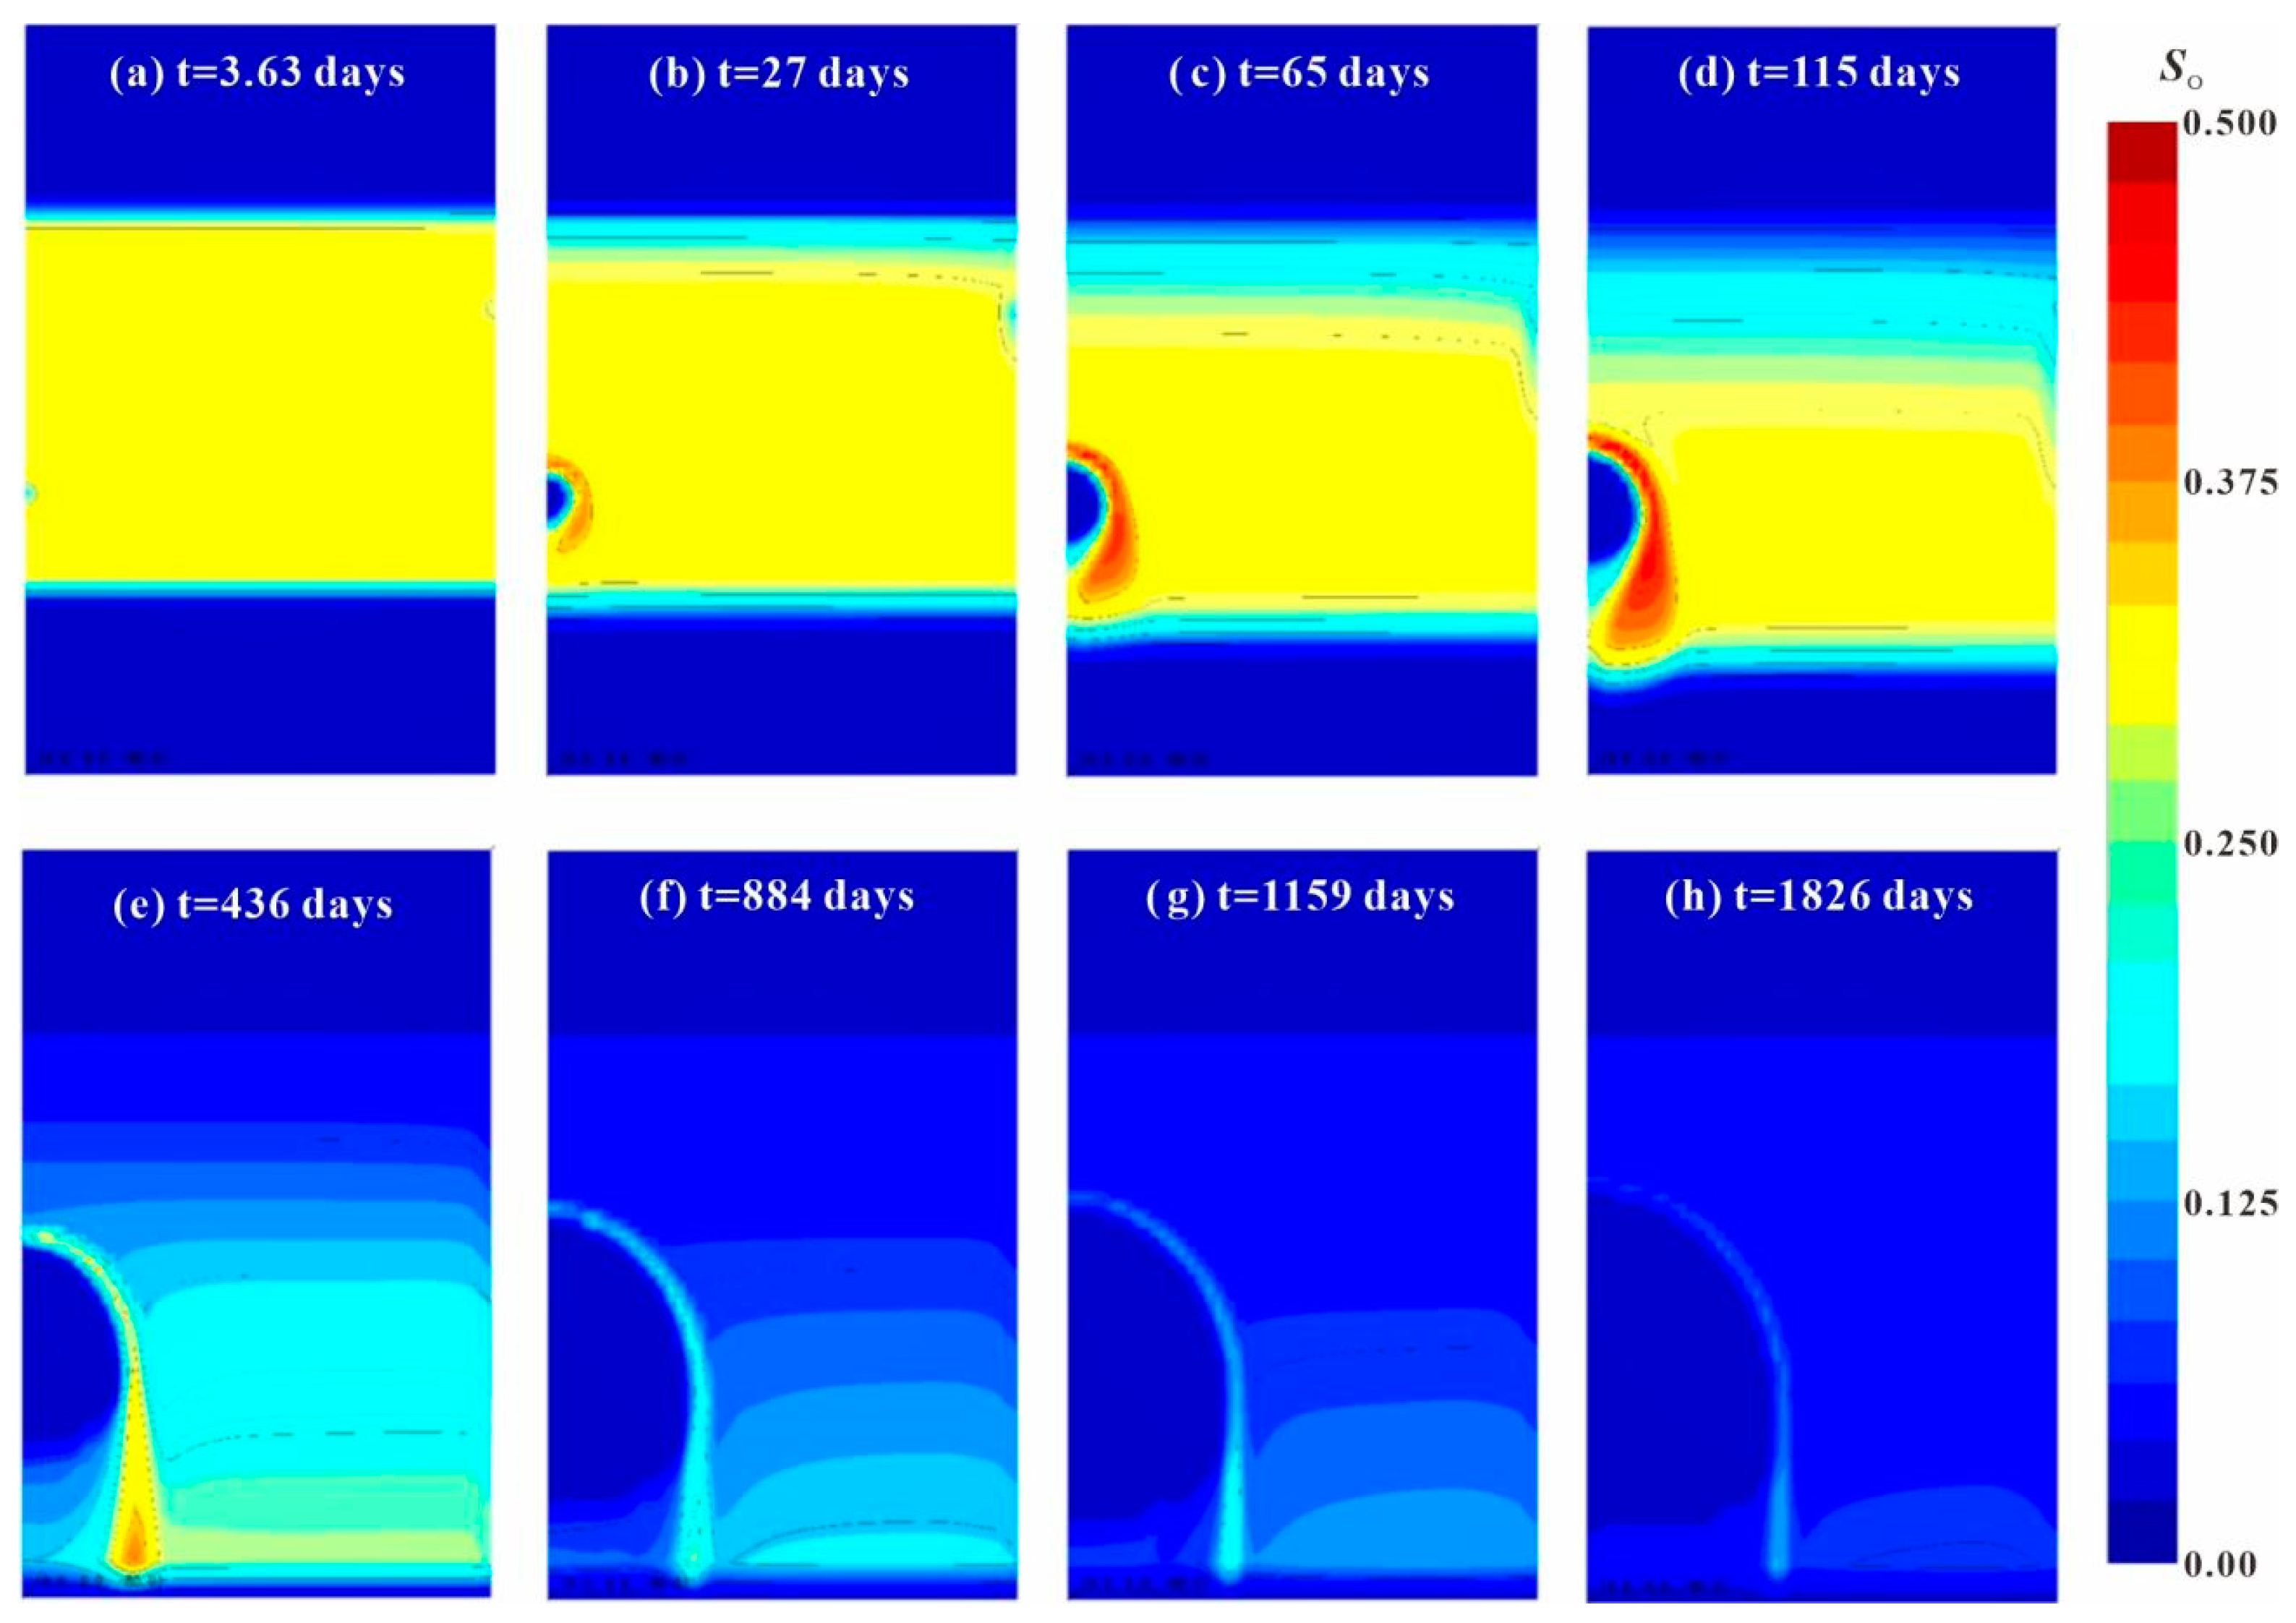
After steam injection, a zero-xylene saturation zone is formed around the injection well, which expands toward the production well as steam is injected. Between the zero saturation zone and the original saturation zone, a high saturation column is formed with a maximum saturation value of 0.45. With the injection of steam, the zero saturation area expands, and xylene saturation decreases, indicating that xylene is driven out gradually. This shows that steam injection is an effective method to remediate xylene pollution.
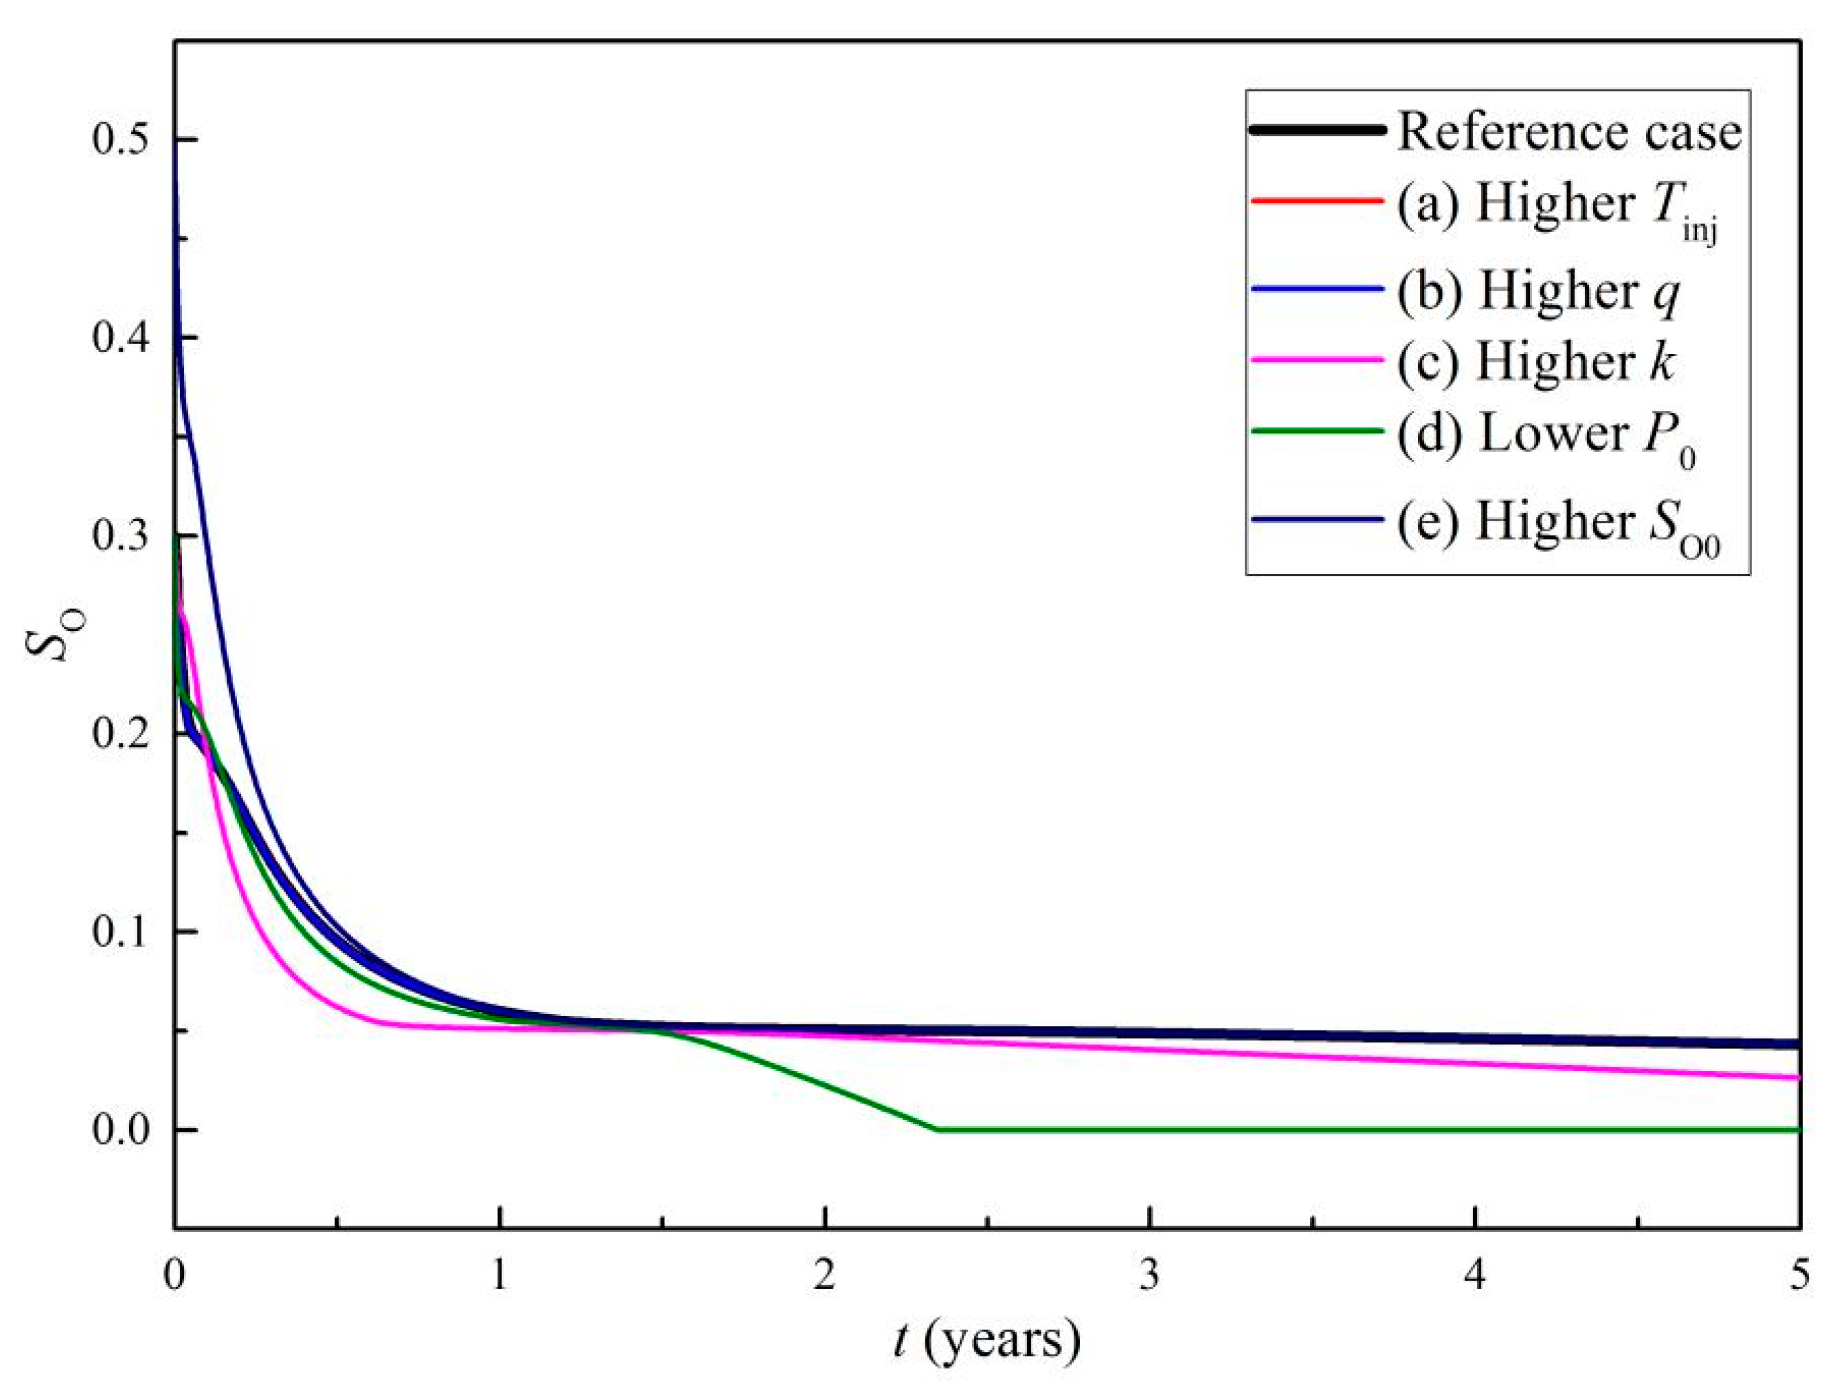
(5)
The steam injection flow rate, formation permeability, production pressure and initial xylene saturation have significant effects on production VOC saturation. Within certain ranges, increasing the steam injection flow rate and formation permeability increases xylene saturation during the remediation stage, decreasing the production pressure decreases xylene saturation during the maintenance stage, and increasing the initial xylene saturation significantly increases xylene saturation during the remediation stage.
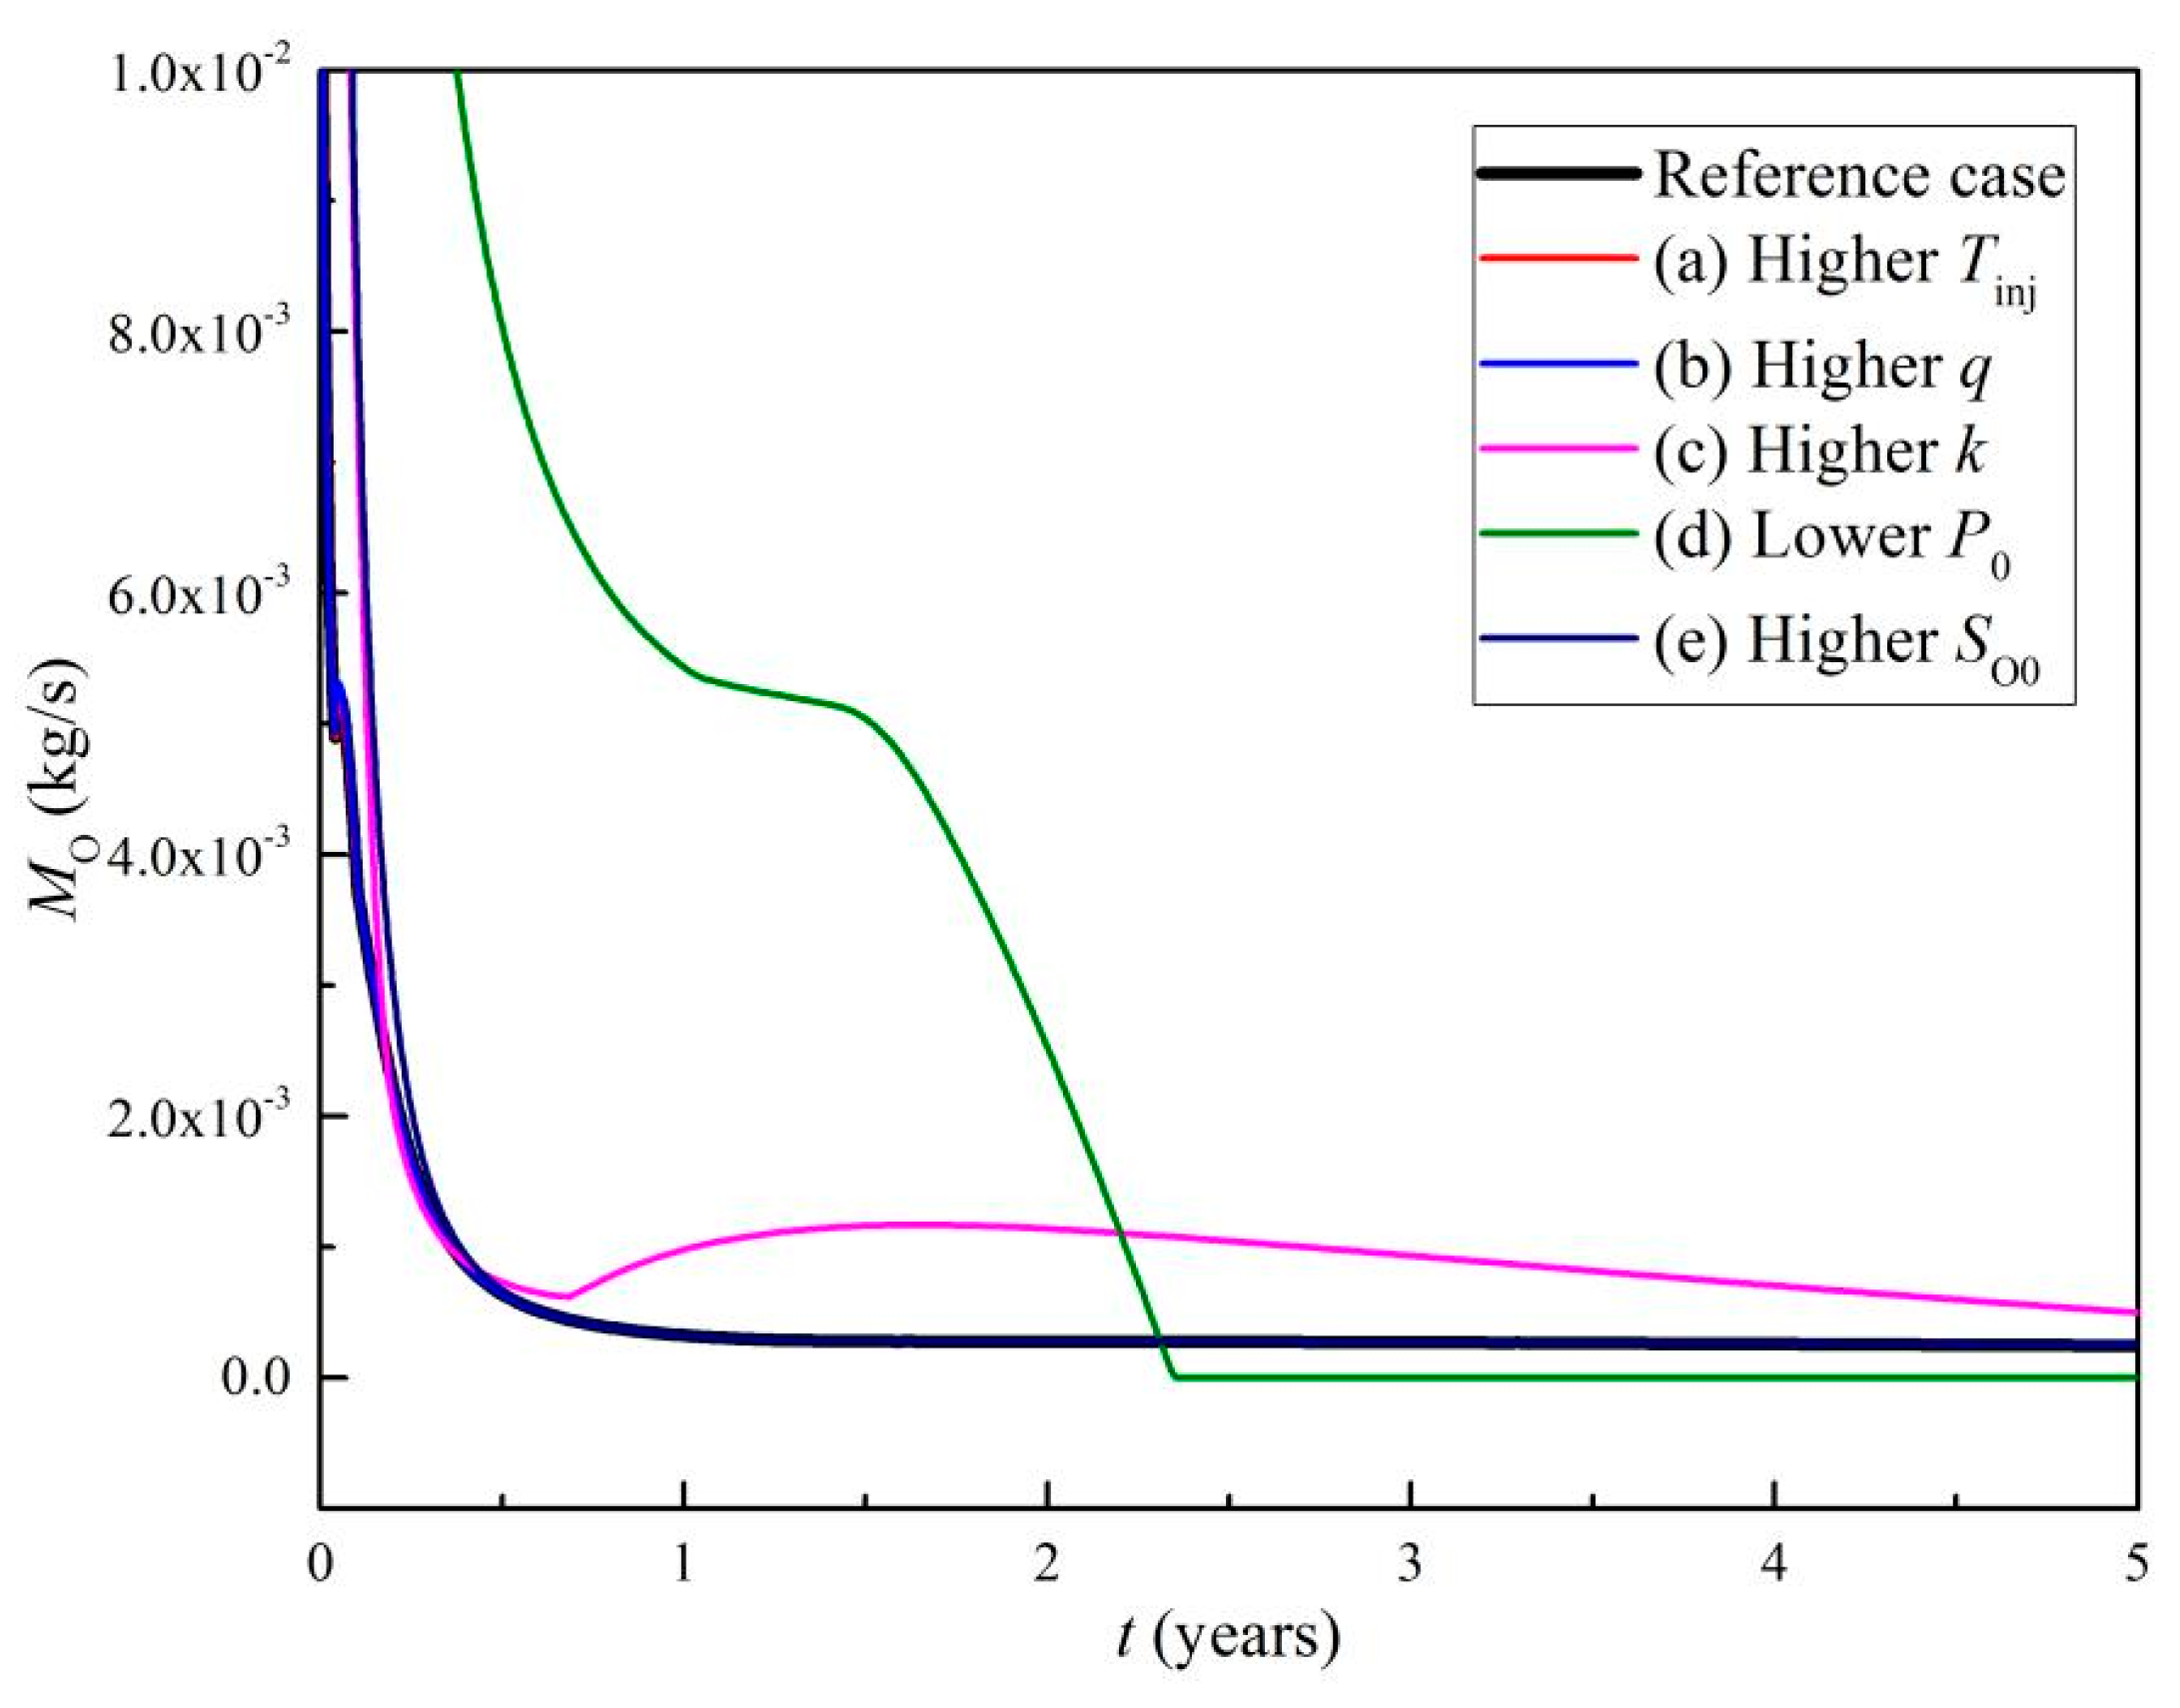
(6)
Formation permeability, production pressure and the initial xylene saturation have significant effects on the production VOC mass flow rate. Increasing formation permeability, reducing production pressure and increasing the initial xylene saturation can improve the production VOC mass flow rate.
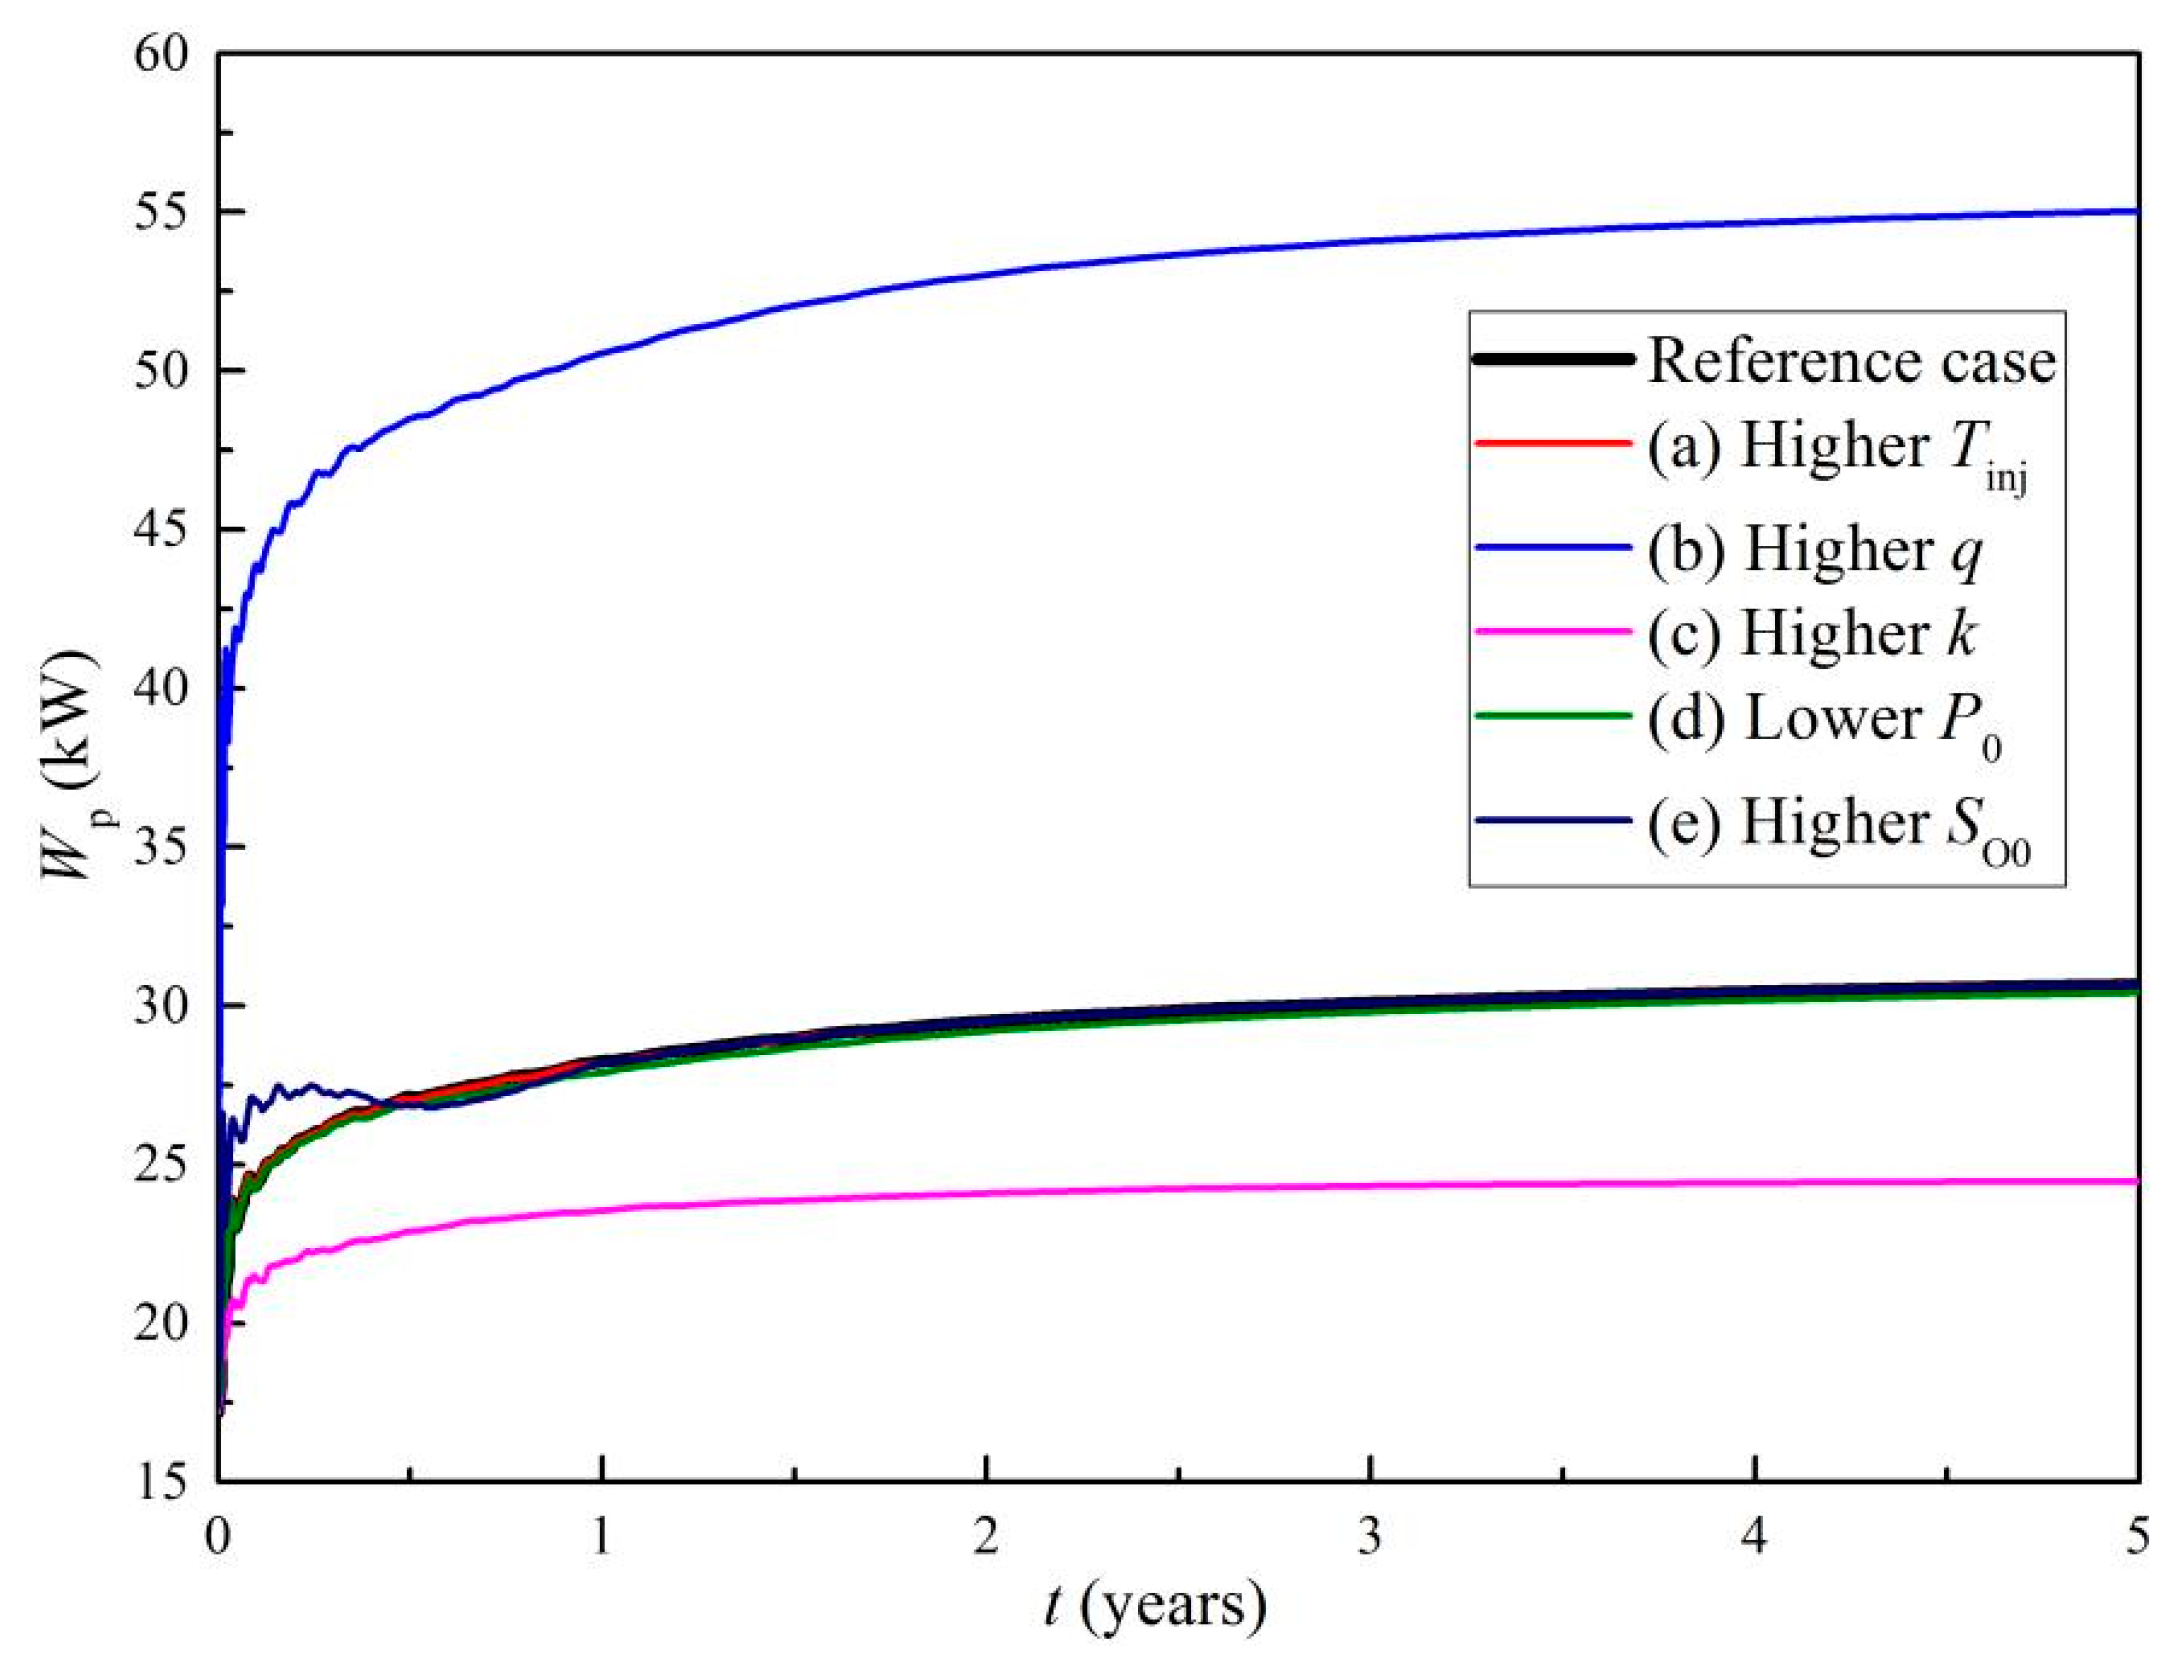
(7)
The pump power of the system is mainly affected by the steam injection flow rate and formation permeability. Increasing the steam injection flow rate significantly increases the pump power, while increasing formation permeability significantly reduces the pump power.
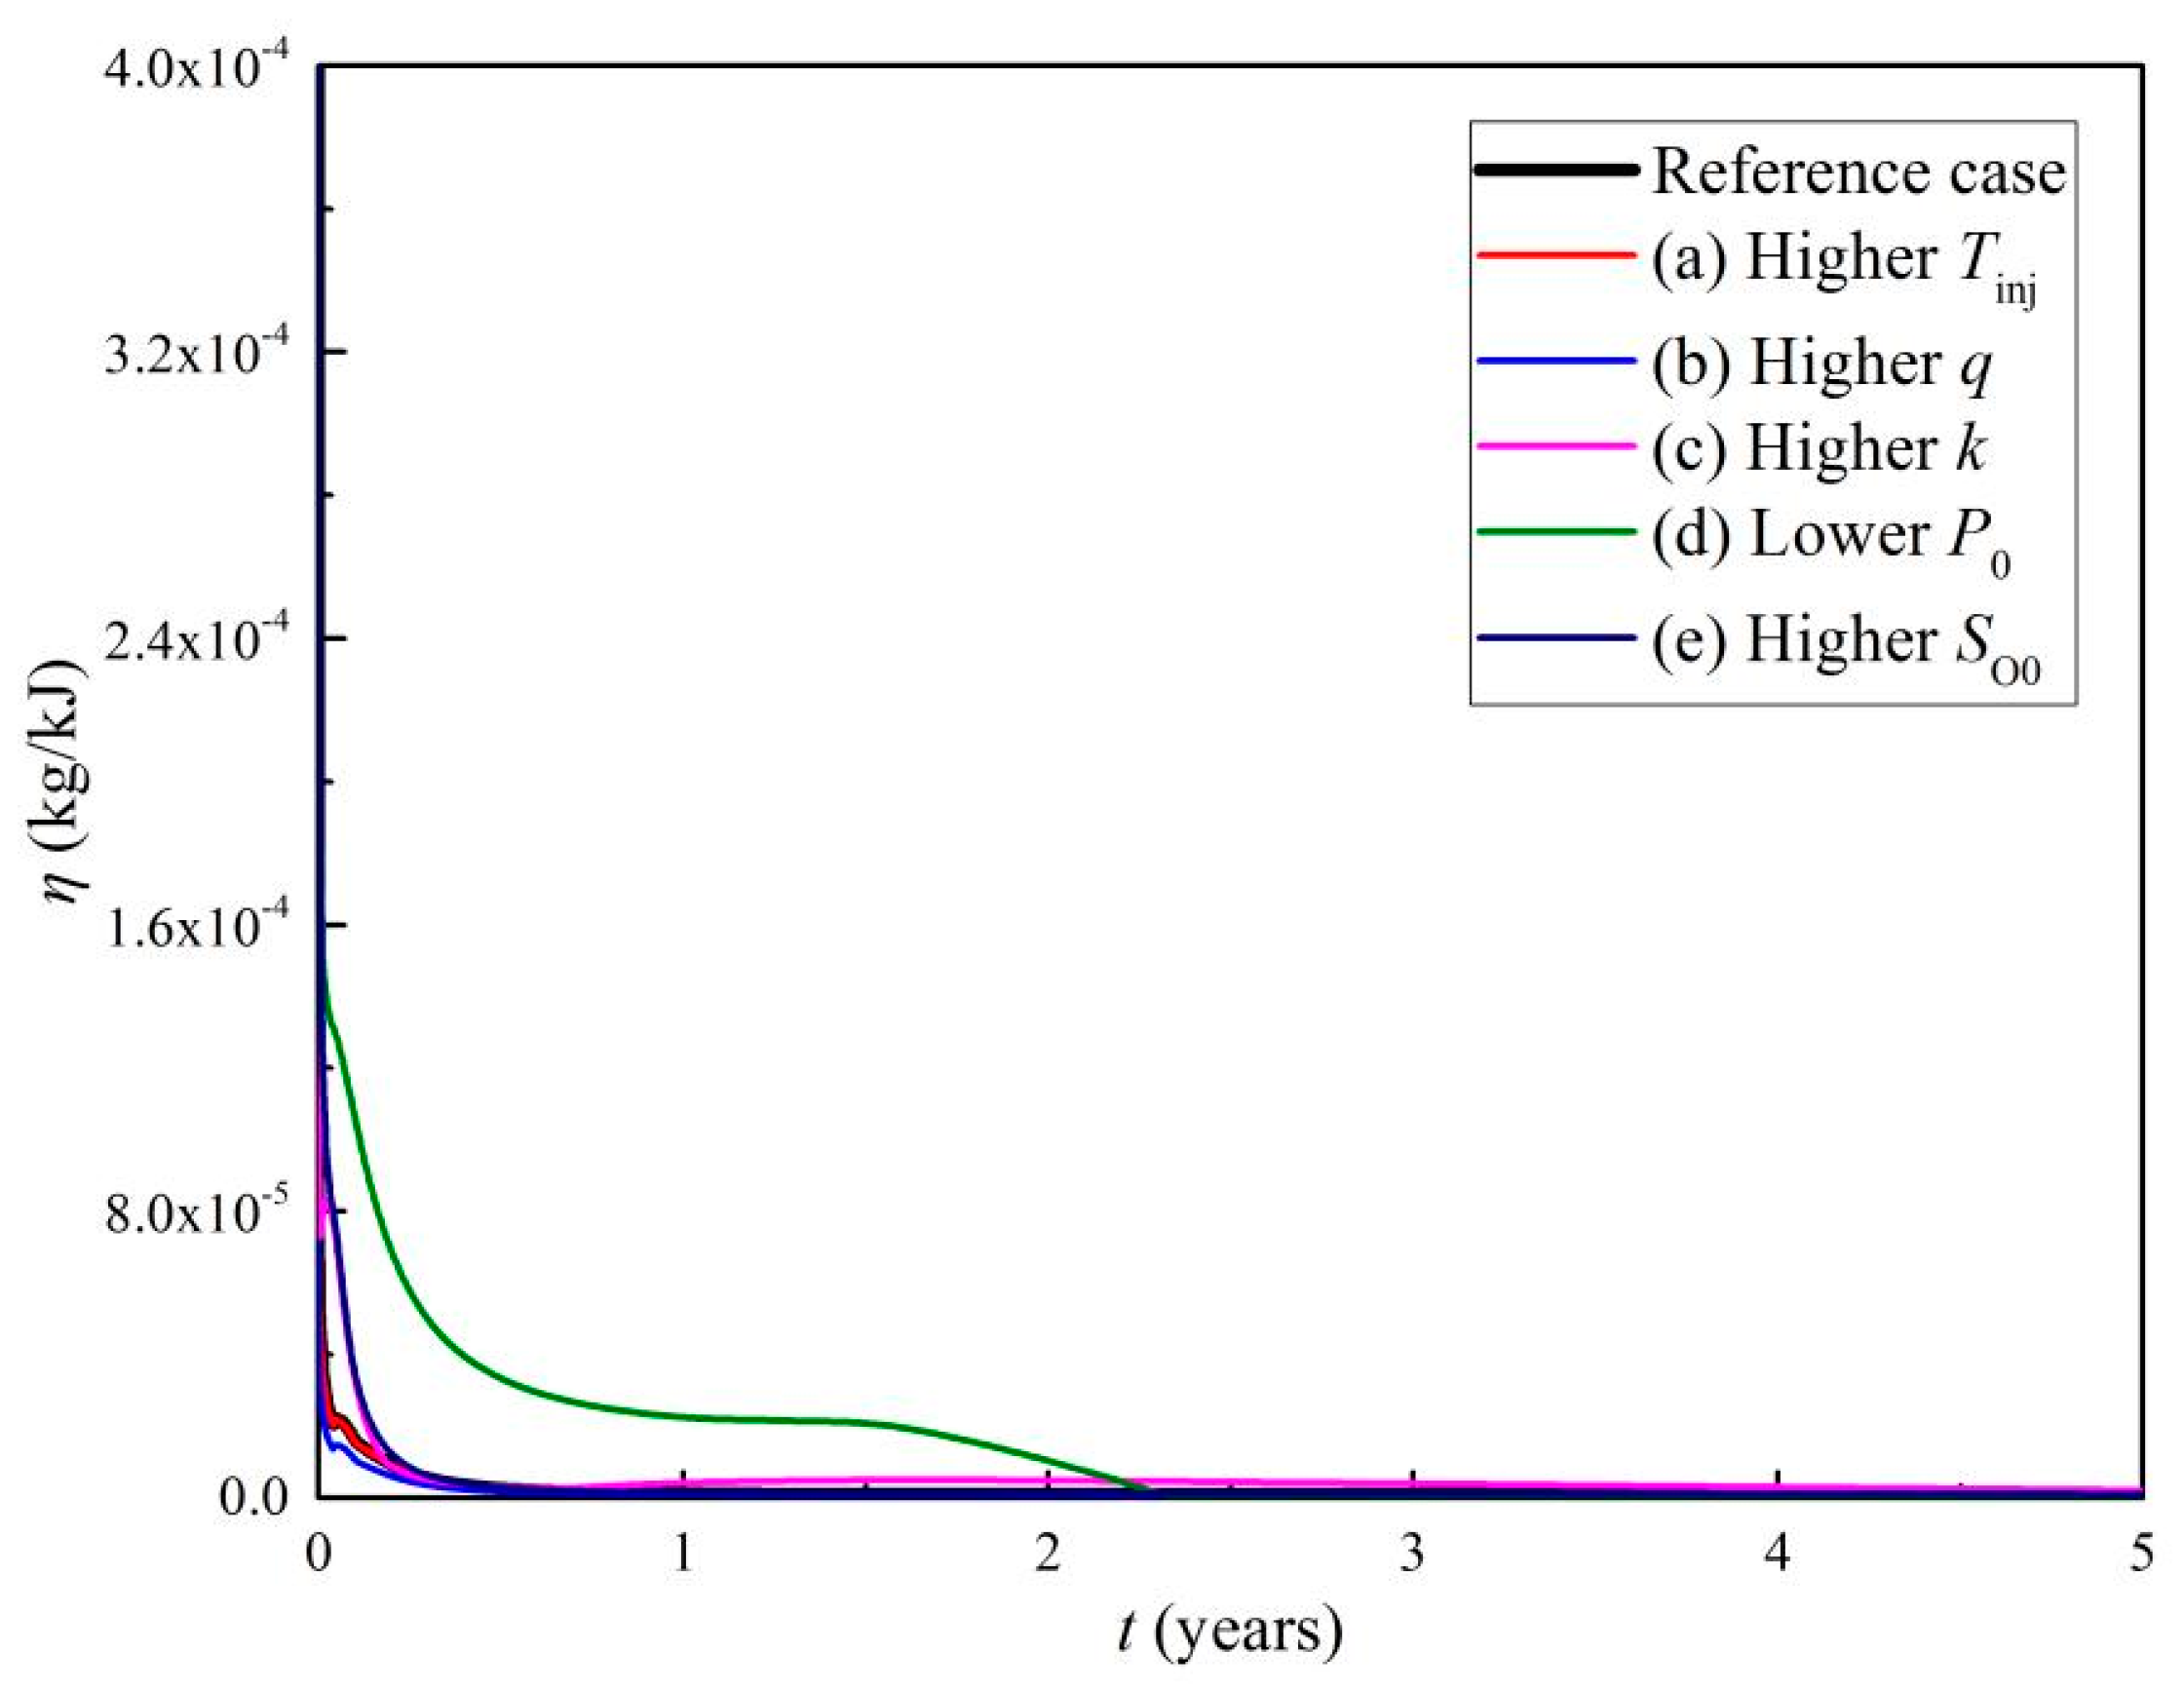
(8)
The energy efficiency of the system is significantly affected by the steam injection flow rate, formation permeability, production pressure, and initial xylene saturation. Increasing formation permeability, reducing production pressure, and increasing the initial xylene saturation significantly improves energy efficiency, while increasing the injection flow rate significantly reduces energy efficiency.

Author Contributions

Methodology, Y.Z.; Software, L.D.; Formal analysis, H.Z. and B.H. All authors have read and agreed to the published version of the manuscript.

Funding

This work was supported by the GDAS’ Project of Science and Technology Development (2020GDASYL-20200102020), the Applied Basic Research Project of Guangzhou (202102020304), the High-level Talent Program of Zhongkai University of Agriculture and Engineering (KA22016B710), the Key Field Program of Ordinary University in Guangdong Province (2022ZDZX4023), the Open Fund of Key Laboratory of Oil & Gas Equipment, the Ministry of Education (Southwest Petroleum University) (OGE202302-12), and the Guangzhou Science and Technology Planning Project (202201010562).

Data Availability Statement

The original contributions presented in this study are included in the article. Further inquiries can be directed to the corresponding author.

Conflicts of Interest

The authors declare no conflict of interest.

References

  1. Ramón, F.; Lull, C. Legal measures to prevent and manage soil contamination and to increase food safety for consumer health: The case of Spain. Environ. Pollut. 2019, 250, 883–891. [Google Scholar] [CrossRef] [PubMed]
  2. Liu, Z.; Yin, Y.; Zhang, Y.; Shi, S. Legal System of Soil Pollution Remediation in China and Its Regulation and Guidance to Soil Pollution Remediation. Sustainability 2023, 15, 11504. [Google Scholar] [CrossRef]
  3. Soga, K.; Page, J.W.E.; Illangasekare, T.H. A review of NAPL source zone remediation efficiency and the mass flux approach. J. Hazard. Mater. 2004, 110, 13–27. [Google Scholar] [CrossRef]
  4. Li, P.; Liu, W.; Sun, T.; Gong, Z.; Fu, S. Remediation of contaminated soil: Its present research situation and prospect. Chin. J. Ecol. 2006, 25, 1544–1548. (In Chinese) [Google Scholar]
  5. Wu, Y. Soil and Groundwater Pollution and Its Remediation; Science Press: Beijing, China, 2018. [Google Scholar]
  6. He, R.; Yang, Y.; Liang, W.; Zhang, L.; Wu, Q. Study on thermal intensified vapor extraction technology of soil contaminated by benzene series. Environ. Prot. Sci. 2021, 47, 167–171. [Google Scholar]
  7. Zhang, Q.; Wang, C. Natural and human factors affect the distribution of soil heavy metal pollution: A review. Water Air Soil Pollut. 2020, 231, 350. [Google Scholar] [CrossRef]
  8. Wiles, C.C. A view of solidification/stabilization technology. J. Hazard. Mater. 1987, 14, 5–21. [Google Scholar] [CrossRef]
  9. Wu, Y.; Wang, X.; Zhao, W.; Wang, X.; Yang, Z.; Li, L. Roles of n-hexadecane in the degradation of dibenzofuran by a biosurfactant-producing bacterium Rhodococcus sp. J. Clean. Prod. 2024, 434, 140500. [Google Scholar] [CrossRef]
  10. Wang, Y. Study on Simulation and Prediction of BTEX Contaminated Site Remediation Effect by Soil Vapor Extraction. Master’s Thesis, Hebei Agricultural University, Baoding, China, 2020. [Google Scholar]
  11. Vinegar, H.J.; Coles, J.M.; Menotti, J.I. In situ thermal desorption of coal tar. In Proceedings of the IGT/GRT International Symposium on Environmental Biotechnologies and Site Remediation Technologies, Orlando, FL, USA, 7–9 December 1998. [Google Scholar]
  12. Heron, G.; Parker, K.; Galligan, J.; Holmes, T.C. Therma treatment of eight CVOC source zones to near nondetect concentration. Ground Water Monit. Remediat. 2009, 29, 56–65. [Google Scholar] [CrossRef]
  13. Izgiris, E.E.; Edelsterin, W.A.; Philipp, H.R.; Iben, I.T. Complex thermal desorption of PCBs from soil. Chemosphere 1995, 30, 377–387. [Google Scholar] [CrossRef]
  14. Iben, E.T.; Edelstein, W.A.; Sheldon, R.B.; Shapiro, A.P.; Uzgiris, E.E.; Scatena, C.R.; Blaha, S.R.; Silverstein, W.B.; Brown, G.R.; Stegemeier, G.L.; et al. Thermal blanket for in-situ remediation of surficial contamination: A pilot test. Environ. Sci. Technol. 1996, 30, 3144–3154. [Google Scholar] [CrossRef]
  15. Zhu, J.; Luo, Q.; Li, X.Q. Thermodesorption of BTEX-contaminated soil using heat conduction. Environ. Chem. 2013, 32, 1546–1553. [Google Scholar]
  16. Li, B.Z.; Zhu, J.; Ji, M.; Tu, B.; Lin, X. Research upon steam enhanced vapor extraction for the remediation of benzene homologues contaminated clayed soil. J. Shanghai Jiaotong Univ. (Agric. Sci.) 2016, 34, 58–75. [Google Scholar]
  17. Huang, W.; Wang, J.; Deng, C.; Cheng, D.; Wang, Q. Research Progress of In-situ Remediation of Non-aqueous Liquid Contaminated Soil by Steam Injection Technology. Environ. Sci. Manag. 2022, 47, 92–97. (In Chinese) [Google Scholar]
  18. Azizan, N.A.; Kamaruddin, S.A.; Chelliapan, S. Steam-enhanced extraction experiments, simulations and field studies for dense non-aqueous phase liquid removal: A review. MATEC Web Conf. 2016, 47, 05012. [Google Scholar] [CrossRef]
  19. Engineering Forum Issue Paper. In In Situ Treatment Technologies for Contaminated Soil; Environmental Protection Agency: Washington, DC, USA, 2006.
  20. Li, X.S.; Li, B.; Li, G.; Yang, B. Numerical simulation of gas production potential from permafrost hydrate deposits by huff and puff method in a single horizontal well in Qilian Mountain, Qinghai province. Energy 2012, 40, 59–75. [Google Scholar] [CrossRef]
  21. Li, G.; Moridis, G.J.; Zhang, K.; Li, X.S. The use of huff and puff method in a single horizontal well in gas production from marine gas hydrate deposits in the Shenhu Area of South China Sea. J. Pet. Sci. Eng. 2011, 77, 49–68. [Google Scholar] [CrossRef]
  22. Zeng, Y.C.; Su, Z.; Wu, N.Y. Numerical simulation of heat production potential from hot dry rock by water circulating through two horizontal wells at Desert Peak geothermal field. Energy 2013, 56, 92–107. [Google Scholar] [CrossRef]
  23. Zeng, Y.C.; Wu, N.Y.; Su, Z.; Hu, J. Numerical simulation of electricity generation potential from fractured granite reservoir through a single horizontal well at Yangbajing geothermal field. Energy 2014, 65, 472–487. [Google Scholar] [CrossRef]
  24. Zeng, Y.C.; Zhan, J.M.; Wu, N.Y.; Luo, Y.; Cai, W. Numerical investigation of electricity generation potential from fractured granite reservoir by water circulating through three horizontal wells at Yangbajing geothermal field. Appl. Therm. Eng. 2016, 104, 1–15. [Google Scholar] [CrossRef]
  25. Song, X.; Shi, Y.; Li, G.; Yang, R.; Wang, G.; Zheng, R.; Li, J.; Lyu, Z. Numerical simulation of heat extraction performance in enhanced geothermal system with multilateral wells. Appl. Energy 2018, 218, 325–337. [Google Scholar] [CrossRef]
  26. Mao, P.; Wan, Y.; Sun, J.; Li, Y.; Hu, G.; Ning, F.; Wu, N. Numerical study of gas production from ffne-grained hydrate reservoirs using a multilateral horizontal well system. Appl. Energy 2021, 301, 117450. [Google Scholar] [CrossRef]
  27. Zhai, H.; Jin, G.; Liu, L.; Su, Z.; Zeng, Y.; Liu, J.; Li, G.; Feng, C.; Wu, N. Parametric study of the geothermal exploitation performance from a HDR reservoir through multilateral horizontal wells: The Qiabuqia geothermal area, Gonghe Basin. Energy 2023, 275, 127370. [Google Scholar] [CrossRef]
  28. Pruess, K.; Oldenburg, C.; Moridis, G. TOUGH2 User’s Guide, Version 2.0; Lawrence Berkeley National Laboratory: Berkeley, CA, USA, 1999. [Google Scholar]
  29. Falta, R.W.; Pruess, K.; Finsterle, S.; Battistelli, A. T2VOC User’s Guide; Lawrence Berkeley National Laboratory: Berkeley, CA, USA, 1995. [Google Scholar]
  30. Sima, J. Experimental Study on the Influencing Factors of Steam Migration in Steam Injection and Its Remediation of Phenanthrene Contaminated Soil. Guangdong Chem. Ind. 2022, 49, 94–97. (In Chinese) [Google Scholar]
Figure 1. System conceptual model of steam injection in three horizontal wells to repair soil xylene pollution.
Processes 13 01491 g001
Figure 2. Simulation area and numerical meshing schemes.
Processes 13 01491 g002
Figure 3. Evolution of production fluid saturation S during 5-year period.
Processes 13 01491 g003
Figure 4. Evolution of Mpro and Tpro during 5-year period.
Processes 13 01491 g004
Figure 5. Evolution of Pinj and Wp during 5-year period.
Processes 13 01491 g005
Figure 6. Evolution of MO and η during 5-year period.
Processes 13 01491 g006
Figure 7. The evolution of the spatial distribution of xylene saturation over the 5-year period.
Processes 13 01491 g007
Figure 8. The evolution of the spatial distribution of gas saturation over the 5-year period.
Processes 13 01491 g008
Figure 9. The evolution of the spatial distribution of water saturation over the 5-year period.
Processes 13 01491 g009
Figure 10. The evolution of the spatial distribution of temperature over the 5-year period.
Processes 13 01491 g010
Figure 11. The evolution of the spatial distribution of pressure over the 5-year period.
Processes 13 01491 g011
Figure 12. Sensitivity of production VOC saturation to various parameters.
Processes 13 01491 g012
Figure 13. Sensitivity of production VOC mass flow rate to various parameters.
Processes 13 01491 g013
Figure 14. Sensitivity of pump power consumption to various parameters.
Processes 13 01491 g014
Figure 15. Sensitivity of energy efficiency to various parameters.
Processes 13 01491 g015
Table 1. Physical properties and operating parameters of the simulated region [29].
ParametersValues
Thickness of overburden layer20 m
Thickness of NAPL layer40 m
Thickness of underburden layer20 m
Soil density2650 kg/m3
Soil porosity40%
Soil permeability 2.5 × 10⁻¹³ m2
Soil thermal conductivity3.1 W/(m·K)
Soil heat capacity1000 J/(kg·K)
Swr in Stone model0.1
Snr in Stone model0.05
Sgr in Stone model0.01
n in Stone model3
Sm in Parker model 0
n in Parker model 1.84
αgn in Parker model 5.0 × 10⁴
αnw in Parker model 5.24
Injection steam mass flow rate, qinj8.0 × 10−4 kg/s
Injection steam enthalpy, hinj2.676 × 106 J/kg
Injection temperature, Tinj100 °C
Production pressure, P08.0 × 104 Pa
Production index, PI2.0 × 10−12 m3
Initial pressure101,325 Pa
Initial temperature22 °C
Initial xylene saturation of NAPL layer0.3
Initial water saturation of NAPL layer0.4
Initial air saturation of NAPL layer0.3
Initial water saturation of overburden and underburden layer0.4
Initial air saturation of overburden and underburden layer0.6
Disclaimer/Publisher’s Note: The statements, opinions and data contained in all publications are solely those of the individual author(s) and contributor(s) and not of MDPI and/or the editor(s). MDPI and/or the editor(s) disclaim responsibility for any injury to people or property resulting from any ideas, methods, instructions or products referred to in the content.

