Article

Optimal Scheduling of Active Distribution Networks with Hybrid Energy Storage Systems Under Real Road Network Topology

State Grid Henan Electric Power Company, Zhengzhou 450007, China
*
Author to whom correspondence should be addressed.
Processes 2025, 13(5), 1492; https://doi.org/10.3390/pr13051492
Submission received: 19 March 2025 / Revised: 27 April 2025 / Accepted: 7 May 2025 / Published: 13 May 2025
(This article belongs to the Topic Advances in Power Science and Technology, 2nd Edition)

Abstract

:
With the increasing proportion of renewable energy in power systems, the applications of mobile energy storage systems (MESSs) with better flexibility and controllability are becoming more widespread. To further explore the hybrid ESS optimization scheduling problem of MESS and SESS, this paper first quantifies parts of actual road topologies in Dali City, China, and combines the Dijkstra algorithm to obtain an MESS path optimization framework. Subsequently, a hybrid ESS optimization scheduling model combining MESS and SESS is constructed with the objective functions of maximizing the scheduling benefits of the hybrid ESS and minimizing system voltage deviation. Finally, the non-dominated sorting genetic algorithm III (NSGA-III) is used to solve the hybrid ESS optimization scheduling model. To verify the effectiveness of the proposed method, this paper selected typical daily load and renewable energy output data in winter in Dali for the case study. The final result shows that the total profit of the optimized scheduling of the hybrid ESS is CNY 578, of which the arbitrage income is CNY 1119.2 and the total cost is CNY 540.44. Meanwhile, the voltage distribution range and total power loss are optimized from [0.9616, 1.0105] to [0.9723, 1.0008] and 0.963 MW to 0.9134 MW, which indicates that the coordinated scheduling of hybrid ESS is the key to improving the reliability of distribution network operation, and the path optimization of MESS is crucial for enhancing its profitability.

1. Introduction

With the proposal of carbon peak and carbon neutralization targets, the proportion of renewable energy in the power system has gradually increased [1,2]. However, the inherent randomness and intermittence of renewable energy generation are threatening the operational stability of the power system [3,4]. Energy storage systems (ESSs) play an increasingly important role in the planning and operation of power systems because of their peak-shaving and valley-filling characteristics [5,6]. Under the trend of continuous breakthroughs in energy storage battery technology and more lightweight design, mobile energy storage systems (MESSs) have gradually become a research hotspot [7,8]. As a backup energy storage power supply with a truck as the carrier, MESS has the controllability and mobility of time and space, which can effectively solve the problem of the lack of flexibility of a stationary energy storage system (SESS) [9].
At present, the research on MESS mainly focuses on power grid disaster relief [10,11] and economic dispatch of MESS [12,13]. This paper focuses on the economic dispatch of MESS. Research [14] proposes a scheduling method of MESS to improve the reliability of high photovoltaic penetration distribution systems. Considering the uncertainty of renewable energy, a strategy for restoring the DN after high-impact and low-probability vicious events via MESS is proposed in [15]. Furthermore, an MESS arbitrage spatiotemporal scheduling strategy considering node marginal price is proposed in [16], demonstrating the arbitrage potential of MESS. Research [17] establishes a collaborative scheduling model for MESS and other mobile resources in DN and verified the role of different types of MESS collaborative scheduling in improving the recovery efficiency of DN. However, the above studies only focus on the optimal scheduling strategy of MESS, and the complementary characteristics between MESS and SESS are fully neglected.
Study [18] proposes an optimization scheduling method for park-level integrated energy systems, which includes electric vehicles (EVs) and SESS. The results show that introducing cross-seasonal ESS and EVs and adopting seasonal scheduling methods has a positive impact. Similarly, a scheduling method for EV participation in integrated energy system dispatching is established in [19]. Although EVs are relatively mature as MESSs applied in the power system, the EV scheduling method driven by time-of-use (TOU) price is difficult to respond to immediately. In contrast, truck-mounted MESS has the advantage of a faster response speed [20]. Research [21] constructs a two-stage optimization scheduling model for MESS and SESS. Finally, results show that resource waste can be avoided via the collaborative scheduling of MESS and SESS. Furthermore, in reference [22], the profits of DN operators are maximized, and the load-loss cost during power outages is reduced by combining SESS and MESS. However, the explorations of practical applications and the joint operation mechanism of SESS and MESS in the above references are not deep enough.
The path optimization problem is a key issue in the optimization scheduling of MESS. Currently, most research on the path optimization of MESS focuses on model-driven methods. Reference [20] proposes a dual-layer optimization model for the economic operation of MESS. The upper-layer model maximizes the total system revenue, while the lower-layer model optimizes the transportation route through fuzzy-time windows and the road congestion index. Simulation results show that the model can effectively avoid congestion periods and improve operational efficiency. Although this method can reduce the travel time of MESS to a certain extent, it only considers the impact of traffic congestion and ignores the delay of road node signal lights, so there are still certain limitations. Moreover, a mixed-integer second-order cone programming model is constructed in [23] with the objective function of minimizing the network loss of DN and the transportation cost of MESS. However, the model ignored the requirement of voltage quality. Reference [24] proposes a two-stage optimization scheduling model for EV and MESS. In the first stage, aiming to maximize the interests of both highway managers and EV users, an electric vehicle-charging optimization problem is constructed, and the grid-connected charging loads are determined. The second stage aims to minimize the cost of mobile energy storage scheduling and construct an optimized scheduling model for MESS. However, the road network only considers expressways, ignoring the impact of road congestion and signal delay on MESS scheduling. In addition, a routing and scheduling model for EV mobile charging stations is proposed in [25]. The mobile charging station in the model can accept the charging and discharging behavior of EVs and connect with the urban DN. Finally, the linear equation is used to simplify the model and shorten the solution time. However, the influence of road conditions on the transfer time of mobile charging stations in the path optimization model is ignored, and the accuracy of the linearly simplified model is not discussed.
Therefore, in order to further explore the routing and scheduling problem of a hybrid ESS containing MESS and SESS, this paper first converts the real road network topology of a certain urban area into a mathematical model and constructs a path-optimization model for MESS based on the real road network topology. Subsequently, a hybrid ESS optimization scheduling model combining MESS and SESS is constructed with the aim of maximizing hybrid ESS scheduling benefits and minimizing system voltage deviation. Finally, to verify the effectiveness of the method proposed in this paper, typical daily loads and renewable energy output data of the city in winter are selected, and the case studies are conducted. Moreover, the main contributions of this paper are as follows:
  • A hybrid ESS optimization scheduling method containing MESS and SESS is proposed, which fully considers the complementary characteristics of MESS and SESS and achieves optimized allocation of MESS and SESS resources. This method not only reduces the operating costs of ESS and ensures system voltage stability but also improves the utilization efficiency of power resources;
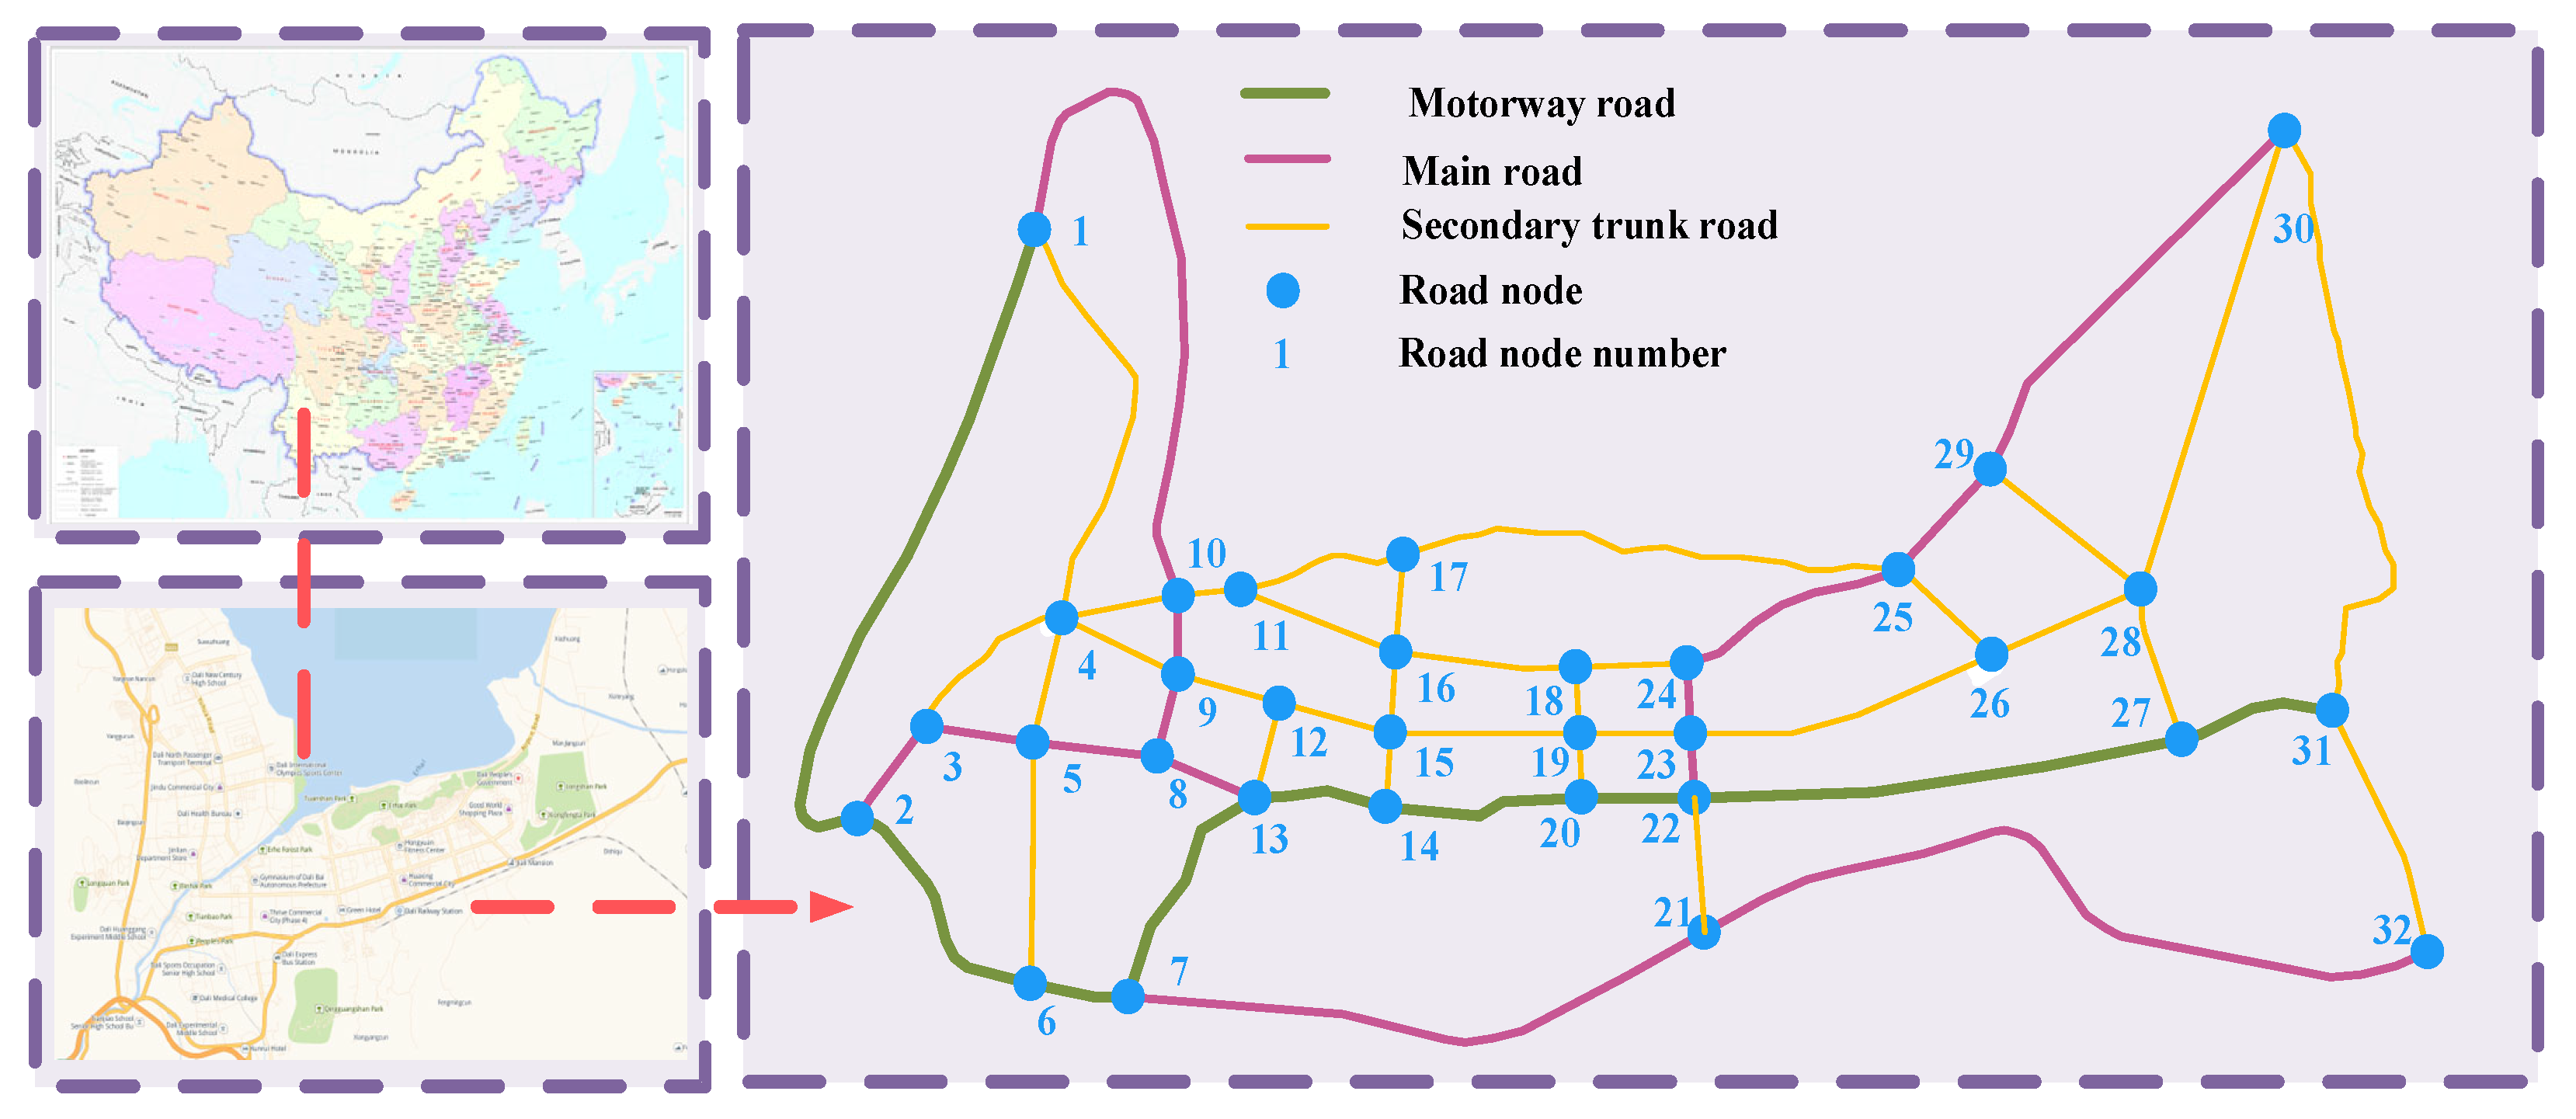
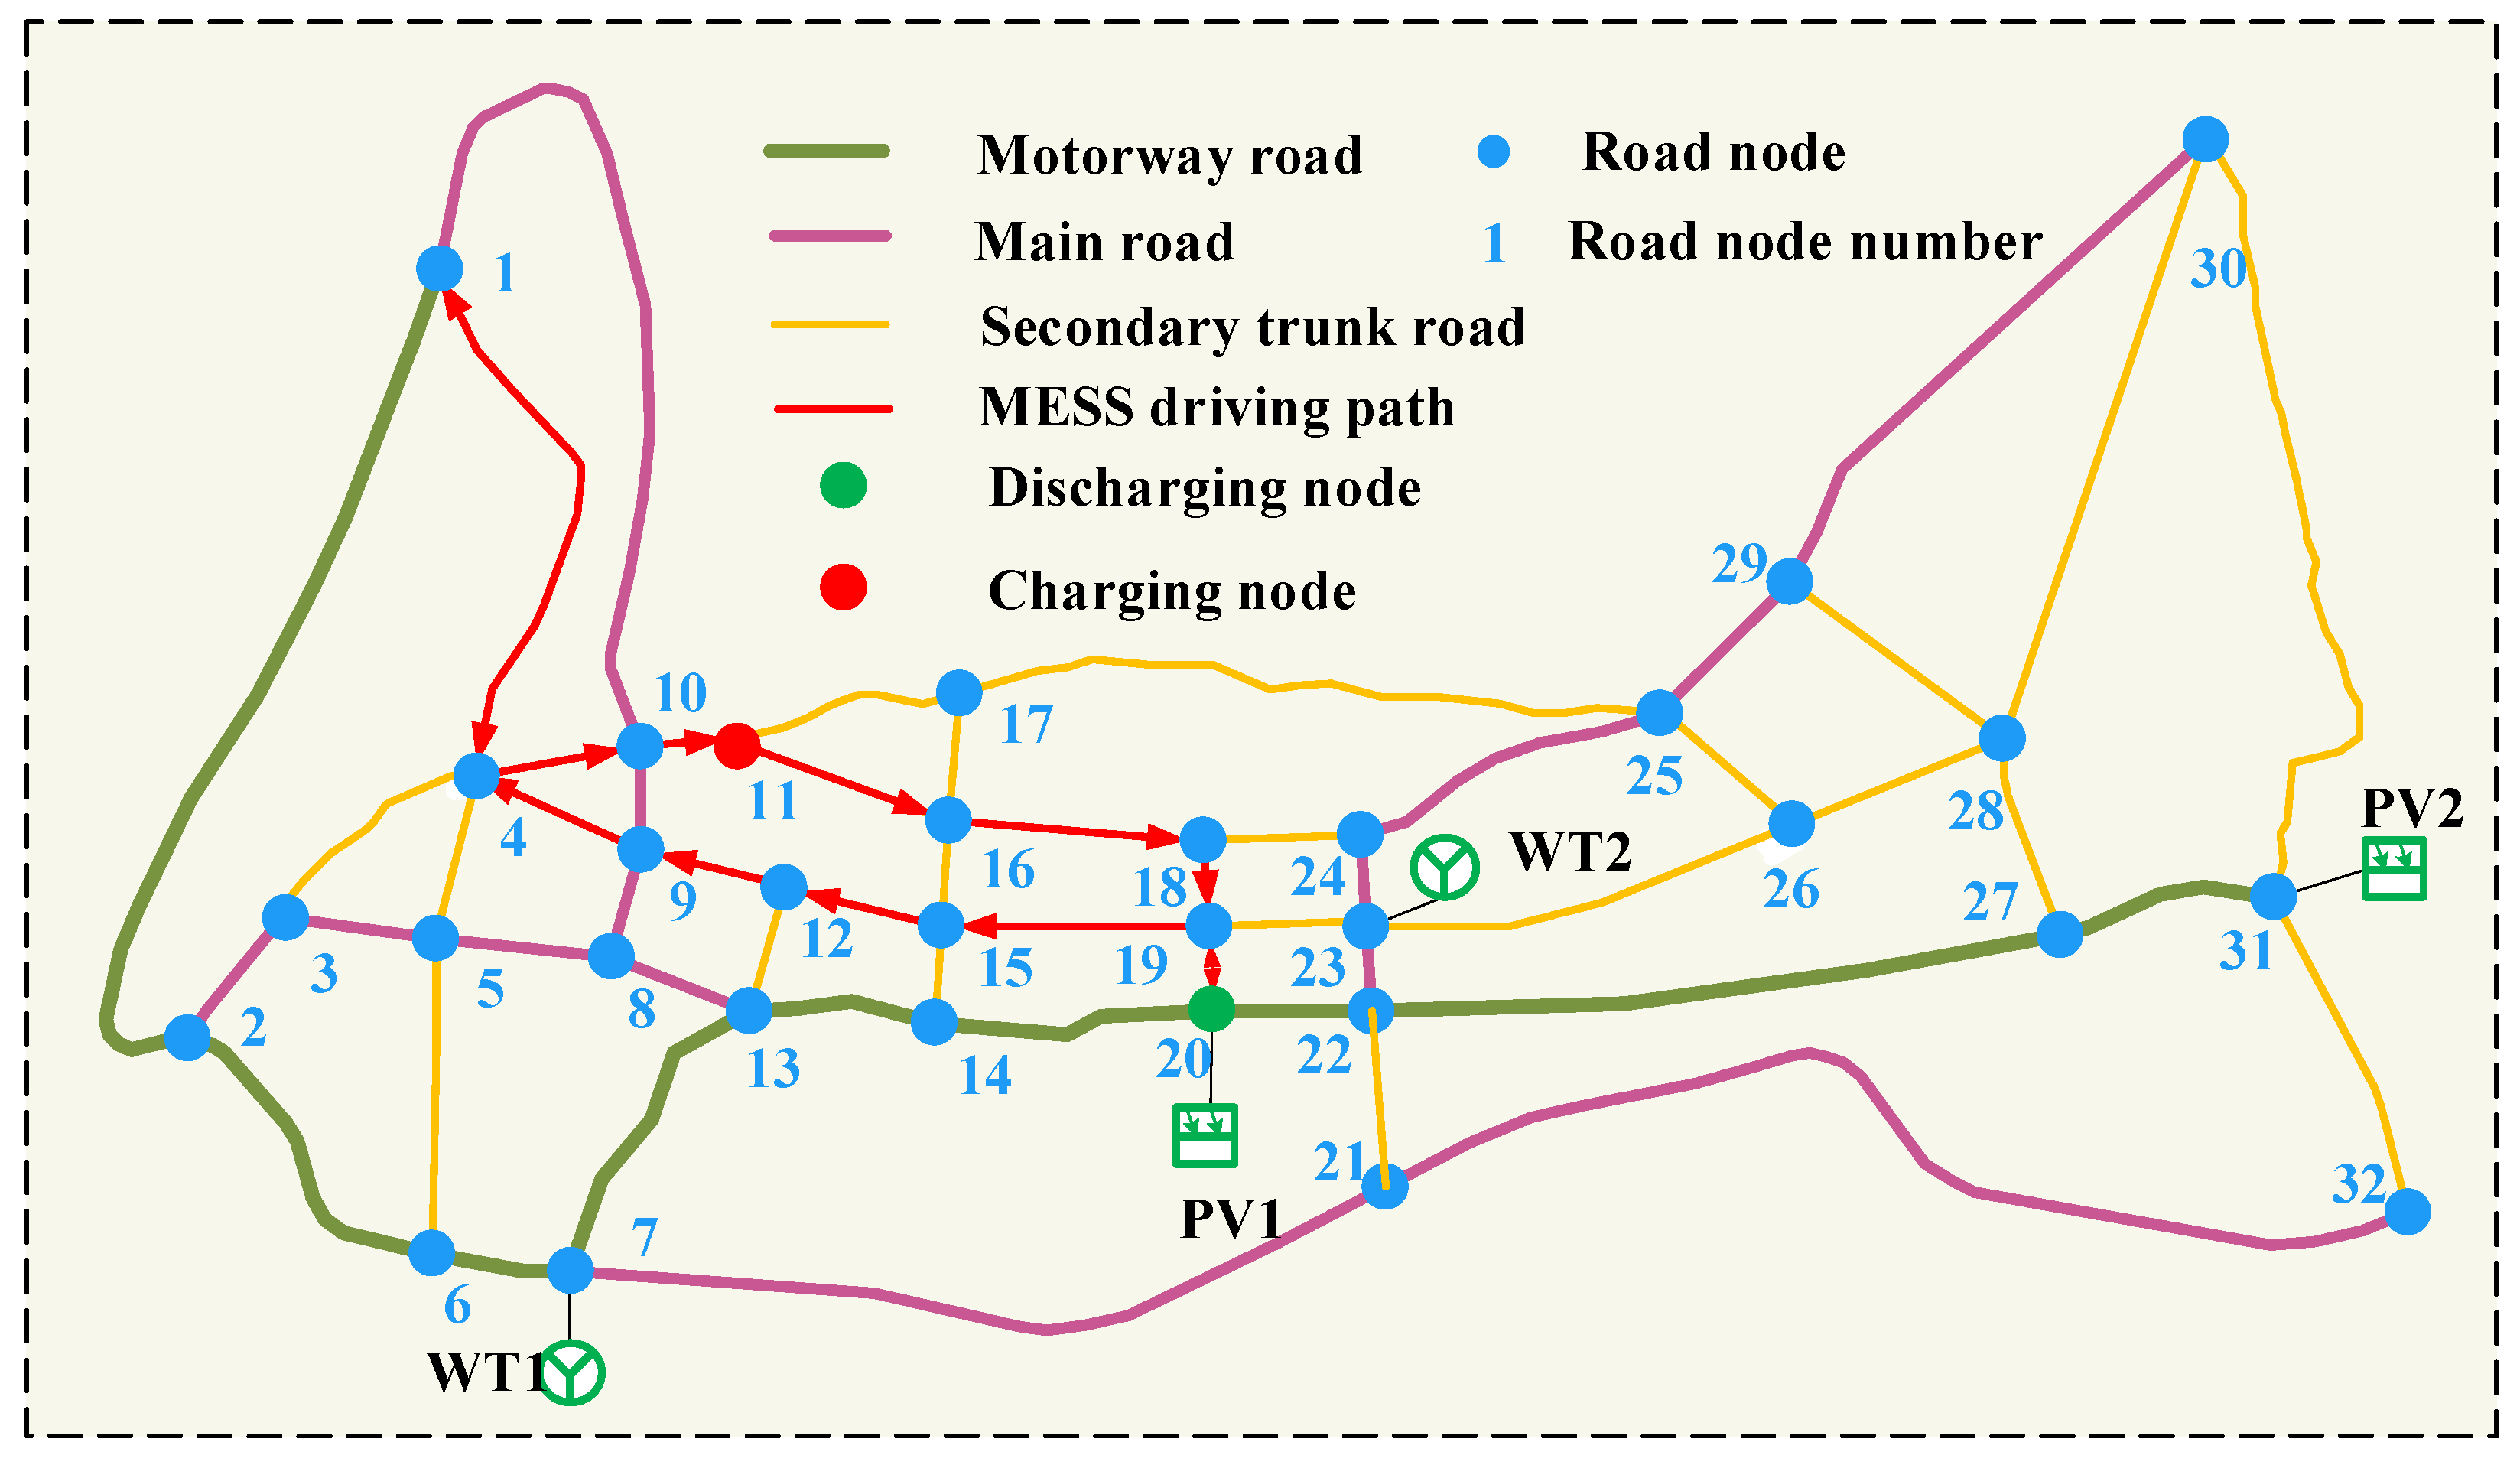
  • The actual transportation network of Dali city is quantified based on the time-flow theory to obtain a dynamic road network model. Moreover, the path with the minimum weight in the dynamic road network model is obtained according to the Dijkstra algorithm, which is the optimal path for MESS scheduling.
The remaining contents of this paper are structured as follows: The road topology modeling is established in Section 2. Section 3 introduces the objective function of the MESS optimization scheduling model. Furthermore, the solution process of the non-dominated sorting genetic algorithm III (NSGA-III) is provided in Section 4. In Section 5, case studies are conducted. The conclusions and future research are drawn in Section 6.

2. Road Topology Modeling

As shown in Figure 1. Dali is located at an east longitude of 99°58′–100°27′ and a north latitude of 25°25′–25°58′. Dali belongs to the northern subtropical plateau monsoon climate type, the annual temperature difference is small, the four seasons are not obvious climate characteristics, and it has rich wind and solar energy. Therefore, Dali is selected as the research object of this paper. Firstly, the Open Street Map website is used to obtain road data in Dali. Then, the version 3.34.1 of QGIS software is employed to visualize the road data in the middle of the Dali urban area [26], and the motorway, main road, and secondary road are retained to construct the traffic network adopted in this paper.

2.1. Mathematical Model of Road Topology

As shown in Figure 1, this paper uses nodes to represent important intersections or important destinations, as well as lines to represent passable roads. According to the actual map, this paper divides different roads into motorway road, main road, and secondary trunk road to distinguish their traffic capacity. The mathematical model of the road network constructed in this paper is shown as follows:
G = N , π , T , W , D , Q , S , U π = a n , a m | n N , m N , n m D = d n m | a n , a m π T = t | t = 1,2 , 3 , , z N = c n | n = 1,2 , 3 , , N n V = v n m t | a n , a m π , t T H = q n m t | a n , a m π , t T S = s n m t | a n , a m π , t T W = w n m t | a n , a m π , t T
where G is the set of road network models for dynamic traffic; π is the set of road segments in the road network; T is the set of time periods; W represents the road weights; D is the set of distances between each node; H denotes the traffic flows on different road segments at different times; S is the set of congestion of each road at each time period; U represents the node voltage of the grid node corresponding to each road network node; a n and a m are the n th node and m th node of the road network, respectively; t is the time period; v n m is the driving speed of road segment n m ; q n m is the traffic flows of road segment n m ; s n m is the congestion of road segment n   m ; and w n m is the road weight of road segment n m .

2.2. Dynamic Mathematical Model of Road Topology

The real-world city contains a large number of intersections and signal lights, which contributes to the actual urban road conditions complex and dynamic. Therefore, this paper introduces the time-flow model to simulate and analyze the dynamic urban roads [27]. Specifically, the traffic condition is divided according to the saturation, and then the urban road resistance is quantified into the node resistance model and road section resistance model according to the traffic condition of each road [26].
The road section resistance model is as follows:
R n m t = t 0 1 + α s n m t β , 0 s n m t 1 t 0 1 + α 2 s n m t β , 1 < s n m t 2
s n m t = q n m t h n m
where R n m t is the road resistance of road segment n m at time t; h n m is the passable capacity of road segment n m ; t 0 is the travel time without traffic flow; and α and β are the resistance influence factors.
The node resistance model is as follows:
R a n t = 9 10 θ 1 λ 2 2 1 λ s n m t + s n m t 2 2 Ƃ 1 s n m t ,   0 s n m t 0.6 θ 1 λ 2 2 1 λ s n m t + 1.5 s n m t 0.6 1 s n m t s n m t ,   s n m t > 0.6
where R a n t is the road resistance of node n ; θ is the period of the signal light; Ƃ represents the vehicle arrival rate; and λ is the ratio of green light.
Road segment resistance, node resistance, and road distance jointly affect the driving time and driving cost of MESS. Therefore, a road weight model containing road segment resistance, node resistance, and road distance is constructed, which guides MESS to select the appropriate path. The road weights model is as follows:
w n m t = w 1 ( R n m t + R a n t ) * + w 2 d n m *
where w 1 and w 2 are the weights of rod resistance and actual distance, respectively.

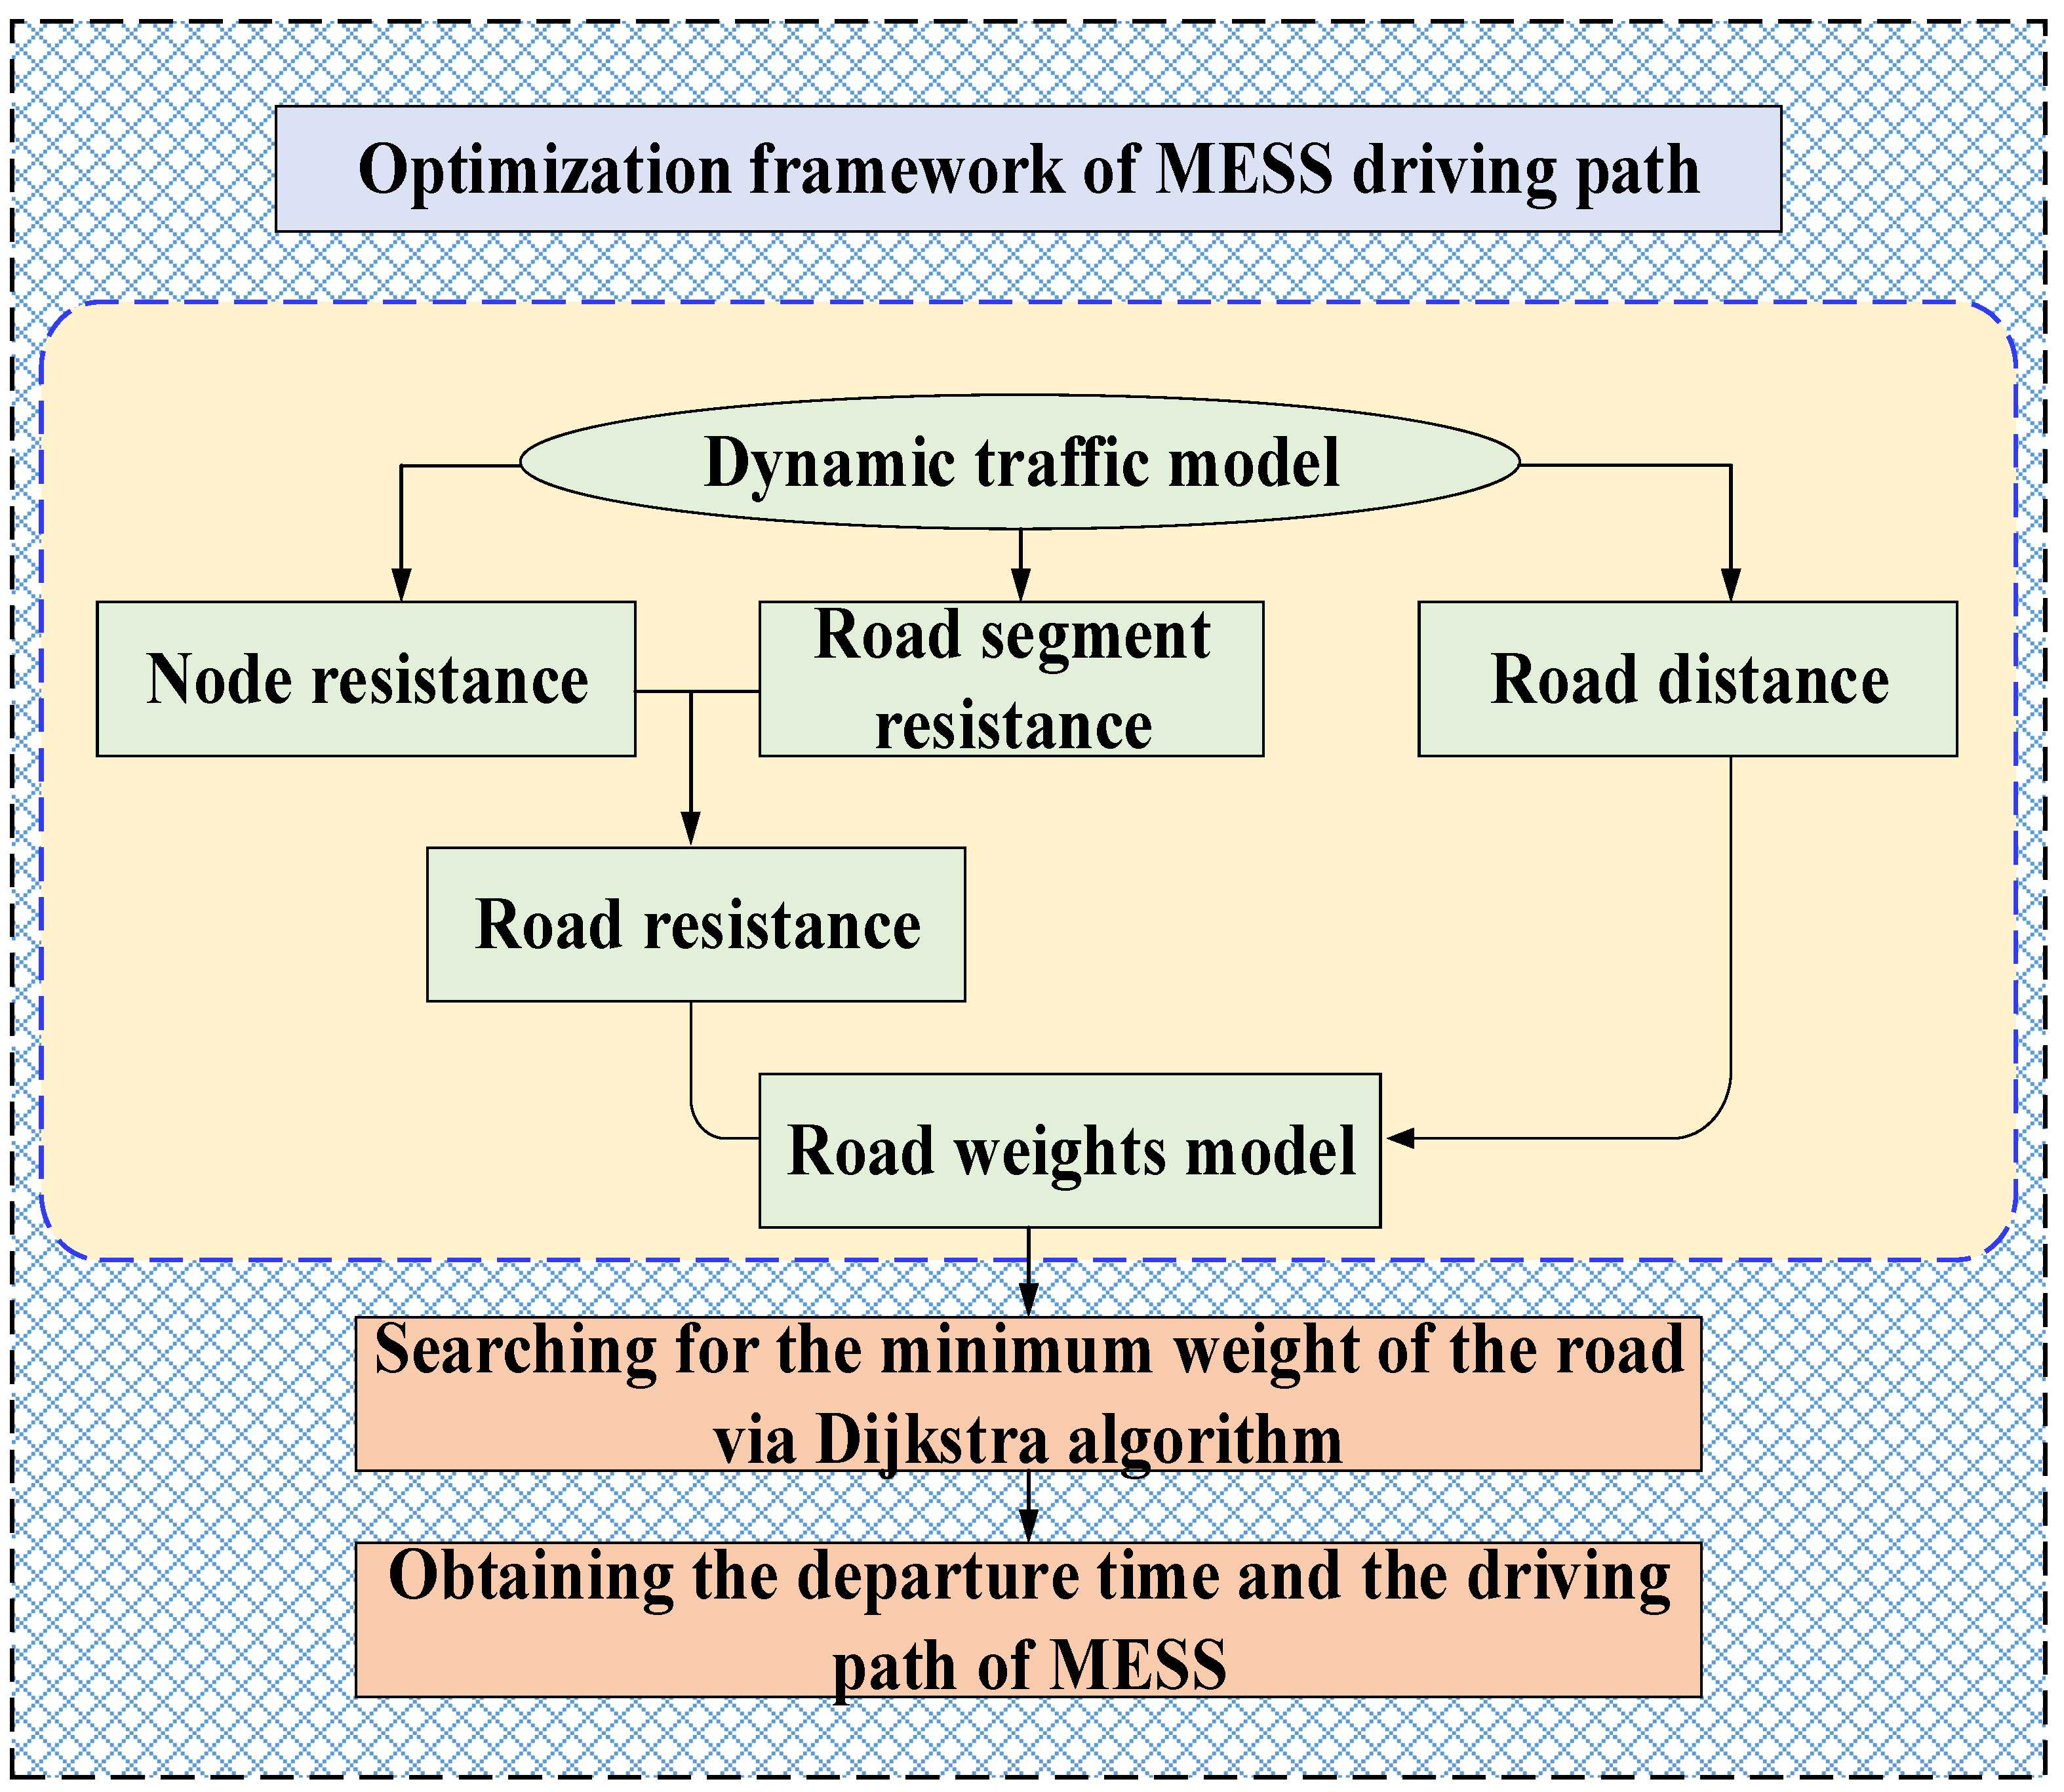
2.3. Optimization Framework of MESS Driving Path

Under the condition that the scheduling plan of MESS is received, the departure time and path of MESS should be optimized to ensure that MESS can access the grid node at a specified time and reduce the driving cost of MESS. Therefore, based on dynamic traffic information, this paper optimizes the departure time and driving path of MESS, and the optimization framework is shown in Figure 2.

2.4. Energy Storage System Operating Constraints

ESS operating constraints mainly contain the charge and discharge power constraints and state-of-charge (SOC) constraints of all ESSs. The details are as follows [28]:
P c h a , a B E S S t   P r a t e , a B E S S 0 P d i s , a B E S S t P r a t e , a B E S S
E a B E S S t = E a B E S S t 1 P c h a , a B E S S t η D t E r a t e , a B E S S P d i s , a B E S S t t η C E r a t e , a B E S S
S o C m i n   E a B E S S t S o C m a x
where P c h a , a B E S S t and P d i s , a B E S S t are the charge and discharge power of the a th battery energy storage system (BESS) at time t , respectively; P r a t e , a B E S S is the rated power of the a th BESS; N B E S S is the total amount of BESS; E a B E S S t is the SOC of the a th BESS at time t ; η C and η D are the efficiency of charge and discharge, respectively; E r a t e , a B E S S represents the rated SOC of the a th BESS; and S o C m a x and S o C m i n are the upper and lower limits of SOC.

2.5. Temporal Constraints

In this paper, the charging and discharging time constraints of MESS are different from those of conventional SESS. Considering the travel time and preparation time of MESS, which needs to reach the destination before the next charge and discharge, we conduct a detailed modeling of the charge and discharge time management of MESS, as follows [29]:
1 T s t a r t 1 T s t a r t r < T s t o p r , r = 1,2 , , z T s t o p h + T t r a h + T r e < T s t a r t h + 1 , h = 1,2 , , z 1 T s t o p z + T t r a z + T r e z p
where T s t a r t r and T s t o p r are the start and end time of the r th charge and discharge; z is the number of charge and discharge in a day; T t r a is the travel time of the h th charging and discharging node transition; T r e is the charge and discharge preparation time; and z p is the scheduling cycle.

2.6. Power Balcance Constraint

Energy balance constraint is the most fundamental constraint in power system scheduling. The active power in the power system should be balanced, otherwise it will cause a supply gap and affect the system frequency [30]. Therefore, the power balance constraint is shown as follows:
a = 1 N B E S S P d i s , a B E S S + j = 1 N p v P pv , j t + l = 1 N w t P wt , l t + P grid t = P load t + P loss t + a = 1 N B E S S P c h a , a B E S S
where P grid t is the supply power of the grid; P loss t is the loss power. This paper only considers the power loss of active power transmission on the line; P pv , j t and P wt , l t are the output power of photovoltaic (PV) and wind turbine (WT); P load t is the load demands; and N p v and N w t are the numbers of PV and WT.

2.7. Node Voltage Constraints

In addition, the power flow during normal operation of the power system should meet the basic power-flow relationship, and the node voltage should not exceed the normal range [31]. The details of power flow and node voltage constraints are as follows:
P y t = U y ( t ) i = 1 N n U i t G y i cos σ y i t + B y i sin σ y i ( t ) Q y t = U y t i = 1 N n U i t G y i sin σ y i t B y i cos σ y i t U m i n , i U i t U m a x , i
where P y t and Q y t are the active power and reactive power of node y at time t , respectively; U y ( t ) is the voltage of node y at time t . G y i and B y i is the conductance and susceptance of branch y i , respectively; σ y i is the phase angle difference between node y and node i ; U m i n , i and U m a x , i are the lower and upper limits of nodes voltage; and N n is the number of nodes, respectively.

3. Optimal Scheduling Framework for Hybrid ESS

The optimal scheduling framework for hybrid ESS is a multi-objective optimization model, where the decision variables are the charging and discharging nodes, time and corresponding power of MESS, the charging and discharging nodes, and the power of SESS and the grid power supply. Moreover, the objective function considers the net benefit of scheduling and total voltage deviation.

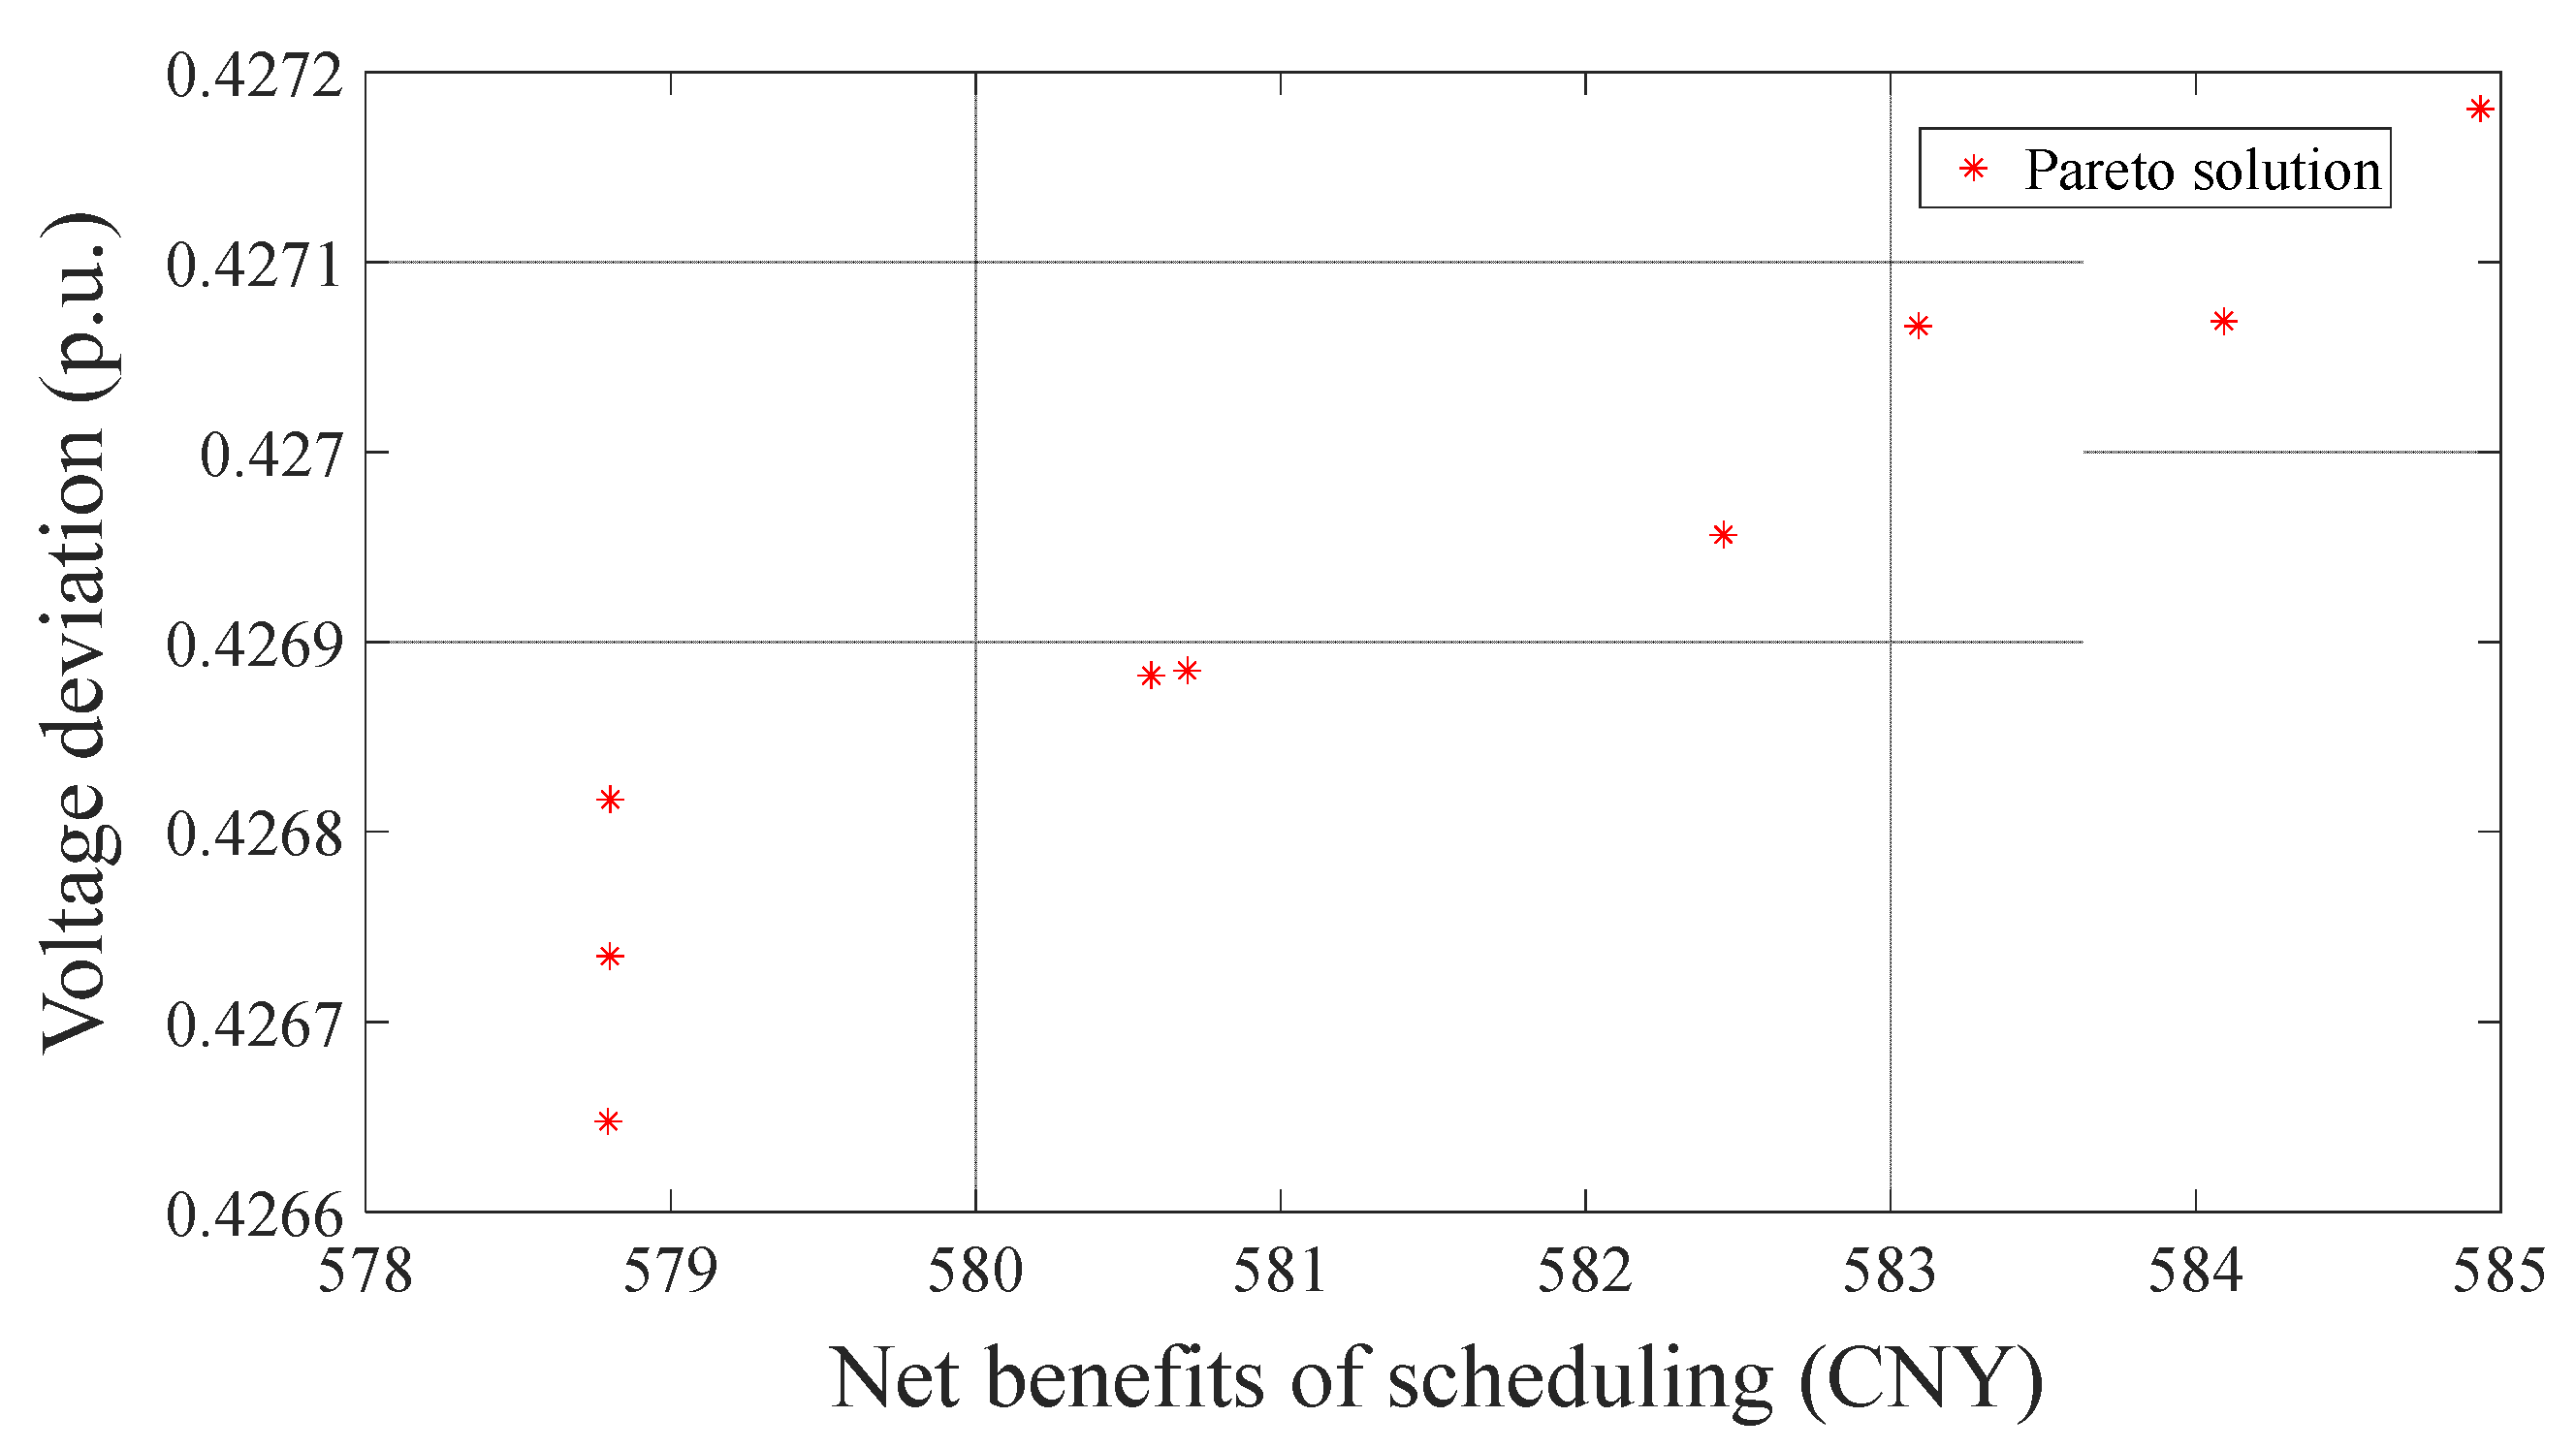
3.1. Net Benefit of Scheduling

The net benefit of scheduling is composed of the arbitrage revenue of BESS, the benefit of reducing network losses, the daily integrated cost of BESS, and MESS driving cost.
m a x F 1 = B d i s + B l o s s C b C d
where F 1 is the net benefit of scheduling; B d i s represents the arbitrage revenue of BESS; B l o s s denotes the benefits of reducing network losses; C b is the battery recession cost; and C d is MESS driving cost.
The details of arbitrage revenue for BESS are as follows:
B d i s = t = 1 T C a = 1 N M E S S D t ( P c h a , a B E S S t + P d i s , a B E S S t )
where P c h a , t o t a l B E S S t and P d i s , t o t a l B E S S t are the total charge and discharge power, respectively; D t is the TOU electricity price.
The benefits of reducing network losses are as follows:
B l o s s = t = 1 T C b = 1 B n [ P l o s s , b 0 t P l o s s , b 1 t ] D t
where P l o s s , b 0 t and P l o s s , b 1 t are the active power loss of the t th branch before and after optimization at time t , respectively; B n represents the number of power grid branches.
A key factor in the operation of BESS is the operating cost, most of which comes from the degradation of the battery under repeated charge and discharge cycles. Different batteries exhibit different degradation behaviors. In this paper, we focus on lithium–ion batteries, which are one of the most popular batteries in practice today. Reference [32] shows that the capacity of lithium manganese oxide batteries is sensitive to the number of cycles and the depth of cyclic discharge, and the marginal cost of lithium batteries is proportional to the depth of discharge. Therefore, this paper uses a linear coefficient to characterize the degree of decline of lithium batteries. The details of battery recession cost are as follows:
C b = λ b t = 1 T C ( | P c h a , a B E S S t | + P d i s , t o t a l B E S S t ) λ b = λ c e l l 10 6 2 N ( S O C m a x S O C m i n )
where λ b is the linearity battery degradation cost factor; λ c e l l is the battery cell price; S O C m a x and S O C m i n are the upper and lower limits of SOC, respectively; and N is the maximum number of cycles.
The expression of the MESS driving cost is as follows:
C d = σ D a D t = 1 T C a = 1 N M E S S D a ( t )
where σ is the cost coefficient of MESS per unit distance; D a is the set of distances traveled by the a th MESS.

3.2. Total Voltage Deviation
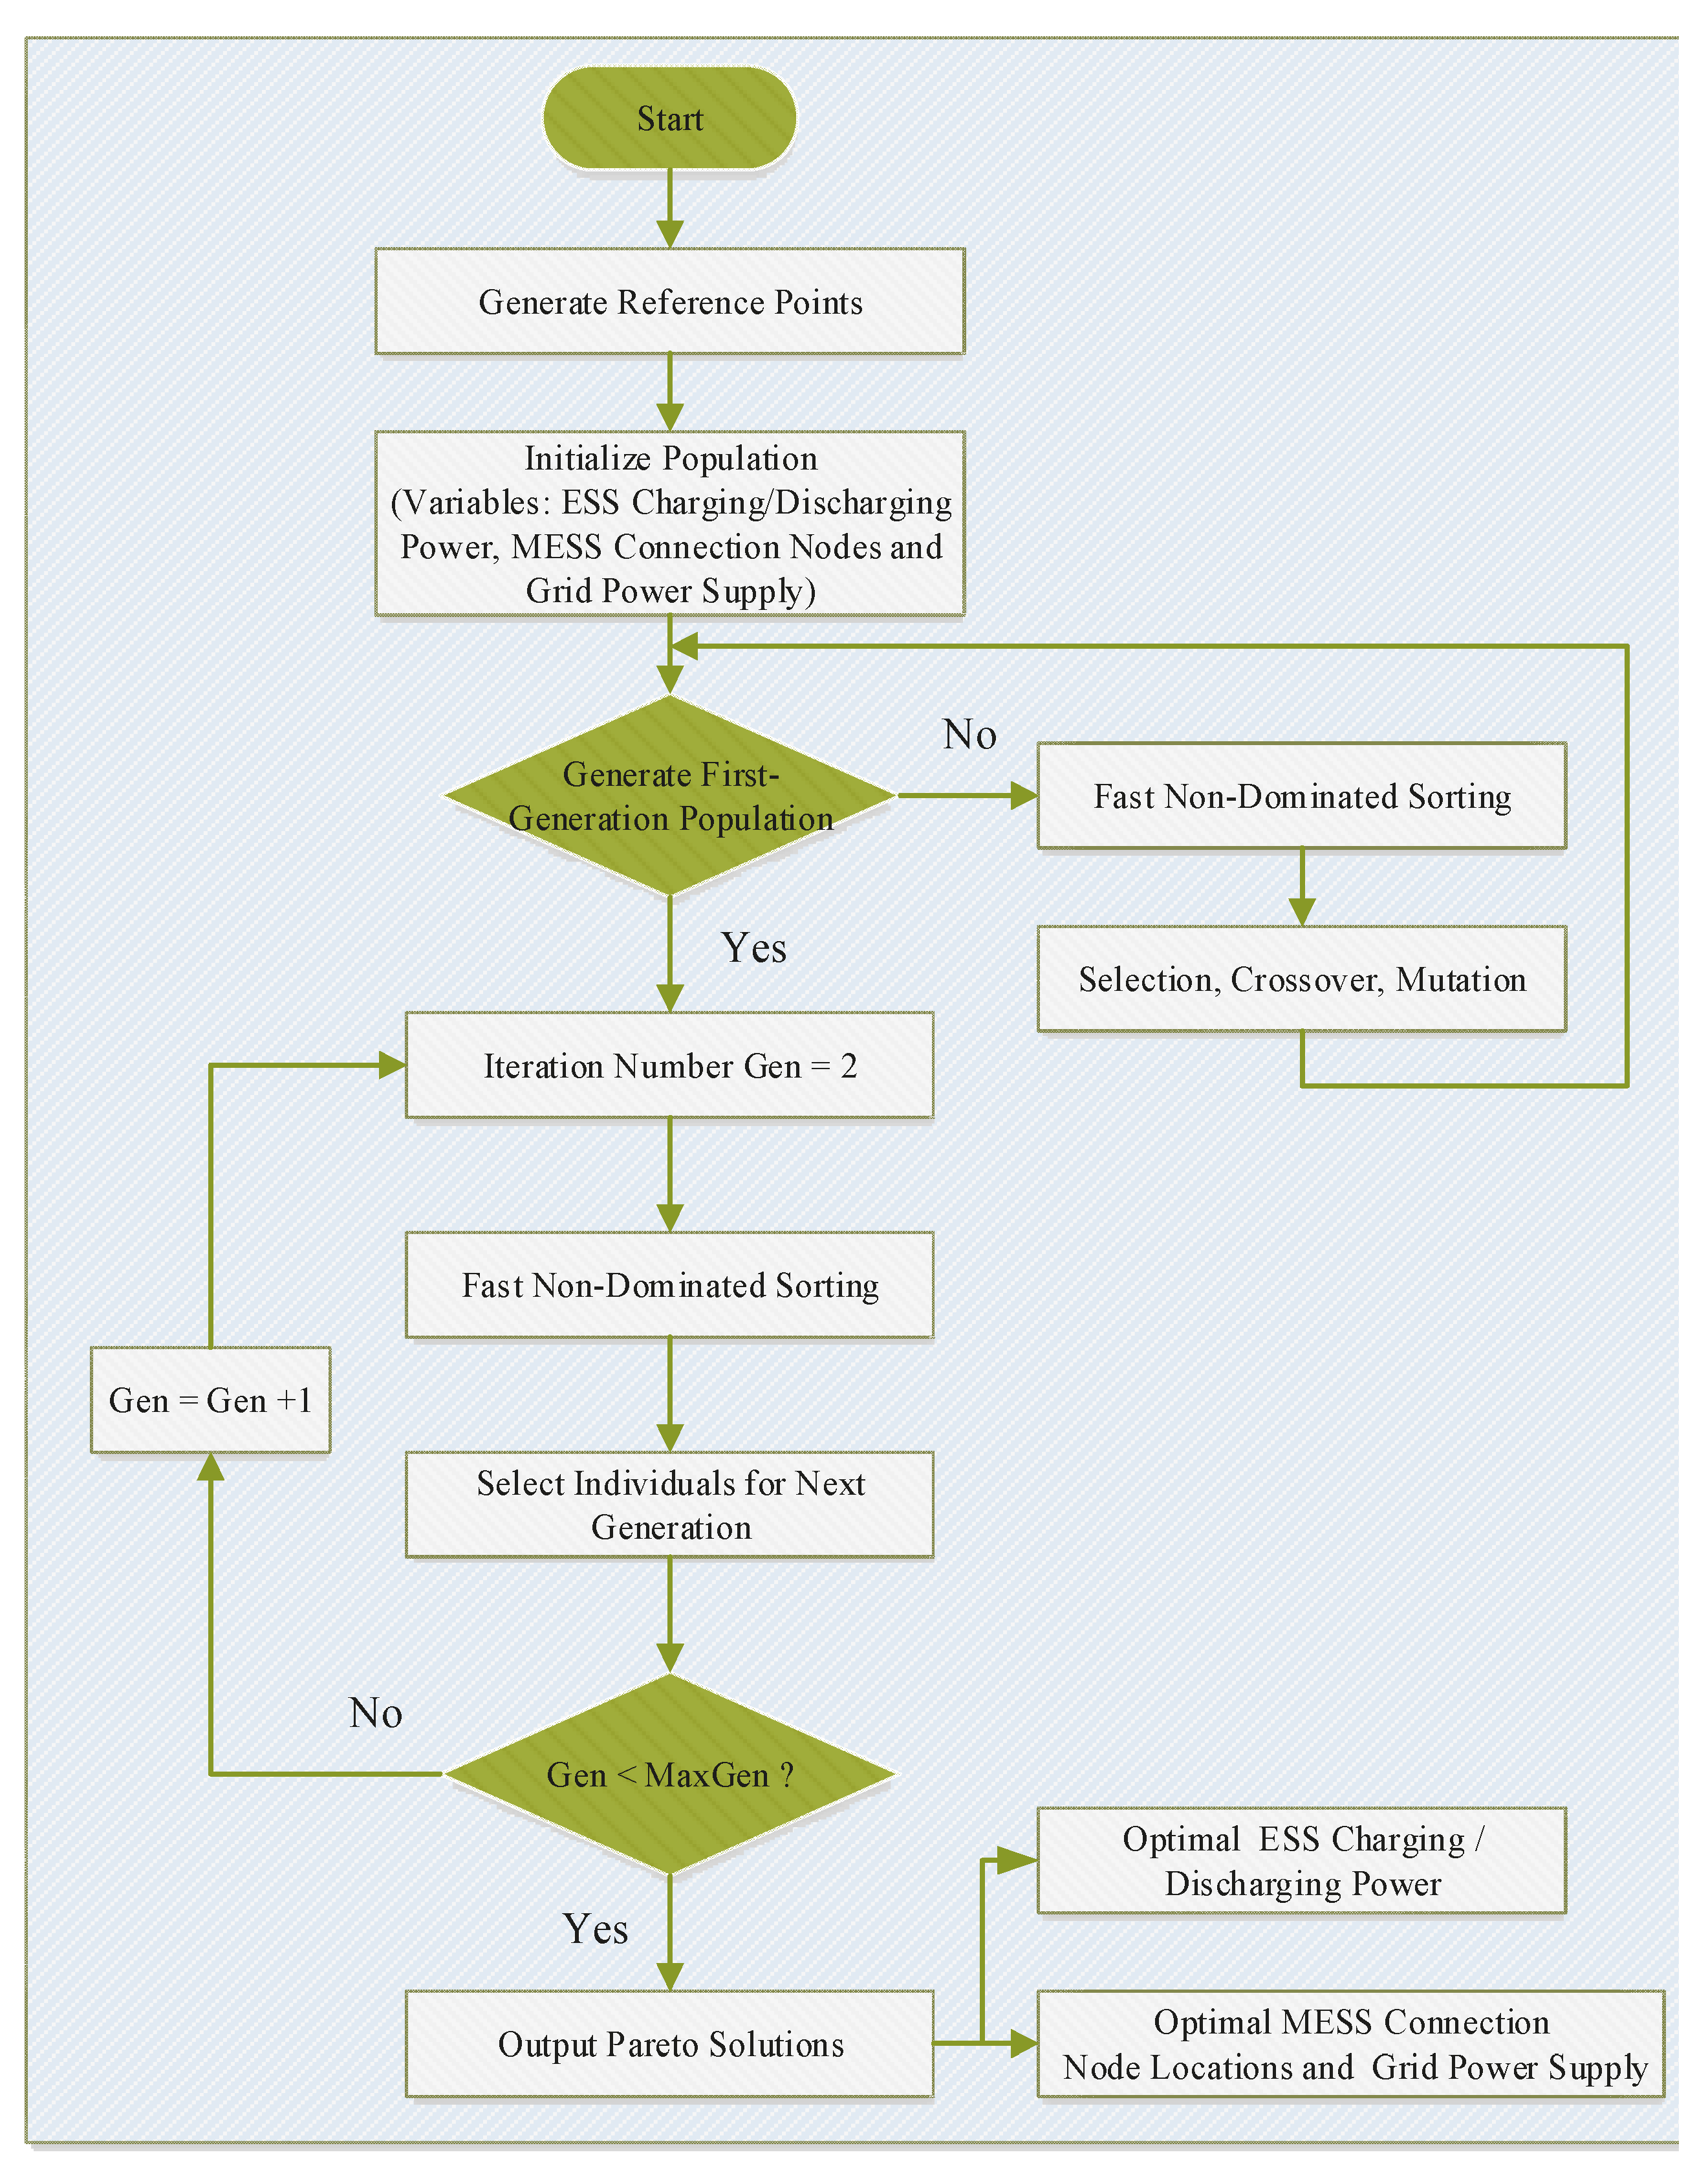
Voltage deviation is one of the key indicators to evaluate system safety and power quality. Therefore, another objective is to minimize the total system voltage deviation, and the details are as follows [33]:
m i n F 2 = 1 T C t = 1 T C   i = 1 N n   U i t U i * t U i , m a x U i , m i n 2
where U i * t is the reference voltage value of node i in time t ; U i , m a x and U i , m i n is set to 1.02 p.u. and 0.95 p.u., respectively.

4. Solution Method

The MESS optimization scheduling model constructed in this paper is a large-scale, multi-objective, and non-linear model. It is difficult to use traditional optimization algorithms to solve this model. NSGA-III is an improved heuristic algorithm, which has the characteristics of fast optimization speed and is hard to fall into a local optimum [34]. NSGA-III is an improvement of the non-dominated sorting genetic algorithm II (NSGA-II). When solving many objective problems, due to the sparse distribution of solutions, NSGA-II is prone to getting stuck in local optima in areas with relatively high distribution density when searching for the optimal solution. The key to preserving the diversity of solutions and jumping out of local optima lies in the selection operation of the genetic algorithm. Furthermore, the main improvements of NSGA-III are listed as follows:
(1)
Multi-level hierarchical sorting: The population is divided into multiple hierarchical levels, each containing solutions of different densities. This hierarchical sorting enables NSGA-III to better maintain uniformly distributed solutions on the Pareto front;
(2)
Adaptive normalization of population individuals: NSGA-III algorithm normalizes the objective function values of each individual through adaptive normalization in order to compare the values between different objectives and determine the relative superiority of individuals in multi-objective optimization;
(3)
Association operation: The association operation can be regarded as a process similar to clustering, which divides the individuals in the population into multiple categories, each of which is defined by the closest reference point. Through this correlation operation, NSGA-III can determine the relative position of each individual in the multi-objective space, which will be used in the subsequent selection process to select the solution to construct the next generation of population. This process helps maintain diversity and better approximate the Pareto front.
(4)
Small habitat preservation operation: Small habitat preservation operation is one of the key mechanisms for maintaining diversity in NSGA-III. The association operation associates each individual with the nearest reference point. Each reference point and its associated individuals form a cluster category, which can be considered as a niche. In selection operations, individuals are usually selected from different small habitats to ensure that the selected solutions have a wide diversity and better approach the Pareto frontier.
Therefore, this paper solves the MESS optimization scheduling model based on the NSGA-III multi-objective optimization algorithm, and the specific solution process is as shown in Figure 3.
Furthermore, according to Figure 3, we set the maximum number of iterations, population size, reference points, crossover percentage, mutation percentage, and mutation rate in the algorithm, which are shown in Table 1.

5. Case Studies

The renewable energy output, load data from typical winter days, and the real transportation network in Dali are applied to conduct a case study analysis to verify the effectiveness of the proposed method in this paper. Moreover, the predicted power output of WT, PV, and the load demand are shown in Figure 4a. Meanwhile, the case studies are conducted under the IEEE-33 standard test system, with specific settings shown in Figure 4b. Furthermore, the basic settings of ESS are shown in Table 2:

5.1. Economic Analysis of Optimizing Scheduling Results

The Pareto solution set obtained by NSGA-III is shown in Figure 5, and the economic results of scheduling are shown in Table 3. Specifically, after a scheduling cycle, the net benefit of the hybrid ESS in DN is CNY 578.80, the total cost is CNY 540.44, and the total revenue is CNY 1119.2. Among them, the battery recession cost accounts for 95.98% of the total cost, and the energy storage arbitrage revenue accounts for 92.5% of the total revenue. From this, it can be seen that the main profit method of ESS is to employ the peak valley electricity price difference for arbitrage. However, the losses caused by repeated charging and discharging of batteries pose a challenge to the profitability of hybrid ESS. Therefore, formulating a reasonable charging and discharging strategy for electric energy storage systems is the key to improving their profitability. In addition, MESS has certain driving costs compared to SESS. Therefore, the profitability of MESS depends on the scientific combination of scheduling strategies on both temporal and spatial scales.
Furthermore, the charging and discharging strategies of the hybrid ESS are shown in Figure 6. Figure 6a shows the SOC variation of ESSs. In addition, Figure 6b shows the time distribution of ESS charging and discharging. All ESSs are charged between 10:00–14:00, during which the SOCs of ESS increase to 0.89, 0.69, and 0.67, respectively. All ESS discharges between 18:00 and 21:00, during which the SOCs of ESS decrease to the original SOC, are 0.1. Specifically, combined with Figure 6 and the TOU electricity price, it can be seen that the hybrid ESS is charged at 10:00–14:00 when the electricity price is low and discharged at 18:00–21:00 when the electricity price is high. In addition, combined with Figure 4 and Figure 6, it can be seen that the hybrid ESS is charged during the low power load demand to consume the excess renewable energy. At the peak of the electric load, the hybrid ESS discharges to fill the energy shortage.
Moreover, the results of path optimization are shown in Figure 7. Specifically, starting from the No. 1 road network node, MESS passes through the No. 4 and No. 10 road network nodes in turn, and finally charges at the No. 11 road network node. Then, MESS passes through the No. 16, No. 18, and No. 19 road network nodes in turn, and finally reaches the No. 20 node discharge. After the discharge, MESS passes through the No. 19, No. 15, No. 12, No. 9, and No. 4 road network nodes in turn to reach the end node No. 1. Combined with Figure 4 and Figure 6, it can be seen that MESS moves to the No. 10 road node to charge to absorb excess renewable energy and prevent voltage from exceeding the limit. On nights with poor PV output power, MESS sets off to discharge the No. 20 road node to support the voltage and fill the power supply gap.

5.2. Reliability Analysis of Optimizing Scheduling Results

This paper mainly analyzes the reliability of the scheduling results from the perspectives of voltage deviation and net load level. As shown in Figure 8, before the optimal scheduling, the voltage range of the system is [0.9616, 1.0105]. After the optimal scheduling, the voltage range of the system is [0.9723, 1.0008]. In summary, after optimizing the scheduling, the voltage of the node with insufficient voltage is increased, and the voltage of the node with higher voltage is reduced, and, finally, the voltage distribution of the system is more concentrated. Moreover, the net load optimization curve is shown in Figure 9. Specifically, before optimization, the peak-valley difference of the net load curve is relatively large, and the optimized net load curve is smoother, thus reducing the impact of load fluctuation on the stability of DN. Furthermore, the power loss of the system before and after optimization is shown in Figure 10. The highest power loss of the system before optimization is 0.07981 MW, and the highest power loss of the system after optimization is 0.0651 MW, with a decrease of 18.42%. Moreover, the total power loss before optimization is 0.963 MW, and the total power loss after optimization is 0.9134 MW, with an overall decrease of 5%.

6. Conclusions

This paper first converts the urban road network in Dali into a mathematical model and constructs a path optimization model for MESS based on the actual road network topology. Subsequently, a hybrid ESS optimization scheduling model integrating MESS and SESS is established, aiming to maximize the scheduling benefits of the hybrid ESS and minimize system voltage deviation. Finally, to validate the effectiveness of the proposed method, typical daily load and renewable energy output data from Dali in winter are selected for case studies, and some main conclusions are obtained as follows:
(1)
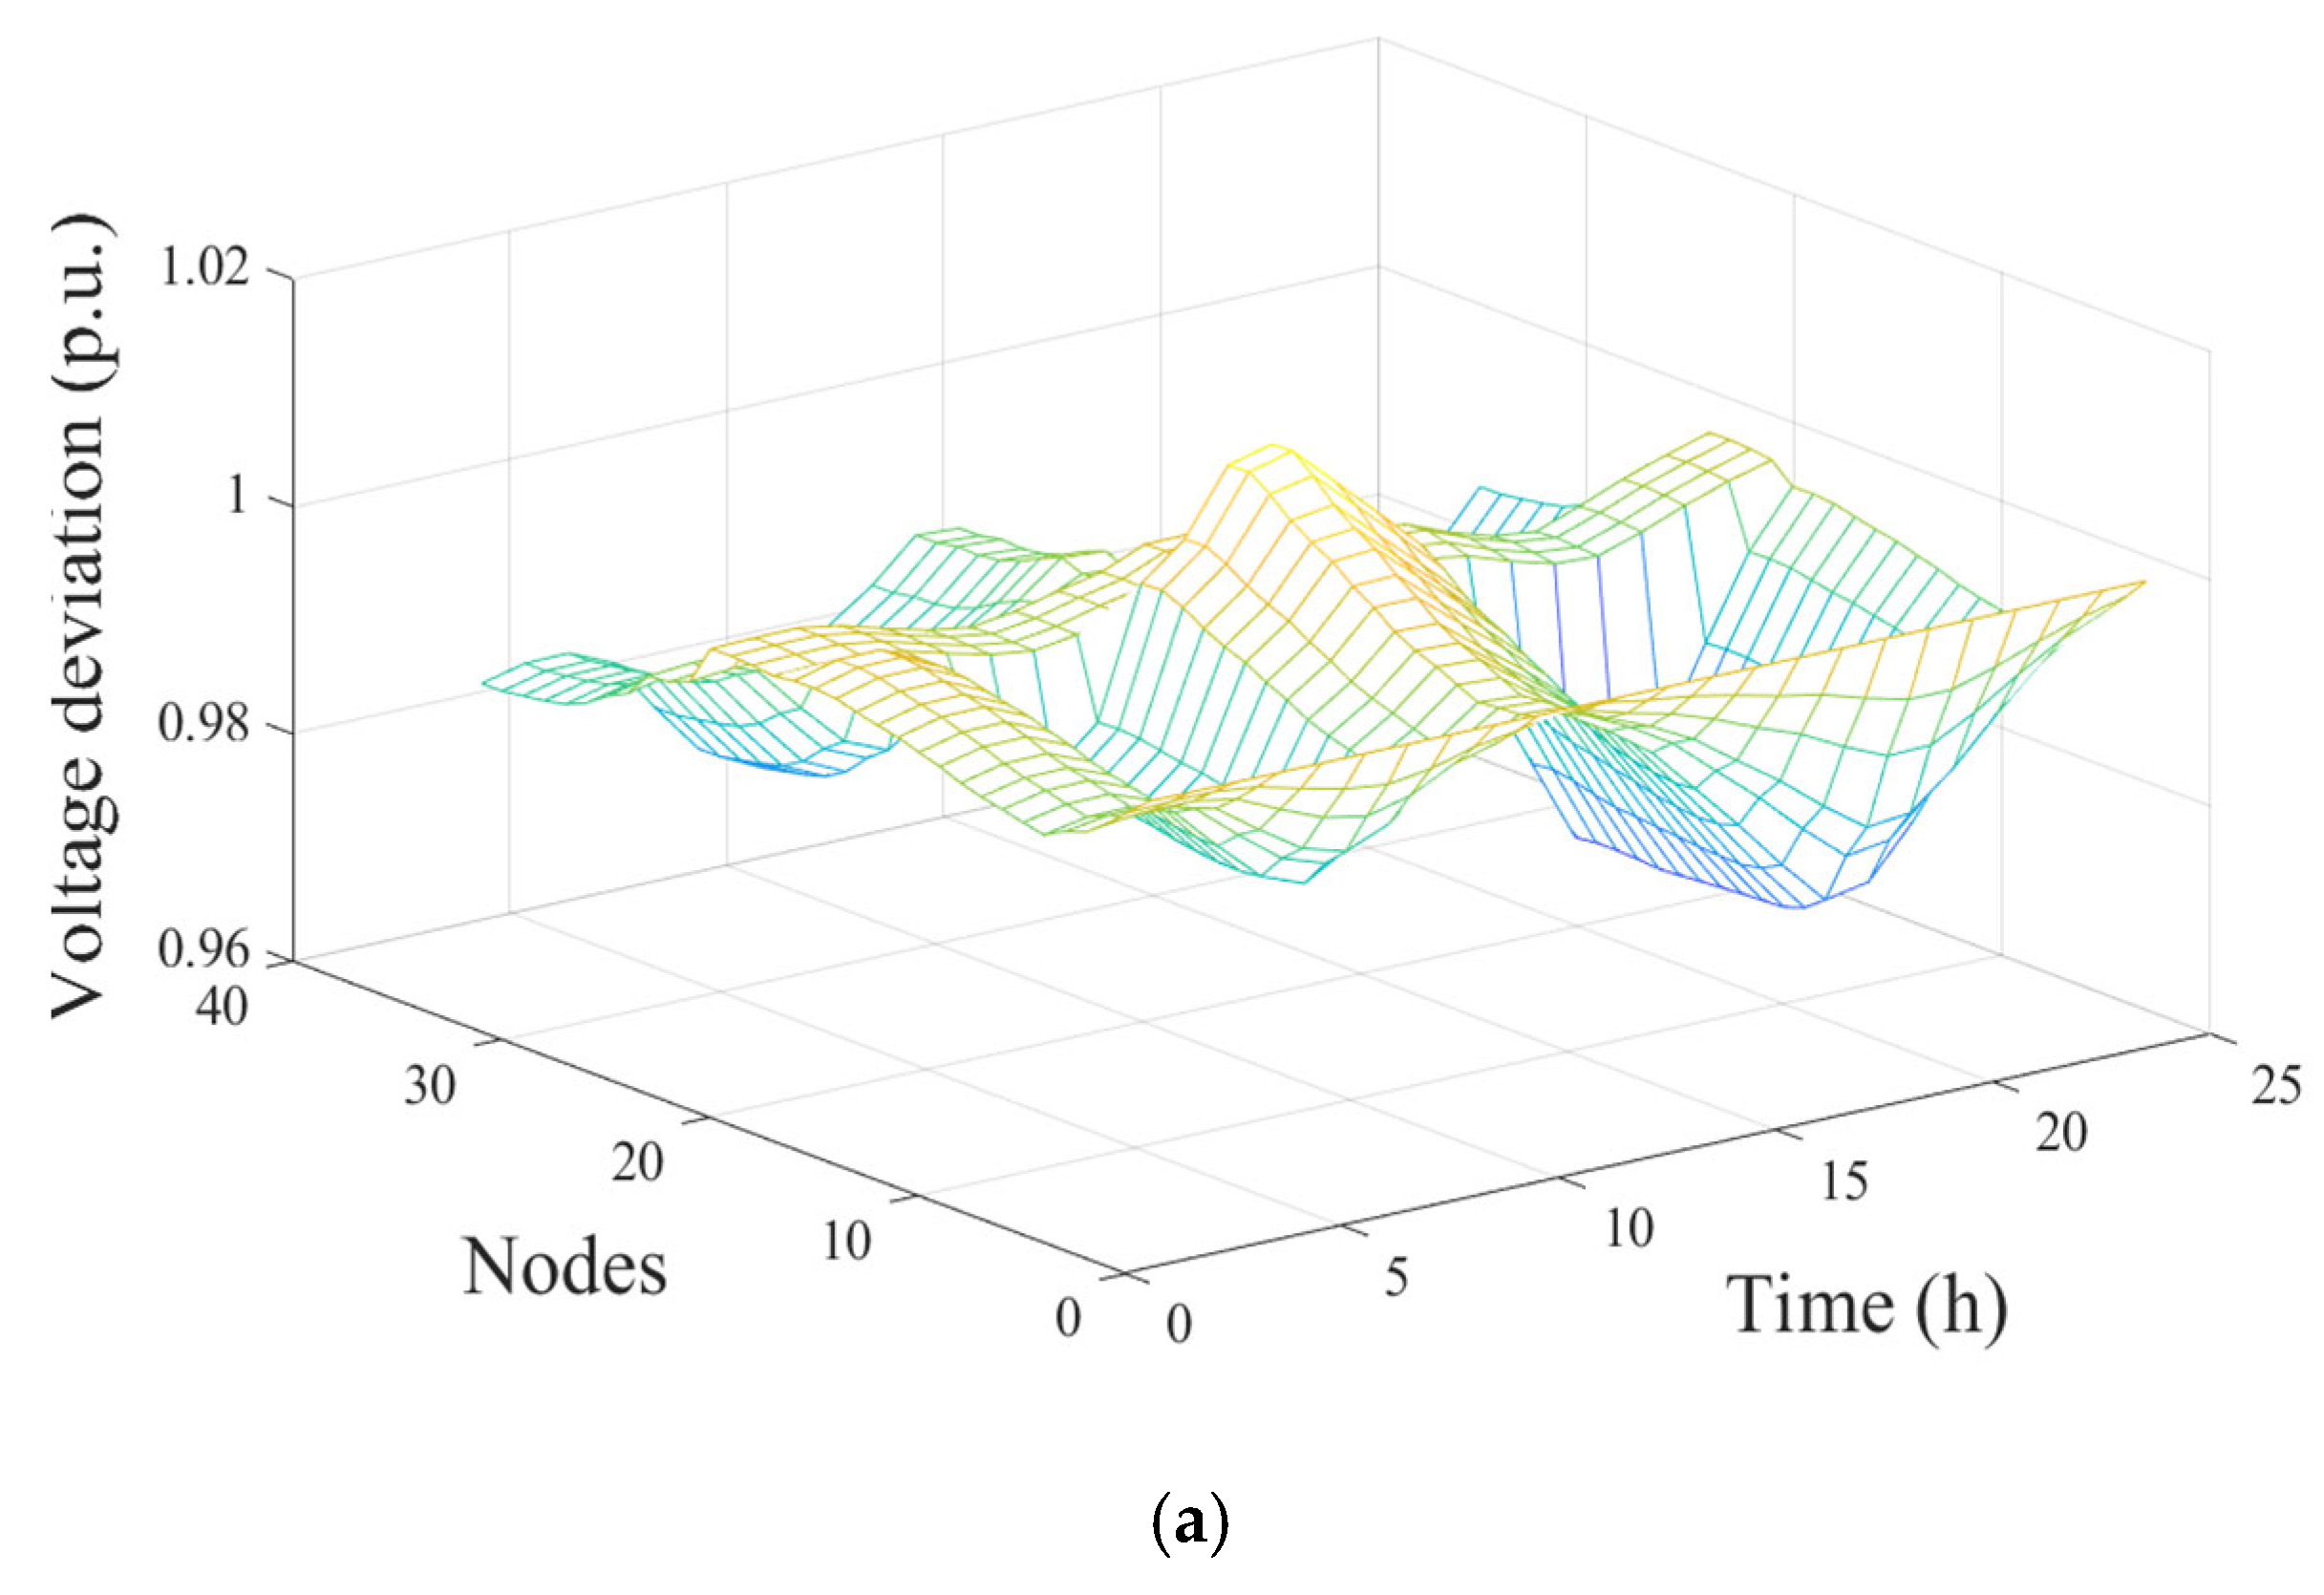
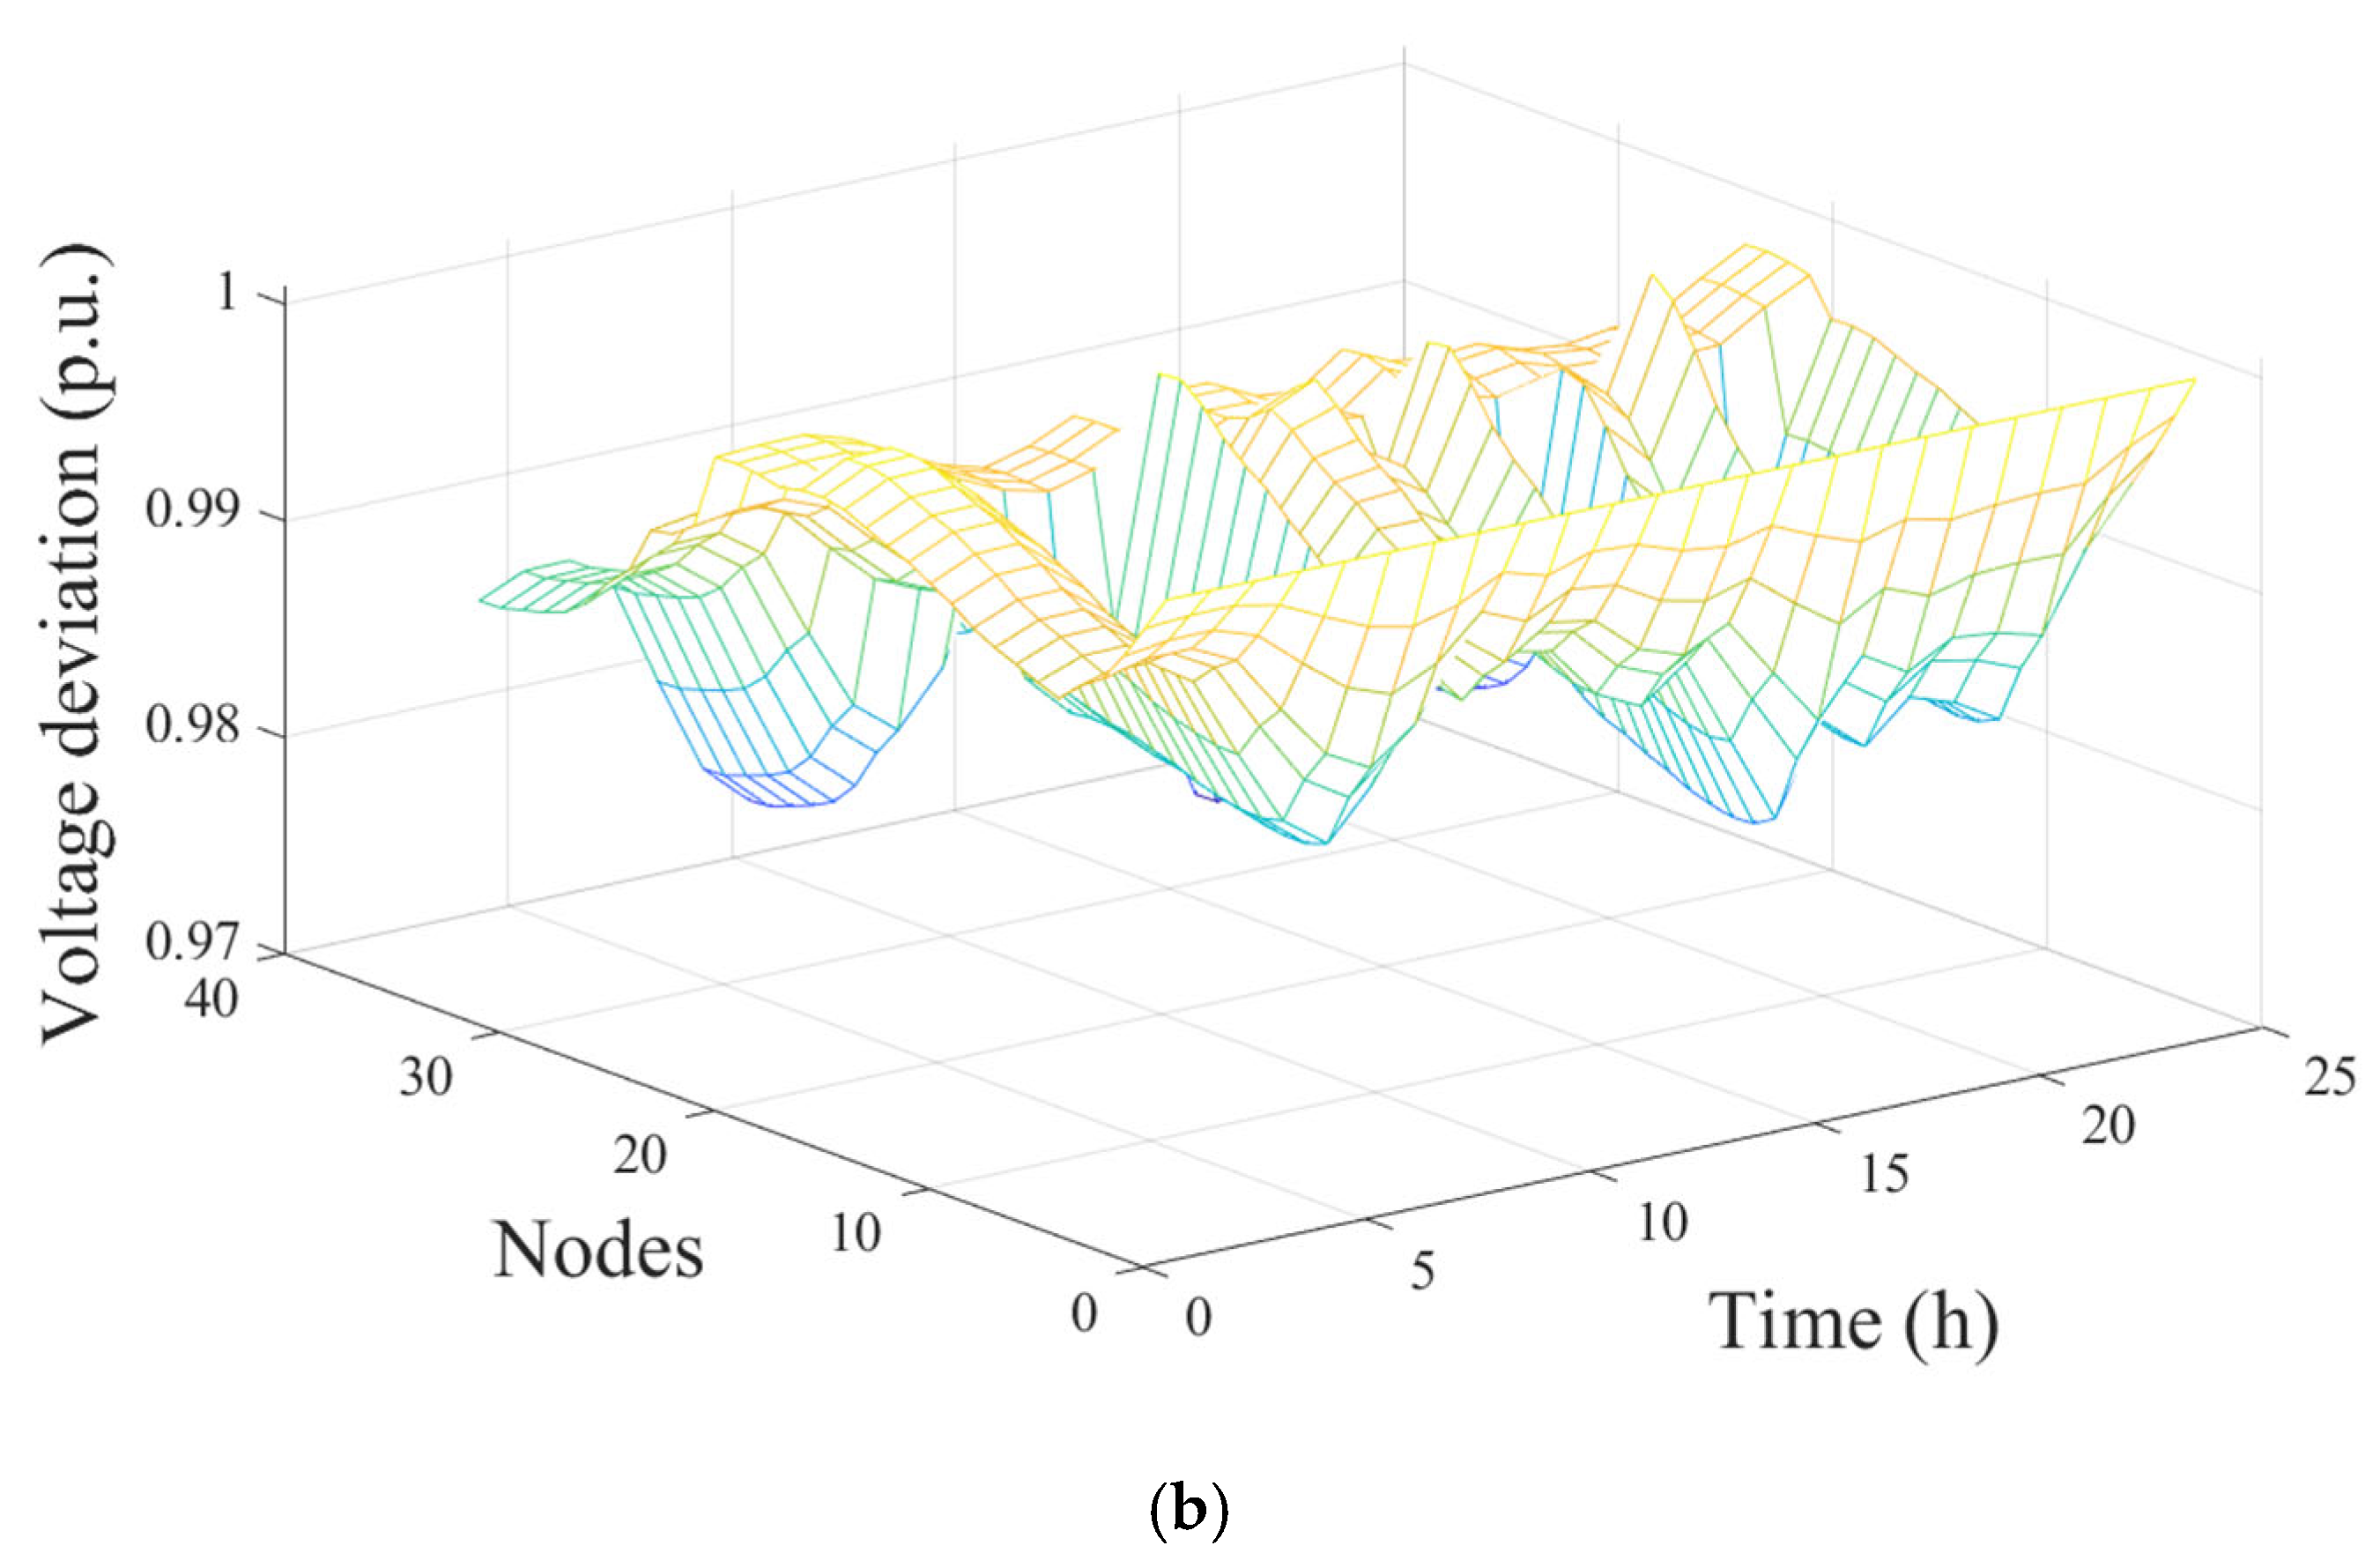
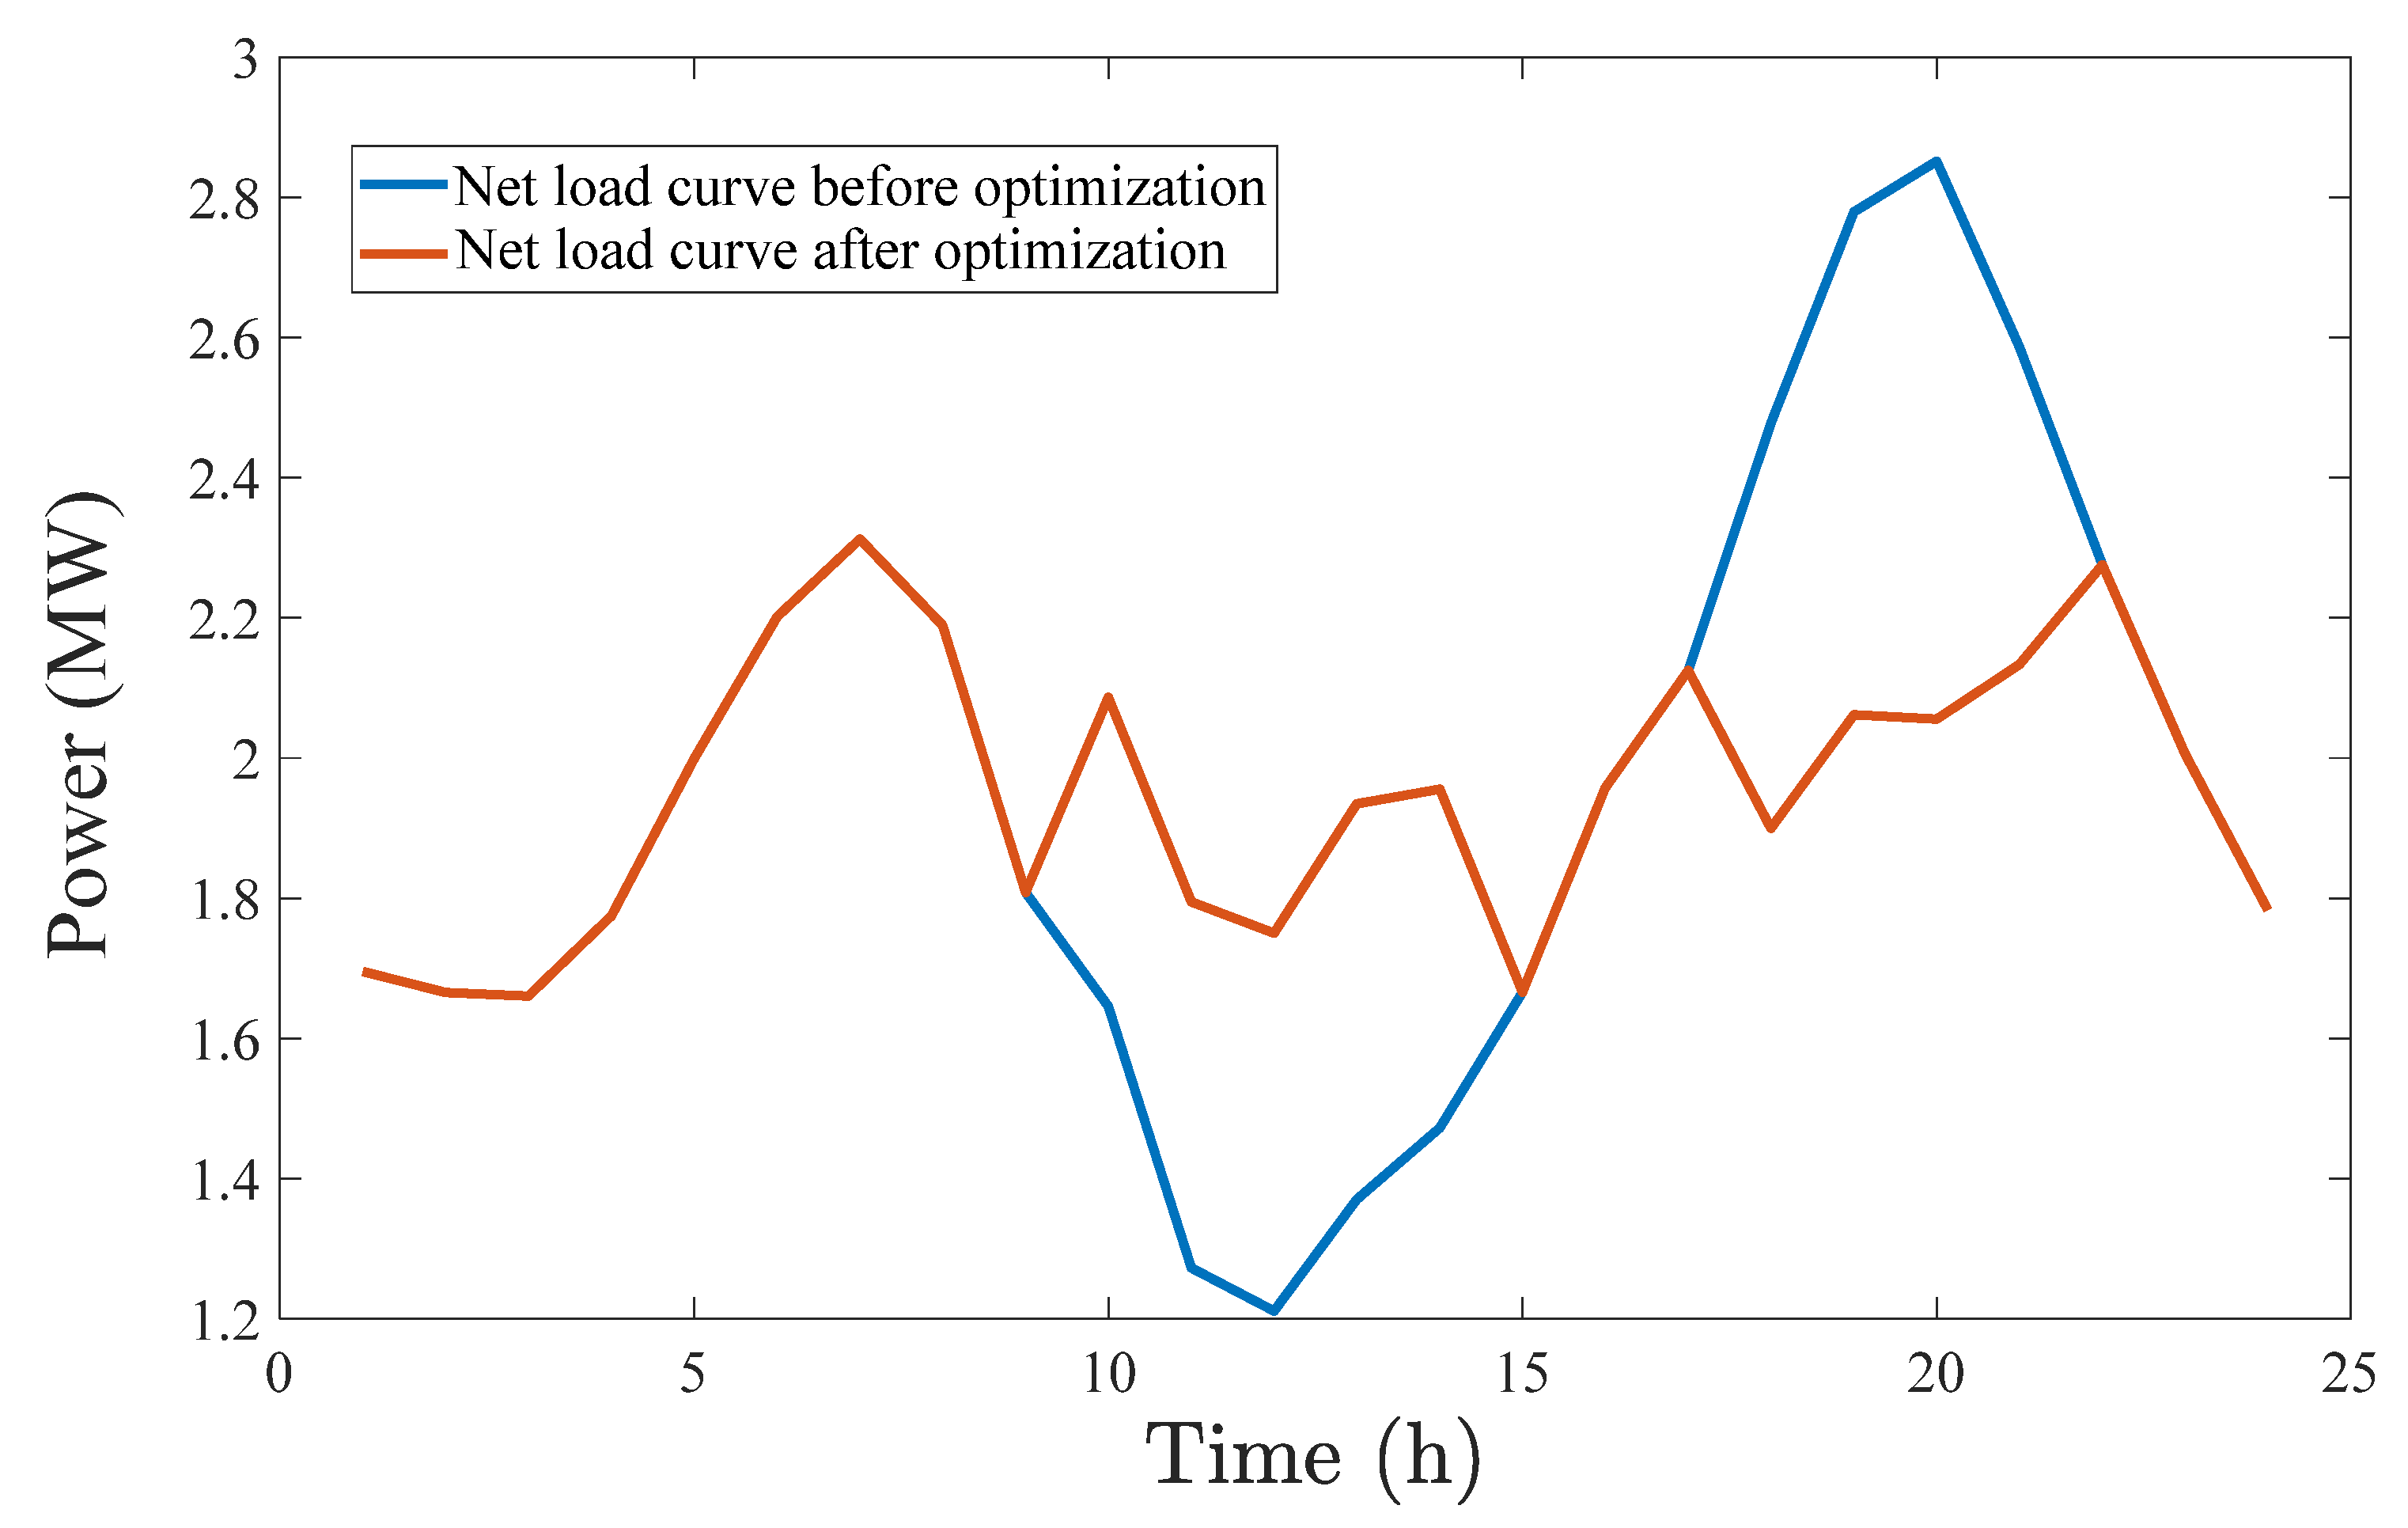
Through coordinated scheduling of MESS and SESS, the net load curve of the DN can be effectively smoothed, the voltage distribution of the system can be improved, and the reliability of the DN is enhanced;
(2)
The profitability of MESS depends on the advantages of the scheduling strategy in spatial scale and time scale. Therefore, efficient ESS charging and discharging optimization strategy and MESS path optimization strategy are the key to improving the income of the hybrid ESS.
The combination of MESS and power grid reconfiguration can effectively deal with the emergency start-up and fault recovery of the power grid after a disaster. Therefore, in future research, we will focus on the combination of MESS optimization scheduling and distribution network reconfiguration.

Author Contributions

Writing—original draft preparation, L.M.; methodology, L.D.; writing—review and editing, J.Z.; software and formal analysis, H.L.; resources, Y.H.; software and formal analysis, X.W. All authors have read and agreed to the published version of the manuscript.

Funding

This work is supported by key technology research and application of county-level digital twin power grid construction for integrated source-network-storage collaborative interaction, a science and technology project of State Grid Henan Electric Power Company Electric Power Science Research Institute (52170224001J).

Data Availability Statement

Data available on request due to restrictions (due to the company’s privacy management).

Conflicts of Interest

The authors declare that they have no known competing financial interests or personal relationships that could have appeared to influence the work reported in this paper. Authors Ling Miao, Li Di, Jian Zhao, Hao Liu, Yurong Hu and Xiaozhao Wei were employed by the State Grid Henan Electric Power Company. The all authors declare that the research was conducted in the absence of any commercial or financial relationships that could be construed as a potential conflict of interest.

Nomenclature

Variables n , m The number of road node
R n m t Road resistance at time t α , β Resistance influence factor
R a n t Road resistance of node n at time t λ The ratio of green light
w n m t The road weights of road n m   at time n w Road weight
E a B E S S t The a th BESS SOC at time t η C , η D The efficiency of charge and discharge
T s t a r t Start time of charge and discharge of MESS E r a t e , a B E S S Rated SOC
T s t o p End time of charge and discharge of MESS P Active power
T t r a Travel time of MESS Q Reactive power
T r e Charge and discharge preparation time of MESS G y i , B y i Conductance and susceptance
P c h a , a B E S S t Charge power of the ath BESS at time t N n Number of grid nodes
P d i s , a B E S S t Discharge power of the a th BESS at time t σ y i Phase angle difference
P grid t The supply power of the grid U m i n , i , U m a x , i The lower and upper limits of nodes voltage
D t TOU electricity price D a The set of distances
P l o s s , b 0 t , P l o s s , b 1 t Power loss after and before optimization σ The cost coefficient of MESS per unit distance
Symbols B d i s The arbitrage revenue
π Road segments set B l o s s The benefits of reducing network losses
D Road distan C b The battery recession cost
U Node voltage set C d MESS driving cost
H Traffic flows set N M E S S Number of MESS
T Time periods set λ b linearity battery degradation cost factor
V Driving speed set λ c e l l The battery cell price
S Road congestion set U i * The reference voltage value
G The dynamic traffic set i , y The number of grid node
a Road node S O C m a x , S O C m i n Upper and lower limits of SOC
N The maximum number of cycles

Abbreviations

BESSBattery energy storage system
DNDistribution network
ESSEnergy storage system
EVElectric vehicle
MESSMobile energy storage system
NSGA-IIINon-dominated sorting genetic algorithm III
NSGA-IINon-dominated sorting genetic algorithm II
PVPhotovoltaic
SESSStationary energy storage system
SOCState of charge
TOUTime of use
WTWind turbine

References

  1. Yang, B.; Yu, L.; Chen, Y.; Ye, H.; Shao, R.; Shu, H.; Yu, T.; Zhang, X.; Sun, L. Modelling, applications, and evaluations of optimal sizing and placement of distributed generations: A critical state-of-the-art survey. Int. J. Energy Res. 2021, 45, 3615–3642. [Google Scholar] [CrossRef]
  2. He, X.; Tang, Y.; Ma, S.; Ai, Q.; Tao, F.; Qiu, R. Redefinition of Digital Twin and Its Situation Awareness Framework Designing Toward Fourth Paradigm for Energy Internet of Things. IEEE Trans. Syst. Man Cybern. Syst. 2024, 54, 6873–6888. [Google Scholar] [CrossRef]
  3. Yang, B.; Li, J.; Shu, H.; Cai, Z.; Tang, B.; Huang, X.; Zhu, M. Recent advances of optimal sizing and location of charging stations: A critical overview. Int. J. Energy Res. 2022, 46, 17899–17925. [Google Scholar] [CrossRef]
  4. Li, J.; Yang, B.; Huang, J.; Guo, Z.; Wang, J.; Zhang, R.; Hu, Y.; Shu, H.; Chen, Y.; Yan, Y. Optimal planning of electricity hydrogen hybrid energy storage system considering demand response in active distribution network. Energy 2023, 273, 127142. [Google Scholar] [CrossRef]
  5. Hu, Y.; Yang, B.; Wu, P.; Wang, X.; Li, J.; Huang, Y.; Su, R.; He, G.; Yang, J.; Su, S.; et al. Optimal planning of electric-heating integrated energy system in low-carbon park with energy storage system. J. Energy Storage 2024, 99, 113327. [Google Scholar] [CrossRef]
  6. Yang, B.; Wang, J.; Chen, Y.; Li, D.; Zeng, C.; Chen, Y.; Guo, Z.; Shu, H.; Zhang, X.; Yu, T.; et al. Optimal sizing and placement of Energy storage system in power grids: A state-of-the-art one-stop handbook. J. Energy Storage 2020, 32, 101814. [Google Scholar] [CrossRef]
  7. He, X.; Ai, Q.; Wang, J.; Tao, F.; Pan, B.; Qiu, R.; Yang, B. Situation awareness of energy internet of things in smart city based on digital twin: From digitization to informatization. IEEE Internet Things J. 2023, 10, 7439–7458. [Google Scholar] [CrossRef]
  8. Elalfy, D.A.; Gouda, E.; Kotb, M.F.; Bureš, V.; Sedhom, B.E. Comprehensive review of energy storage systems technologies, objectives, challenges, and future trends. Energy Strategy Rev. 2024, 54, 101482. [Google Scholar] [CrossRef]
  9. Wu, T.; Zhuang, H.; Huang, Q.; Xia, S.; Zhou, Y.; Gan, W.; Terzić, J.S. Routing and scheduling of mobile energy storage systems in active distribution network based on probabilistic voltage sensitivity analysis and Hall’s theorem. Appl. Energy 2025, 386, 125535. [Google Scholar] [CrossRef]
  10. Benedetto, G.; Bompard, E.; Mazza, A.; Pons, E.; Jaboeuf, R.; Tosco, P.; Zampolli, M. Impact of bidirectional EV charging stations on a distribution network: A Power Hardware-In-the-Loop implementation. Sustain. Energy Grids Netw. 2023, 35, 101106. [Google Scholar] [CrossRef]
  11. Qiao, J.; Mi, Y.; Shen, J.; Xia, D.; Li, D.; Wang, P. Active and reactive power coordination optimization for active distribution network considering mobile energy storage system and dynamic network reconfiguration. Electr. Power Syst. Res. 2025, 238, 111080. [Google Scholar] [CrossRef]
  12. Yan, X.; Gao, C.; Francois, B. Multi-objective optimization of a virtual power plant with mobile energy storage for a multi-Stakeholders energy community. Appl. Energy 2025, 386, 125553. [Google Scholar] [CrossRef]
  13. Wang, Y.; Qiu, D.; Strbac, G. Multi-agent deep reinforcement learning for resilience-driven routing and scheduling of mobile energy storage systems. Appl. Energy 2022, 310, 118575. [Google Scholar] [CrossRef]
  14. Lu, Z.; Xu, X.; Yan, Z.; Shahidehpour, M. Routing and scheduling of mobile energy storage in coupled transportation and power distribution networks. IEEE Trans. Transp. Electrif. 2022, 8, 2583–2594. [Google Scholar] [CrossRef]
  15. Nazemi, M.; Dehghanian, P.; Lu, X.; Chen, C. Uncertainty-aware deployment of mobile energy storage systems for distribution grid resilience. IEEE Trans. Smart Grid 2021, 12, 3200–3214. [Google Scholar] [CrossRef]
  16. He, G.; Michalek, J.; Kar, S.; Chen, Q.; Zhang, D.; Whitacre, J.F. Utility-scale portable energy storage systems. Joule 2020, 5, 379–392. [Google Scholar] [CrossRef]
  17. Hu, S.; Liao, K.; Yang, J.; Li, B.; Yang, W. Power supply restoration strategy of urban power grid based on V2G technology. Electr. Power Autom. Equip. 2023, 43, 53–61. [Google Scholar]
  18. Yan, N.; Ma, G.; Li, X.; Ma, S. Low-carbon economic dispatch method of park integrated energy system considering cross-seasonal energy storage. High Volt. Eng. 2023, 49, 4182–4191. [Google Scholar]
  19. Xiao, Q.; Yang, K.; Song, Z. Scheduling strategy of industrial parks integrated energy system considering carbon trading and electric vehicle charging load. High Volt. Eng. 2023, 49, 1392–1401. [Google Scholar]
  20. Shen, Y.; Qian, T.; Li, W.; Zhao, W.; Tang, W.; Chen, X.; Yu, Z. Mobile energy storage systems with spatial–temporal flexibility for post-disaster recovery of power distribution systems: A bilevel optimization approach. Energy 2023, 282, 128300. [Google Scholar] [CrossRef]
  21. Meng, H.; Jia, H.; Xu, T.; Wei, W.; Wu, Y.; Liang, L.; Cai, S.; Liu, Z.; Wang, R.; Li, M. Optimal configuration of cooperative stationary and mobile energy storage considering ambient temperature: A case for Winter Olympic Game. Appl. Energy 2022, 325, 119889. [Google Scholar] [CrossRef]
  22. Ganivada, P.K.; El-Fouly, T.H.; Zeineldin, H.H.; Al-Durra, A. Optimal siting and sizing of mobile-static storage mix in distribution systems with high renewable energy resources penetration. Electr. Power Syst. Res. 2024, 226, 109860. [Google Scholar] [CrossRef]
  23. Li, Z.; Cai, Y.; Tang, X.; Cao, Y.; Zhou, Z.; Zhou, T. Collaborative optimization strategy of mobile energy storage devices and distribution network reconfiguration for power loss reduction scenarios. Electr. Power Constr. 2023, 44, 137–148. [Google Scholar]
  24. Wang, D.; Guo, J.; Zhang, Y.; Zhong, Q.; Xu, H. Optimizing expressway battery electric vehicle charging and mobile storage energy truck scheduling: A two-stage approach to improve photovoltaic generation utilization. Energy 2025, 320, 135145. [Google Scholar] [CrossRef]
  25. Shamani, M.; Foroud, A.; Rastgoo, R. Optimal routing and scheduling of mobile charging station considering operational limitations of energy sources in distribution system. J. Energy Storage 2025, 117, 116135. [Google Scholar] [CrossRef]
  26. He, B.; Yang, B.; Han, Y.; Zhou, Y.; Hu, Y.; Shu, H.; Su, S.; Yang, J.; Huang, Y.; Li, J.; et al. Optimal EVCS planning via spatial-temporal distribution of charging demand forecasting and traffic-grid coupling. Energy 2024, 313, 133885. [Google Scholar] [CrossRef]
  27. Yu, T.; Ma, J. A review of the link traffic time estimation of urban traffic. In Proceedings of the IEEE International Conference on Intelligent Transportation Engineering (ICITE), Singapore, 20–22 August 2016; pp. 123–127. [Google Scholar]
  28. Zhou, Y.; Yang, B.; Hu, Y.; He, P.; Zhou, G.; Li, J. Electricity-Heat-Gas Collaborative Low-Carbon Optimal Dispatch of Multi-Energy Complementary Integrated Energy System Considering Green Certificate and Carbon Emission Trading. Power Syst. Technol. Available online: https://doi.org/10.13335/j.1000-3673.pst.2024.0551 (accessed on 10 March 2025).
  29. Chen, M.; Lu, Z.; Liu, Y.; Ding, Z.; Rao, H.; Bao, G.; Lu, C. Research on optimal peak load shifting strategy of battery energy storage system operated in constant power mode. Power Syst. Technol. 2012, 36, 232–237. [Google Scholar]
  30. Tang, B.; Shi, Q.; Chen, Y.; Zhao, X.; Yang, P.; Lai, X.; Muyeen, S. Co-planning of network-load-storage to enhance the power-balancing capability of active distribution networks. Electr. Power Syst. Res. 2025, 246, 111723. [Google Scholar] [CrossRef]
  31. Miguel, P.C. Power sharing and voltage regulation control for grid forming of future distribution circuits with multiple voltage references. Electr. Power Syst. Res. 2025, 246, 111668. [Google Scholar]
  32. Shi, Y.; Xu, B.; Wang, D.; Zhang, B. Using battery storage for peak shaving and frequency regulation: Joint optimization for superlinear gains. IEEE Trans. Power Syst. 2017, 33, 2882–2894. [Google Scholar] [CrossRef]
  33. Xu, Z.; Tang, Z.; Chen, Y.; Liu, Y.; Gao, H.; Xu, X. Optimal robust allocation of distributed modular energy storage system in distribution networks for voltage regulation. Appl. Energy 2025, 388, 125625. [Google Scholar] [CrossRef]
  34. Li, Y.; Zhou, S.; Liu, J.; Tong, J.; Dang, J.; Yang, F.; Ouyang, M. Multi-objective optimization of the Atkinson cycle gasoline engine using NSGA III coupled with support vector machine and back-propagation algorithm. Energy 2023, 262, 125262. [Google Scholar] [CrossRef]
Figure 1. Schematic diagram of road topology.
Processes 13 01492 g001
Figure 2. Optimization framework of MESS driving path.
Processes 13 01492 g002
Figure 3. Solution process of hybrid ESS optimization scheduling model based on NSGA-III.
Processes 13 01492 g003
Figure 4. Basic settings of case studies (a) electrical load and WT, PV output prediction curves; (b) configuration of units in IEEE-33 standard test system.
Processes 13 01492 g004
Figure 5. Schematic diagram of Pareto set.
Processes 13 01492 g005
Figure 6. Charging and discharging strategy of hybrid ESS (a) schematic diagram of SOC changes in MESS and SESS; (b) schematic diagram of charging and discharging.
Processes 13 01492 g006
Figure 7. Schematic diagram of MESS driving path.
Processes 13 01492 g007
Figure 8. Voltage deviation of each node before and after optimal scheduling (a) voltage deviation diagram before optimal scheduling; (b) voltage deviation diagram after optimal scheduling.
Processes 13 01492 g008aProcesses 13 01492 g008b
Figure 9. Comparison of net load curve optimization results.
Processes 13 01492 g009
Figure 10. Comparison of power loss before and after optimization.
Processes 13 01492 g010
Table 1. The settings of NSGA-III algorithm.
ParametersValue
Maximum number of iterations600
Population size500
Reference points15
Crossover percentage0.5
Mutation percentage0.5
Mutation rate0.2
Table 2. The settings of hybrid ESS.
ParametersSymbolValue
MESS#1SESS#1SESS#2
Rated power (kW) P r a t e , a B E S S 260300300
Rated capacity (kW*h) E r a t e , a B E S S 100015001500
Initial SOC/0.10.10.1
Maximum/Minimum SOC S O C m a x / S O C m i n 0.9/0.10.9/0.10.9/0.1
Maximum number of charge and discharge N 500050005000
Unit iron core price (CNY/(W*h)) λ c e l l 0.60.60.6
The cost coefficient of MESS per unit distance (CNY/km) σ 1.6//
TOU price (CNY/kW*h)Peak price/0.71 (18:00–22:00)
Standard price/0.51 (5:00–9:00, 14:00–18:00, 22:00–24:00)
Valley price/0.31 (1:00–5:00, 9:00–14:00)
Table 3. Economic results of scheduling.
Net Benefits of Scheduling (CNY)Arbitrage Revenue (CNY)Benefits of Reducing Network Losses (CNY)Driving Cost (CNY)Battery Recession Cost (CNY)
578.801035.2184.0121.74518.70
Disclaimer/Publisher’s Note: The statements, opinions and data contained in all publications are solely those of the individual author(s) and contributor(s) and not of MDPI and/or the editor(s). MDPI and/or the editor(s) disclaim responsibility for any injury to people or property resulting from any ideas, methods, instructions or products referred to in the content.

