Article

Analysis of Waterflooding Oil Recovery Efficiency and Influencing Factors in the Tight Oil Reservoirs of Jilin Oilfield

1
School of Petroleum Engineering, Yangtze University, Wuhan 430100, China
2
Key Laboratory of Drilling and Production Engineering for Oil and Gas, Yangtze University, Wuhan 430100, China
3
Department of Petroleum Engineering, China University of Petroleum (East China), Qingdao 266580, China
*
Author to whom correspondence should be addressed.
Processes 2025, 13(5), 1490; https://doi.org/10.3390/pr13051490
Submission received: 31 March 2025 / Revised: 6 May 2025 / Accepted: 11 May 2025 / Published: 13 May 2025
(This article belongs to the Special Issue Recent Developments in Enhanced Oil Recovery (EOR) Processes)

Abstract

:
During the waterflooding recovery process, water is injected into the hydrocarbon reservoirs and displaces a portion of the oil and gas, thereby improving oil and gas recovery rates and extending the production life of the reservoir. The macro benefits of waterflooding technology are widely recognized; however, the micro-scale effects of water on the reservoir’s pore structure and fluid distribution during the injection process remain underexplored. Therefore, this study aims to analyze the micro-distribution characteristics of fluids in the reservoir during the oil–water displacement process. To further investigate the micro-mechanisms of waterflooding recovery and the factors influencing recovery efficiency, the study focuses on the impact of permeability, pressure gradient, injection volume, and reverse displacement on oil recovery efficiency. A combined qualitative and quantitative analysis approach was employed, using techniques such as nuclear magnetic resonance (NMR), CT scanning, and fluid distribution tomography to comprehensively analyze the fluid evolution patterns within the reservoir. The results show the following: (1) The movable fluids in the oilfield are primarily distributed within pores ranging from 0.1 to 40 μm; the remaining oil is mainly distributed within pores of 0.1 to 10 μm, accounting for over 85% of the total distribution, and these pores serve as the main space for extracting remaining oil in later stages. (2) Increasing the injection volume significantly improves the oil recovery efficiency in pores ranging from 0.1 to 10 μm. Increasing the displacement pressure gradient effectively reduces remaining oil in pores of 0.1 to 5 μm. However, for reservoirs with permeability greater than 10 mD, once the injection volume exceeds 1 PV or the displacement pressure gradient exceeds 1.8 MPa/m, the increase in oil recovery efficiency becomes marginal. (3) With increasing water injection multiples, the oil displacement efficiency of cores with varying permeability levels shows an overall upward trend. However, the extent of improvement varies significantly, with low-permeability cores exhibiting a markedly greater enhancement in displacement efficiency compared to high-permeability cores. (4) Reverse displacement can reduce the remaining oil in pores ranging from 0.1 to 10 μm, and the increase in oil recovery efficiency is more significant in cores with lower permeability than in those with higher permeability. Therefore, increased production cannot solely rely on improving the production pressure differential to develop remaining oil.

1. Introduction

In recent years, the study of low-permeability to ultra-low-permeability hydrocarbon reservoirs, as well as tight sandstone oil and gas, has become a hot topic in the field of petroleum extraction. Research on low-permeability reservoirs primarily focuses on the microscopic pore structure characteristics of the reservoirs and the behavior of movable fluids. Movable oil refers to the oil that can flow within a reservoir and be partially produced under specific oil recovery conditions. It is a critical parameter in reservoir evaluation [1,2,3]. The study of the microscopic pore structure of low-permeability to ultra-low-permeability hydrocarbon reservoirs began as early as the 1930s. Scholars used capillary pressure measurements to quantitatively analyze pore and throat characteristics, addressing numerous practical problems in the process. Purcell developed a model for calculating relative permeability based on the mercury injection method 3. Subsequently, Pirson and Boatman, as well as Brooks and Corey, proposed empirical formulas correlating capillary pressure with relative permeability [4,5]. Core nuclear magnetic resonance (NMR) experiments and capillary pressure measurements both characterize pore size distributions and evaluate pore structure, indicating an intrinsic connection between the two methods. Numerous scholars noted that T2 relaxation time correlates well with pore-throat size distribution obtained from mercury injection experiments [6,7,8]. Through appropriate conversion factors, the two can be interconverted. Currently, oil saturation studies typically rely on laboratory core analysis methods. However, traditional methods cannot directly determine the movable oil saturation in cores, making this a critical issue that requires urgent resolution.
Low-permeability oil reservoirs generally exhibit low recovery efficiency and face numerous challenges compared to medium- and high-permeability oilfields. These challenges are primarily reflected in two aspects: First, the low porosity and permeability of the reservoir lead to high flow resistance and poor pressure transmission capability, resulting in a slow replenishment rate of natural formation energy [9,10,11]. As a result, oil wells exhibit low natural productivity, and production declines rapidly after commissioning when relying solely on natural energy, leading to lower recovery rates. Under typical conditions, medium- and high-permeability oilfields can achieve recovery rates of 30–40% with water flooding, whereas low-permeability reservoirs achieve only about 22% [12]. More critically, as formation pressure decreases and production declines, restoring the formation pressure becomes extremely challenging, further compromising the sustainability of oilfield development [13]. Second, due to the small average pore-throat radius and poor sorting in the reservoir, the reservoir is highly susceptible to damage during production [14,15]. During water injection, the injected water preferentially flows into pre-established larger flow channels, resulting in insufficient water absorption capacity in injection wells, higher injection pressures, and poor waterflooding performance in production wells [16,17]. Additionally, the heterogeneity of the reservoir structure further increases the risk of water channeling, significantly impacting the effectiveness of reservoir development.
To better guide the formulation of development plans, flow units, as the foundation of reservoir description, must reflect both the fluid storage capacity and the potential for fluid flow [18,19]. However, as research on low-permeability, ultra-low-permeability, and tight hydrocarbon reservoirs progresses, traditional mercury intrusion methods are increasingly insufficient for objectively characterizing the pore structure of reservoirs. Currently, a variety of laboratory methods are available to study pore structures, including constant-rate mercury intrusion, high-pressure mercury intrusion, and CT three-dimensional scanning, each offering unique advantages in the investigation of reservoir pore-throat structures [20,21,22]. For studying the movable fluid saturation of low-permeability reservoirs, NMR experiments and centrifuge methods have shown distinct advantages, allowing for the calibration of the T2 cutoff value for reservoir rocks and the accurate measurement of movable fluid saturation in low-permeability reservoirs [23,24,25]. For example, Jin et al. [26] extracted the T2-weighted arithmetic mean from NMR echo data using integral transformation for permeability prediction. Hosseinzade et al. [27] converted the NMR T2 distribution into capillary pressure curves and calculated relative permeability curves using the Corey model, achieving excellent application results in carbonate reservoirs. Guo et al. [28] derived the relationship between T2 and relative permeability (Kr) based on fractal theory and developed a corresponding conversion model. Liu et al. [29] conducted fractal analysis on the NMR T2 distribution of tight sandstone and used multifractal parameters to evaluate the pore structure and rock types of tight sandstone. The continuous optimization of these research methods provides more scientific theoretical support and technical means for the development of low-permeability and ultra-low-permeability reservoirs.
This study focuses on the core samples from the C4 and C7 reservoirs of the Jilin Xinli Oilfield, analyzing the distribution of reservoir fluids, dynamic changes in pore structure, and factors influencing displacement efficiency during the waterflood process. During the waterflooding process, the impact of water injection on the pore throat morphology and fluid content distribution in hydrocarbon reservoirs is primarily qualitative. Nuclear magnetic resonance (NMR) T2 relaxometry was used to quantitatively describe the movable fluid saturation and the distribution of remaining oil in the reservoir. Additionally, displacement experiments were conducted to analyze the influence mechanisms of individual factors such as permeability, pressure gradient, injection volume, and reverse displacement on oil recovery efficiency. This study provides both qualitative and quantitative analytical references for the macroscopic and microscopic characteristics of reservoir fluids during the waterflooding process.

2. Materials and Methods

2.1. Experimental Samples

The experimental cores were obtained from the Xinli Oilfield, which is characterized by a high calcite content and significant heterogeneity. Based on the research objectives, cores with varying permeability ranges were selected for nuclear magnetic resonance (NMR) testing. The experimental process involved comparing the effects of pressure gradients and forward–reverse displacement on the cores. The basic physical properties of the cores and specific experimental arrangements are provided in Table 1.

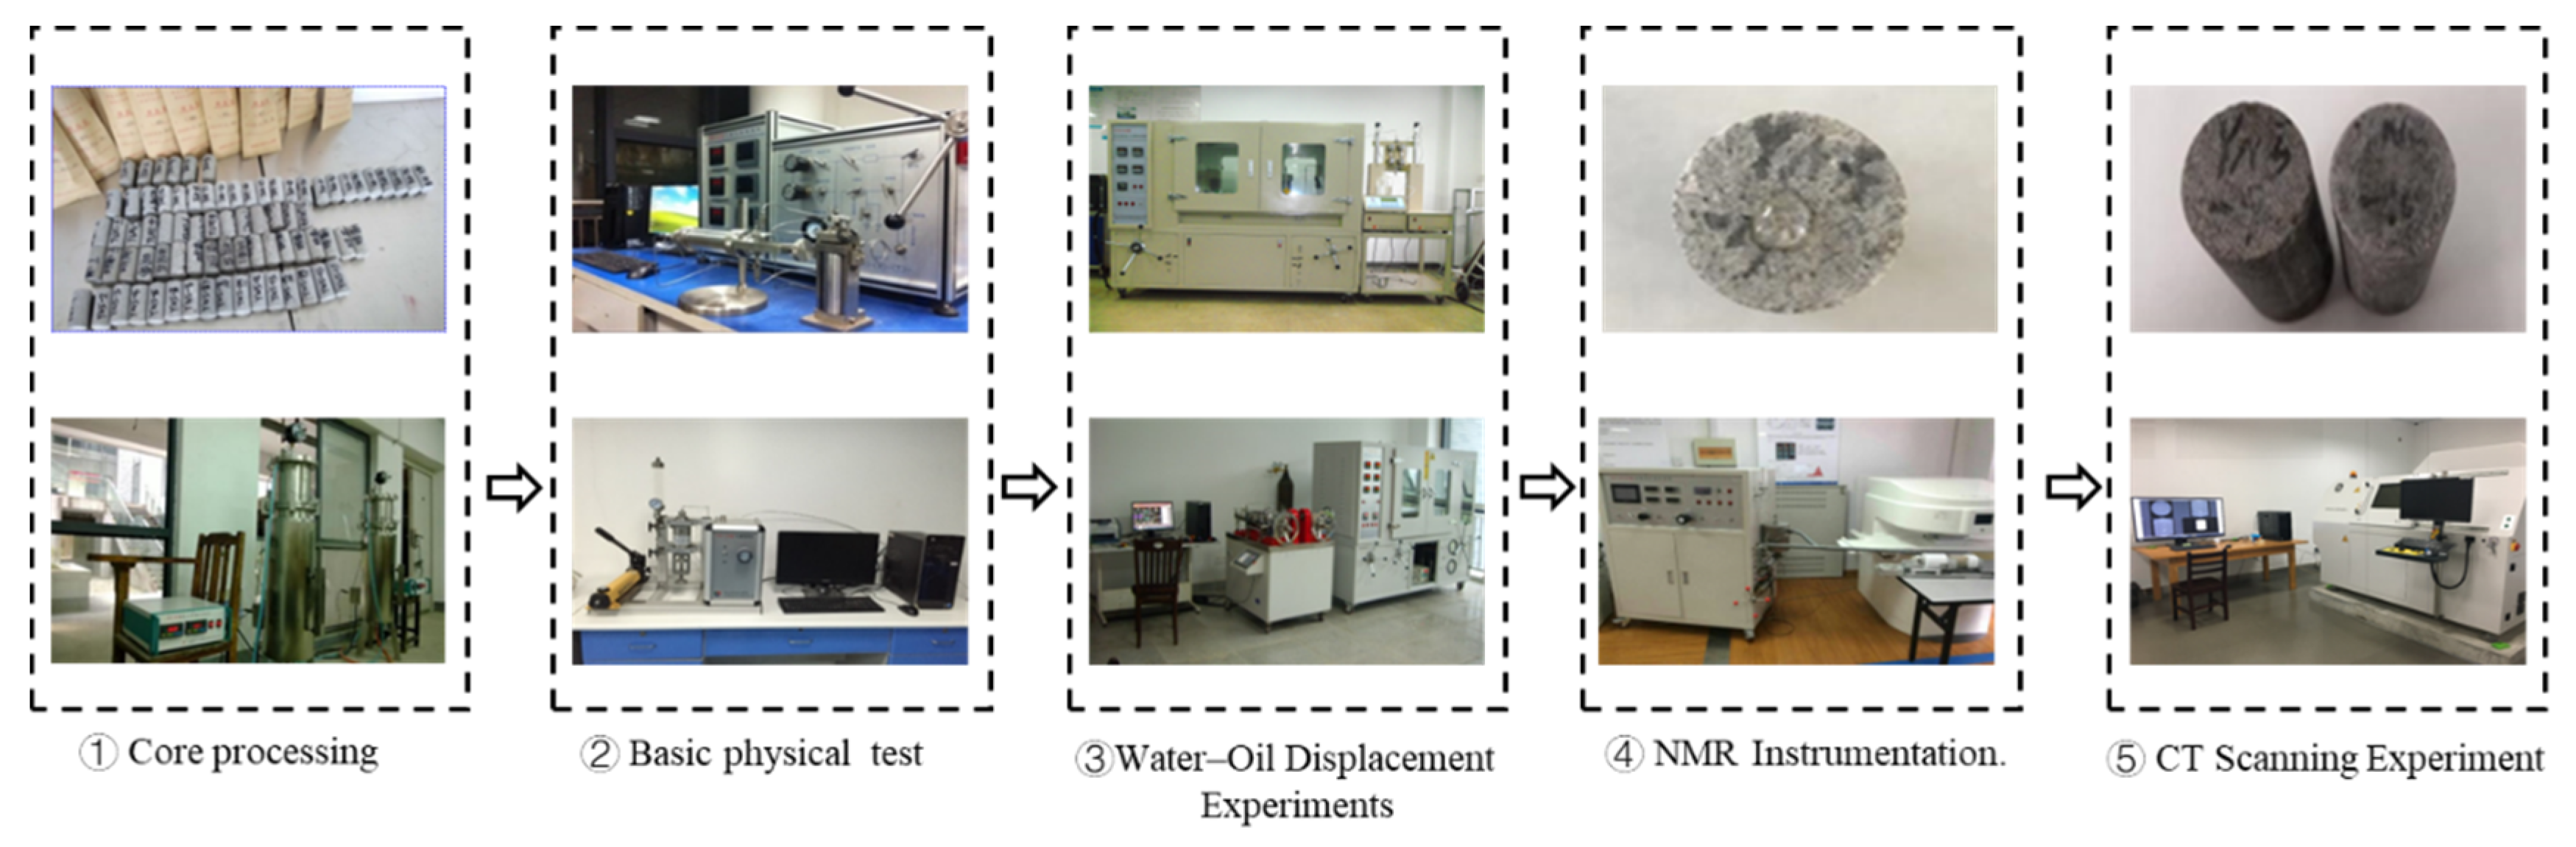
2.2. Experimental Procedure

2.2.1. Basic Preparation

Figure 1 illustrates the experimental process. The equipment used in the experiment includes the following: ① Representative core samples were selected from the target reservoir, and residual crude oil and wax were removed using a toluene and anhydrous ethanol mixture in a 2:1 volume ratio for preliminary degreasing and dewaxing treatment. ② The core’s basic physical properties—including mass, length, diameter, permeability, and porosity—were measured. Each measurement was repeated three times under identical conditions to ensure reproducibility, and the average value was reported as the final result. The error range for each measurement was documented. Permeability and porosity were determined using an automated gas–mercury porosimeter, with testing errors controlled within ±5%, ensuring accuracy and scientific reliability. ③ Various types of displacement experiments were conducted to analyze oil recovery efficiency and investigate two-phase oil–water flow behavior. A data acquisition and recording subsystem was used to collect time-dependent data on flow rate, confining pressure, injection pressure, fluid temperature, and core sample temperature, with all real-time data transmitted to a computer for continuous monitoring. ④ a nuclear magnetic resonance (NMR) device was used to perform NMR scanning and T2 spectrum tests on selected cores at different experimental stages. ⑤ CT scanning equipment (CT) was used to obtain the core morphological structure based on X-ray tomography.

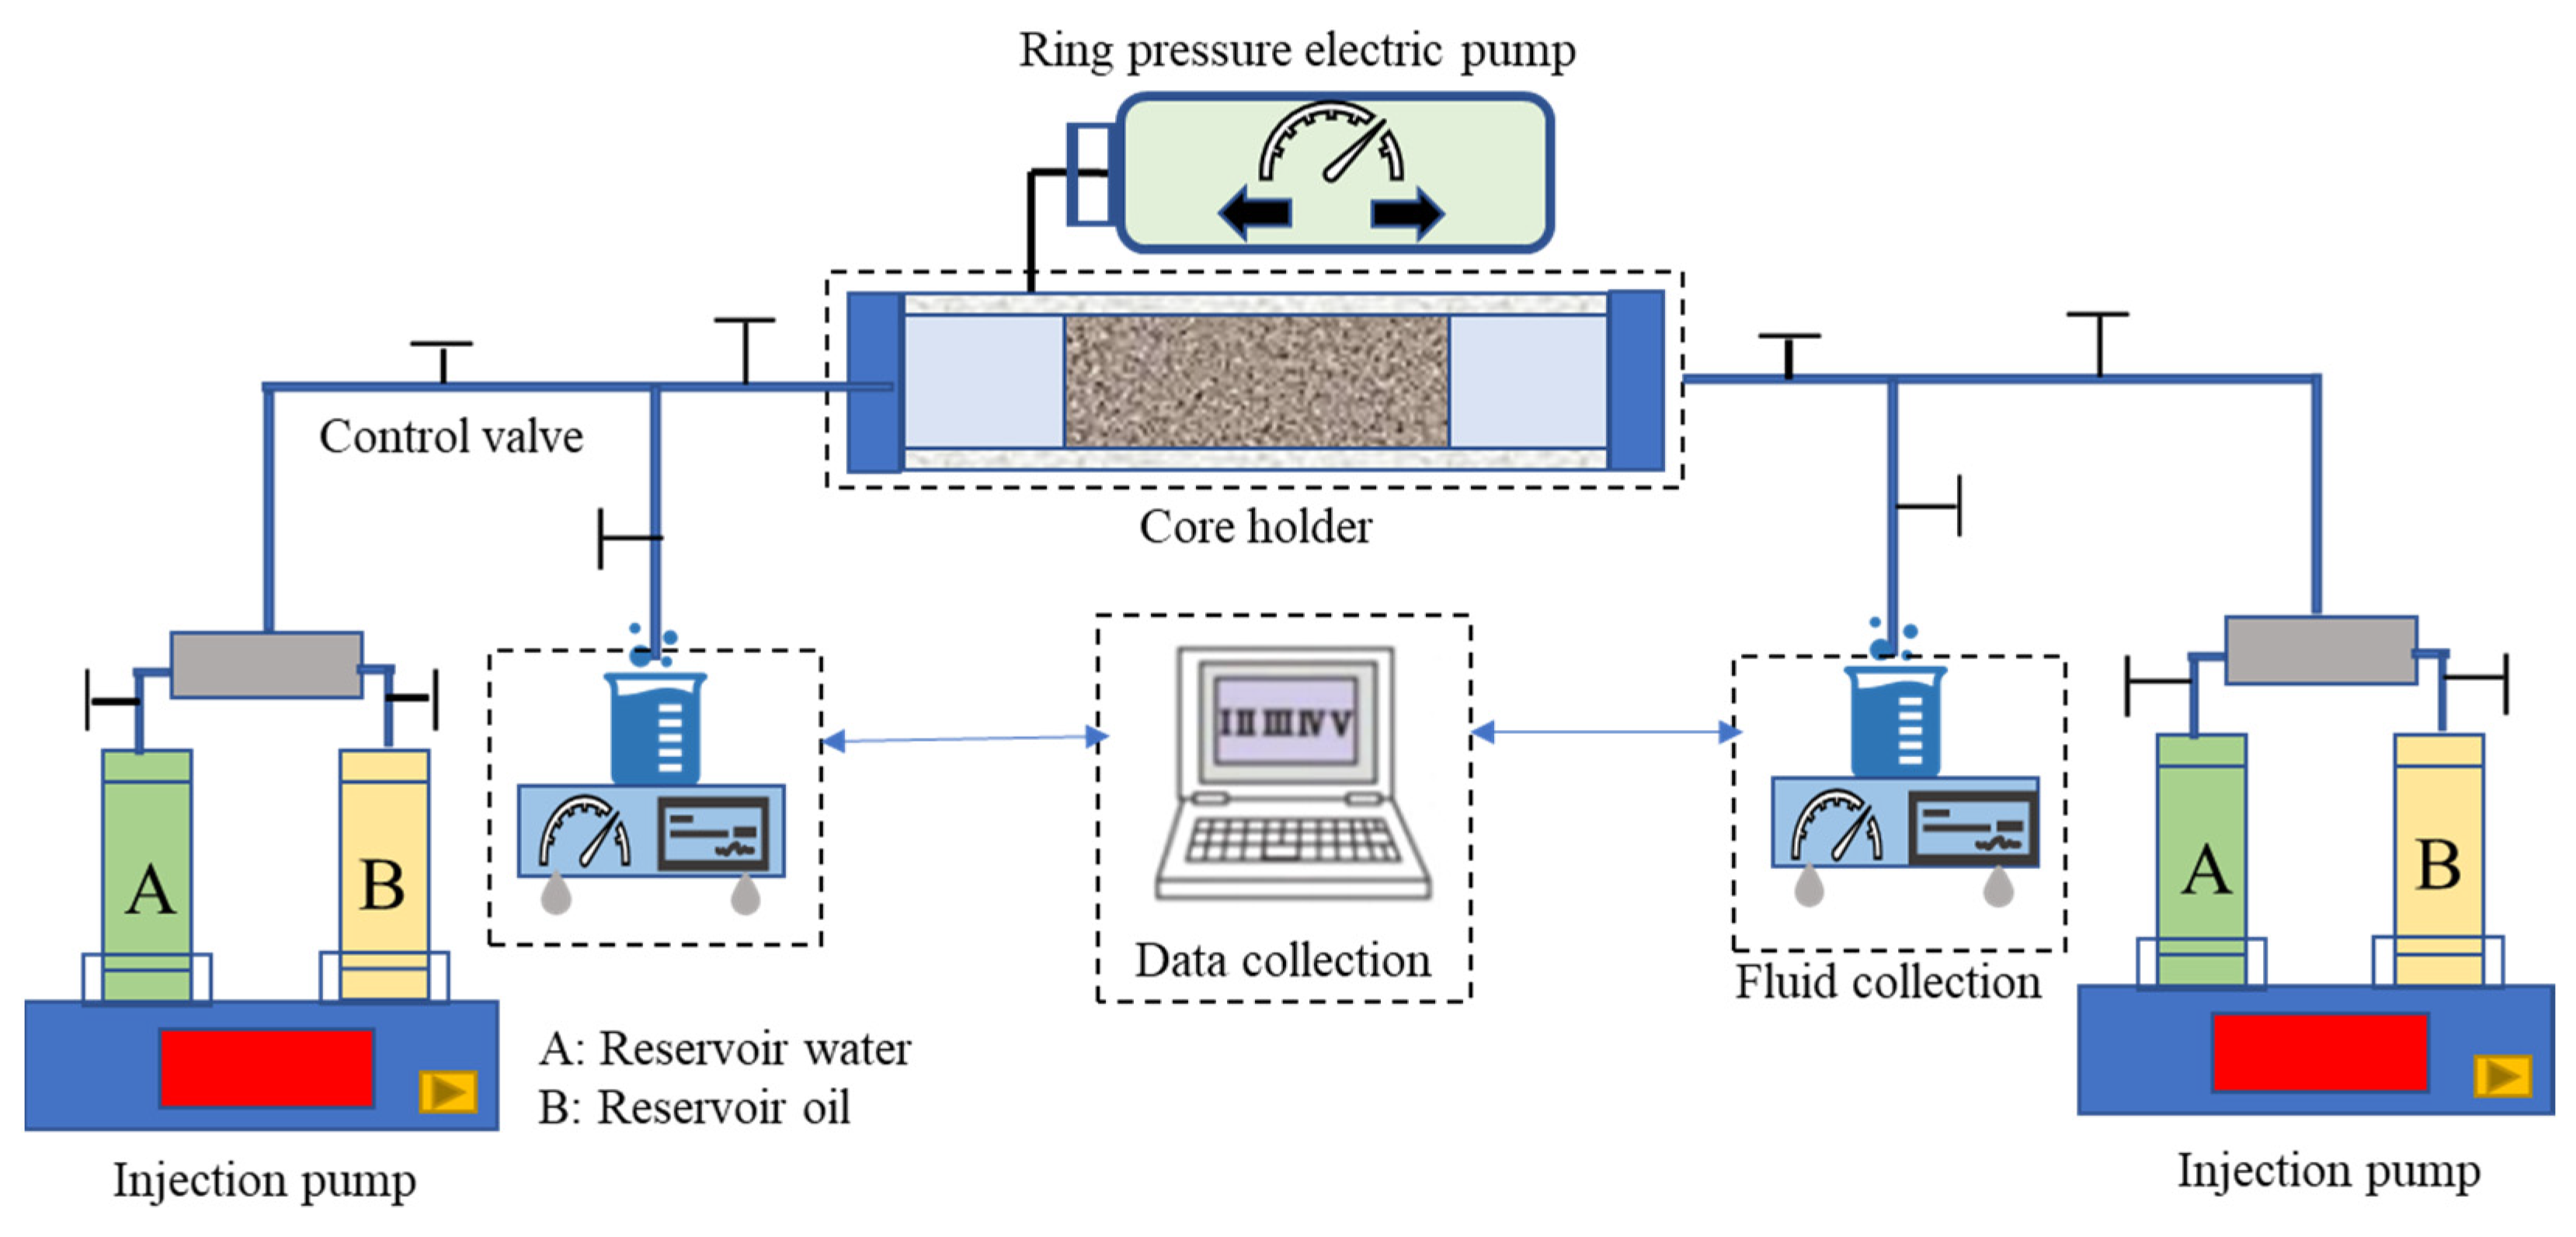
2.2.2. Displacement Experiment Procedure Design

Forward Flooding Stage: The prepared oil-saturated core was first placed into a core holder and sealed, followed by connection to a high-pressure displacement system. A constant injection rate of 0.05 mL/min of simulated formation water was applied using a constant-pressure pump. The displacement experiment was conducted at room temperature. During the experiment, high-precision pressure sensors continuously monitored and recorded the pressure at both the inlet and outlet. A flow meter was used to measure the volume of produced fluids, and temperature sensors recorded both core and fluid temperatures. All data were transmitted and stored in real time via a data acquisition system connected to a computer, ensuring time alignment and data integrity. The flooding was considered complete when no oil was produced at the outlet for a continuous period of 10 min, after which the next experimental stage commenced.
Reverse Flooding Stage: After the completion of forward flooding, the system remained sealed while a three-way valve was used to reverse the injection direction, initiating the reverse flooding experiment. Simulated formation water was injected at the same constant rate of 0.05 mL/min. All experimental conditions were maintained identical to those of forward flooding to ensure comparability. Throughout the process, pressure, fluid production volume, and temperature were continuously monitored and recorded by the data acquisition system. Reverse flooding continued until stable water production was observed at the outlet with no further oil output. The core was then cooled and disassembled in preparation for subsequent CT scanning and NMR analysis. The experimental apparatus is arranged in accordance with Figure 2.

3. Results

3.1. Analysis of Displacement Characteristics Results

3.1.1. Oil-Displacing-Water Experiment Results

As shown in Figure 3, the process of bound water formation during oil displacement of water in the core is illustrated. At 0 h, the core is in a saturated water state, while at 5.501 h, the displacement process reaches its endpoint, which corresponds to the bound water state. In the initial stage of the oil displacement process, oil first displaces water through larger pores where the surrounding capillary resistance is lower. This process gradually causes water in the intermediate smaller pore clusters to become trapped. When the displacement pressure exceeds the capillary pressure of the smaller pore clusters, these clusters lose their drainage pathways, preventing the water within them from being displaced and ultimately forming bound water.
To further characterize the internal dynamics of the core, CT slice scanning was performed. A localized schematic diagram of the CT scan slices at the same position within the core is shown in Figure 4. The non-wetting phase oil preferentially flows through coarse pore channels with lower capillary resistance, forming bypassing flows. This effectively traps water in smaller channels, severing its hydrodynamic connection with other water bodies. This mechanism is a key factor in the formation of bound water. In larger pores, bound water primarily forms due to the irregular shape of the pores, which leads to water accumulation in dead-end areas.

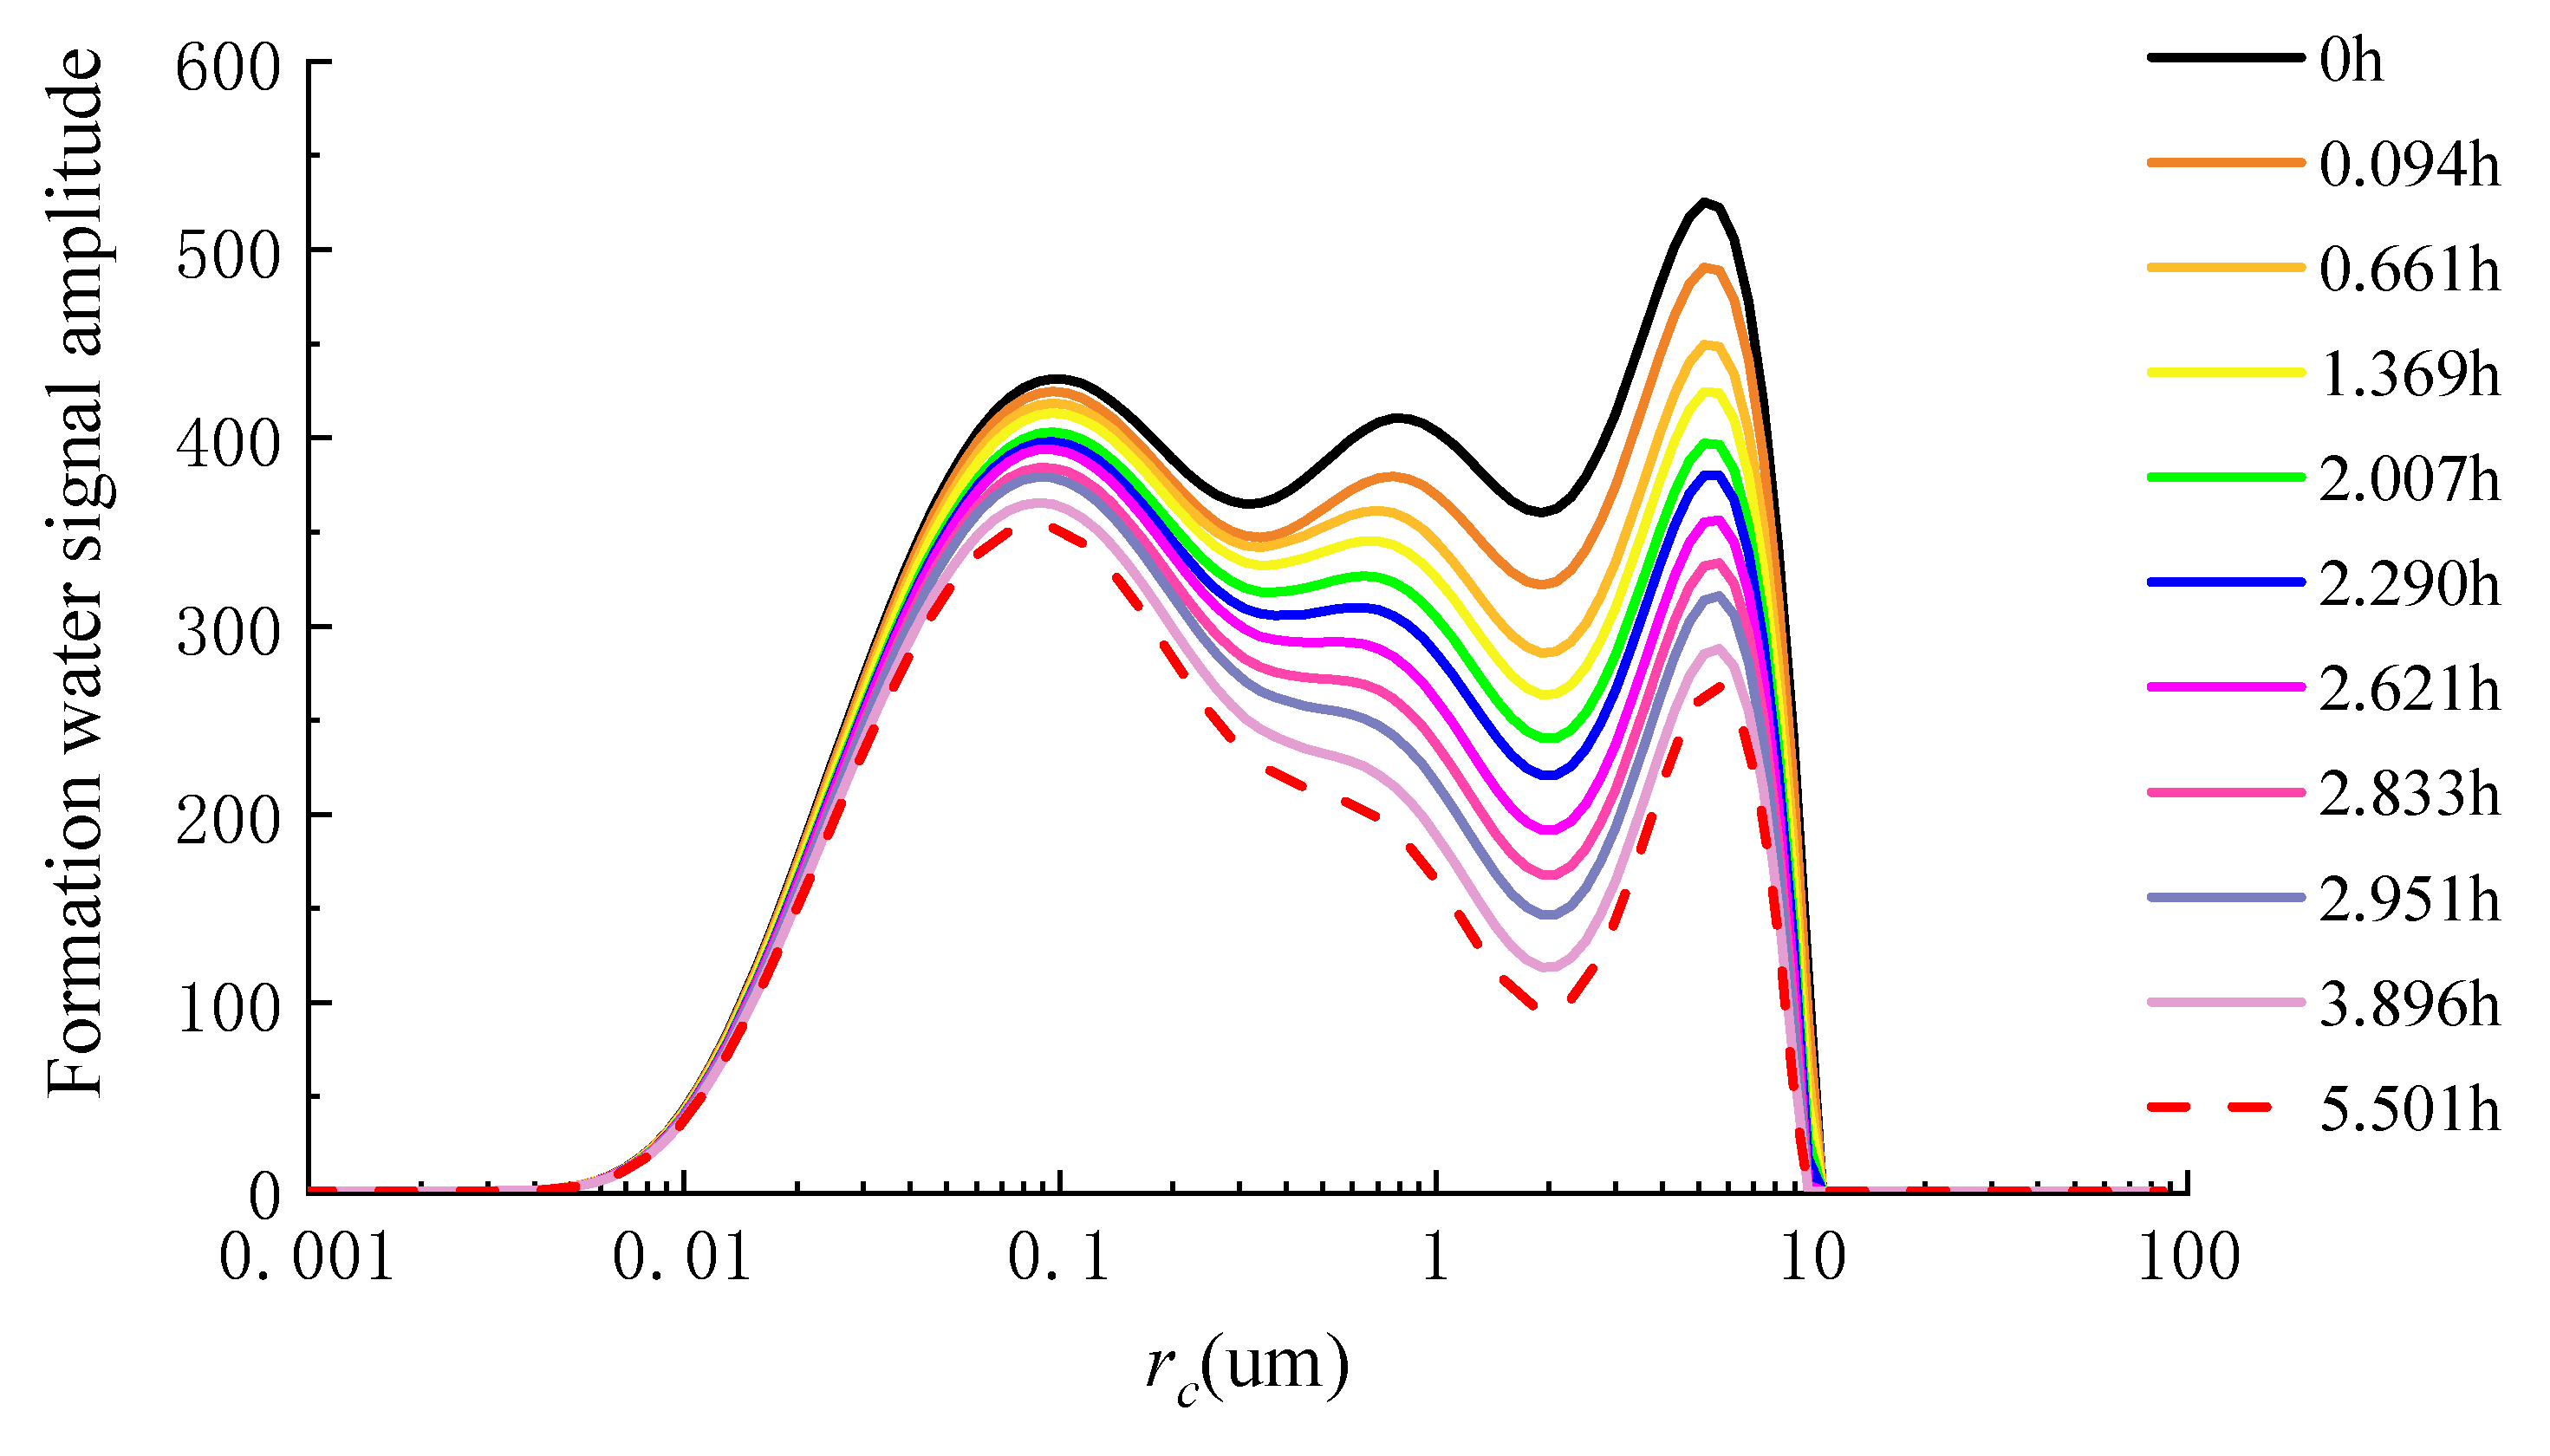
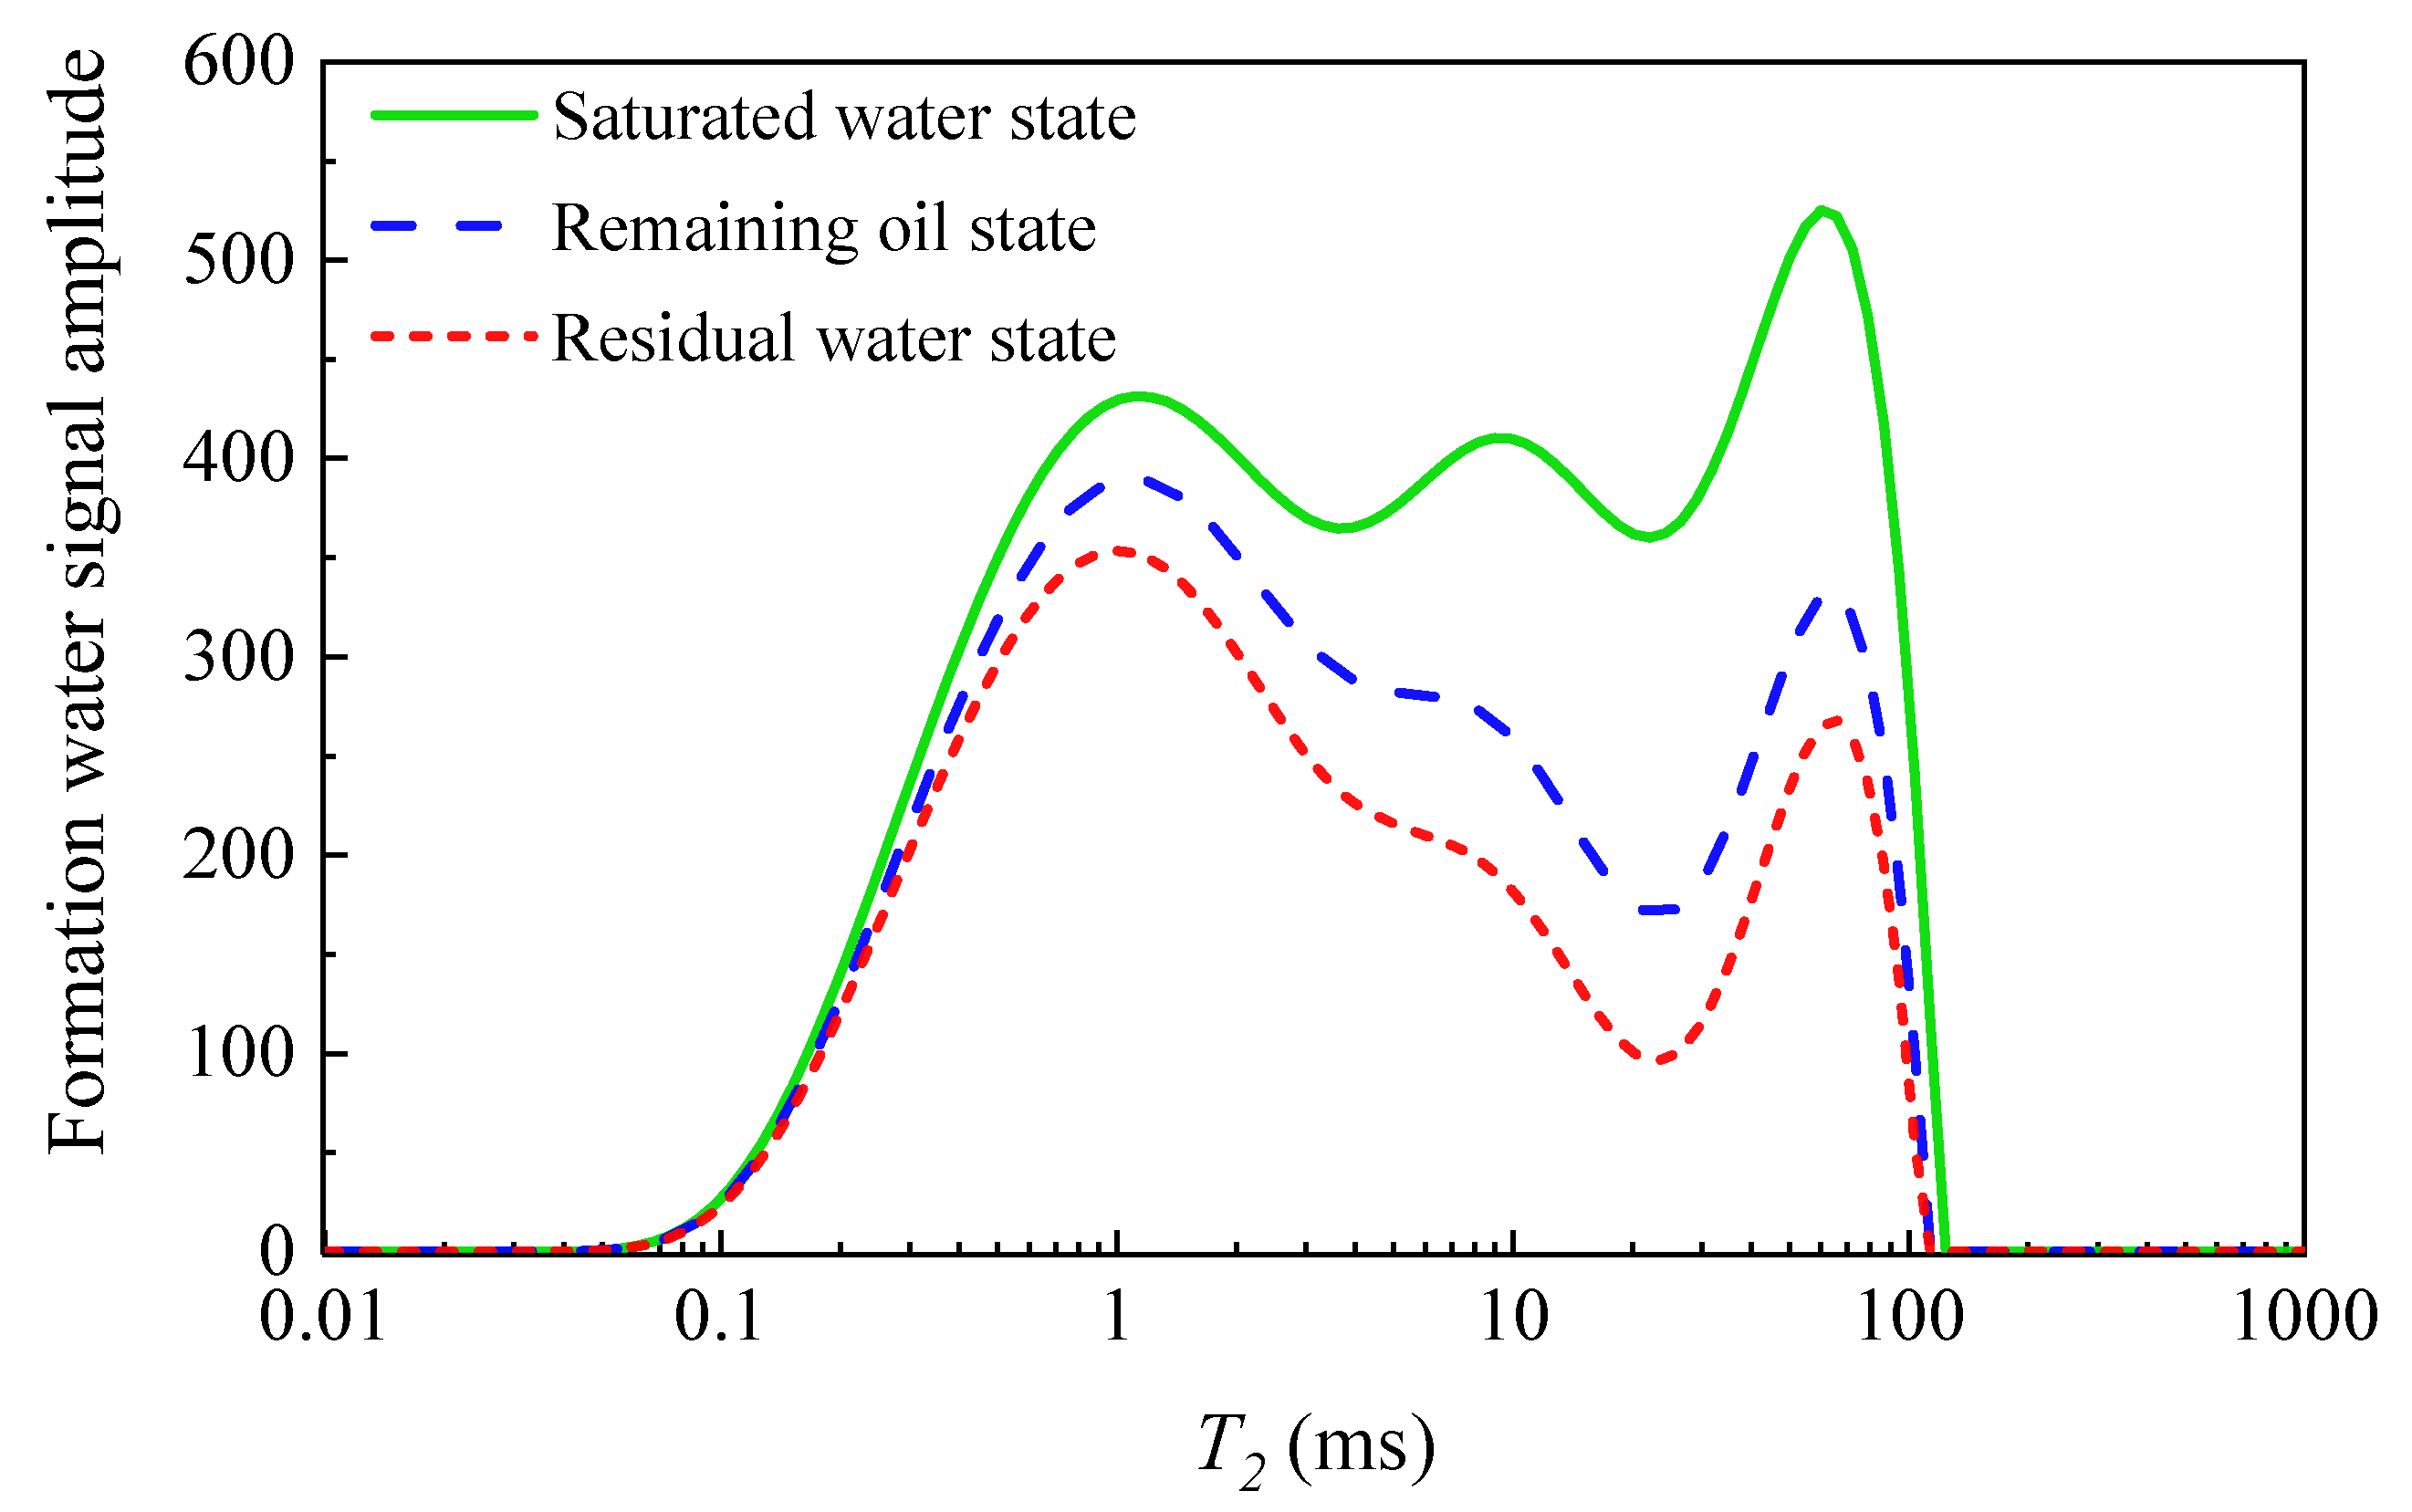
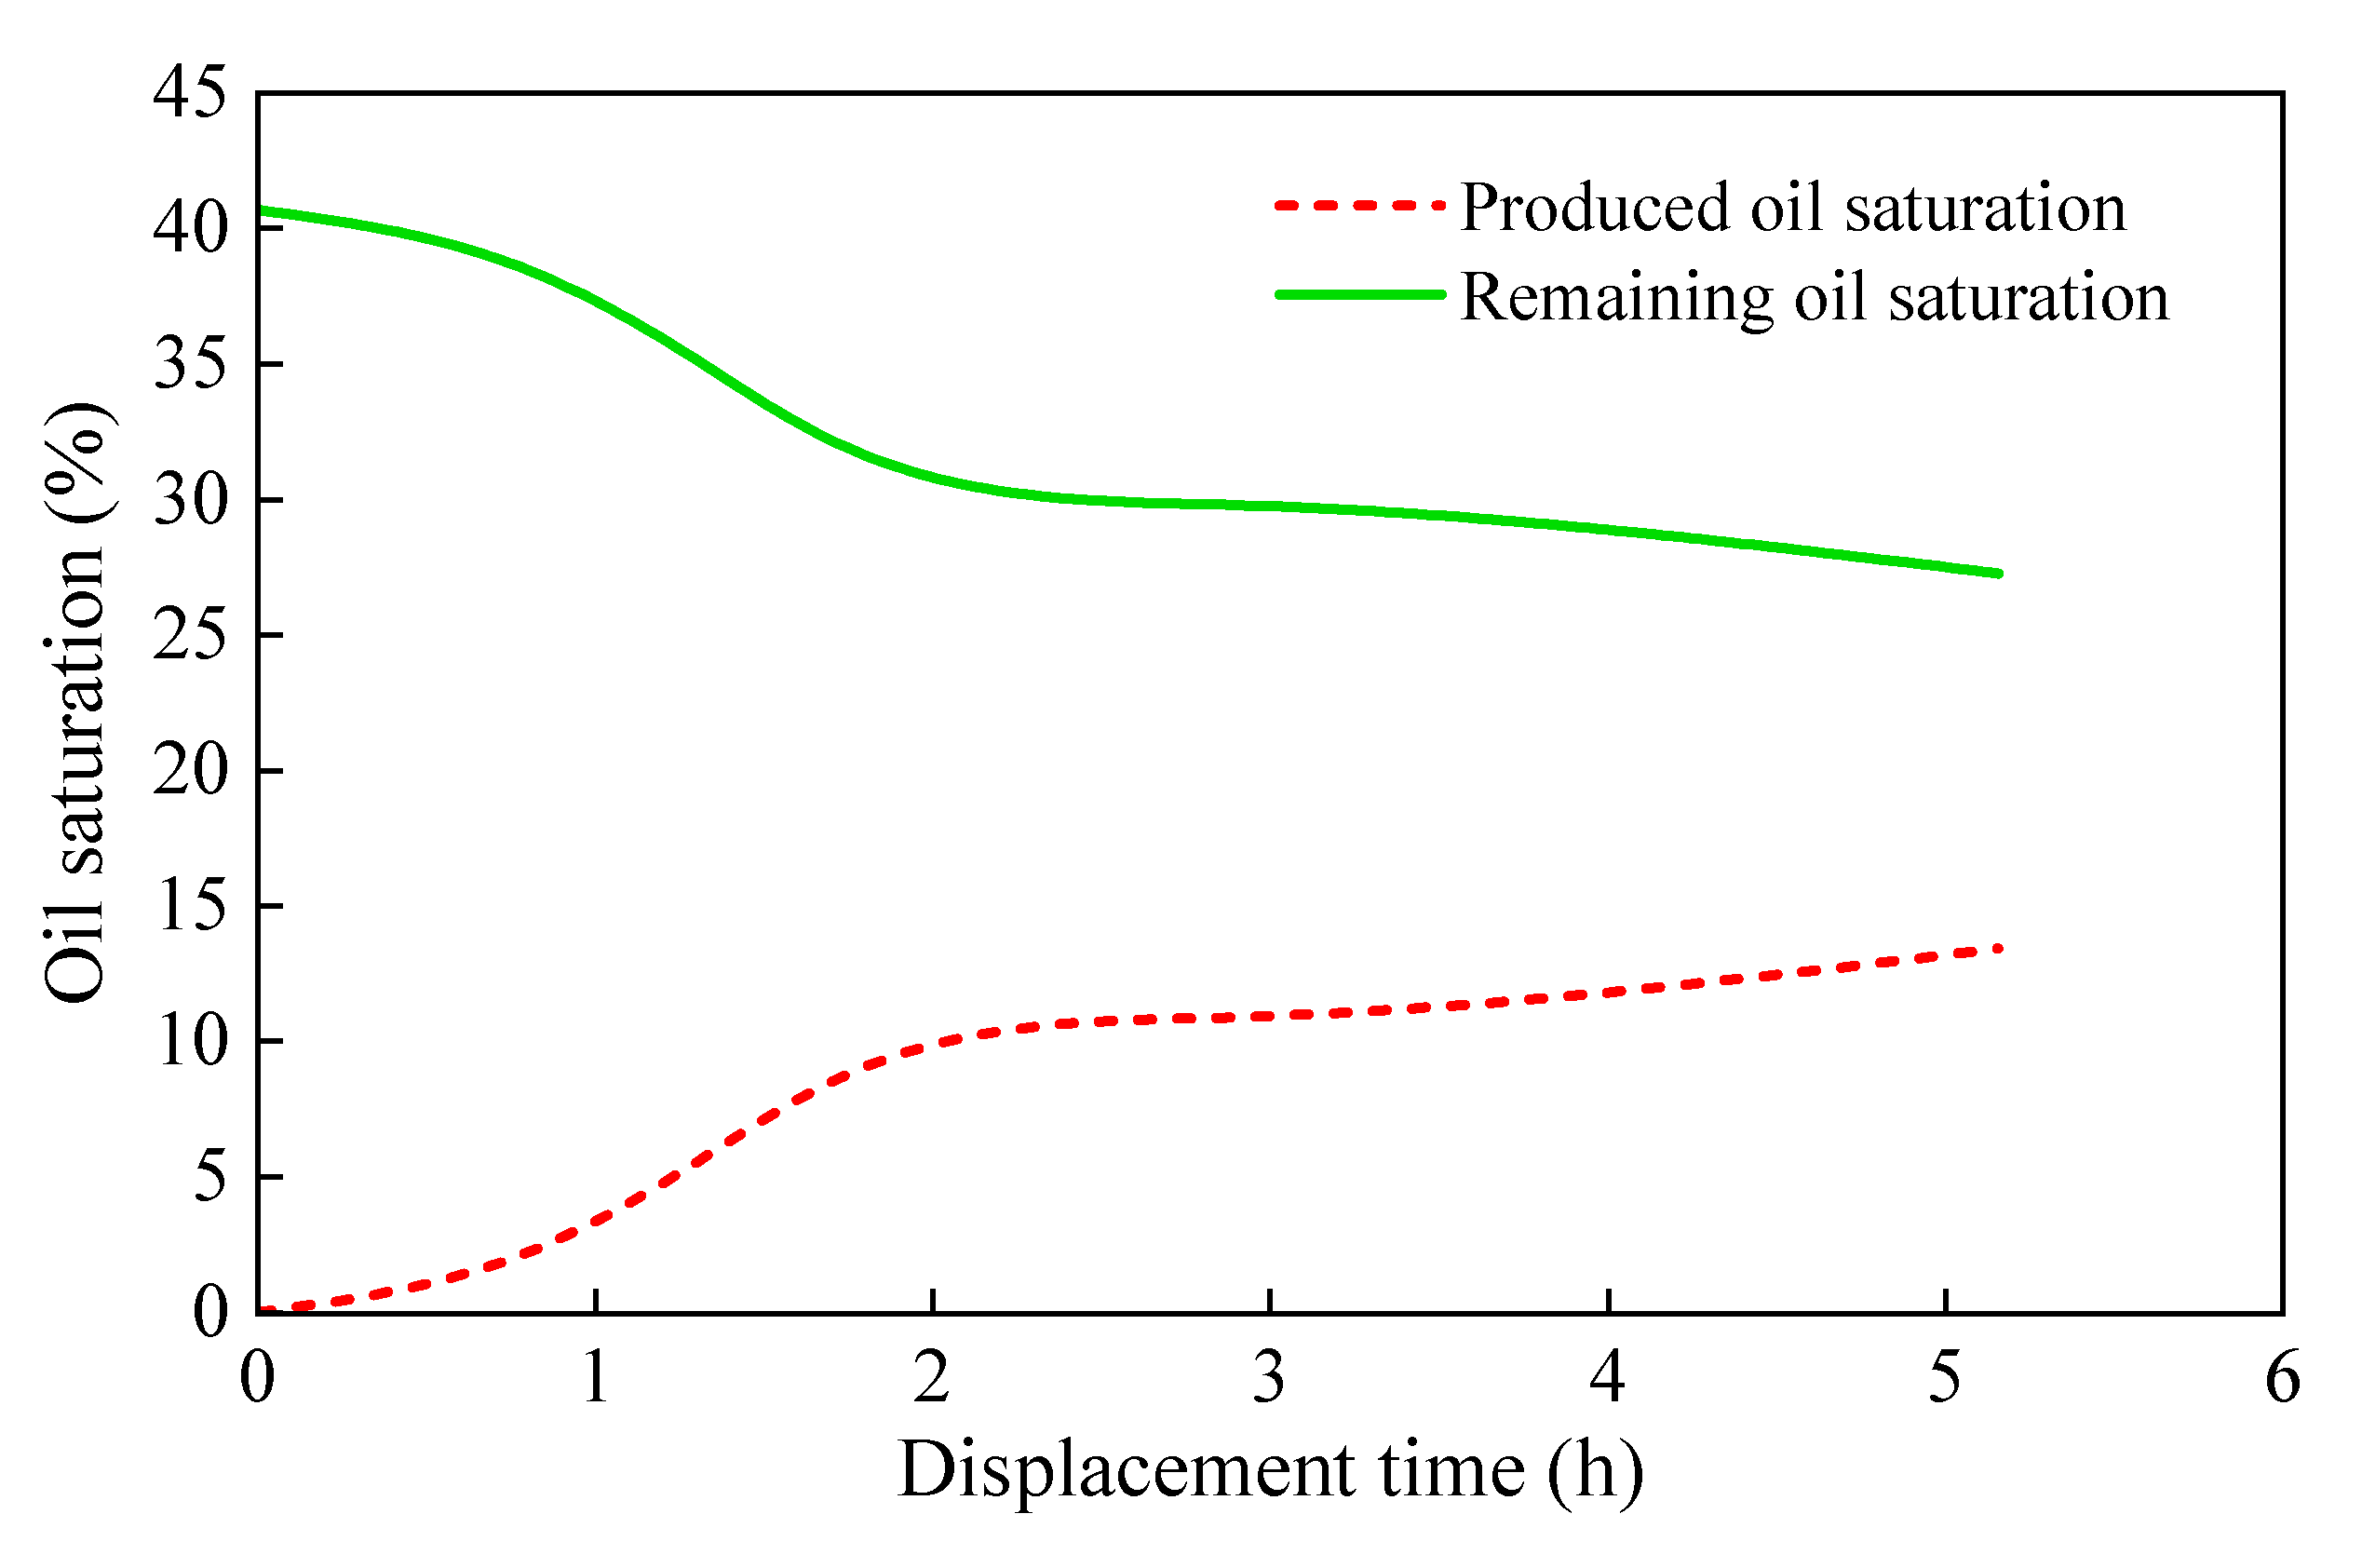
3.1.2. Water-Displacing-Oil Experiment Results

As shown in Figure 5, the T2 spectrum represents the process of water flooding oil in the core. During the water flooding process, the injected water preferentially flows along paths with lower pore channel resistance, a phenomenon known as microscopic fingering. When two water flow channels converge in certain pore channels ahead, oil pockets between these channels may remain, forming remaining oil. This occurs because the injected water always tends to flow along the path of least resistance. Once stable water flow channels are established, the resistance to water flow within these channels significantly decreases, facilitating further water movement. Due to the prevalent microscopic heterogeneity in the reservoir, remaining oil tends to accumulate extensively during the water flooding process.
To more vividly and intuitively analyze the changes in pore structure and other parameters during the water flooding experiment of the rock sample, digital modeling was conducted based on CT scan results, as shown in Figure 6. In certain large pore channels, although some crude oil is displaced by water, the water primarily advances along the hydrophilic rock walls or water films on these walls. Due to the continuity of the water phase in the pore channels, water often occupies the throat of the oil flow pathway before the oil is completely displaced, interrupting the oil flow. The remaining oil is trapped in larger pores as droplets, forming “island-like” remaining oil [30,31]. Additionally, since large pores often have highly irregular shapes, the corners of these pores that the injected water cannot displace become key areas for remaining oil accumulation. These areas, due to their complex geometry and irregularity, cause oil to form residual patches that are difficult to remove. This significantly impacts the efficiency of water flooding and the ultimate recovery rate.
Thus, once the large pore throats are developed first, crude oil in the smaller pore throats becomes difficult to mobilize. In terms of remaining oil distribution, most remaining oil is concentrated in medium-sized pores, while small pores are almost entirely occupied by bound water, leaving very little remaining oil. Furthermore, remaining oil in large pores is also relatively limited. Therefore, medium-sized pore clusters are the key target areas for remaining oil development in the Jilin Xinli Oilfield.

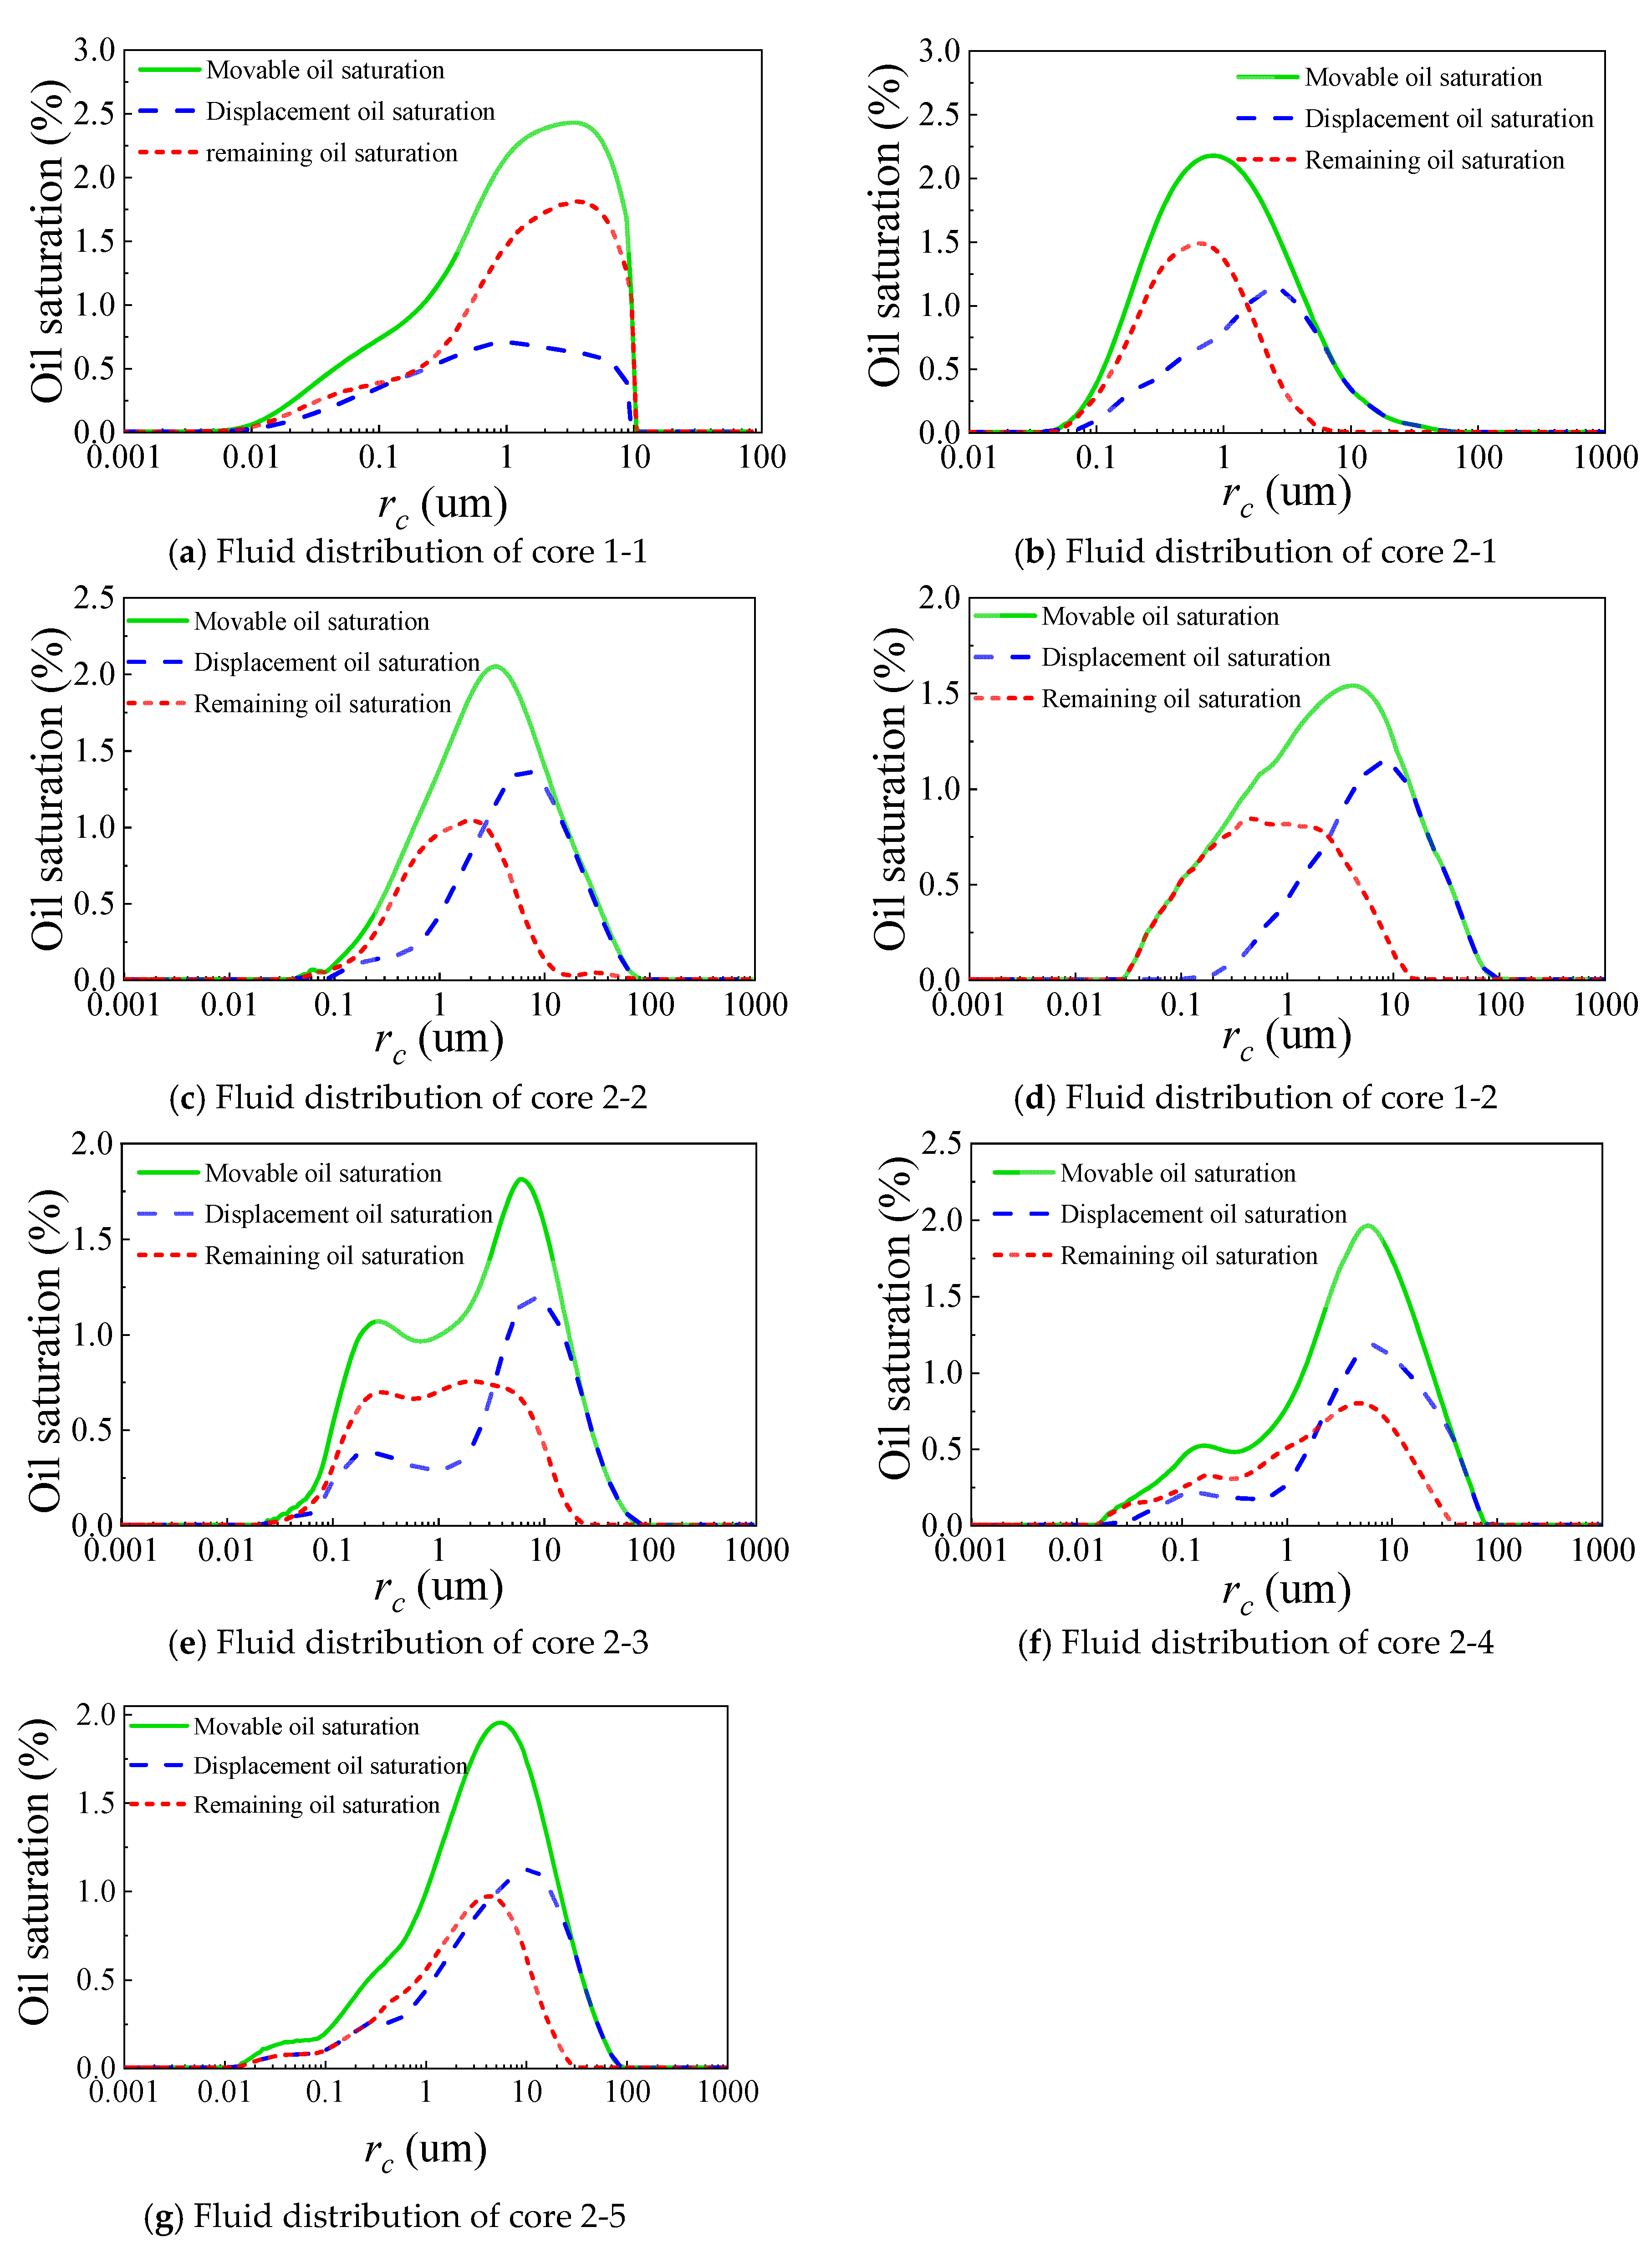
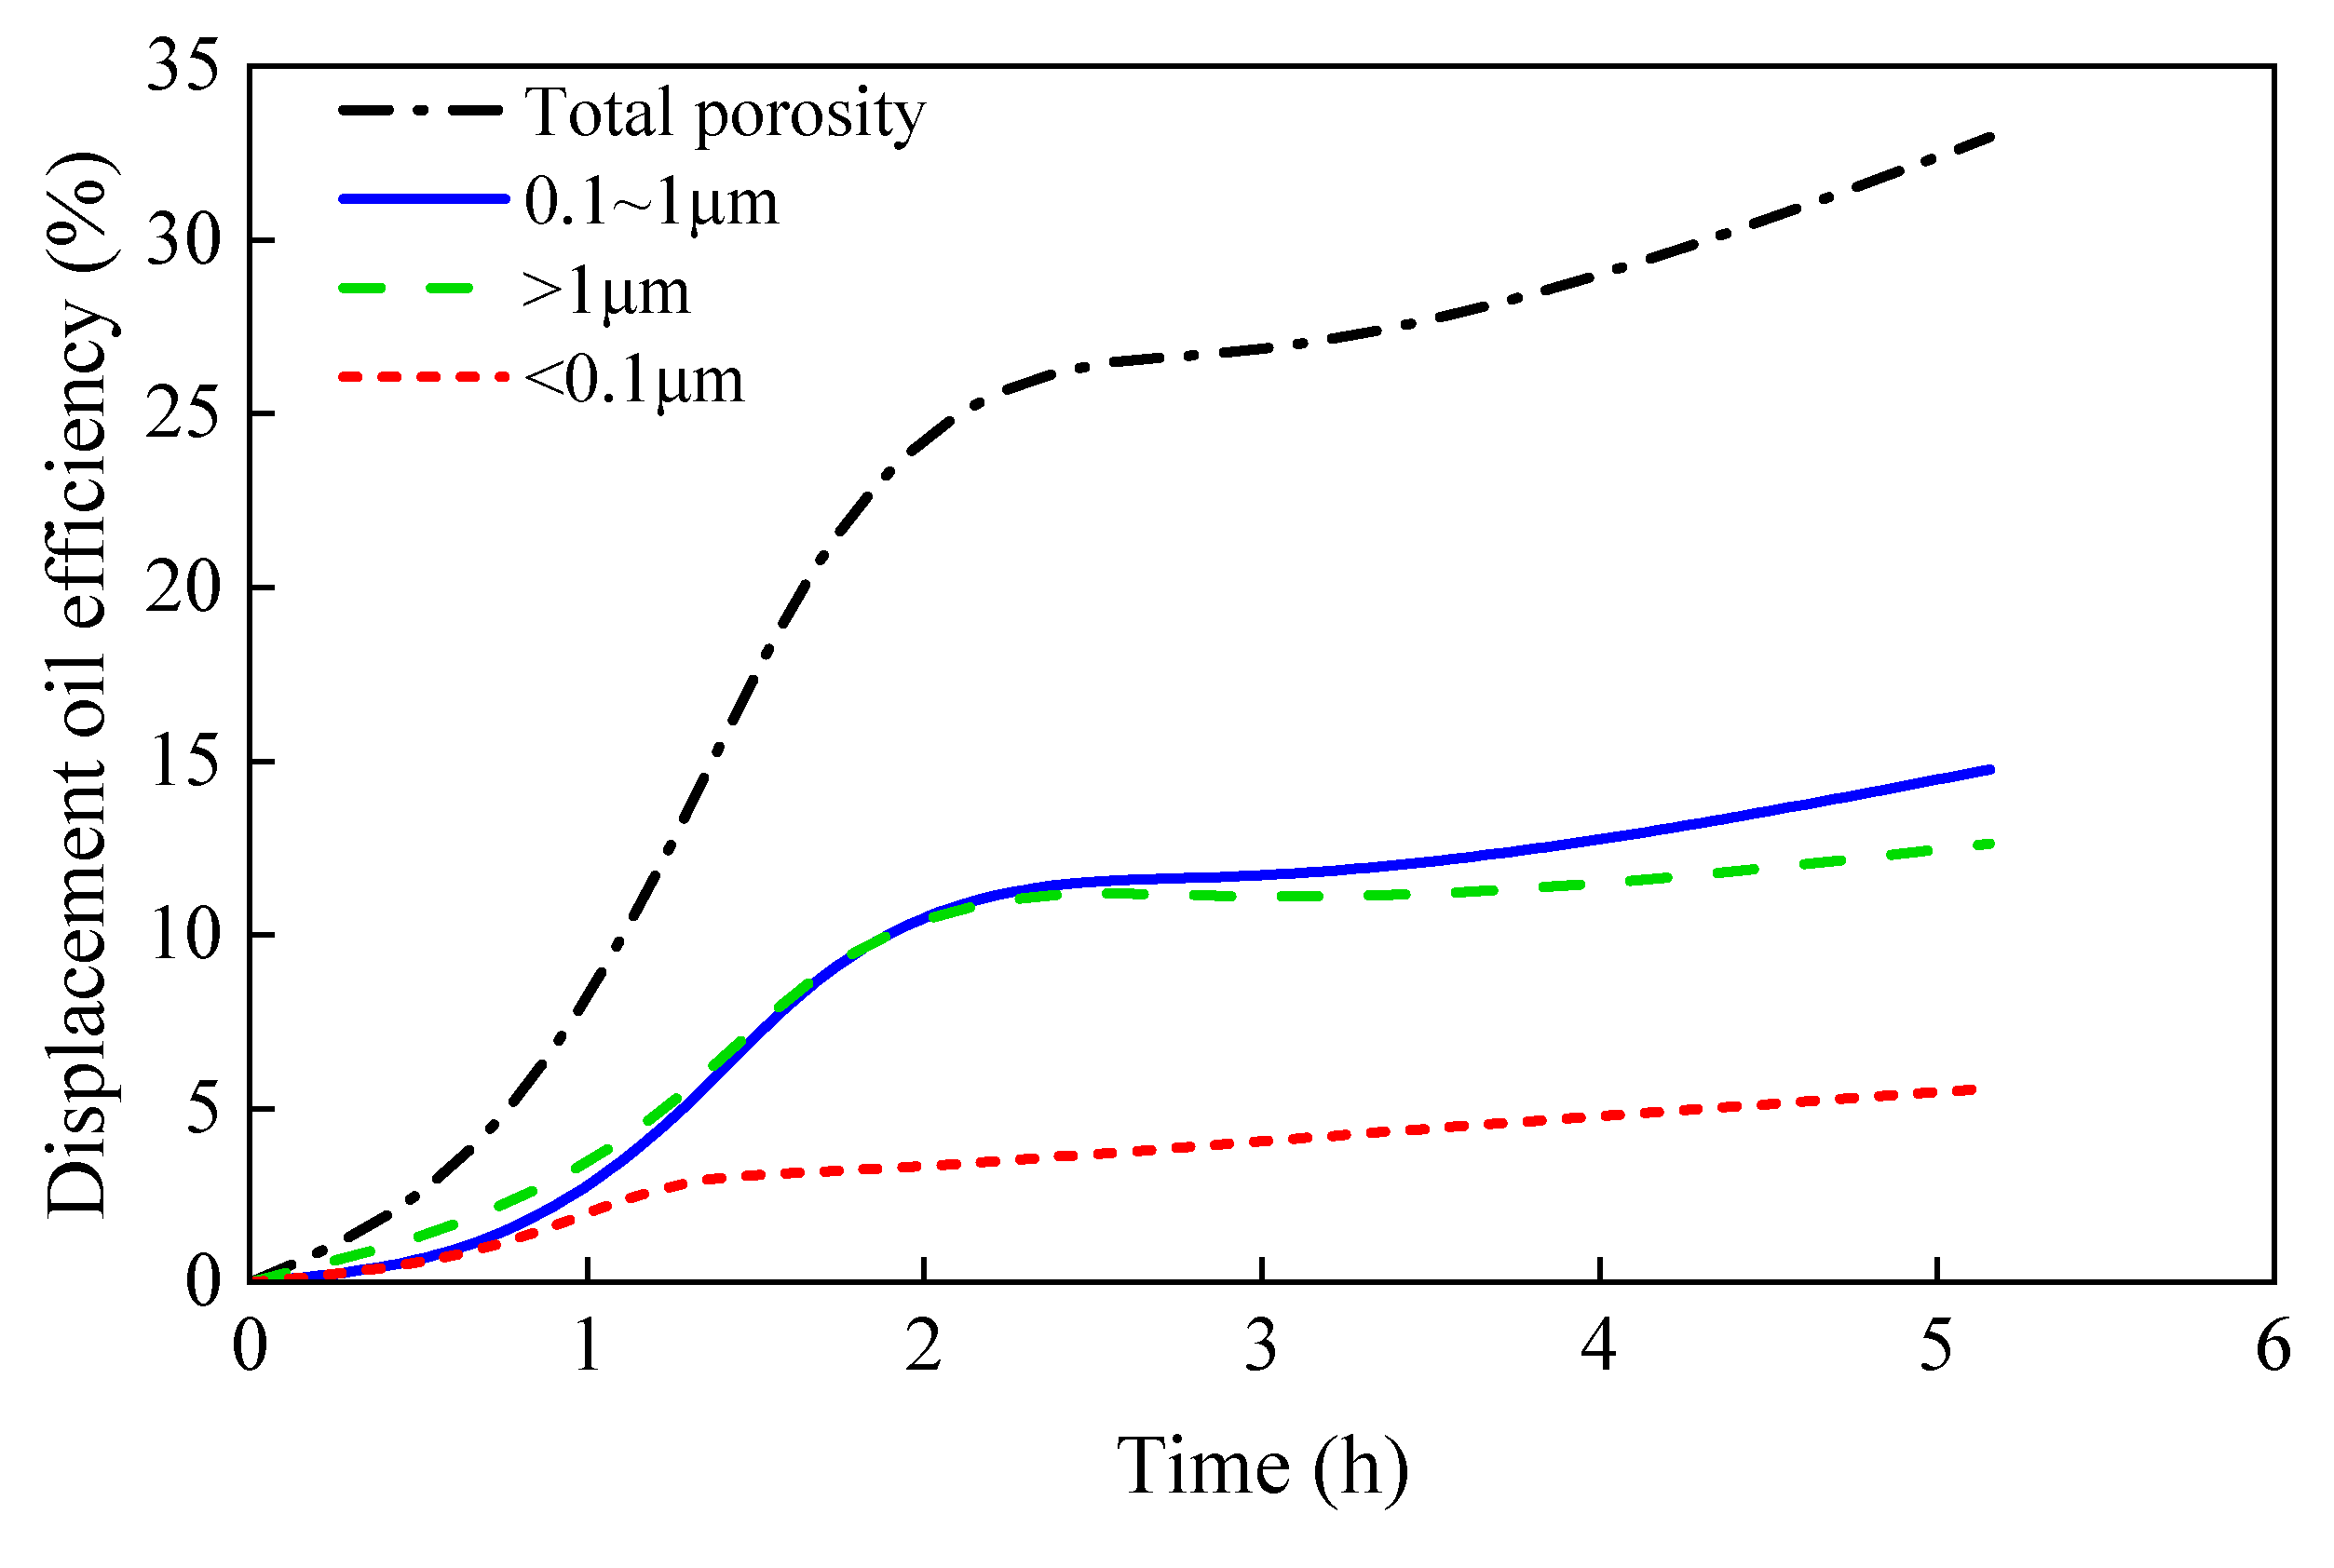
3.2. Analysis of Movable Fluid Saturation Distribution and Displacement Efficiency Characteristics

As shown in Figure 7a–g, the distribution of movable fluid in cores with different permeability ranges is as follows: In cores with permeability ranging from 1 to 5 mD, movable fluids are primarily concentrated in pores with diameters of 0.01–10 μm. In cores with permeability ranging from 5 to 9 mD, movable fluids are mainly distributed in pores with diameters of 0.1–20 μm. In cores with permeability ranging from 9 to 20 mD, movable fluids are primarily found in pores with diameters of 0.1–40 μm. In cores with permeability greater than 20 mD, movable fluids are mainly distributed in pores with diameters of 0.1–50 μm. These data indicate that as the permeability of the core increases, the pore distribution range of movable fluids also expands.
Movable fluid saturation refers to the ratio of the volume of movable fluid to the total volume of stored fluid. This ratio can be determined by calculating the enveloped area of the T2 spectrum and the horizontal axis under two core states: saturated water state and bound water state. Therefore, the movable fluid saturation S m can be expressed as follows:
S m = T 2 s a t u r a t e d   w a t e r d T T 2 b o u n d   w a t e r e r d T T 2 s a t u r a t e d   w a t e r d T
The movable fluid saturation of each core was calculated using Equation (1), as shown in Table 2. Figure 8 shows the variation curve of oil recovery efficiency with time for different pore sizes during water flooding in the core. It can be observed from the graph that during the displacement process, the oil recovery efficiency initially increases slowly, then increases rapidly, and eventually stabilizes. Furthermore, in the later stages, the oil recovery efficiency for pores in the 0.1–1 mm range increases significantly, while the increase in larger pores slows down. Although the smaller pores continue to increase at the same rate, their overall contribution remains small. Therefore, the primary potential for remaining oil development in the later stages lies in these pores, which is consistent with the previous conclusion. As displacement time increases and the injection multiplier rises, there is a significant effect on improving oil recovery efficiency in medium and small pores, but the effect on larger pores is not significant.

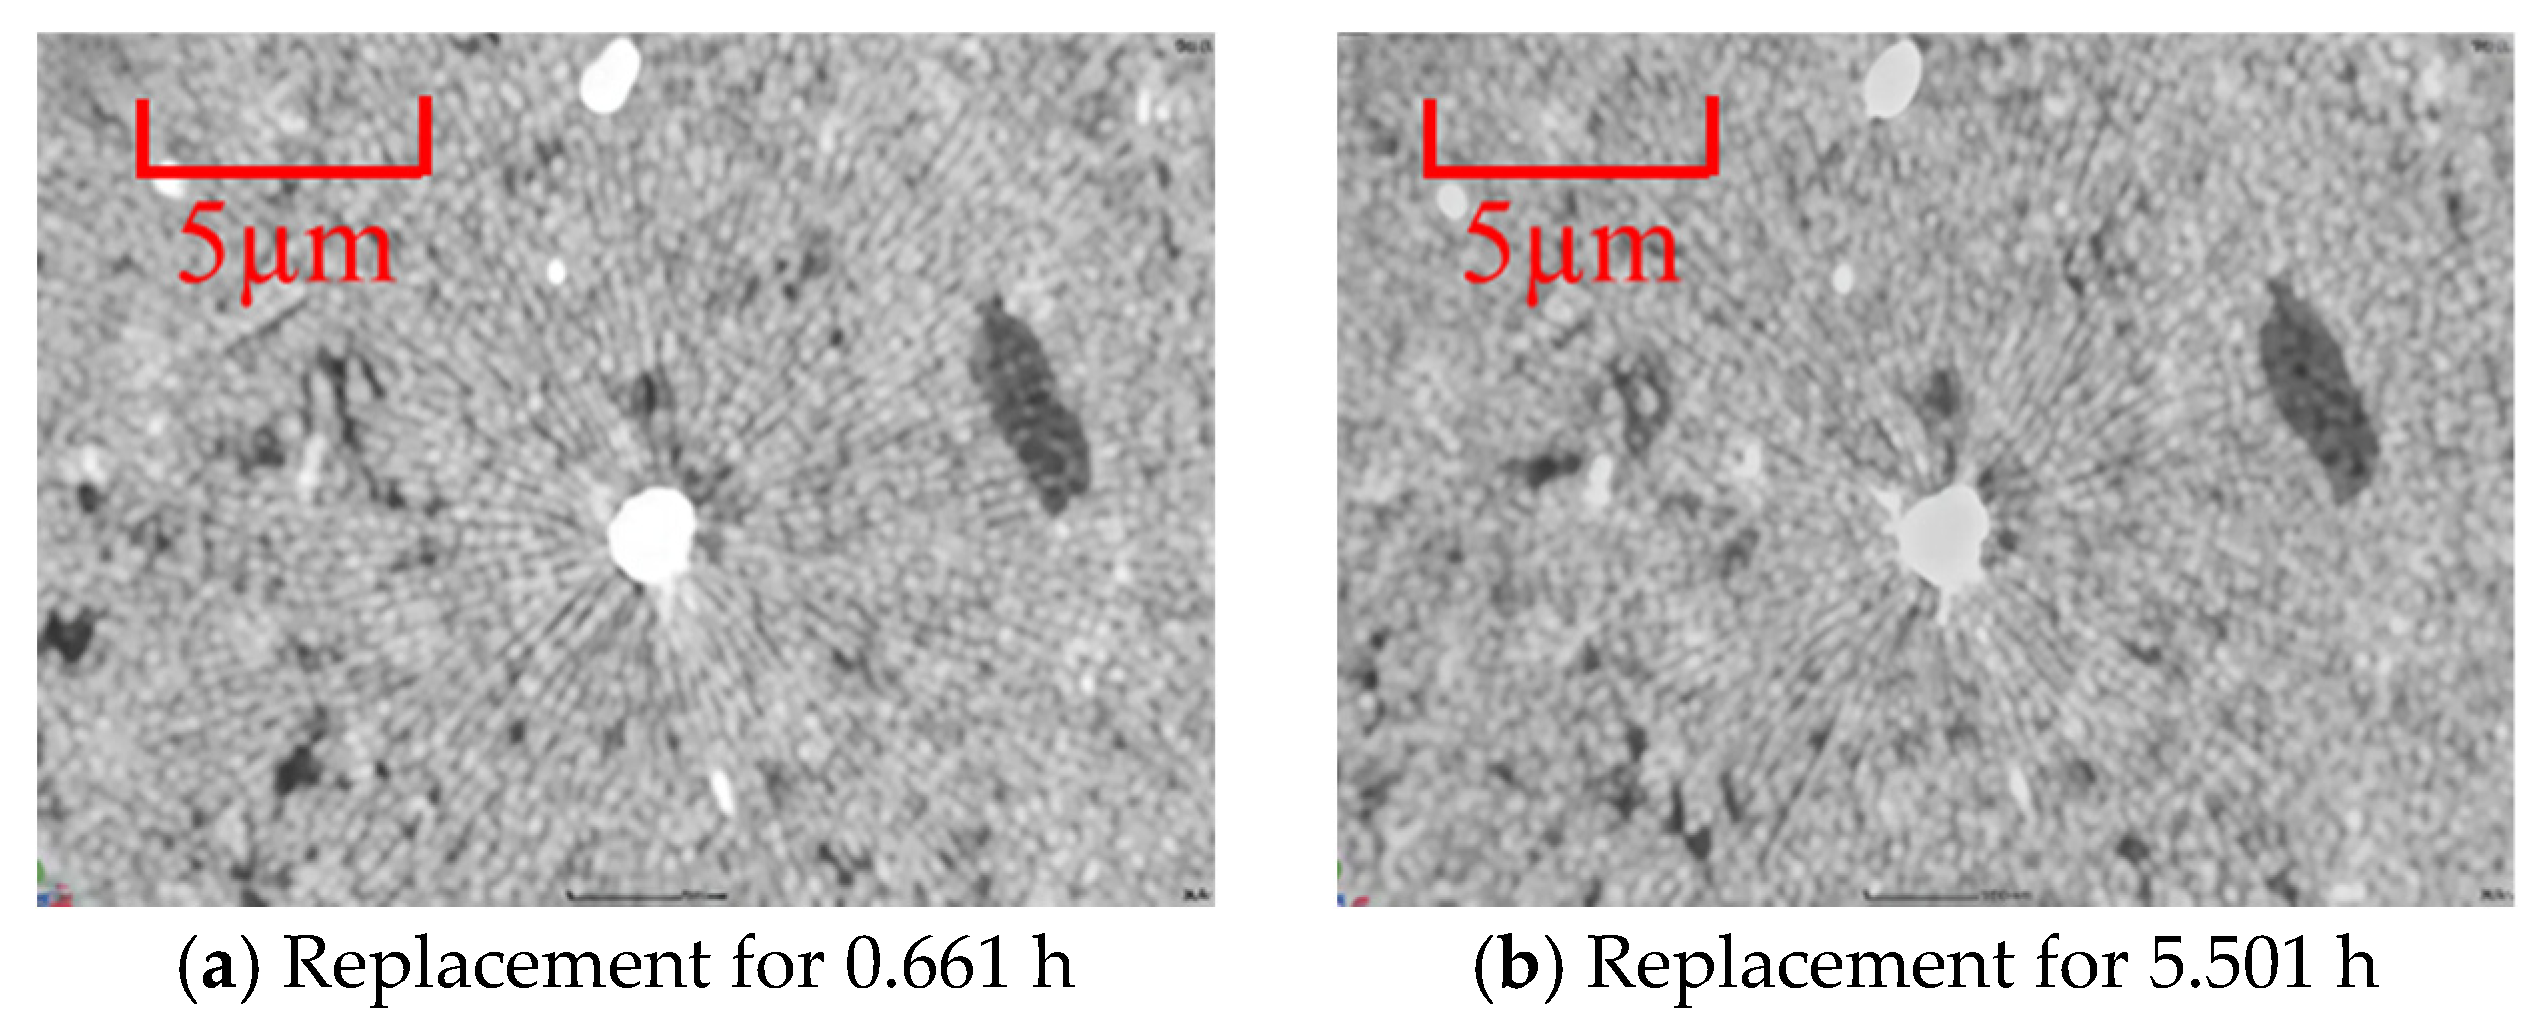
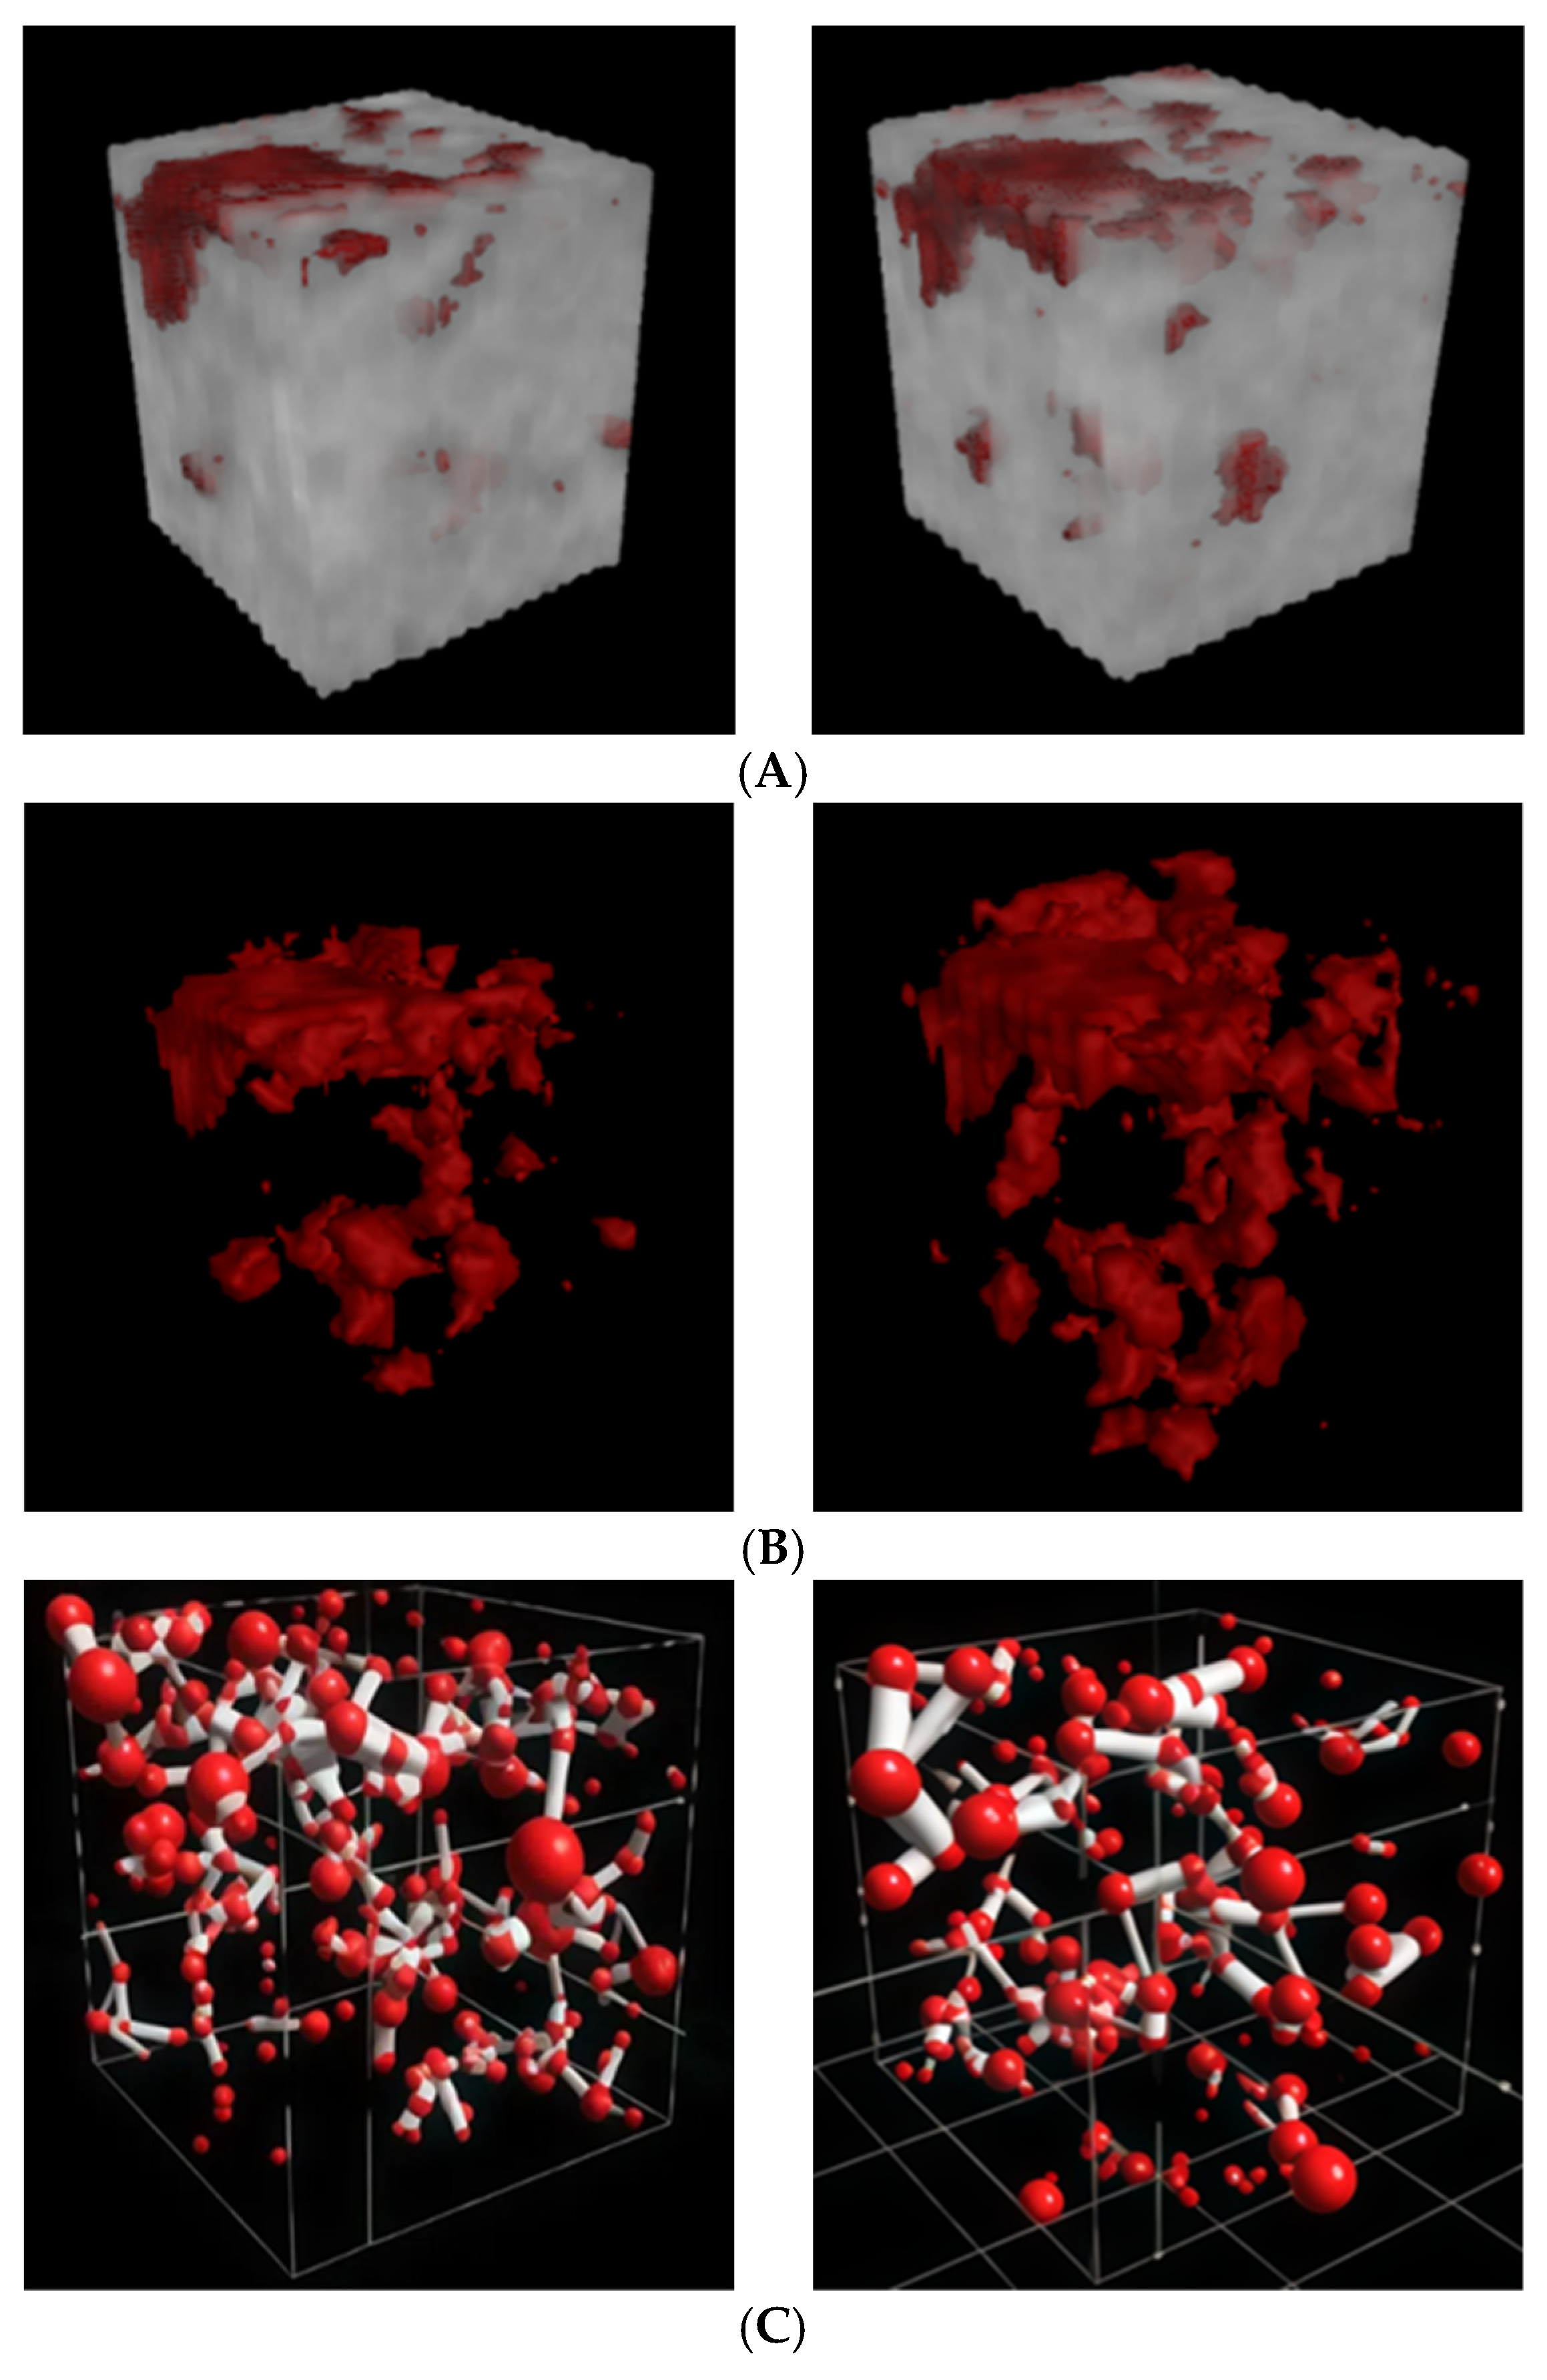
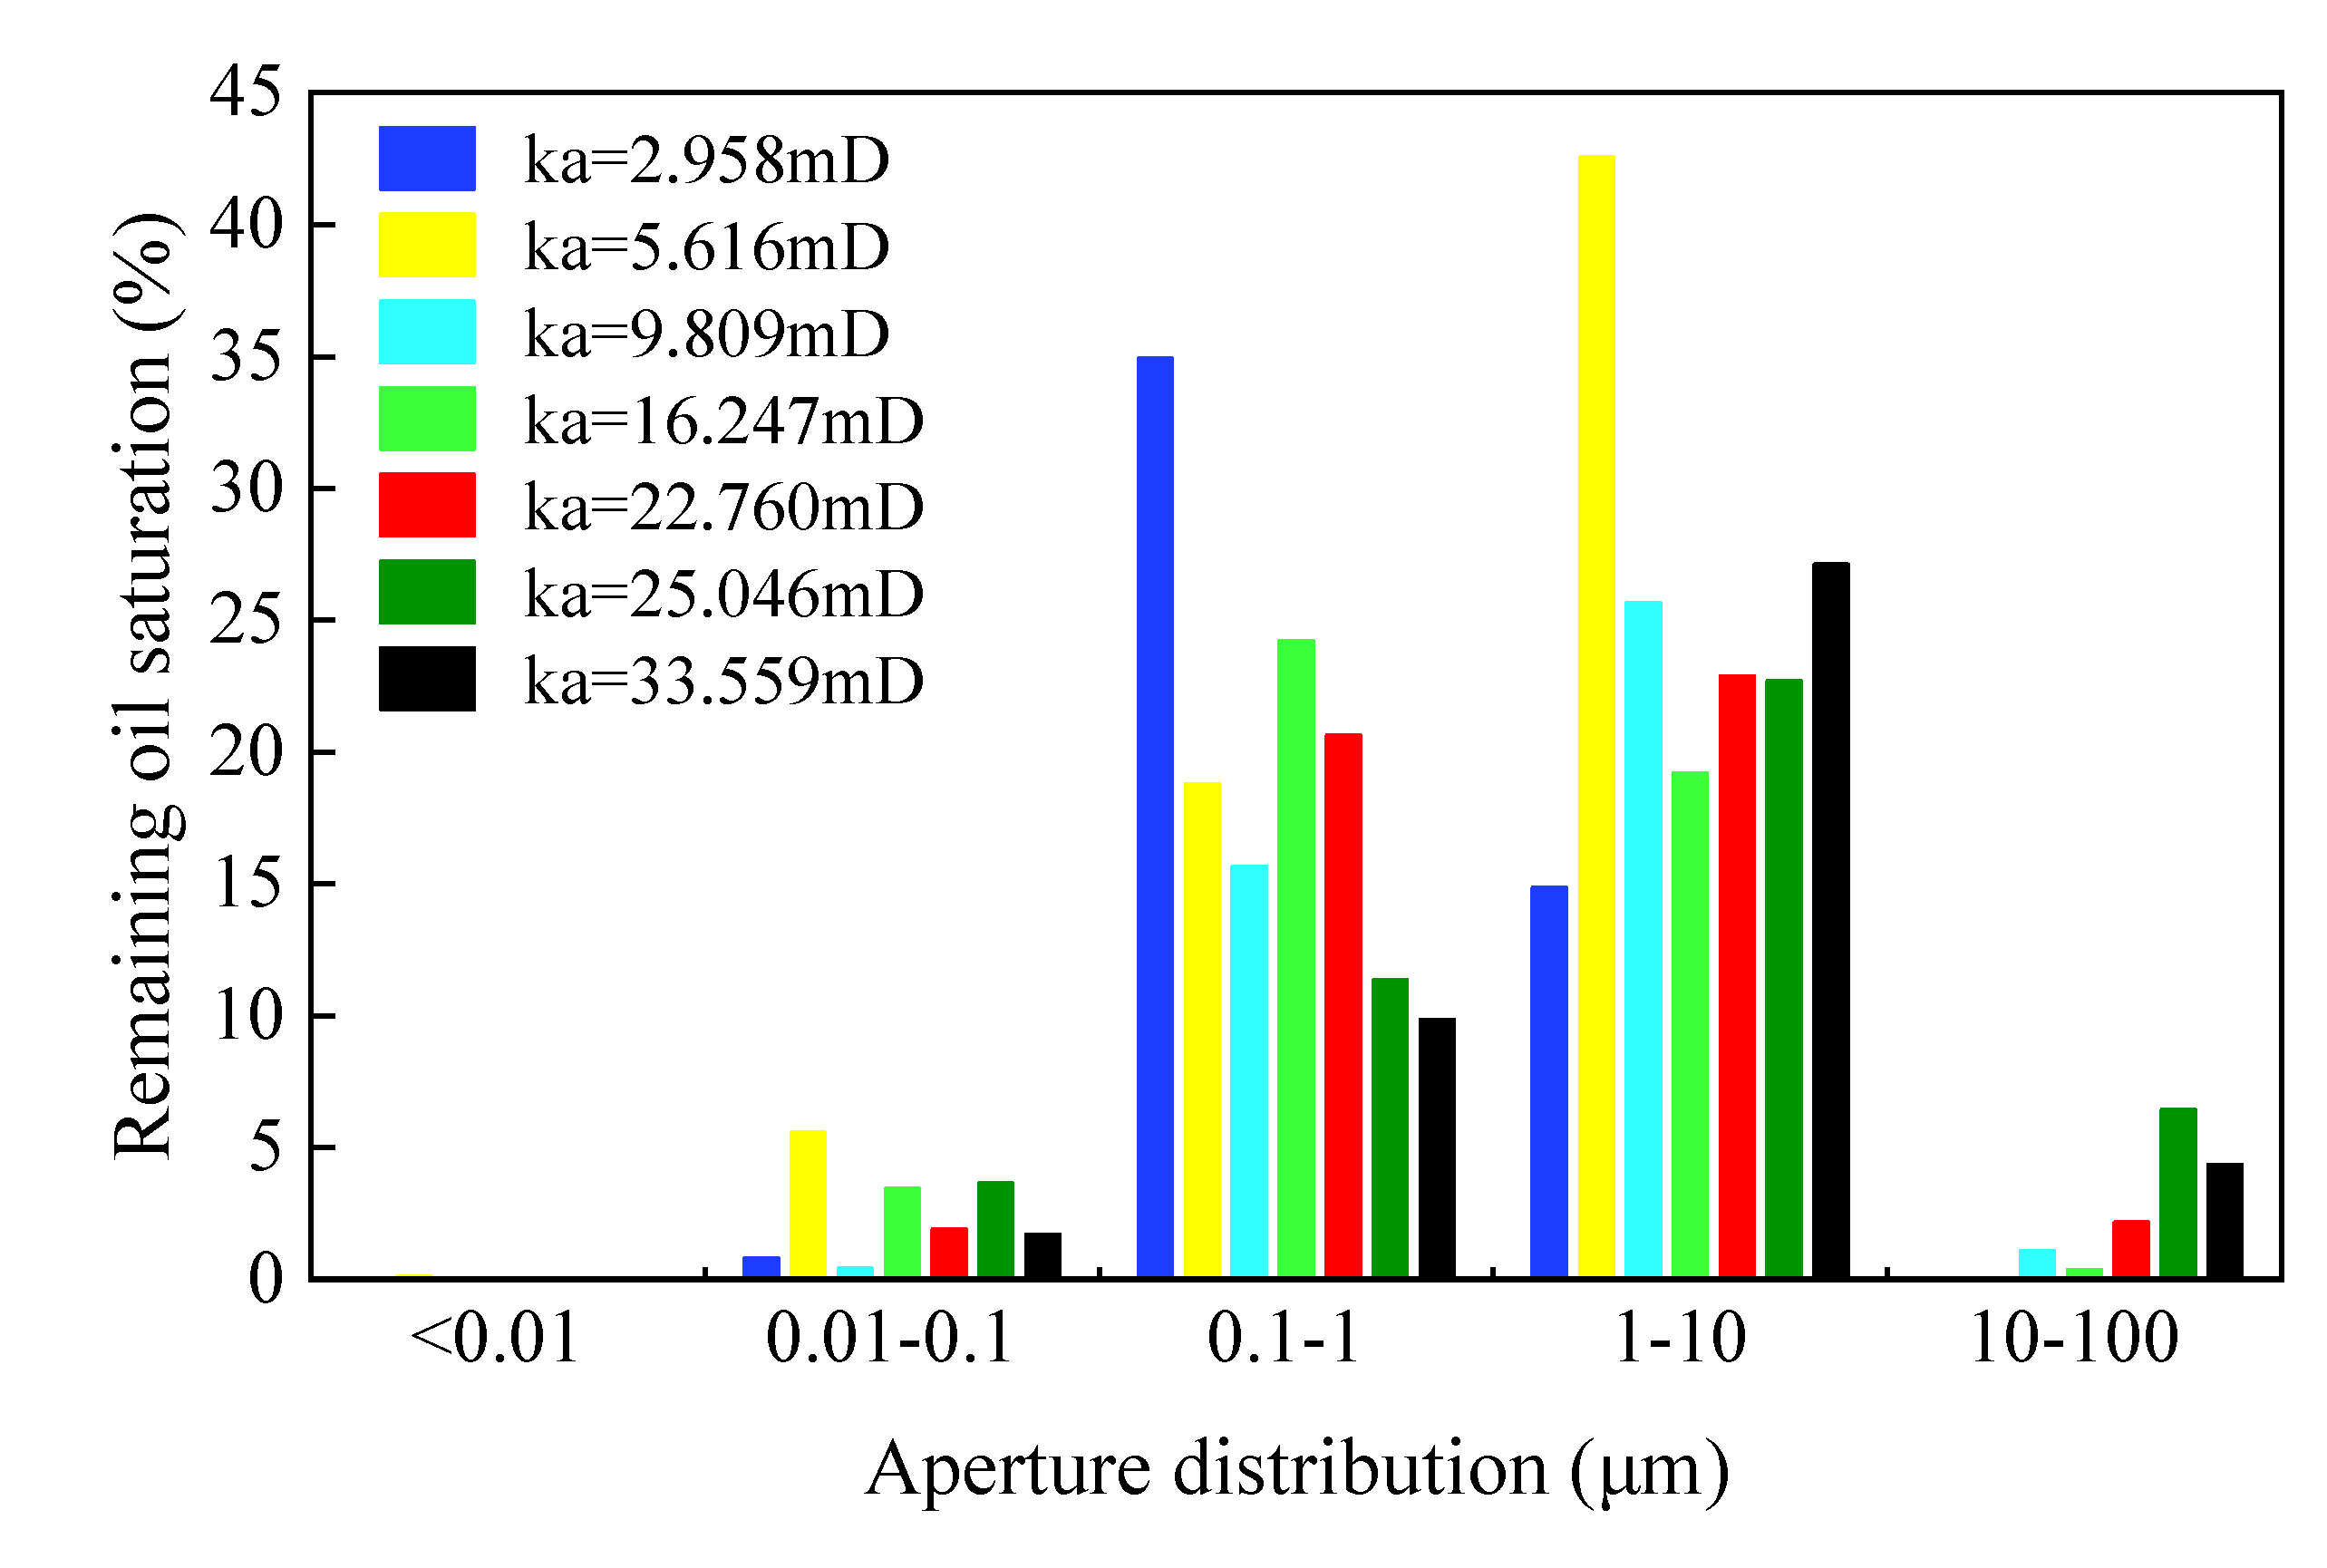
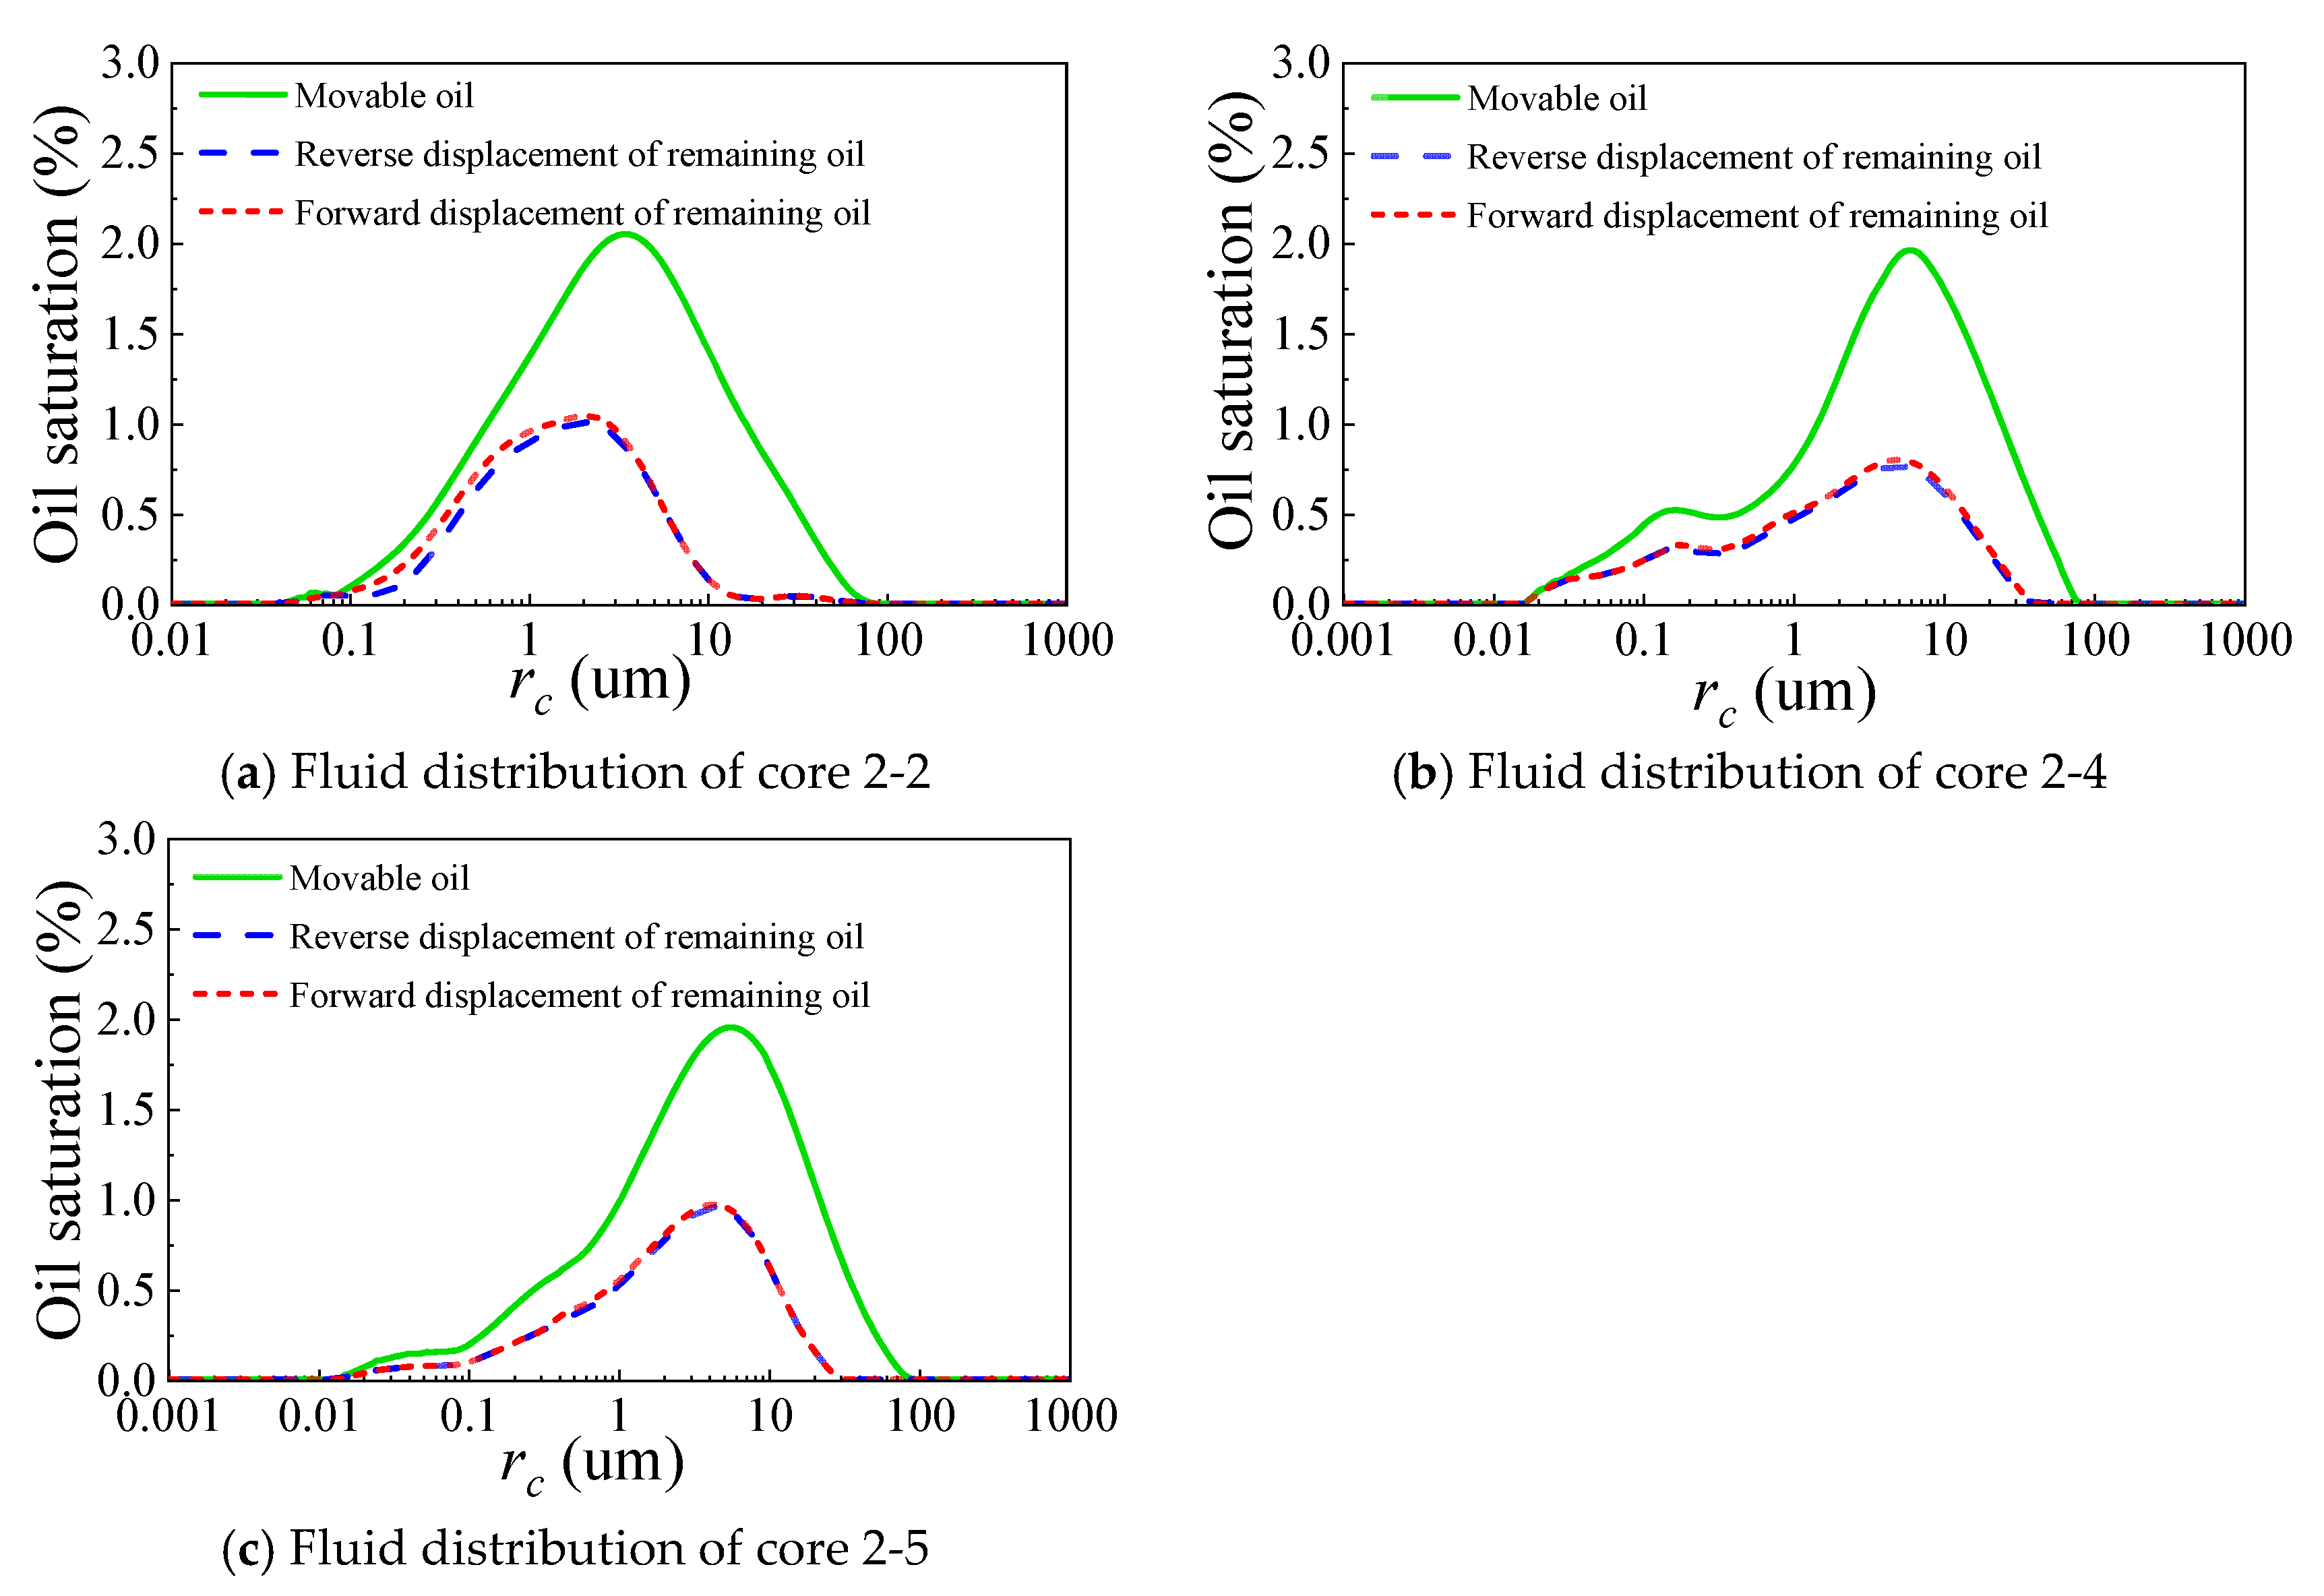
3.3. Analysis of Remaining Oil Distribution Characteristics

The percentage of movable remaining oil refers to the proportion of movable oil in the remaining oil after water flooding, relative to the original total oil content of the core sample. It highlights the movable part of the remaining oil after water flooding, which can accurately characterize the degree of water flooding in the reservoir and the development potential of the reservoir after water flooding.
Based on the analysis of the mechanism of remaining oil formation during water flooding, it is known that the reservoir has formed dominant water flow channels during long-term water injection development. The development of medium and small pores is low, and to reduce remaining oil and improve oil recovery efficiency, injection pressure and injection rate can be controlled to develop the remaining oil in the medium and small pores. From the distribution of remaining oil, it is found that the remaining oil is mainly distributed in the medium pores, with the small pores being mostly occupied by bound water, leaving very little remaining oil. The oil in large pores has mostly been recovered, and there is little oil remaining. This indicates that these pores are the key areas for remaining oil development in the oil field.
The pore diameter is divided into five ranges, and the remaining oil distribution in different cores within these ranges is statistically calculated, as shown in Table 3 and Figure 9. The results show that the remaining oil distribution in the Jilin Xinli block cores follows this pattern: the remaining oil is mainly distributed in pores ranging from 0.1 to 10 μm, accounting for more than 85% of the total distribution. This indicates that medium and small pores are the primary space for later remaining oil recovery. With the increase in permeability, the distribution of remaining oil in the 0.1–1 μm pores gradually decreases, while the distribution in the 1–10 μm pores gradually increases. This indicates that with the increase in permeability, the space for remaining oil recovery shifts towards the medium pores.
Figure 10 shows the curve of fluorine oil saturation in the C7 (2-2) core as it changes with displacement time. It can be seen that during the early stages of displacement, the recovery degree significantly increases, and the remaining oil saturation decreases rapidly. However, as the displacement time increases, this trend gradually slows down. Yet the rate of decline does not approach zero, indicating that there is still potential for further remaining oil recovery in the later stages.

4. Analysis of Factors Affecting Oil Displacement Efficiency

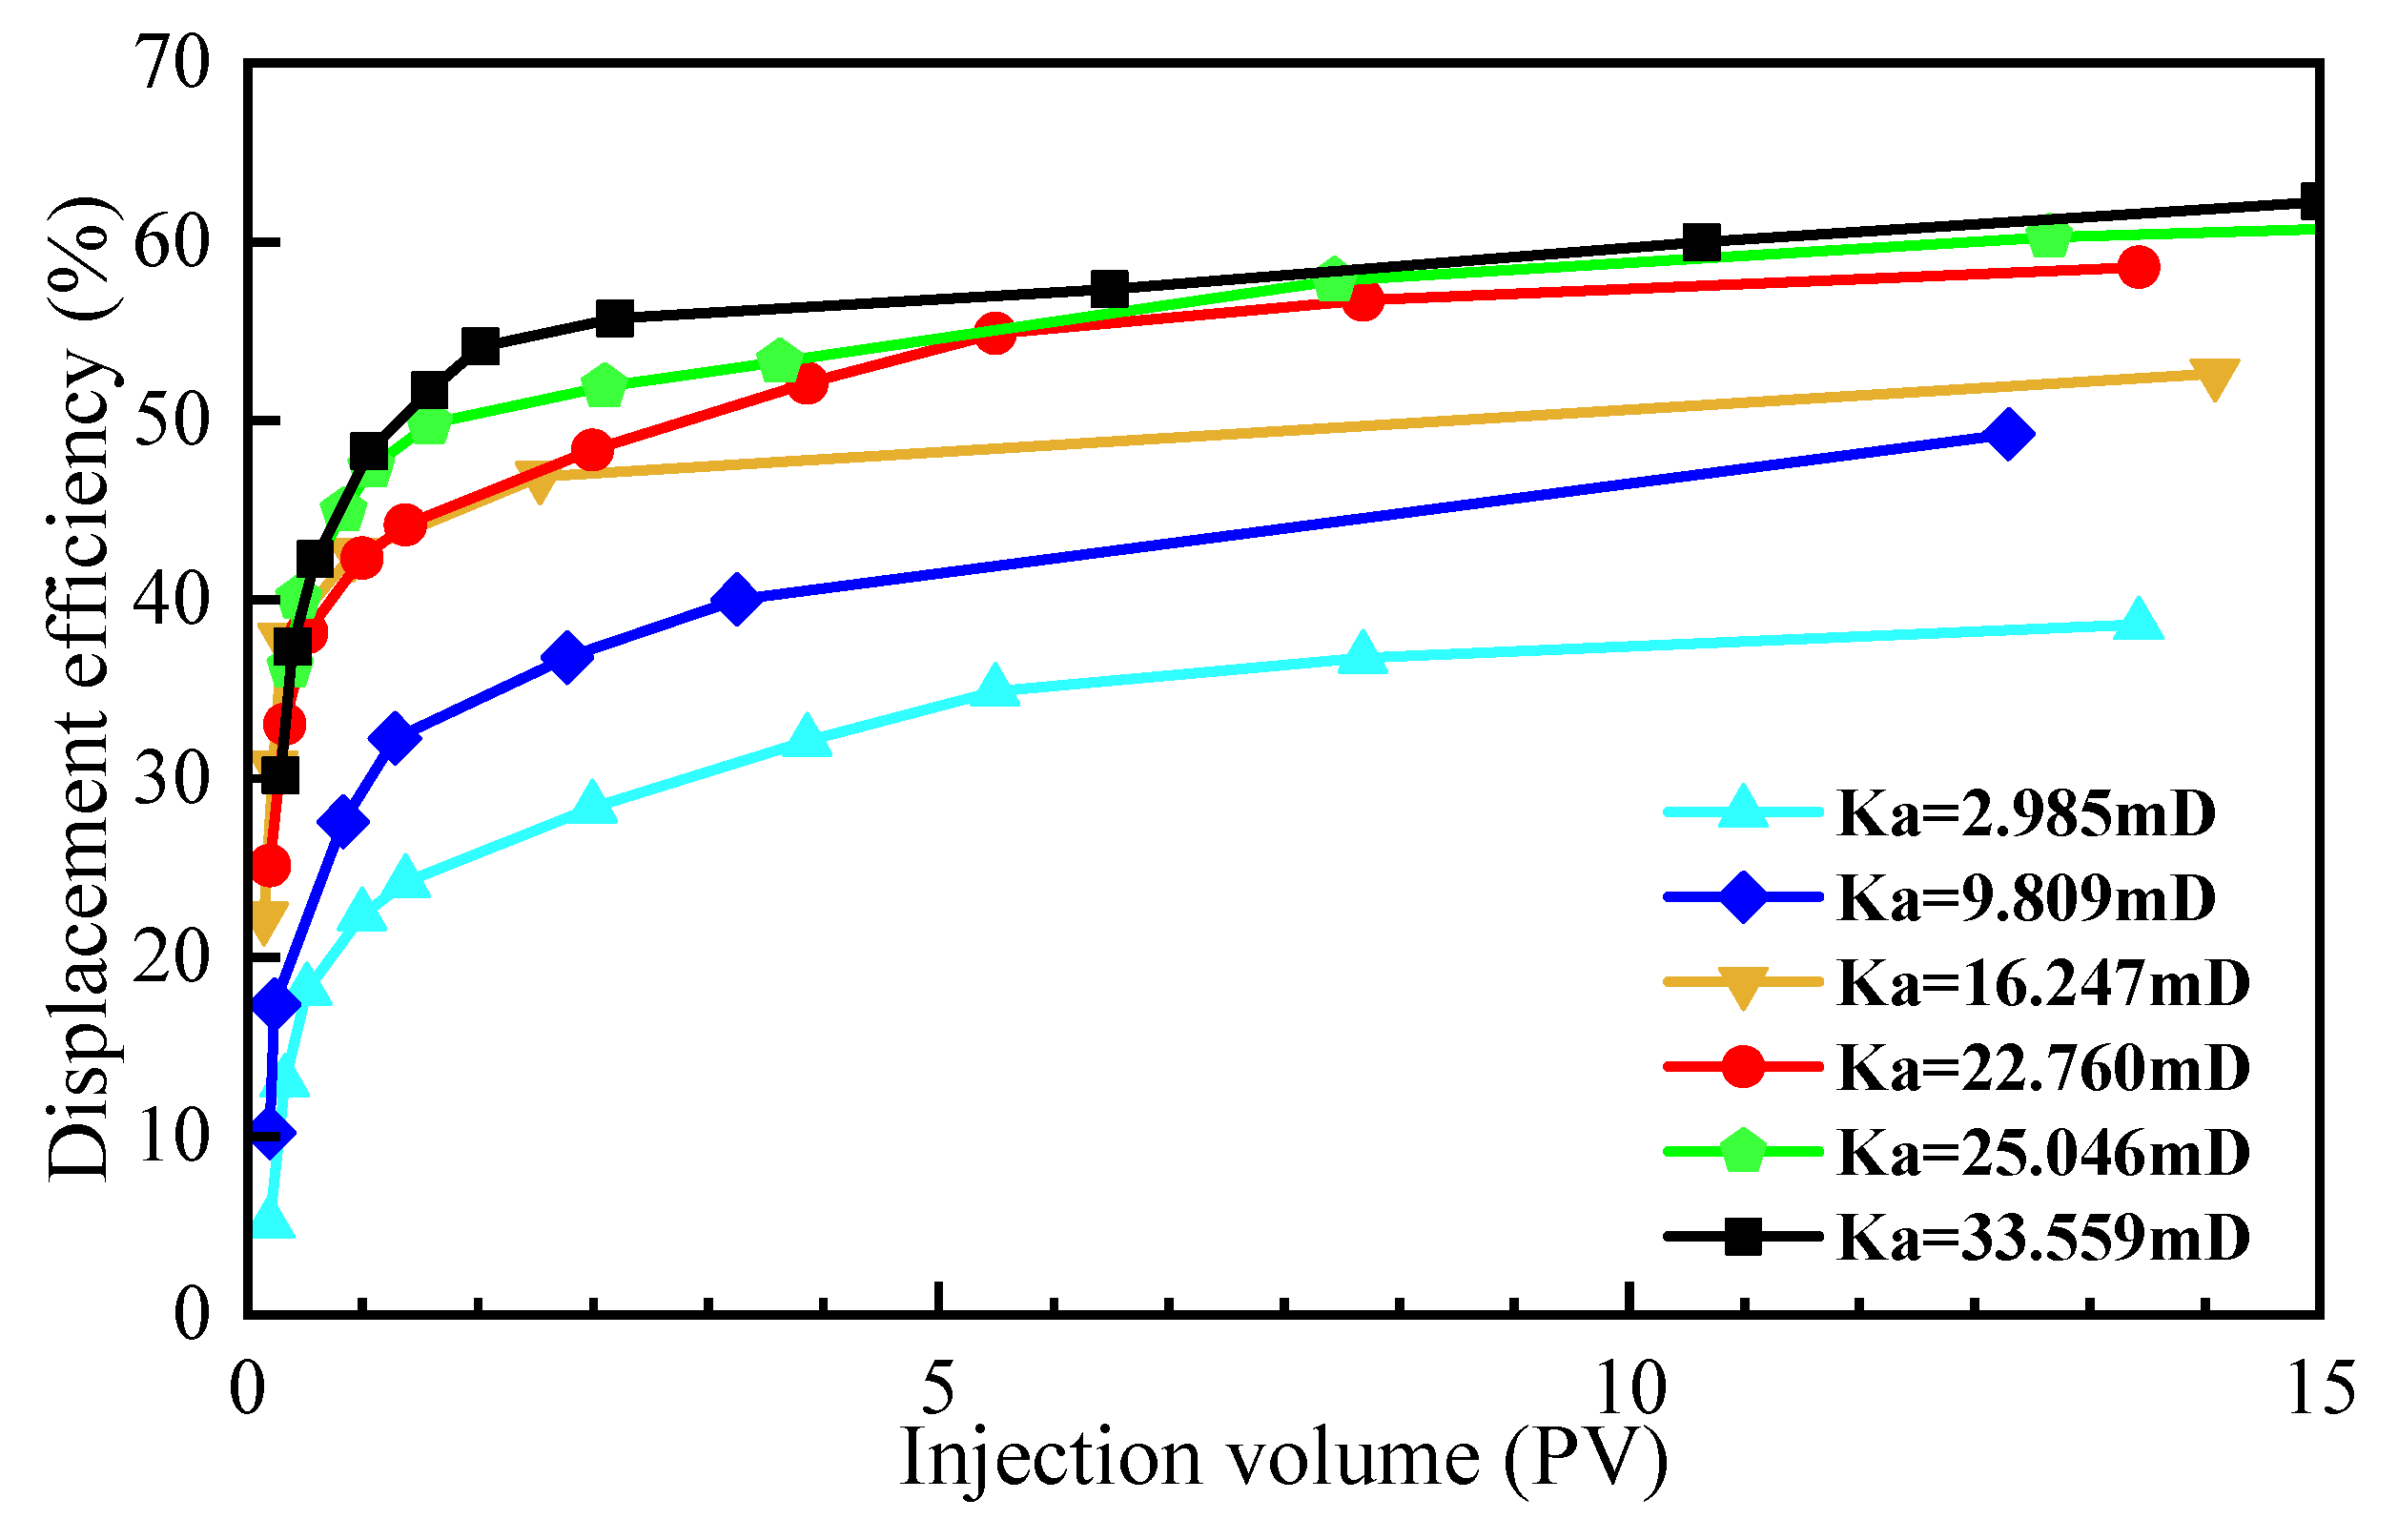
4.1. Variation Pattern of Movable Oil Distribution and Oil Recovery Efficiency in Reservoirs with Different Permeabilities

A scatter plot showing the relationship between movable oil saturation, oil recovery efficiency, and permeability for the seven cores tested by NMR is presented in Figure 11 and Figure 12. From the figure, it can be observed that movable oil saturation has a strong linear relationship with permeability, increasing as permeability rises. Oil recovery efficiency also increases with permeability, but the linear relationship is weaker.

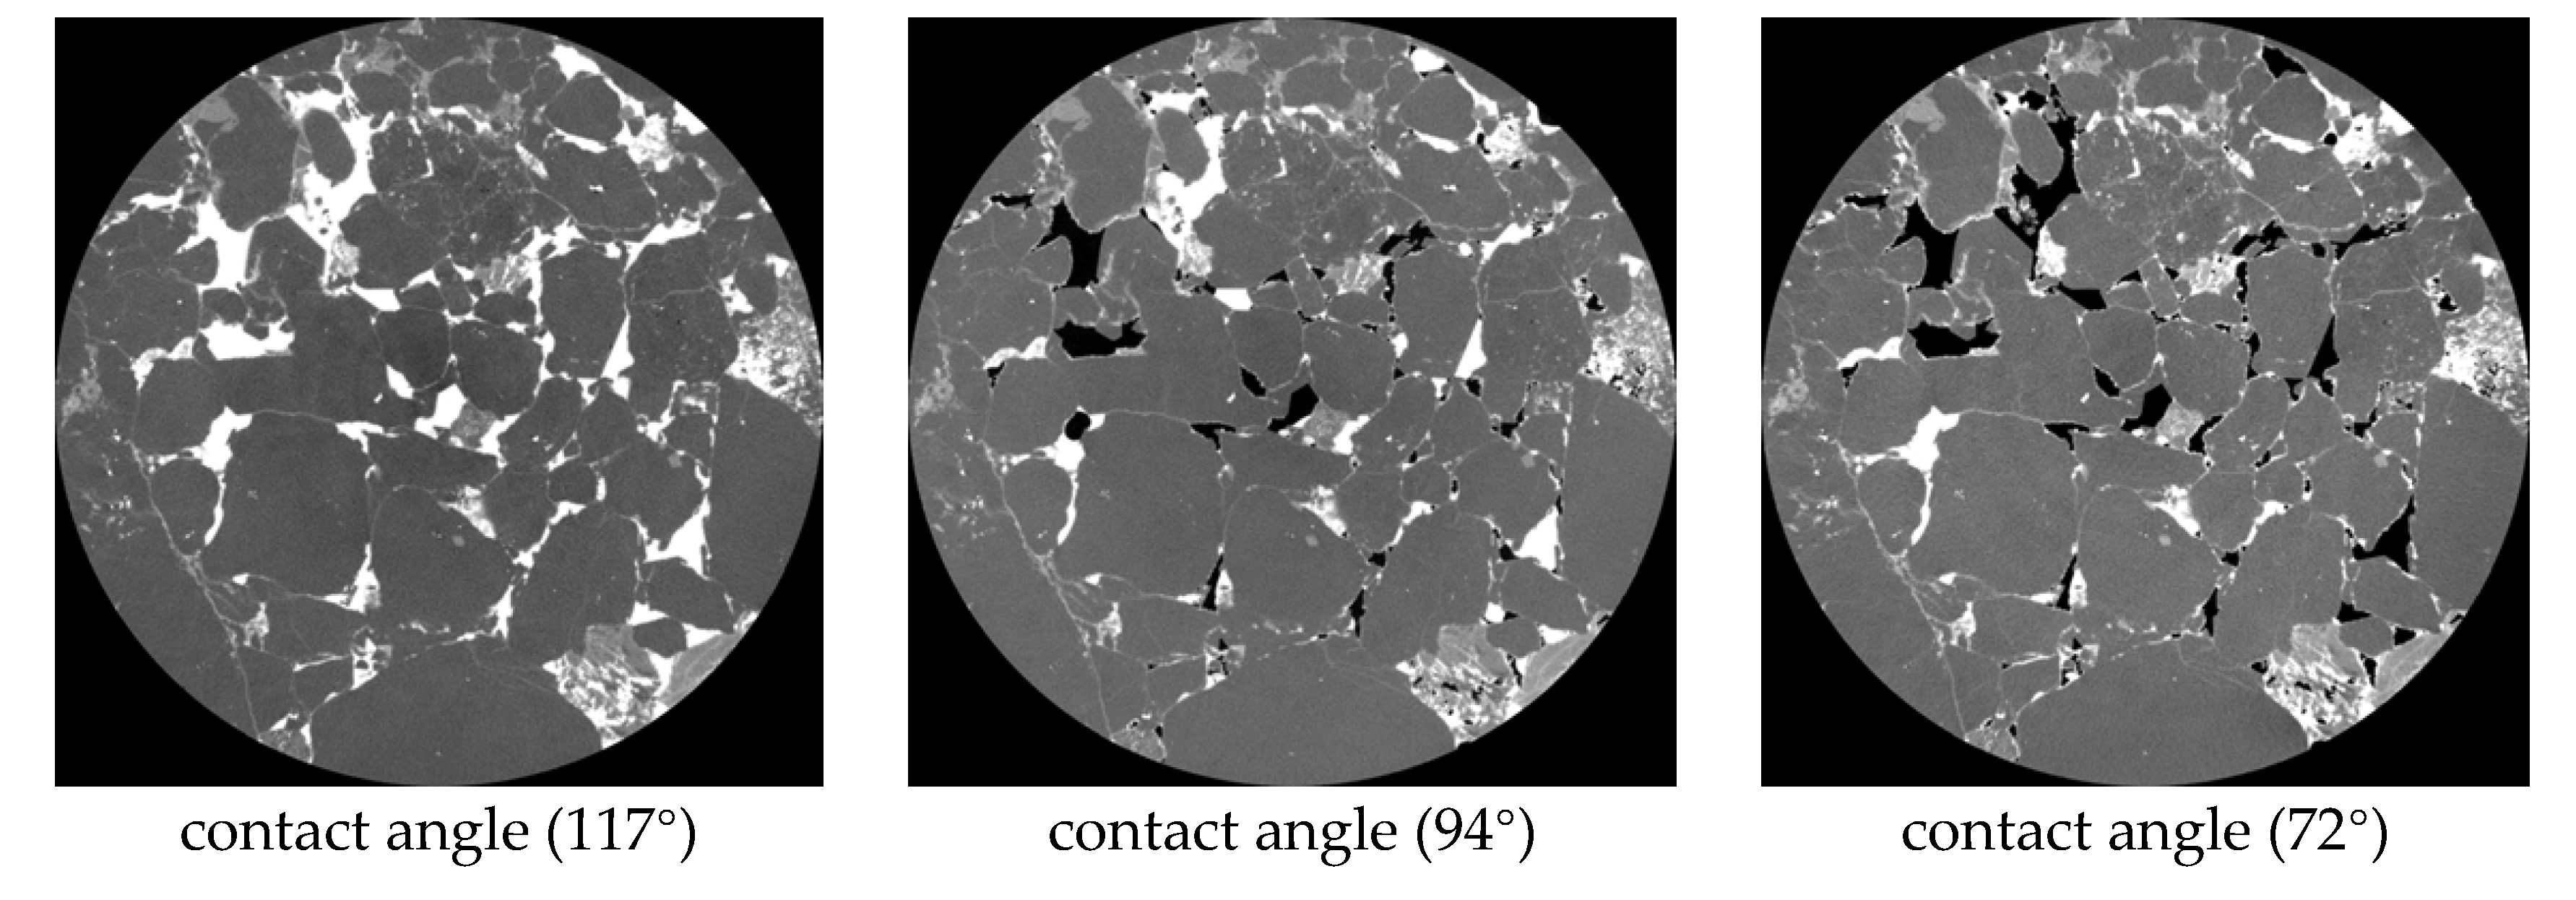
4.2. The Influence of Wettability

By injecting an organic solvent to dissolve the oil film adhered to the rock surface, the hydrophilicity of the rock can be regulated. As shown in Figure 13, the recovery efficiency curves under different wettability conditions clearly demonstrate that the wettability of the rock significantly affects the ultimate oil recovery. In the figure, stages I, II, and III correspond to oil-wet (contact angle 117°), intermediate-wet (contact angle 94°), and water-wet (contact angle 72°) conditions, respectively. The final oil recoveries for these three stages are 29.51%, 38.19%, and 50.35%, respectively. Under identical displacement velocities, porous media with different wettability exhibit distinct production dynamics: in weakly hydrophilic media, capillary forces act as a driving force that promotes spontaneous imbibition; in neutrally wet media, the effect of capillary forces is nearly absent; and in oil-wet media, capillary forces instead act as a resistance to flow. This variation results in significantly higher oil recovery from water-wet reservoirs compared to neutral-wet and oil-wet reservoirs.
Figure 14 shows the distribution of residual oil under different wettability conditions. It is evident that as the contact angle decreases, the rock surface becomes more hydrophilic, and the overall amount of residual oil gradually decreases. Under hydrophobic or neutrally wet conditions, the oil phase tends to adhere to pore walls, resulting in encapsulation or entrapment, with residual oil more concentrated and less responsive to water displacement. In strongly hydrophilic conditions, the water phase preferentially occupies the rock surface and pore throats, more effectively displacing the oil phase. Consequently, residual oil transitions to a discontinuous phase distribution, leading to improved recovery efficiency.

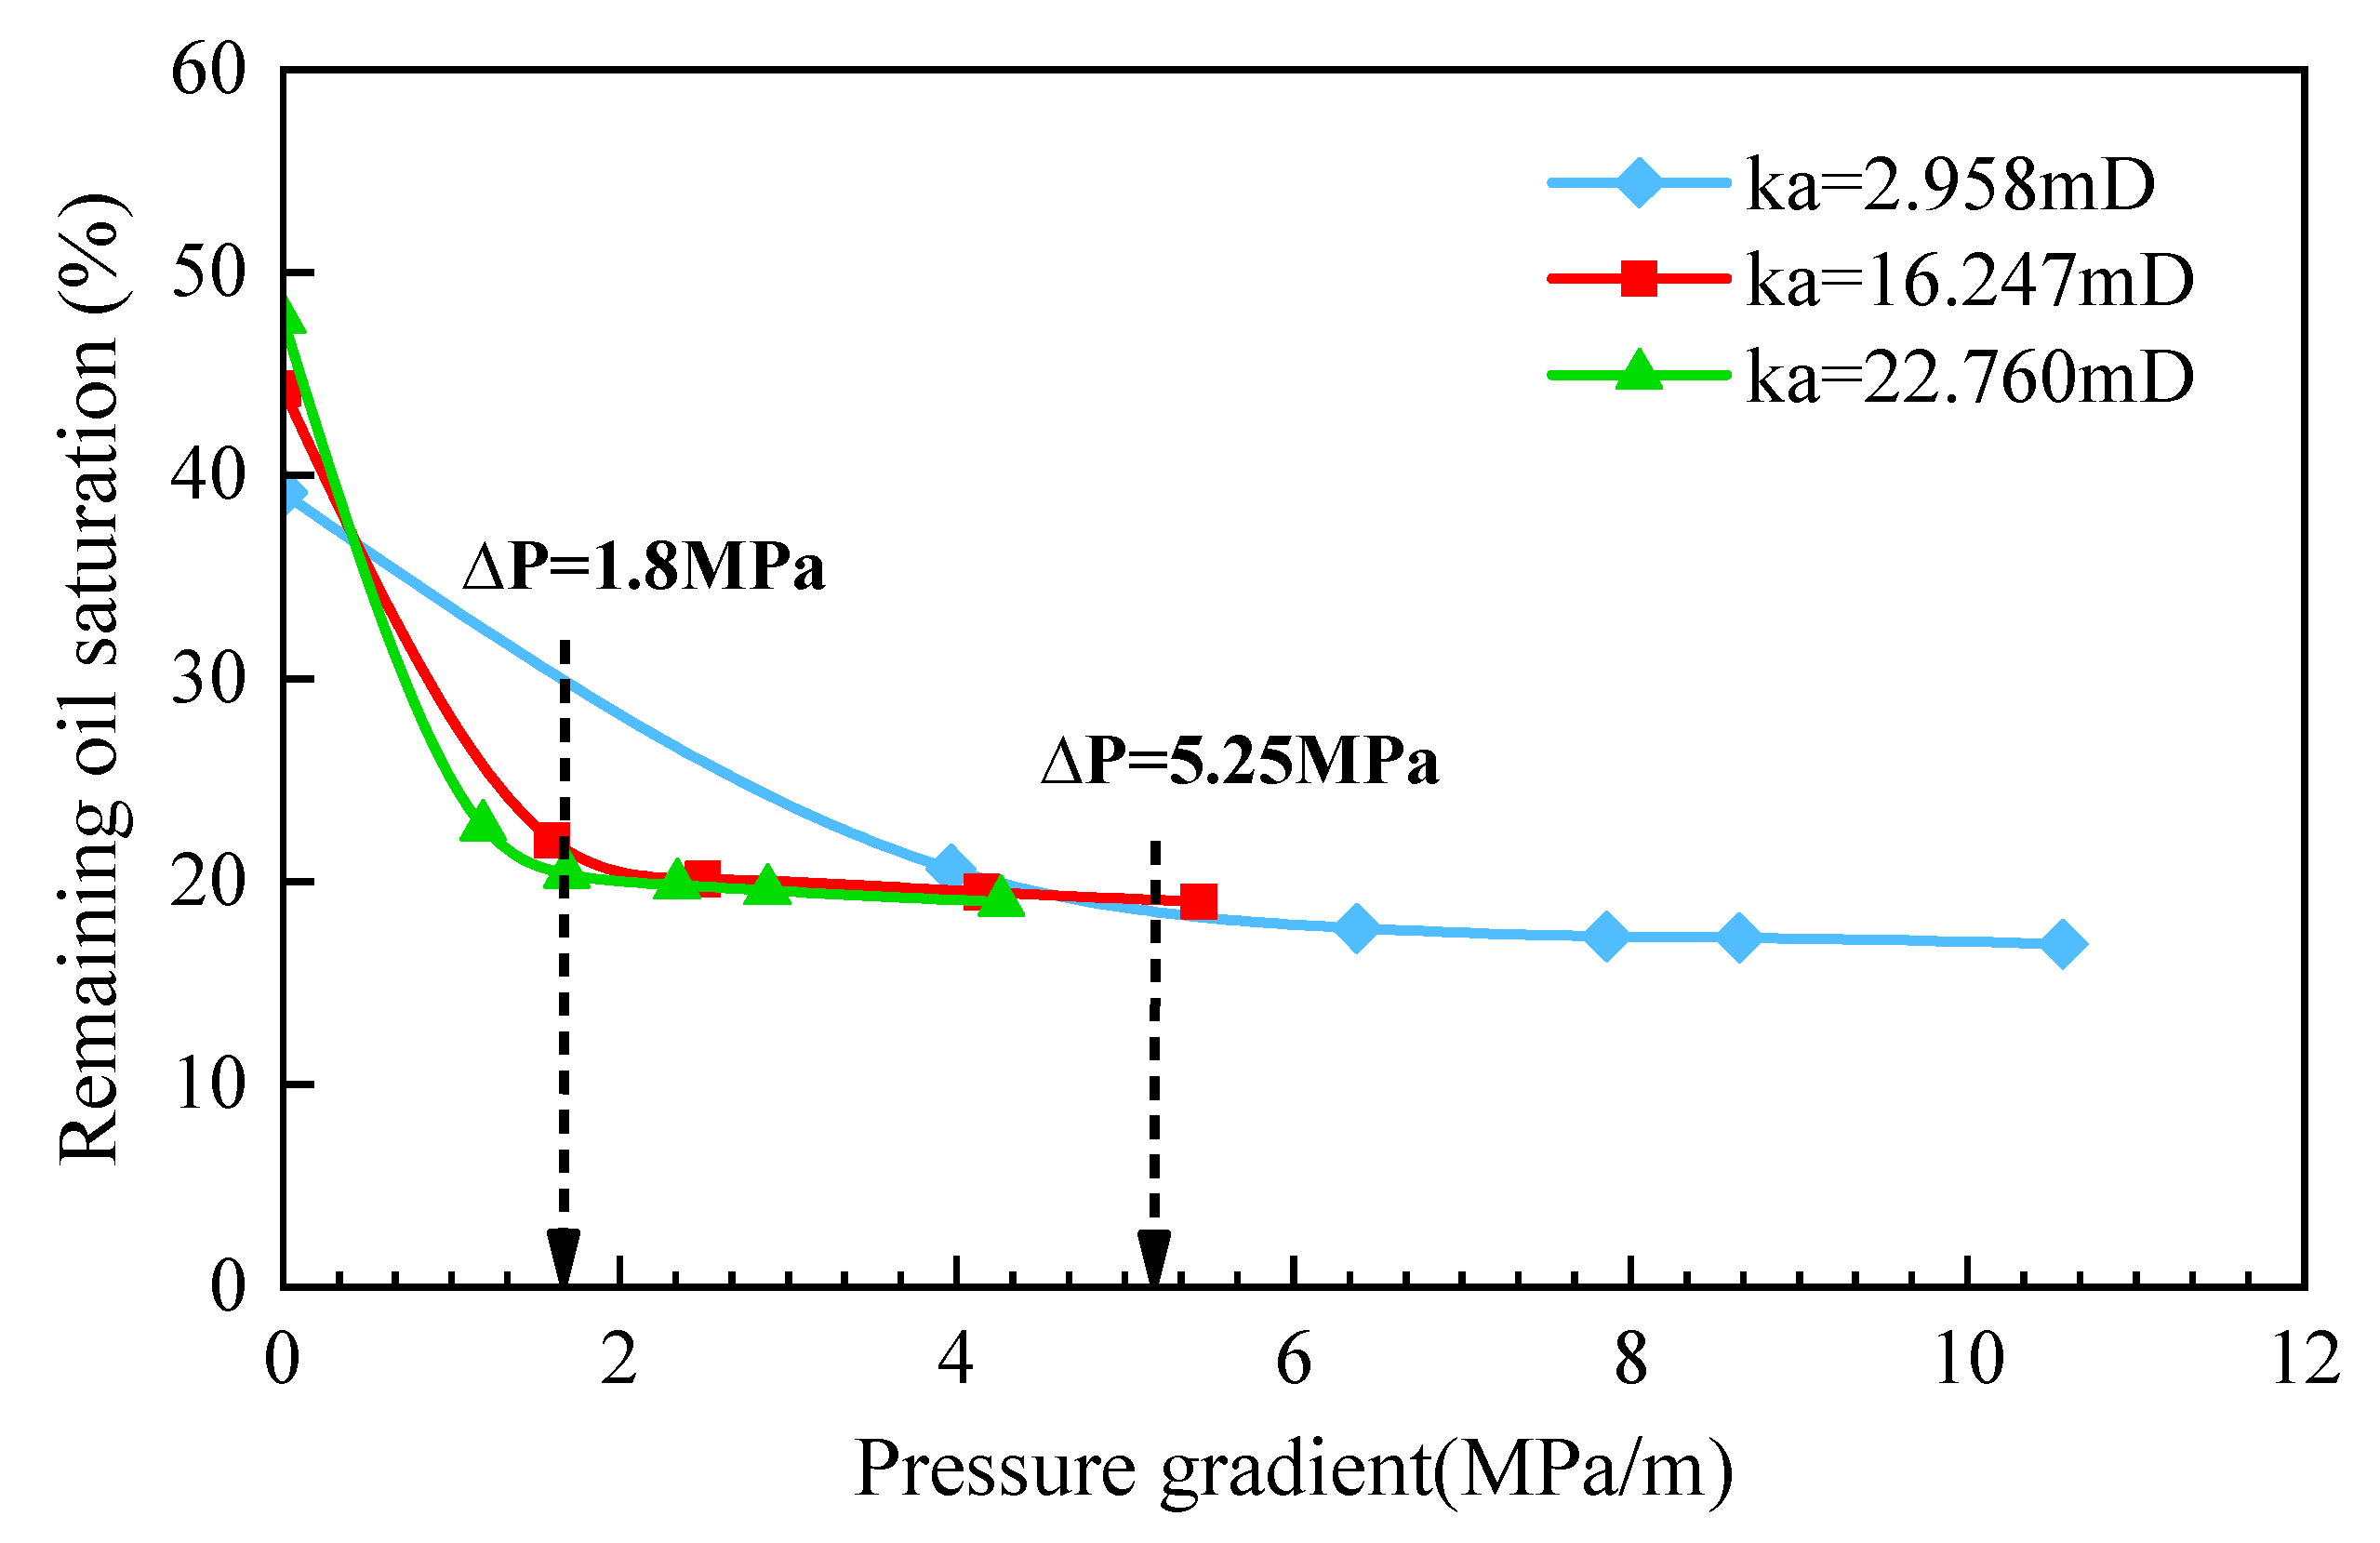
4.3. The Influence of Pressure Gradient

Three cores with different permeability levels were selected for water flooding experiments to investigate the impact of increasing pressure gradients (designed based on the actual water injection rate of 0.01 mL/min in the Oilfield). The relationships between displacement efficiency, remaining oil saturation, and pressure gradient are shown in Figure 15 and Figure 16. As the pressure gradient increases, the displacement efficiency of low-permeability reservoirs improves significantly. However, after the pressure gradient reaches 5.25 MPa/m, the rate of increase becomes negligible, and the remaining oil saturation remains essentially unchanged. For high-permeability reservoirs, the increase in displacement efficiency diminishes after the pressure gradient exceeds 1.80 MPa/m, and the remaining oil saturation also remains largely unchanged.

4.4. The Effect of Injection Water Multiples

Figure 17 illustrates the oil recovery efficiency of cores with different permeabilities under varying injection water multiples. As shown in the figure, in the core with a permeability of 2.98 mD, the oil recovery efficiency increases from 5.12% to 38.60%; although the injection volume continuously increases, the rate of improvement in recovery efficiency is relatively slow. In contrast, the core with a permeability of 33.2 mD achieves an oil recovery efficiency of 30.19% at a lower injection volume, and as the injection volume increases, the oil recovery efficiency rises rapidly, ultimately reaching 62.26%. It is clearly evident from the figure that with the increase in injection water multiples, the oil recovery efficiency of cores with different permeabilities shows an upward trend. At a low water injection multiple of 1 PV, the oil displacement efficiency of all cores increases rapidly. However, when the injection multiple reaches 3–10 PV, the displacement efficiency of high-permeability cores shows a slower increase or tends to stabilize, while low-permeability cores exhibit a relatively higher growth rate in displacement efficiency compared to their high-permeability counterparts.

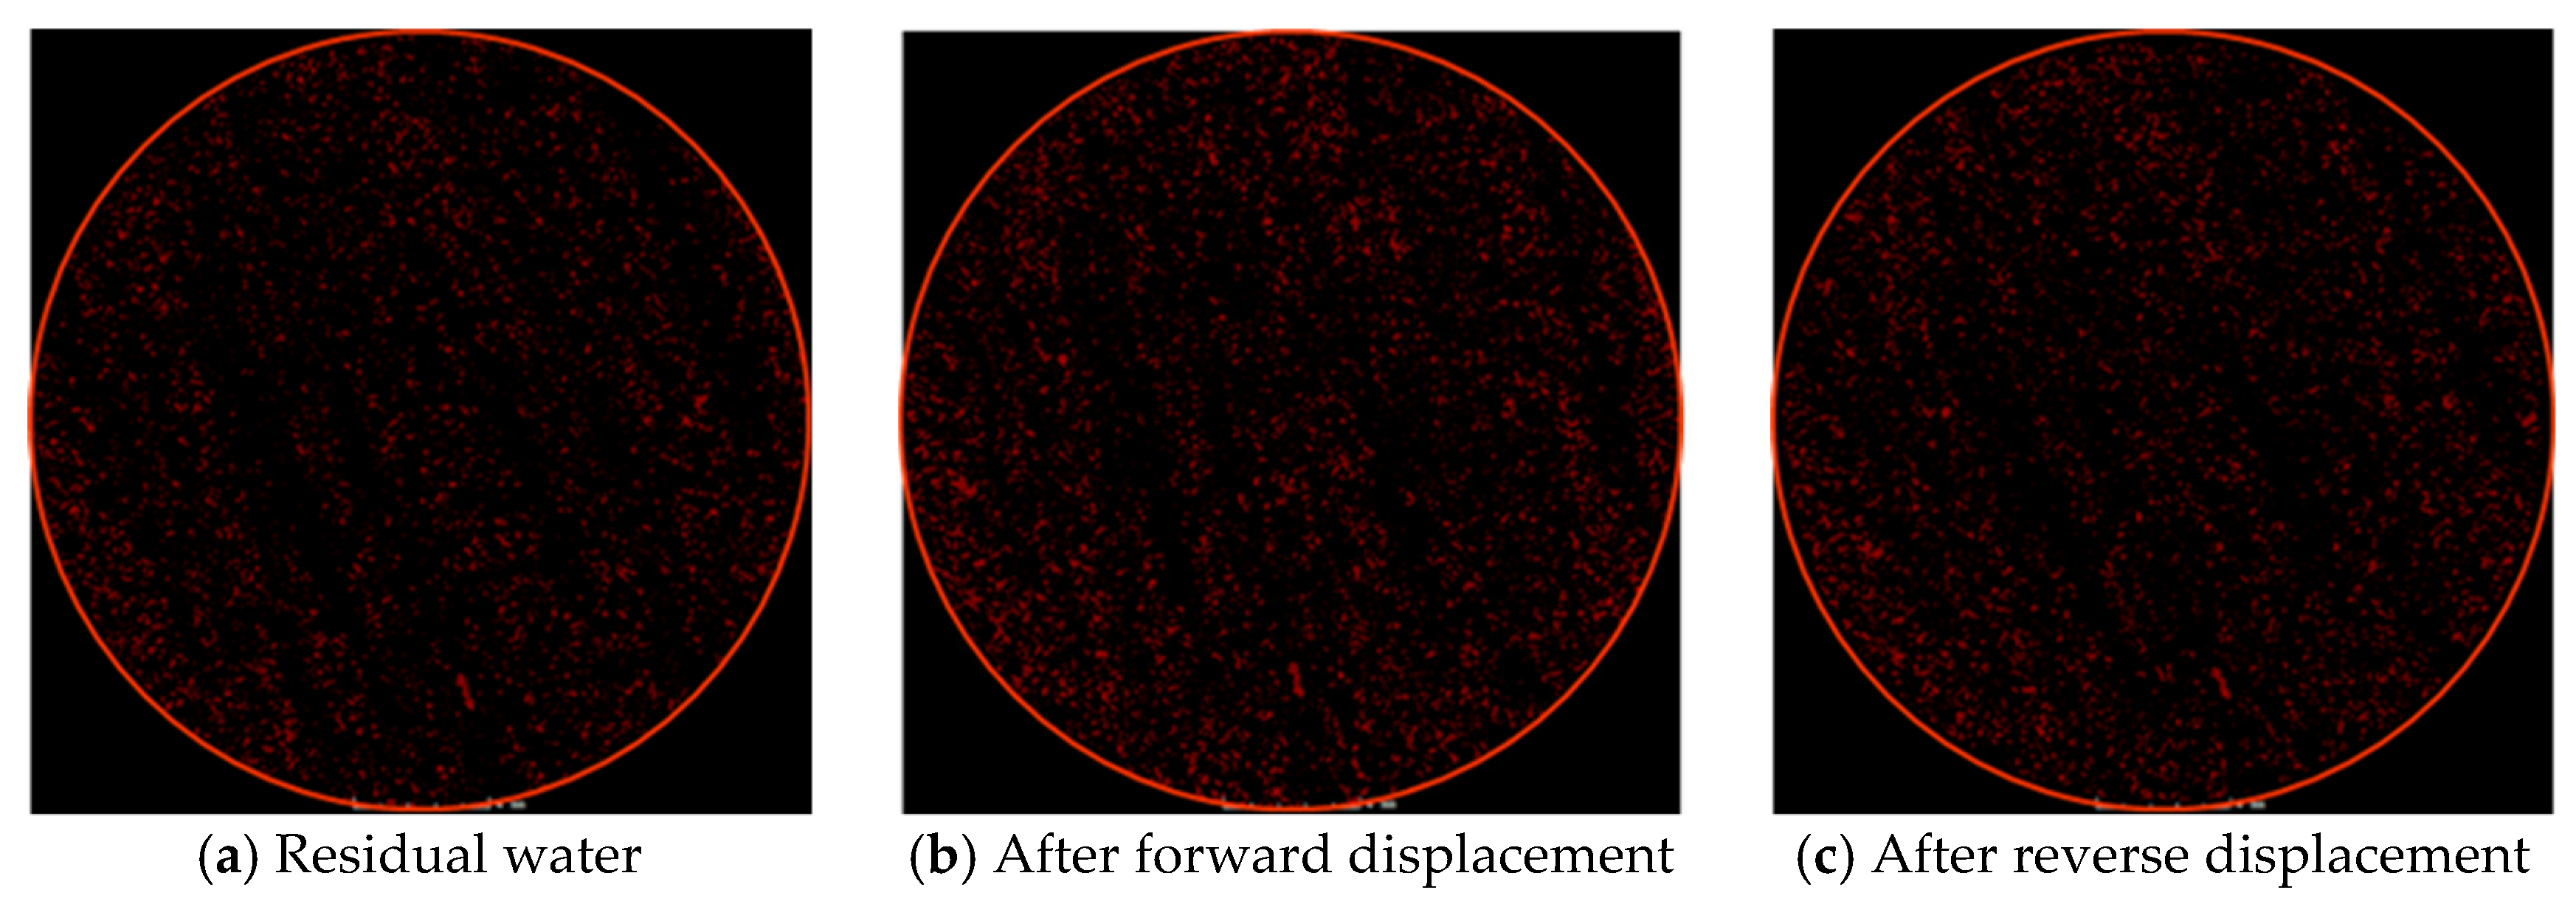
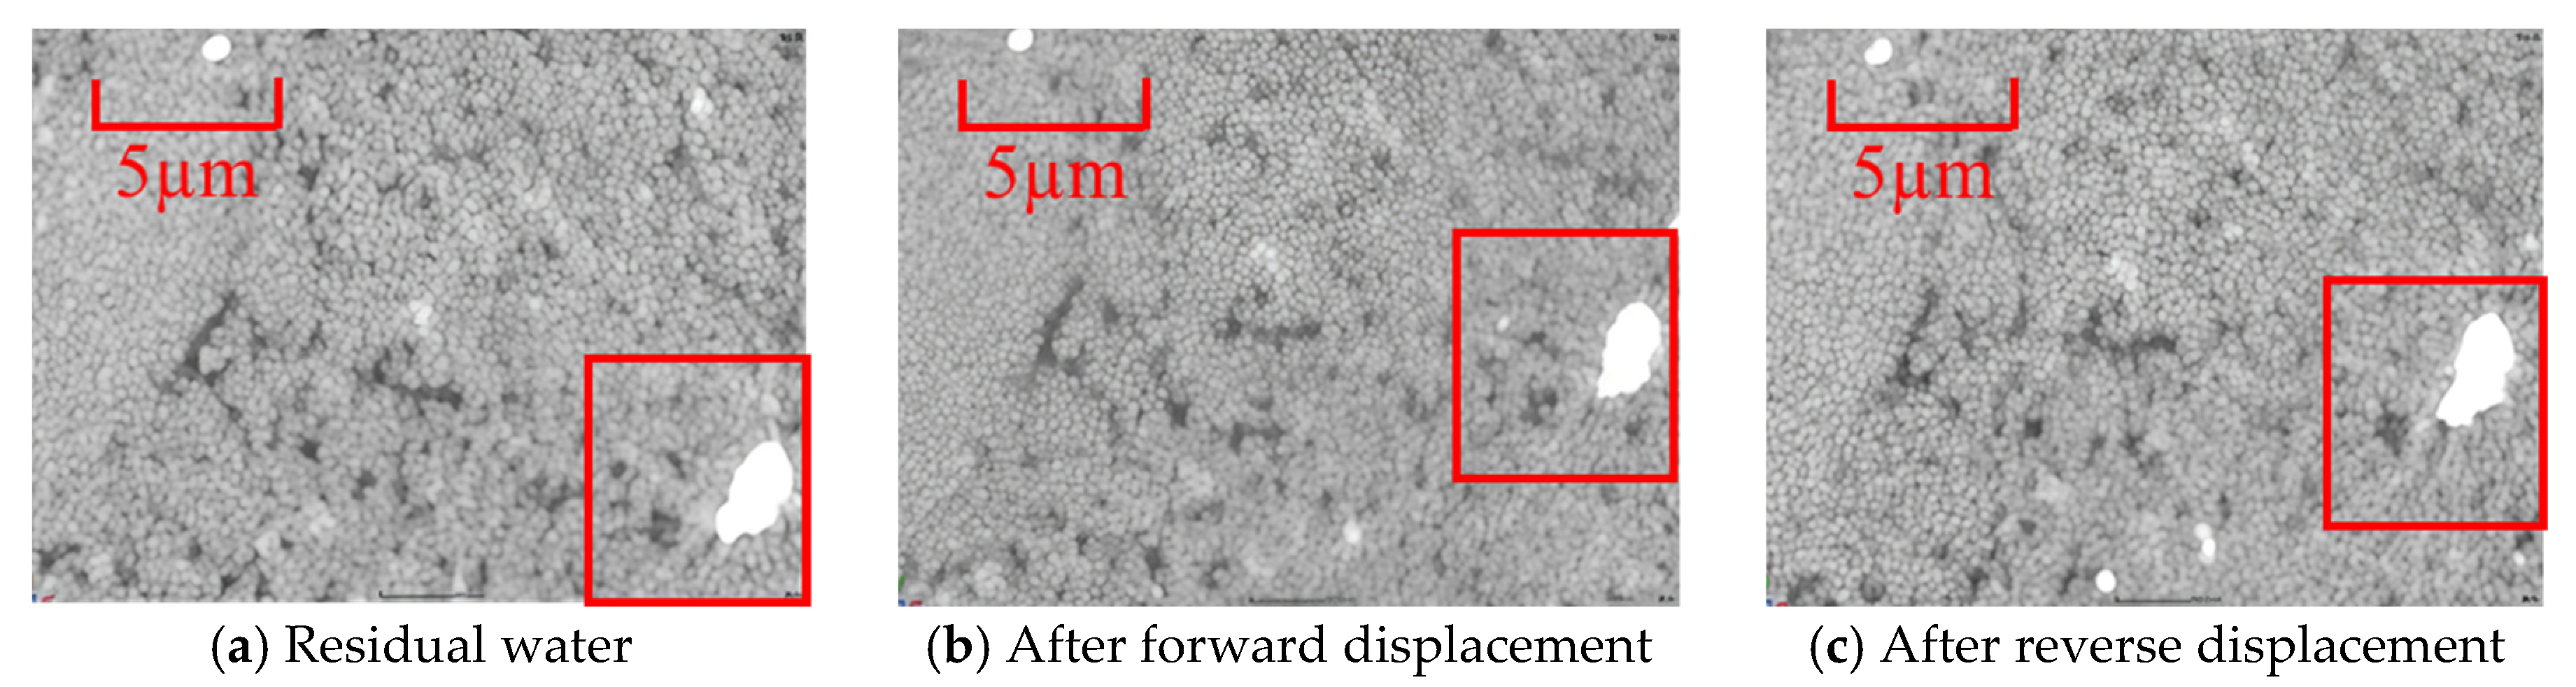
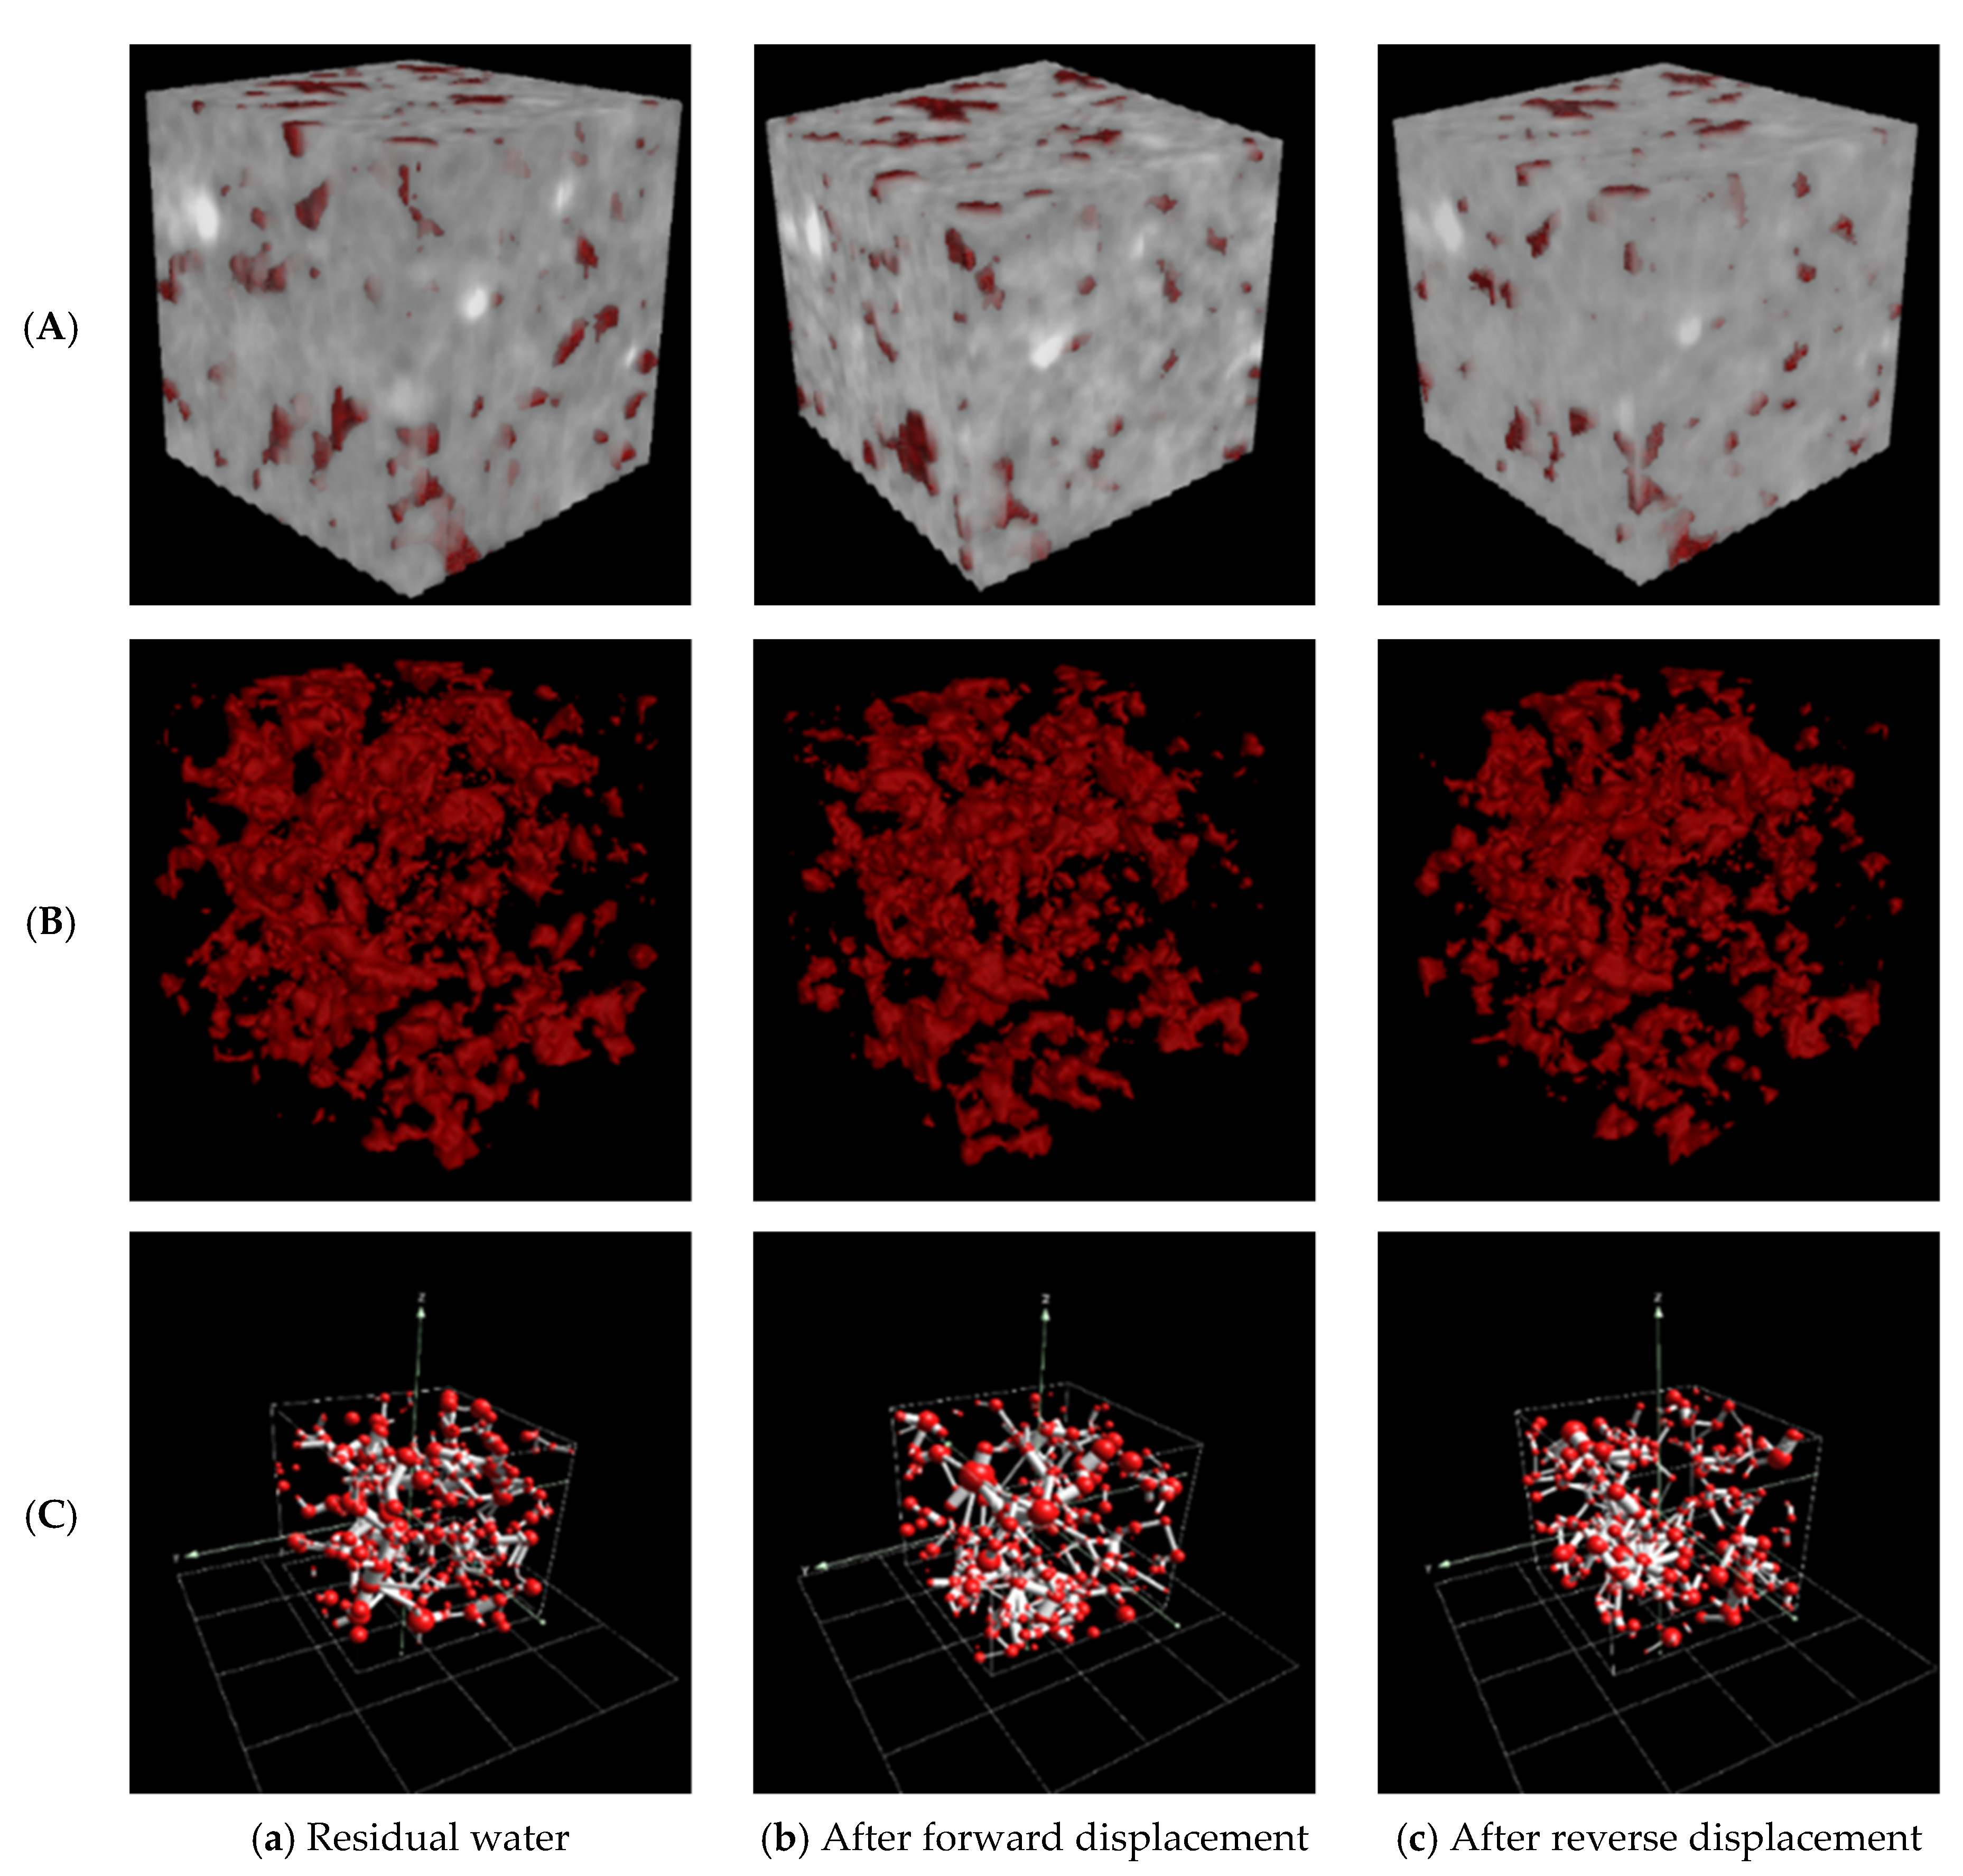
4.5. Effect of Reverse Displacement on Microscopic Fluid Distribution

The underlying physical mechanism by which reverse displacement enhances oil recovery in low-permeability cores lies in its ability to dynamically adjust the pressure field, effectively mitigating the effects of capillary resistance lag and microscale heterogeneity inherent in low-permeability reservoirs. By periodically altering the injection direction, reverse displacement disrupts the original capillary equilibrium, thereby mobilizing previously trapped residual oil. Additionally, the reverse pressure gradient counteracts the capillary resistance encountered during forward flooding, reactivating microfractures and tortuous pore channels oriented in various directions, and ultimately improving the microscopic sweep efficiency of the displacing fluid.
Water flooding experiments were conducted on three cores with varying permeability levels. Once oil production ceased under forward flooding, reverse displacement was implemented. The resulting changes in displacement efficiency are summarized in Table 4. As shown, reverse displacement led to a substantial improvement in displacement efficiency for low-permeability cores, whereas the enhancement was relatively modest in cores with higher permeability. In high-permeability media, capillary forces are relatively weak, and the perturbations introduced by reverse displacement are insufficient to remobilize the trapped oil phase. Compared with low-permeability cores, high-permeability cores generally achieve higher recovery during forward flooding, thereby limiting the incremental potential of reverse displacement.
Figure 18 shows that during reverse displacement, low-permeability cores (9.809 mD) mainly mobilize small pores (0.1–3 μm) and a small number of medium pores. Medium-high permeability cores (25.046 mD) mobilize pores in the range of 0.2–10 μm with uniform utilization across pore sizes. High-permeability cores (33.559 mD) primarily mobilize medium and small pores (0.4–8 μm), with minimal and uniform mobilization across pore sizes. The reason for this phenomenon is that in low-permeability cores, the lower seepage velocity of injected water during reverse displacement facilitates the mobilization of remaining oil in small pores. Conversely, in high-permeability cores, the higher seepage velocity causes the water to flow directly through the dominant channels, making it difficult to displace remaining oil further.
In order to verify the changes in core pore size during the bidirectional displacement process, a core sample with uniform texture was selected to avoid potential interference caused by the core’s initial structural heterogeneity. Figure 19 presents the fault pore distribution scan images under different displacement conditions. As seen in the figure, after different displacement experiments, the CT value changes in the core sample’s cross-section are relatively stable, and the differences in the core’s pore distribution are minimal. The pore structure of the core sample maintained good stability, with no significant pore changes or uneven distribution observed.
During the displacement experiment, CT slice scans were performed at different stages of the experiment to gain a deeper understanding of the pore changes in the core at each stage. Figure 20 shows a local schematic diagram of the CT scan slices at the same position in the core. From the slice images, it can be observed that under bound water saturation conditions, the boundary between the fluid space and rock particles is relatively clear, and the pore structure is more distinct and clearer. However, during the forward water displacement to remaining oil stage, the number of pores in the slice images decreases relatively, and the volume of some pores also shrinks. This indicates that in this stage, the water displacement process causes the fluid in the pores to be displaced, leading to a reduction in pore space, while the fluid density in the pores increases and the difference between the fluid and rock density gradually decreases, reflecting the effect of the water displacement process on the core’s pore structure. In the reverse displacement stage, some pores in the images start to become clearer, indicating that under the reverse driving action, the oil trapped by capillary forces and other factors begins to reaggregate.
In order to further characterize the changes in remaining oil during the displacement process, 3D extraction was performed at the same position in the core at different CT scan stages. The extracted data volume was 100 × 100 × 100 μm, and the 3D reconstruction of the digital core representing the unit cell was carried out using the maximum sphere method to obtain the corresponding pore network model [32,33]. Figure 21 shows the pore network model before and after the displacement experiment, where the 3D view of the pore network model uses red spheres to represent the pores and white cylinders to represent the throats. As shown in Figure 19, under the condition of bound water saturation, the oil content in the pore space of the core is relatively high. At this point, the density difference between the fluid and the rock is large, resulting in a larger pore radius measured by CT scanning. During the bound water stage, the oil saturation is high, and the interface between the oil and the rock in the pores is distinct, with the pore structure being more prominent. During the bound water stage, the oil saturation is high, and the interface between the oil and the rock within the pores is distinct, with the pore structure being more prominent. As the displacement process progresses, the water saturation gradually increases, and the proportion of water occupying the pore space increases, leading to a relative decrease in oil content. Although during the forward displacement stage, with the increase in displacement multiples, injected water continues to enter the pore space, some oil in small pore throats cannot be displaced due to the capillary trapping effect and other factors [34,35,36]. As a result, the oil phase in these small throats cannot be fully displaced, and the pore throat distribution shows a decreasing trend. When the displacement process transitions to reverse displacement, the direction of injected water flow changes, causing the oil originally stored in small pores to begin to be displaced. During the reverse displacement process, some of the oil droplets that were originally dispersed in the pores begin to aggregate in certain pores, which results in an increase in the density difference between the fluid and the rock. As the oil aggregates, the pore throat distribution is partially restored, particularly with the release of the oil phase in small pore throats, which further enhances the utilization of pore space and improves oil and gas recovery efficiency. This process indicates that reverse displacement can effectively improve the fluidity of oil and gas in low-permeability regions. By altering the direction of fluid flow, trapped oil droplets can reaggregate, thereby enhancing oil and gas recovery efficiency.

5. Conclusions

In hydrocarbon reservoirs, the macroscopic benefits of water flooding are evident, but studies on the distribution of movable oil and oil displacement efficiency within the reservoir remain limited. To address this issue, this study utilizes nuclear magnetic resonance (NMR) testing and oil–water relative permeability experiments to thoroughly analyze the micro-distribution of reservoir fluids, oil–water seepage behavior, and displacement mechanisms. Additionally, the effects of permeability, pressure gradient, water cut, and injection multiples on oil displacement efficiency are systematically studied through qualitative and quantitative analyses. The main conclusions and recommendations are as follows:
(1) Remaining oil is primarily concentrated in mesopores and micropores (0.1–10 μm), accounting for over 85% of the total distribution, with its accumulation shifting toward mesopores (1–10 μm) as permeability increases. In low-permeability cores (<10 mD), movable fluids are predominantly confined within micropores (0.1–3 μm), whereas in high-permeability cores (>20 mD), the presence of preferential flow channels limits the effective mobilization of remaining oil in macropores (>10 μm). During the later stages of displacement, the oil displacement efficiency in micropores (0.1–1 μm) exhibits a continuous but gradual increase, indicating that these micropores serve as critical targets for long-term enhanced oil recovery.
(2) The efficiency of oil displacement in reservoirs with varying permeability is significantly influenced by pressure gradient, with an optimal injection pressure threshold existing for different permeability ranges. In low-permeability reservoirs (<10 mD), a pressure gradient of ≥5.25 MPa/m is required to effectively mobilize remaining oil within micropores (0.1–3 μm); however, further pressure increases yield limited additional benefits. In contrast, in high-permeability reservoirs (>20 mD), oil displacement efficiency stabilizes beyond a pressure gradient of 1.80 MPa/m, with excessive pressure potentially inducing channeling, thereby reducing overall efficiency. Reverse displacement has been found to optimize pore utilization, enhancing the displacement efficiency of micropores in low-permeability cores by 15–20%. However, for high-permeability cores, implementing mobility control measures is necessary to improve displacement performance. This study establishes the optimal injection pressure thresholds for different reservoir types, providing a scientific basis for optimizing field-scale water injection strategies.
(3) As the water injection multiple increases, oil recovery generally improves across cores with varying permeability but exhibits a clear permeability dependence. At low injection multiples (1 PV), all core types show rapid increases in oil recovery efficiency. However, in the high injection range (3–10 PV), high-permeability cores tend to reach efficiency saturation, with recovery growth slowing or stabilizing. In contrast, low-permeability cores maintain significant production potential during this stage, indicating greater potential for enhanced recovery in the later stages of development.
(4) Based on displacement dynamics and pore utilization characteristics, a targeted strategy for enhancing oil recovery during the high-water-cut stage in the Xinli Oilfield is proposed. For low-permeability reservoirs, high-pressure and low-velocity water injection (5–6 MPa/m) is recommended to activate remaining oil within micropores, whereas for high-permeability reservoirs, maintaining a controlled pressure (1.5–2 MPa/m) in combination with profile control agents is advised to mitigate macropore channeling. By employing alternating forward and reverse displacement techniques, remaining oil mobilization in mesopores and micropores can be enhanced.
While short-term displacement studies can reveal immediate variations in oil recovery efficiency, they lack support from long-term waterflooding data and are thus insufficient for comprehensively evaluating reservoir dynamic behavior. During prolonged water injection, pore structures may become clogged due to factors such as particle migration, chemical precipitation, or microbial activity, resulting in a decline in permeability. Simultaneously, the wettability of rock surfaces may shift from hydrophilic to hydrophobic due to the cumulative effects of chemical components in the injected fluids, leading to wettability reversal. These gradual processes can significantly alter the two-phase flow behavior of oil and water, thereby reducing displacement efficiency; however, such time-dependent and cumulative damage effects are often difficult to capture in short-term experiments. Therefore, future studies should integrate long-term dynamic monitoring with mechanistic analysis to more accurately predict production changes and recovery decline trends in the later stages of field development.

Author Contributions

Methodology, J.C.; software, Z.L.; validation, Z.Z.; data curation, L.W.; writing—original draft preparation, J.C.; writing—review and editing, Y.W.; visualization, Z.Z.; supervision, L.W.; funding acquisition, Y.W. All authors have read and agreed to the published version of the manuscript.

Funding

This study was supported by the National Natural Science Foundation of China (grant number 51874045).

Data Availability Statement

The raw data supporting the conclusions of this article will be made available by the authors upon request.

Acknowledgments

The author would like to thank the Editor and the anonymous referees for their helpful comments and suggestions.

Conflicts of Interest

The authors declare no conflicts of interest.

References

  1. Burdine, N.T. Relative Permeability Calculations from Pore Size Distribution Data. Trans. Am. Inst. Min. Metall. Eng. 1953, 198, 71–78. [Google Scholar] [CrossRef]
  2. Kleinberg, R.L. Utility of NMR T-2 distributions, connection with capillary pressure, clay effect, and determination of the surface relaxivity parameter rho(2). Magn. Reson. Imaging 1996, 14, 761–767. [Google Scholar] [CrossRef] [PubMed]
  3. Purcell, W.R. Capillary Pressures—Their Measurement Using Mercury and the Calculation of Permeability Therefrom. Trans. Am. Inst. Min. Metall. Eng. 1949, 186, 39–48. [Google Scholar] [CrossRef]
  4. Brooks, R.H.; Corey, A.T. Properties of porous media affecting fluid flow. J. Irrig. Drain. Div. 1966, 92, 02. [Google Scholar] [CrossRef]
  5. Pirson, S.J.; Boatman, E.M.; Nettle, R.L. Prediction of Relative Permeability Characteristics of Intergranular Reservoir Rocks from Electrical Resistivity Measurements. Trans. Soc. Pet. Eng. AIME 1964, 231, 564–570. [Google Scholar] [CrossRef]
  6. Hidajat, I.; Singh, M.; Cooper, J.; Mohanty, K.K. Permeability of porous media from simulated NMR response. Transp. Porous Med. 2002, 48, 225–247. [Google Scholar] [CrossRef]
  7. Liu, Y.F.; Deng, R.; Luo, S.C.; Li, H.; Zhang, L.; Gan, L.X. The Saturation Calculation of NMR Logging Based on Constructing Water Spectrum Function. Processes 2024, 12, 2518. [Google Scholar] [CrossRef]
  8. Wu, Y.Q.; Tahmasebi, P.; Lin, C.Y.; Zahid, M.A.; Dong, C.M.; Golab, A.N.; Ren, L.H. A comprehensive study on geometric, topological and fractal characterizations of pore systems in low-permeability reservoirs based on SEM, MICP, NMR, and X-ray CT experiments. Mar. Petrol. Geol. 2019, 103, 12–28. [Google Scholar] [CrossRef]
  9. Chalmers, G.R.; Bustin, R.M.; Power, I.M. Characterization of gas shale pore systems by porosimetry, pycnometry, surface area, and field emission scanning electron microscopy/transmission electron microscopy image analyses: Examples from the Barnett, Woodford, Haynesville, Marcellus, and Doig units. AAPG Bull. 2012, 96, 1099–1119. [Google Scholar]
  10. Li, L.; Hao, Y.M.; Lv, Y.T.; Wang, C.W.; Yao, C.J.; Zhao, Q.M.; Xiao, P.F. Experimental investigation on low-velocity seepage characteristics and influencing factors in a shale oil reservoir. J. Petrol. Sci. Eng. 2020, 195, 107732. [Google Scholar] [CrossRef]
  11. Hui, G.; Chen, Z.X.; Wang, Y.J.; Zhang, D.M.; Gu, F. An integrated machine learning-based approach to identifying controlling factors of unconventional shale productivity. Energy 2023, 266, 126512. [Google Scholar] [CrossRef]
  12. Al-Quraishi, A.; Khairy, M. Pore pressure versus confining pressure and their effect on oil-water relative permeability curves. J. Petrol. Sci. Eng. 2005, 48, 120–126. [Google Scholar] [CrossRef]
  13. Mohammadkhani, S.; Shahverdi, H.; Esfahany, M.N. Impact of salinity and connate water on low salinity water injection in secondary and tertiary stages for enhanced oil recovery in carbonate oil reservoirs. J. Geophys. Eng. 2018, 15, 1242–1254. [Google Scholar] [CrossRef]
  14. Li, J.J.; Jiang, H.Q.; Wang, C.; Zhao, Y.Y.; Gao, Y.J.; Pei, Y.L.; Wang, C.C.; Dong, H. Pore-scale investigation of microscopic remaining oil variation characteristics in water-wet sandstone using CT scanning. J. Nat. Gas Sci. Eng. 2017, 48, 36–45. [Google Scholar] [CrossRef]
  15. Zhou, Y.; Helland, J.O.; Hatzignatiou, D.G. Pore-Scale Modeling of Waterflooding in Mixed-Wet-Rock Images: Effects of Initial Saturation and Wettability. SPE J. 2014, 19, 88–100. [Google Scholar] [CrossRef]
  16. Wang, Z.N.; Liu, K.Y.; Zhang, C.Q.; Yan, H.J.; Yu, J.; Yu, B.; Liu, J.L.; Jiang, T.L.; Dan, W.D.; Hu, C.Z. Integral Effects of Porosity, Permeability, and Wettability on Oil-Water Displacement in Low-Permeability Sandstone Reservoirs-Insights from X-ray CT-Monitored Core Flooding Experiments. Processes 2023, 11, 2786. [Google Scholar] [CrossRef]
  17. Wei, J.G.; Zhou, X.F.; Zhou, J.M.; Li, J.T.; Wang, A.L. Recovery efficiency of tight oil reservoirs with different injection fluids: An experimental investigation of oil-water distribution feature. J. Petrol. Sci. Eng. 2020, 195, 107678. [Google Scholar] [CrossRef]
  18. Hassanizadeh, S.M.; Celia, M.A.; Dahle, H.K. Dynamic Effect in the Capillary Pressure-Saturation Relationship and its Impacts on Unsaturated Flow. Vadose Zone J. 2002, 1, 38–57. [Google Scholar] [CrossRef]
  19. Zhang, H.Y.; He, S.L.; Jiao, C.Y.; Luan, G.H.; Mo, S.Y.; Lei, G. Investigation of Dynamic Effect of Capillary Pressure in Ultra-Low Permeability Sandstones. Indian Geotech. J. 2015, 45, 79–88. [Google Scholar] [CrossRef]
  20. Al-Mahrooqi, S.H.; Grattoni, C.A.; Muggeridge, A.H.; Zimmerman, R.W.; Jing, X.D. Pore-scale modelling of NMR relaxation for the characterization of wettability. J. Petrol. Sci. Eng. 2006, 52, 172–186. [Google Scholar] [CrossRef]
  21. Guan, H.; Brougham, D.; Sorbie, K.S.; Packer, K.J. Wettability effects in a sandstone reservoir and outcrop cores from NMR relaxation time distributions. J. Petrol. Sci. Eng. 2002, 34, 33–52. [Google Scholar] [CrossRef]
  22. Zhao, J.; Zhang, Y.Z.; Zhang, M.L.; Mao, Z.; Wang, C.C.; Hu, R.R.; Yang, L.; Liu, Y. Research on Micro-Pore Structure and 3D Visual Characterization of Inter-Salt Shale Based on X-CT Imaging Digital Core Technology. Processes 2022, 10, 1321. [Google Scholar] [CrossRef]
  23. Daigle, H.; Johnson, A. Combining Mercury Intrusion and Nuclear Magnetic Resonance Measurements Using Percolation Theory. Transp. Porous Med. 2016, 111, 669–679. [Google Scholar] [CrossRef]
  24. Li, Z.; Sun, X.; Wang, F.; Liang, Y. Microscopic Flow Characteristics of Fluids in Porous Medium and Its Relationship with Remaining Oil Distribution: A Case Study in Saertu Oilfield of Daqing in China. Geofluids 2018, 2018, 7549831. [Google Scholar] [CrossRef]
  25. Ryazanov, A.V.; Sorbie, K.S.; van Dijke, M.I.J. Structure of remaining oil as a function of wettability using pore-network modelling. Adv. Water Resour. 2014, 63, 11–21. [Google Scholar] [CrossRef]
  26. Jin, G.W.; Xie, R.H.; Liu, M.; Guo, J.F. Petrophysical Parameter Calculation Based on NMR Echo Data in Tight Sandstone. IEEE Trans. Geosci. Remote Sens. 2019, 57, 5618–5625. [Google Scholar] [CrossRef]
  27. Hosseinzadeh, S.; Kadkhodaie, A.; Yarmohammadi, S. NMR derived capillary pressure and relative permeability curves as an aid in rock typing of carbonate reservoirs. J. Petrol. Sci. Eng. 2020, 184, 106593. [Google Scholar] [CrossRef]
  28. Guo, Y.H.; Pan, B.Z.; Zhang, L.H. A New Method to Identify Reservoirs in Tight Sandstones Based on the New Model of Transverse Relaxation Time and Relative Permeability. Geofluids 2017, 2017, 1–16. [Google Scholar] [CrossRef]
  29. Liu, M.; Xie, R.H.; Guo, J.F.; Jin, G.W. Characterization of Pore Structures of Tight Sandstone Reservoirs by Multifractal Analysis of the NMR Distribution. Energy Fuel 2018, 32, 12218–12230. [Google Scholar] [CrossRef]
  30. Fan, Z.F.; Li, K.C.; Li, J.X.; Song, H.; He, L.; Wu, X.L. A study on remaining oil distribution in a carbonate oil reservoir based on reservoir flow units. Petrol. Explor. Dev. 2014, 41, 634–641. [Google Scholar] [CrossRef]
  31. Zhang, T.J.; Yang, X.P.; Yan, X.C.; Luo, Z.M. Deriving the Oil-Water Seepage Pressure Distribution from Two-Phase Oil-Water Flow Stress Gradient. Chem. Tech. Fuels Oils 2019, 55, 199–205. [Google Scholar]
  32. Yu, H.M.; Wang, Y.Q.; Zhang, L.; Zhang, Q.X.; Guo, Z.H.; Wang, B.Z.; Sun, T. Remaining oil distribution characteristics in an oil reservoir with ultra-high water-cut. Energy Geosci. 2024, 5, 100116. [Google Scholar] [CrossRef]
  33. Zhao, J.; Zhang, M.L.; Wang, C.C.; Mao, Z.; Zhang, Y.Z. Application of the Backpropagation Neural Network Image Segmentation Method with Genetic Algorithm Optimization in Micropores of Intersalt Shale Reservoirs. ACS Omega 2021, 6, 25246–25257. [Google Scholar] [CrossRef] [PubMed]
  34. Zhou, Q.; Yang, Z.B.; Huang, C.B.; Liu, J.M.; Wang, Y.T.; Wu, W. Evaluating the pore structure of low permeability glutenite reservoir by 3D digital core technology. SN Appl. Sci. 2022, 4, 294. [Google Scholar] [CrossRef]
  35. Wang, H.; Su, Y.L.; Wang, W.D.; Li, L.; Sheng, G.L.; Zhan, S.Y. Relative permeability model of oil-water flow in nanoporous media considering multi-mechanisms. J. Petrol. Sci. Eng. 2019, 183, 106361. [Google Scholar] [CrossRef]
  36. Zhang, F.Q.; Kor, T.; Yan, J.Z. Oil secondary migration simulation in tight reservoir and fingering factors analysis. J. Petrol. Sci. Eng. 2022, 209, 109969. [Google Scholar] [CrossRef]
Figure 1. Schematic diagram of the core sample experimental workflow.
Processes 13 01490 g001
Figure 2. Schematic diagram of the displacement experiment.
Processes 13 01490 g002
Figure 3. T2 spectrum of the oil–water displacement process for core 1-1.
Processes 13 01490 g003
Figure 4. Bound water distribution in pores at different displacement times.
Processes 13 01490 g004
Figure 5. T2 spectrum of the waterflooding process for core 1-1.
Processes 13 01490 g005
Figure 6. Pore network model construction before and after the displacement experiment. (A) Three-dimensional digital core; (B) pore space model; (C) pore network model. (Note: In the 3D digital model, the dark red regions represent pores, while in the pore network model, the red and white regions indicate pores and pore channels of different sizes and volumes).
Processes 13 01490 g006
Figure 7. Distribution of movable fluids in cores with different permeability ranges.
Processes 13 01490 g007
Figure 8. Variation curve of oil recovery efficiency at different stages of displacement.
Processes 13 01490 g008
Figure 9. Frequency distribution of remaining oil.
Processes 13 01490 g009
Figure 10. Variation curve of oil saturation over time for core 1-1.
Processes 13 01490 g010
Figure 11. Scatter plot of the relationship between moveable oil saturation and permeability.
Processes 13 01490 g011
Figure 12. Scatter plot of the relationship between oil displacement efficiency and permeability.
Processes 13 01490 g012
Figure 13. Displacement efficiency under different wettability conditions.
Processes 13 01490 g013
Figure 14. CT scans of residual oil distribution under different wettability conditions.
Processes 13 01490 g014
Figure 15. Relationship curve between displacement efficiency and pressure gradient.
Processes 13 01490 g015
Figure 16. Relationship curve between remaining oil saturation and pressure gradient.
Processes 13 01490 g016
Figure 17. The relationship curve of oil displacement efficiency with the change of water injection multiple.
Processes 13 01490 g017
Figure 18. Fluid distribution in the core after forward and reverse displacement experiments.
Processes 13 01490 g018
Figure 19. Scanning images of fault pore distribution under different displacement conditions.
Processes 13 01490 g019
Figure 20. Local cross-sectional CT scan images under different displacement conditions.
Processes 13 01490 g020
Figure 21. Pore network model before and after the bidirectional displacement experiment. (A) Three-dimensional digital core; (B) pore space model; (C) pore network model (Note: In the 3D digital model, the dark red regions represent pores, while in the pore network model, the red and white regions indicate pores and pore channels of different sizes and volumes).
Processes 13 01490 g021
Table 1. The basic physical properties of the cores.
BlockNumberDepth
(m)
Length
(cm)
Permeability
(mD)
Porosity
(%)
Experimental
Type
C41-11207.305.1685.61615.27
C73-11250.505.0222.3208.89
C72-11225.65.7262.95810.24A
C72-21201.764.8149.80918.77B
C41-21198.005.11816.24720.20A
C72-31225.755.04022.76013.67A
C72-41237.224.91025.04613.75B
C72-51237.975.13033.55915.00B
A: pressure gradient; B: forward and reverse displacement.
Table 2. Summary of T2 spectrum parameters for core samples.
CoreSaturation
Spectral Area
Immovable
Peak Area
Movable
Peak Area
Movable Fluid
Saturation
(%)
Remaining Oil
Saturation
(%)
Oil Displacement
Efficiency
(%)
1-127,281.9616,181.8911,100.0840.6967.0432.96
2-138,846.3823,636.5315,209.8539.1550.6349.37
2-240,890.1823,485.5917,404.5942.5642.8557.15
1-244,574.3824,834.9319,739.4544.2847.2552.75
2-331,839.6416,647.2015,192.4447.7247.5852.42
2-435,895.5318,283.2917,612.2549.0744.1355.87
2-533,986.5016,811.9317,174.5750.5343.0556.95
Table 3. Distribution frequency of remaining oil in core samples.
CorePermeability (mD)Aperture Distribution (μm)
<0.010.01~0.10.1~11~10>10
1-12.95801.6169.0129.370.01
2-15.6160.178.3028.0463.480
2-29.80900.9936.5859.902.53
1-216.24707.3051.2540.660.79
2-322.76003.9943.3848.064.57
2-425.04608.2725.7351.4414.56
2-533.55903.9722.8963.0110.13
Table 4. Changes in core oil displacement efficiency.
CorePermeability
(mD)
Forward Oil
Displacement Efficiency
(%)
Reverse Oil
Displacement Efficiency
(%)
Increase in Oil
Displacement Efficiency
(%)
2-29.80957.1560.733.57
2-425.04655.8758.152.28
2-533.55956.9558.051.10
Disclaimer/Publisher’s Note: The statements, opinions and data contained in all publications are solely those of the individual author(s) and contributor(s) and not of MDPI and/or the editor(s). MDPI and/or the editor(s) disclaim responsibility for any injury to people or property resulting from any ideas, methods, instructions or products referred to in the content.

