Article

Load Restoration Based on Improved Girvan–Newman and QTRAN-Alt in Distribution Networks

1
State Grid Tianjin Jinghai Electric Power Supply Company, Tianjin 301600, China
2
State Grid Tianjin Chengnan Electric Power Supply Company, Tianjin 300202, China
3
State Grid Tianjin Electric Power Company Electric Power Research Institute, Tianjin 300392, China
4
China Electric Power Research Institute, Beijing 100192, China
5
School of Electrical Engineering and Automation, Wuhan University, Wuhan 430072, China
*
Author to whom correspondence should be addressed.
Processes 2025, 13(5), 1473; https://doi.org/10.3390/pr13051473
Submission received: 3 March 2025 / Revised: 4 April 2025 / Accepted: 10 April 2025 / Published: 12 May 2025

Abstract

:
With the increasing demand for power supply reliability, efficient load restoration in large-scale distribution networks post-outage scenarios has become a critical challenge. However, traditional methods become computationally prohibitive as network expansion leads to exponential growth of decision variables. This study proposes a multi-agent reinforcement learning (MARL) framework enhanced by distribution network partitioning to address this challenge. Firstly, an improved Girvan–Newman algorithm is employed to achieve balanced partitioning of the network, defining the state space of each agent and action boundaries within the multi-agent system (MAS). Subsequently, a counterfactual reasoning framework solved by the QTRAN-alt algorithm is incorporated to refine action selection during training, thereby accelerating convergence and enhancing decision-making efficiency during execution. Experimental validation using a 27-bus system and a 70-bus system demonstrates that the proposed QTRAN-alt with the Girvan–Newman method achieves fast convergence and high returns compared to typical MARL approaches. Furthermore, the proposed methodology significantly improves the success rate of full system restoration without violating constraints.

1. Introduction

As distribution networks expand and face increased complexity, large-scale power outages stemming from upstream grid failures have become a growing concern [1]. In such scenarios, the number of switch operation combinations grows exponentially [2], and traditional load restoration methods relying on experience and manual rules are no longer sufficient to meet the demand for rapid response. As the distribution system directly serves the end users, the system restoration capability of the distribution network not only directly impacts the normal electricity demand of users but also serves as an important indicator of the technical level and service capacity of modern power systems [3,4]. Therefore, the issue of distribution network fault recovery has always been a key research focus in both academia and engineering practice.
To address the issue of load restoration, researchers have explored various approaches. One typical method involves utilizing the graph data structure characteristics of the power grid to optimize the restoration path by spanning tree search [5]. However, as the distribution network scale continues to grow and controllable device categories expand, researchers have increasingly turned to mathematical programming approaches due to the constrained representation capabilities of search algorithms [6]. Programming methods offer greater flexibility, allowing for the dynamic definition of constraints and controlling variables based on specific requirements, and enabling more comprehensive and accurate descriptions of the state changes in the distribution network [7]. Furthermore, some researchers have explored the integration of graph theory with mixed-integer linear programming (MILP) methods, leveraging optimized model structures and algorithm designs to achieve significant improvements in solution efficiency [8].
As distribution networks continue to expand and controllable devices become more diverse, traditional model-based solution methods encounter significant challenges in handling the complexities of real-world operating conditions. Particularly in cases where the impact scope of power outages increases, the computational complexity grows significantly, leading to a considerable reduction in both the solution efficiency and result accuracy. In this context, reinforcement learning (RL), as a model-free learning approach, has gradually gained attention from researchers due to its adaptability and efficiency in complex environments [9,10,11]. However, as state space dimensions and decision complexity become increasingly intricate, RL may face considerable challenges. Specifically, these challenges can cause RL algorithms to become stuck in a local optimum or require excessively long training times to converge. Moreover, these limitations hinder the practical application potential of RL in real-world scenarios and increase the demand for computational resources and time costs [12].
Multi-agent reinforcement learning (MARL) decomposes complex high-dimensional tasks into subproblems of cooperative decision-making among multiple agents, allowing each agent to focus only on its local state and action space. This significantly reduces the state space dimension that a single agent needs to process. Currently, there are preliminary applications of MARL in the system restoration of distribution networks. Wang et al. [13] proposed a hierarchical MARL-based approach, which flexibly mobilizes mobile power sources and repair personnel under extreme weather conditions to improve microgrid load recovery efficiency. Vu et al. [14] introduced invalid action masking in MARL to quickly determine the optimal sequence of switch operations after a fault, and it has been validated in systems of varying scales. Fan et al. [15] employed graph-based RL to design a centralized training method for the multi-agent system (MAS), enhancing cooperative recovery capabilities of the system. The study in [16] proposed a dynamic agent network structure to effectively address the challenges posed by changes in topology and varying input dimensions and filtered out unsafe samples while training MARL.
Existing research on the application of MARL in distribution network restoration primarily focuses on distributed energy optimization within a single feeder or local microgrid. However, there has been limited exploration of multiple feeder outage issues resulting from upstream grid failures. Investigating feeder partitioning strategies is essential to enhance supply reliability under such contingencies [17,18]. The core contributions of the proposed method in applying MARL to load restoration can be summarized as follows:
  • A community discovery-based decentralized partially observable Markov decision process (Dec-POMDP) model is proposed, thereby significantly expanding the application capability of MARL in complex distribution network load restoration scenarios.
  • A distribution network restoration structure based on the QTRAN-alt algorithm is proposed, where counterfactual analysis is employed to rapidly identify optimal actions during MARL training. This approach effectively accelerates the convergence of MARL in large-scale distribution networks while ensuring the correctness of actions.
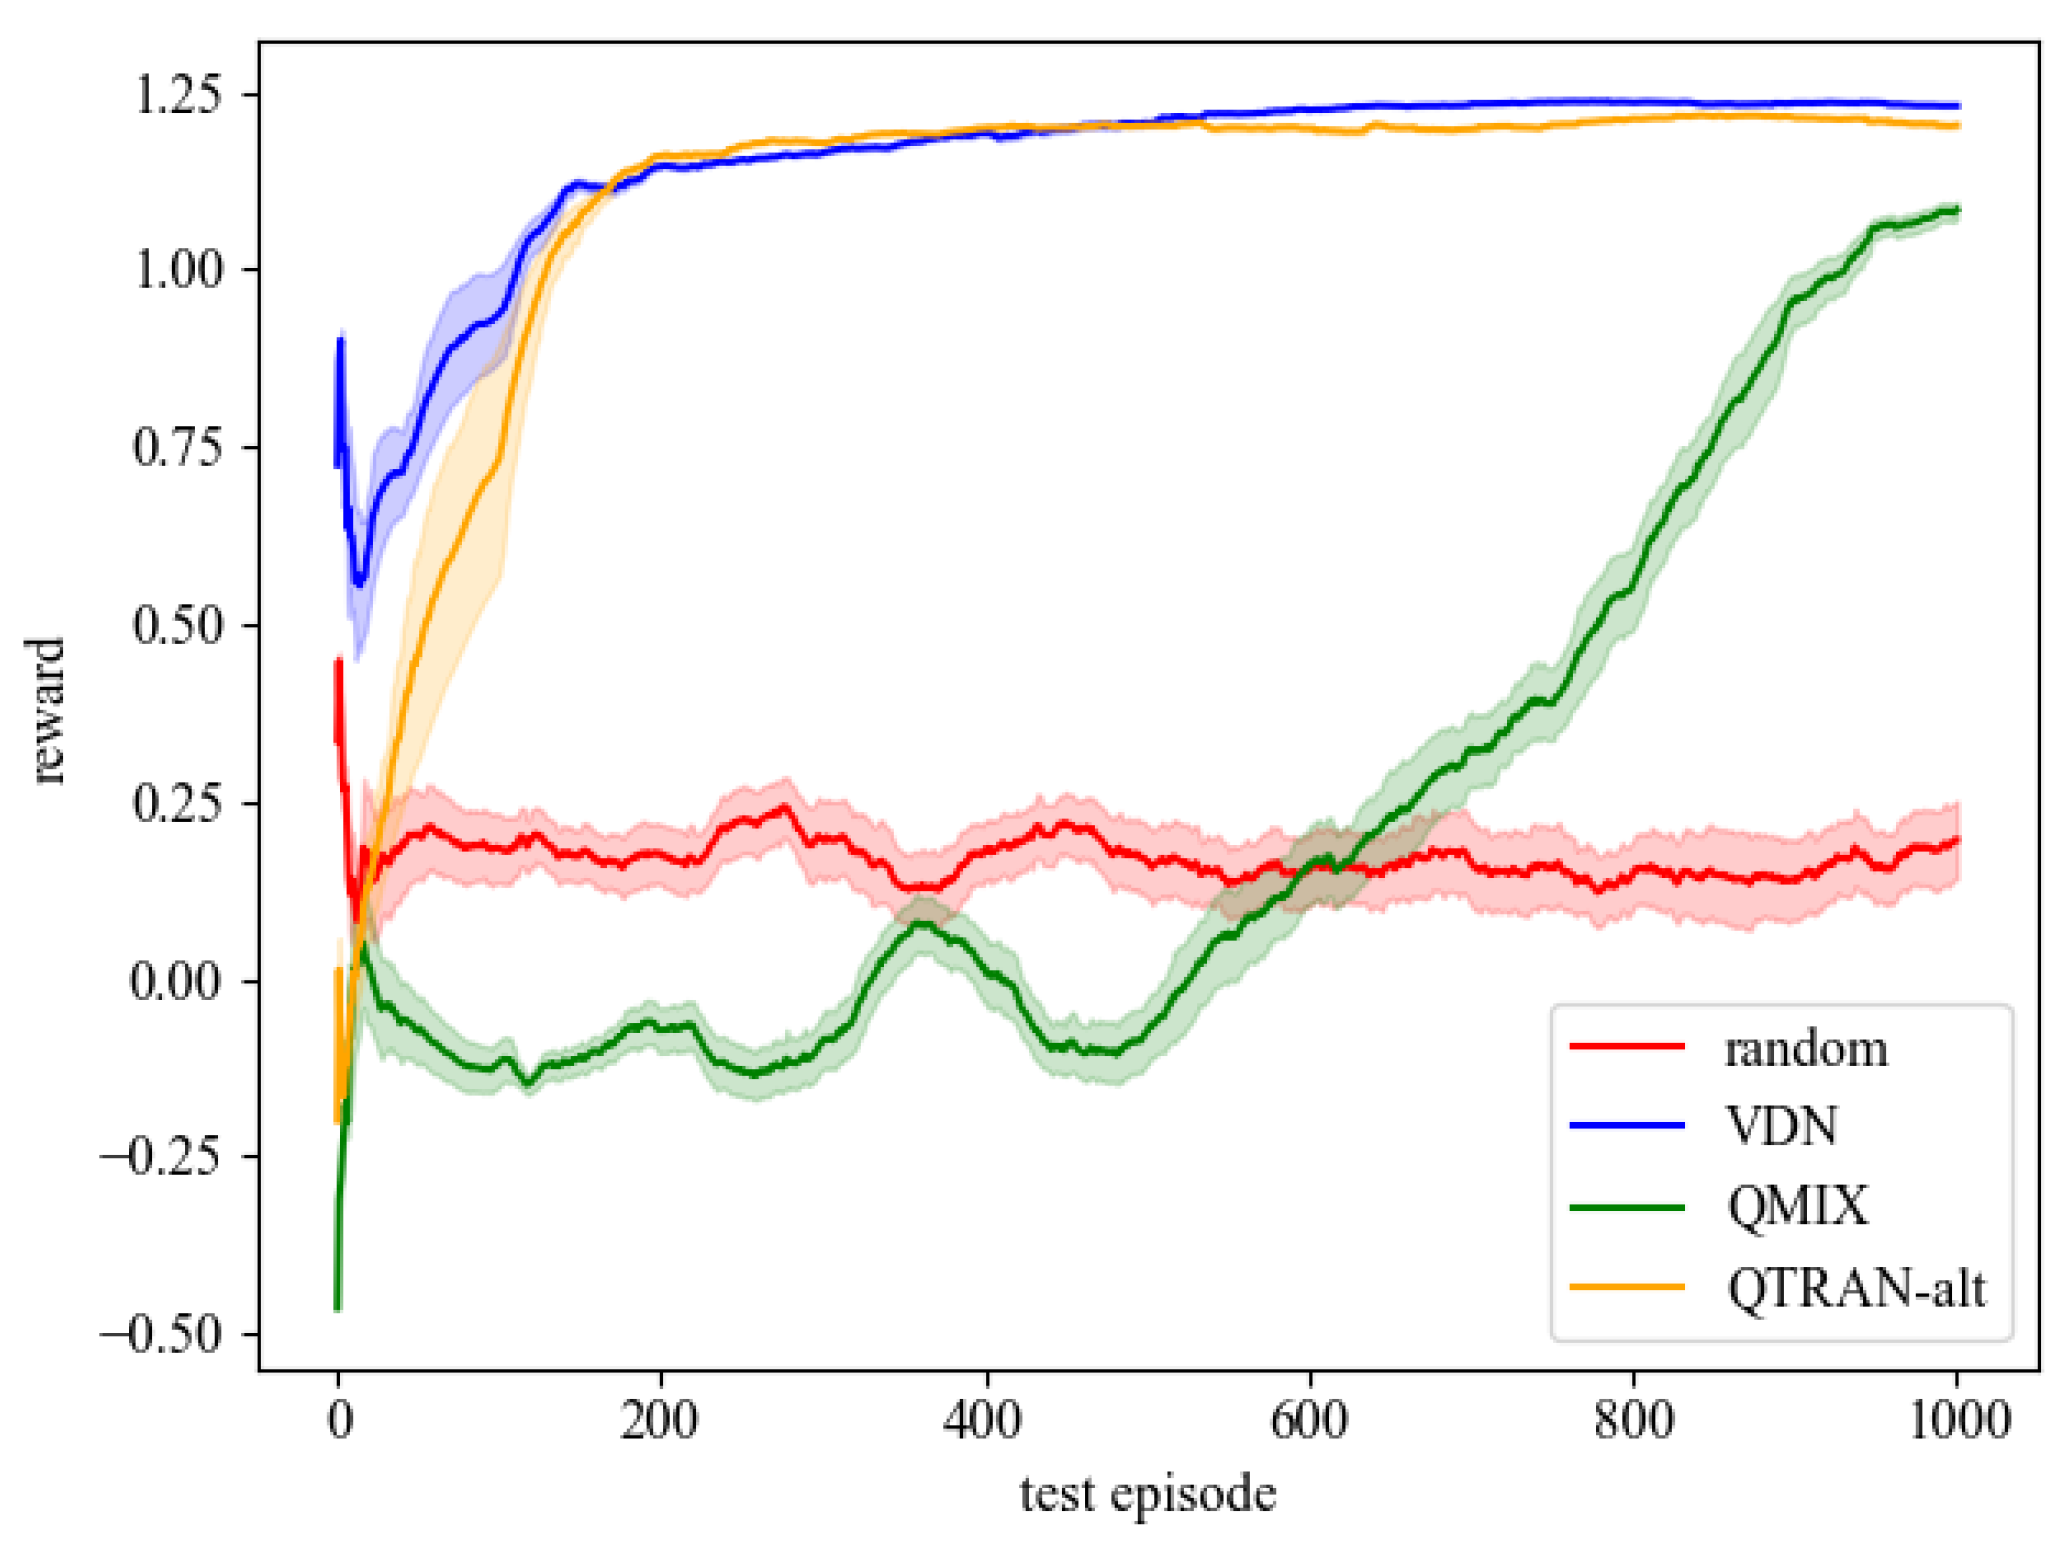
  • The effectiveness of our approach is demonstrated through practical applications. In terms of key performance indicators such as convergence speed and recovery success rate, our approach surpasses comparison methods.
The structure of the paper is arranged as follows. Section 2 elaborates on the model and its underlying theory. Section 3 delineates the implementation process of the proposed algorithm. Section 4 validates the efficacy of our proposed method through simulation experiments. Section 5 culminates with the presentation of research findings and suggests future research directions.

2. Proposed Load Restoration Method

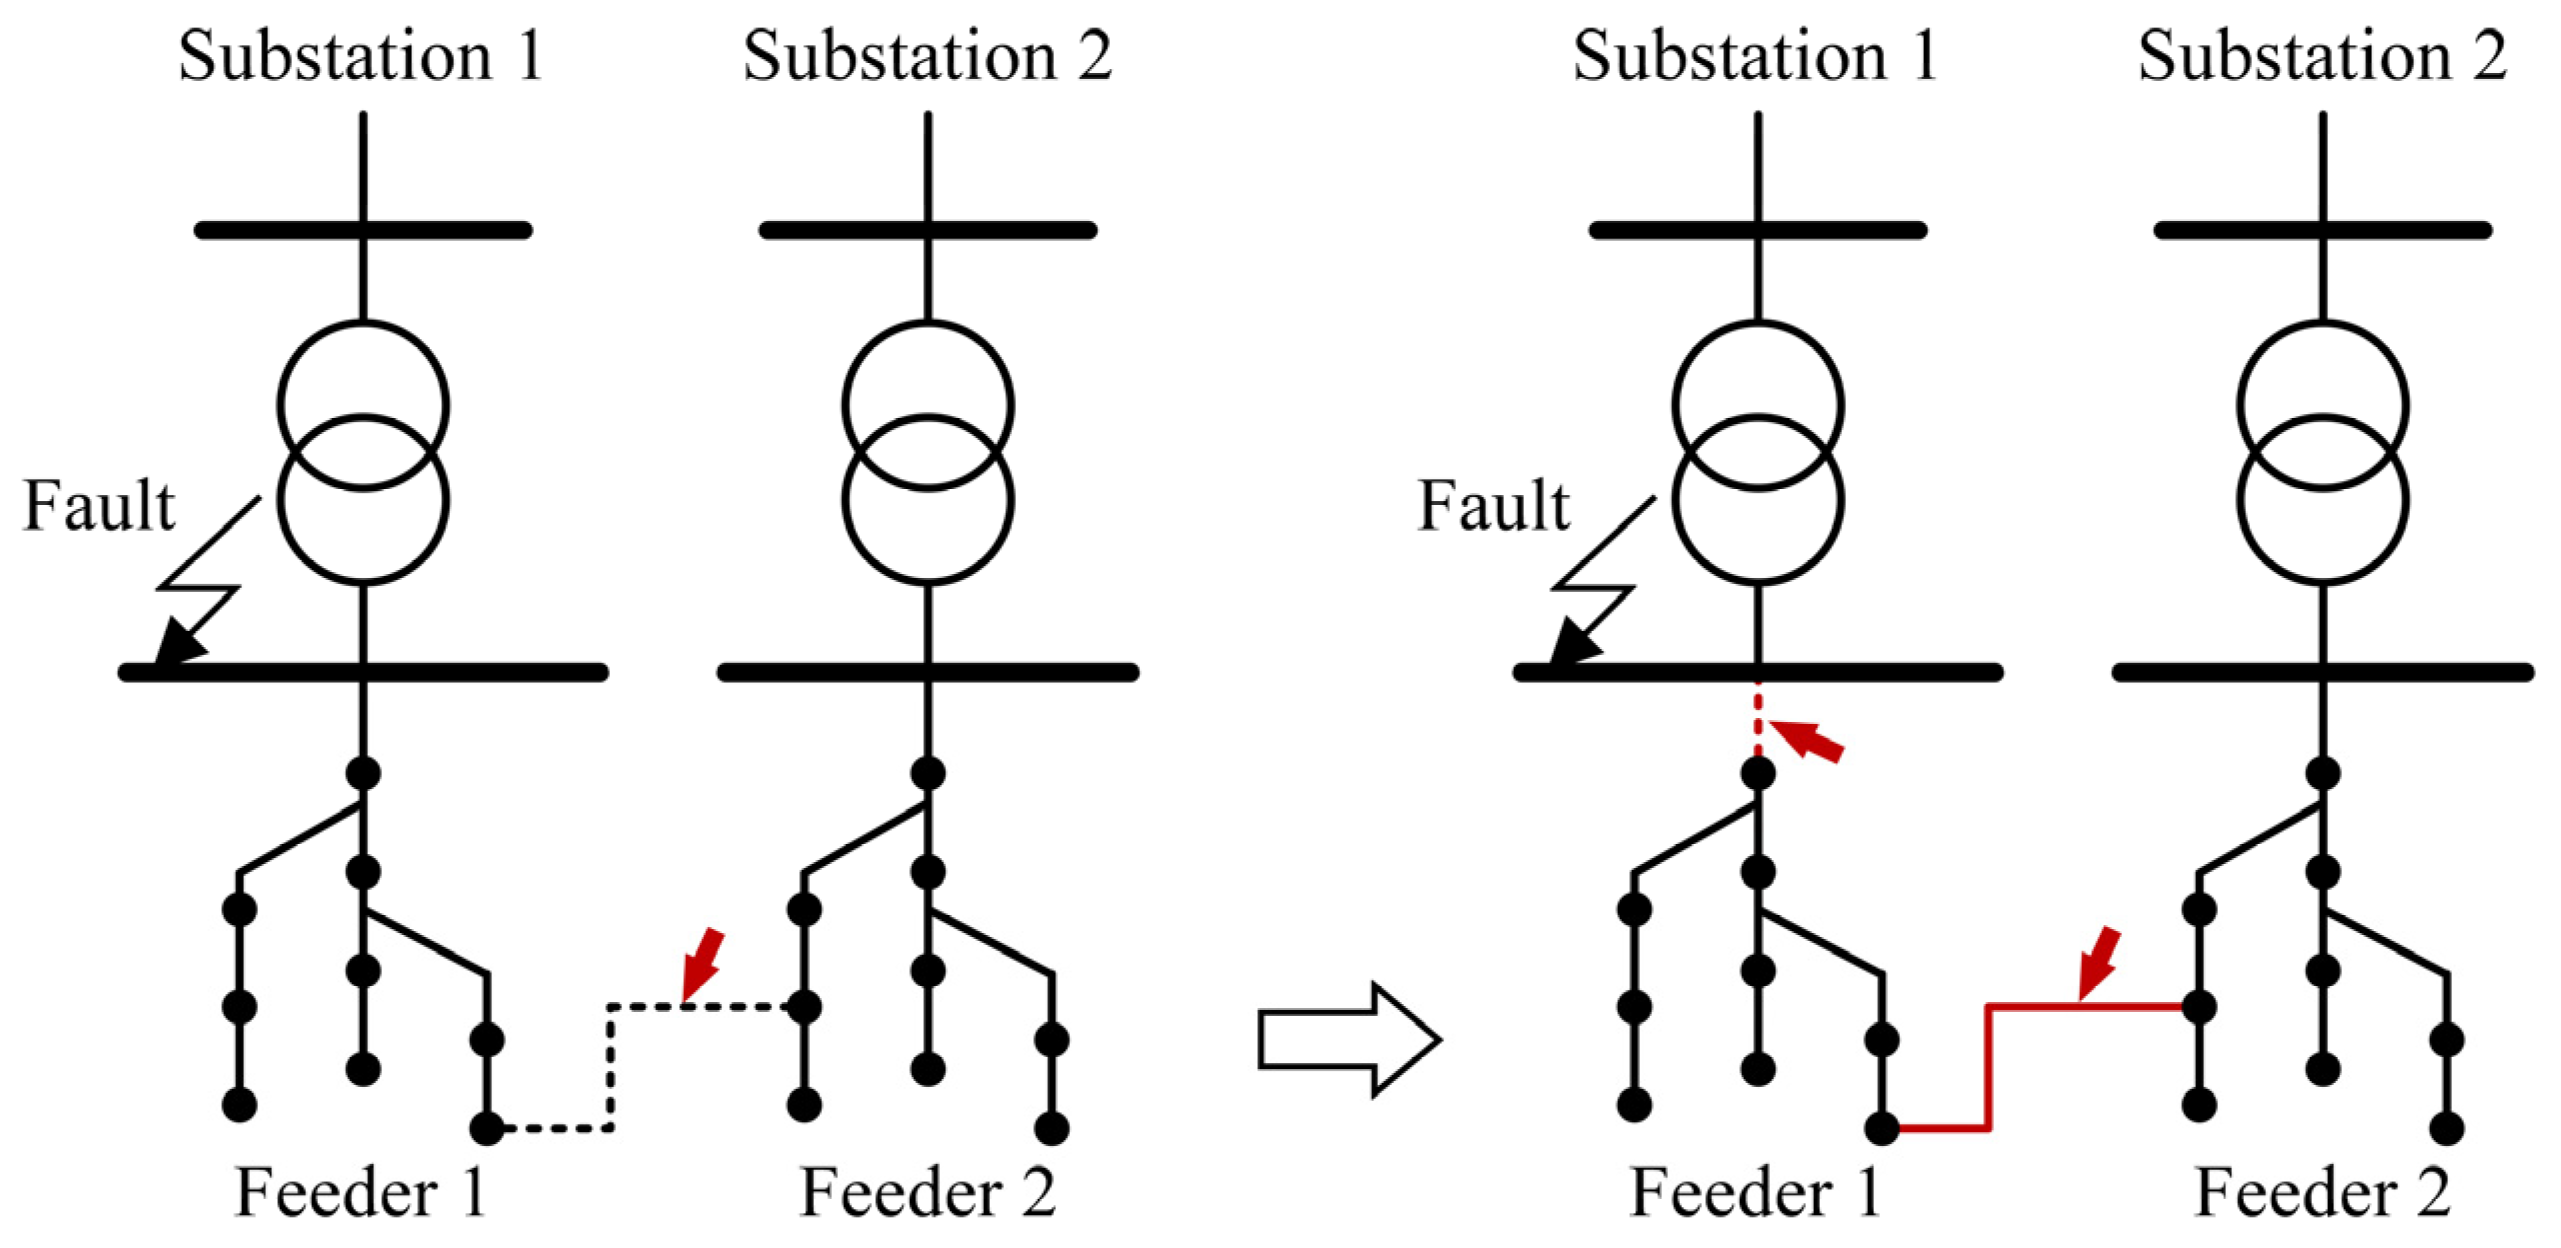
2.1. Load Restoration Model

Load restoration is one of the core tasks in distribution network fault recovery. Its goal is to minimize the impact of power interruptions on users by reasonably scheduling and optimizing the transfer of loads from power outages to feeders of normally operating substations. In practical distribution networks, there may be interconnections between feeders from different substations. When one substation fails, the feeders served by it can be transferred to other normally operating substations, as shown in Figure 1.
For a distribution network with N unsupplied nodes, the load redistribution target can be formulated as follows:
max n = 1 N P i restored
where P i restored is the restored load at the power outage node i .
Within a distribution network modeled through an undirected graph G = V , E , the load restoration process must satisfy several constraints, including power flow constraints, branch capacity constraints, bus voltage constraints, and radial topology constraints.
P i = U i j = 1 U j G i j cos θ i j + B i j sin θ i j Q i = U i j = 1 U j G i j sin θ i j + B i j cos θ i j
I i j I i j max
U i min U i U i max
E ¯ V ¯ 1 path ( v i gen v j gen ) = Ø , i j
Equation (2) represents the power flow equation constraint, where P i and Q i denote the active and reactive power injections at bus i , U i is the voltage magnitude at bus i , G i j and B i j are the conductance and susceptance of the branch connecting bus i and bus j , and θ i j represents the phase angle difference between bus i and bus j .
Equation (3) expresses the branch current constraint, where I i j and I i j max represent the current and the maximum allowable current on the branch between bus i and bus j .
Equation (4) specifies the bus voltage constraint, where U i min and U i max represent the minimum and maximum allowable voltage at bus i .
Equation (5) defines the radial topology constraint, where V ¯ and E ¯ represent the set of operational buses and the set of lines, which form the node and edge sets in the graph. path ( v i gen v j gen ) represents the path between the equivalent power supply node v i gen and the equivalent power supply node v j gen in the graph, which is used to prevent the formation of electromagnetic loops in the distribution network caused by the upper grid.

2.2. Improved Girvan–Newman Community Detection Method

As power systems grow larger in scale and distribution networks become more intricate, dividing the distribution network into several geographically independent yet functionally interrelated subregions has become a viable approach. Each subregion is capable of achieving local optimal control while maintaining overall coordination, thus simplifying the decision-making process for load restoration. The partitioning of the distribution network requires converting the physical connectivity of devices into graph-based data for computation. During this process, it is crucial to ensure the connectivity within each subregion. We propose and implement an enhanced Girvan–Newman algorithm for network division.
For a distribution network consisting of B buses and L branches, its equivalent undirected graph G = V , E can be defined as follows:
V = v i , V = B E = v i , v j , E = L
where V i represents the bus i , and v i , v j represents the branch connecting the bus i and the bus j , with each edge being undirected. V and E denote the number of nodes and edges in graph G .
As a community detection algorithm, the Girvan–Newman method [19] calculates the betweenness of each edge in the graph, which represents the degree of connection between communities. The edge with the highest betweenness is considered a boundary edge between communities and is removed from the graph as shown in Equation (7). This process iteratively divides the graph into distinct communities.
e = arg max e E B ( e )
where B ( e ) represents the betweenness of an edge, and e * denotes the edge currently exhibiting the highest betweenness. After each edge is removed, the betweenness metrics of the remaining connections are updated, ensuring that boundary changes are dynamically captured throughout the partitioning process. The betweenness B ( v , w ) of an edge connecting nodes v and w is given by
B ( v , w ) + = σ [ v ] coeff
where σ [ v ] represents the number of shortest paths from node v to every other node, and σ [ v ] can be obtained via breadth-first search (BFS). The coefficient is the scaling factor, calculated as follows:
coeff = 1 + δ [ v ] σ [ v ]
where δ [ v ] represents the dependency contribution of node v to node w . Before traversal begins, dependency contributions of all nodes are initialized to zero. When traversing to node v , the dependency contributions are updated according to the formula in Equation (10).
δ [ w ] + = 1 + δ [ v ]
The edge-betweenness partitioning method does not guarantee an equal distribution of nodes across partitions, which may undermine the efficiency of strategy sharing and collaborative optimization among regions.
Specifically, when a partition contains an excessive number of nodes, the load restoration task within that region becomes more complex, which may have an impact on the overall stability of the system due to the imbalanced distribution. Conversely, for partitions with too few nodes, the coupling of strategies increases, thereby significantly raising the complexity of collaborative operations.
Therefore, after computing the partitioning results of the power grid using the Girvan–Newman algorithm, it is necessary to compare the number of nodes in each partition. If the nodes are unevenly distributed, further adjustments are made to redistribute the nodes within the partitions to achieve balance. Specifically, in subgraphs with a larger number of nodes, boundary nodes are traversed and moved from the partition with more nodes to the partition with fewer nodes, until the node count in all partitions is fully balanced. The specific steps of this process are illustrated in Figure 2. This process ensures that the load restoration tasks across all partitions are more evenly distributed. It also reduces the burden on collaborative optimization. This enhancement boosts both system-wide efficiency and operational stability.

2.3. Dec-POMDP Model for Load Restoration

Based on the partitioning of the distribution network, we define each partition as an agent. Each agent within a subregion can only access a subset of observable data from the whole distribution network environment. The load restoration task after partitioning is modeled as a Dec-POMDP. By describing the decision-making process of multiple agents within their local observation spaces, this approach enables collaborative optimization across regions, ultimately achieving the global objective. Typically, a Dec-POMDP can be represented as follows.
S , A , T , r , O , N , γ
where S is the state space, A is the joint action space, T is the state transition probability distribution, r is the reward function, O is the joint observation space, N is the number of agents, and γ [ 0 , 1 ) is the discount factor. In the distribution network restoration task, each variable can be described as follows:
1.
State space S : the state space must fully represent the information of the environment, which is defined as follows:
S = { S U , S I , S load , S ¯ load , S gen }
where S U and S I represent the bus voltage and line current in the power grid, S load and S ¯ load represent the load supplied and the load demand in the grid, and S gen represents the output of the generators in the network.
2.
Joint action space A : with the action space of each agent denoted as A i , the joint action space can be defined as A = A 1 × A 2 × × A N . In the distribution network load restoration scenario, the action space for each agent is defined as follows:
A i = { A breaker }
where A breaker corresponds to the switches in partition i . In practice, considering that switch operations must meet specific switching conditions, agents are not allowed to open a switch with both sides charged if the switch is in a closed state. Similarly, they are not allowed to close a switch with both sides charged if the switch is in an open state.
3.
State transition probability distribution T : the probability of the environment transitioning from state s to state s under the joint action a is denoted by T ( s s , a ) . In the distribution network load restoration problem, the next state after applying a given action to the grid is deterministic, so it is fixed as T ( s s , a ) = 1 .
4.
Reward function r : at time t , the reward value r t = r ( s t 1 , a t 1 , s t ) can be calculated by the state at time t 1 , the joint action at time t 1 and the state at time t . According to the Equation (1) in Section 2.1, the reward function can be defined as follows:
r t = P load t P load t 1 P base
where P load t and P base represent the total active power delivered by the system at time t and the predefined baseline. The chosen baseline active power is calculated as the aggregate of individual load baselines. Considering that the system needs to satisfy the constraints, this reward value is valid only when the system does not violate any of the constraints in Section 2.1. If the action taken in the previous time step results in a state that violates a constraint, the reward is set to −1.
5.
Joint observation space O : with the observation space of each agent denoted as O i , then the joint observation space can be defined as O = O 1 × O 2 × × O N . The observation space for each agent i depends on the state space and joint action space and is represented as O i = O ( s , a | i ) . Thus, the observation space for each agent can be defined as follows:
O i = { S i U , S i I , S i load , S ¯ i load , O ( A i ) }
where S i represents the corresponding state component in partition i , and O ( A i ) represents the observed switching status in the corresponding action space.
Due to the escalating computational demands of solving Dec-POMDP, MARL is implemented as a practical approximation method. In this approach, deep neural networks are leveraged to model the decision-making behavior of agents within this framework. In MARL, each agent i selects an action a i based on its partial observation o i through its policy π i , as expressed by
π a | o = i = 1 N π i a i | o i
where π denotes the joint policy distribution of all agents, a represents the joint action, satisfying a = a 1 , a 2 , , a N , and o represents the joint observation, satisfying o = o 1 , o 2 , , o N .
The goal of Dec-POMDP in the context of MARL is to find the optimal joint policy π that maximizes the expected value of the joint reward, as shown in Equation (17).
π = arg max π E t γ t r ( s t , a t , s t + 1 )

3. Load Restoration Structure Based on QTRAN-Alt

3.1. MARL Value Functions Decomposition

In MARL, the MAS aims to identify a collaborative strategy that enhances overall performance by maximizing aggregate returns. However, since the joint policy function of a MAS is difficult to represent explicitly, MARL introduces the state-action value function to evaluate potential rewards in future states. In the state-action value function-based solution method, the optimization target is defined by the equation below:
π = arg max π Q π ( o , a )
where Q π ( o , a ) represents the joint state-action value function of MARL, which can be written as follows:
Q π ( o , a ) = E t γ t r t o 0 = o , a 0 = a
where o 0 and a 0 represent the joint observation and the joint action of the system at the initial step.
As shown in Equation (16), the joint policy space grows exponentially with the number of agents. In practical applications, the MAS is typically executed in a distributed manner, where each agent independently selects its actions.
a i = π i o i
To ensure global optimality during the distributed execution phase while minimizing the computational consumption, the joint state-action value function Q ( o , a ) in MARL can be decomposed into individual state-action value functions Q i ( o i , a i ) for each agent. This decomposition simplifies the learning process and significantly reduces the computational cost. In addressing the electricity distribution network recovery operation, the power grid topology provides a clear physical criterion for the decomposition. Additionally, the linear superposition property of independent load restoration operations across regions corresponds well to the mathematical representation of the decomposition.
Q ( o , a ) = i = 1 N Q i ( o i , a i )
where Q ( o , a ) is the transformed joint state-action value function, which ensures consistency in the optimal action before and after the transformation, as expressed by:
arg max a Q ( o , a ) = arg max a Q ( o , a )
The decomposition requires that the combination of individual optimal actions must be equivalent to the joint optimal action. In system restoration tasks without any power deficit, the objective of maximizing load restoration within each partition is entirely consistent to maximize load restoration across the entire network. Therefore, the state-action value function can be linearly decomposed as shown in Equation (23).
arg max a Q = arg max a 1 Q 1 arg max a N Q N
In MARL, each function is approximated by a neural network. To achieve this, an error correction term is introduced to guide the selection of the optimal action. Specifically, when each agent selects a locally optimal action, the following constraint must be satisfied:
i = 1 N Q i o i , a i Q o , a + V ( o ) = 0 , a = a ¯
where a ¯ represents the set of locally optimal actions for each agent, and V o is the state value function. These two components are expressed as follows:
a ¯ = a ¯ 1 , a ¯ 2 , , a ¯ N , a ¯ i = arg max a i Q i
V o = max a Q i = 1 N Q i o i , a ¯ i
Thus, the optimization objective for the optimal actions in MARL is as follows:
min Q o , a ¯ Q o , a ¯ + V ( o )
where Q represents the estimated value of the joint state-action value function, which is approximated by a deep neural network.

3.2. QTRAN-Alt Loss Function

In MARL scenarios, the interactions between individual agents and the environment often make it difficult to directly quantify the impact of the action from a single agent on the overall reward. A common approach to addressing this challenge is to fix the actions of other agents while introducing variations in the actions of a specific agent, to assess its marginal contribution to the global reward. This method of analyzing the difference between actual events and those that could occur in a hypothetical scenario is known as counterfactual analysis. Through counterfactual analysis, multi-agent collaborative decision-making can more accurately assign credit, leading to more efficient and robust policy learning. For this study, we employ the QTRAN-alt algorithm [20], integrating it with a counterfactual-based collective architecture to discern optimal and suboptimal actions, thereby reinforcing the constraints on suboptimal actions.
For Equation (24), when the action differs from the local optimum, it can be expressed based on counterfactual analysis as follows:
Q o , a i , a i Q o , a i , a i + V 0 , a a ¯
where a i is the actions of all agents except for agent i , which satisfies a = a i , a i . During the training phase, the current action is generally not considered locally optimal. Therefore, the optimization objective for non-optimal actions is formulated as shown in Equation (29).
min a i a Q o , a i , a i Q o , a i , a i + V o
In the QTRAN-alt algorithm, the state-action value function Q i ( o i , a i ) , joint state-action value function Q ( o , a ) , transformed joint state-action value function Q ( o , a ) , and state value function V o are all approximated using neural networks. The loss function is expressed as follows:
L = L t d + λ o p t L o p t + λ n o p t L n o p t
where L t d represents the temporal difference loss. L o p t and L n o p t correspond to the constraint losses for optimal and non-optimal actions, respectively, as defined in Equations (27) and (29). λ o p t and λ n o p t denote the weight coefficients for the optimal and non-optimal loss terms.

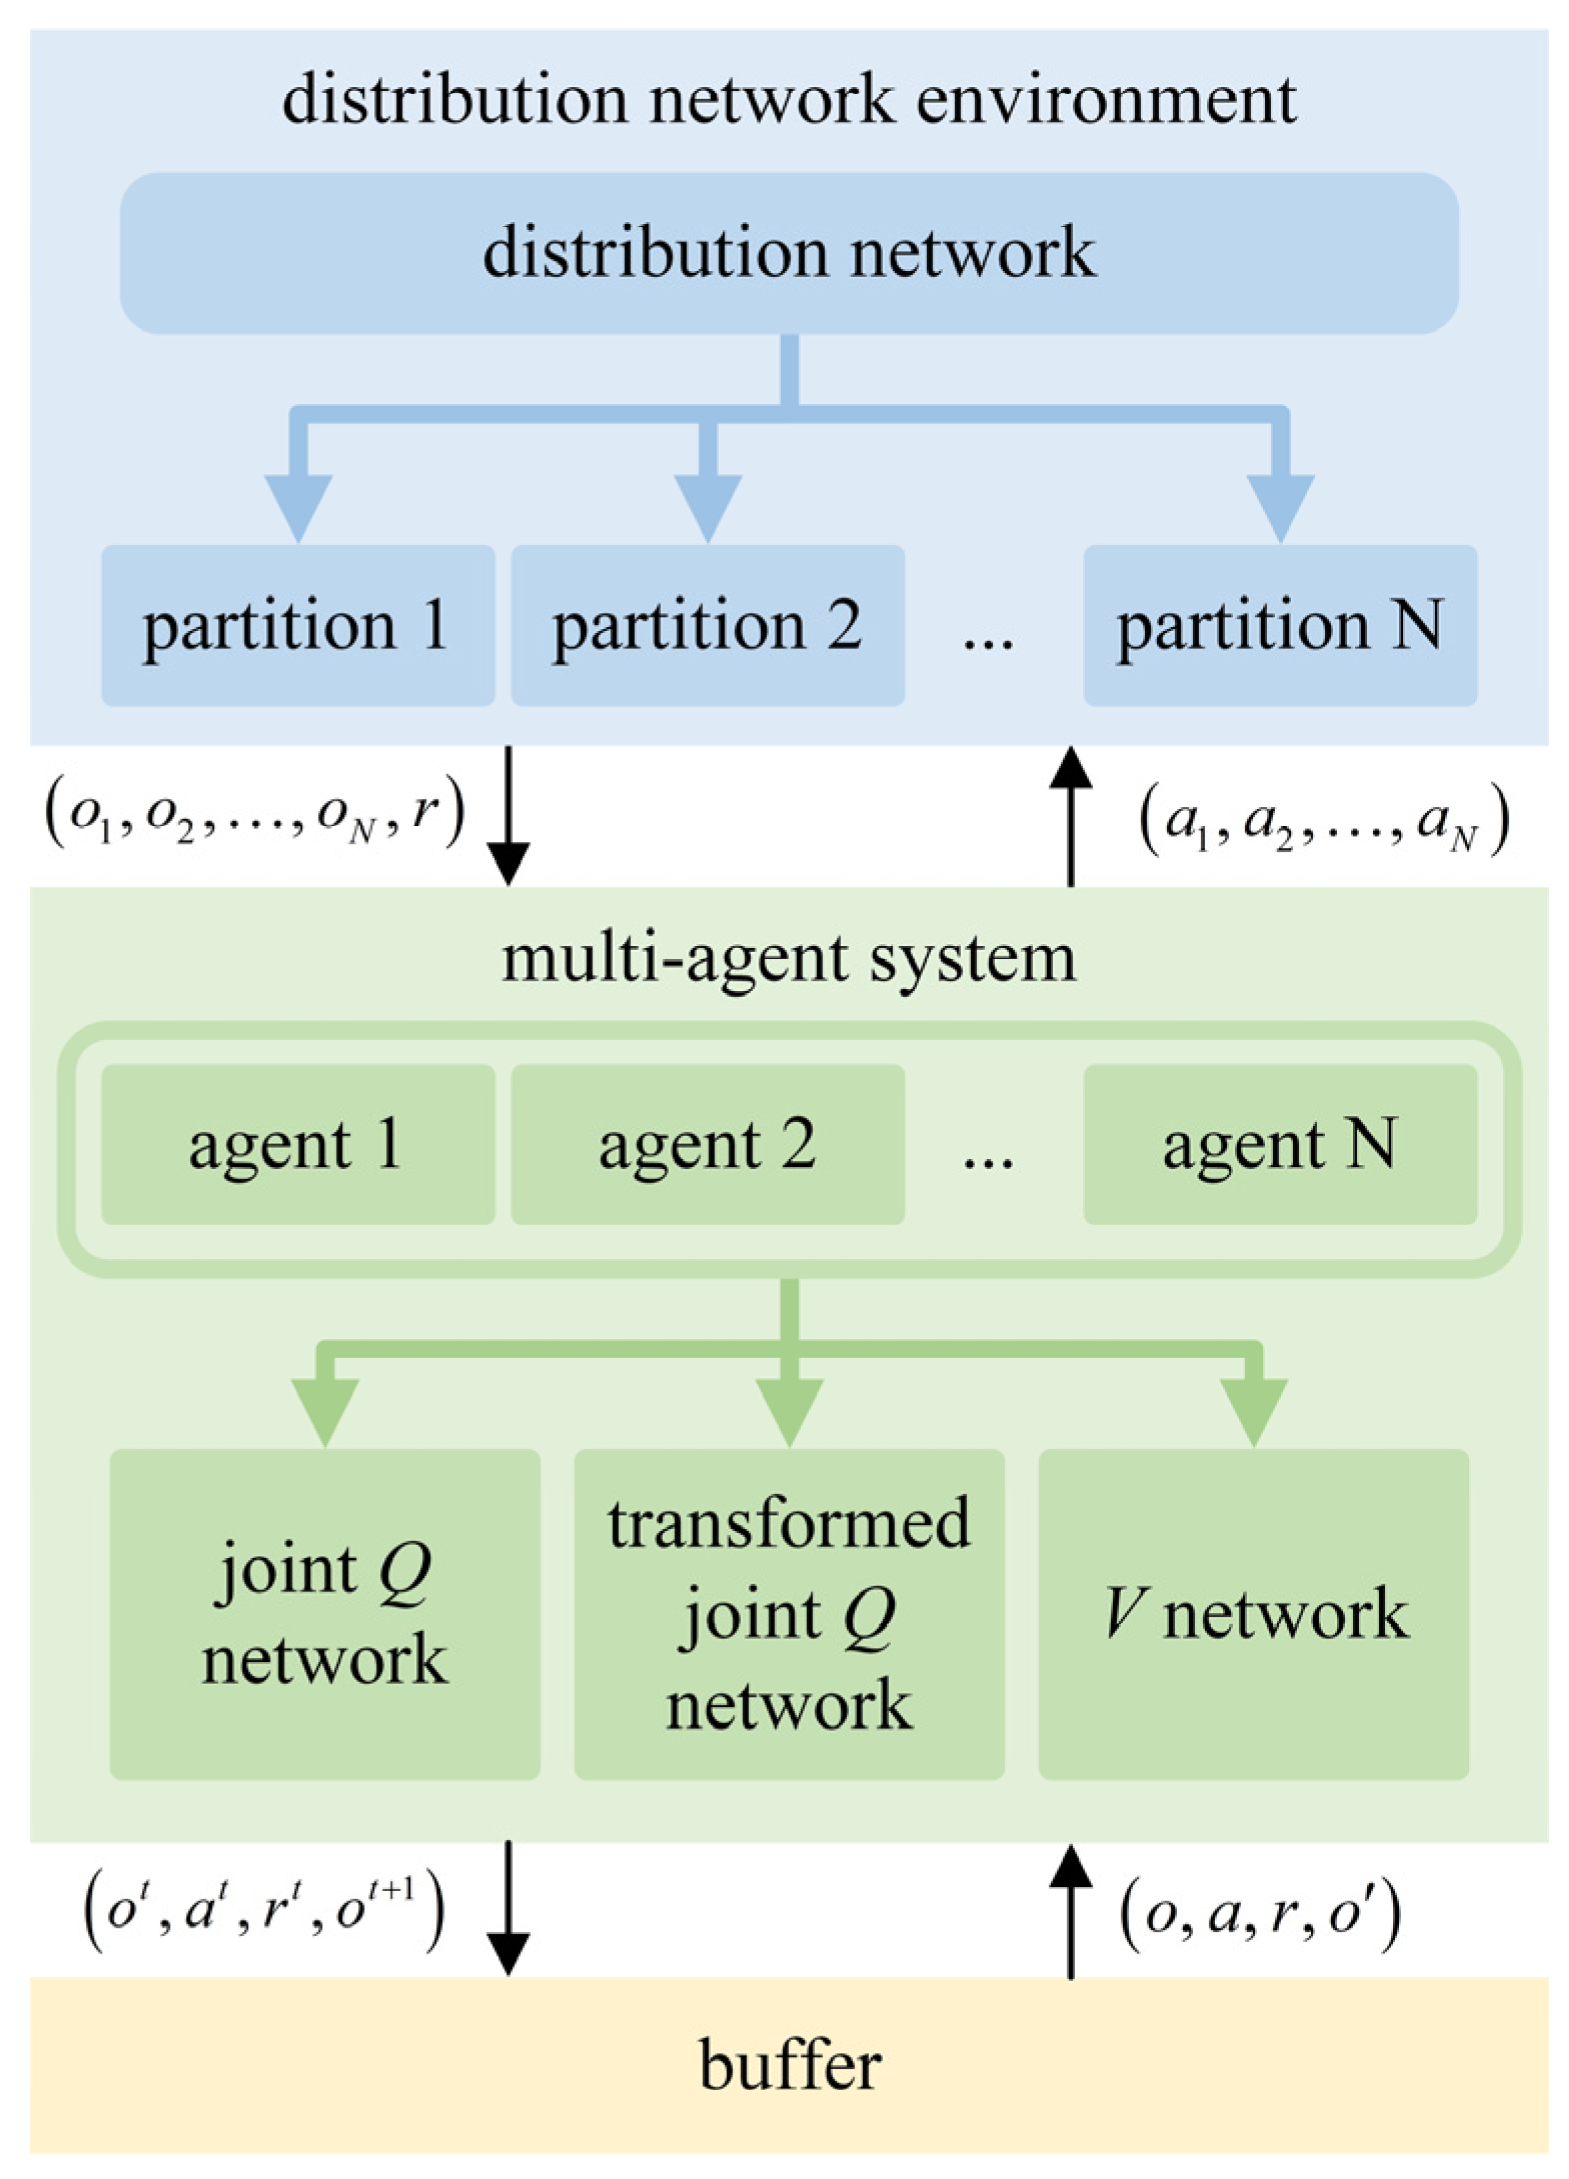
3.3. Load Restoration Structure

Based on the methodology described earlier, the distribution network fault restoration task is partitioned using an enhanced Girvan–Newman algorithm and subsequently modeled as a Dec-POMDP model to be solved by the QTRAN-alt algorithm, with its architecture illustrated in Figure 3.
When constructing the distribution network environment, an improved Girvan–Newman algorithm is employed to partition the buses evenly based on the number of feeders. Within each partition, the action and observation spaces for the corresponding agents are established following Equation (13) and (15). Each agent approximates its state-action value function Q i ( o i , a i ) using a neural network. During the sampling phase, each subregion operates as an independent agent, analyzing local observations to make decisions. The joint action ( a 1 , a 2 , , a N ) is then applied to the environment, which subsequently updates its state and computes the reward values. The joint observations and rewards, denoted as ( o 1 , o 2 , , o N , r ) , are returned to the MAS. After multiple rounds of interaction, the interaction tuples o t , a t , r t , o t + 1 are stored in the experience replay buffer.
To accelerate the convergence of MARL, neural networks are used to approximate the joint state-action value function Q ( o , a ) in Equation (18), the transformed joint state-action value function Q ( o , a ) in Equation (21), and the state value function V o in Equation (26). During training, a batch of samples o , a , r , o is drawn from the experience buffer, and the output of each neural network is fed into the networks for joint state-action value function, transformed joint state-action value function, and state value function. Finally, the MAS system is updated based on the loss function described in Equation (30).

4. Experimental Study

To validate the proposed method, experiments were conducted on two benchmark distribution networks: a 27-bus system and a 70-bus system, which are both three-phase balanced low-voltage distribution systems with multiple substations. The system topology and component parameters are available in [21], and the equipment scales for both test cases are summarized in Table 1.
In the 27-bus system, three low-voltage buses from the upstream substations were excluded from the partitioning process, while in the 70-bus system, two such buses were similarly excluded. Each line in the network is equipped with controllable switches at both ends, which serve as the action space for agents. The load profiles for each test case were constructed by superimposing a 15 min resolution time series curve on the baseline load values, with several representative load profiles illustrated in Figure 4.
For each test case, a fault was randomly set on a low-voltage bus of an upstream substation at a randomly selected time during the day. The MAS was required to complete the load restoration task within 10 steps. Otherwise, it is considered a task failure. The agents interacted with the environment for a total of 100,000 episodes, with evaluations conducted every 100 interactions. The hyperparameters of the MARL algorithm are listed in Table 2.
To demonstrate the superiority of the QTRAN-alt algorithm, it was compared against a random action baseline as well as the VDN [22] and QMIX [23]. Both VDN and QMIX share the same hyperparameter settings as QTRAN-alt. The MARL training and testing were based on PyTorch 2.2.1. The modeling and simulation of the power grid environment were carried out using pandapower 2.13.1 [24].

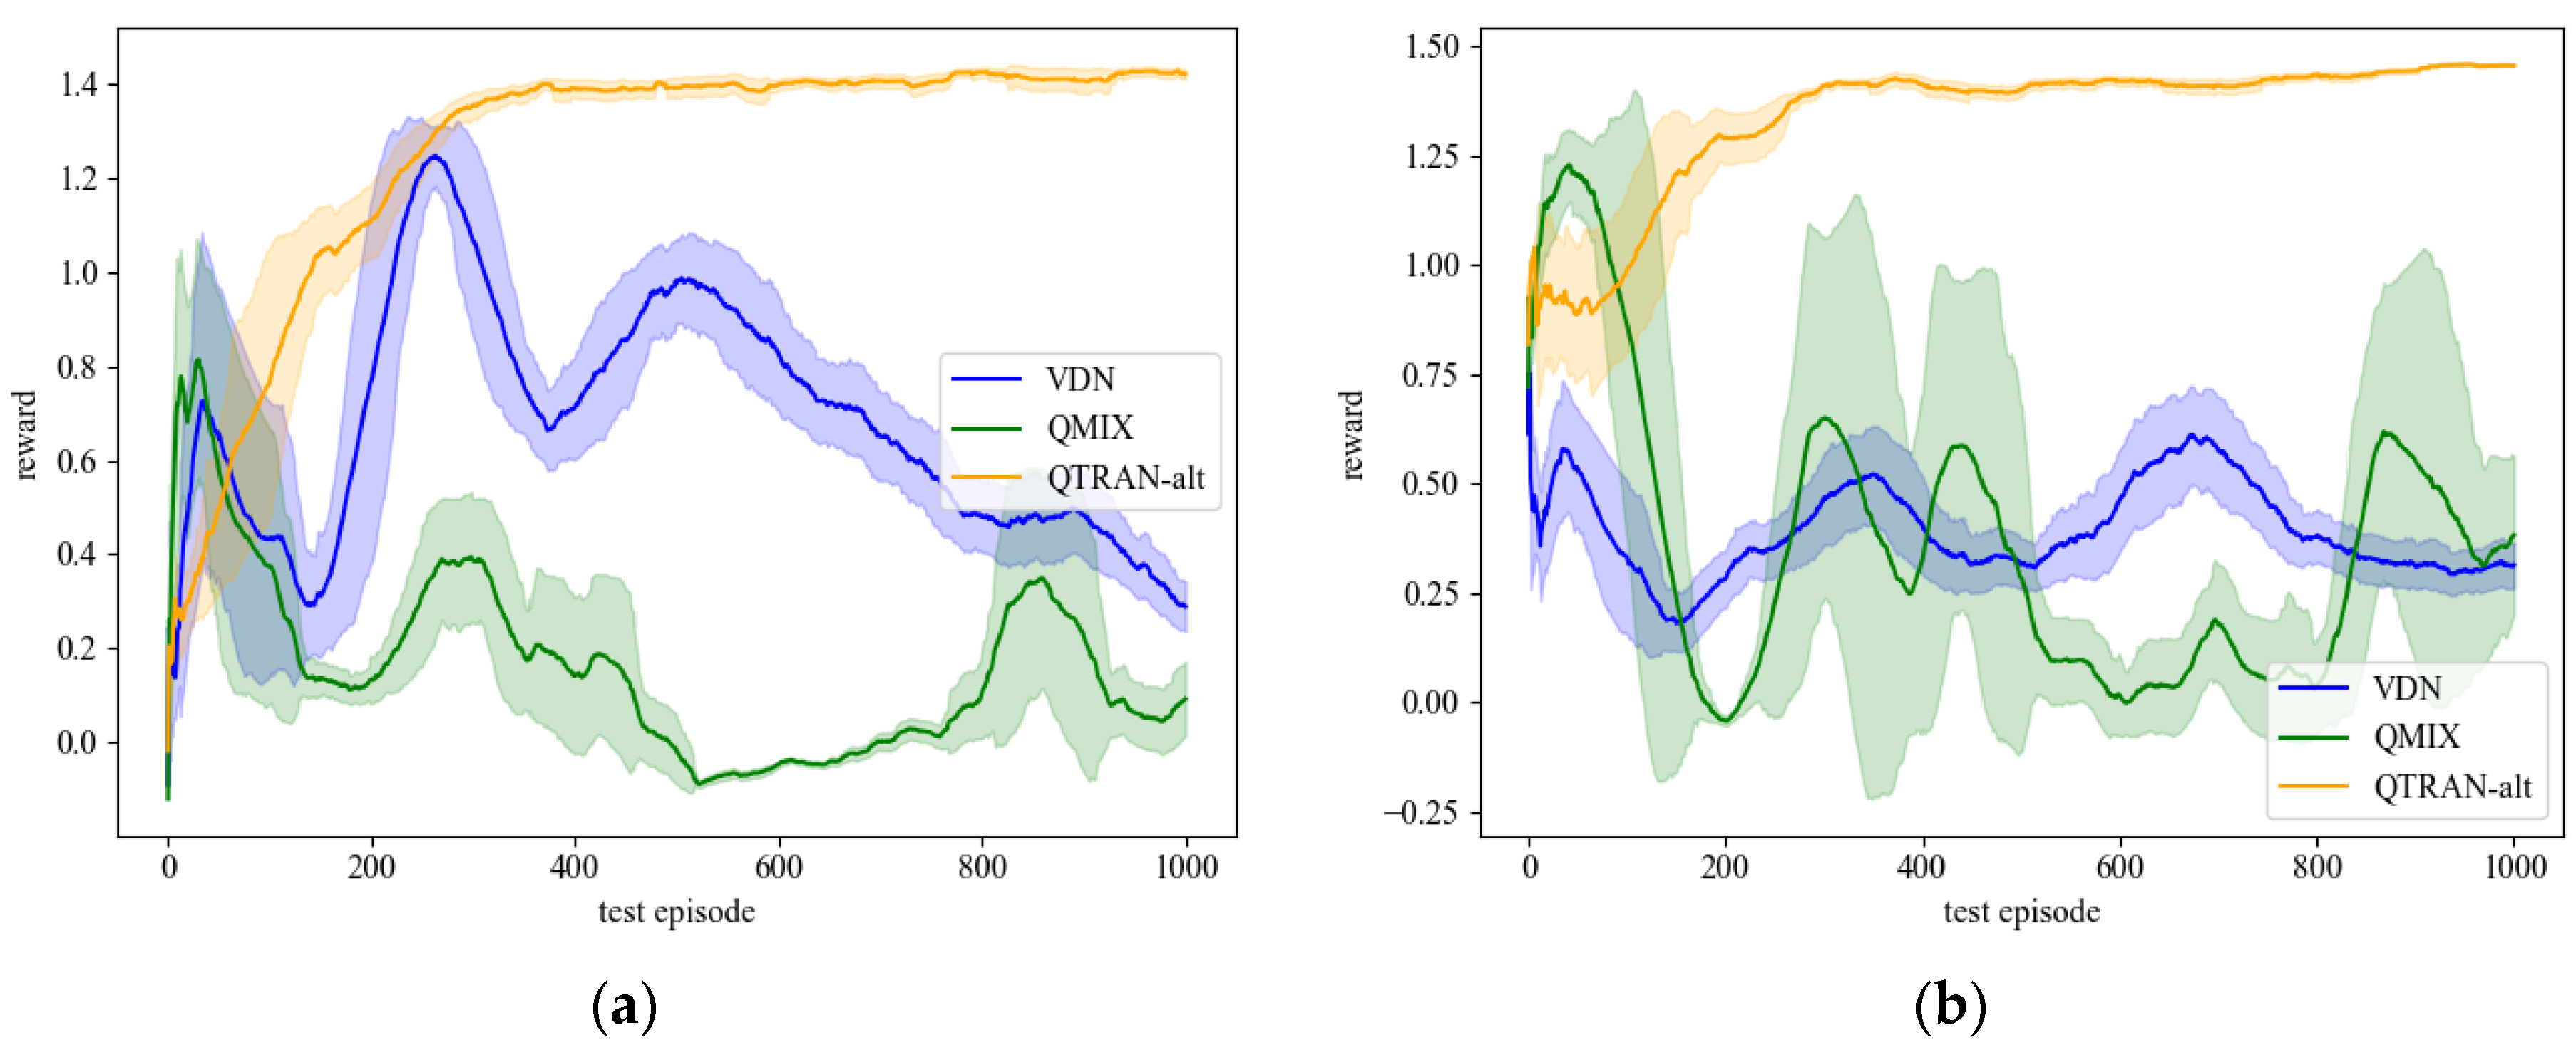
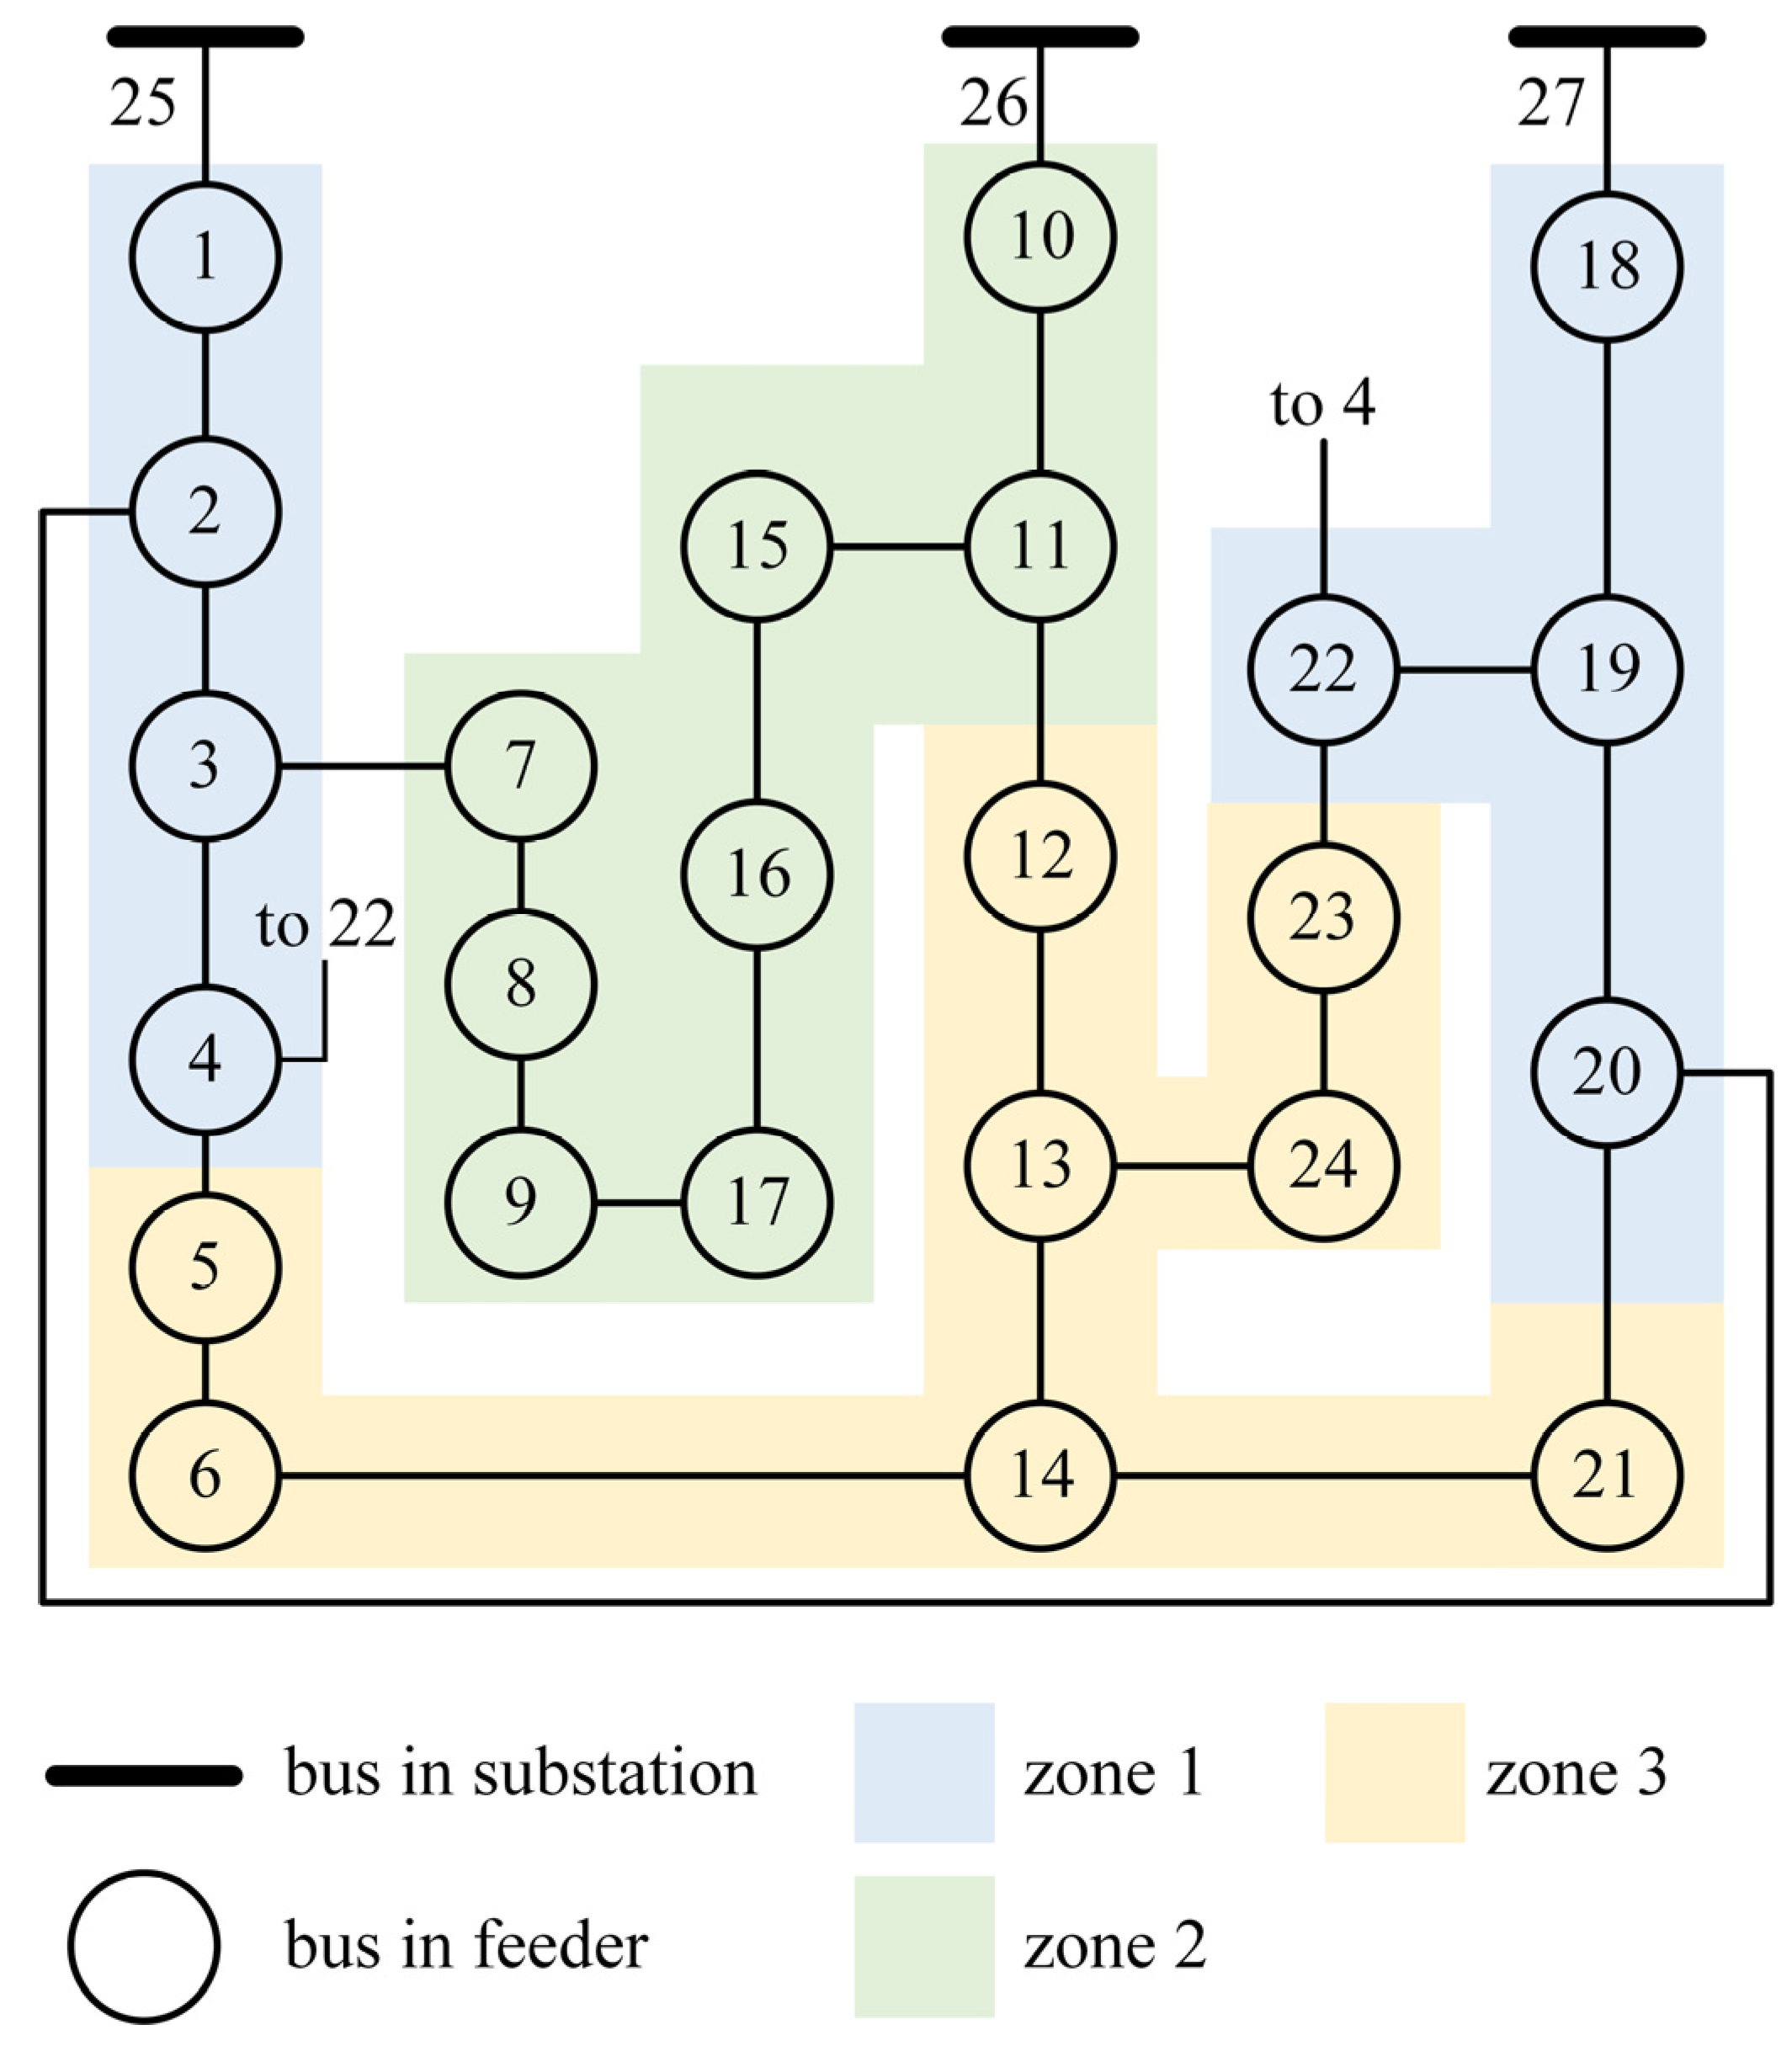
4.1. Load Restoration Experiments in the 27-Bus System

In this experiment, two additional AC lines were incorporated into the original 27-bus system, specifically connecting 2–20 and 4–22. The partitioning results for the 24 buses in the feeder of the distribution network are shown in Figure 5. After partitioning, each agent manages eight buses with load, and under normal operating conditions, the following lines are disconnected: 9–17, 6–14, 13–24, 14–21, 2–20, and 4–22.
To evaluate the acceleration effect of the improved Girvan–Newman algorithm in agent training, a control scenario with random partitioning was also set up during the experiments. This allows for the comparison of the adaptability and learning effectiveness of different algorithms under unstructured partitioning conditions. The reward curves for the four algorithms in the random partitioning scenario are shown in Figure 6. It can be observed that the VDN algorithm converges the fastest and yields the highest reward, followed by QTRAN-alt, which significantly outperforms both QMIX and random actions. QMIX exhibits slower convergence and greater fluctuation in reward values during training. The reward values for random actions fluctuate around 0.17, indicating no learning capability.
Further analysis of the reward changes after partitioning with the Girvan–Newman algorithm is shown in Figure 7. The reward for random actions significantly increases to around 0.8, suggesting that a reasonable partitioning strategy provides a more favorable training environment for the MAS. At this point, QTRAN-alt still converges quickly, while VDN and QMIX exhibit varying degrees of oscillation in their reward values, indicating a certain level of instability in these algorithms.
To systematically assess the final performance of each algorithm in the distribution network recovery task, Table 3 presents the average recovery success rates for each algorithm across all test rounds. The task success rate is set to 100% only when all lost loads have been fully recovered without violating either the time limit or power system constraints. According to the experimental data, in the small-scale grid environment, where the number of agents is relatively low and the decision dimensions are simpler, VDN, relying on its straightforward linear decomposition mechanism, achieves comparable convergence speed and final rewards to QTRAN-alt. Due to the complexity of its value decomposition network, QMIX faces greater optimization challenges during training, resulting in overall poorer performance. In general, the improved Girvan–Newman algorithm combined with QTRAN-alt demonstrates the best performance in recovery tasks. Particularly in the last 50 test rounds, the recovery success rate of QTRAN-alt achieved 100%, further validating the positive impact of a well-structured partitioning strategy on improving agent learning efficiency and system recovery capabilities.

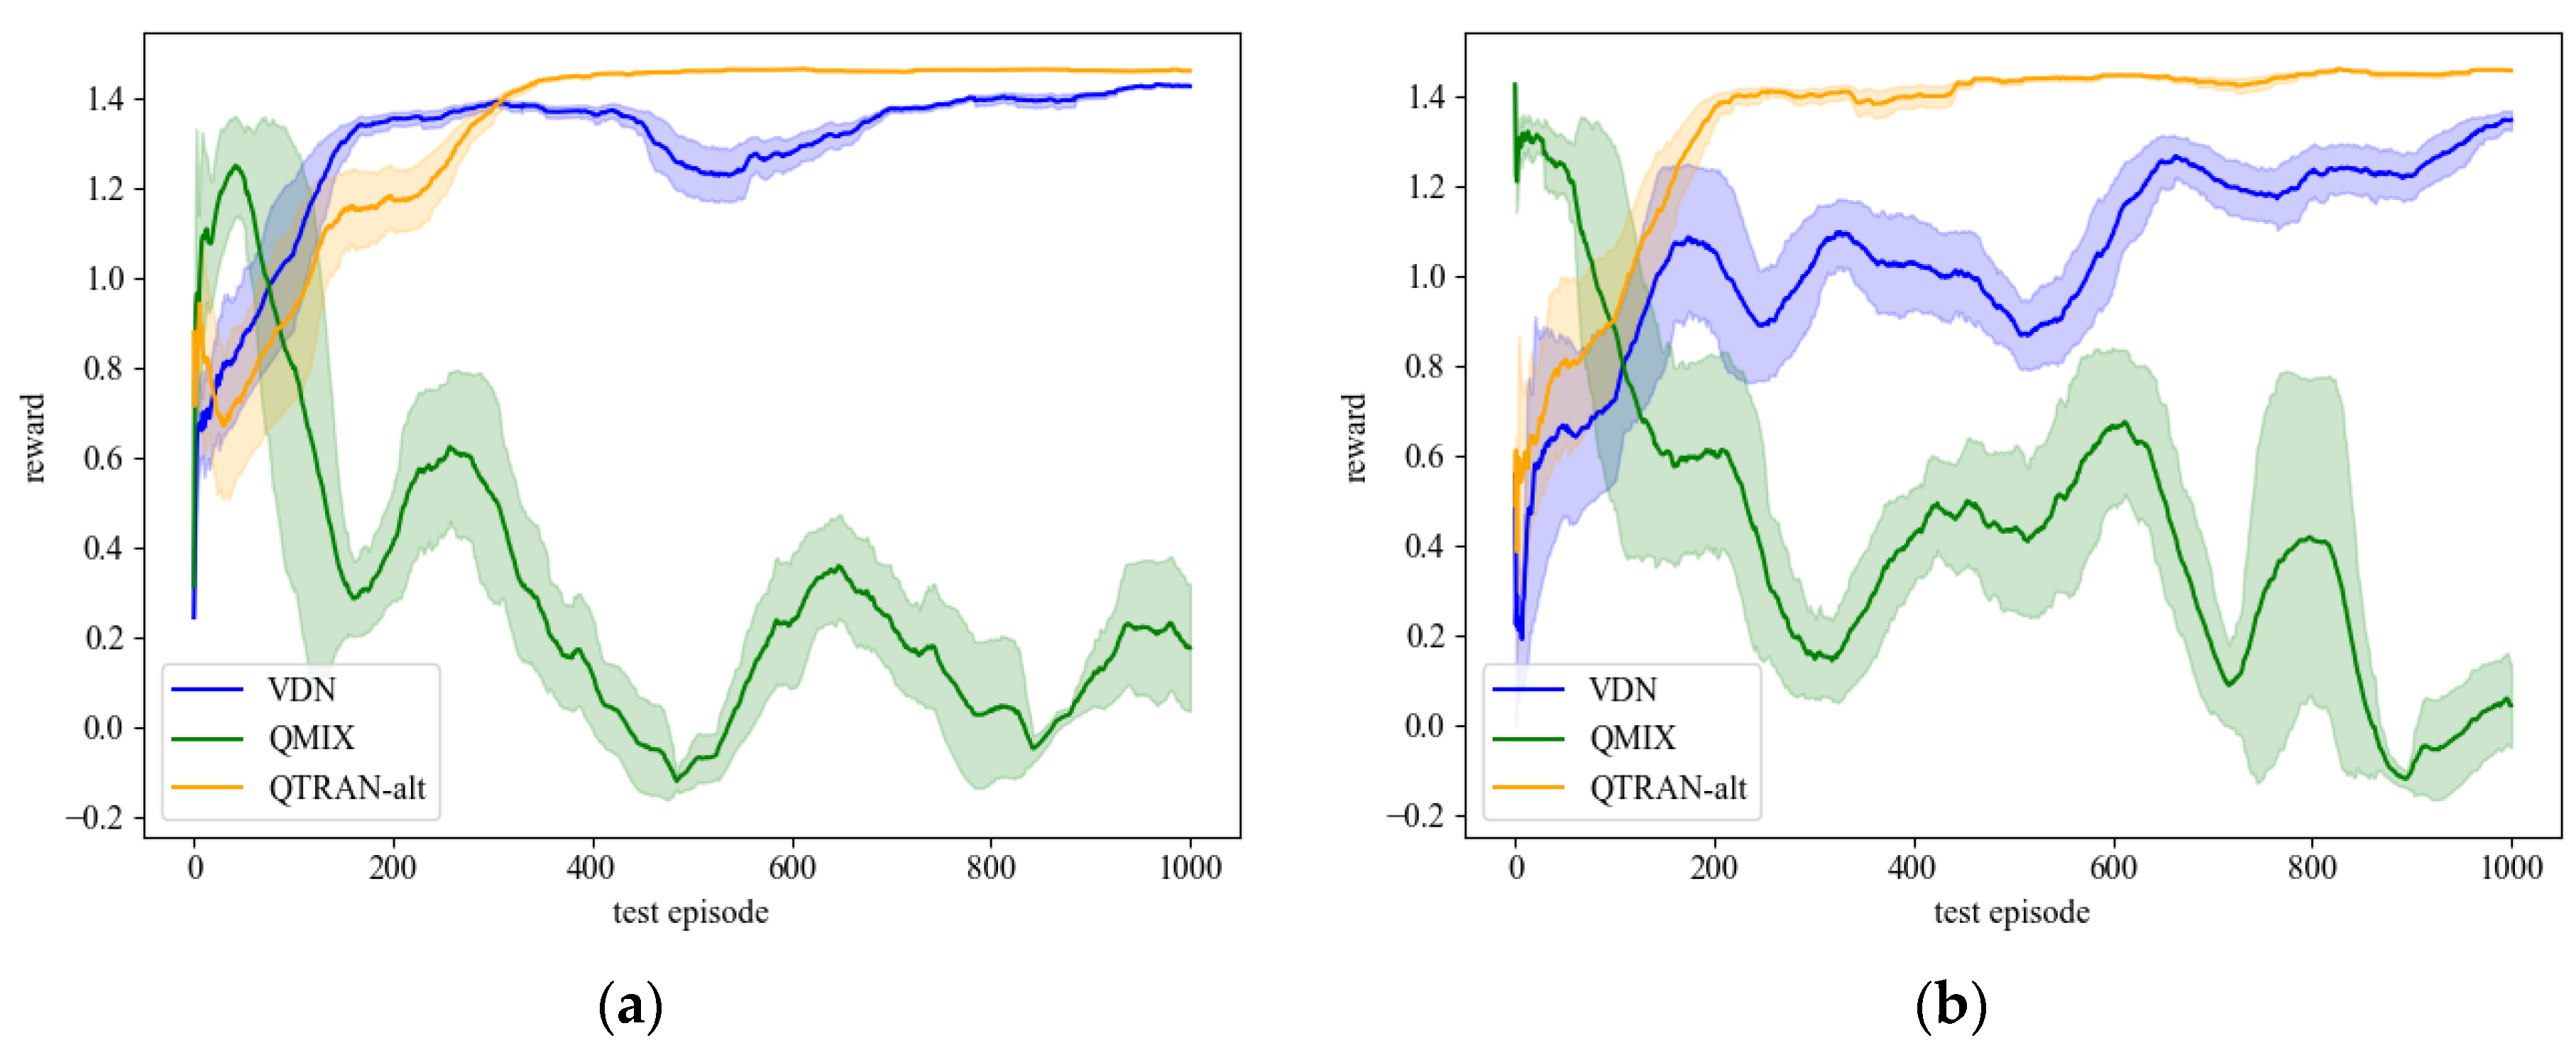
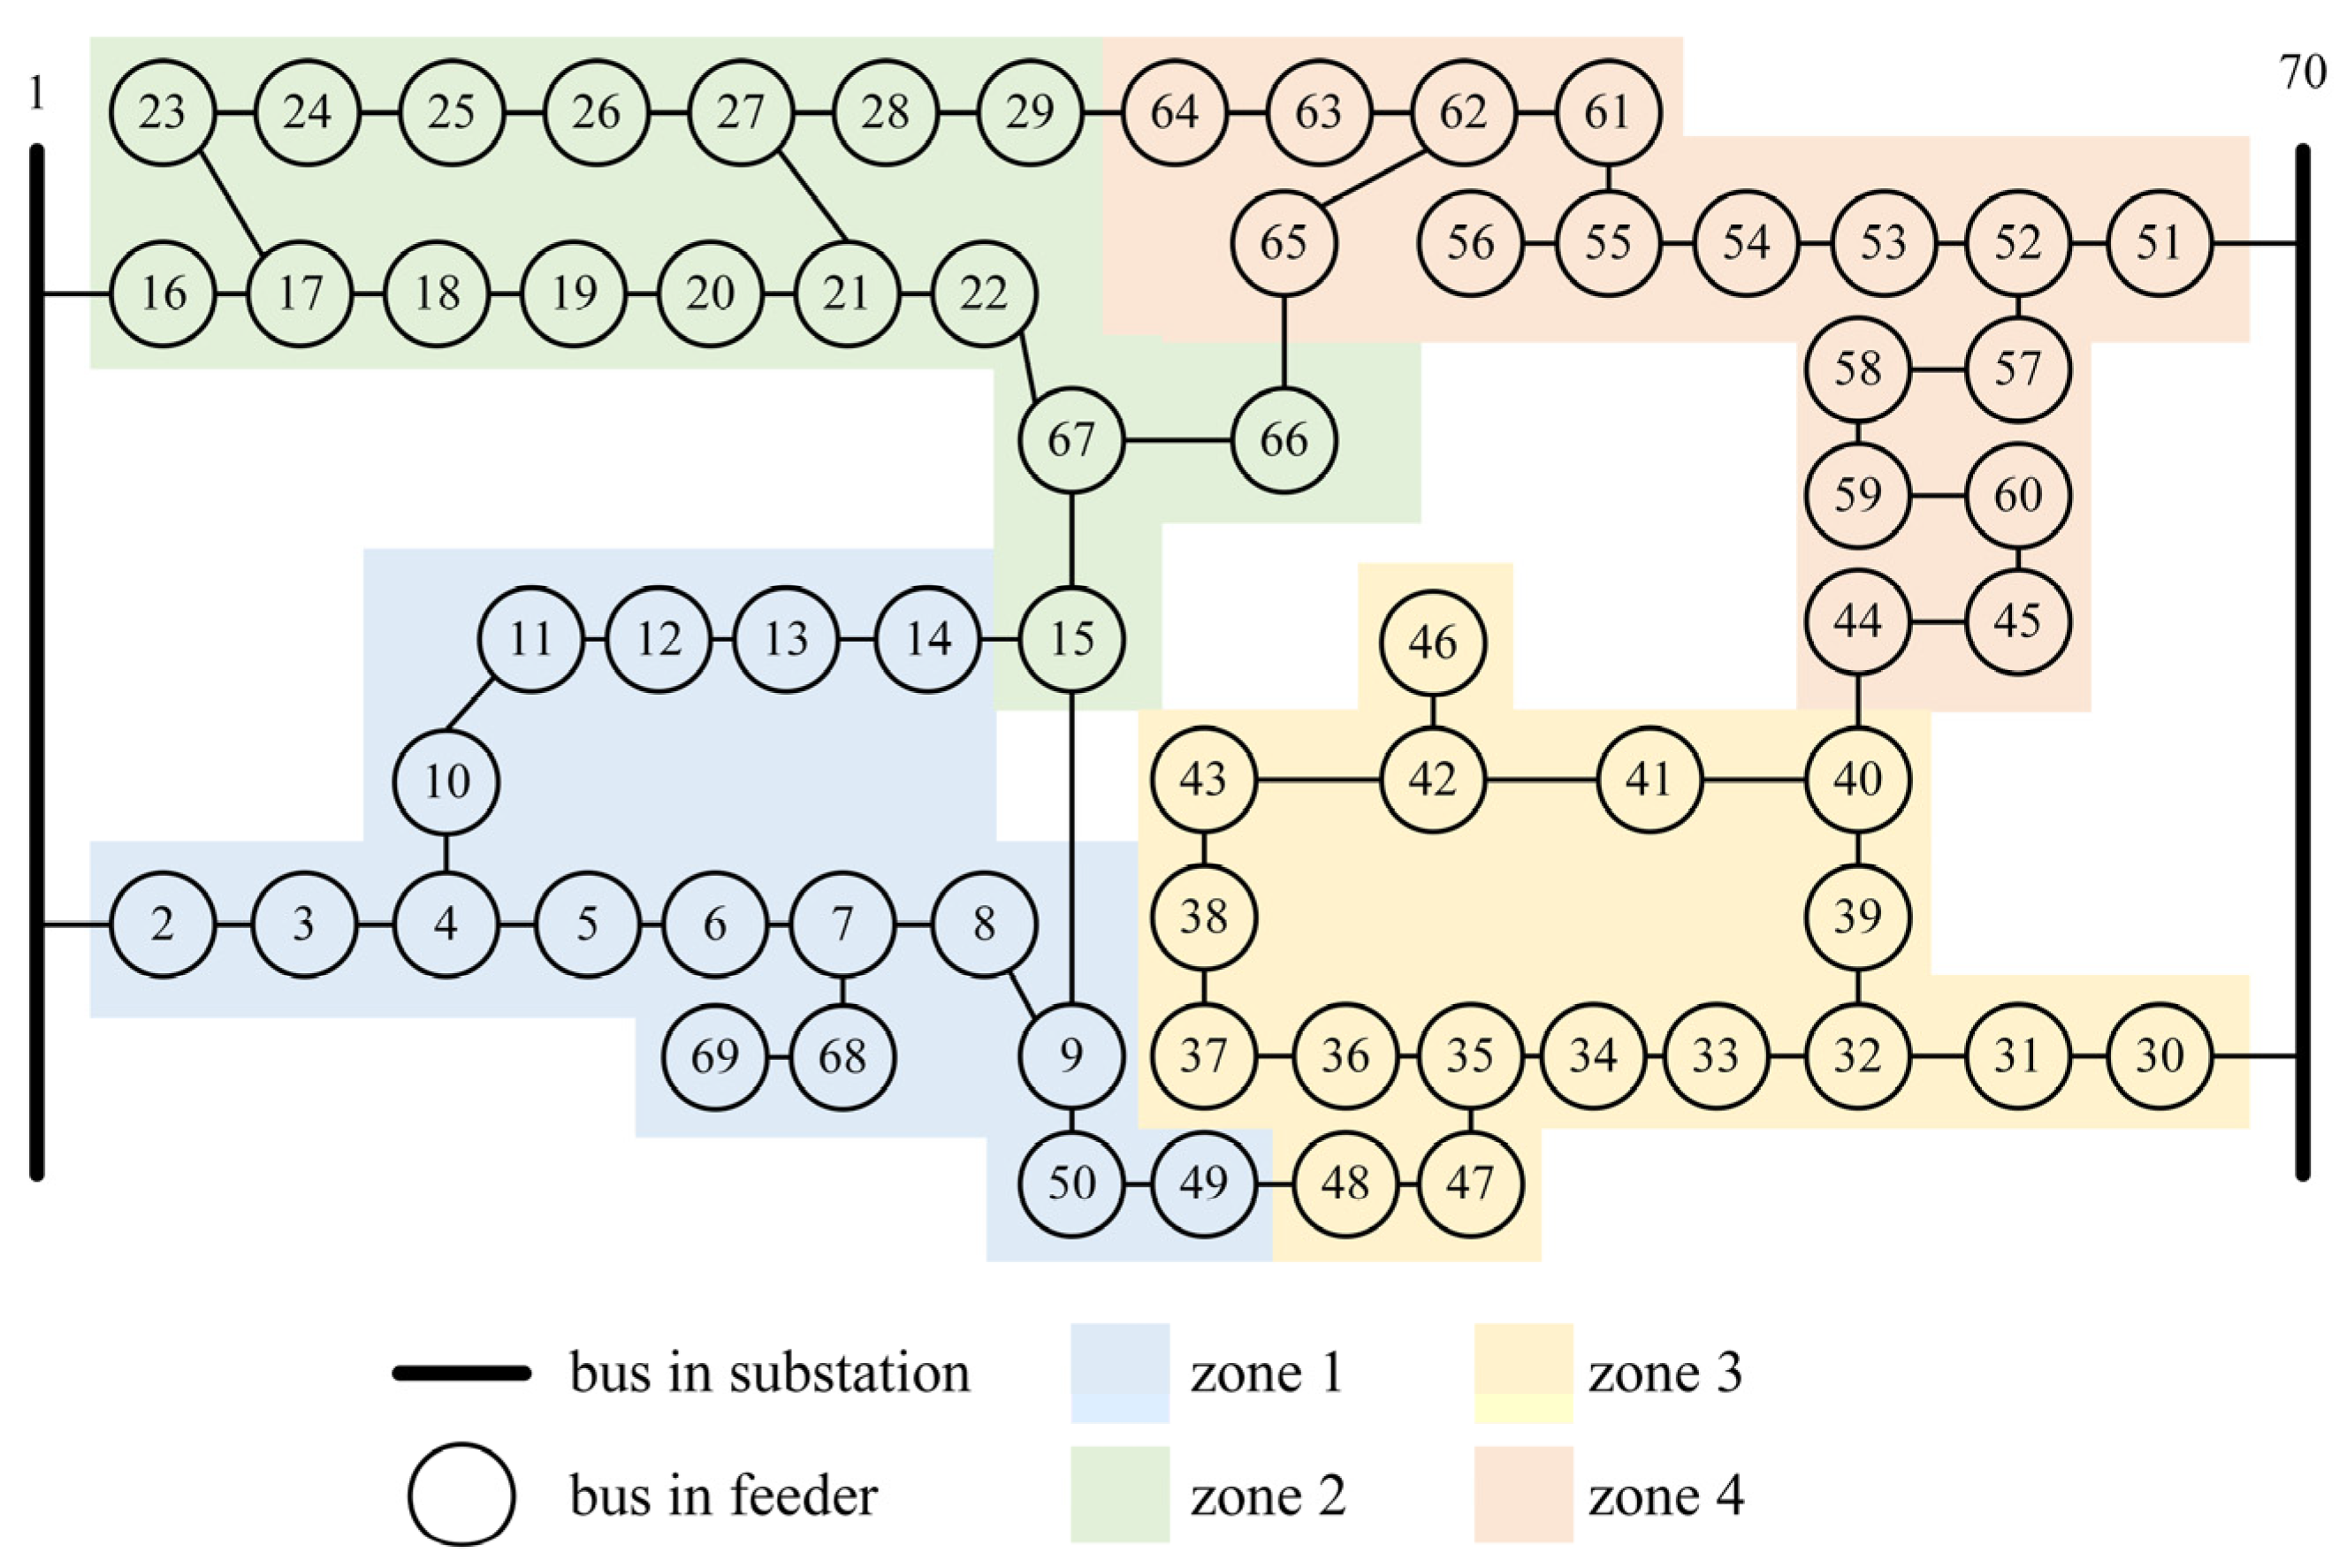
4.2. Load Restoration Experiments in the 70-Bus System

Since the 70-bus distribution network consists of four feeders, the number of partitions was set to four. The partitioning results for the 68 buses within the feeders are shown in Figure 8. After partitioning, each agent manages 17 buses, and under normal operating conditions, the following lines are disconnected: 49–50, 9–15, 38–43, 15–67, 44–45, 26–27, 29–64, and 65–66.
The reward curves for different algorithms under random partitioning are shown in Figure 9. Throughout the training process, the reward for random actions remained around −0.2, indicating that without strategy optimization, random actions fail to effectively address task requirements. Due to the unreasonable partitioning, agents executing random actions frequently violate system constraints, resulting in negative rewards. The rewards for VDN and QMIX were also notably low; although VDN eventually converged to approximately 0.4, its low reward suggests that it only learned partially effective strategies for the task. QTRAN-alt, on the other hand, converged and stabilized around 0.8. These results indicate that under a randomly partitioned grid environment, none of the algorithms were able to explore optimal strategies. Compared to Figure 6, it is evident that in large-scale distribution system restoration tasks, the increase in the number of agents, as well as the dimensional expansion of actions and observations, makes MAS coordination a more challenging task.
Experiments were then conducted in a power grid environment partitioned using the improved Girvan–Newman method, with the reward variations for each algorithm illustrated in Figure 10. As shown, the reward for random actions increased to approximately 0.5, demonstrating that a well-structured partitioning strategy significantly reduces constraint violations caused by agent actions. However, since random actions do not involve policy learning, their reward did not exhibit notable improvements over time. While the rewards for QMIX and VDN were generally higher than those for random actions, their fluctuations were significantly more pronounced. Compared to Figure 7, this suggests that the instability observed in these two algorithms within small-scale grids becomes even more apparent as system dimensionality increases. QTRAN-alt exhibited markedly superior performance, rapidly converging to a high reward value of approximately 1.4 and maintaining steady improvement in later stages. Furthermore, the variance in the reward of QTRAN-alt was substantially lower than that of QMIX and VDN, indicating its higher learning efficiency and better adaptability to large-scale distribution system restoration tasks. Additionally, hyperparameter sensitivity analysis demonstrated that the QTRAN-alt algorithm exhibits superior stability and performance, with detailed comparative results in Appendix A.
Table 4 summarizes the success rates of different algorithms across all test rounds under the two partitioning conditions, providing an intuitive comparison of their system restoration performance. From a partitioning perspective, the improved Girvan–Newman method significantly enhanced the success rate, showing the importance of reasonable partitioning strategies in distribution network fault handling. Among the algorithms, QTRAN-alt consistently outperformed the others in both partitioning scenarios. Even in the random partitioning setting, it demonstrated a certain degree of adaptability. In the improved Girvan–Newman partitioned environment, QTRAN-alt was able to ensure successful system restoration in nearly all cases, confirming its strong policy optimization capability and its effectiveness in supporting multi-agent collaboration. These results highlight its superior performance in large-scale distribution system restoration tasks.

5. Conclusions

This paper addresses the system restoration problem in large-scale distribution networks caused by failures at upstream substations and proposes a recovery method based on improved Girvan–Newman and QTRAN-alt. By partitioning the distribution network, each subnet autonomously optimizes its local load restoration strategy within an independent agent framework. The approach leverages value function decomposition and counterfactual analysis to ensure consistency between local and global optimality.
In the small-scale 24-bus distribution network, where interactions of agents and dependencies are relatively simple, the improved Girvan–Newman and QTRAN-alt algorithms did not exhibit significant advantages. However, in the large-scale 70-bus distribution network, the increasing system size and agent count led to a substantial rise in both local and global interaction complexity. Under these conditions, the proposed method achieved a significantly higher success rate in system restoration compared to other baseline algorithms, while also demonstrating faster reward convergence. These results suggest that for large-scale and complex distribution networks, the proposed method offers an effective and feasible solution for system restoration.
Future work will extend this research to address complex fault scenarios in large-scale urban distribution networks with high penetration of renewable energy sources and emerging load types. In an environment with a variety of controllable resources, we consider exploring the MARL algorithm that can handle the joint action spaces with both discrete and continuous. Moreover, the uncertainty quantification framework will be enhanced by integrating advanced stochastic modeling approaches. This uncertainty-aware methodology will be synergistically combined with regional collaboration strategies, leveraging both physical grid characteristics and data-driven measurements from real-world power systems.

Author Contributions

Conceptualization, C.Z. and T.G.; investigation, Q.S.; methodology, C.Z. and Q.S.; project administration, S.M.; resources, J.H. and Y.W.; validation, H.M.; visualization, H.C.; writing—original draft, C.Z. and T.G.; writing—review and editing, J.C. and T.G. All authors have read and agreed to the published version of the manuscript.

Funding

This research was funded by The National Key Research and Development Program of China (2021ZD0112700); (Jinghai Research 2024-01) State Grid Tianjin Jinghai Electric Power Company Technology Project (520327240004).

Data Availability Statement

The original contributions presented in this study are included in the article. Further inquiries can be directed to the corresponding author.

Conflicts of Interest

Authors Chao Zhang, Yan Wang and Hao Chen were employed by State Grid Tianjin Jinghai Electric Power Supply Company. Author Qiao Sun was employed by State Grid Tianjin Chengnan Electric Power Supply Company. Authors Jiakai Huang and Shiqian Ma were employed by State Grid Tianjin Electric Power Company Electric Power Research Institute. Author Hanning Mi was employed by China Electric Power Research Institute. The remaining authors declare that the research was conducted in the absence of any commercial or financial relationships that could be construed as a potential conflict of interest.

Appendix A

Experiments of hyperparameter sensitivity analysis were conducted on three hyperparameters—epsilon, gamma, and learning rate—in the 70-bus system with calculated partitions. VDN and QMIX are very sensitive to parameters in different settings. On the contrary, QTRAN-alt shows relatively stable convergence performance.
Figure A1. Comparative analysis of algorithm performance with different epsilon: (a) is rewards for three algorithms while epsilon = 0.8; (b) is rewards for three algorithms while epsilon = 1.
Processes 13 01473 g0a1
Figure A2. Comparative analysis of algorithm performance with different gamma: (a) is rewards for three algorithms while gamma = 0.9; (b) is rewards for three algorithms while gamma = 0.95.
Processes 13 01473 g0a2
Figure A3. Comparative analysis of algorithm performance with different learning rate: (a) is rewards for three algorithms while learning rate = 1 × 10⁻³; (b) is rewards for three algorithms while learning rate = 1 × 10⁻⁴.
Processes 13 01473 g0a3

References

  1. Tong, H.; Zeng, X.; Yu, K.; Zhou, Z. A Fault Identification Method for Animal Electric Shocks Considering Unstable Contact Situations in Low-Voltage Distribution Grids. In IEEE Transactions on Industrial Informatics; IEEE: New York, NY, USA, 2025; pp. 1–12. [Google Scholar] [CrossRef]
  2. Arif, A.; Cui, B.; Wang, Z. Switching Device-Cognizant Sequential Distribution System Restoration. IEEE Trans. Power Syst. 2022, 37, 317–329. [Google Scholar] [CrossRef]
  3. Heydt, G.T. The Next Generation of Power Distribution Systems. IEEE Trans. Smart Grid 2010, 1, 225–235. [Google Scholar] [CrossRef]
  4. Li, X.; Hu, C.; Luo, S.; Lu, H.; Piao, Z.; Jing, L. Distributed Hybrid-Triggered Observer-Based Secondary Control of Multi-Bus DC Microgrids Over Directed Networks. IEEE Trans. Circuits Syst. Regul. Pap. 2025, 1–14. [Google Scholar] [CrossRef]
  5. Li, J.; Ma, X.-Y.; Liu, C.-C.; Schneider, K.P. Distribution System Restoration with Microgrids Using Spanning Tree Search. IEEE Trans. Power Syst. 2014, 29, 3021–3029. [Google Scholar] [CrossRef]
  6. Xia, Y.; Li, Z.; Xi, Y.; Wu, G.; Peng, W.; Mu, L. Accurate Fault Location Method for Multiple Faults in Transmission Networks Using Travelling Waves. IEEE Trans. Ind. Inform. 2024, 20, 8717–8728. [Google Scholar] [CrossRef]
  7. Arif, A.; Wang, Z. Service Restoration in Resilient Power Distribution Systems with Networked Microgrid. In Proceedings of the 2016 IEEE Power and Energy Society General Meeting (PESGM), Boston, MA, USA, 17–21 July 2016; pp. 1–5. [Google Scholar]
  8. Poudel, S.; Dubey, A. A Graph-Theoretic Framework for Electric Power Distribution System Service Restoration. In Proceedings of the 2018 IEEE Power & Energy Society General Meeting (PESGM), Portland, OR, USA, 5–10 August 2018; pp. 1–5. [Google Scholar]
  9. Momen, H.; Jadid, S. Resilience Enhancement of Power Distribution System Using Fixed and Mobile Emergency Generators Based on Deep Reinforcement Learning. Eng. Appl. Artif. Intell. 2024, 137, 109118. [Google Scholar] [CrossRef]
  10. Xie, H.; Tang, L.; Zhu, H.; Cheng, X.; Bie, Z. Robustness Assessment and Enhancement of Deep Reinforcement Learning-Enabled Load Restoration for Distribution Systems. Reliab. Eng. Syst. Saf. 2023, 237, 109340. [Google Scholar] [CrossRef]
  11. Jo, S.; Oh, J.-Y.; Yoon, Y.T.; Jin, Y.G. Self-Healing Radial Distribution Network Reconfiguration Based on Deep Reinforcement Learning. Results Eng. 2024, 22, 102026. [Google Scholar] [CrossRef]
  12. Mohammed, N. Mathematics of Reinforcement Learning and Handling of the Curse of Dimensionality. In Proceedings of the Mathematical Sciences Conference, African Institute for Mathematical Science, Cape Town, South Africa, 11–12 June 2019. [Google Scholar]
  13. Wang, Y.; Qiu, D.; Teng, F.; Strbac, G. Towards Microgrid Resilience Enhancement via Mobile Power Sources and Repair Crews: A Multi-Agent Reinforcement Learning Approach. IEEE Trans. Power Syst. 2024, 39, 1329–1345. [Google Scholar] [CrossRef]
  14. Vu, L.; Vu, T.; Vu, T.L.; Srivastava, A. Multi-Agent Deep Reinforcement Learning for Distributed Load Restoration. IEEE Trans. Smart Grid 2024, 15, 1749–1760. [Google Scholar] [CrossRef]
  15. Fan, B.; Liu, X.; Xiao, G.; Kang, Y.; Wang, D.; Wang, P. Attention-Based Multiagent Graph Reinforcement Learning for Service Restoration. IEEE Trans. Artif. Intell. 2024, 5, 2163–2178. [Google Scholar] [CrossRef]
  16. Si, R.; Chen, S.; Zhang, J.; Xu, J.; Zhang, L. A Multi-Agent Reinforcement Learning Method for Distribution System Restoration Considering Dynamic Network Reconfiguration. Appl. Energy 2024, 372, 123625. [Google Scholar] [CrossRef]
  17. Correia, A.F.M.; Cavaleiro, M.; Neves, M.; Coimbra, A.P.; Almeida, T.R.O.; Moura, P.; De Almeida, A.T. Architecture and Operational Control for Resilient Microgrids. In Proceedings of the 2024 IEEE/IAS 60th Industrial and Commercial Power Systems Technical Conference (I&CPS), Las Vegas, NV, USA, 19 May 2024; pp. 1–12. [Google Scholar]
  18. Hamidieh, M.; Ghassemi, M. Microgrids and Resilience: A Review. IEEE Access 2022, 10, 106059–106080. [Google Scholar] [CrossRef]
  19. Girvan, M.; Newman, M.E.J. Community Structure in Social and Biological Networks. Proc. Natl. Acad. Sci. USA 2002, 99, 7821–7826. [Google Scholar] [CrossRef] [PubMed]
  20. Son, K.; Kim, D.; Kang, W.J.; Hostallero, D.E.; Yi, Y. QTRAN: Learning to Factorize with Transformation for Cooperative Multi-Agent Reinforcement Learning. International conference on machine learning. In Proceedings of the 36th International Conference on Machine Learning, Long Beach, CA, USA, 1–10 May 2019. [Google Scholar]
  21. Das, D. Reconfiguration of Distribution System Using Fuzzy Multi-Objective Approach. Int. J. Electr. Power Energy Syst. 2006, 28, 331–338. [Google Scholar] [CrossRef]
  22. Sunehag, P.; Lever, G.; Gruslys, A.; Czarnecki, W.M.; Zambaldi, V.; Jaderberg, M.; Lanctot, M.; Sonnerat, N.; Leibo, J.Z.; Tuyls, K.; et al. Value-Decomposition Networks for Cooperative Multi-Agent Learning. arXiv 2017, arXiv:1706.05296. [Google Scholar]
  23. Rashid, T.; Samvelyan, M.; Witt, C.S.; de Farquhar, G.; Foerster, J.; Whiteson, S. Monotonic Value Function Factorisation for Deep Multi-Agent Reinforcement Learning. J. Mach. Learn. Res. 2020, 21, 1–51. [Google Scholar]
  24. Thurner, L.; Scheidler, A.; Schafer, F.; Menke, J.-H.; Dollichon, J.; Meier, F.; Meinecke, S.; Braun, M. Pandapower—An Open-Source Python Tool for Convenient Modeling, Analysis, and Optimization of Electric Power Systems. IEEE Trans. Power Syst. 2018, 33, 6510–6521. [Google Scholar] [CrossRef]
Figure 1. Feeder transfer diagram.
Processes 13 01473 g001
Figure 2. Flowchart of the improved Girvan–Newman algorithm for power system partitioning.
Processes 13 01473 g002
Figure 3. Load restoration framework based on QTRAN-alt.
Processes 13 01473 g003
Figure 4. Load time series data.
Processes 13 01473 g004
Figure 5. The 27-bus system calculated partitions.
Processes 13 01473 g005
Figure 6. Rewards in the 27-bus system with random partitions.
Processes 13 01473 g006
Figure 7. Rewards in the 27-bus system with calculated partitions.
Processes 13 01473 g007
Figure 8. The 70-bus system calculated partitions.
Processes 13 01473 g008
Figure 9. Rewards in the 70-bus system with random partitions.
Processes 13 01473 g009
Figure 10. Rewards in the 70-bus system with calculated partitions.
Processes 13 01473 g010
Table 1. Network scale for each case.
Case No.BusFeederLineLoadGenerator
127330243
270476682
Table 2. MARL hyperparameter.
ParameterValue
γ 0.99
hidden size for each agent64
hidden size for mixing network32
hidden size for state value network64
learning rate5 × 10−4
epsilon0.5
decreased epsilon every episode0.00064
minimum epsilon0.02
batch size32
buffer size5 × 103
λ o p t 1
λ n o p t 1
Table 3. Successful restoration rate of MARL across partitioning methods in the 27-bus system.
Partitioning MethodAlgorithmRate (%)
Randomrandom35.08
VDN98.34
QMIX39.41
QTRAN-alt96.87
Improved Girvan–Newmanrandom83.58
VDN97.85
QMIX77.91
QTRAN-alt99.73
Table 4. Successful restoration rate of MARL across partitioning methods in the 70-bus system.
Partitioning MethodAlgorithmRate (%)
Randomrandom1.40
VDN6.23
QMIX1.04
QTRAN-alt23.95
Improved Girvan–Newmanrandom31.96
VDN58.01
QMIX64.57
QTRAN-alt96.09
Disclaimer/Publisher’s Note: The statements, opinions and data contained in all publications are solely those of the individual author(s) and contributor(s) and not of MDPI and/or the editor(s). MDPI and/or the editor(s) disclaim responsibility for any injury to people or property resulting from any ideas, methods, instructions or products referred to in the content.

