Article

A Microgrid Simulation Platform Based on Cyber-Physical Technology

1
China Electric Power Research Institute Co., Ltd., Beijing 100192, China
2
College of mechanical and electrical engineering, Beijing Information Science and Technology University, Xiaoying Campus, Beijing 100196, China
*
Author to whom correspondence should be addressed.
Processes 2025, 13(5), 1441; https://doi.org/10.3390/pr13051441
Submission received: 26 February 2025 / Revised: 7 April 2025 / Accepted: 14 April 2025 / Published: 8 May 2025
(This article belongs to the Section Energy Systems)

Abstract

:
With the transformation of energy structure and the development of new power systems, higher requirements have been put forward for the performance and stability of microgrids. To adapt to the multi-information, multi-energy, and multi-business characteristics of microgrids, this paper proposes a cyber-physical system (CPS) based a microgrid simulation platform, which constructs an integration architecture composed of the physical system, main station system, and strategy simulation system. Through the interaction of information and energy businesses, real-time reproduction and state control of business scenarios are achieved. The platform innovatively introduces the theory of finite state machine (FSM) and designs a state transition strategy. Taking fault optimization as an example, the optimal path can be selected through state transition, and the system fault optimization effect is improved based on FSM. Compared to traditional methods, this platform reduces simulation time by 16% to 86.6%, significantly shortening scene reproduction time. In addition, the practical application value of the platform in fault optimization and operational efficiency improvement was verified by building a semi-physical simulation system based on a rapid control prototype (RCP) and hardware-in-the-loop testing (HIL).

1. Introduction

In recent years, the transformation of the global energy structure has become a core issue in promoting sustainable development. In order to implement the reform and reconstruction of the new power system in the context of “carbon peak and neutrality goals” [1], higher demands have been put forward for the performance and stability of the new power system [2]. Due to the greater precision and complexity of large-scale distributed renewable energy systems with flexible power equipment, and the uncertainty of new source load power, microgrids urgently require flexible and controllable power regulation and digital operation management methods [3]. Active hierarchical control of distributed energy resources increasingly relies on the coupling of power systems and CPS [4]. CPS, through information acquisition, data analysis, intelligent decision-making, and control, enables power systems to respond more efficiently to environmental changes and make real-time adjustments [5]. The integration of CPS technology, which combines computing, communication, and power systems to develop an integrated simulation platform for microgrids, is becoming increasingly valuable.
Microgrids based on information physics technology have become a new development trend, and some scholars have conducted related research. Reference [6] proposed a cross-sectional optimization (CSO) algorithm to solve parameter optimization problems and established a small-signal model for multi-source and multi-load microgrids. Reference [7] introduced a two-stage energy storage optimization method that comprehensively considers the reliability and economic efficiency of distribution networks. Based on the reliability model of power supply with a single primary source, energy storage power supply reliability models were developed for single-point and multi-point access structures. Reference [8] presented a fault location method based on the Beetle Swarm Optimization algorithm, analyzing the fault characteristics on the post-short-circuit side and establishing a mathematical model for fault location. While these studies independently examine energy and information, they do not address the coupled characteristics between energy and information.
The development of microgrid CPS is rapid, and the complexity of the system is increasing. The reliability of the physical system is increasingly dependent on the support of the information system. Therefore, it is increasingly important to conduct reliability analysis and evaluation of the system. Many experts and scholars have conducted research in this area. Reference [9] proposed a multi-source coordinated recovery method for distribution network CPS based on info-gap decision theory, incorporating post-disaster recovery models that account for network reconfiguration and uncertainties in renewable energy output. Reference [10] introduced a rapid recovery approach for microgrid power supply following CPS failures caused by extreme weather, using measures such as communication blind-zone clustering to simplify topology and network slicing for resource optimization. Reference [11] developed a reliability assessment model for distribution network CPS based on Generalized Stochastic Petri Nets (GSPNs), analyzing the impacts of information attacks and component failures, and combining maximum flow theory with dynamic inference to enhance evaluation efficiency by avoiding exhaustive analysis. Reference [12] proposes an FDIA detection method for power information physical systems based on ASR UFK and IMC prediction algorithms, which improves detection accuracy through state estimation and bias analysis. Reference [13] designed a CPS framework considering interdependence, leveraging complex network theory and applying structure- and function-based repair strategies to evaluate repair efficiency comprehensively. Reference [14] proposed a multi-stage coordinated recovery strategy for CPS failures caused by natural disasters, taking into account grid integration and interdependencies between systems, and assessing resilience metrics during the recovery process. Reference [15] utilized state machines at the physical device layer, expressed control decisions with tuples at the decision-making layer, and set optimization objectives at the system optimization layer, thereby constructing an integrated cyber-physical model that significantly enhanced the observability of microgrid systems. Reference [16] established a state probability model based on the Markov process Monte Carlo method to analyze the impact of information equipment failures on system reliability. However, Markov processes mainly target stochastic problems and have an insufficient ability to handle deterministic problems. Reference [17] proposed a multi-dimensional Q-V droop control method based on known information from normal nodes and the physical layer to mitigate the effects of communication disruptions, enabling precise voltage control and improving voltage regulation resilience. Reference [18] introduced a distribution CPS architecture based on event-driven models, designed a framework for information-physical cascading failure evolution mechanisms, and studied the importance of information nodes and the probability of successful attacks. Reference [19] employed predictive methods to identify and classify vulnerable generating units, ensuring transient stability while addressing the risks associated with the loss of network observability. Reference [20] proposed an edge computing node deployment optimization method based on community theory, improving network stability and response speed by integrating power flow and line impedance. Reference [21] presented a local evolution model for communication networks based on the physical grid topology, analyzing the impact of reconnection probability on self-organizing states and cascading failures in power CPS, thereby enhancing the system’s resistance to cascading failures. These studies focus on the optimization and recovery strategies of CPS, analyzing the coupling characteristics of distribution networks under various scenarios and the synergistic effects of multiple measures. It is evident that the integration of information flow and energy flow has become an inevitable trend in the development of modern microgrids. However, there remains a lack of systematic cyber-physical integration platforms that support simulation and analysis across diverse business applications.
In the analysis and control of microgrid state transitions, Reference [22] proposed a real-time scheduling anti-error control method for power systems. This method establishes an overall framework and model for scheduling anti-error control based on finite state machines. Reference [23] introduced a dual-vector model predictive control strategy, utilizing FSM to describe a finite control set and restricted vector switching, thereby simplifying the system design approach. Reference [24] presented an FSM-based modulation technique, applying it to a boost converter’s modulation module to regulate output voltage stability. Reference [25] developed an FSM-based multi-flow integration simulation engine for distribution networks, constructing a real-time rapid simulation architecture with a state interaction control scheme between the physical layer, host layer, and real-time simulation layer. The above research demonstrates the application advantages of finite state machines in structure and dynamic transformation, which can provide theoretical support for the integration simulation platform of microgrids.
Based on the aforementioned research progress and analysis, this paper addresses the technical demands in the application of cyber-physical technology within microgrids and proposes a simulation platform and implementation scheme oriented towards business integration. The main contributions of this study are as follows:
(1)
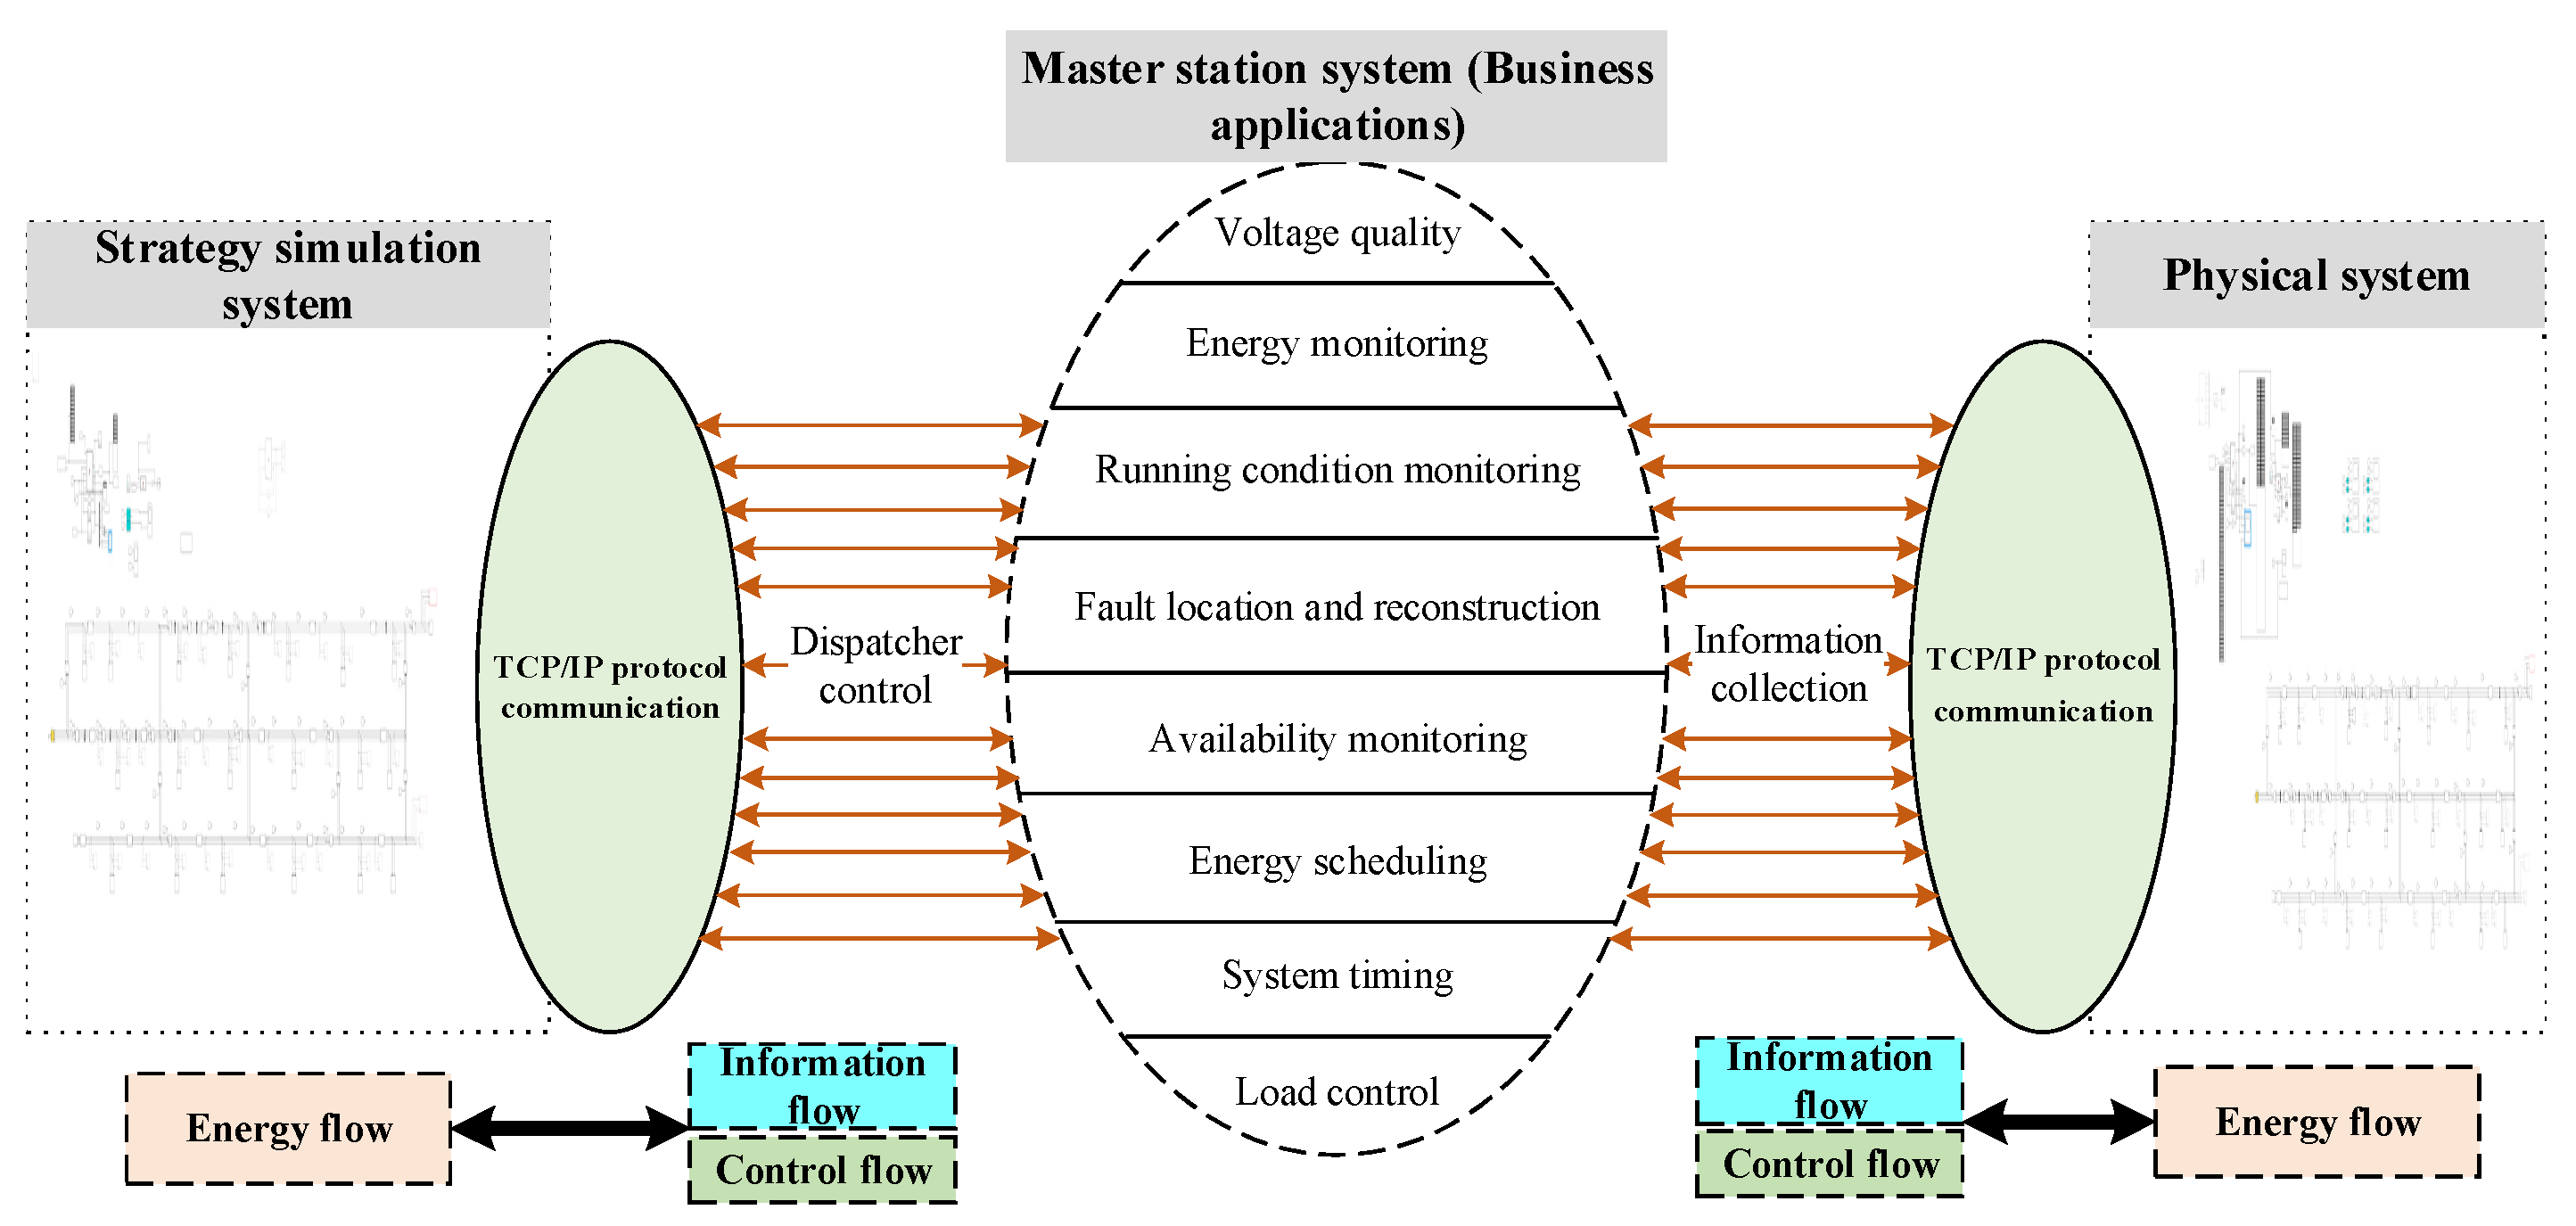
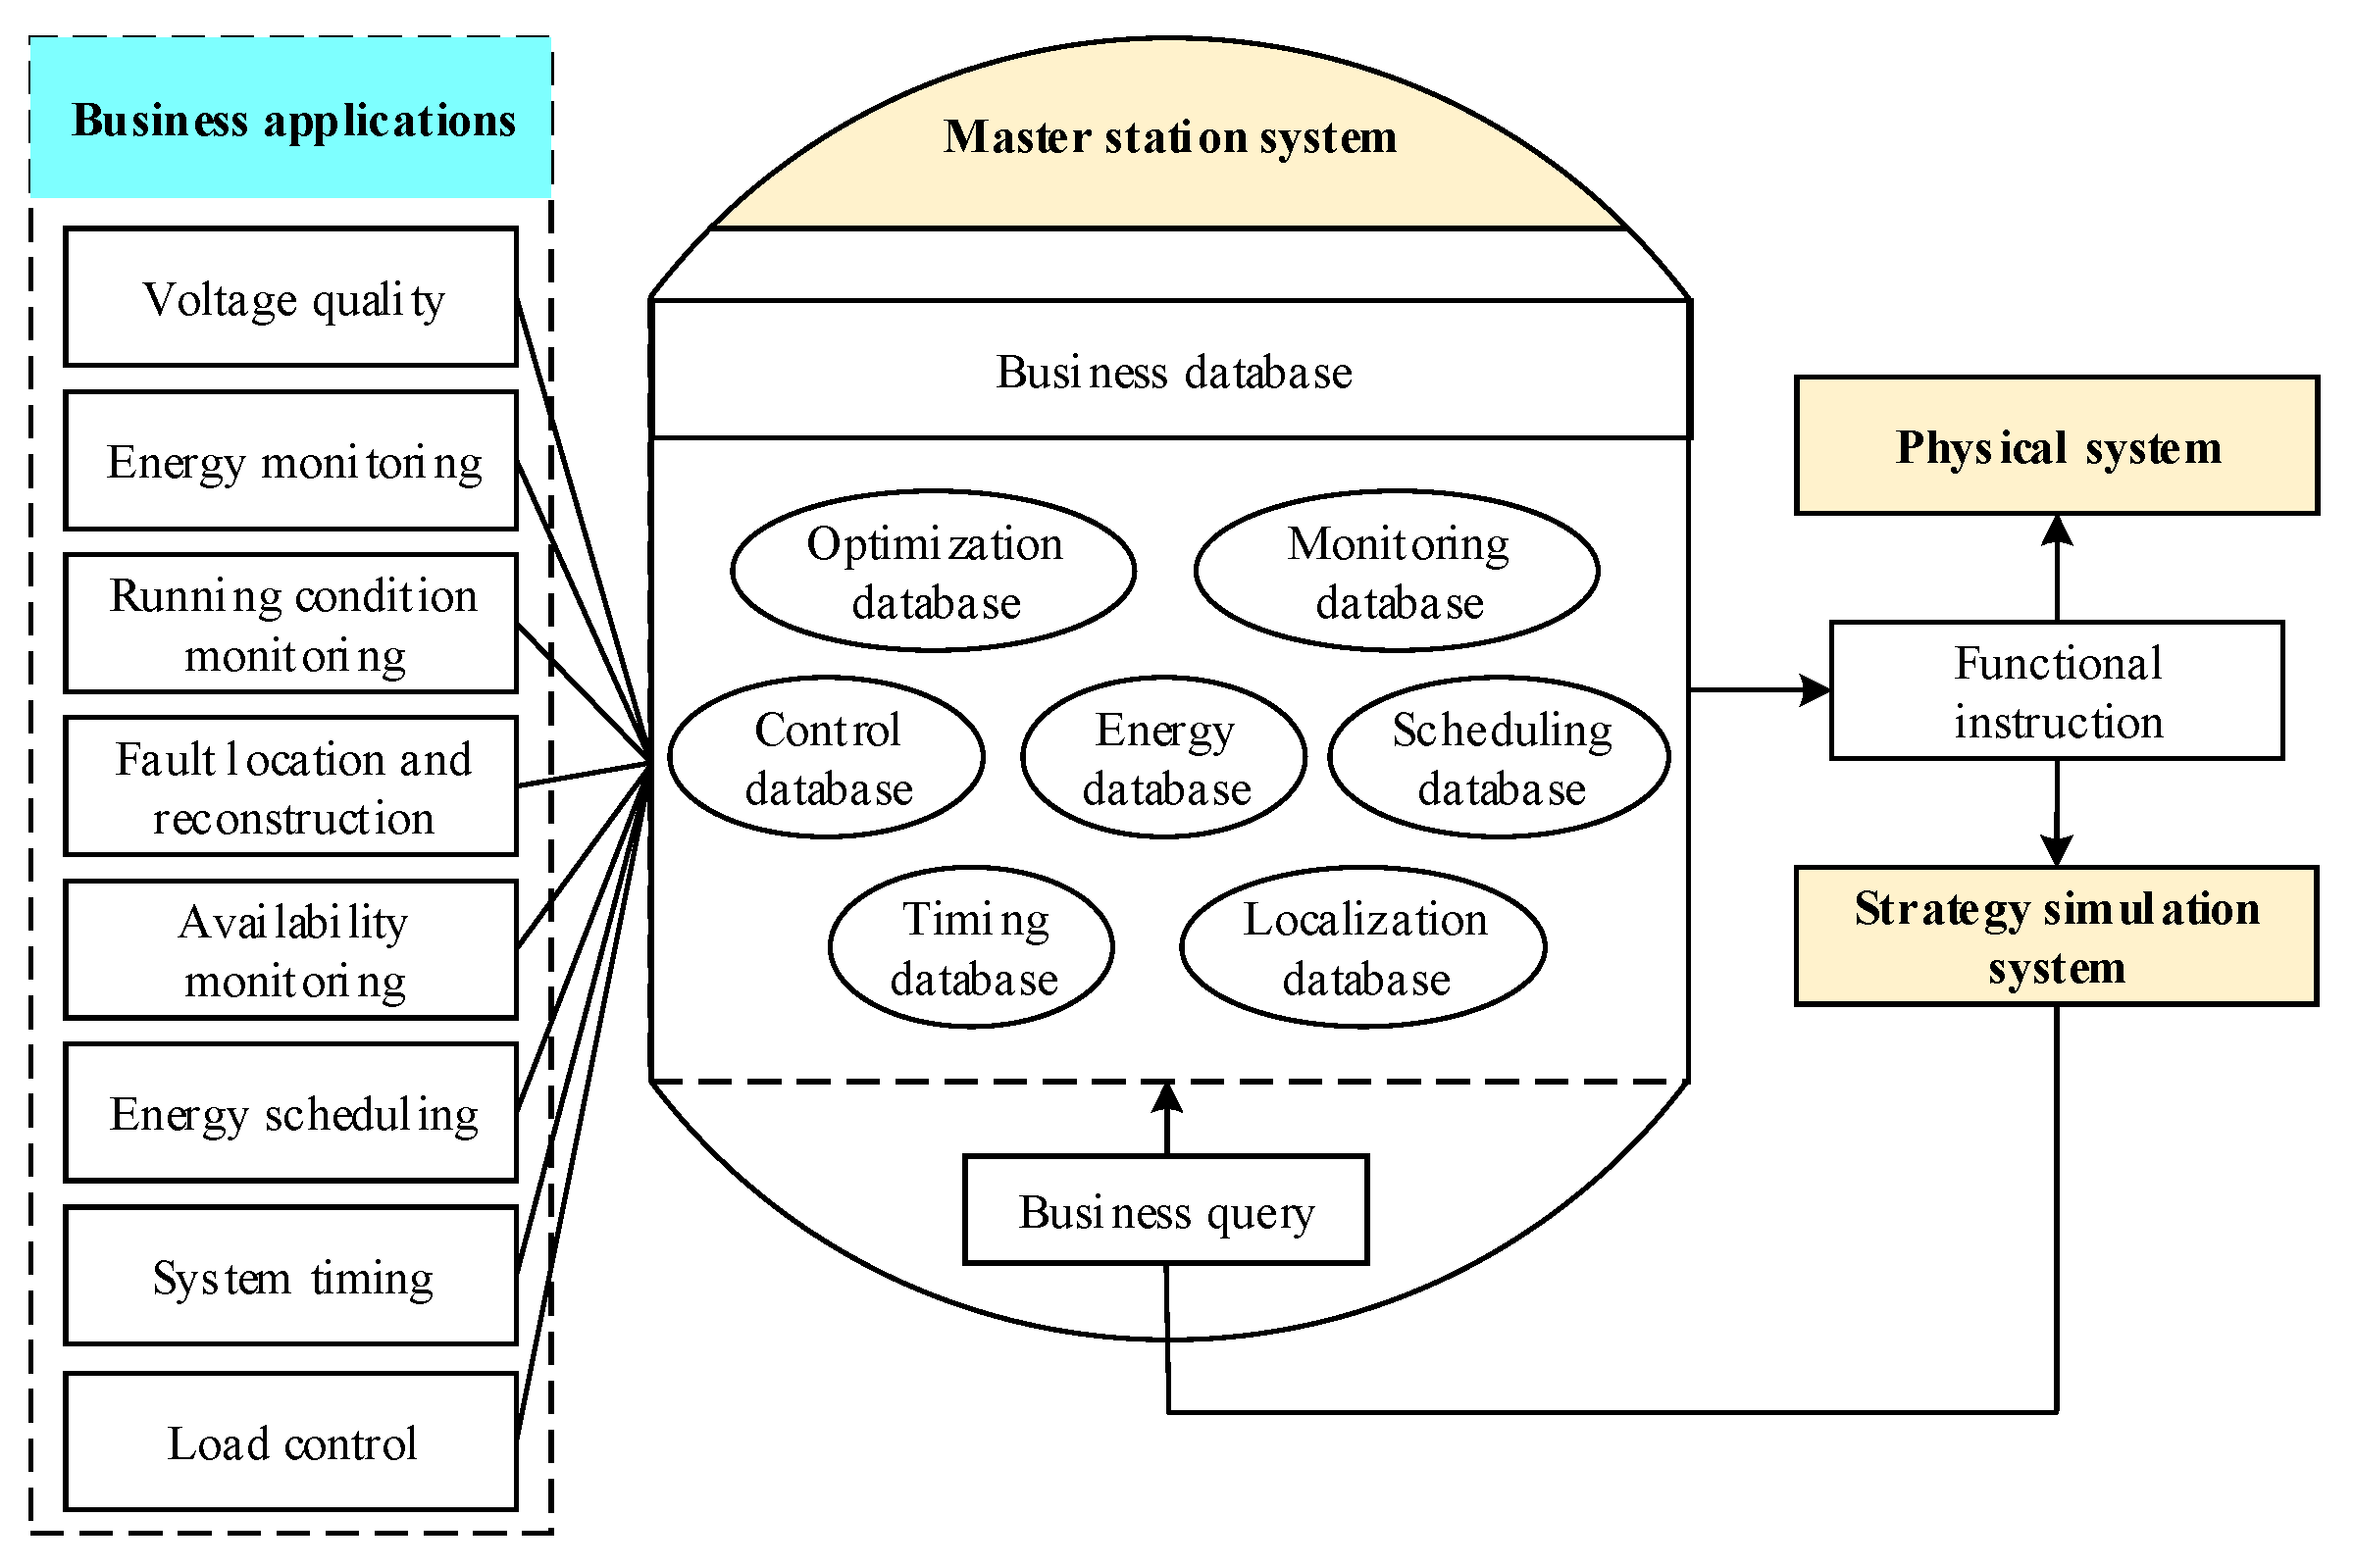
An architecture integrating cyber-physical technology and business applications is proposed. This architecture incorporates the physical system, the central station system, and the strategy simulation system. By leveraging the business query method of the central station system, real-time simulation of various business applications is achieved.
(2)
An FSM model for the integrated simulation platform is developed. Through state division and transitions, the deep integration of the physical system, the central station system, and the strategy simulation system is realized, thereby enhancing simulation efficiency and business scenario reproduction capabilities.
The remainder of this paper is organized as follows: The Section 2 proposes a method for integrating cyber-physical technology with business applications in microgrids. The Section 3 constructs an integrated simulation platform based on finite state machines. The Section 4 analyzes the business state transition strategy and communication format, using fault optimization as an example. The Section 5 employs semi-physical simulation technology to replicate the fault optimization scenario and conducts an in-depth discussion of the simulation results. The Section 6 concludes the paper by summarizing the main findings of this research. The list of variables and terms mainly used in this paper is summarized in Table 1.

2. Microgrid CPS and Business Integration Methods

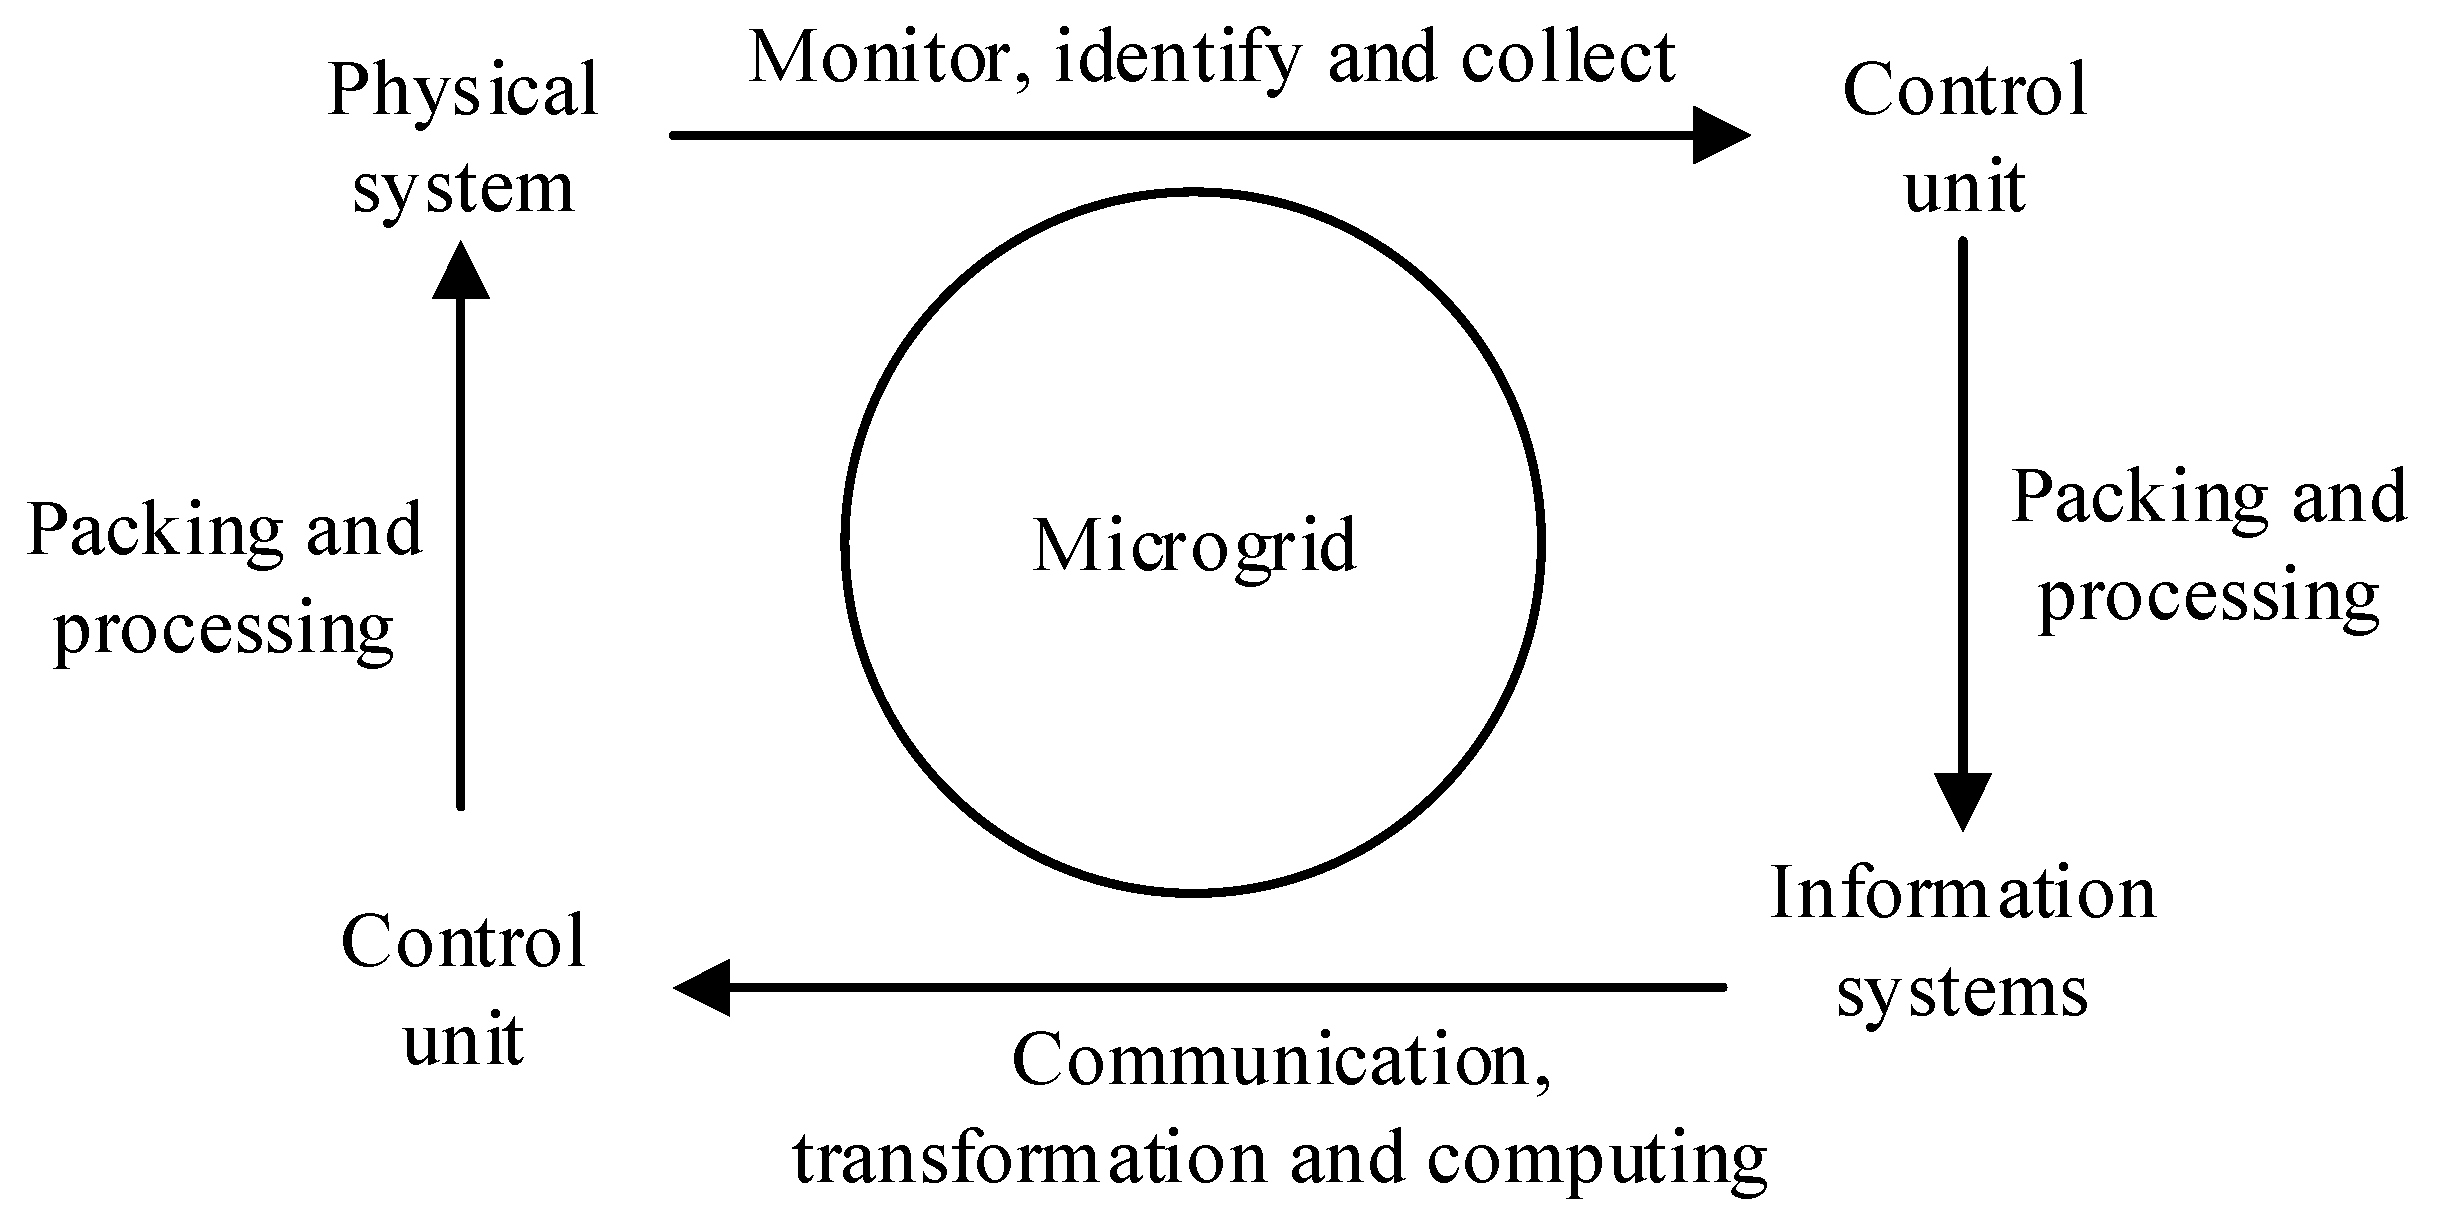
2.1. Cyber-Physical Technology

The microgrid is a multi-dimensional cyber-physical system (CPS) where continuous and discrete states coexist and interact. The application of cyber-physical technology meets the dynamic coupling state requirement of microgrids, while also addressing the real-time control and reliability needs of the system.
In the actual operation of a microgrid, the energy distribution (i.e., power flow distribution) reflects the operating status of the grid. Data acquisition devices collect parameter signals that represent the physical system’s state and convert them into discrete digital signals. These digital signals are input into the information system, where they undergo communication, transformation, and computational processing to generate control instructions, which are then fed back into the physical system. As shown in Figure 1, the information system monitors energy information within the physical system, and the control instructions generated by the information system also influence the energy distribution within the physical system. In real-time simulation, monitoring and instruction information are exchanged and updated in real time, establishing a close relationship between the two.

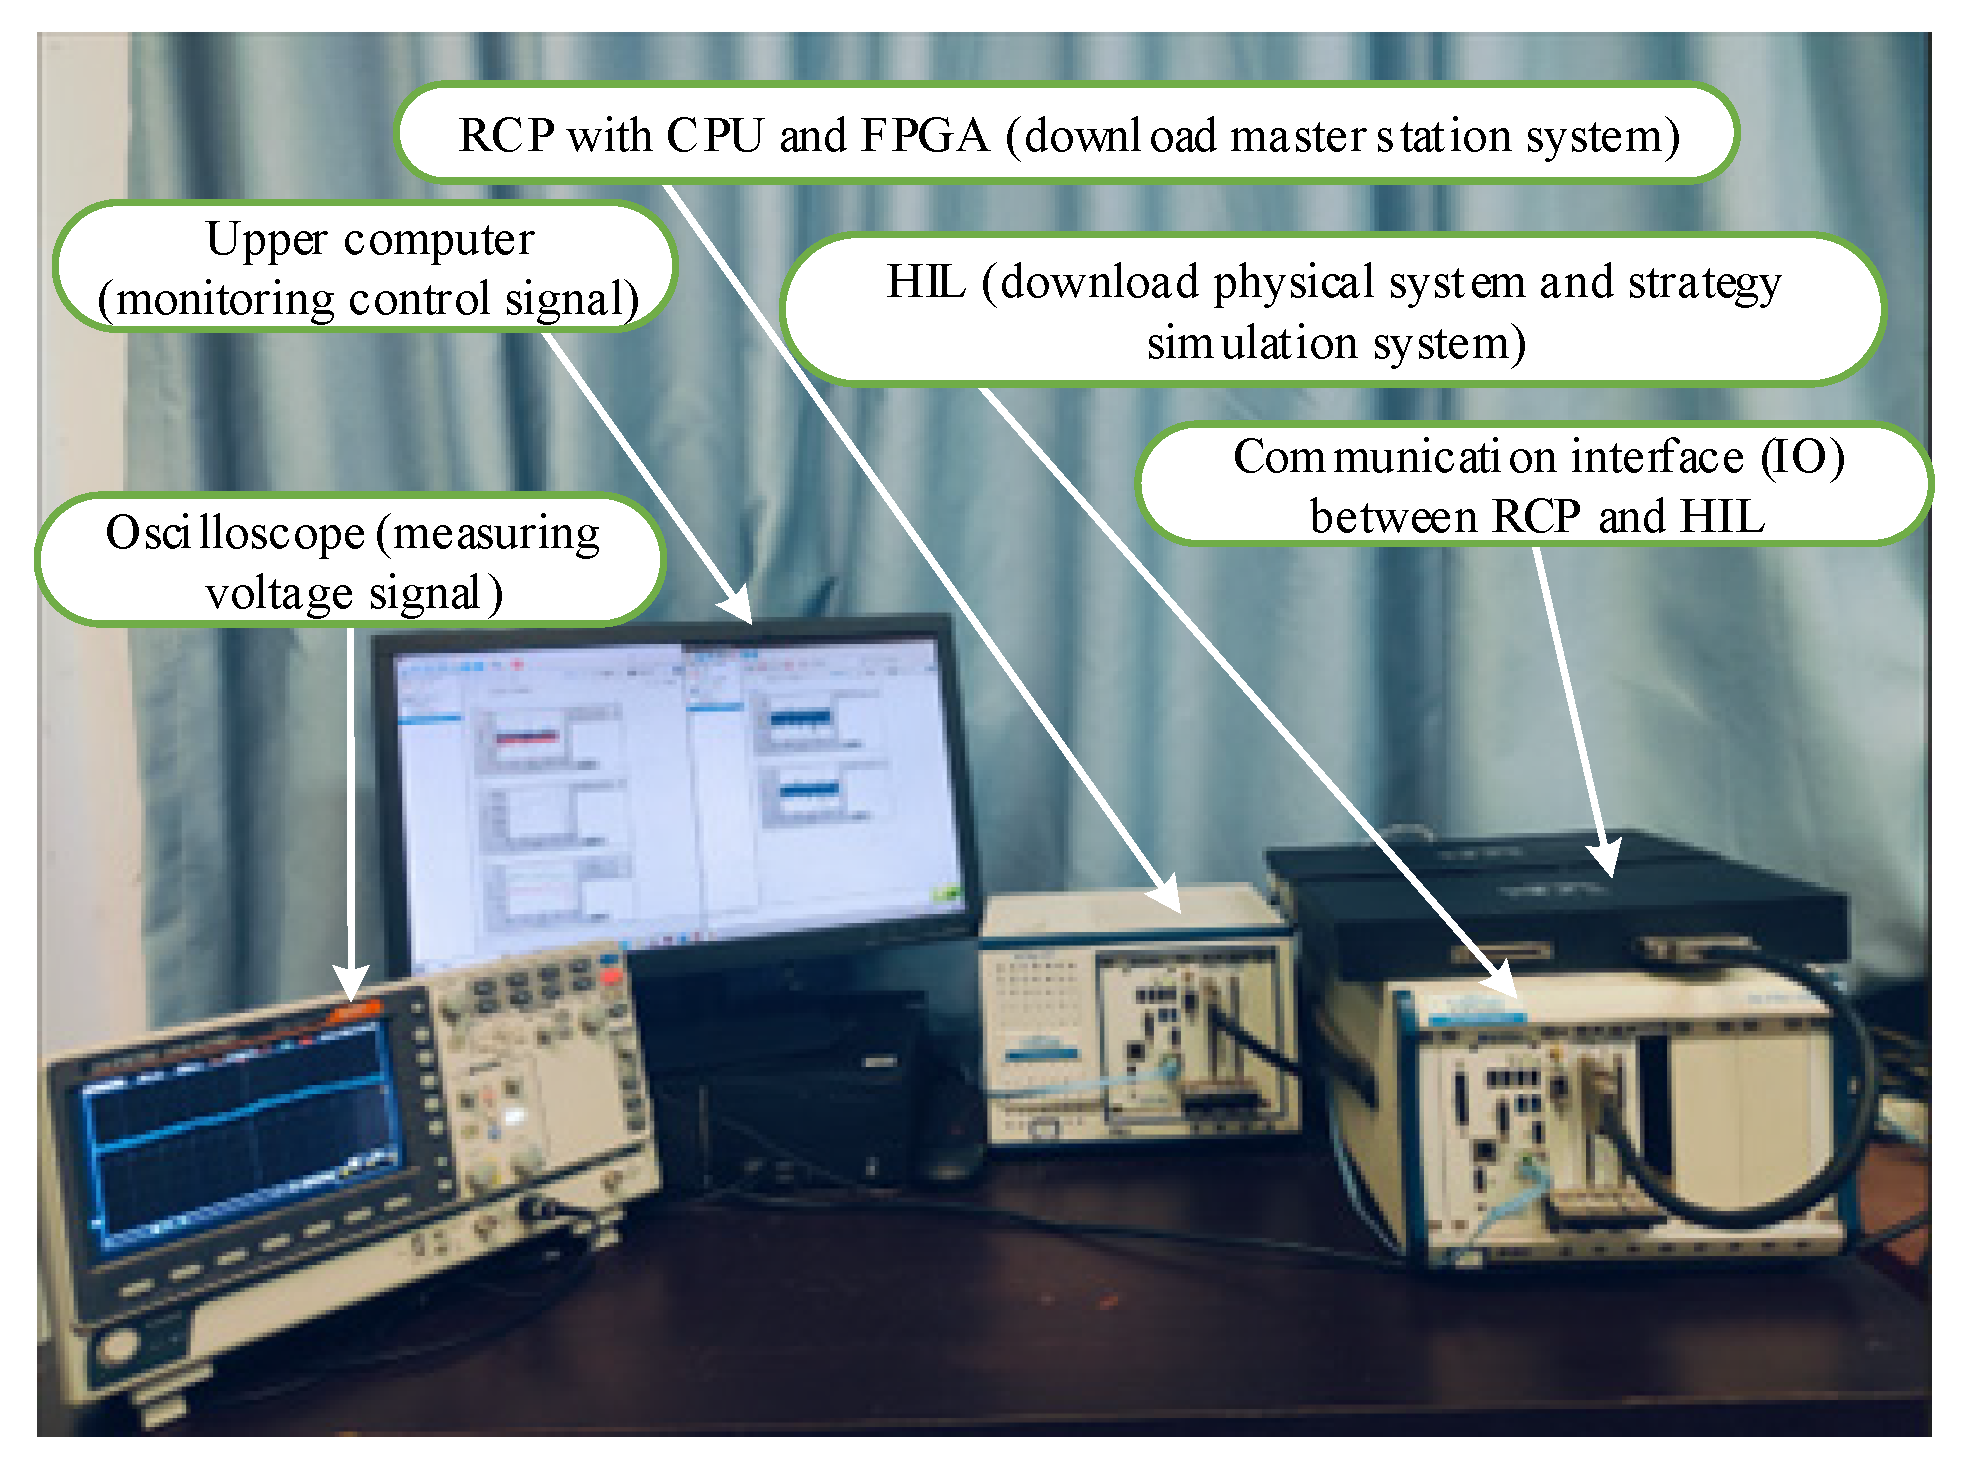
2.2. CPS-Based Microgrid Simulation Platform

As shown in Figure 2, microgrid business applications include voltage quality, energy monitoring, operation status monitoring, fault location and optimization, availability monitoring, energy scheduling, system timing, and load control. These business applications continuously evolve during the operation of the microgrid. They may occur independently or simultaneously, and transition between each other in the form of the microgrid’s operational state, thereby forming the operational framework of the microgrid.
In the architecture of the microgrid information physics and business integration platform, the entire platform architecture is divided into a strategy simulation system, a main station system, and a physical system. The fusion of communication and control between the strategy simulation system, physical system, and main station system is achieved through the application of information physics technology. The specific fusion method is as follows.
The master station system collects energy information, such as voltage and current, from the physical system via Transmission Control Protocol/Internet Protocol (TCP/IP) protocol communication. As shown in Figure 3, the master station system queries the business application in the business database. Different business applications correspond to different business scenarios and functional instructions. The extracted functional instructions are then scheduled to the strategy simulation system through TCP/IP protocol communication. The strategy simulation system replicates the energy information from the physical system and converts the scheduled functional instructions into sequential control operations executable by the simulation model. The simulation results are transmitted in real time to the master station system via cyber-physical technology. The master station system assesses the usability and stability of the simulation results and then issues the same functional instructions to the physical system to realize the reproduction of the business scenario and optimization of faults.
The simulation architecture of the information, physical, and business integration platform built in this article achieves the integration of upper level business and lower level physical information. The business query method of the main station system can simulate different business applications in real time, and the simulation results of the strategy simulation system will also query the content in the corresponding library. The main purpose is to improve the real-time simulation speed of each scenario, and quickly achieve scenario reproduction and fault optimization. Additionally, in practical microgrid operations, the three-layer simulation approach involving the strategy simulation system, master station system, and physical system reduces the time consumption for fault optimization during the operation of the microgrid, providing technical support for the stable operation of the microgrid.

3. Construction of Simulation Model Based on FSM

3.1. Principles of FSM

The FSM is a mathematical model with discrete inputs and outputs, which has advantages in structure and dynamic transformation, providing theoretical support for the integration of information physics and business architecture in simulation platforms.
Figure 4 shows the FSM model of the simulation platform, where FSC is the finite state controller. The interaction between the main station system, strategy simulation system, and physical system can be described through state transitions. The energy and state information of the physical system are transmitted to the input storage band of the finite state machine of the main station through TCP/IP communication protocol in the form of input signals. FSC identifies the state and energy information in the FSM input storage tape, and achieves state transition through instruction conversion, and sends functional command information to the strategy simulation system. If the simulation results are satisfactory, the functional command is returned to the main station system and forwarded to the physical system. The finite state machine is used to simulate the control center of the main station system, modeling the process of receiving state awareness information and outputting functional commands, thereby achieving state transitions.

3.2. Mathematical Description of FSM Model

The basic elements of FSM include events, states, actions, and transitions. Events are input conditions for FSM. In a certain state, when an event is triggered, the corresponding action will be executed to transition to another state. A state is a means of describing an object, and all states of an object constitute a set of states, and at any given time, it will only be in one of these states. An action is a response to events. Transitions are state transition functions that enable control over system state transitions. FSM can be represented by a five-tuple:
F S M = S , C , f , S 0 , S n
where S is a finite set of states; C is the collection of events; S0 is the initial state; Sn is the target state; and f is the state transition function.
S n = f S i , C i
where Si is the current state; and Ci is the current input event. Sn represents the state that can be reached when the FSM is in state Si and the event condition Ci is met.
When the state Sn is reached, the corresponding output set is
O n = g S n , C n
where On is the output state of the system at time n; g is the output function, indicating the output rules of the system affected by the current state and input events; and Cn is the set of output events.
The state set contains more state information, so the state set is divided into three subsets: physical system, master station system, and strategy simulation system. Each subset represents different states of different systems at different times. Figure 5 shows the basic principle of FSM. When the event is triggered, the current state of the physical system changes. With the change in events and time, the state can transfer between different systems. For example, when the physical system state changes to S1, with the change in events and time, the state can be transferred to S2 in the same system or S2 in the master station system. When the master station system status is S2, it can be transferred to Sj in the same system or Sj in the strategy simulation system, until the end of all state transitions, including input and output events that trigger state changes.
FSM exists in the physical system, strategy simulation system, and master station system, which effectively connects discrete information and continuous information through state transition. The status and energy information of the physical system is transmitted to the master station system through the TCP/IP communication protocol. The FSM in the master station system reads, parses, and re-encodes the information. Then, it is transmitted to the strategy simulation system for discrete simulation. Finally, the optimized instruction information is transmitted to the physical system through the master station system for execution. Details of the TCP/IP communication protocol are as follows:
(1)
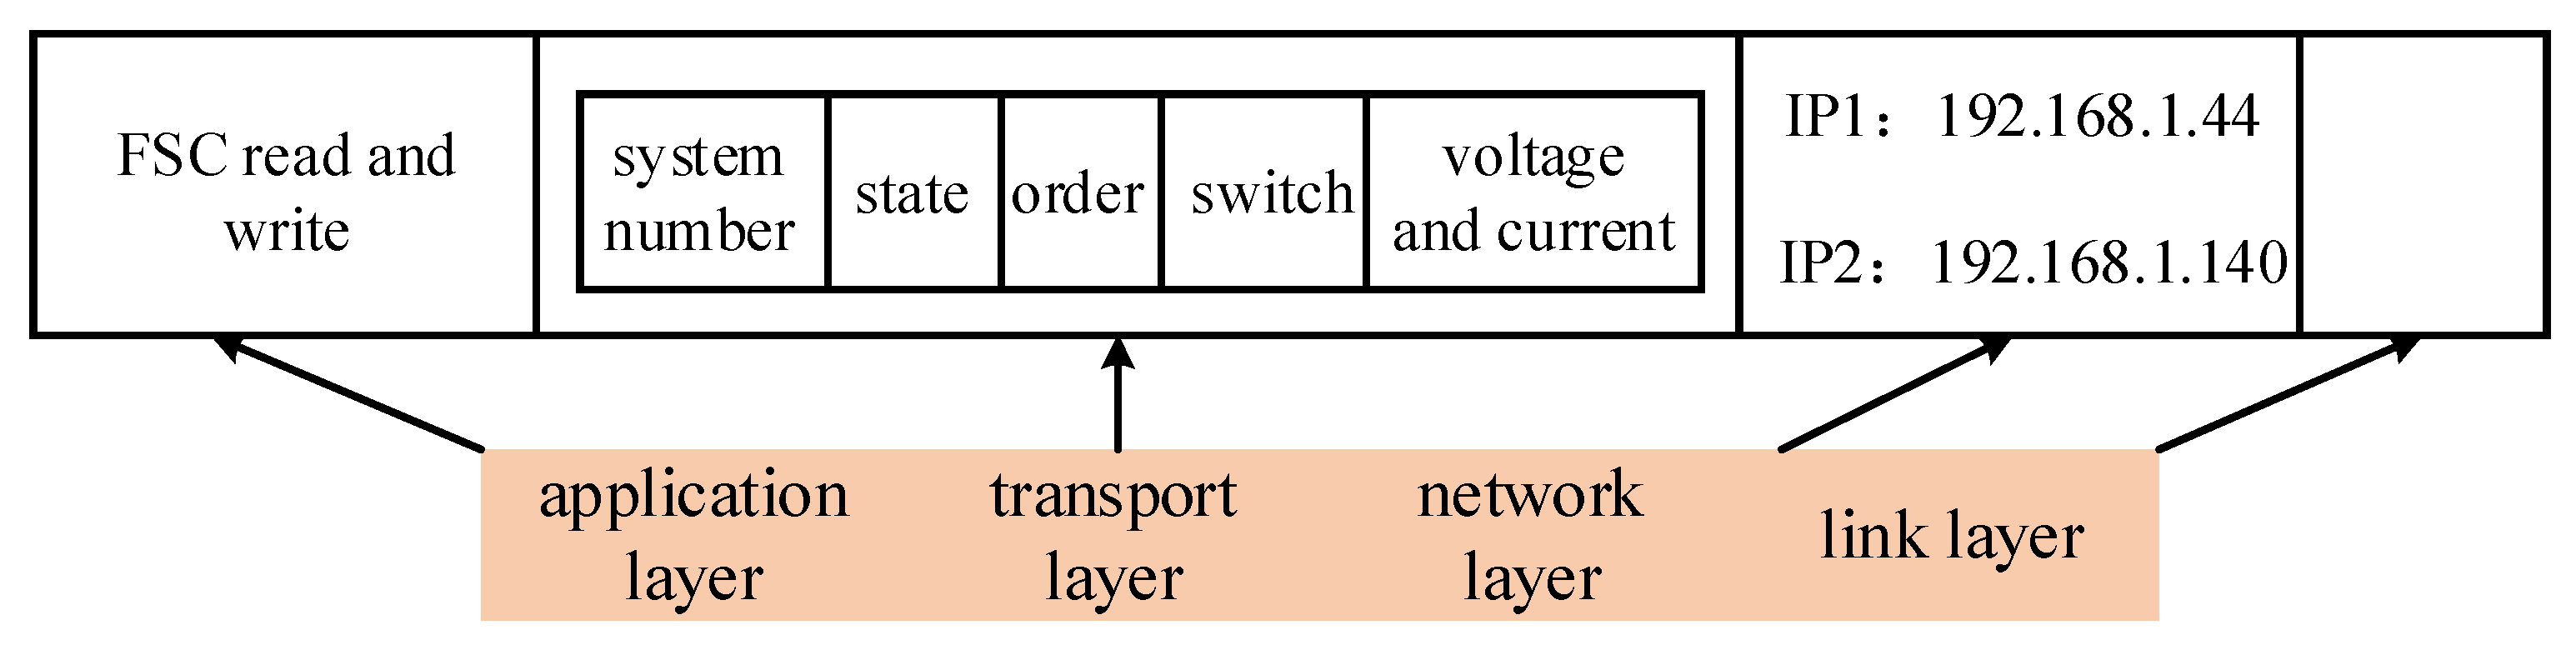
The TCP/IP communication protocol defines the four-layer framework of network interconnection, as shown in Figure 6. This paper mainly applies the application layer, transport layer, and network layer of the TCP/IP communication protocol. The network layer is responsible for finding a suitable path for the data packets to be sent in the complex network environment. The specific address information is 192.168.1.44 and 192.168.1.140.
(2)
The transmission layer carries transmission information, including system number, status, command information, switch information, node voltage, and current information. The transmission layer sends them in the specified order.
(3)
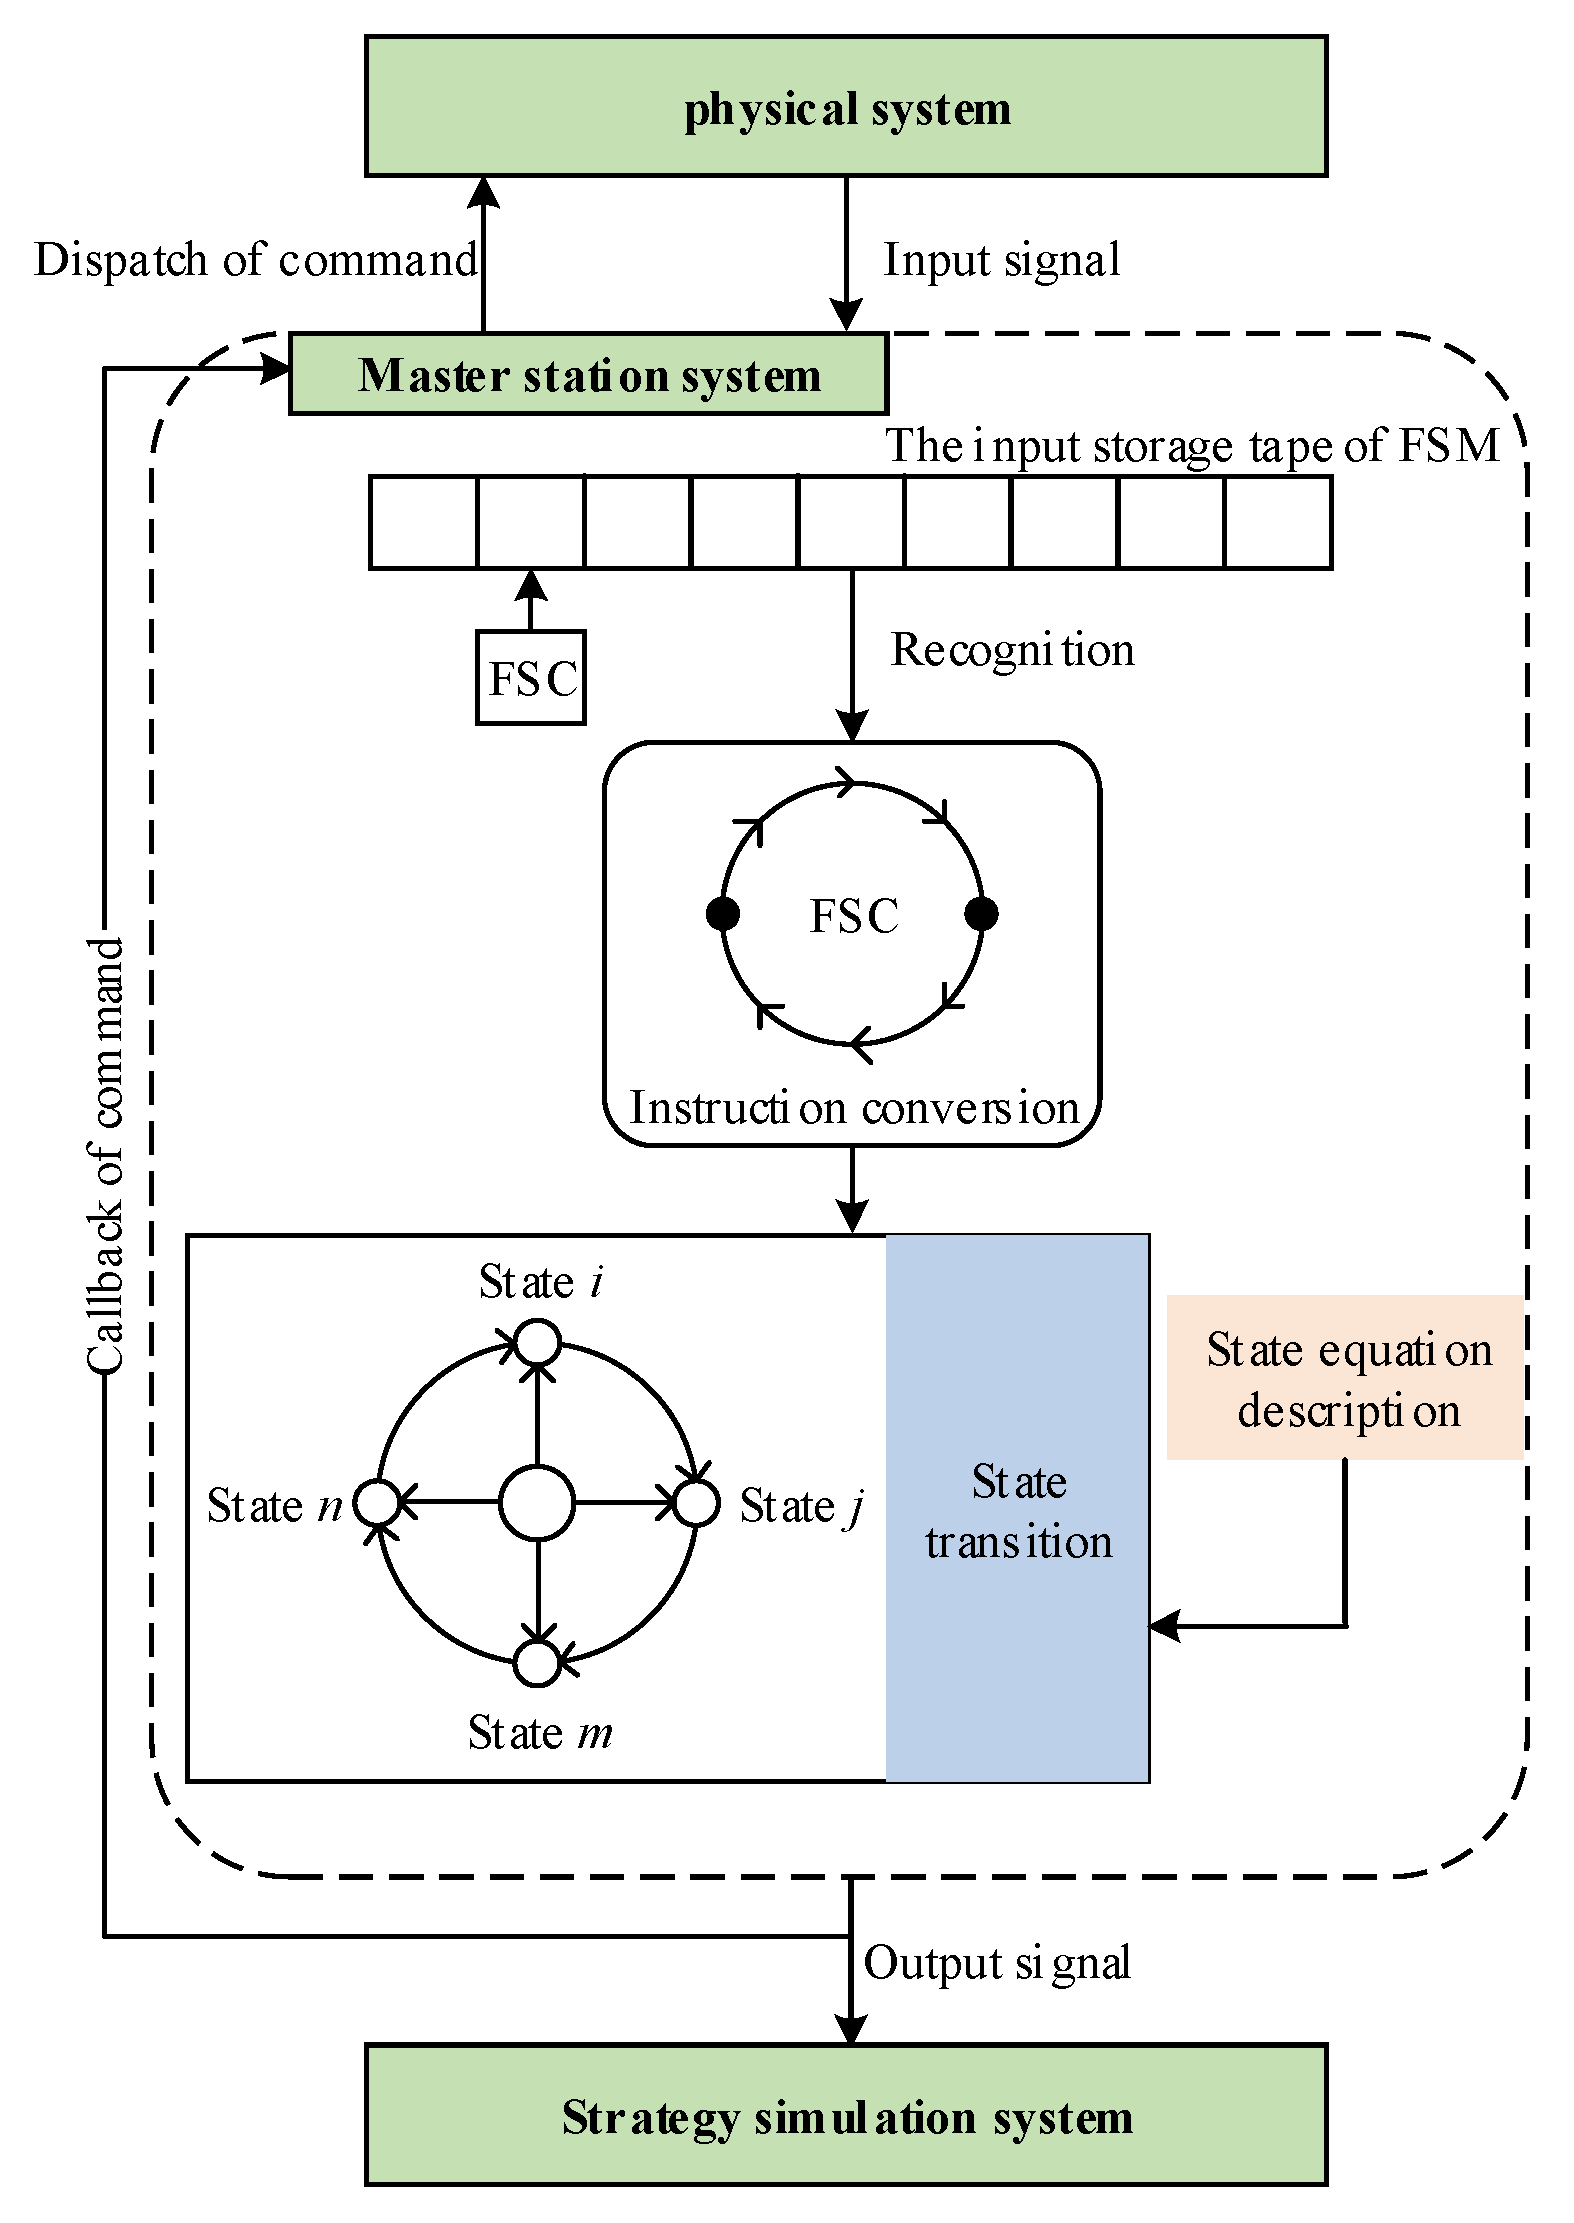
The application layer can support user applications. When the application layer is combined with the finite state machine, the FSC is responsible for reading and writing the data of the transport layer. After reading and before writing, it needs to go through the instruction transition and state transition of the finite state machine model.

4. Fault Optimization Business State Transition Based on the Simulation Platform

4.1. Defining Fault Optimization State Strategy

FSM are responsible for managing the switching process of system operation status in the integrated simulation platform. When a state transition occurs, corresponding coordination and control strategies need to be developed. These strategies may include controlling state transitions of physical system control units, driving changes in the state of the master station system, or coordinating the actions and execution of the strategy simulation system to ensure overall system coordination and efficient operation. The definitions of the basic operational state control strategies for the integrated simulation platform are shown in Table 2.
The state definition attributes of the physical system, master station system, and strategy simulation system are as follows (the same state will not be further introduced):
(1)
The system number of the physical system is 0, and the communication resolution address is located in the first bit of the TCP/IP communication layer. The communication information resolution address of its state is located in the second bit of the TCP/IP communication layer. The specific status attributes are as follows:
  • Initial state: The physical system is powered on and initialized.
  • Data collection state: The energy information of each node in the topology is monitored at all times, including current information and voltage information.
  • Recloser state: In case of a fault, the physical system will initiate the reclosing operation first and solve the fault problem separately in the physical system.
  • Fault state: After a reclosing failure, the physical system is defined as a fault state.
  • Finite state machine communication state: The state definition of a finite state machine in a physical system that interacts with the main station system, and can exchange communication layer information through the TCP/IP protocol.
  • Waiting state: The physical system is waiting for instruction information optimized by the main station system fault.
(2)
The series number of the main station system is 1, and the communication resolution address is located in the first bit of the TCP/IP communication layer. The communication information resolution address for its status is located in the second bit of the TCP/IP communication layer. The specific status attributes are as follows:
  • Finite state machine communication state: The state definition of the finite state machine in the main station system when it interacts with the physical system and policy simulation system, and can exchange communication layer information through the TCP/IP protocol.
  • Finite state machine parsing state: When information exchange occurs between the physical system and the main station system, it parses the TCP/IP protocol communication layer. The parsing method is to copy the TCP/IP protocol communication layer information into the input storage tape of FSM. FSC will identify each storage tape based on its location and correspond the identified content to the optimization library in FSM. The optimization library will determine the state transition and output the content of the TCP/IP protocol communication layer.
  • Judging-the-optimization-result state: The simulation results of the main station system’s multi-directional processing strategy simulation system, such as simulation time, solution consumption time, voltage deviation, voltage mean square error, and number of switch actions, are judged.
  • Issue functional instruction state: Instruction information with good performance is issued to the physical system.
(3)
The system number of the strategy simulation system is 2, and the communication resolution address is located at the first bit of the TCP/IP communication layer. The communication information resolution address for its status is located at the second bit of the TCP/IP communication layer. The specific status attributes are as follows:
  • Simulation execution status: Execute parsed instruction information and simulate different optimization paths.
  • Simulation result feedback status: The strategy simulation system feeds back the simulation results to the main station system and transitions the state to the initial state.
The state definition provides partial data for the TCP/IP communication layer, facilitating the identification of system numbers and states by different systems, and providing communication references for the subsequent transmission and execution of command information, switch information, voltage, current, and power information.

4.2. Defining Fault Optimization State Transition and Communication

In the simulation platform, when a fault occurs at a certain node on the physical system side, fault optimization is performed through the following steps:
(1)
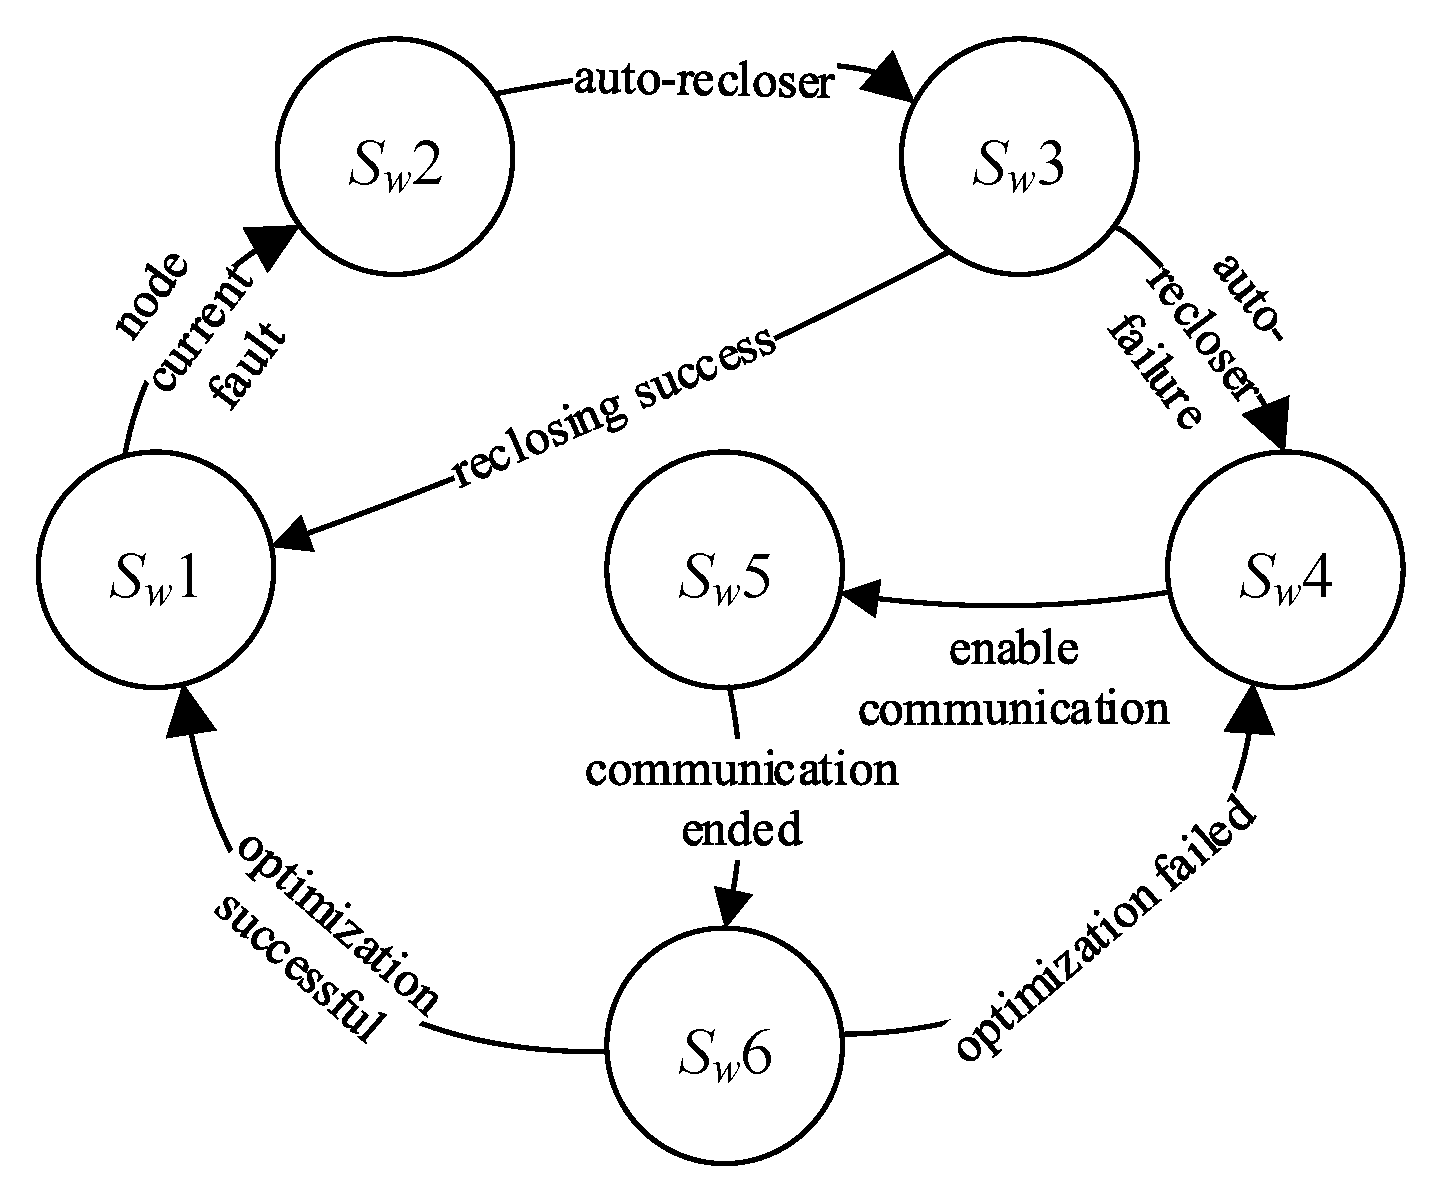
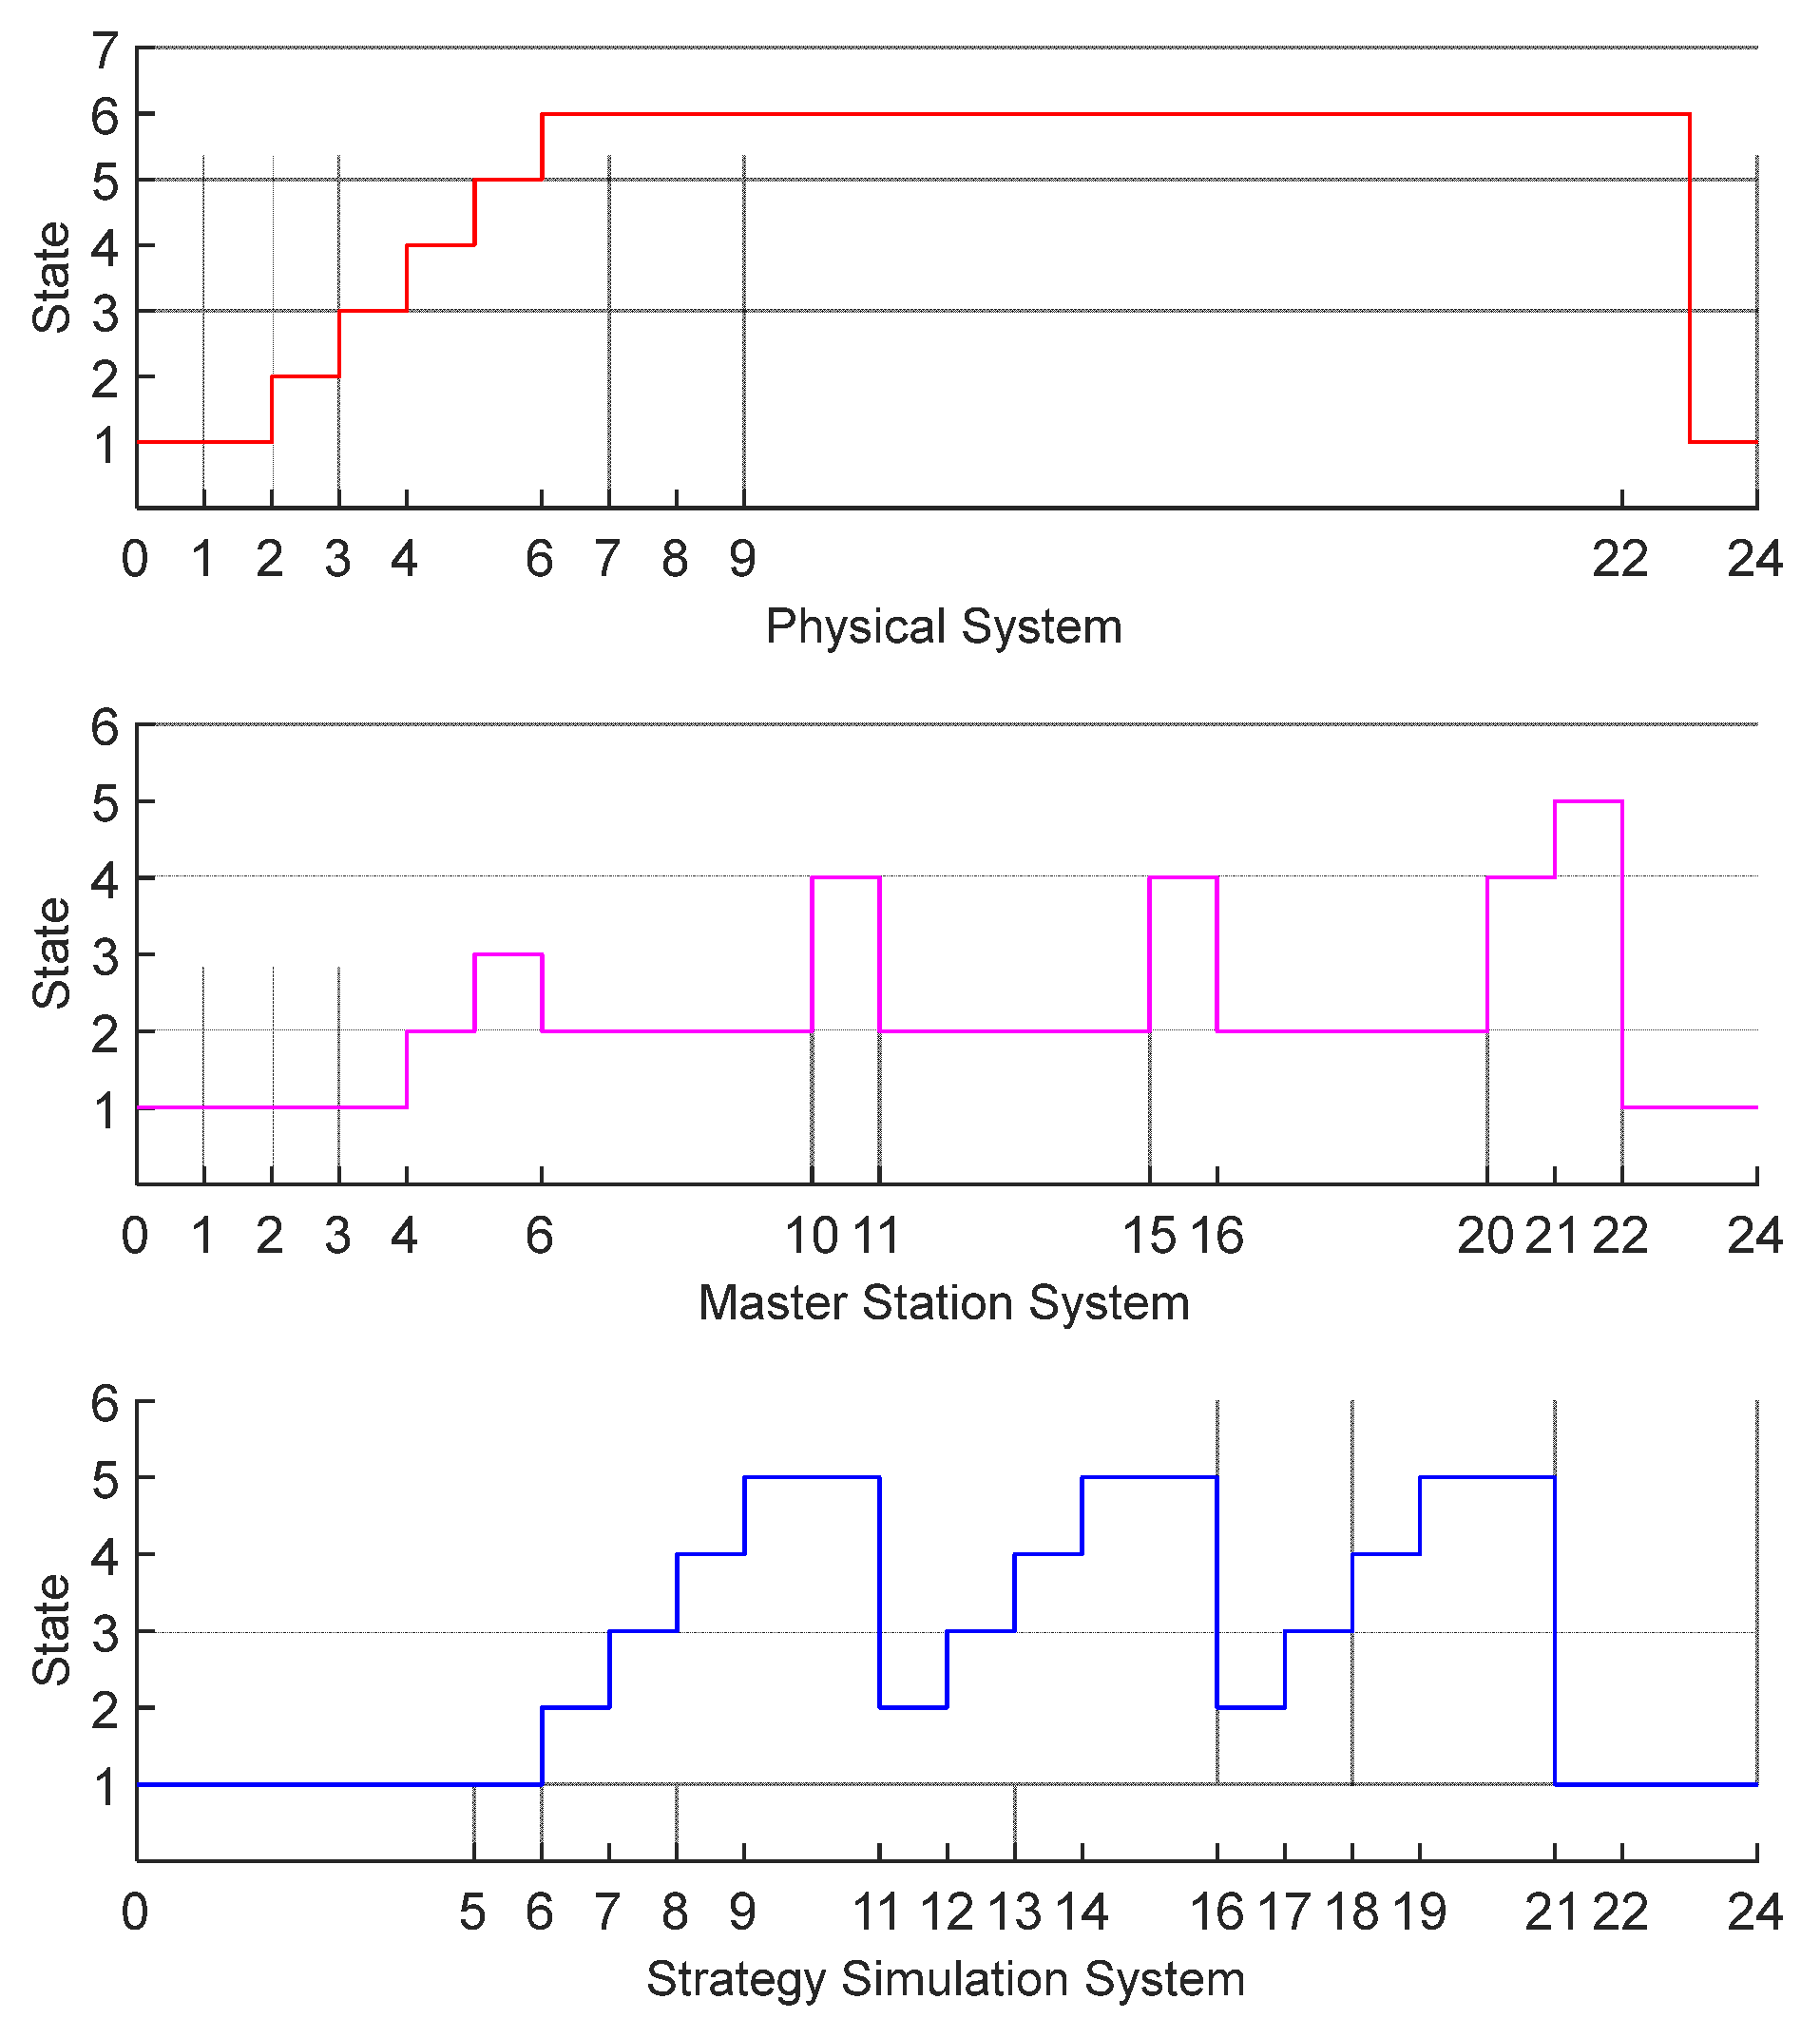
The state transition of the physical system in the simulation platform is shown in Figure 7. The physical system initially resides in the initial state. When a significant change in the monitoring node’s current occurs, the state transitions to the data collection state, and real-time current information from each node is collected. Then, using a difference-based method, the fault node on the primary side is identified, and the switches on both ends of the fault node are disconnected.
(2)
After the fault node is determined, the state transitions to the reclosing state. The physical system then initiates the reclosing operation and re-evaluates the processed current difference. If the current state is normal, the fault is cleared; if the reclosing fails, the fault information is locked, and the state transitions to the fault state.
(3)
In the fault state, the physical system uploads the system ID, current state, fault node ID, instruction information, switch information, node voltage, and current information (collectively referred to as program variable parameters) through TCP/IP communication to the master system. After the information is transmitted, the system then transitions to the waiting state.
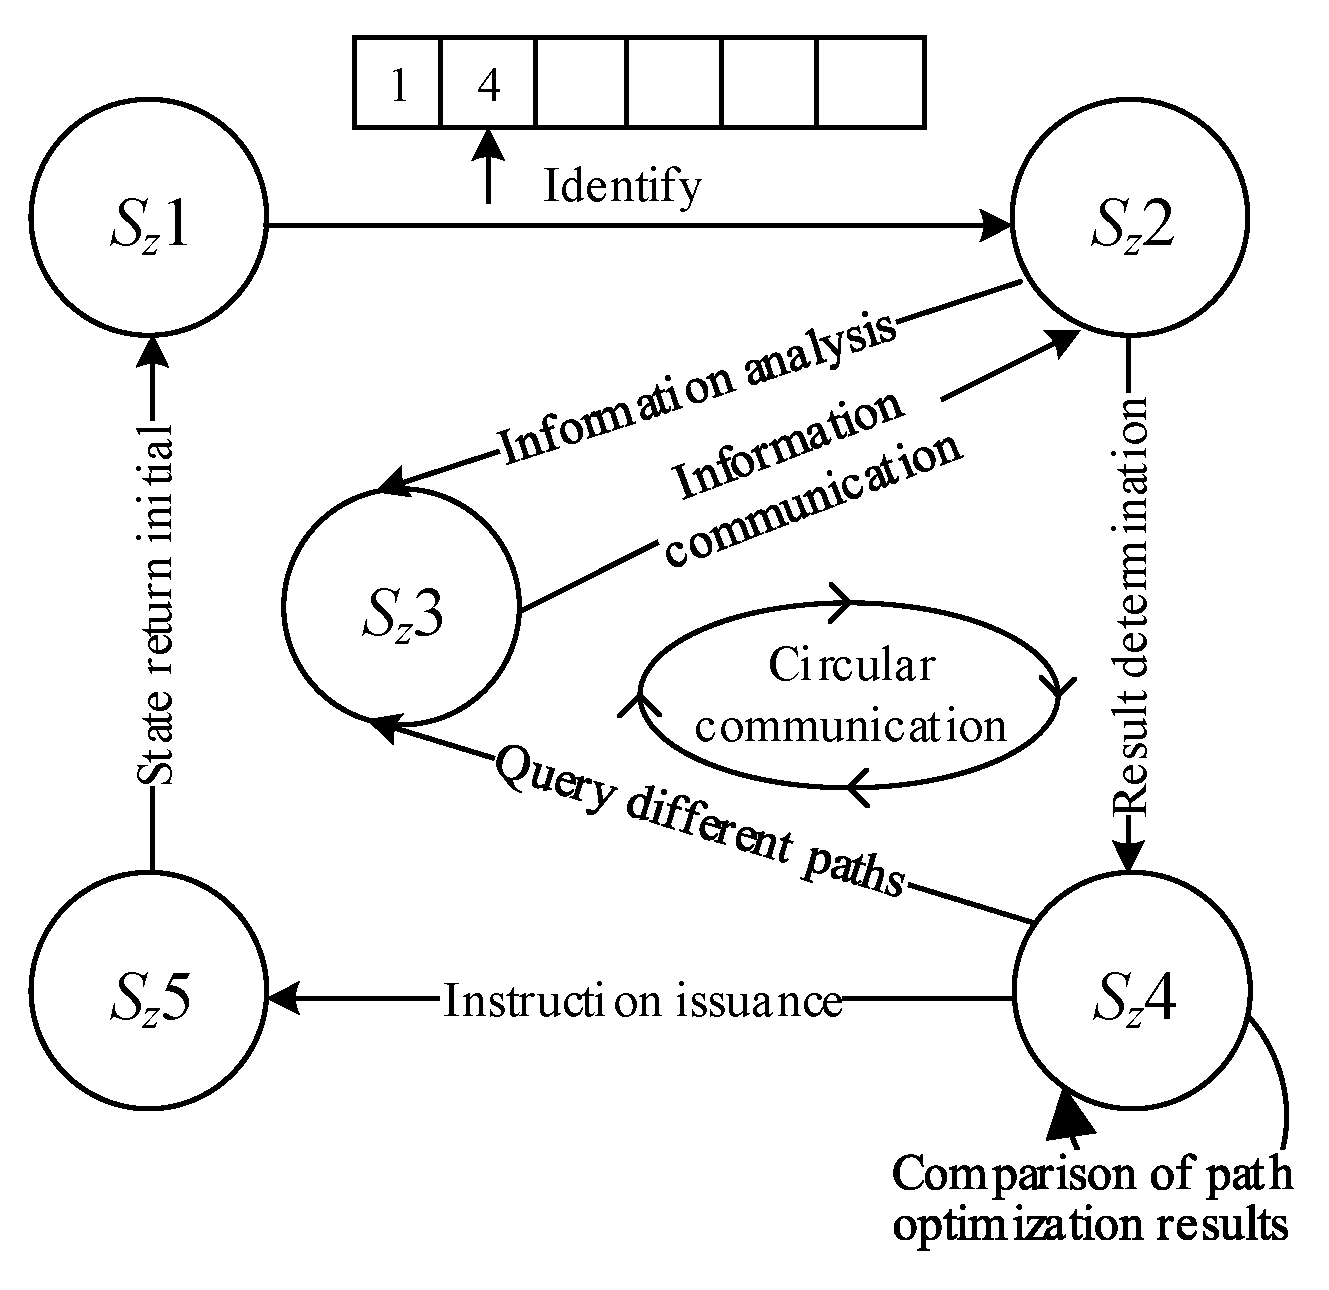
(4)
The state transition of the master station system in the simulation platform is shown in Figure 8. Initially, the master station system is in the initial state. When the second position of the program variable parameters received from the physical system equals 4, the state transitions to the finite state machine communication state, where the received information is parsed. At this point, the state transitions to the finite state machine parsing state, where the fault node is used to query the corresponding instruction and switch information. The specific path information for fault optimization is shown in Table 3. Upon successful parsing, the state transitions back to the finite state machine communication state, where communication with the strategy simulation system occurs.
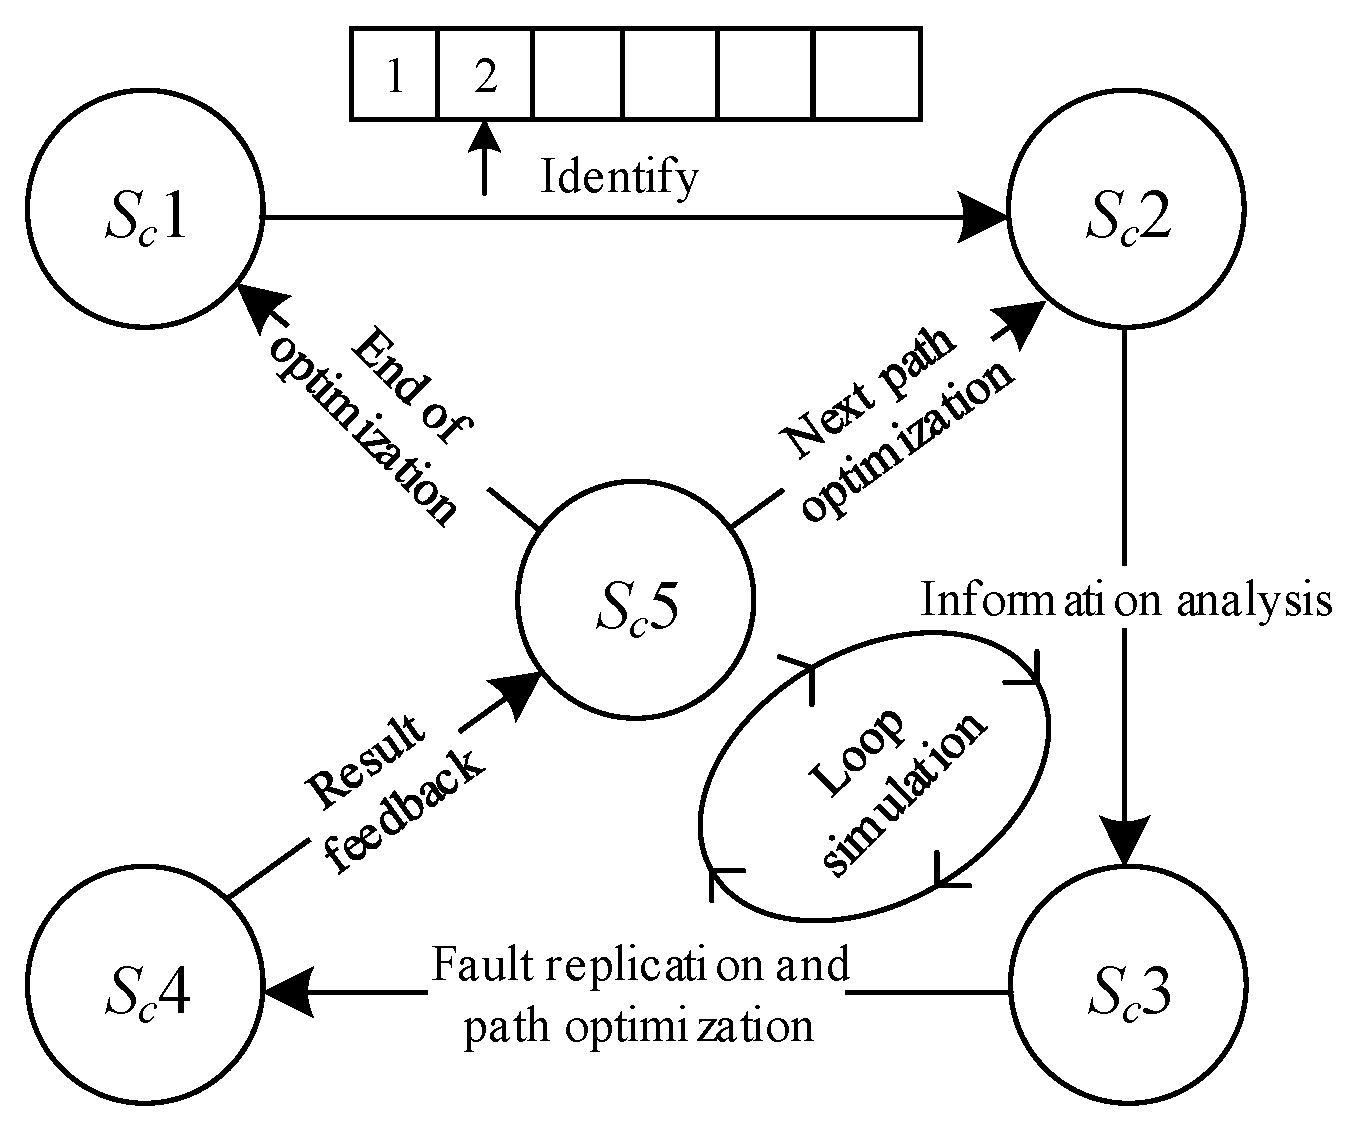
(5)
In the simulation platform, the state transition of the strategy simulation system is shown in Figure 9. The strategy simulation system is initially in the initial state. When it receives the program variable parameter with the second position as 2 from the master station system, the state transitions to the finite state machine communication state and begins parsing the received information. At this point, the state transitions to the finite state machine parsing state, and the parsing process is as follows: a. Copy the fault information of the physical system based on the fault node number; b. Modify the topology based on switch and instruction information, and optimize different paths. During the execution of related instruction information, the state of the strategy simulation system is the simulation execution state. After the simulation concludes, the state transitions to the simulation result feedback state, where the optimized program variable parameters (mainly voltage and current information) are uploaded to the master station system.
(6)
When the master station system in the finite state machine communication state receives the result feedback information from the strategy simulation system, the state transitions to the judgment of optimization results state. The system then evaluates and records the feedback information for optimization results. At this point, the first fault optimization is completed. The master station system will continue to communicate in a loop with the strategy simulation system, based on different path optimization information from the optimization library, until all path optimizations are simulated and completed.
(7)
Similarly, the strategy simulation system in the simulation result feedback state will continue to identify the program variable parameter in the second position from the master station system and continue performing the loop simulations until all path simulation results are completed. All feedback information will then be uploaded, and the final state transitions to the initial state.
(8)
After the final path optimization result feedback, the master station system will perform a determination based on the mean square deviation and simulation time for all path optimization information. The optimal result will be selected, and the path optimization information with the best result will be sent to the physical system. The state will then transition to the initial state.
(9)
The physical system, in the waiting state, will execute the best path information sent by the master station system, control the switches for fault optimization, and, after a successful optimization, the state will transition back to the initial state.

5. Simulation Experiment Verification and Analysis

To validate the usability of the proposed integrated simulation platform, a semi-hardware-in-the-loop simulation system, as shown in Figure 10, is constructed. The system mainly consists of a rapid control prototype (RCP), hardware-in-the-loop (HIL), and an upper computer. The RCP model is PXIe-1071, Intel i3 dual core CPU2.6GHz per core, equipped with NI-PXIe-7846R board; the HIL model is PXIe-1082, Intel i7 quad core CPU2.6GHz per core, equipped with NI-PXIe-7858R board; the upper computer has an i7-7700 quad core CPU with a frequency of 1.6 GHz per core and a RAM of 16.0 GB.
The upper computer is used to install the application software StarSim RCP (version: 4.6.9.0) and the HIL application software StarSim HIL (version: 4.6.9.0) for RCP. The microgrid topology model is downloaded from the upper computer to the HIL system. The control module, compiled with Simulink (version: 2018a)-generated .tlc code, is deployed on the RCP, with the physical system and the strategy simulation system running on HIL, and the master station system running on the RCP. After configuring network addresses within the same local area network, data can be exchanged directly between the RCP and HIL through analog and digital ports. Since all simulations on both RCP and HIL are performed with a time step of 100 μs, and considering the fiber-optic communication delay on the microsecond level, the signal delay through the analog port is approximately 200 μs. The microsecond-level delay is neglected, and the voltage signals are measured using an oscilloscope. Due to the IO interface’s signal communication limit of 10, the voltage signal is scaled down by 1000 times when passing through the RCP’s IO port. After passing through HIL, the voltage signal is restored to 1000 times its original value.

5.1. Simulation Experiment Analysis

The physical system simulates a real power grid, demonstrating grid faults through physical system failures. As shown in Figure 11, a new microgrid topology model with an IEEE 33-node, 10 kV power source is established. Under normal operation, the switches gi on both sides of the nodes are closed, while the optimization switches ki (represented by the dashed lines) are open. In the fault state, the optimization switches and node switches can operate according to the optimized switch command information. Based on the communication strategy and state transitions of the integrated simulation platform, a short-circuit fault is created at node 26, while the remaining nodes are in a normally connected state, and a simulation analysis is conducted.
Figure 12 shows the state transition results of the physical system, master station system, and strategy simulation system within the integrated simulation platform. Based on the fault optimization state strategy proposed above, when the physical system is in a fault state, the master station system receives the program variable parameters from the physical system, performs parameter analysis, and engages in a cyclic communication with the strategy simulation system. A total of three path optimization simulations are conducted. Taking the time point 15 as an example, the strategy simulation system is in the simulation result feedback state, the master station system is in the judgment of optimization result state, and the physical system is in the waiting state. At this point, after the master station system concludes the optimization result judgment, it sends the third path optimization command information to the strategy simulation system, which, upon receiving it, continues executing the path optimization until all three path optimization simulations are completed. Throughout this interval, the physical system remains in the waiting state. The physical system, master station system, and strategy simulation system in the integrated simulation platform execute according to the strategy and communication format, with the simulation results fully aligning with the previously described outcomes. This supports the inference of the availability of the simulation platform in executing the strategy.

5.2. Conclusion Analysis

Due to the short-circuit fault occurring at node 26, the voltage at node 27 was collected for result analysis. Figure 13 shows the voltage variation throughout the entire simulation process at node 27. The oscilloscope probe has a 1000:1 ratio. Under normal conditions, the voltage at node 27 is 7.75 kV, and it can be observed that there are a total of four voltage changes.
The first change was caused by a short-circuit fault at node 26. Figure 14 shows that the voltage of node 27 is basically kept at 0 when a short-circuit fault occurs at node 26. The remaining changes are due to the optimization of simulation platform faults. The first path optimization switch signal ki = 010000, and the switch acts 3 times. Figure 15 shows that the voltage at node 27 has recovered to about 7.75 kV, basically completely recovered. The second path optimization switch signal ki = 001000, and the switch acts 3 times. The voltage at node 27 is restored to about 6.75 kV, which is significantly different from the initial voltage at node 27. The third path optimization switch signal ki = 011000, and the switch acts 4 times. Figure 16 shows that the voltage at node 27 recovered to about 7.75 kV, basically completely recovered.
A comparative analysis was conducted with existing methods in terms of simulation time and optimal path selection while ensuring the similarity of microgrid topology. Table 4 shows the comparison results of optimization time between the proposed method and C-ADMM-A algorithm, C-ADMM-F algorithm, CADMM + SA algorithm, QA-ADMM-A-1 algorithm, and QA-ADMM-A-2 algorithm [26] on the IEEE-33 microgrid topology. The fault optimization time of the proposed method in this paper is 0.512 s, which consumes the least time compared with the traditional optimization strategy, and is reduced by about 16–86.6%.
The voltage mean square deviation, average voltage deviation, and switching action times are taken as the optimization objectives to select the best path.
Table 5 shows the comparison results of the objectives after fault optimization in the example:
(1)
When the main objective is to minimize the voltage mean square deviation and the average voltage deviation, while auxiliary objective is to minimize the number of switching actions, the first recovery path is optimal;
(2)
When the only objective is to minimize the number of switching actions, the second recovery path is optimal;
(3)
When taking the minimum voltage mean square deviation, the minimum average voltage deviation, and the minimum number of switching actions as the same weight objectives, the third recovery path is optimal.

6. Conclusions

The efficient operation of microgrids urgently requires the deep integration of information physics technology and business to achieve the reproduction of source load dynamic regulation scenarios. In response to this demand, this article has made the following main contributions:
(1)
A CPS-based microgrid simulation platform is proposed, which integrates information physics technology and business architecture to achieve real-time simulation and reproduction of business scenarios. In theory, it can be connected to the main control system to achieve state decision-making and control.
(2)
The fault optimization time of the proposed platform in this paper is 0.512 s, which consumes the least time compared with the traditional optimization methods, and is reduced by about 16–86.6%.
(3)
The proposed platform can design different state transition strategies according to different business. Taking fault optimization business as an example, the best path can be selected through state transition, and the optimal fault recovery of the physical system can be achieved through communication and real-time control.
The proposed platform can be applied to real-time simulation of microgrids with different topologies and scenarios, such as fault optimization, fault location, energy scheduling, and load control. However, reproducing multiple scenarios will lead to a significant increase in dimensionality, making it impossible to achieve real-time simulation and having certain limitations. This is also the future research direction of the platform.

Author Contributions

Conceptualization, D.J. and X.Y.; methodology, D.J.; validation, K.Y., X.L. and W.D.; formal analysis, W.S.; investigation, K.L.; resources, D.J.; data curation, X.Y.; writing—original draft preparation, K.Y.; writing—review and editing, X.L.; project administration, D.J.; funding acquisition, D.J. All authors have read and agreed to the published version of the manuscript.

Funding

This research was funded by the Science and Technology Project of State Grid Corporation of China “Research on the key technology of modeling and simulation analysis of peer-to-peer distribution system”, grant number: (5400-202355767A-3-5-YS).

Data Availability Statement

Restrictions apply to the availability of these data. Data were obtained from China Electric Power Research Institute Co., Ltd.; they are limited and are available from the authors with the permission of China Electric Power Research Institute Co., Ltd.

Acknowledgments

We would like to express our gratitude to all the reviewers and editors for providing valuable advice.

Conflicts of Interest

Authors Dongli Jia, Xiaoyu Yang, Wanxing Sheng, Keyan Liu were employed by the company China Electric Power Research Institute Co., Ltd. The remaining authors declare that the research was conducted in the absence of any commercial or financial relationships that could be construed as a potential conflict of interest. The company had no role in the design of the study; in the collection, analyses, or interpretation of data; in the writing of the manuscript, or in the decision to publish the results.

References

  1. Hirokazu, I.; Honoka, D.; Soshi, S.; Hidehiko, T.; Yoshikiyo, H.; Takato, N.; Nobuyoshi, N. Enhancing understanding of pressure drop in carbon porous electrodes for vanadium redox flow batteries. J. Energy Storage 2023, 73, 109066. [Google Scholar]
  2. Yang, Y.; Lu, Q.; Yu, Z.; Wang, W.; Hu, Q. Multi-Type Energy Storage Collaborative Planning in Power System Based on Stochastic Optimization Method. Processes 2024, 12, 2079. [Google Scholar] [CrossRef]
  3. Yang, Q.M.; Li, G.F.; Bie, Z.H.; Wu, J.Y.; Lin, C.F.; Liu, D.F. Coordinated Power Supply Restoration Method of Resilient Urban Transmission and Distribution Networks Considering Intermittent New Energy. High Volt. Eng. 2023, 49, 2764–2774. [Google Scholar]
  4. China National Knowledge Infrastructure. Available online: https://kns.cnki.net/kcms2/article/abstract?v=_pLk7jldQwhLeziox4zGOk3D4UsyyRQEE1hIx3i7AKGHnjuAiWUSpyijOuUPM7h40Dxt0bdJFTPk0eje3PR06M5YpzwlcQsVnHfa6GxLD2AYByXu_MYWaInYy8oJSceNUvE1aDw8DLWKejnJMw6dV7ghGGGXW3LY0Ukz74LYc5snz-Id5gUPCQISm5VMFMP3&uniplatform=NZKPT&language=CHS (accessed on 15 November 2024).
  5. Yang, H.; Yin, B.; Meng, K.; Yu, H.; Zhou, N.; Xu, Z. Distributed Robust Optimal Scheduling of the New Interconnected Power System with the Inter-province and Intra-province Considering Moment Uncertainty of Source Load Power. Electr. Power Constr. 2023, 44, 98–110. [Google Scholar]
  6. Yang, L.; Huang, Z.H.; Chen, J.H.; Zheng, D.L.; Hong, M.Z.; Liu, J.X. Optimal Stability Analysis of DC Microgrid Based on Crisscross Optimization Algorithm. High Volt. Eng. 2023, 49, 4632–4641. [Google Scholar]
  7. Zhang, J.M.; Ouyang, S.; Wu, H.; Xin, X.; Huang, Y. Optimal configuration of grid-side energy storage considering reliability and operation economy of distribution network. Electr. Power Autom. Equip. 2024, 44, 62–68+85. [Google Scholar]
  8. Li, L.J.; Xu, Y. Flexible DC distribution network fault location method based on beetle swarm optimization algorithm. J. Phys. Conf. Ser. 2023, 2625, 012001. [Google Scholar] [CrossRef]
  9. Dong, G.C.; He, C.; Liu, X.; Nan, L.; Liu, T.Q.; Zhang, Y.Q. Coordinated recovery method of post-disaster distribution network cyber-physical system considering network reconstruction and emergency resources. Electr. Power Autom. Equip. 2024, 44, 106–113. [Google Scholar]
  10. China National Knowledge Infrastructure. Available online: https://kns.cnki.net/kcms2/article/abstract?v=_pLk7jldQwiDoWzfs8RAyxeeZIEbbJjLQVSuuh_uNazaRRKP2Arr2tjSEATWlpfOWbM5EqYDlxZBo0ubasdjCpUZu3Q_fuC3Gql4Lhkt6Wfr6MARMB4abRS1u76D7pPaiPpo3kamPX7kqCBcusN0Ky-QfX6gRMpbXWWKWsoOTT23WVHvr5GYHvTvW9q3Lh4f&uniplatform=NZKPT&language=CHS (accessed on 9 October 2024).
  11. Li, H.Z.; Guo, X.C. Reliability Evaluation of Cyber-physical System of Distribution Network Based on Petri Net. Power Syst. Technol. 2023, 47, 347–359. [Google Scholar]
  12. Pang, Q.L.; Han, S.Y.; Zhou, T.; Zhang, F.; Jiao, X.G.; Wang, Y.Q. False Data Injection Attack Detection of Cyber-physical Power System Based on ASRUKF and IMC Algorithms. Grid Anal. Study 2024, 52, 111–118. [Google Scholar]
  13. Chen, L.J.; Wang, B. Disaster recovery strategies for cyber-physical systems considering the Interdependence. Electr. Power Syst. Res. 2024, 232, 110397. [Google Scholar] [CrossRef]
  14. Liu, Y.L.; Feng, H.N.; Hatziargyriou, N.D. Multi-stage collaborative resilient enhancement strategy for coupling faults in distribution cyber physical systems. Appl. Energy 2023, 348, 121560. [Google Scholar] [CrossRef]
  15. Yang, Y.; Yang, P. The Hierarchical Modeling Approach for Centralized Control Microgrid Cyber Physical System. Proc. CSEE 2022, 42, 7088–7102. [Google Scholar]
  16. Zheng, H.K.; Lv, T.T.; Sun, Y.W.; Li, Y.J.; Yu, K.D. Reliability Analysis of Integrated Energy Cyber Physical System Considering Information Equipment Failure. High Volt. Eng. 2022, 48, 3078–3087. [Google Scholar]
  17. He, H.; Liang, Y.; Liu, K.Y.; Weng, Y.H. Active Distribution Network Voltage Control Method Considering Communication Interruption. Power Inf. Commun. Technol. 2022, 20, 1–10. [Google Scholar]
  18. Huang, Z.; Liu, D.; Chen, G.H.; Weng, J.M.; Yin, H.Y.; Wang, Z. The evolution mechanism of the cyber-physical cascading failure of power distribution system based on event-driven. Electr. Power Eng. Technol. 2022, 41, 2–13. [Google Scholar]
  19. Anant, M.T.; Dusmanta, K.M. RBFNN assisted transient instability-based risk assessment of cyber-physical power system. Int. J. Electr. Power Energy Syst. 2022, 137, 107787. [Google Scholar]
  20. Zhang, J.; Yang, T.; Ji, H.; Li, W. Optimal locating method of edge computing device in cyber physical distribution system. Energy Rep. 2022, 8, 684–694. [Google Scholar] [CrossRef]
  21. Fang, Y.; Tang, X.; Tang, L.; Chen, Y.; Wang, W. Local Evolution Model of the Communication Network for Reducing Outage Risk of Power Cyber-Physical System. Energies 2022, 15, 7876. [Google Scholar] [CrossRef]
  22. Yang, Z.; Jia, W.; Xu, B.W.; Min, X.; Zhao, F.L.; Xu, L. Error Proof Control Method for Real-time Power Dispatching Based on Finite State Machine. Electr. Eng. 2023, 12, 176–178+182. [Google Scholar]
  23. Zhou, H.B.; Yang, J.; Huang, L.S.; Song, D.R.; Chen, X.J.; Dong, M. Double-vector Model Predictive Control Strategy of Three-level Inverter Based on Finite State Machine. Autom. Electr. Power Syst. 2023, 47, 155–164. [Google Scholar]
  24. Zhong, M.H.; Tong, X.Q.; Liu, X.H. A new fast PWM modulation strategy for power electric converter based on finite set state machine theory. Energy Rep. 2023, 9, 90–96. [Google Scholar] [CrossRef]
  25. Liu, K.Y.; Li, Z.; Jia, D.L.; Ye, X.S. Multi-flow Fusion Simulation Engine for New Distribution Network Based on Finite State Machine. High Volt. Eng. 2023, 50, 4826–4836. [Google Scholar]
  26. Fu, W.; Xie, H.; Wang, H.; Chen, C.; Bie, Z. Post-Disaster Topological Reconfiguration Approachfor Distribution Networks Using Hybrid Quantum-Classical Algorithm. J. Xi’an Jiaotong Univ. 2025, 59, 1–16. [Google Scholar]
Figure 1. Cyber-physical technology coupling process.
Processes 13 01441 g001
Figure 2. Microgrid cyber-physical systems and business integration platform architecture.
Processes 13 01441 g002
Figure 3. Master station system business query method.
Processes 13 01441 g003
Figure 4. Finite state machine model.
Processes 13 01441 g004
Figure 5. Basic principle of FSM.
Processes 13 01441 g005
Figure 6. Four-layer framework of TCP/IP communication protocol.
Processes 13 01441 g006
Figure 7. Physical system state transition process.
Processes 13 01441 g007
Figure 8. Master station system state transition process.
Processes 13 01441 g008
Figure 9. Strategy simulation system state transition process.
Processes 13 01441 g009
Figure 10. Semi-hardware-in-the-loop simulation system.
Processes 13 01441 g010
Figure 11. IEEE 33 node novel microgrid topology.
Processes 13 01441 g011
Figure 12. State transition process of simulation platform.
Processes 13 01441 g012
Figure 13. The voltage variation diagram of the whole process of the 27-node simulation.
Processes 13 01441 g013
Figure 14. Voltage variation diagram of node 27 when short-circuit fault occurred.
Processes 13 01441 g014
Figure 15. Node 27’s first and second optimized voltage diagram.
Processes 13 01441 g015
Figure 16. Node 27’s second and third optimized voltage diagram.
Processes 13 01441 g016
Table 1. Description of variables and technical terms.
SymbolExplanation
variablesSFinite set of states
CCollection of events
S0Initial state
SnTarget state
fState transition function
SiCurrent state
CiCurrent input event
OnOutput state
gOutput function
CnSet of output events
technical termsC-ADMM-AAlternating direction method of multiplier algorithm in classical computing environment, A stands for adaptive update with penalty factor
C-ADMM-FAlternating direction method of multiplier algorithm in classical computing environment, F stands for fixed penalty factor
CADMM + SASimulated annealing algorithm for discrete problems in classical computing environment
QA-ADMM-A-1Quantum annealing embedded ADMM algorithm under a solver
QA-ADMM-A-2Quantum annealing embedded ADMM algorithm based on b solver
Table 2. Definition of state control strategies.
SystemSystem IdentifierStateCommunication InformationStrategy Definition
Physical system0sw_11initial state
sw_22data collection state
sw_33reclosing state
sw_44fault state
sw_55FSM communication state
sw_66waiting state
Master station system1sz_11initial state
sz_22FSM communication state
sz_33FSM parses state
sz_44determine the status of the optimization result
sz_55issue functional command status
Strategy simulation system2sc_11initial state
sc_22FSM communication state
sc_33FSM parses state
sc_44simulation execution status
sc_55simulation result feedback status
Table 3. Fault optimization library.
Node1–34–67–91015–1718–202124–2526–2829–3211–14, 23, 33
PathL1L1L6L1L3L1L1L1L2L1L1L1L3L1off-grid
Switch
(k1k6)
100000000100001000000001000100000010000001100000010000001000000000
010000
001000000010001000
011000000001
010100000001011000
001100
Table 4. Comparison of solution time.
StrategyTime Consumption for Fault Optimization Solution (s)
Traditional optimization strategiesC-ADMM-A0.609
C-ADMM-F3.829
CADMM + SA2.830
QA-ADMM-A-12.044
QA-ADMM-A-20.725
The method proposed in this article0.512
Table 5. Comparative results of the objectives.
ObjectivesVoltage Mean Square Deviation (kV)Average Voltage Deviation (%)Switching Action Times
Path
First path0.020.263
Second path0.8310.713
Third path0.030.394
Disclaimer/Publisher’s Note: The statements, opinions and data contained in all publications are solely those of the individual author(s) and contributor(s) and not of MDPI and/or the editor(s). MDPI and/or the editor(s) disclaim responsibility for any injury to people or property resulting from any ideas, methods, instructions or products referred to in the content.

