Article

Simulation of Biofouling Caused by Bacillus halotolerans MCC1 on FeNP-Coated RO Membranes

by
Maria Magdalena Armendáriz-Ontiveros
1,
Teresa Romero-Cortes
1,
Victor Hugo Pérez España
1,
Jaime A. Cuervo-Parra
1,
Martin Peralta-Gil
1,
Maria del Rosario Martinez Macias
2 and
Gustavo Adolfo Fimbres Weihs
3,*
1
Escuela Superior de Apan, Universidad Autónoma del Estado de Hidalgo, Chimalpa Tlalayote, Apan C.P. 43900, Hidalgo, Mexico
2
Departamento de Ciencias de la Salud, Universidad de Sonora, Blvd Bordo Nuevo S/N, Ciudad Obregón C.P. 85199, Sonora, Mexico
3
School of Chemical and Biomolecular Engineering, The University of Sydney, Camperdown, NSW 2006, Australia
*
Author to whom correspondence should be addressed.
Processes 2025, 13(5), 1422; https://doi.org/10.3390/pr13051422
Submission received: 14 March 2025 / Revised: 24 April 2025 / Accepted: 29 April 2025 / Published: 7 May 2025

Abstract

:
Reverse osmosis (RO) desalination technology offers a promising solution for mitigating water scarcity. However, one of the major challenges faced by RO membranes is biofouling, which significantly increases the desalination costs. Traditional simulation models often overlook environmental variability and do not incorporate the effects of membrane-surface modifications. This paper develops a bacterial growth model for the prediction of seawater desalination performance, applicable to commercial RO membranes, which can be either uncoated or coated with iron nanoparticles (FeNPs or nZVI). FeNPs were selected due to their known antimicrobial properties and potential to mitigate biofilm formation. The native seawater bacterium Bacillus halotolerans MCC1 was used as a model biofouling bacterium. Growth kinetics were determined at different temperatures (from 26 to 50 °C) and pH values (from 4 to 10) to obtain growth parameters. Microbial growth on RO membranes was modeled using the Monod equation. The desalination performance was evaluated in terms of hydraulic resistance and permeate flux under clean and biofouled conditions. The model was validated using desalination data obtained at the laboratory scale. Bacteria grew faster at 42 °C and pH 10. The pH had a more significant effect than temperature on the bacterial growth rate. The FeNP-coated membranes exhibited lower resistance and maintained a higher long-term water flux than the commercial uncoated membrane. This modeling approach is useful for improving the monitoring of feed water parameters and assessing the operational conditions for minimum biofouling of RO membranes. In addition, it introduces a novel integration of environmental parameters and membrane coating effects, offering a predictive tool to support operational decisions for improved RO performance.

1. Introduction

Water scarcity is a growing global challenge [1]. Seawater reverse osmosis (SWRO) desalination has emerged as a promising solution to address water shortages; however, its effectiveness is hindered by biofouling, which is a significant operational issue [2]. Biofouling occurs when microorganisms (MOS) adhere to and grow on reverse osmosis (RO) membrane surfaces, reducing water production efficiency, increasing energy consumption, and elevating the need for chemical cleaning, thereby driving up operational costs [3]. In fact, biofouling management is a major cost driver in RO systems, directly and indirectly accounting for 20–30% of operating expenses [4]. In addition to impacting operational costs, biofouling affects the quantity and quality of produced water by increasing hydraulic resistance and exacerbating biofilm-enhanced concentration polarization [5,6,7]. Pretreating feedwater to reduce microbial and nutrient levels is a primary strategy for managing biofouling [8]. Metrics such as the silt density index (SDI) and modified fouling index (MFI) are commonly used to assess fouling potential; however, no widely accepted biofouling index exists, as biofouling cannot be completely eliminated [9]. Even if 99.9% of MOS are removed during pretreatment, residual bacteria or spores can still pass through the filters, reach the membrane modules, and initiate biofilm formation [10]. Biofouling is typically considered a significant issue when the flux declines by 10–20%, at which point the affected module usually requires replacement [11]. Consequently, effective biofouling monitoring and control strategies are critical for maintaining the efficiency and longevity of RO systems [12].
The growth of microorganisms (MOS) on reverse osmosis (RO) membranes is strongly influenced by factors such as temperature, salinity, pH, nutrient availability, and dissolved oxygen levels [13]. These variables make it challenging to predict or model membrane biofouling, as MOS develop survival strategies by adapting to different environmental conditions. Additionally, the significant variability in seawater quality around the world further complicates the prediction of biofouling [14]. Currently, only a few biofouling models are available in the literature, which are typically specific to certain locations or seasons. For example, Hoek et al. [15] developed a model to simulate biofouling in brackish water RO membranes, focusing on the biological aspects of biofilm formation and growth over a 20-day period. Their findings revealed that the specific energy consumption, feed pressure, and brine pressure increased by 27%, 27%, and 13%, respectively. Similarly, Bucs et al. [16] modeled biomass growth in various commercial feed spacers and found that biomass accumulation on the feed spacer had a greater impact on the pressure drop than attachment to the membrane surface. Rashkeev et al. [11] proposed a reaction/diffusion model for biofouling in RO membranes, specifically incorporating Picochlorum algae. Their model indicated potential reductions in the operational and maintenance costs of RO systems. These studies highlight the importance of modeling and simulation to better prevent and control biofouling, which supports the continued advancement of RO membrane technologies [17]. Although several biofouling models currently exist, many rely on computational fluid dynamics (CFD), which requires significant computational resources. Moreover, these models are typically limited to microscopic or small-scale studies and have limited applicability in industrial settings. Therefore, a practical, user-friendly biofouling model that can be effectively applied at an industrial scale is required.
Various techniques are used to detect MOS growth and assess the bacterial growth potential in desalination plants. One such method is flow cytometry [18], which provides a detailed analysis of microbial populations [19], offering detailed information on the abundance and structure of both phytoplankton and bacterial communities. Other techniques include microbiological analysis, luminometry, and liquid and gas chromatography [20]. However, these methods are expensive and require skilled operators to ensure accurate results. When biofouling occurs, membrane autopsies are often performed to assess the extent of the problem, typically after the system has already been affected [21]. This process is destructive, as the membrane cannot be reused after analysis [22], highlighting the severe operational challenges faced by reverse osmosis (RO) units.
In addition to these methods, recent advances in non-destructive imaging have shown promise for improved biofouling detection and monitoring. Advanced visualization techniques, including optical coherence tomography (OCT) [23,24,25] and magnetic resonance imaging (MRI) [26,27,28], have been successfully applied to monitor biofilm formation and development on reverse osmosis membranes. These methods allow non-invasive, real-time visualization of biofilm morphology, thickness, and spatial distribution, significantly enhancing biofouling diagnostics and management strategies.
Given the importance of detecting biofouling without damaging the RO membrane, which helps prevent cost increases in desalination operations, effective monitoring and control of biofouling are essential. To address this challenge, researchers have proposed various strategies for predicting and managing biofouling. For example, Hoek et al. [15] recommended understanding the site-specific biofilm formation process, applying effective biofouling pretreatment methods, and continuously monitoring biofouling to ensure efficient membrane cleaning. Manalo and Nishijima [29] emphasized the importance of evaluating feed water quality parameters, analyzing foulants and fouled membrane surfaces, and incorporating hydrodynamic conditions into the RO plant design. Additionally, Zhang et al. [30] advocated the use of a free ammonia (NH3) solution as a novel chemical cleaning agent to control biofouling and restore RO membrane performance. These approaches not only improve the cost-effectiveness of biofouling removal but also minimize environmental impacts.
Other researchers have explored the use of nanomaterials due to their unique properties [31]. In particular, membranes have been modified with nanoparticles (NPs) or antimicrobial materials to reduce microbial growth and extend membrane lifespan [32]. For instance, Xiaofang et al. [33] enhanced an RO membrane by incorporating gallic acid (GA) and silver nanoparticles (AgNPs). The modified membrane demonstrated a 46.7% increase in water flux and exhibited exceptional antibacterial properties, achieving over 99.9% efficiency against Escherichia coli and Staphylococcus aureus. Similarly, Torres-Valenzuela et al. [34] modified a commercial RO membrane by adding an extra polyamide layer impregnated with AgNPs through interfacial polymerization. This modification resulted in a 19% increase in hydrophilicity and a 72% reduction in bacterial growth (Bacillus halotolerans MCC1) on the membrane surface. In another study, Armendariz et al. [35] coated a commercial membrane with 0.3 wt% iron nanoparticles (FeNPs) using the immersion method. The modified membranes showed improved flux under biofouled conditions and a 94% reduction in biofilm formation against Bacillus halotolerans MCC1. Notably, this bacterium has been frequently identified in the Sea of Cortez, Mexico, where it causes biofouling problems for desalination plants in the region (including 19 small and four medium-sized plants as of 2022) [36].
Recent studies have explored the use of FeNPs to modify reverse osmosis (RO) membranes, primarily due to their antimicrobial properties and lower cost compared to other nanoparticles [37]. FeNPs disrupt microbial cell membranes, generate reactive oxygen species (ROS), and alter surface hydrophilicity, thereby reducing bacterial attachment and biofilm formation [38]. However, most research on FeNPs has focused only on short-term biofouling tests, leaving the long-term effects on desalination performance and anti-biofouling properties unexplored. Assessing the behavior of FeNP-coated membranes and the growth of bacteria on them presents a promising alternative for the desalination industry. To address this gap, this study evaluates the behavior of FeNP-coated membranes and their interaction with a native seawater bacterium. A simulation model was developed and validated to predict the productivity of RO membranes—both FeNP-coated and uncoated—under varying temperature and pH conditions. The model simulates the growth of seawater bacteria based on the Monod model, which calculates key bacterial growth parameters (specific growth rate, biomass yield, generation time, and generation number). These parameters are used to predict the membrane permeate flux and hydraulic resistance under both biofouling and clean conditions. This work represents the first attempt to model the growth of a native bacterium from the Northwest of Mexico on FeNP-coated RO membranes. The findings are particularly relevant for desalination plants in the Sea of Cortez, Mexico, a region with a significant desalination capacity of roughly 1.4 GL d−1 [36]. To the best of our knowledge, no published research has modeled biofouling using FeNP-coated membranes and seawater bacteria under conditions typical of RO desalination processes. Additionally, this study is the first to report the growth characteristics and classification of Bacillus halotolerans MCC1, detailing its temperature and pH requirements. The insights gained provide valuable contributions to the optimization of desalination processes in regions with similar environmental conditions.
While many studies have focused on the benefits of advanced membrane materials and modeling approaches, there are inconsistencies in the literature regarding their real-world applicability and performance. For example, some reports highlight significant improvements in flux and biofouling resistance using antimicrobial coatings [33,34,35], whereas others have found limited long-term effectiveness or even adverse effects due to nanoparticle leaching or reduced membrane stability [39]. Similarly, while models based on CFD offer detailed insights at the pore scale, their scalability to industrial operations remains a subject of debate [15,16,17]. These conflicting findings underscore the need for practical and easy-to-use models that can bridge the gap between experimental research and operational realities. This study addresses this issue by proposing a simplified Monod-based model that is both computationally efficient and validated under realistic desalination conditions using native seawater bacteria.
This study models biofouling based on a bacterial growth model, which helps explain the correlation between bacterial growth and biofouling resistance. Therefore, as bacterial growth increases, the biofouling resistance also increases. Thus, the objective of this work is to develop a simple predictive model and compare its results with experimental biofouling data to evaluate its accuracy. We aim to demonstrate the model’s practical applicability through a basic case study using both an uncoated membrane and a membrane with antimicrobial properties. By employing a simple model based on Monod kinetics and using data collected over a two-week period, we demonstrate that it is possible to estimate the long-term biofouling performance of membranes. This approach provides a practical and computationally efficient tool for assessing membrane behavior in the presence of typical biofouling by bacteria.

2. Materials and Methods

2.1. Bacterium Growth Kinetics

Bacterial growth kinetics were studied using Bacillus halotolerans MCC1 at temperatures of 26, 30, 34, 38, 42, 46, and 50 °C and pH levels of 4–10 over a 24 h period. This strain was chosen for biofouling studies because it was isolated from seawater after a typical desalination pretreatment in the Sea of Cortez, Mexico [10], where it poses a potential biofouling risk to desalination facilities. A nutrient broth composed of 3 g L−1 peptone, 1 g L−1 glucose, 15 g L−1 yeast extract, and pretreated seawater from the Sea of Cortez (with a salinity of 48,100 ± 350 µS cm−1) was sterilized and used to inoculate the bacterial strain. The bacterium was inoculated at a concentration of 1 × 10⁴ CFU mL−1 into 40 mL of nutrient broth and incubated under each temperature and pH condition. For the pH experiments, the pH of the broth was adjusted using acetic acid or sodium hydroxide, and the cultures were incubated at a constant temperature of 30 °C. Bacterial growth was monitored hourly via optical density measurements using a UV–VIS spectrophotometer (ELx800, BioTek Instruments, Inc., Winooski, VT, USA) with blank corrections and three independent replicates per condition (42 replicates). A calibration curve was used to convert the optical density into biomass (g L−1). This experimental design allowed a systematic analysis of the growth response of the strain to environmental variables critical to desalination processes, particularly its adaptation to the conditions of the Sea of Cortez.

2.2. Growth Parameters of Biofouling Bacterium

Bacterial growth dynamics were quantified using two parameters: the specific biomass growth rate (k) in h−1 and the true biomass yield from the substrate (YXS) in g of biomass per g of substrate. These metrics were derived from the logarithmic phase of growth kinetics by applying the Monod model [40]. The k value was determined using Equation (1), which relates the natural logarithm of the biomass concentration ratio (g L−1) between two time points (N2 and N1) to the time interval (t2t1) in h:
k = ln N 2 N 1 t 2 t 1
YXS can be obtained using Equations (2) and (3):
a = K s u + S 0 K s u
Y x s = x S 0 a a + 1
where Ksu is the substrate constant, S0 is the substrate concentration at the initial time, and x is the biomass concentration (g L−1). Where α is a constant that depends on Ksu and S0. Additionally, the generation time (g) in h per number of generations, which reflects the rate of bacterial multiplication, was determined to analyze the strain behavior under different temperatures and pH scale conditions, following Equations (4) and (5).
g = t n
n = log N n N 0 log 2
where n is the generation number (generation of bacteria), and t is the time interval (h) between the initial biomass concentration (N0) given in g L−1 and the final biomass concentration (Nn) in g L−1.

2.3. Modeling the Bacteria Growth on RO Membranes

To simulate bacterial growth on RO membranes (both uncoated and coated with 0.3 wt% of FeNPs by the immersion method), a MATLAB (R2024a, Mathworks, Natick, MA, USA) model was developed using the differential form of the Monod equation. A reduced-order model was used, and the model parameters were derived from the growth kinetics of Bacillus halotolerans MCC1 at varying temperatures and pH levels. Since direct measurement of substrate consumption was impractical, yield normalization was achieved by assuming a carbon source dependency. Substrate utilization was instead calculated numerically using the Monod equation, with a nutrient broth input of 40 mL d−1 defined as the substrate source. The simulation was conducted using ODE45 in MATLAB (R2024a, Mathworks, Natick, MA, USA) to model the kinetic conditions. Model validation was performed by comparing the results with the experimental biofouling data from Armendariz et al. [35,41], which involved accelerated biofouling tests on coated (0.3 wt% FeNPs) and uncoated commercial RO membranes (Dow SW30HR, Midland, MI, USA). In these experiments, membranes were exposed to a high bacterial concentration (109 CFU mL−1) of Bacillus halotolerans MCC1 at 28 ± 1 °C and pH 8, with daily supplementation of 40 mL of nutrient broth. The bacterial growth model on the RO membranes was obtained using Equations (6)–(8):
k = k max S K s + S
d C B d t = k k d C B
where dCB/dt represents the change in microbial biomass over time (g L−1 h−1), k is the specific biomass growth rate (h−1), kmax is the maximum specific growth rate (h−1), kd is the specific death rate (h−1), Ks is the substrate consumption rate at 50% of the maximum specific growth rate (g of substrate per g of biomass), S is the limiting substrate concentration (g L−1), and CB is the biomass concentration at a given time (g L−1). This model also includes a mass balance of the substrate, using a rough approximation that considers the total dead bacteria as organic matter, which is then converted into nutrients for the remaining bacteria, as shown in Equation (8):
d S d t = S 0 a t C B Y x s k max S K s + S + k d C B
where dS/dt is the rate of substrate concentration change (g L−1 h−1), S is the addition of substrate (g L−1) based on the daily supplementation, which is composed of yeast extract (3 g L−1), peptone (15 g L−1), and glucose (1 g L−1). It is assumed that the bacteria present consume all the added substrate within the day, resulting in an S value of zero by the end of the day. The variable kd is the specific death rate of MCC1 based on cell concentration (h−1); its value is considerably dependent on temperature [42] and is extracted from the growth kinetics calculated by
k d = k max 1 t ln N n N 0
where N0 is the initial biomass concentration (g L−1), and Nn is the final biomass concentration (g L−1).

2.4. Modeling the Desalination Performance of Membranes

To evaluate the performance of the uncoated and FeNP-coated membranes, a MATLAB (R2024a) model was developed to solve the differential equations describing dynamic parameters, such as hydraulic resistance and flux. The membrane performance is evaluated by applying the bacterial growth model, assuming biofouling conditions. The permeate flux (Jv) in m s−1 is estimated using the Kedem–Katchalsky–Merten equation [43]:
J v = Δ P ϕ T C C p μ w R m + R f
where ΔP is the transmembrane pressure (TMP, in Pa), ϕ is the water osmotic factor (Pa L K−1 g−1), T is the temperature (K), C and Cp are the feed water and permeate salt concentrations (g L−1), Rf is the fouling resistance (m−1) as a function of biomass concentration over time, and Rm is the membrane resistance (m−1), which is temperature dependent, and was determined for the uncoated commercial membrane from pure water permeation data by varying the feed pressure [44]. This process was repeated for several temperature values, and Rm is fitted to a linear temperature dependence based on experimental data:
R m = 3.9598 × 10 14 1.0976 × 10 12 T
where T is the temperature (K), and Rm is the membrane resistance in m−1.
The water viscosity (µw), given in Pa s, is also temperature dependent. This correlation was obtained experimentally for seawater, specifically from the Sea of Cortez, Mexico, as follows:
μ w = μ p w 1 + w 1.07266 + 1.27219 × 10 7 T 3 + w 56.2241 + 1.33318 × 10 6 T 3 + 1.20533 × 10 5 w 2 T 3
where µpw is the pure water viscosity (Pa s) and w is the salt mass fraction of the feed water (dimensionless) calculated as:
w = β ( E C 2.1 ) θ
where EC is the electrical conductivity of seawater (µs cm−1), and β and θ are experimentally determined constants (4.19 × 10⁻⁷ and 1.061049, respectively).
Equation (10) is further split into three component equations to describe the interactions between flux, osmotic pressure, and fouling:
J v = L p ( Δ P Δ π )
Δ π = ϕ T ( C C p )
L p = 1 μ w ( R m + R f )
where Lp is the membrane permeance (m Pa−1 s−1), and Δπ is the transmembrane osmotic pressure (Pa). The model assumed a working TMP of 6.5 MPa and a feedwater salt concentration of 35,000 ppm. Simulations were performed using MATLAB, and the results were validated against experimental desalination data from Armendariz et al. [35]. In this study, both uncoated and FeNP-coated membranes were evaluated in a CF042 crossflow system (Sterlitech Corp., Auburn, WA, USA) with an effective membrane area of 0.0042 m2 at 28 ± 1 °C and a TMP of 6.5 MPa, using seawater from the Sea of Cortez, Mexico. The permeate flux was calculated from the permeate mass data recorded on a digital scale (OHaus, Adventurer Pro AV4101C, Parsippany, NJ, USA) collected every minute. As an initial approximation of the MCC1 model, Rf is assumed to have a linear correlation with the biomass concentration present on the membrane. This assumption is validated using experimental Rf data from both uncoated and FeNP-coated membranes by fitting the following:
R f = q C B
where q is a constant obtained from the regression between Rf and CB. CB values are used to simulate the growth of Bacillus halotolerans MCC1 on RO membranes (uncoated and FeNP-coated) based on a reduced-order model derived from Monod kinetics. This variable allowed the construction of growth that illustrates how biomass concentration evolves over time under membrane conditions influenced by environmental factors (temperature and pH). The difference in the slopes and plateau levels between the two membrane types directly reflects the inhibitory effect of FeNPs on MCC1 growth (for a more detailed explanation, refer to Appendix A).
Potential sources of bias were considered to improve data reliability. Optical density (OD600) measurements may be affected by cell aggregation; to minimize this, cultures were vortexed and measured in triplicate. Variability in seawater composition was controlled using a single pretreated batch throughout all experiments. Model assumptions—such as complete daily substrate consumption and a linear relationship between biomass and fouling resistance—were validated against experimental data, although they may not fully capture biofilm complexity. Finally, although laboratory conditions may not perfectly replicate field environments, temperature, pH, and salinity were selected to match those typical of the Sea of Cortez.

2.5. Statistical Analysis

A simple linear regression (fixed-effects model) was used to assess the relationship between generation time and two independent variables: pH and temperature. This method is appropriate given the controlled experimental setup and the continuous nature of the variables involved. The goodness of fit for each regression was evaluated using the coefficient of determination (R2) and p-values, which quantify how well pH and temperature explain the variations in generation time, as this method enables an assessment of both the strength and statistical significance of the relationships. All data points from the experiments were used, as no extreme outliers were identified. All statistical analyses were conducted using STATISTICA version 10 (StatSoft, Tulsa, OK, USA).

3. Results

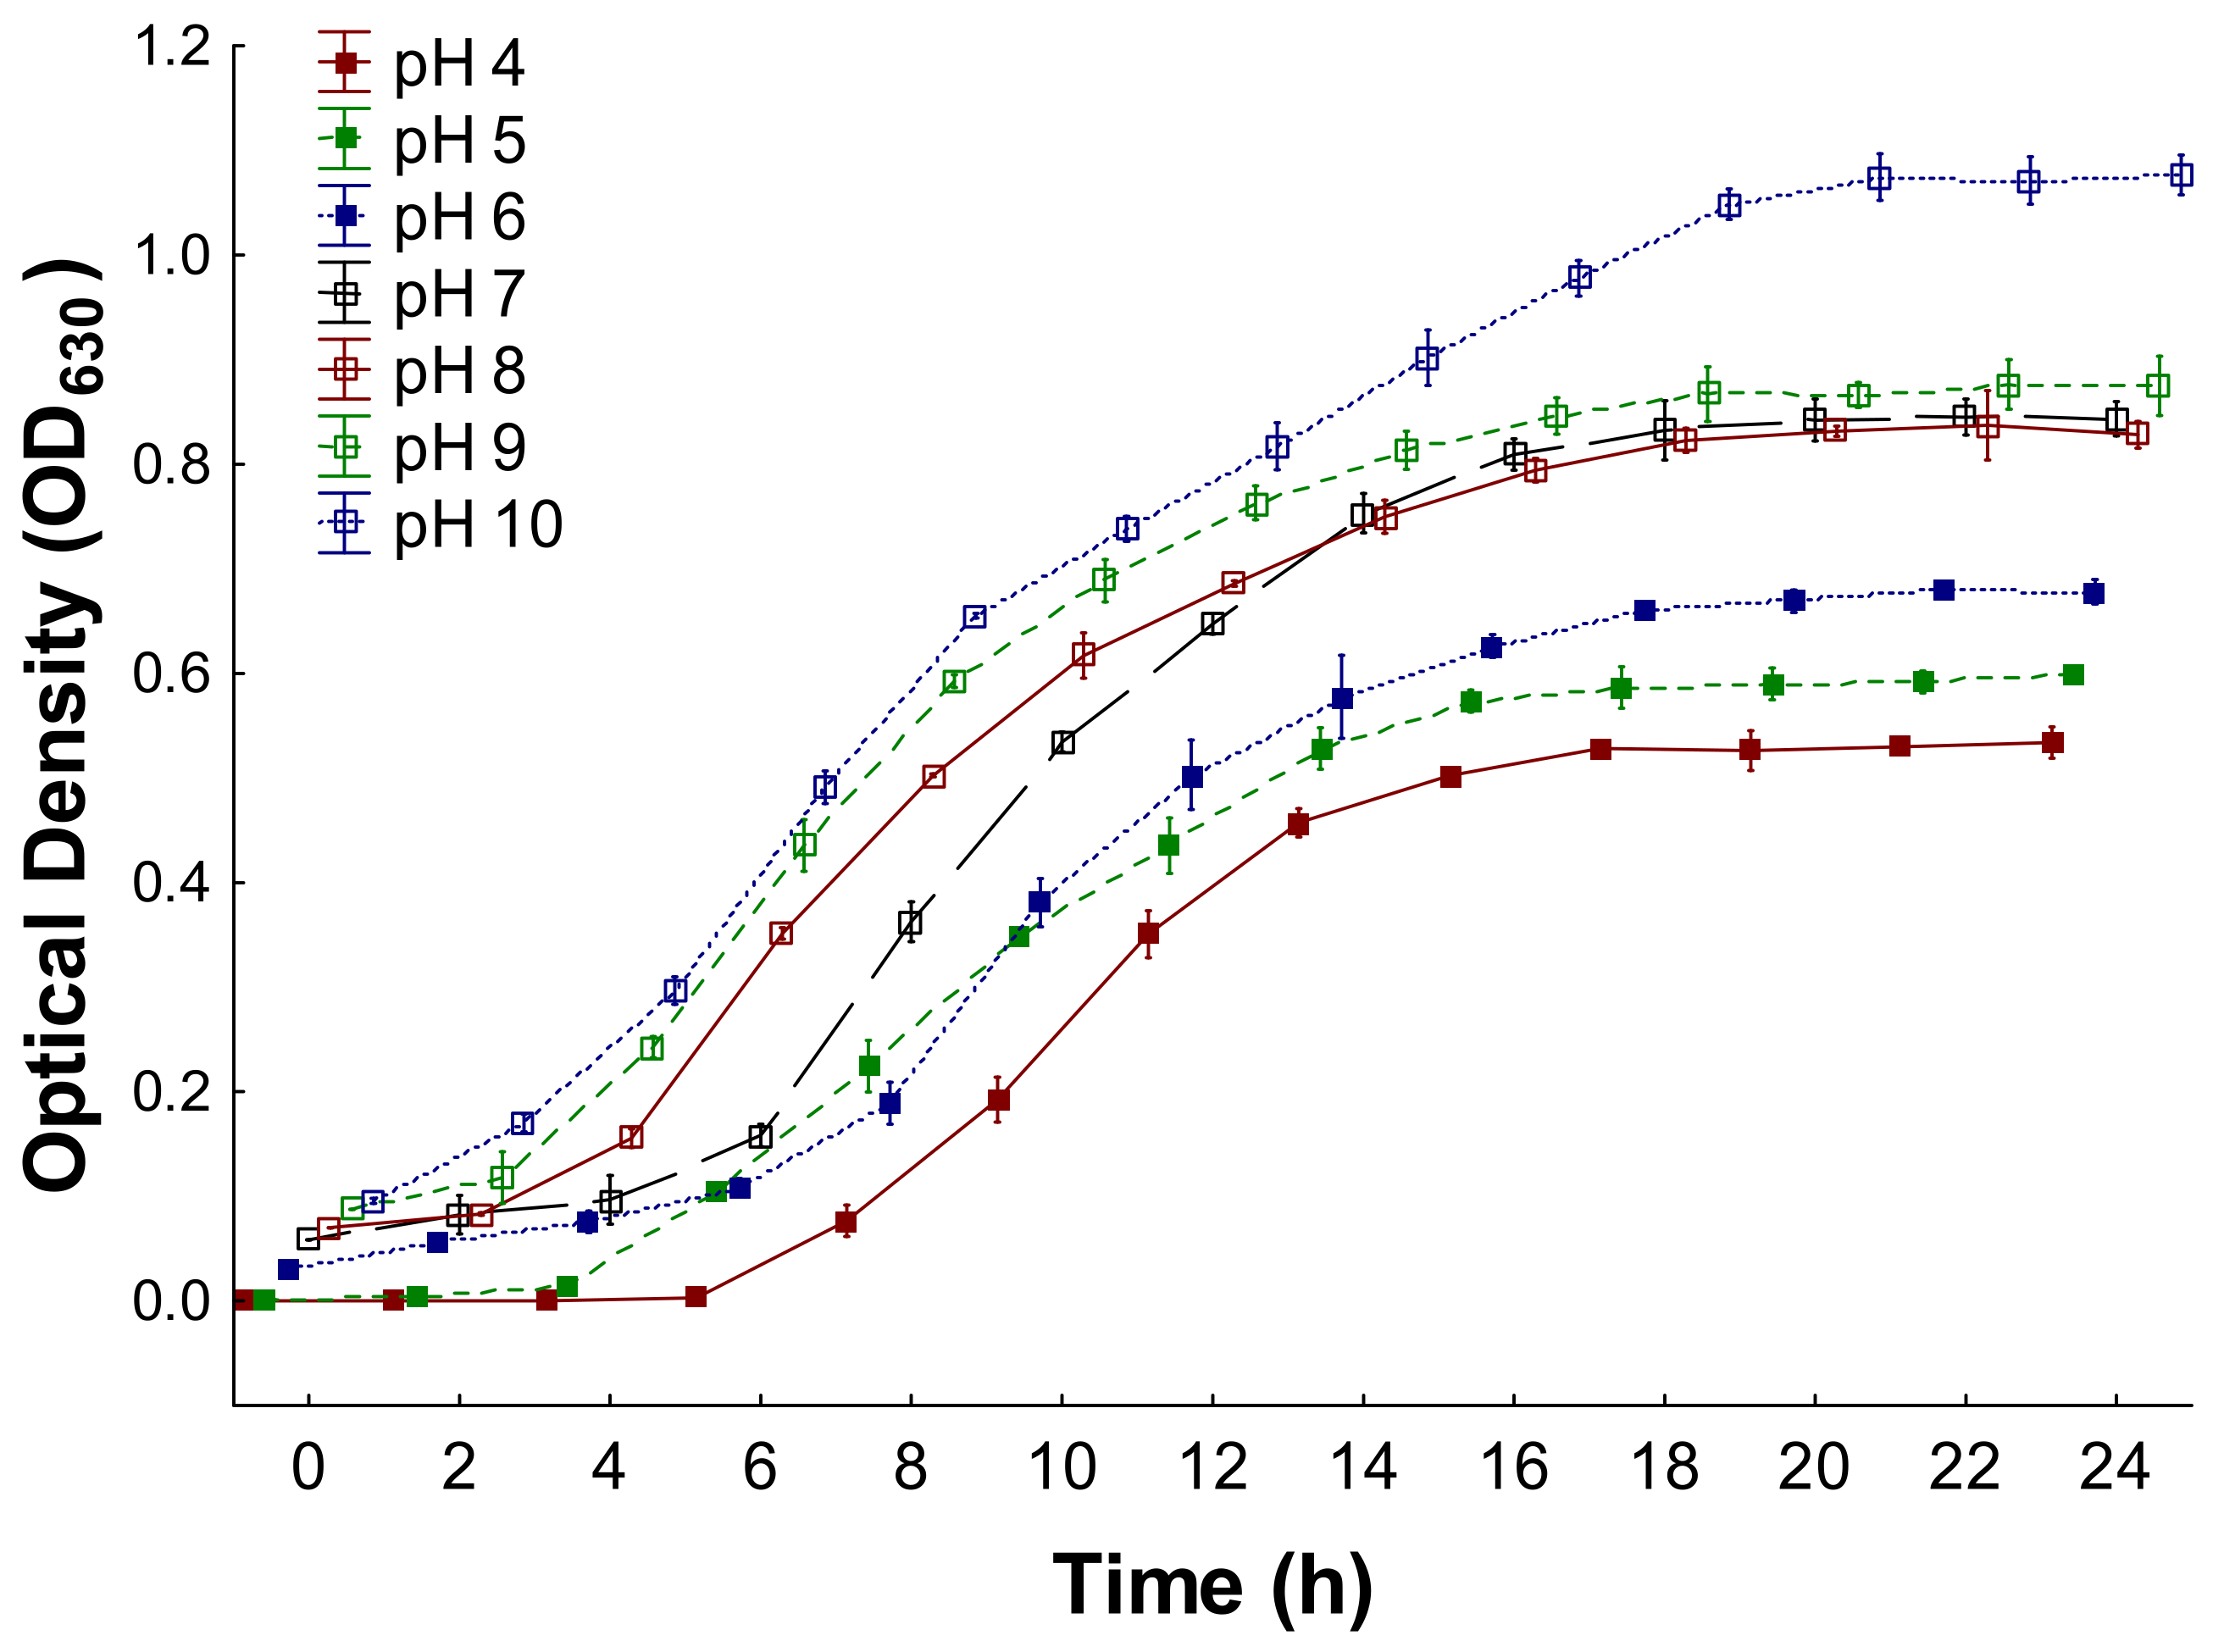
3.1. Bacterium Growth Kinetics

Figure 1 shows the growth kinetics of Bacillus halotolerans MCC1 under different pH levels. The data show that bacterial growth increases as the pH increases. The lag phase becomes shorter with increasing pH, and at pH 10, the log phase begins after just 1 h. Furthermore, the duration of the log phase increased with increasing pH. Notably, at pH 8—the natural pH of the Sea of Cortez, the bacterium’s native habitat—the log phase exhibited the steepest slope, reflecting optimal growth and reproduction rates. Growth is even higher at pH levels above 8, suggesting that MCC1 is more comfortable reproducing at elevated pH levels. Therefore, MCC1 can be classified as alkaliphilic [45], which is a typical characteristic of bacteria isolated from marine environments [46]. Furthermore, bacterial growth at pH levels below 8 may indicate the strain’s adaptability to survive under more extreme conditions. Based on these results, it is recommended that desalination plants in the Sea of Cortez region use feed water with a pH below 8 to minimize bacterial proliferation on membranes and extend operational efficiency.
Figure 2 illustrates the growth kinetics of B. halotolerans MCC1 at different temperatures. The highest growth is observed at 42 °C, followed by 38 °C. In contrast, the lowest growth occurred at 26 °C, where the bacteria initially grew rapidly within the first six hours but declined after seven hours of inoculation. At 44 °C, growth was slow for the first 11 h, while no bacterial growth was detected at 50 °C, indicating that MCC1 cannot survive at temperatures above this threshold. The absence of growth at such high temperatures suggests that extreme conditions lead to cellular damage, including protein unfolding, DNA and RNA denaturation, and enzyme inactivation, ultimately resulting in cell death [47]. Despite the adaptive ability of MCC1 to harsh conditions, there is a clear adaptability limit after which it cannot survive. MCC1 can be classified as a facultative thermophile, as it grows within the mesophilic range (25–40 °C) [48], but it exhibits optimal growth at 42 °C. This thermotolerance is likely due to the presence of saturated fatty acids in the cell membrane, which enhances stability against heat [49]. For desalination processes, the temperature should remain below 42 °C. Operating at 44 °C may increase permeate flux but also risks damaging the membrane structure as it approaches the maximum operating temperature (45 °C) specified by membrane manufacturers [50]. Therefore, a temperature of 44 °C is only recommended for desalination plants with sophisticated temperature control systems to ensure that the process does not exceed 45 °C.

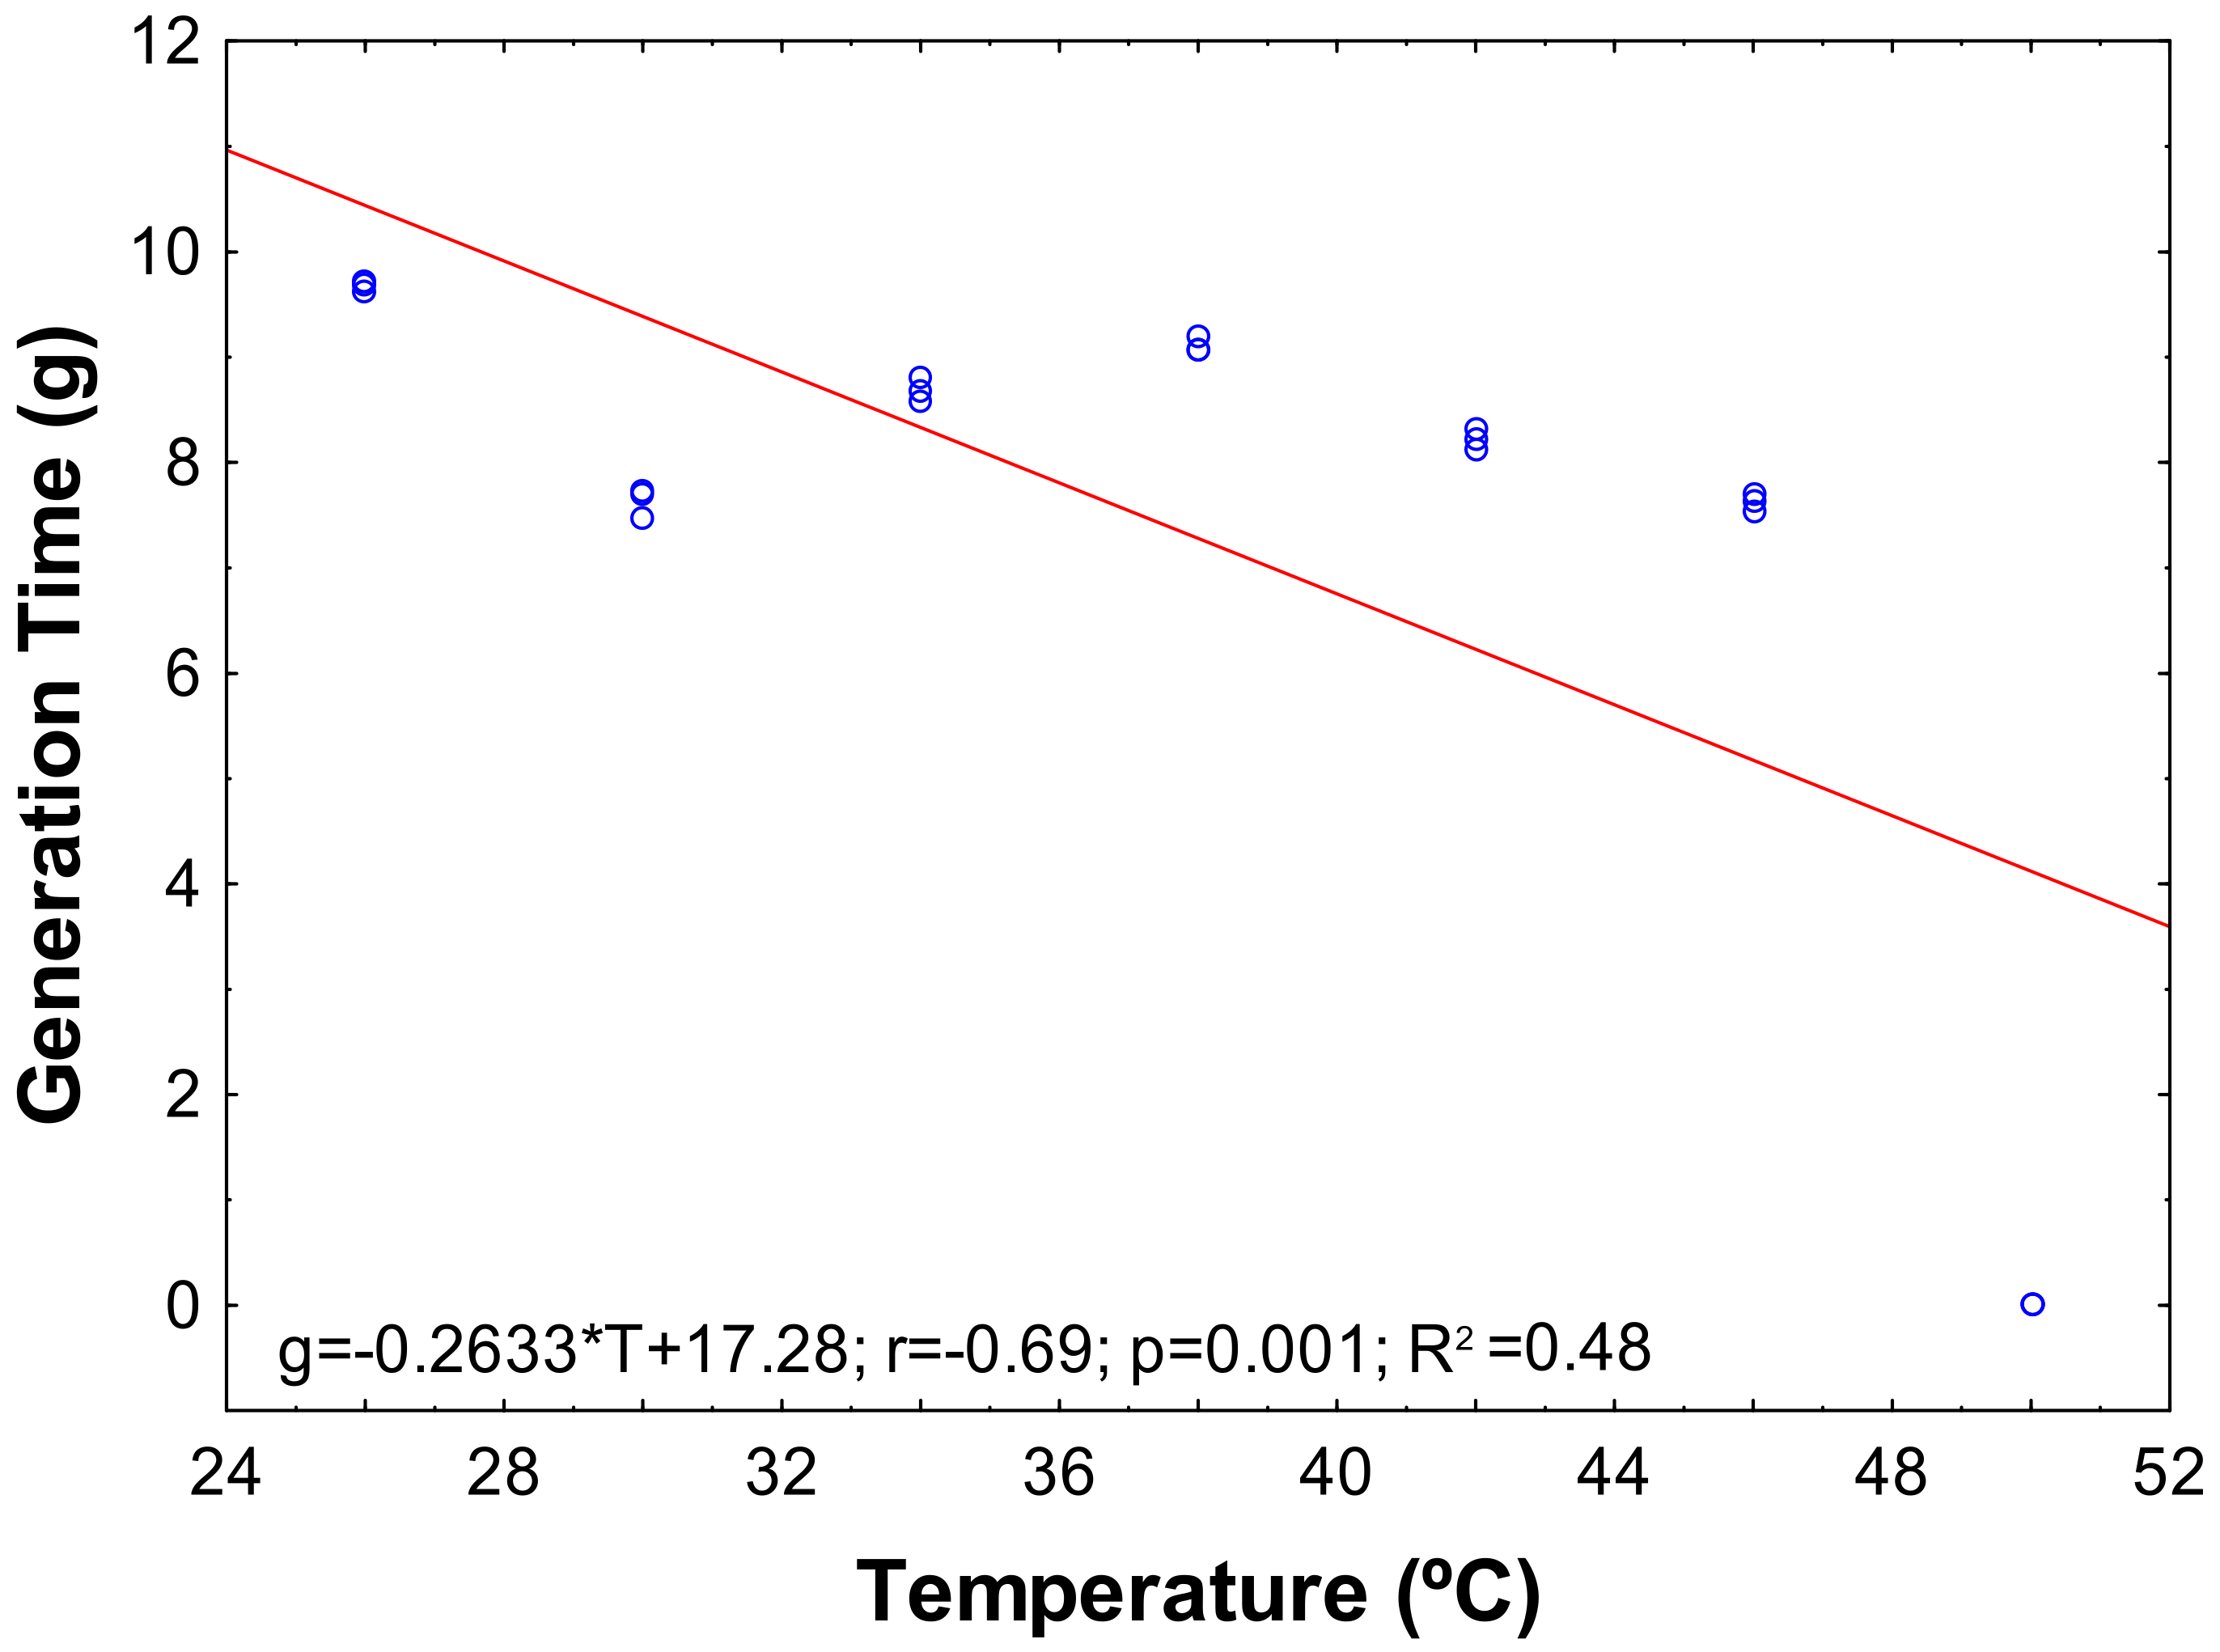
3.2. Growth Parameters of the Bacterium

A significant increase in the generation time of strain MCC1 was observed with increasing pH. There was a positive correlation with a highly significant (95% confidence) dependence between these variables (r = 0.91, p < 0.001). The degree of goodness of fit was high (R2 = 0.81) for the linear regression model (Figure 3). The greatest increase in the generation time of MCC1 is observed when the pH increased from 5 to 6. These results can be attributed to the MCC1 possesses stress response and resistance mechanisms that allow it to adapt to extreme abiotic conditions. The data indicate that MCC1 grows more rapidly at higher pH levels, thereby reinforcing its adaptability. Figure 3 also shows that generation time remains ≥4.5 h across a pH range of 5 to 10, highlighting MCC1 as a potential concern for desalination plants. Its ability to easily form biofilms under these conditions [51] poses a risk to reverse osmosis (RO) membranes, potentially compromising system efficiency and longevity.
The strain MCC1 exhibited a significant negative correlation between generation time and temperature, with higher temperatures corresponding to shorter generation times. However, the linear regression model (R2 = 0.48) revealed that temperature explains only 48% of the variance in generation time (Figure 4), indicating that other abiotic factors strongly influence cellular division under varying thermal conditions. Notably, the generation times across the tested temperature range (24–48 °C) remained ≥7.5 h. Such prolonged doubling times are concerning for desalination operations, as even generation times ≥2.5 h are sufficient to promote biofilm formation on RO membranes [51] since they increase hydraulic resistance by obstructing water flow, which ultimately reduces the quantity of treated water produced [52]. While MCC1’s generation time decreases modestly with increasing temperature, the persistent risk of biofouling across all tested conditions underscores the need for additional mitigation strategies beyond temperature control to maintain membrane efficiency.
Table 1 presents the k and YXS results obtained from the growth kinetics of B. halotolerans MCC1 at different pH levels and temperatures, along with the start and end times of the log phase. The results indicate that the exponential phase is extended when the bacteria are under stress, likely because they require additional time to develop adaptive strategies for survival. This aligns with previous findings that alkaline conditions tend to prolong the logarithmic growth phase of microorganisms [53]. Consistent with this, the biomass yield (YXS) increases as pH increases, classifying MCC1 as an alkaliphilic bacterium. This classification is further supported by the growth kinetics observed in this study. Regarding temperature, YXS exhibits a steady increase from 26 °C to 42 °C but declines sharply from 48 °C to 50 °C. The maximum YXS values were obtained at 42 °C (27.37 ± 0.38 g g−1) and pH 10 (23.97 ± 0.08 g g−1). In contrast, the k values follow a distinct pattern: it peaks at 34 °C (0.15 ± 0.01 h−1) and at pH 4 (0.56 ± 0.07 h−1). This inverse relationship between k and YXS may reflect MCC1’s survival strategy, where accelerated metabolism under suboptimal conditions prioritizes rapid growth over biomass efficiency [54].

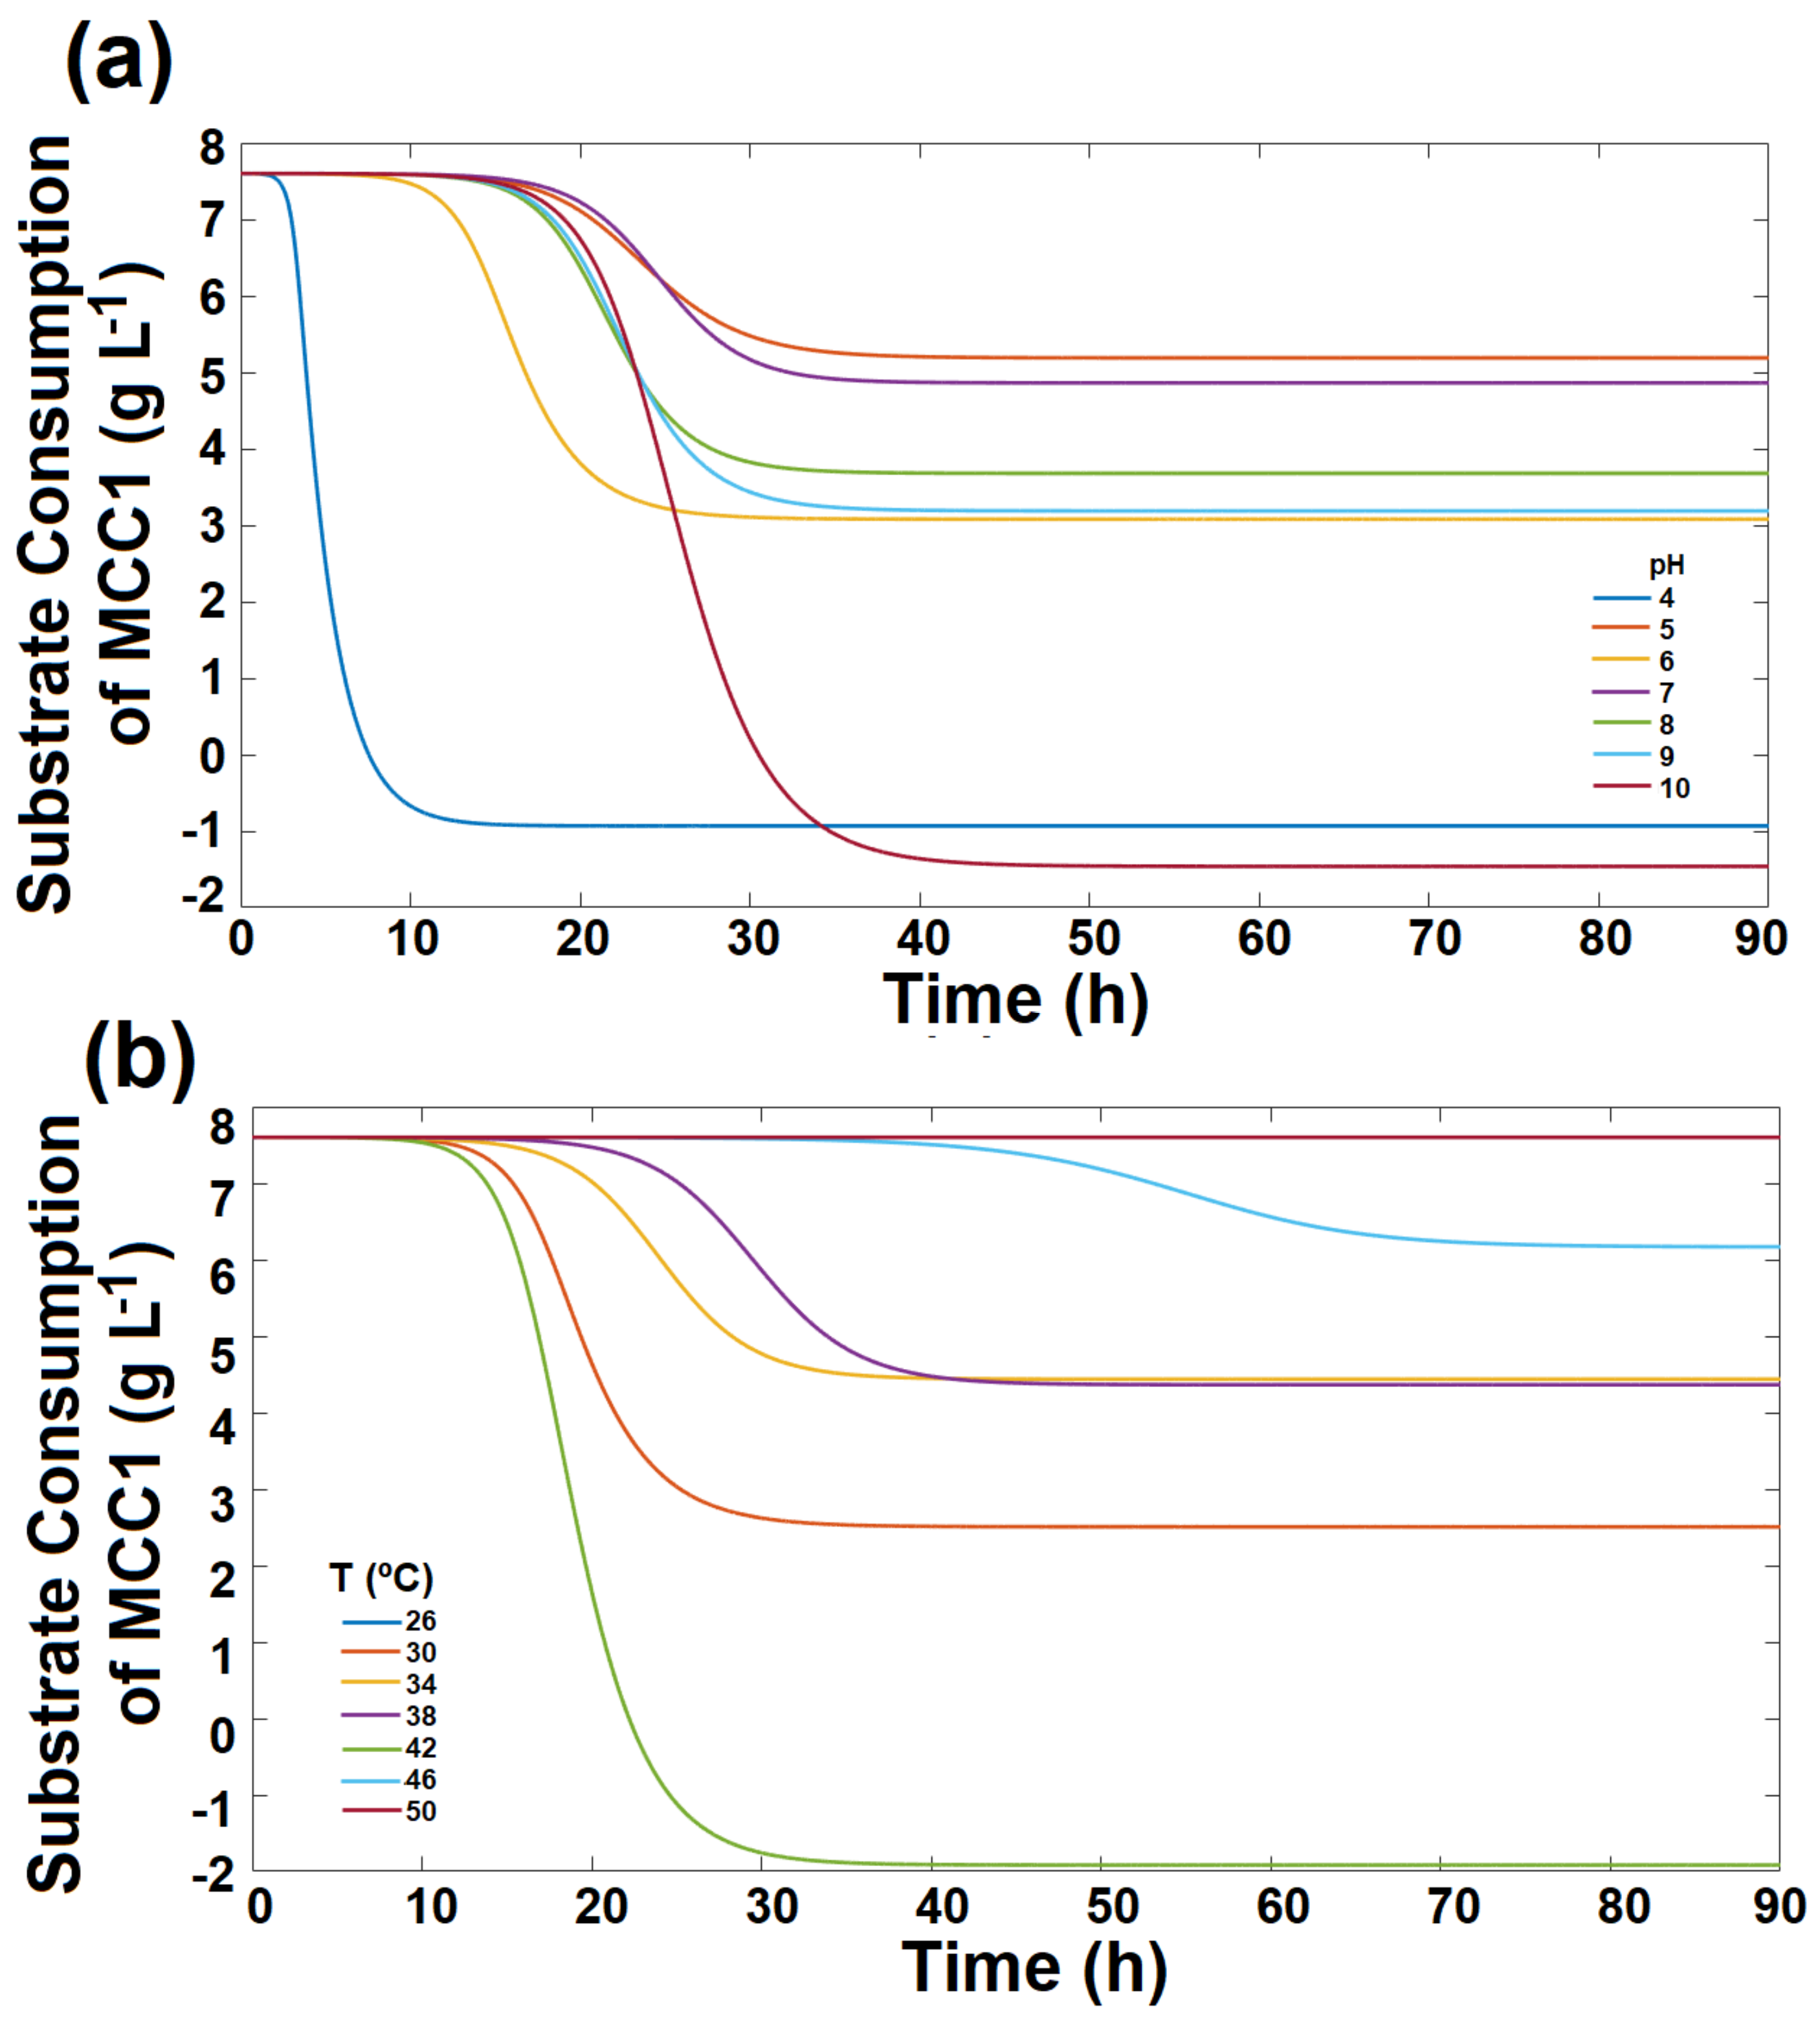
3.3. Bacterial Growth on RO Membranes

The simulated CB over time was compared with the OD600-based biomass data collected during the accelerated biofouling experiments. Figure 5 shows the predicted MCC1 growth on the RO membrane. Bacterial growth is observed at all tested pH levels, with the lowest growth occurring at pH 5 (Figure 5a). The highest growth is recorded at pH 10, which aligns with the growth kinetics trends identified in this study. However, bacterial adhesion to the membrane is influenced by multiple factors, such as operating pressure, flow rate, and crossflow dynamics [55]; thus, the growth of bacteria does not necessarily increase proportionally with pH. For desalination plants in the Sea of Cortez region, using feedwater at pH 5 is not advisable despite its lower bacterial growth, as acidic conditions may cause structural damage to the membrane, significantly reducing desalination performance [56]. Instead, a feedwater pH of 7 is recommended, as it minimizes bacterial growth while maintaining membrane stability and preventing conformational changes in the polymer structure that could affect performance [57].
Regarding bacterial growth on the membrane at different temperatures, Figure 5b shows that no growth occurred at 26 °C, likely because MCC1 was originally isolated from seawater with a typical temperature of 30 °C [13], making it difficult to grow in this environment. Similarly, no growth is observed at 50 °C, as this temperature exceeds the bacterium’s thermal tolerance. The highest growth was recorded at 42 °C, followed by 30 °C, which aligns with the bacterial growth kinetics observed in this study. At 46 °C, MCC1 exhibited reduced growth, indicating a decline in its survival capacity at this temperature. Growth at 34 °C and 38 °C was similar, but at 34 °C, exponential growth was more pronounced, likely due to the adaptive survival mechanisms. To mitigate biofouling issues, desalination plants are recommended to use feedwater at 34 °C, as this temperature slows bacterial growth on membranes. The study also indicates that pH has a greater impact on accelerating MCC1’s exponential phase than temperature, likely due to the bacterium’s response to high pressure (5.55 MPa) in biofouling test conditions. This further highlights MCC1’s ability to survive extreme environmental stress [58].
Figure 6 illustrates the prediction of substrate consumption by MCC1. At pH 4 (Figure 6a), the strain rapidly consumes the substrate, likely because it accelerates its metabolism under stressful conditions to survive. At pH 10, the MCC1 completely depletes the substrate within 30 h, as this condition supports the highest growth rate, leading to increased competition for nutrients [59]. In contrast, at pH 6, 8, and 9, the strain does not consume the entire amount of the initial substrate. This is due to the lower growth rate under these conditions and the contribution of nutrients from dead cells, which helps maintain a constant substrate level by the end of the simulation. The lowest substrate consumption occurs at pH 5 and 7, where the MCC1 exhibits the lowest growth rate, resulting in fewer cells and reduced nutrient uptake.
Regarding substrate consumption at different temperatures, Figure 6b shows that the strain does not consume substrate at 26 °C and 50 °C, which aligns with Figure 5b, as no bacterial growth occurs under these conditions. MCC1 depletes all available substrates within 22 h at 42 °C because its growth rate is the highest at this temperature. At 30 °C, 34 °C, 38 °C and 46 °C, MCC1 could not completely consume the substrate since its growth rate was insufficient to deplete it completely. These findings suggest that pH has a greater influence on MCC1 substrate consumption than temperature, indicating its survival strategies.

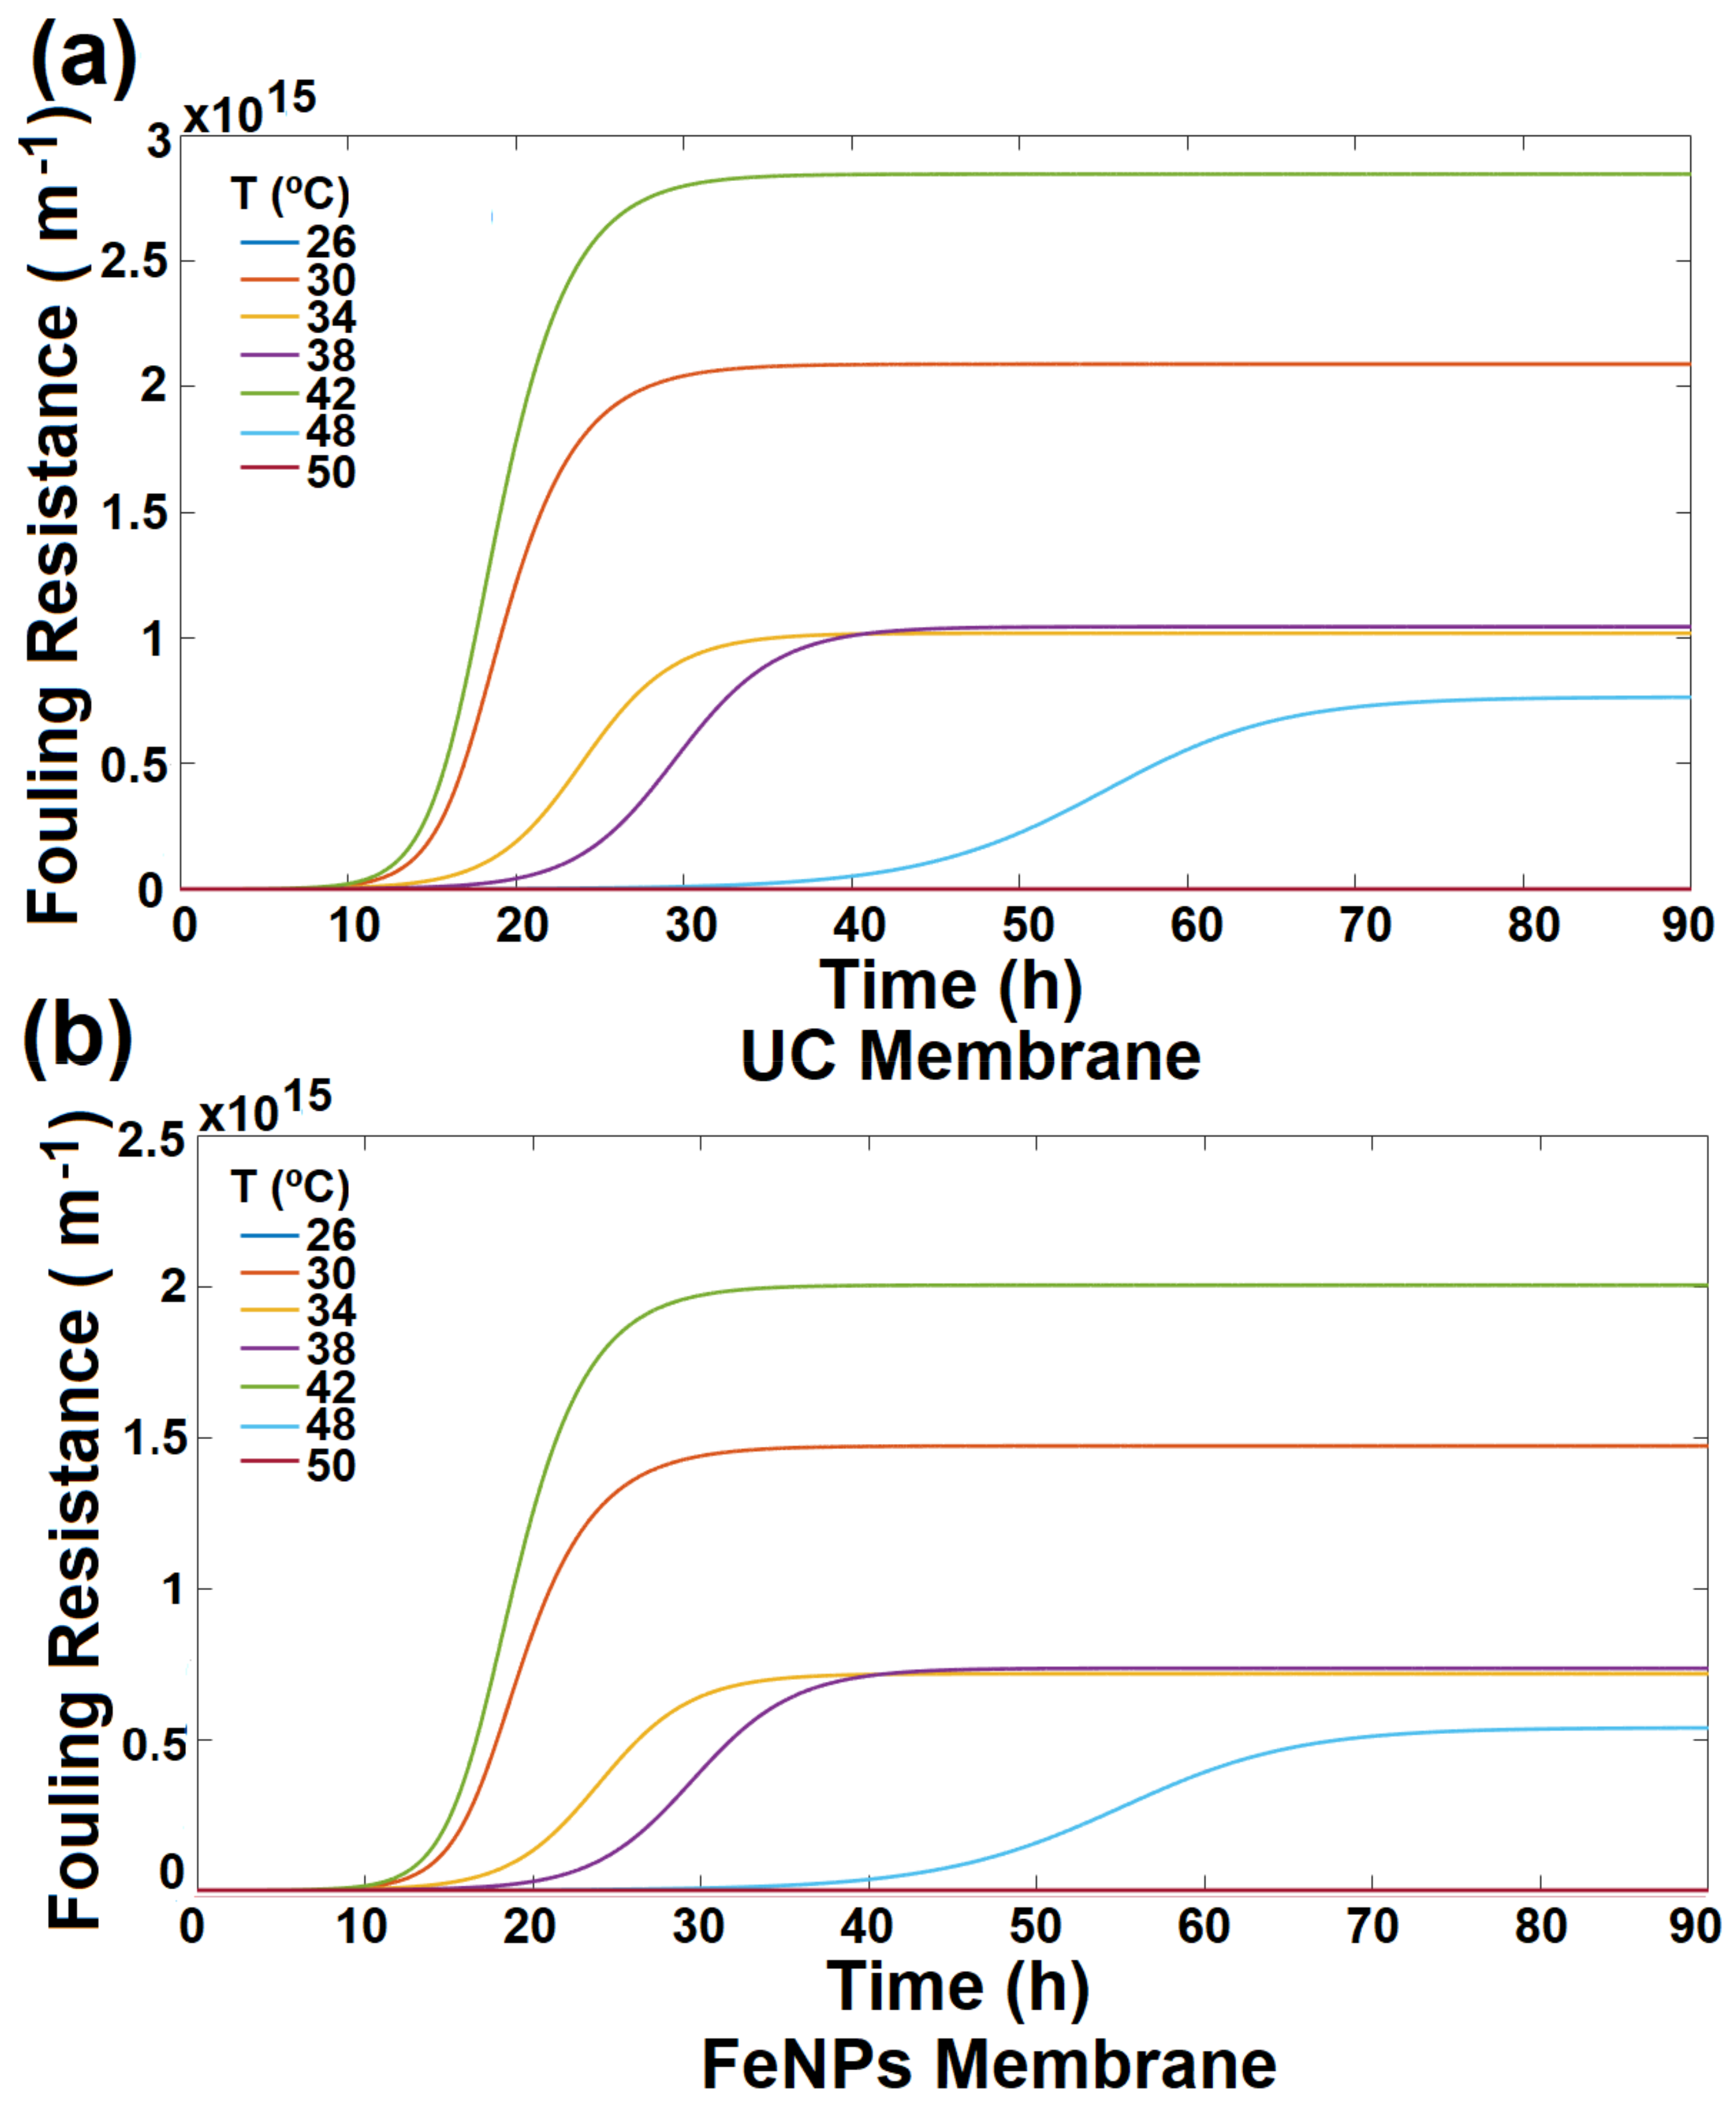
3.4. Membrane Desalination Performance

Figure 7 and Figure 8 show the membrane fouling resistance as a function of pH and temperature. A similar trend is observed in the fouling resistance of both the UC and FeNPs membranes (Figure 7) across different pH levels. Initially, the resistance is very low, but as bacterial growth progresses on the membrane, the resistance increases over time until it stabilizes. Among all the tested membranes and pH levels, the lowest resistance values are observed at pH 5 and pH 4, reflecting MCC1’s reduced growth in acidic conditions due to its alkaliphilic nature. Conversely, the highest fouling resistance is observed at pH 10 for both membranes. This aligns with MCC1’s highest growth rate occurring at pH 10, leading to biofilm formation that obstructs water flow and diminishes desalination performance.
The FeNP membrane exhibits lower fouling resistance than the UC membrane, with reductions of 44%, 40%, 40%, and 42% at pH 10, 8, 10, and 6, respectively. This reduction is likely due to the antimicrobial effect of FeNPs, which inhibits MCC1 growth and improves the desalination process. However, at pH 7, the FeNPs membrane shows a 25% increase in fouling resistance compared to the uncoated membrane. This may be because FeNPs remain in a neutral state at this pH, preventing the full activation of the Fenton reaction and reducing their biocidal potential [60]. These findings emphasize the importance of membrane coatings in minimizing fouling resistance after biofilm formation and enhancing permeate flux [61].
Regarding the temperature effects, Figure 8 shows that the membrane fouling resistance was highest at 42 °C, followed by 30 °C. This corresponds to MCC1’s peak biomass yield at 42 °C (see Table 1), which accelerates biofilm development and increases resistance by blocking water passage. The lowest resistance values are observed at 26 °C and 50 °C. At 50 °C, MCC1 did not grow (Figure 2) due to exceeding its thermal tolerance, while at 26 °C, MCC1 exhibited slow adaptation since its natural habitat temperature is around 30 °C, making metabolic functions and reproduction more difficult. The membrane resistance trends at 34 °C and 38 °C are similar, suggesting that these temperatures represent the typical feedwater range for desalination plants in this region. At 46 °C, the resistance is lower than that at 34 °C and 38 °C, likely due to MCC1’s decreasing heat tolerance, which reduces its specific growth rate.
The FeNPs membrane exhibits lower fouling resistance values than its UC membrane counterpart, with reductions of 33%, 100%, 100%, 40%, and 37.5% at 30 °C, 34 °C, 38 °C, 42 °C, and 48 °C, respectively. No comparison is available at 26 °C and 50 °C, as no bacterial growth occurred at these temperatures. These results reinforce the beneficial antimicrobial effect of the FeNP coating on MCC1 [62]. Lower membrane resistance is associated with increased permeate flux, further highlighting the advantages of FeNP coatings for desalination applications [63].
The correlation between biomass concentration and membrane fouling resistance was determined using MATLAB. Figure 9 shows that the highest fouling resistance values are found for the uncoated membrane under different pH levels (Figure 9a) and temperatures (Figure 9b), with the resistances for the FeNP-coated membrane being 44% and 27.5% lower under pH levels and temperatures, respectively, at the end of the evaluated period. This strongly suggests that FeNPs help reduce biomass accumulation on the membrane, thereby reducing resistance and potentially increasing permeate flux. These results were corroborated by experimental data obtained in a previous study. The results under different pH ranges show that the coefficient (q) is 5.8 × 10¹² for FeNPs membranes and 1 × 10¹⁴ for UC membranes, indicating an 82% reduction with the use of FeNPs. At different temperatures, the value of q for the FeNPs membrane (3.6 × 10¹²) is 29% lower than that of the UC membrane (5.1 × 10¹²). These results demonstrate the biocidal effect of FeNPs, which contributes to improving the desalination process.
In addition, the results of this simplified model demonstrate its ability to adjust the biomass concentration with specific seawater by integrating the membrane properties and operating conditions to estimate the permeate flux. Compared to more complex biofouling models that require substantial computational resources [17], this model provides a practical and accessible tool for evaluating biofouling behavior under varying operational scenarios but using seawater that is specific to the region under study. Thus, the model can provide insights into the mechanism of membrane biofouling by identifying the parameters that exhibit the greatest changes.
Figure 10 shows the permeate flux of the FeNPs and UC membranes under biofouling conditions at different pH levels (Figure 10a,b) and temperatures (Figure 10c,d), showing predictions over a 90 h period. The model indicates that the FeNPs membrane exhibits a slightly higher permeate flux than the UC membrane by the end of the tested period. This improvement is likely due to the antimicrobial properties of FeNPs, which reduce the biofilm cake layer thickness and, consequently, the fouling resistance [35], as corroborated by Figure 7 and Figure 8. In contrast, the UC membrane experiences unrestricted biofilm formation, leading to increased fouling resistance to water flow and a subsequent decline in permeate flux [64]. At different pH levels, the FeNPs membrane achieves the highest flux at pH 5, followed by pH 7, while the lowest flux is observed at pH 10. This trend aligns with the highest bacterial growth occurring at pH 10, which increases biofouling resistance and reduces flux. Therefore, maintaining the feed water at pH 7 is recommended for optimal performance in desalination plants. It is important to note that these predictions consider only biofouling; when other types of fouling (organic, inorganic, scaling, and colloidal) are considered, the permeate flux reduction is expected to be even greater [65].
Regarding temperature, the highest flux is observed at 50 °C, where Rf remains zero due to the absence of bacterial growth, allowing the flux to remain constant throughout the simulation. A similar trend is observed at 26 °C, although with a lower flux (2.7 × 10⁻⁶ m s−1) compared to 50 °C (4.9 × 10⁻⁶ m s−1). At 48 °C, the FeNPs membrane exhibits a 31% higher flux than the UC membrane, followed by similar improvements at 34 °C and 38 °C. The UC membrane follows the same general trend as the FeNPs membrane but consistently shows lower flux values since the UC membrane accumulates exponential MCC1 growth, escalating fouling resistance and flux decline [66].
Temperature significantly influences the flux by affecting the membrane structure [67] and the viscosity and density of water [68]. However, an increase in temperature does not always result in a proportional flux rise, as several factors impact permeate flux in this study, including the MCC1 growth rate, operating pressure, water viscosity, salt concentration, and flow velocity. Based on these findings, it is recommended that desalination plants maintain feedwater temperatures between 34 and 38 °C to achieve higher permeate flux, as previous studies have shown that sustained feedwater temperatures of 40 °C or higher can lead to a permanent performance decline in SWRO membranes [67].
Notably, the FeNPs membrane exhibits a slightly wider range of flux variation compared to the UC membrane over the evaluated period. This is likely due to the biocidal effect of FeNPs, which significantly reduces the biofilm cake layer. A previous study indicated that an increased temperature enhances the effectiveness of FeNP coating [13].
It is important to note that these results are influenced by specific limitations. For example, the use of a single strain does not reflect the complexity of the seawater microbiota, which affects biofilm formation dynamics. Additionally, the model assumes complete daily substrate consumption, which simplifies the nutrient availability and bacterial metabolism. The experiments were carried out under laboratory conditions. Therefore, these limitations suggest caution when extrapolating these models to full-scale applications.

4. Conclusions

Temperature and pH significantly influence the growth kinetics and biofilm development of Bacillus halotolerans MCC1 on commercial reverse osmosis (RO) membranes, directly impacting desalination performance. The kinetic growth analysis of MCC1 indicates that it is an alkalophilic and facultative thermophilic bacterium, with a maximum growth rate occurring at 42 °C and pH 10. When subjected to environmental stress, MCC1 exhibits accelerated growth as a survival mechanism, which is detrimental to RO membranes because it enhances biofilm formation and adhesion to the polyamide layer. Among the two factors, pH has a greater impact on the exponential growth rate of MCC1, highlighting the importance of closely monitoring pH levels during the pretreatment stages of desalination plants.
The relationship between MCC1 growth and temperature or pH is not strictly linear, as other operational factors in RO systems—such as pressure, crossflow velocity, and flow rate—also influence bacterial development. The highest bacterial growth was observed at 42 °C and pH 10; therefore, maintaining a feedwater pH of 7 and a temperature of 34 to 38 °C is recommended. However, this alone is insufficient to reliably mitigate MCC1 growth, as all tested temperatures and pH levels fall within a range that promotes the formation of biofilms. This underscores the necessity of implementing additional biofouling mitigation strategies.
Although the FeNP coating exhibited a strong biocidal effect and showed promise at the laboratory scale, its effectiveness at an industrial scale remains unproven. In order to gain further insights from this FeNP coating, it is recommended to conduct studies using a bacterial consortium from seawater, test long-term field trials to evaluate the performance of the coating over extended periods, and test the coating in a pilot desalination plant under varying temperatures and pH conditions to assess its real-world effectiveness and durability in dynamic operational environments. The practical implication of this model is that it can be used to predict biofouling development from a short-term experiment to determine the membrane lifetime or when cleaning is necessary. Additionally, it provides a realistic approach for estimating the operational costs of membranes with anti-biofouling properties. The model is simple, can be applied using real feed water, and requires only a short experimental period to calibrate it for long-term performance predictions.

Author Contributions

Conceptualization, M.M.A.-O. and G.A.F.W.; methodology, M.M.A.-O. and G.A.F.W. Software: M.M.A.-O. and G.A.F.W.; validation, M.M.A.-O. and G.A.F.W.; formal analysis, M.M.A.-O. and M.d.R.M.M.; investigation, M.M.A.-O. and G.A.F.W. Resources: M.M.A.-O. and G.A.F.W.; data curation, M.M.A.-O., T.R.-C., J.A.C.-P., M.P.-G. and V.H.P.E.; writing—original draft preparation, M.M.A.-O.; writing—review and editing, M.M.A.-O., G.A.F.W., M.d.R.M.M., T.R.-C., J.A.C.-P., M.P.-G., V.H.P.E.; and visualization, M.M.A.-O. and G.A.F.W. Supervision: M.M.A.-O. and G.A.F.W. Project administration: M.M.A.-O. and G.A.F.W. Funding acquisition: M.M.A.-O. and G.A.F.W. All authors have read and agreed to the published version of the manuscript.

Funding

This research was funded by the Instituto Tecnológico de Sonora through PROFAPI-2023-008 and the Cátedras CONACYT Program (Project 2338).

Data Availability Statement

The data presented in this study are available in this article.

Declaration of Generative AI and AI-Assisted Technologies in the Writing Process

During the preparation of this work the authors used chat GPT and DeepSeek in order to improve clarity and logical flow. After using this tool/service, the authors reviewed and edited the content as needed and took full responsibility for the content of the publication.

Acknowledgments

Special thanks are extended to Alan Marcelo Castro Arambula from the Instituto Tecnológico de Sonora for his technical support.

Conflicts of Interest

The authors declare that they have no known competing financial interests or personal relationships that could have appeared to influence the work reported in this paper.

Nomenclature

Variables
SymbolDescriptionUnits
CFeed water concentrationg L−1
CBBiomass concentration at a given timeg L−1
CpPermeate salt concentrationg L−1
dCB/dtChange in microbial biomass over timeg L−1 h−1
dS/dtRate of substrate concentration changeg L−1 h−1
ECElectrical conductivity of seawaterµs cm−1
gGeneration timeh per number of generations
kSpecific biomass growth rateh−1
kdSpecific death rateh−1
kmaxMaximum specific growth rateh−1
KsSubstrate consumption rate at 50% of the maximum specific growth rateg of substrate per g of biomass
KsuSubstrate constantg L−1
LpMembrane permeancem Pa−1 s−1
nGeneration numberGeneration of bacteria
N0Initial biomass concentrationg L−1
N1Biomass concentration ratio at time 1g L−1
N2Biomass concentration ratio at time 2g L−1
NnFinal biomass concentrationg L−1
qConstant obtained from the regression between Rf and CB-
RfFouling resistancem−1
RmMembrane resistancem−1
S0Substrate concentration at initial timeg L−1
SAddition of substrateg L−1
tTime intervalh
TTemperature°C, K
t1Time 1h
t2Time 2h
xBiomass concentrationg L−1
YxsTrue biomass yield from substrateg of biomass per g of substrate
ΔPTransmembrane pressurePa
Greek Symbols
SymbolDescriptionUnits
αConstant that depends on Ksu and S0.-
βExperimentally determined constant-
ϕWater osmotic factorPa L K−1 g−1
θExperimentally determined constant-
µwWater viscosityPa s
µpwPure water viscosityPa s
ΔπTransmembrane osmotic pressurePa

Appendix A

This section presents and summarizes the auxiliary equations required for bacterial growth in RO modeling described in Section 2.
The mathematical model for the modified Monod-based kinetic model describes the growth of Bacillus halotolerans MCC1 and its biofouling impact on RO membranes. This mathematical model adapted the Monod equation to include the effects of pH and temperature on bacterial activity and subtract consumption. The basic equations used are as follows:
d C B d t = k S , T , p H C B k d C B
k S , T , p H = k max S K s + S f ( T ) f ( p H )
d S d t = 1 Y x s d C B d t
where CB is the biomass concentration (g L−1), S is the limiting substrate concentration (g L−1), k is the specific biomass growth rate (h−1), kmax is the maximum specific growth rate (h−1), Ks is the substrate consumption rate at 50% of the maximum specific growth rate (g of substrate per g of biomass), kd is the specific death rate (h−1), YXS is the true biomass yield from the substrate (g of biomass per g of substrate), and f(T) and f(pH) are empirical functions for temperature and pH adjustment.
The model was determined in MATLAB (R2024a) using ODE45, and the parameters were obtained by fitting the model to the experimental bacterial growth curves using nonlinear least-squares regression. The fitting quality and model reliability were assessed using the R2 and RMSE metrics. Some modifications from the original Monod model include the integration of pH and temperature into the growth rate expression, integration of the death rate to indicate biomass loss over time, and the use of empirical functions f(T) and f(pH), derived from experimental data and validated through sensitivity analysis.
To evaluate the impact of bacterial growth on membrane performance, the permeate flux (Jv) was modeled using the Kedem–Katchalsky–Merten equation:
J v = Δ P ϕ T C C p μ w R m + R f
The variables are described in Section 2. The fouling resistance (Rf) is related to bacterial growth and Jv, and is assumed to scale linearly with biomass concentration:
R f = q C B
where q is the regression constant determined from the experimental data. To guarantee reliability, this model assumes that the substrate is fully consumed within 24 h; OD600-based biomass estimations are validated through calibration and vortexing to minimize aggregation bias; temperature, pH, and salinity values replicate real feedwater conditions in the Sea of Cortez; the linear correlation between biomass and fouling resistance is based on regression fits from experimental data; and model reliability was cross-validated against experimental results from both uncoated and FeNP-coated RO membranes.

References

  1. du Plessis, A. Water Resources from a Global Perspective. In South Africa’s Water Predicament: Freshwater’s Unceasing Decline; Springer International Publishing: Cham, Switzerland, 2023; pp. 1–25. [Google Scholar]
  2. Hong, S.; Park, K.; Kim, J.; Alayande, A.B.; Kim, Y. Seawater Reverse Osmosis (SWRO) Desalination: Energy Consumption in Plants, Advanced Low-Energy Technologies, and Future Developments for Improving Energy Efficiency; IWA Publishing: London, UK, 2023. [Google Scholar]
  3. Amin, N.A.; Elcik, H.; Alpatova, A.; Gonzalez-Gil, G.; Blankert, B.; Farhat, N.; Vrouwenvelder, J.S.; Ghaffour, N. Selected physical and chemical cleanings remove biofilm in seawater membrane distillation without causing pore wetting. NPJ Clean Water 2023, 6, 61. [Google Scholar] [CrossRef]
  4. Jafari, M.; Vanoppen, M.; van Agtmaal, J.M.C.; Cornelissen, E.R.; Vrouwenvelder, J.S.; Verliefde, A.; van Loosdrecht, M.C.M.; Picioreanu, C. Cost of fouling in full-scale reverse osmosis and nanofiltration installations in The Netherlands. Desalination 2021, 500, 114865. [Google Scholar] [CrossRef]
  5. Radu, A.; Vrouwenvelder, J.; Van Loosdrecht, M.; Picioreanu, C. Modeling the effect of biofilm formation on reverse osmosis performance: Flux, feed channel pressure drop and solute passage. J. Membr. Sci. 2010, 365, 1–15. [Google Scholar] [CrossRef]
  6. Armendáriz-Ontiveros, M.; Sethi, S.; Salinas-Rodriguez, S.; Fimbres-Weihs, G. Applications of Iron Nanoparticles on Osmotic Membrane Processes to Reduce Energy Consumption and Biofouling. In Nanomaterials for Energy Applications; CRC Press: Boca Raton, FL, USA, 2024; pp. 308–322. [Google Scholar]
  7. Gutman, J.; Herzberg, M. Cake/Biofilm Enhanced Concentration Polarization. In Encyclopedia of Membrane Science and Technology; Wiley: Hoboken, NJ, USA, 2013; pp. 1–14. [Google Scholar]
  8. Abushawish, A.; Bouaziz, I.; Almanassra, I.W.; AL-Rajabi, M.M.; Jaber, L.; Khalil, A.K.A.; Takriff, M.S.; Laoui, T.; Shanableh, A.; Atieh, M.A.; et al. Desalination Pretreatment Technologies: Current Status and Future Developments. Water 2023, 15, 1572. [Google Scholar] [CrossRef]
  9. Veza, J.M.; Ortiz, M.; Sadhwani, J.J.; Gonzalez, J.E.; Santana, F.J. Measurement of biofouling in seawater: Some practical tests. Desalination 2008, 220, 326–334. [Google Scholar] [CrossRef]
  10. Armendáriz-Ontiveros, M.M.; Fimbres Weihs, G.A.; de los Santos Villalobos, S.; Salinas-Rodriguez, S.G. Biofouling of FeNP-Coated SWRO Membranes with Bacteria Isolated after Pre-Treatment in the Sea of Cortez. Coatings 2019, 9, 462. [Google Scholar] [CrossRef]
  11. Rashkeev, S.N.; Shomar, B. A simple reaction-diffusion model for initial stages of biofouling in reverse osmosis membranes. Environ. Res. 2020, 190, 110000. [Google Scholar] [CrossRef]
  12. Abushaban, A.; Salinas-Rodriguez, S.G.; Philibert, M.; Le Bouille, L.; Necibi, M.C.; Chehbouni, A. Biofouling potential indicators to assess pretreatment and mitigate biofouling in SWRO membranes: A short review. Desalination 2022, 527, 115543. [Google Scholar] [CrossRef]
  13. Armendáriz-Ontiveros, M.M.; Álvarez-Sánchez, J.; Dévora-Isiordia, G.E.; García, A.; Fimbres Weihs, G.A. Effect of seawater variability on endemic bacterial biofouling of a reverse osmosis membrane coated with iron nanoparticles (FeNPs). Chem. Eng. Sci. 2020, 223, 115753. [Google Scholar] [CrossRef]
  14. Al Kubaish, A.; Salama, J. Impacts of Climate Change on Seawater Temperature and Total Dissolved Solids: Challenges and Sustainable Solutions for Reverse Osmosis Desalination in the Arabian Gulf Region. Comput. Water Energy Environ. Eng. 2023, 13, 86–93. [Google Scholar] [CrossRef]
  15. Hoek, E.M.V.; Weigand, T.M.; Edalat, A. Reverse osmosis membrane biofouling: Causes, consequences and countermeasures. npj Clean Water 2022, 5, 45. [Google Scholar] [CrossRef]
  16. Bucs, S.S.; Radu, A.I.; Lavric, V.; Vrouwenvelder, J.S.; Picioreanu, C. Effect of different commercial feed spacers on biofouling of reverse osmosis membrane systems: A numerical study. Desalination 2014, 343, 26–37. [Google Scholar] [CrossRef]
  17. Najid, N.; Hakizimana, J.N.; Kouzbour, S.; Gourich, B.; Ruiz-García, A.; Vial, C.; Stiriba, Y.; Semiat, R. Fouling control and modeling in reverse osmosis for seawater desalination: A review. Comput. Chem. Eng. 2022, 162, 107794. [Google Scholar] [CrossRef]
  18. Dhakal, N.; Salinas-Rodriguez, S.G.; Ampah, J.; Schippers, J.C.; Kennedy, M.D. Measuring Biofouling Potential in SWRO Plants with a Flow-Cytometry-Based Bacterial Growth Potential Method. Membranes 2021, 11, 76. [Google Scholar] [CrossRef]
  19. Maceiras, A.R.; Graca, L. Identification of Foxp3+ T Follicular Regulatory (Tfr) Cells by Flow Cytometry. In T Follicular Helper Cells: Methods and Protocols; Humana: New York, NY, USA, 2015; pp. 143–150. [Google Scholar]
  20. Drioli, E.; Criscuoli, A.; Macedonio, F. Membrane-Based Desalination: An Integrated Approach (MEDINA); IWA Publishing: London, UK, 2011. [Google Scholar]
  21. Philibert, M.; Villacorte, L.O.; Ekowati, Y.; Abushaban, A.; Salinas-Rodriguez, S.G. Fouling and scaling in reverse osmosis desalination plants: A critical review of membrane autopsies, feedwater quality guidelines and assessment methods. Desalination 2024, 592, 118188. [Google Scholar] [CrossRef]
  22. Elma, M.; Rahma, A.; Mustalifah, F.R.; Wahid, A.R.; Lamandau, D.R.; Fatimah, S.; Huda, M.S.; Alsiren, M.A.; Nasruddin; Saraswati, N.K.D.A.; et al. Nanofiltration Technology Applied for Peat and Wetland Saline Water. In Nanofiltration Membrane for Water Purification; Ahmad, A., Alshammari, M.B., Eds.; Springer Nature: Singapore, 2023; pp. 217–245. [Google Scholar]
  23. Vrouwenvelder, J.S.; Fortunato, L.; Salinas-Rodríguez, S.G.; Villacorte, L.O. Optical Coherence Tomography (OCT) as a Tool for (Bio)-fouling Assessment in Desalination Systems. In Experimental Methods for Membrane Applications in Desalination and Water Treatment; IWA Publishing: London, UK, 2024. [Google Scholar]
  24. Fortunato, L.; Bucs, S.; Linares, R.V.; Cali, C.; Vrouwenvelder, J.S.; Leiknes, T. Spatially-resolved in-situ quantification of biofouling using optical coherence tomography (OCT) and 3D image analysis in a spacer filled channel. J. Membr. Sci. 2017, 524, 673–681. [Google Scholar] [CrossRef]
  25. Fortunato, L.; Jeong, S.; Leiknes, T. Time-resolved monitoring of biofouling development on a flat sheet membrane using optical coherence tomography. Sci. Rep. 2017, 7, 15. [Google Scholar] [CrossRef]
  26. Zargar, M.; Ujihara, R.; Vogt, S.J.; Vrouwenvelder, J.S.; Fridjonsson, E.O.; Johns, M.L. Imaging of membrane concentration polarization by NaCl using 23Na nuclear magnetic resonance. J. Membr. Sci. 2020, 600, 117868. [Google Scholar] [CrossRef]
  27. Creber, S.A.; Vrouwenvelder, J.S.; van Loosdrecht, M.C.M.; Johns, M.L. Chemical cleaning of biofouling in reverse osmosis membranes evaluated using magnetic resonance imaging. J. Membr. Sci. 2010, 362, 202–210. [Google Scholar] [CrossRef]
  28. Fridjonsson, E.O.; Vogt, S.J.; Vrouwenvelder, J.S.; Johns, M.L. Early non-destructive biofouling detection in spiral wound RO membranes using a mobile earth’s field NMR. J. Membr. Sci. 2015, 489, 227–236. [Google Scholar] [CrossRef]
  29. Manalo, C.V.; Nishijima, W. Biofouling Detection on Reverse Osmosis Membranes. In Water and Wastewater Treatment Technologies; Bui, X.-T., Chiemchaisri, C., Fujioka, T., Varjani, S., Eds.; Springer: Singapore, 2019; pp. 379–402. [Google Scholar]
  30. Zhang, Z.; Li, X.; Liu, H.; Zhou, T.; Wang, Z.; Nghiem, L.D.; Wang, Q. Biofouling control of reverse osmosis membrane using free ammonia as a cleaning agent. J. Membr. Sci. 2024, 694, 122414. [Google Scholar] [CrossRef]
  31. Zeinali Heris, S.; Bagheri Khaniani, P.; Mousavi, S.B. Photocatalytic degradation of co-amoxiclav using hybrid TiO2/ZnO nanoparticles: Experimental and optimization. J. Water Process Eng. 2025, 70, 107040. [Google Scholar] [CrossRef]
  32. Rodríguez, B.E.; Armendariz-Ontiveros, M.M.; Quezada, R.; Huitrón-Segovia, E.A.; Estay, H.; García García, A.; García, A. Influence of Multidimensional Graphene Oxide (GO) Sheets on Anti-Biofouling and Desalination Performance of Thin-Film Composite Membranes: Effects of GO Lateral Sizes and Oxidation Degree. Polymers 2020, 12, 2860. [Google Scholar] [CrossRef]
  33. Zou, X.; Zhu, T.; Tang, J.; Gan, W.; Nong, G. Doping silver nanoparticles into reverse osmosis membranes for antibacterial properties. e-Polymers 2023, 23, 20228087. [Google Scholar] [CrossRef]
  34. Torres-Valenzuela, P.G.; Álvarez-Sánchez, J.; Dévora-Isiordia, G.E.; Armendáriz-Ontiveros, M.M.; del Rosario Martínez-Macias, M.; Pérez-Sicairos, S.; Sánchez-Duarte, R.G.; Fimbres Weihs, G.A. Modification and characterization of TFC membranes with Ag nanoparticles: Application in seawater desalination. Polym. Bull. 2023, 80, 6285–6306. [Google Scholar] [CrossRef]
  35. Armendáriz-Ontiveros, M.M.; García-García, A.; Mai-Prochnow, A.; Fimbres Weihs, G.A. Optimal loading of iron nanoparticles on reverse osmosis membrane surface to reduce biofouling. Desalination 2022, 540, 115997. [Google Scholar] [CrossRef]
  36. Global Water Intelligent (GWI). Desalting Plant Inventory. 2022. Available online: https://www.desaldata.com/ (accessed on 15 March 2023).
  37. Armendariz Ontiveros, M.M.; Quintero, Y.; Llanquilef, A.; Morel, M.; Argentel Martínez, L.; García García, A.; Garcia, A. Anti-Biofouling and Desalination Properties of Thin Film Composite Reverse Osmosis Membranes Modified with Copper and Iron Nanoparticles. Materials 2019, 12, 2081. [Google Scholar] [CrossRef]
  38. Carnathan, B.J.; Stevens, D.; Shikha, S.; Slater, C.; Byford, N.; Sturdivant, R.X.; Zarzosa, K.; Braswell, W.E.; Sayes, C.M. Assessing the Effects of Surface-Stabilized Zero-Valent Iron Nanoparticles on Diverse Bacteria Species Using Complementary Statistical Models. J. Funct. Biomater. 2025, 16, 113. [Google Scholar] [CrossRef]
  39. Mahlangu, O.T.; Motsa, M.M.; Richards, H.; Mamba, B.B.; George, M.J.; Nthunya, L.N. The impact of nanoparticle leach on sustainable performance of the membranes—A critical review. Environ. Nanotechnol. Monit. Manag. 2024, 22, 100984. [Google Scholar] [CrossRef]
  40. Koch, A.L. The Monod Model and Its Alternatives. In Mathematical Modeling in Microbial Ecology; Koch, A.L., Robinson, J.A., Milliken, G.A., Eds.; Springer: Boston, MA, USA, 1998; pp. 62–93. [Google Scholar]
  41. Armendáriz-Ontiveros, M.M.; García García, A.; de los Santos Villalobos, S.; Fimbres Weihs, G.A. Biofouling performance of RO membranes coated with Iron NPs on graphene oxide. Desalination 2019, 451, 45–58. [Google Scholar] [CrossRef]
  42. Doran, P.M. Bioprocess Engineering Principles; Elsevier: Amsterdam, The Netherlands, 1995. [Google Scholar]
  43. Kedem, O.; Katchalsky, A. Thermodynamic analysis of the permeability of biological membranes to non-electrolytes. Biochim. Biophys. Acta 1958, 27, 229–246. [Google Scholar] [CrossRef] [PubMed]
  44. Suzuki Valenzuela, M.F.; Sánchez Soto, F.; Armendáriz-Ontiveros, M.M.; Sosa-Tinoco, I.M.; Fimbres Weihs, G.A. Improving thermal distribution in water-cooled PV modules and its effect on RO permeate recovery. Water 2021, 13, 229. [Google Scholar] [CrossRef]
  45. Das, T.; Al-Tawaha, A.R.; Pandey, D.K.; Nongdam, P.; Shekhawat, M.S.; Dey, A.; Choudhary, K.; Sahay, S. Halophilic, Acidophilic, Alkaliphilic, Metallophilic, and Radioresistant Fungi: Habitats and Their Living Strategies. In Extremophilic Fungi: Ecology, Physiology and Applications; Sahay, S., Ed.; Springer Nature: Singapore, 2022; pp. 171–193. [Google Scholar]
  46. Kevbrin, V.V. Isolation and Cultivation of Alkaliphiles. In Alkaliphiles in Biotechnology; Mamo, G., Mattiasson, B., Eds.; Springer International Publishing: Cham, Switzerland, 2020; pp. 53–84. [Google Scholar]
  47. Mangrola, A.V.; Patel, R.K.; Dudhagara, P.; Gandhi, H.; Ghelani, A.; Jain, K.R.; Shah, H.; Mevada, V.A. Thermophiles: Physiology, Metabolism, Enzymology, and Adaptation Mechanisms. In Physiology, Genomics, and Biotechnological Applications of Extremophiles; IGI Global: Hershey, PA, USA, 2022; pp. 65–93. [Google Scholar]
  48. Kumar, R.; Pundir, S. Bacterial cell, classification and required essential contents for growth. Asian J. Pharm. Technol. 2021, 11, 181–187. [Google Scholar] [CrossRef]
  49. Ghosh, S.; Lepcha, K.; Basak, A.; Mahanty, A.K. Chapter 16—Thermophiles and thermophilic hydrolases. In Physiological and Biotechnological Aspects of Extremophiles; Salwan, R., Sharma, V., Eds.; Academic Press: Cambridge, MA, USA, 2020; pp. 219–236. [Google Scholar]
  50. DuPont, W.S. FilmTec™ SW30 Seawater Elements, Product Data Sheet. 2024. Available online: https://www.dupont.com/content/dam/water/amer/us/en/water/public/documents/en/RO-FilmTec-SW30-Seawater-PDS-45-D01519-en.pdf (accessed on 29 April 2024).
  51. Maddah, H.; Chogle, A. Biofouling in reverse osmosis: Phenomena, monitoring, controlling and remediation. Appl. Water Sci. 2017, 7, 2637–2651. [Google Scholar] [CrossRef]
  52. Ranieri, L.; Esposito, R.; Nunes, S.P.; Vrouwenvelder, J.S.; Fortunato, L. Biofilm rigidity, mechanics and composition in seawater desalination pretreatment employing ultrafiltration and microfiltration membranes. Water Res. 2024, 253, 121282. [Google Scholar] [CrossRef]
  53. Pal, A.; Bhattacharjee, S.; Saha, J.; Sarkar, M.; Mandal, P. Bacterial survival strategies and responses under heavy metal stress: A comprehensive overview. Crit. Rev. Microbiol. 2022, 48, 327–355. [Google Scholar] [CrossRef]
  54. Yu, F.; Zhao, C.; Li, K.; Su, L.; Zhang, S.; Yue, Q.; Zhao, L. Salt-tolerant mechanism and application of salt-tolerant bacteria. In Proceedings of the 2022 International Conference on Green Environmental Materials and Food Engineering, Gemfe, Tianjin, China, 26–27 March 2022; pp. 111–116. [Google Scholar]
  55. Tawalbeh, M.; Qalyoubi, L.; Al-Othman, A.; Qasim, M.; Shirazi, M. Insights on the development of enhanced antifouling reverse osmosis membranes: Industrial applications and challenges. Desalination 2023, 553, 116460. [Google Scholar] [CrossRef]
  56. Hoang, T.; Stevens, G.; Kentish, S. The effect of feed pH on the performance of a reverse osmosis membrane. Desalination 2010, 261, 99–103. [Google Scholar] [CrossRef]
  57. Kimani, E.M.; Pranić, M.; Porada, S.; Kemperman, A.J.B.; Ryzhkov, I.I.; van der Meer, W.G.J.; Biesheuvel, P.M. The influence of feedwater pH on membrane charge ionization and ion rejection by reverse osmosis: An experimental and theoretical study. J. Membr. Sci. 2022, 660, 120800. [Google Scholar] [CrossRef]
  58. Armendáriz-Ontiveros, M.M.; Villegas-Peralta, Y.; Madueño-Moreno, J.E.; Álvarez-Sánchez, J.; Dévora-Isiordia, G.E.; Sánchez-Duarte, R.G.; Madera-Santana, T.J. Modification of Thin Film Composite Membrane by Chitosan–Silver Particles to Improve Desalination and Anti-Biofouling Performance. Membranes 2022, 12, 851. [Google Scholar] [CrossRef]
  59. Dai, T.; Wen, D.; Bates, C.T.; Wu, L.; Guo, X.; Liu, S.; Su, Y.; Lei, J.; Zhou, J.; Yang, Y. Nutrient supply controls the linkage between species abundance and ecological interactions in marine bacterial communities. Nat. Commun. 2022, 13, 175. [Google Scholar] [CrossRef] [PubMed]
  60. Ahmed, N.; Vione, D.; Rivoira, L.; Carena, L.; Castiglioni, M.; Bruzzoniti, M.C. A Review on the Degradation of Pollutants by Fenton-Like Systems Based on Zero-Valent Iron and Persulfate: Effects of Reduction Potentials, pH, and Anions Occurring in Waste Waters. Molecules 2021, 26, 4584. [Google Scholar] [CrossRef] [PubMed]
  61. Desmond, P.; Huisman, K.T.; Sanawar, H.; Farhat, N.M.; Traber, J.; Fridjonsson, E.O.; Johns, M.L.; Flemming, H.-C.; Picioreanu, C.; Vrouwenvelder, J.S. Controlling the hydraulic resistance of membrane biofilms by engineering biofilm physical structure. Water Res. 2022, 210, 118031. [Google Scholar] [CrossRef]
  62. Egorova, A.; Xia, B.; Vyas, H.K.N.; Armendáriz-Ontiveros, M.M.; Lin, Y.-C.; Garcia-Garcia, A.; Wang, D.K.; Cullen, P.J.; Fimbres Weihs, G.; Mai-Prochnow, A. Iron nanoparticle coating and plasma-activated water cleaning as a biofouling removal method for reverse osmosis membranes suitable for desalination. J. Water Process Eng. 2024, 59, 105043. [Google Scholar] [CrossRef]
  63. Bonyadi, E.; Niknejad, A.S.; Ashtiani, F.Z.; Bazgir, S.; Kargari, A. A well-designed polystyrene/polycarbonate membrane for highly saline water desalination using DCMD process. Desalination 2022, 528, 115604. [Google Scholar] [CrossRef]
  64. Qamar, A.; Kerdi, S.; Amin, N.; Zhang, X.; Vrouwenvelder, J.; Ghaffour, N. A deep neural networks framework for in-situ biofilm thickness detection and hydrodynamics tracing for filtration systems. Sep. Purif. Technol. 2022, 301, 121959. [Google Scholar] [CrossRef]
  65. Ahmed, M.A.; Amin, S.; Mohamed, A.A. Fouling in reverse osmosis membranes: Monitoring, characterization, mitigation strategies and future directions. Heliyon 2023, 9, e14908. [Google Scholar] [CrossRef]
  66. Zhang, W.; Liang, W.; Jin, J.; Meng, S.; He, Z.; Ali, M.; Saikaly, P.E. Filtration performance of biofilm membrane bioreactor: Fouling control by threshold flux operation. Chemosphere 2024, 362, 142458. [Google Scholar] [CrossRef]
  67. Altmann, T.; Buijs, P.J.; Farinha, A.S.F.; Borges, V.R.P.; Farhat, N.M.; Vrouwenvelder, J.S.; Das, R. Seawater Reverse Osmosis Performance Decline Caused by Short-Term Elevated Feed Water Temperature. Membranes 2022, 12, 792. [Google Scholar] [CrossRef]
  68. Armendáriz-Ontiveros, M.M.; Dévora-Isiordia, G.E.; Rodríguez-López, J.; Sánchez-Duarte, R.G.; Álvarez-Sánchez, J.; Villegas-Peralta, Y.; Martínez-Macias, M.d.R. Effect of Temperature on Energy Consumption and Polarization in Reverse Osmosis Desalination Using a Spray-Cooled Photovoltaic System. Energies 2022, 15, 7787. [Google Scholar] [CrossRef]
Figure 1. Growth kinetics of B. halotolerans MCC1 at different pH values.
Processes 13 01422 g001
Figure 2. Growth kinetics of B. halotolerans MCC1 under different temperature conditions.
Processes 13 01422 g002
Figure 3. The generation time of the strain MCC1 at different pHs levels. g: generation time. r: correlation coefficient. p: probability. R2: coefficient of determination without adjustment.
Processes 13 01422 g003
Figure 4. The generation time of strain MCC1 at different temperatures. g: generation time. T: temperature; r: correlation coefficient. p: probability. R2: coefficient of determination without adjustment.
Processes 13 01422 g004
Figure 5. Growth prediction of the strain MCC1 on the RO membrane under different (a) pH and (b) temperature conditions.
Processes 13 01422 g005
Figure 6. Substrate consumption prediction of the strain MCC1 on the RO membrane under different (a) pH and (b) temperature conditions.
Processes 13 01422 g006
Figure 7. Simulation of membrane resistance at different pH values: (a) Uncoated membrane and (b) FeNPs membrane.
Processes 13 01422 g007
Figure 8. Simulation of membrane resistance at different temperatures: (a) Uncoated membrane and (b) FeNPs membrane.
Processes 13 01422 g008
Figure 9. Effect of biomass concentration on fouling resistance of the membranes under different: (a) pH levels and (b) temperatures.
Processes 13 01422 g009
Figure 10. Permeate flux under biofouling conditions (a) UC membrane and FeNPs membrane under pH levels conditions; (b) Detailed flux view of UC membrane and FeNPs membrane under pH levels conditions; (c) UC membrane and FeNPs membrane under temperature conditions and (d) Detailed flux view of UC membrane and FeNPs membrane under temperature conditions.
Processes 13 01422 g010
Table 1. Growth kinetics parameters for Bacillus Halotolerance MCC1.
T
(°C)
k
(h−1)
YXS
(g g−1)
ILP
(h)
FLP
(h)
pHk
(h−1)
YXS
(g g−1)
ILP
(h)
FLP
(h)
260.11 ± 0.0112.72 ± 0.0621640.56 ± 0.0713.35 ± 0.06615
300.14 ± 0.0217.31 ± 0.5121650.37 ± 0.0414.74 ± 0.01313
340.15 ± 0.0120.91 ± 0.0131460.16 ± 0.0516.36 ± 0.07417
380.14 ± 0.0222.45 ± 0.2721470.17 ± 0.0419.63 ± 0.06516
420.12 ± 0.0527.37 ± 0.3821880.15 ± 0.0119.33 ± 0.09317
480.13 ± 0.0315.49 ± 0.2051790.14 ± 0.0520.23 ± 0.09316
500.00 ± 0.0000.00 ± 0.0000100.11 ± 0.0323.97 ± 0.08118
g g−1 = grams of biomass per grams of substrate; ILP = Initial Time of Log Phase; FLP = Final Time of Log Phase.
Disclaimer/Publisher’s Note: The statements, opinions and data contained in all publications are solely those of the individual author(s) and contributor(s) and not of MDPI and/or the editor(s). MDPI and/or the editor(s) disclaim responsibility for any injury to people or property resulting from any ideas, methods, instructions or products referred to in the content.

