Article

Effects of Supercritical CO2 Immersion Time on CO2/CH4 Gas Seepage Characteristics in Coal

1
Chinese Institute of Coal Science, Beijing 100013, China
2
Shaanxi Coal Industry Company Limited, Xi’an 710054, China
3
Huangling Mining Group Company Limited, Yan’an 727307, China
4
College of Safety Science and Engineering, Xi’an University of Science and Technology, Xi’an 710054, China
5
College of Safety Science and Engineering, Henan Polytechnic University, Jiaozuo 454003, China
*
Author to whom correspondence should be addressed.
Processes 2025, 13(5), 1419; https://doi.org/10.3390/pr13051419
Submission received: 20 March 2025 / Revised: 20 April 2025 / Accepted: 21 April 2025 / Published: 7 May 2025

Abstract

:
Low permeability has always limited the efficient extraction of coalbed methane (CBM) in China. To investigate the permeability enhancement effect of supercritical CO2 on coal seams, experiments were conducted using a self-developed supercritical CO2 immersion system and a single-component gas (CO2 and CH4) seepage experimental apparatus, considering different immersion times and injection pressures. The gas seepage characteristics of CO2 and CH4 in coal seams were studied under various conditions. Additionally, nuclear magnetic resonance (NMR) was used to obtain the porosity components of the coal samples at different immersion times. The changes in permeability before and after the experiment were compared to analyze the permeability enhancement effect of supercritical CO2 on the coal samples. The results show that the original porosity of the coal sample was 2.06%. After 5, 10, 15, and 20 days of immersion, the porosity of the coal samples increased by 2.78%, 3.26%, 3.22%, and 2.86%, respectively. After immersion in supercritical CO2, the porosity exhibited a trend of initially increasing and then decreasing. During the single-component gas seepage experiment following supercritical CO2 immersion, the outlet flow rates of both CO2 and CH4 reached their maximum on the 10th day of immersion. Compared with the 0-day immersion, the outlet flow rates of CO2 and CH4 increased by 4.49 times and 3.23 times, respectively. After immersion, the CH4 permeability within the coal sample was stronger than that of CO2.

1. Introduction

Coal is one of the main energy sources in our country, and China is also one of the world’s most coal-rich nations [1,2,3]. Mine gas (coalbed methane) disasters are one of the major hazards in coal mines [4,5]. Due to the complex structure of coal seams, high degree of metamorphism, soft coal quality, and low permeability in our country, pre-mining gas extraction from original coal seams is difficult [6,7]. Efficient reservoir modification technologies are urgently needed for economically viable development [8]. Currently, methods such as intensive drilling, hydraulic fracturing, hydraulic jetting, hydraulic slitting, and gas injection fracturing are used to improve the recovery rate of coalbed methane [9,10]. Although certain achievements have been made, these technologies still exhibit inherent limitations. For instance, the intensive borehole drainage technique suffers from issues such as excessive drilling workload, borehole collapse or clogging, and poor geological adaptability. Conventional large-scale hydraulic fracturing, a key method for enhancing coalbed methane production, is constrained by its high water consumption, potential reservoir damage, water-blocking effects, and risks of groundwater contamination [11]. More critically, the hydraulic fracturing process may induce seismic events, exacerbating environmental and safety concerns.
In recent years, waterless fracturing technologies (e.g., CO2/liquid N2 gas-phase fracturing) have emerged as a promising direction for unconventional gas extraction worldwide. To address the challenges of low-permeability coal seam gas drainage, researchers have proposed injecting CO2 into coal seams. This approach leverages the higher adsorption affinity of coal for CO2 compared with methane, thereby displacing the adsorbed methane and enhancing coalbed methane recovery [12]. However, while this method demonstrates short-term permeability improvement, it is primarily suitable for localized gas control in underground coal mines rather than large-scale field applications. To address the aforementioned challenges, supercritical CO2 fracturing technology has emerged. Supercritical CO2 refers to a fluid with a temperature greater than 31.1 °C and pressure exceeding 7.38 MPa [13]. This fluid not only possesses the high-density characteristics of a liquid but also has the low-viscosity characteristics of a liquid [13]. Additionally, it exhibits exceptional flow and permeability properties, as well as the ability to extract small molecular compounds from coal. Injecting supercritical CO2 into coal seams can, on the one hand, further promote the effective development of the coal seam fracture system during coalbed methane extraction, increasing the flow channels for coalbed methane. On the other hand, it can reduce the partial pressure and enhance the desorption rate of coalbed methane from the coal matrix. As a result, there is an increasing demand for injecting supercritical CO2 into low-permeability coal seams for coalbed methane extraction, offering promising prospects for application and development.
Y Yu and others [14] conducted experimental studies on the flow, permeability, and adsorption of supercritical CO2 in coal seams, considering the influence of the injection pressure and temperature. They compared the changes in the longitudinal wave velocity of the samples before and after the experiments. Jiang R and others [15] performed geochemical interaction experiments with typical high-ash coal and CO2, investigating the changes in water-soluble elements after the interaction with supercritical CO2. Niu Q and colleagues [16] injected supercritical CO2 into coal samples of different ranks for permeability testing, and their results showed that the permeability of coal is related to its rank. In particular, medium-rank coals, which have more fractures generated during coalification, showed the least effect on permeability after cyclic loading/unloading. Hashemi S S [17] studied the impact of supercritical CO2 on the fracture permeability and surface characteristics of shale with different compositions. Li W and others [18] conducted a series of studies on naturally fractured coal, coal adsorbing supercritical CO2 for different periods, and a high-pressure triaxial apparatus with supercritical CO2. They found that the coal treated with supercritical CO2 exhibited a well-connected pore system, with an increased proportion of mesopores and macropores, as well as an overall increase in pore volume.
In summary, current research both domestically and internationally is largely focused on the geochemical reactions of supercritical CO2 with coal and its impact on the coal’s permeability. These studies have demonstrated the potential of supercritical CO2 in enhancing coal seam permeability and improving gas extraction efficiency. The findings highlight how CO2 affects the structural characteristics of coal, such as the pore distribution and connectivity, thereby increasing the recovery of coalbed methane in low-permeability coal seams. However, there is still limited research on the permeability changes following the dissolution of coal with supercritical CO2. This study focused on the 8# coal of the Benxi Formation in the Ordos Basin and conducted supercritical CO2 solvent immersion treatments on coal pillar samples for different durations. Permeability experiments on coal pillar samples were carried out to investigate the relationship between the treatment duration, gas seepage pressure gradient, and permeability parameters. In conjunction with NMR technology, the impact of the immersion time on the coal body porosity was analyzed. The findings of this study contribute to enriching the theoretical foundation for enhancing coalbed methane recovery and geological storage using supercritical CO2.

2. Experimental Methods

2.1. Subsection

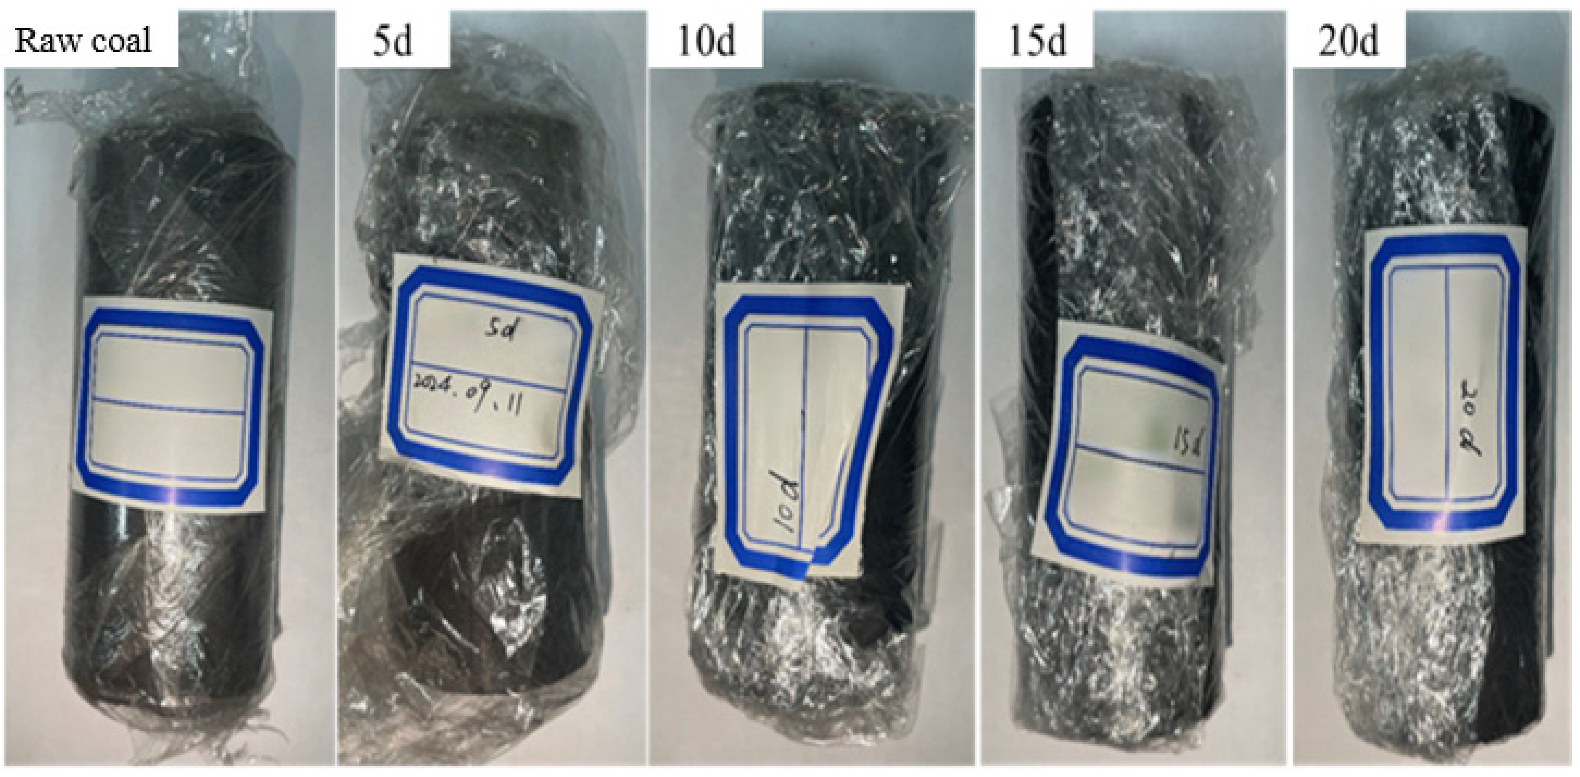
2.1.1. Coal Sample Selection and Pretreatment

In this experiment, coal samples from the Benxi Formation 8# coal seam of the Upper Paleozoic coal-bearing strata in the Ordos Basin were selected. The raw coal was immediately sealed in fresh-keeping film after being extracted from the mine to prevent damage during transportation and to ensure the coal sample maintained its original structure. Using a core-drilling machine, the raw coal was processed along the vertical bedding direction into cylindrical specimens with a diameter of 10 mm and a height of 20 mm. Only coal samples with smooth surfaces and no obvious cracks were selected for the dissolution and permeability experiment. The coal composition information is shown in Table 1.
To study the effect of supercritical CO2 dissolution on the permeability characteristics of coal before and after treatment, the coal samples were first subjected to a drying pre-treatment in a drying oven at 70 °C. The coal samples were weighed every 3 h, and if the weight change was less than 0.01 g or the weight remained unchanged for two consecutive measurements, the samples were considered to be fully dried. Next, 200-mesh fine sandpaper was used to grind and polish the coal surface to remove any impurities. Finally, the prepared coal samples were placed into the dissolution chamber for the supercritical CO2 dissolution experiment. After a certain period of dissolution, the samples were subjected to CO2 permeability experiments to evaluate the changes in their permeability.

2.1.2. Experimental Program

(1)
Coal samples in supercritical CO2 medium solution leaching treatment
The treatment of coal samples with supercritical CO2 dissolution was conducted using a supercritical CO2 dissolution experimental system, as shown in Figure 1.
This system consisted of a CO2 gas cylinder (40 L), a CO2 storage tank with a viewing window (with a maximum withstand pressure of 30 MPa and a volume of 2.2 L), a high-temperature circulator (0–90 °C, with a temperature control accuracy of ±0.5 °C), a heating and cooling circulator (−40 °C–80 °C, with a temperature control accuracy of ±0.3 °C), pressure sensors (0–20 MPa; with an accuracy of 0.2% FS), temperature sensors (−50 °C–200 °C, with an accuracy of ±0.2 °C), a vacuum pump (1400 r/min; 220 v), a pressure-regulating valve (R21-1/4-4P), a safety valve (DN10-25 mm), and a data acquisition system (64 channels), among other components. During the experiment, supercritical CO2 was supplied from the gas cylinder through a booster pump and heating–cooling circulator, which worked together to pressurize and heat the CO2. An online intelligent temperature controller (with an accuracy of 0.1 grade and a display size of 7 inches) was used to collect pressure and temperature signals throughout the experimental process.
The specific method for dissolving the coal samples in the supercritical CO2 medium was as follows: The dried coal samples were placed into a high-pressure dissolution storage tank. Supercritical CO2 was then injected into the tank until the coal samples were fully submerged. After the set soaking time, the coal samples were removed from the tank and placed into vacuum bags for sealed storage. The dissolution procedure is outlined in Table 2.
(2)
Permeability experiment of coal samples after immersion under single-component gas (CO2/CH4) conditions.
This experiment used a single-component CO2 and CH4 percolation experimental setup, as shown in Figure 2.
The setup consisted of six main units: the gas supply unit, gas pressurization unit, confining pressure loading unit, clamp, back-pressure unit, and data acquisition unit.
The gas supply unit was composed of a CO2 gas cylinder (40 L).
The gas pressurization unit consisted of an air compressor, booster pump, and pressure-regulating valve.
The confining pressure loading unit was composed of a self-developed hand-operated pump device.
The back-pressure unit was composed of a self-developed back-pressure valve.
The data acquisition unit included a Coriolis mass flowmeter, flow sensors, and a 64-channel data acquisition system.
The percolation experimental method for the coal samples after impregnation under single-component CO2 and CH4 gas conditions was as follows: The cylindrical coal samples, before and after supercritical CO2 impregnation, were placed into the test vessel. Firstly, a CO2 percolation experiment was conducted using the single-component gas percolation experimental setup. Pressure- and flow-monitoring devices were installed to collect real-time pressure and flow data at both the gas injection and outlet points. After each experiment, the coal column was replaced, and CH4 gas was injected. The pressure and gas flow changes during the percolation process were recorded in real time. The tests were repeated for coal samples with different impregnation times. The tested coal samples are shown in Figure 3, and the CO2 and CH4 gas percolation experimental scheme is shown in Table 3.
During the gas injection process, the gas compressibility factor changed with the increase in the gas injection pressure, making it difficult to describe the gas migration process in the coal column using a fixed volumetric flow rate. Therefore, the average outlet flow rate was introduced to solve this problem. Assuming the average pore pressure was the average value of the coal column injection pressure and outlet pressure, according to Boyle’s law, we can obtain Equation (1) [19].
P 1 + P 2 2 Q ¯ = P 2 Q 2
In Equation (1), P1 and P2 represent the inlet and outlet pressures at both ends of the coal column (MPa); the average outlet gas flow rate is represented as Q ¯ (mL); and the outlet gas flow rate is represented as Q2 (mL).
During the gas injection process, it can be assumed that the average outlet gas flow rate is linearly related to the pressure gradient. Therefore, it is assumed that the gas percolation process within the coal column follows Darcy’s law. By substituting Equation (1) into Darcy’s law, we can obtain Equation (2) [20].
k = μ L Q ¯ P 1 P 2 A = 2 μ Q P α L P 1 2 P 2 2 A
In Equation (2), k is the permeability of the experimental fluid (10–15 m2); μ is the dynamic viscosity of the experimental fluid (μ Pa·s); Q is the fluid flow rate (ml); is the standard atmospheric pressure (0.1 MPa); L is the length of the coal column specimen (cm); and A is the cross-sectional area of the specimen (cm2).

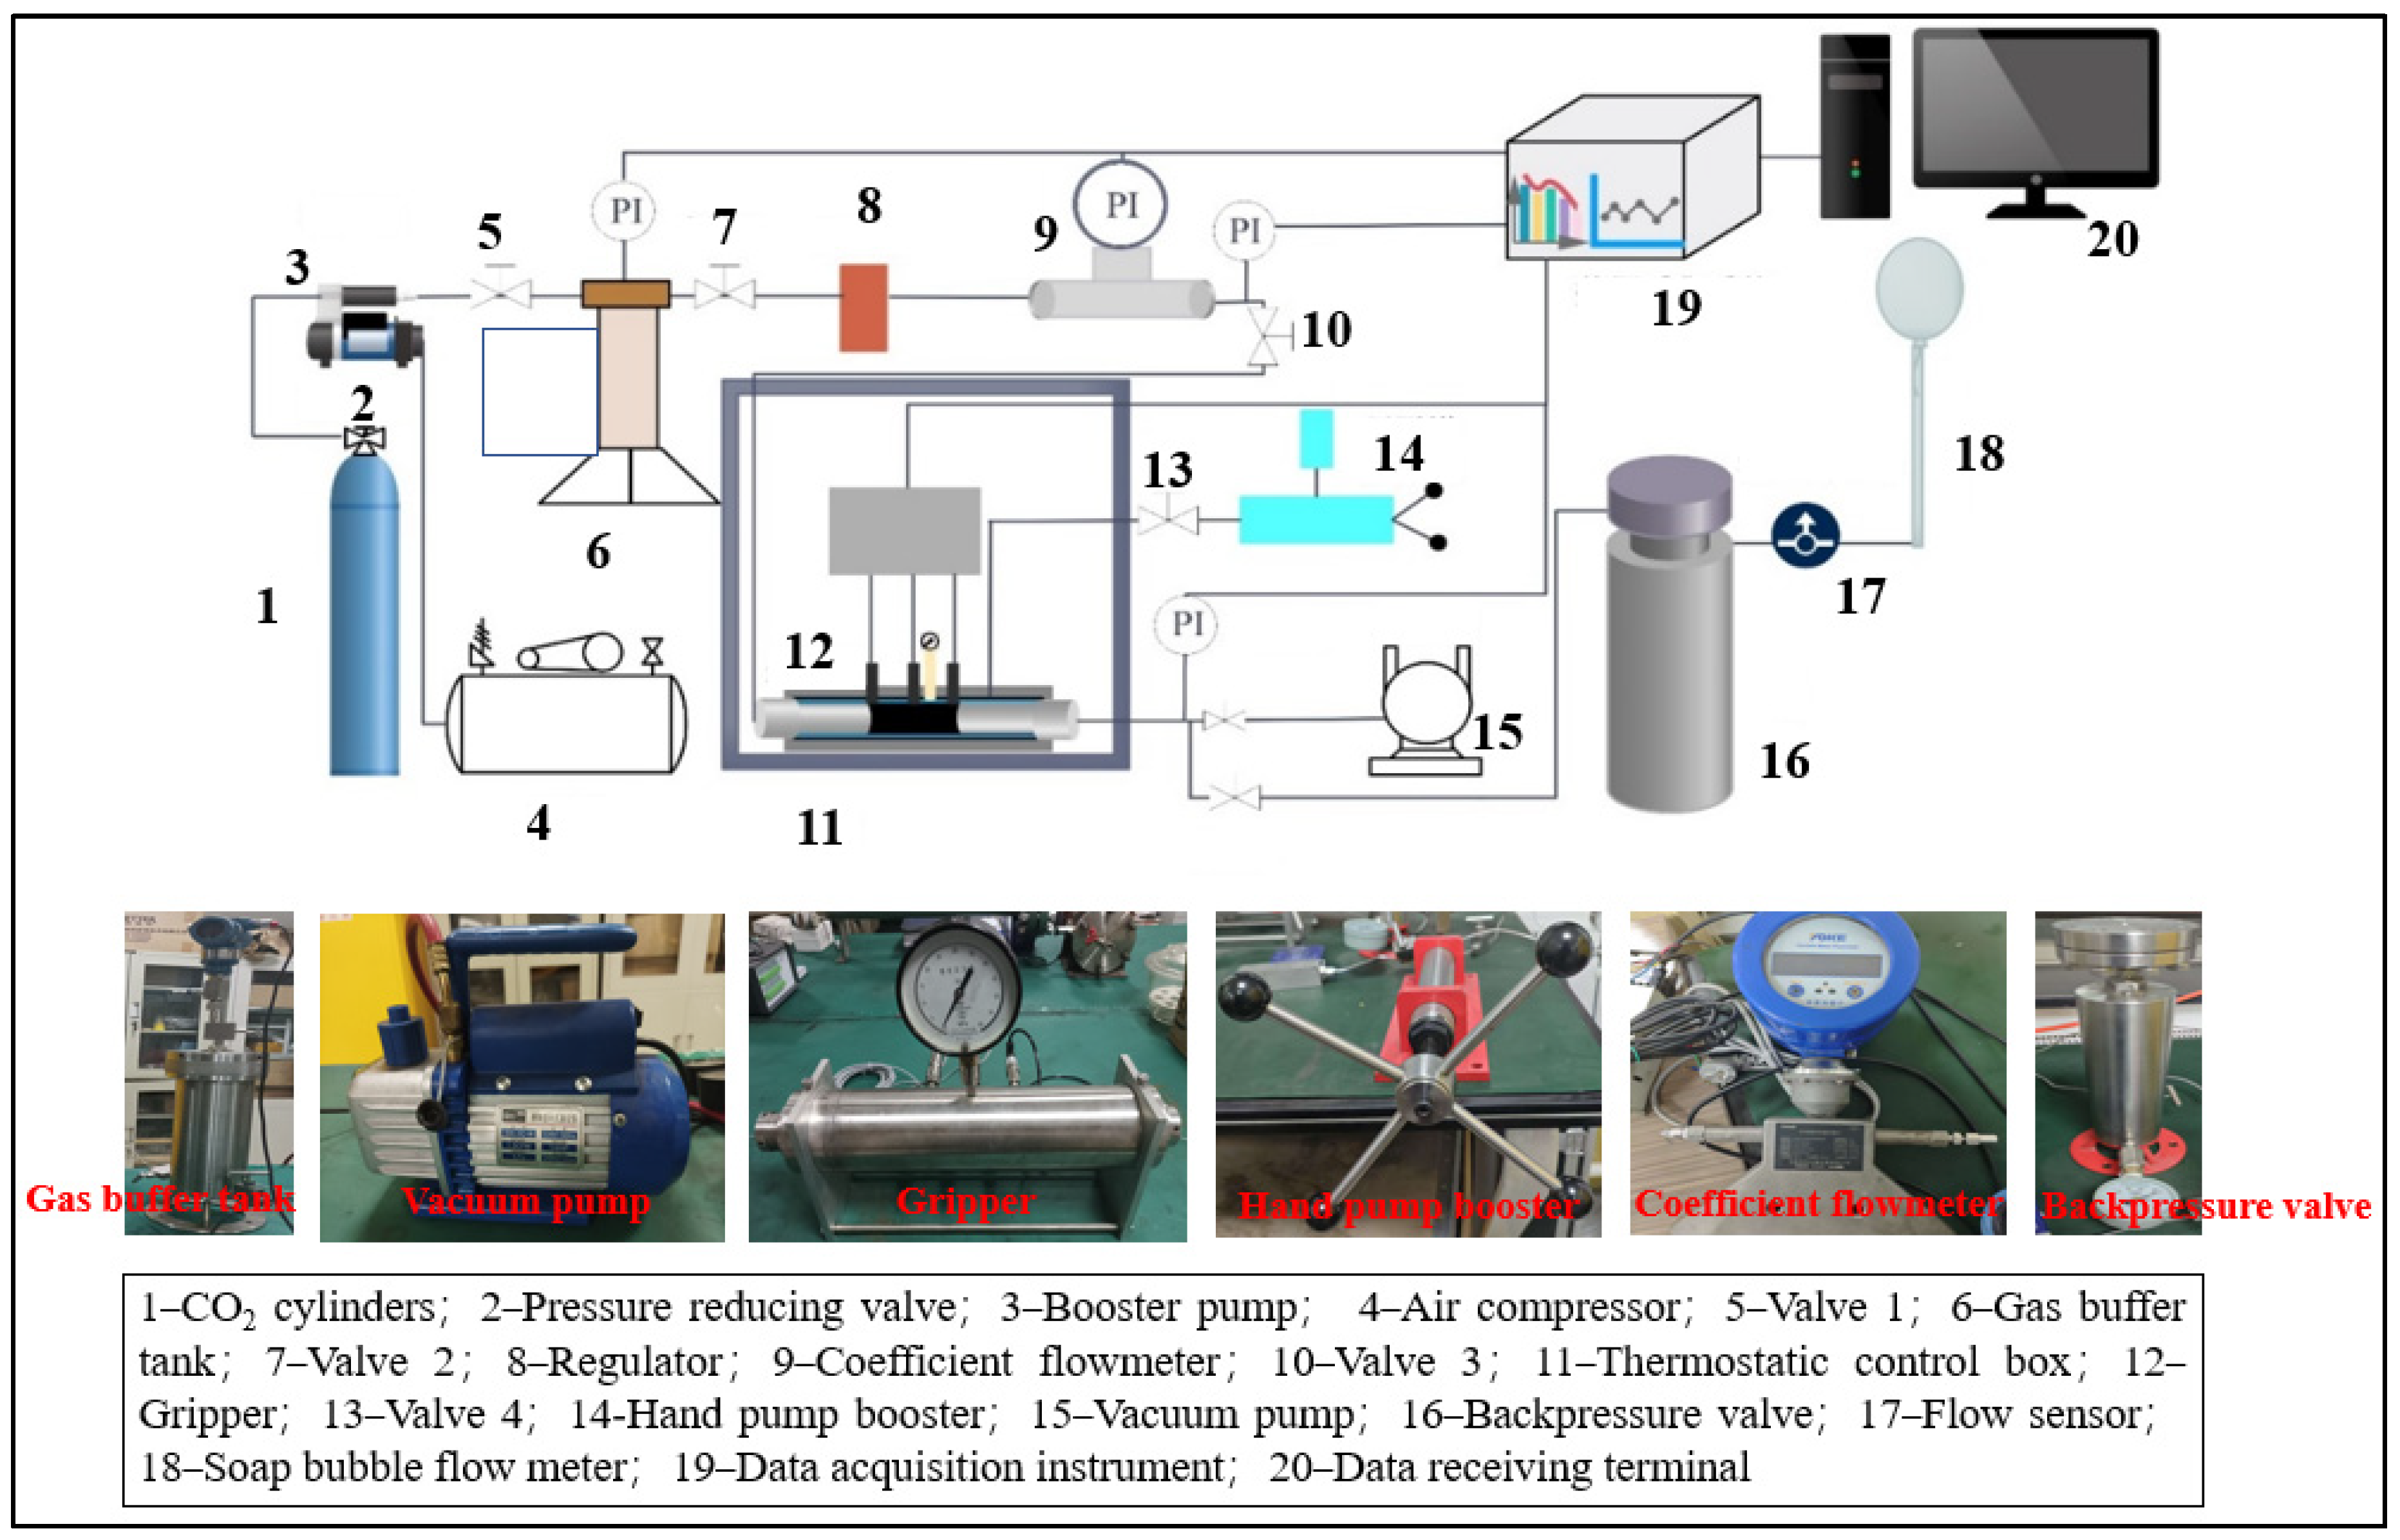
2.2. Experimental Preparation Stage

The experimental steps are shown in Figure 4.
(1)
The coal samples were placed in a high-pressure leaching vessel, where supercritical CO2 was injected for the leaching experiments at different time intervals. After leaching, the coal samples were placed in a vacuum-pressurized water saturation device, where they were evacuated to saturation. The pore structure of the water-saturated coal samples and the pore structure of the centrifuged coal samples were measured using NMR systems and a centrifuge.
(2)
Based on the pressure distribution characteristics of the coal reservoir in the study area, the pressure in the experimental conditions was adjusted according to the corresponding strength of the sample using similarity theory. Given that the experimental coal samples were relatively small with lower strength, the confining pressure and gas pressure were proportionally reduced to reflect the field conditions. The coal columns, leached for different time intervals, were placed into a loading device, and the confining pressure was gradually applied up to 8 MPa.
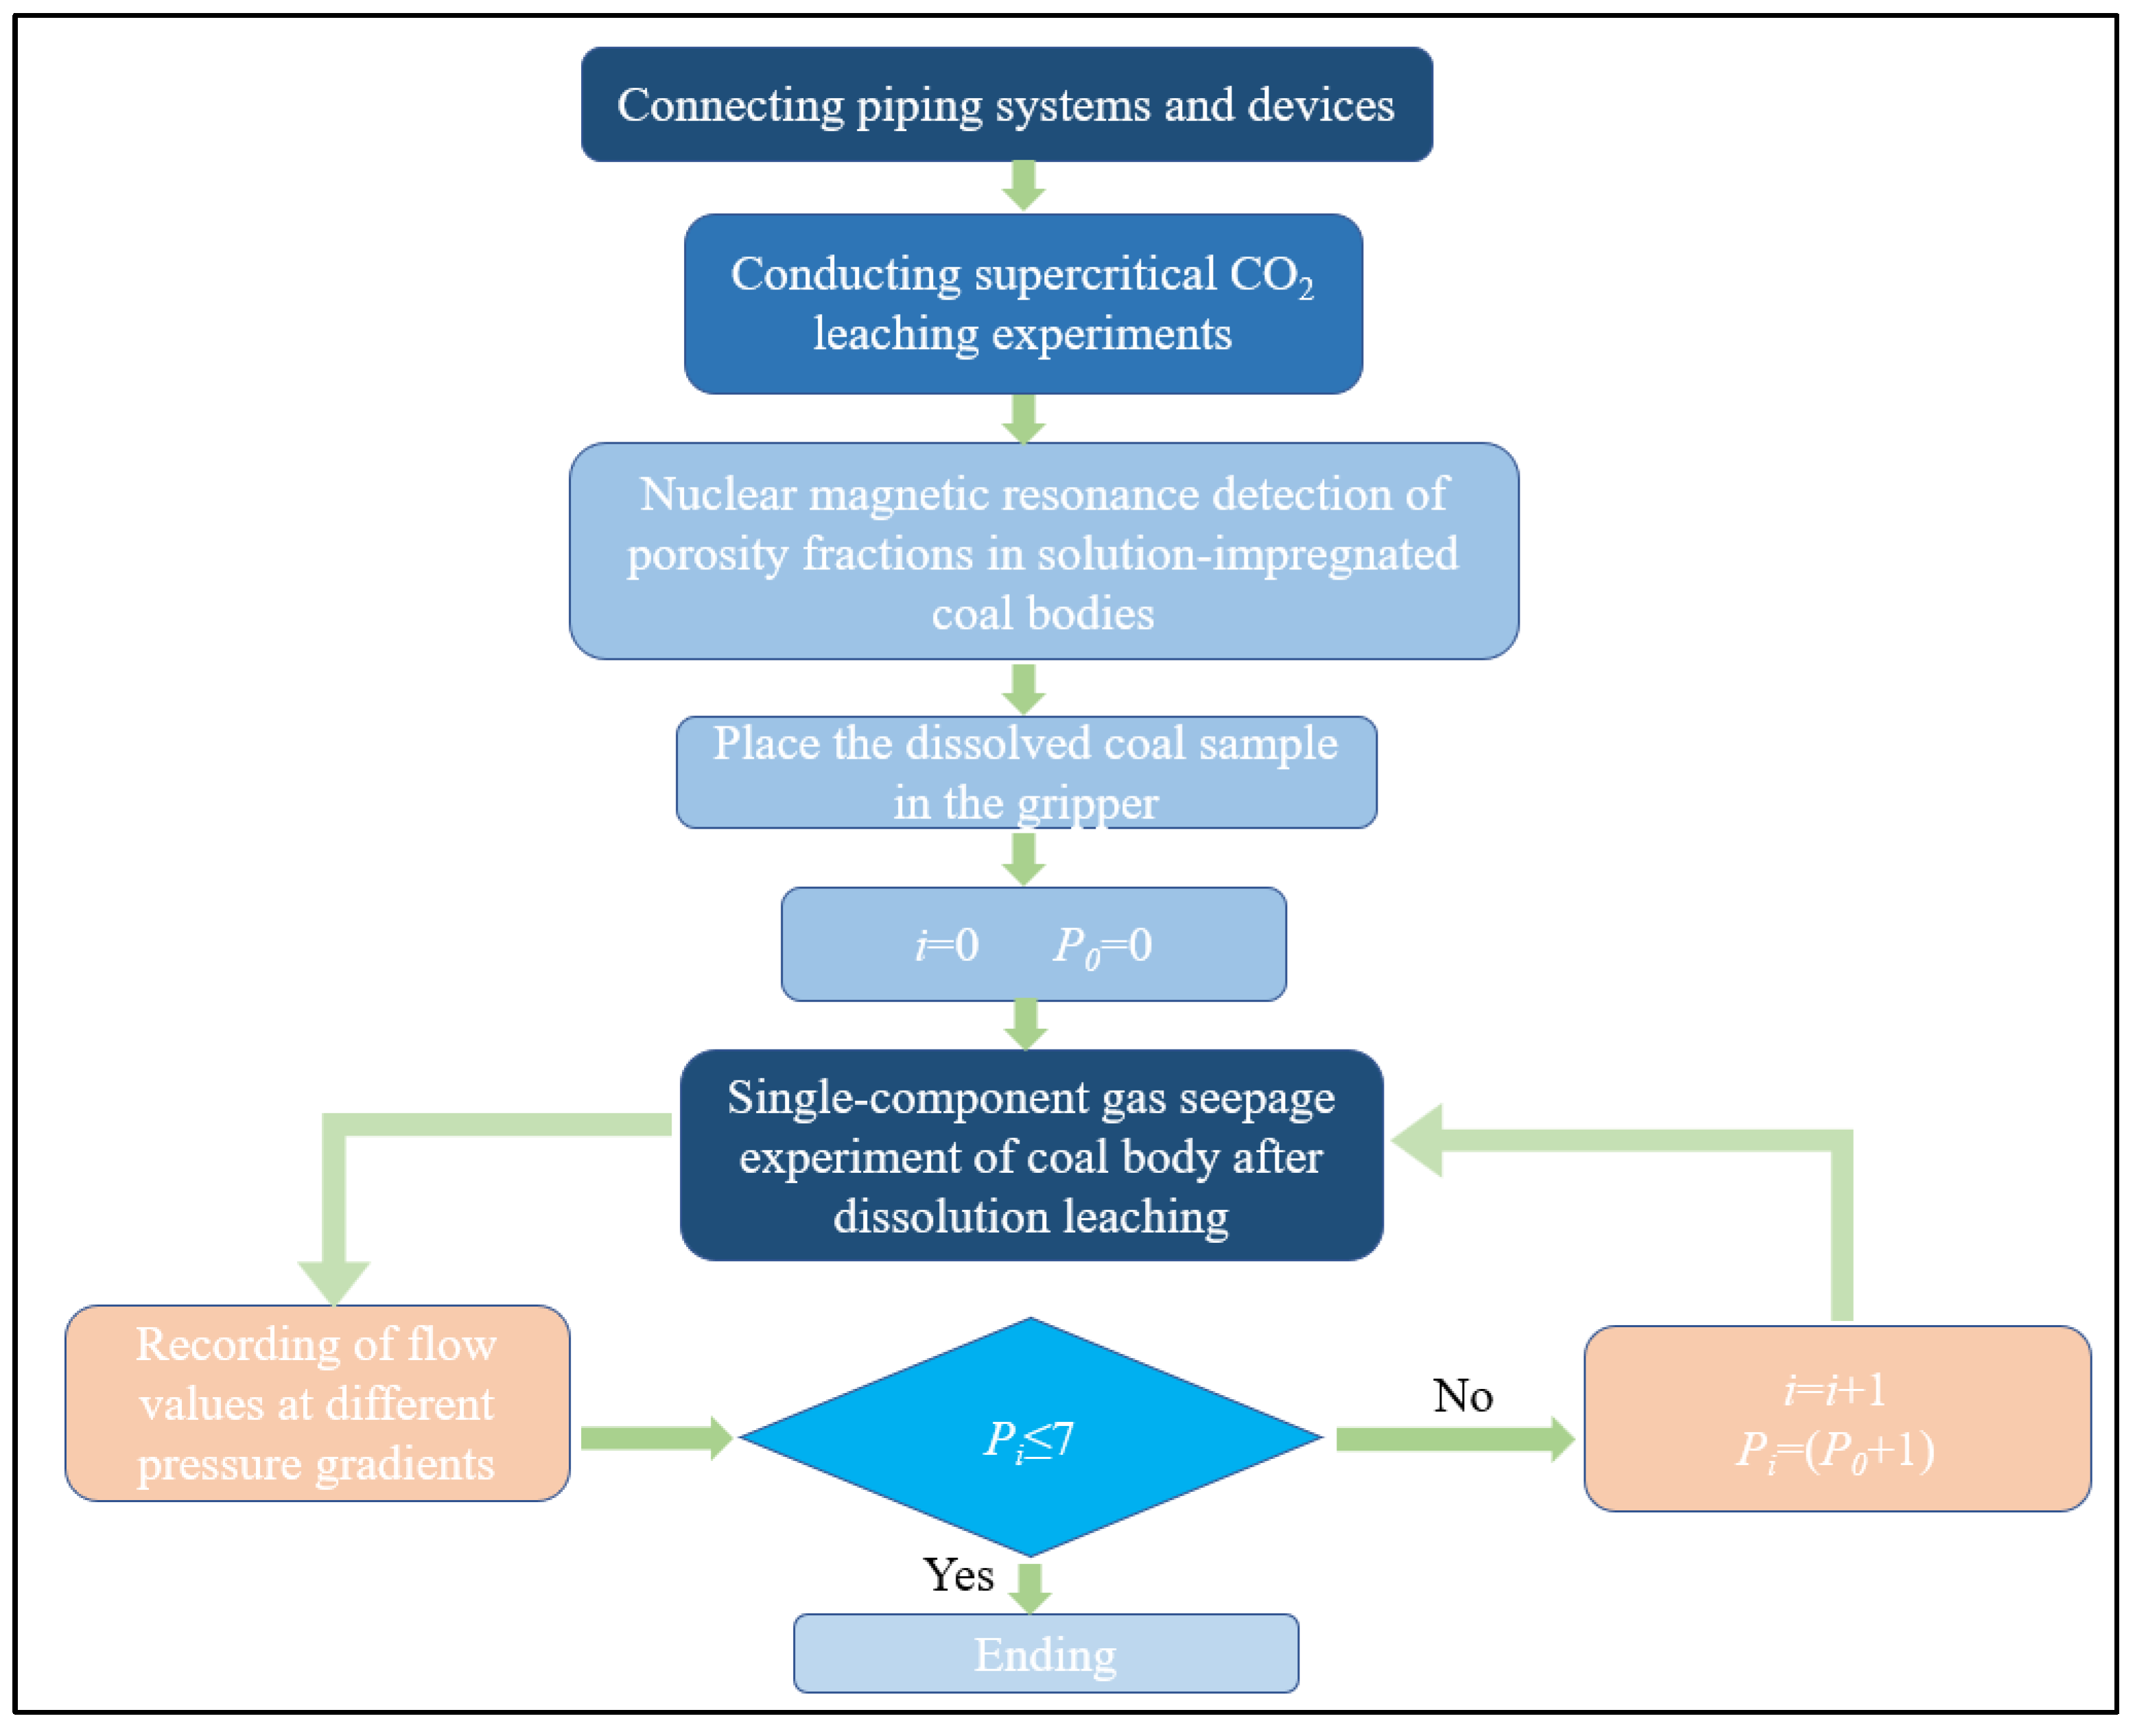
(3)
Before the experiment began, a vacuum pump was used to evacuate the coal column inside the loading device. The data acquisition unit was then activated, and the gas inlet valve was opened. Under a constant temperature of 300 K, pure CO2 gas was injected into the loading device at a constant pressure ranging from 1 to 7 MPa. By adjusting the pressure-regulating valve, the injection pressure was gradually increased from 1 MPa to 7 MPa. Simultaneously, the flow rates at the gas inlet and outlet were measured. Once the flow rates stabilized, the injection pressure was increased in steps, and the flow values at different pressure gradients were recorded.
(4)
At the end of the experiment, the data acquisition system and the gas cylinder valve were first closed. The pressure relief valve was then opened under ventilated conditions to release the gas pressure from the inlet-end pipeline. Next, the back-pressure valve was adjusted to 0, and the gas pressure accumulated at the outlet was released. Finally, the confining pressure was removed, and the coal column was taken out by opening both ends of the loading device.
(5)
The coal samples were replaced with those leached for different durations, and the data were recorded. Steps (3) to (4) were repeated.
(6)
The CO2 gas was replaced with CH4 gas, and steps (3) to (4) were repeated.

3. Results

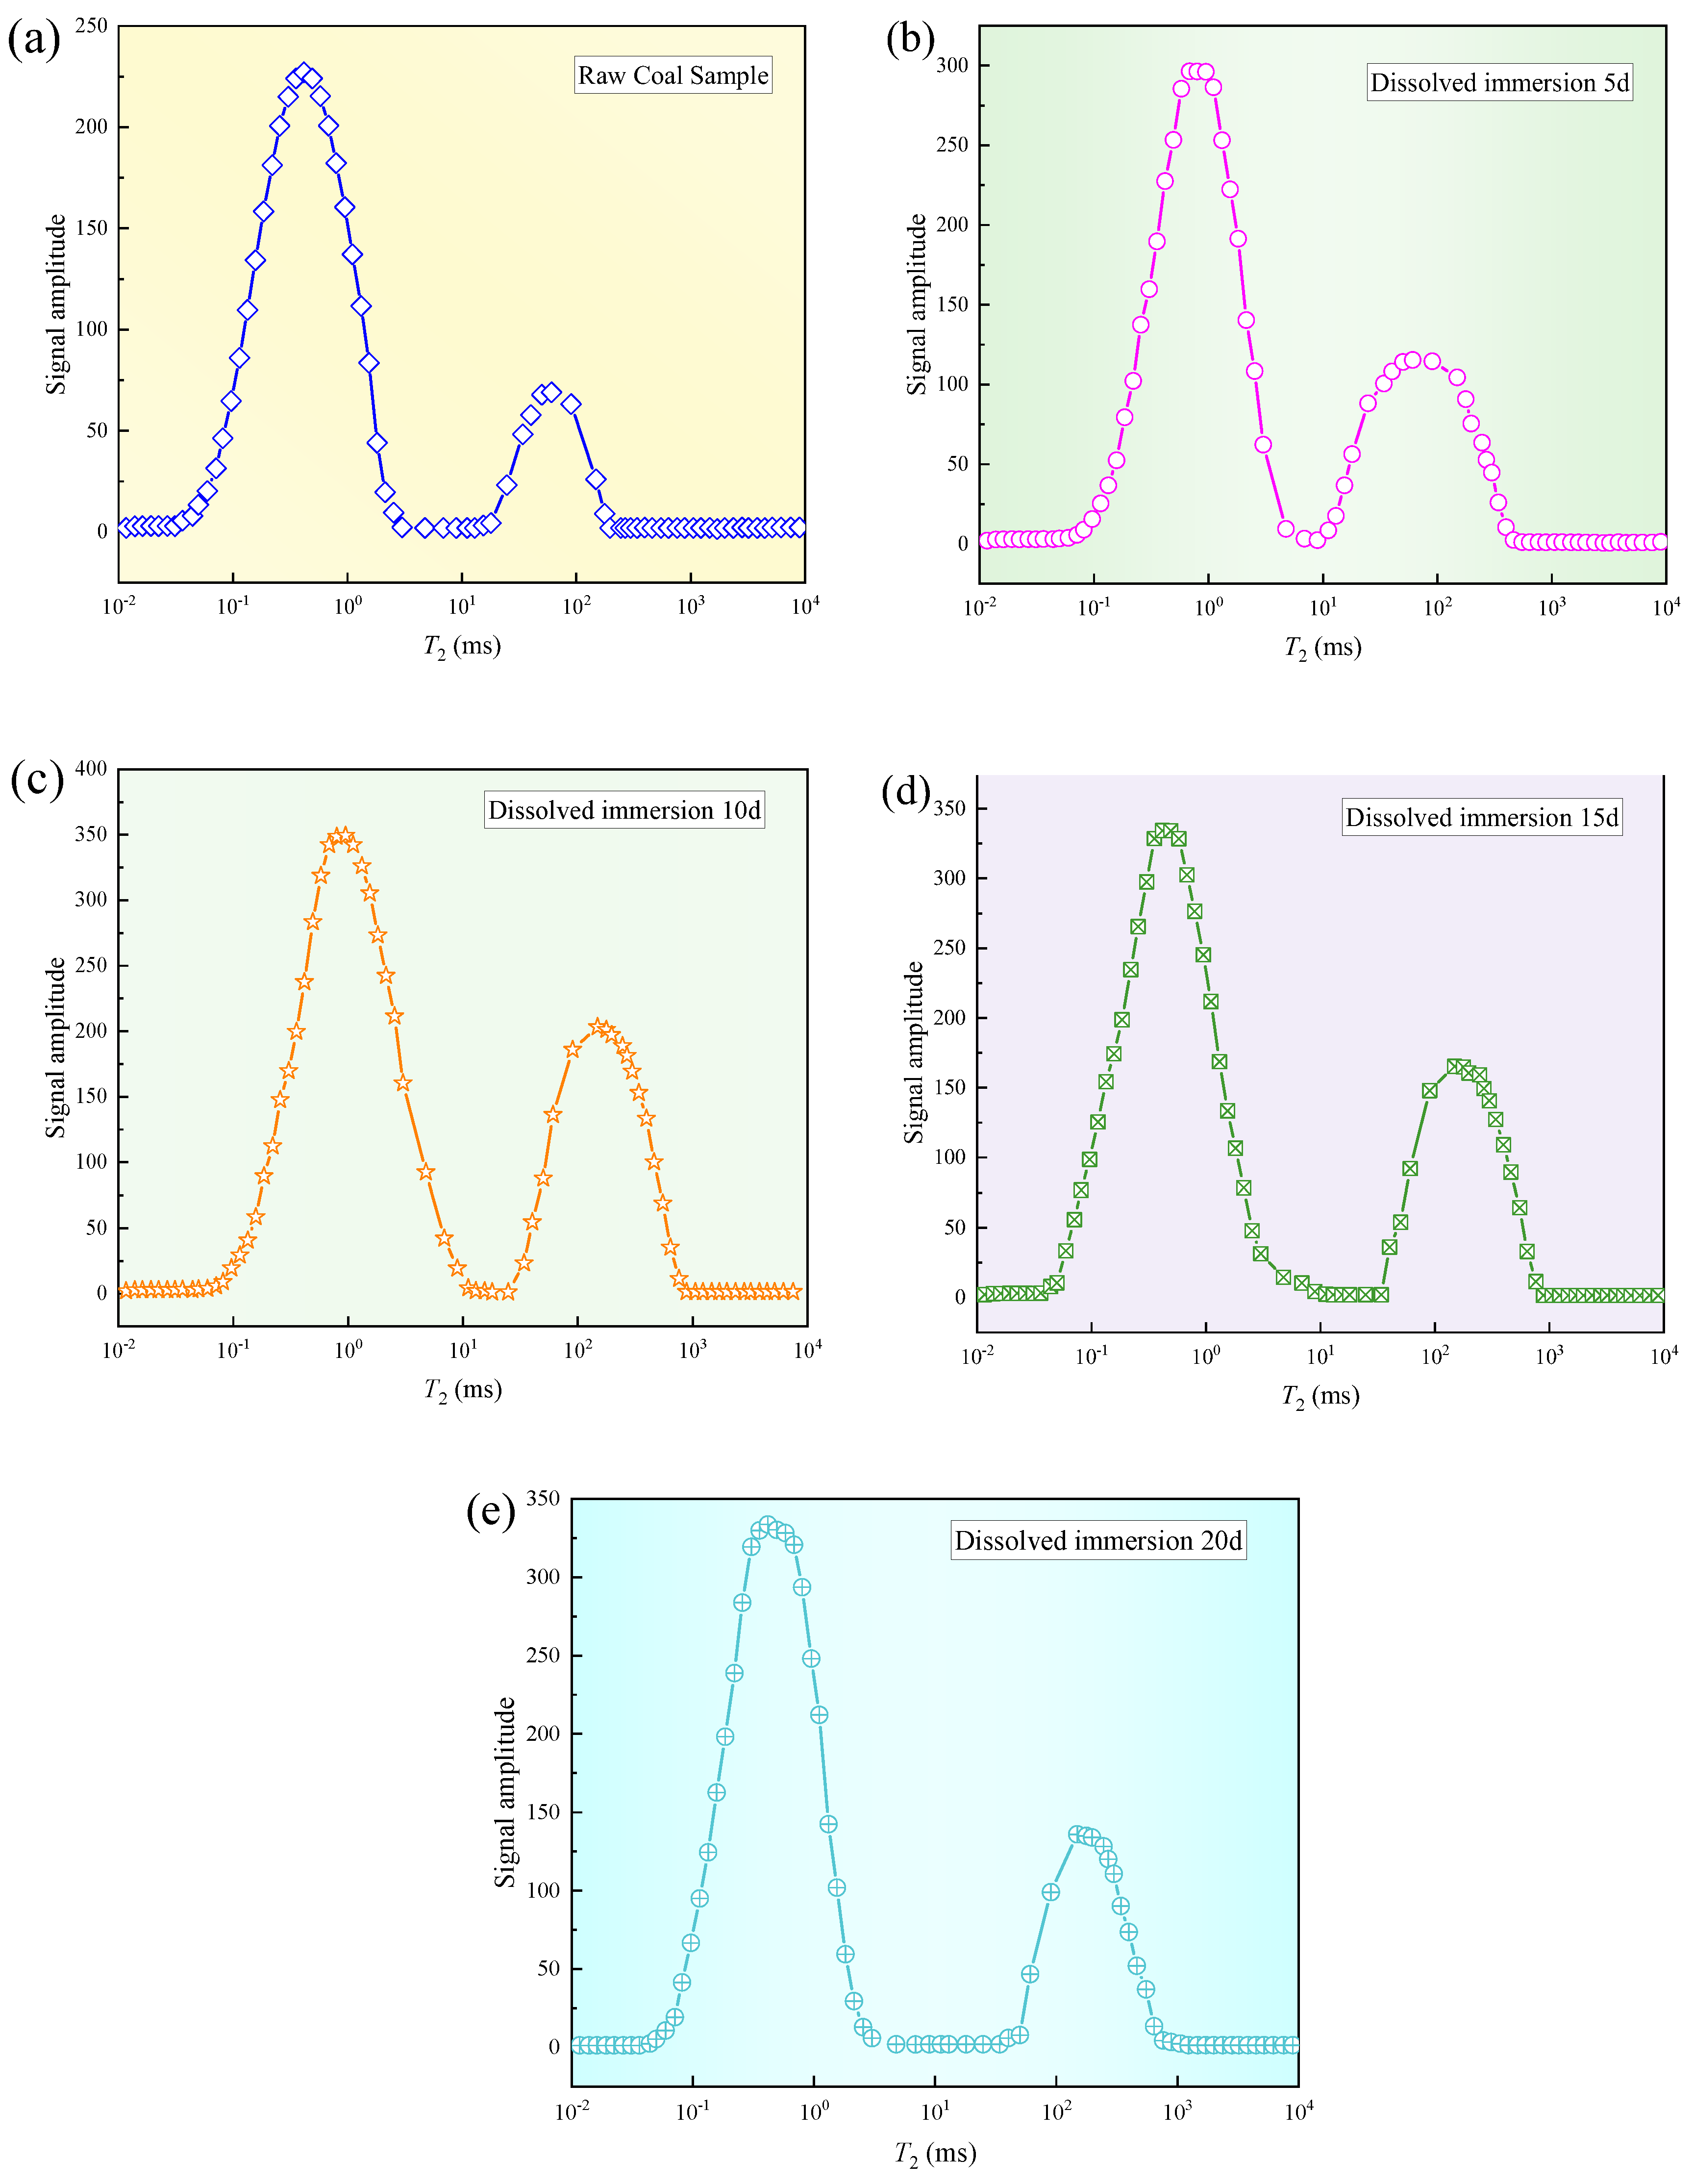
3.1. Pore Distribution in T2 Mapping of Water-Saturated Coal Bodies for Different Dissolution Leaching Time Lengths

According to B.B. Hodorot’s classification method [21], the T2 NMR spectrum area reflects the pore volume, and the connectivity or isolation between peaks indicates the pore connectivity. T2 < 10 ms corresponds to micropores, 10 ms ≤ T2 ≤ 100 ms corresponds to mesopores, and T2 > 100 ms corresponds to macropores and microfractures [21]. The T2 NMR spectrum distribution of the experimental coal sample is shown in Figure 5.
Under fully saturated conditions, the T2 curve of the coal sample exhibits two peaks in the ranges of 0.01–10 ms and 10–1000 ms. The spectrum of the coal samples shows pores of varying sizes. An increase in the width of the T2 peak range indicates an expansion of the pore size, while an increase in the amplitude of the T2 peak signals indicates an increase in the number of pores [22]. Both factors suggest that after supercritical CO2 dissolution, the microfracture network of the coal sample was more developed.
In Figure 5, it can be seen that after immersion in supercritical CO2 for different durations, the T2 spectrum of the fully saturated coal body shows an increase in both the peak width and signal amplitude in comparison with the original coal sample before immersion. At the initial immersion time of 5 d (Figure 5b), the pore structure of the coal sample underwent damage, as reflected in the T2 spectrum by the increase in the amplitude and area of micropores and meso/macropores. When the immersion time was extended to 10 d (Figure 5c), the damage to the coal structure gradually accumulated, and the degree of pore structure destruction intensified. This is reflected in the T2 spectrum by the largest number of micropores and meso/macropores. At immersion durations of 15 d–20 d (Figure 5d,e), the number of pores decreased to some extent, but the degree of pore destruction remained much higher than that of the original coal (Figure 5a). This suggests that when the immersion time exceeded 10 d, further increases in the immersion duration did not effectively enhance the number of pores or significantly improve the pore space of the coal body.

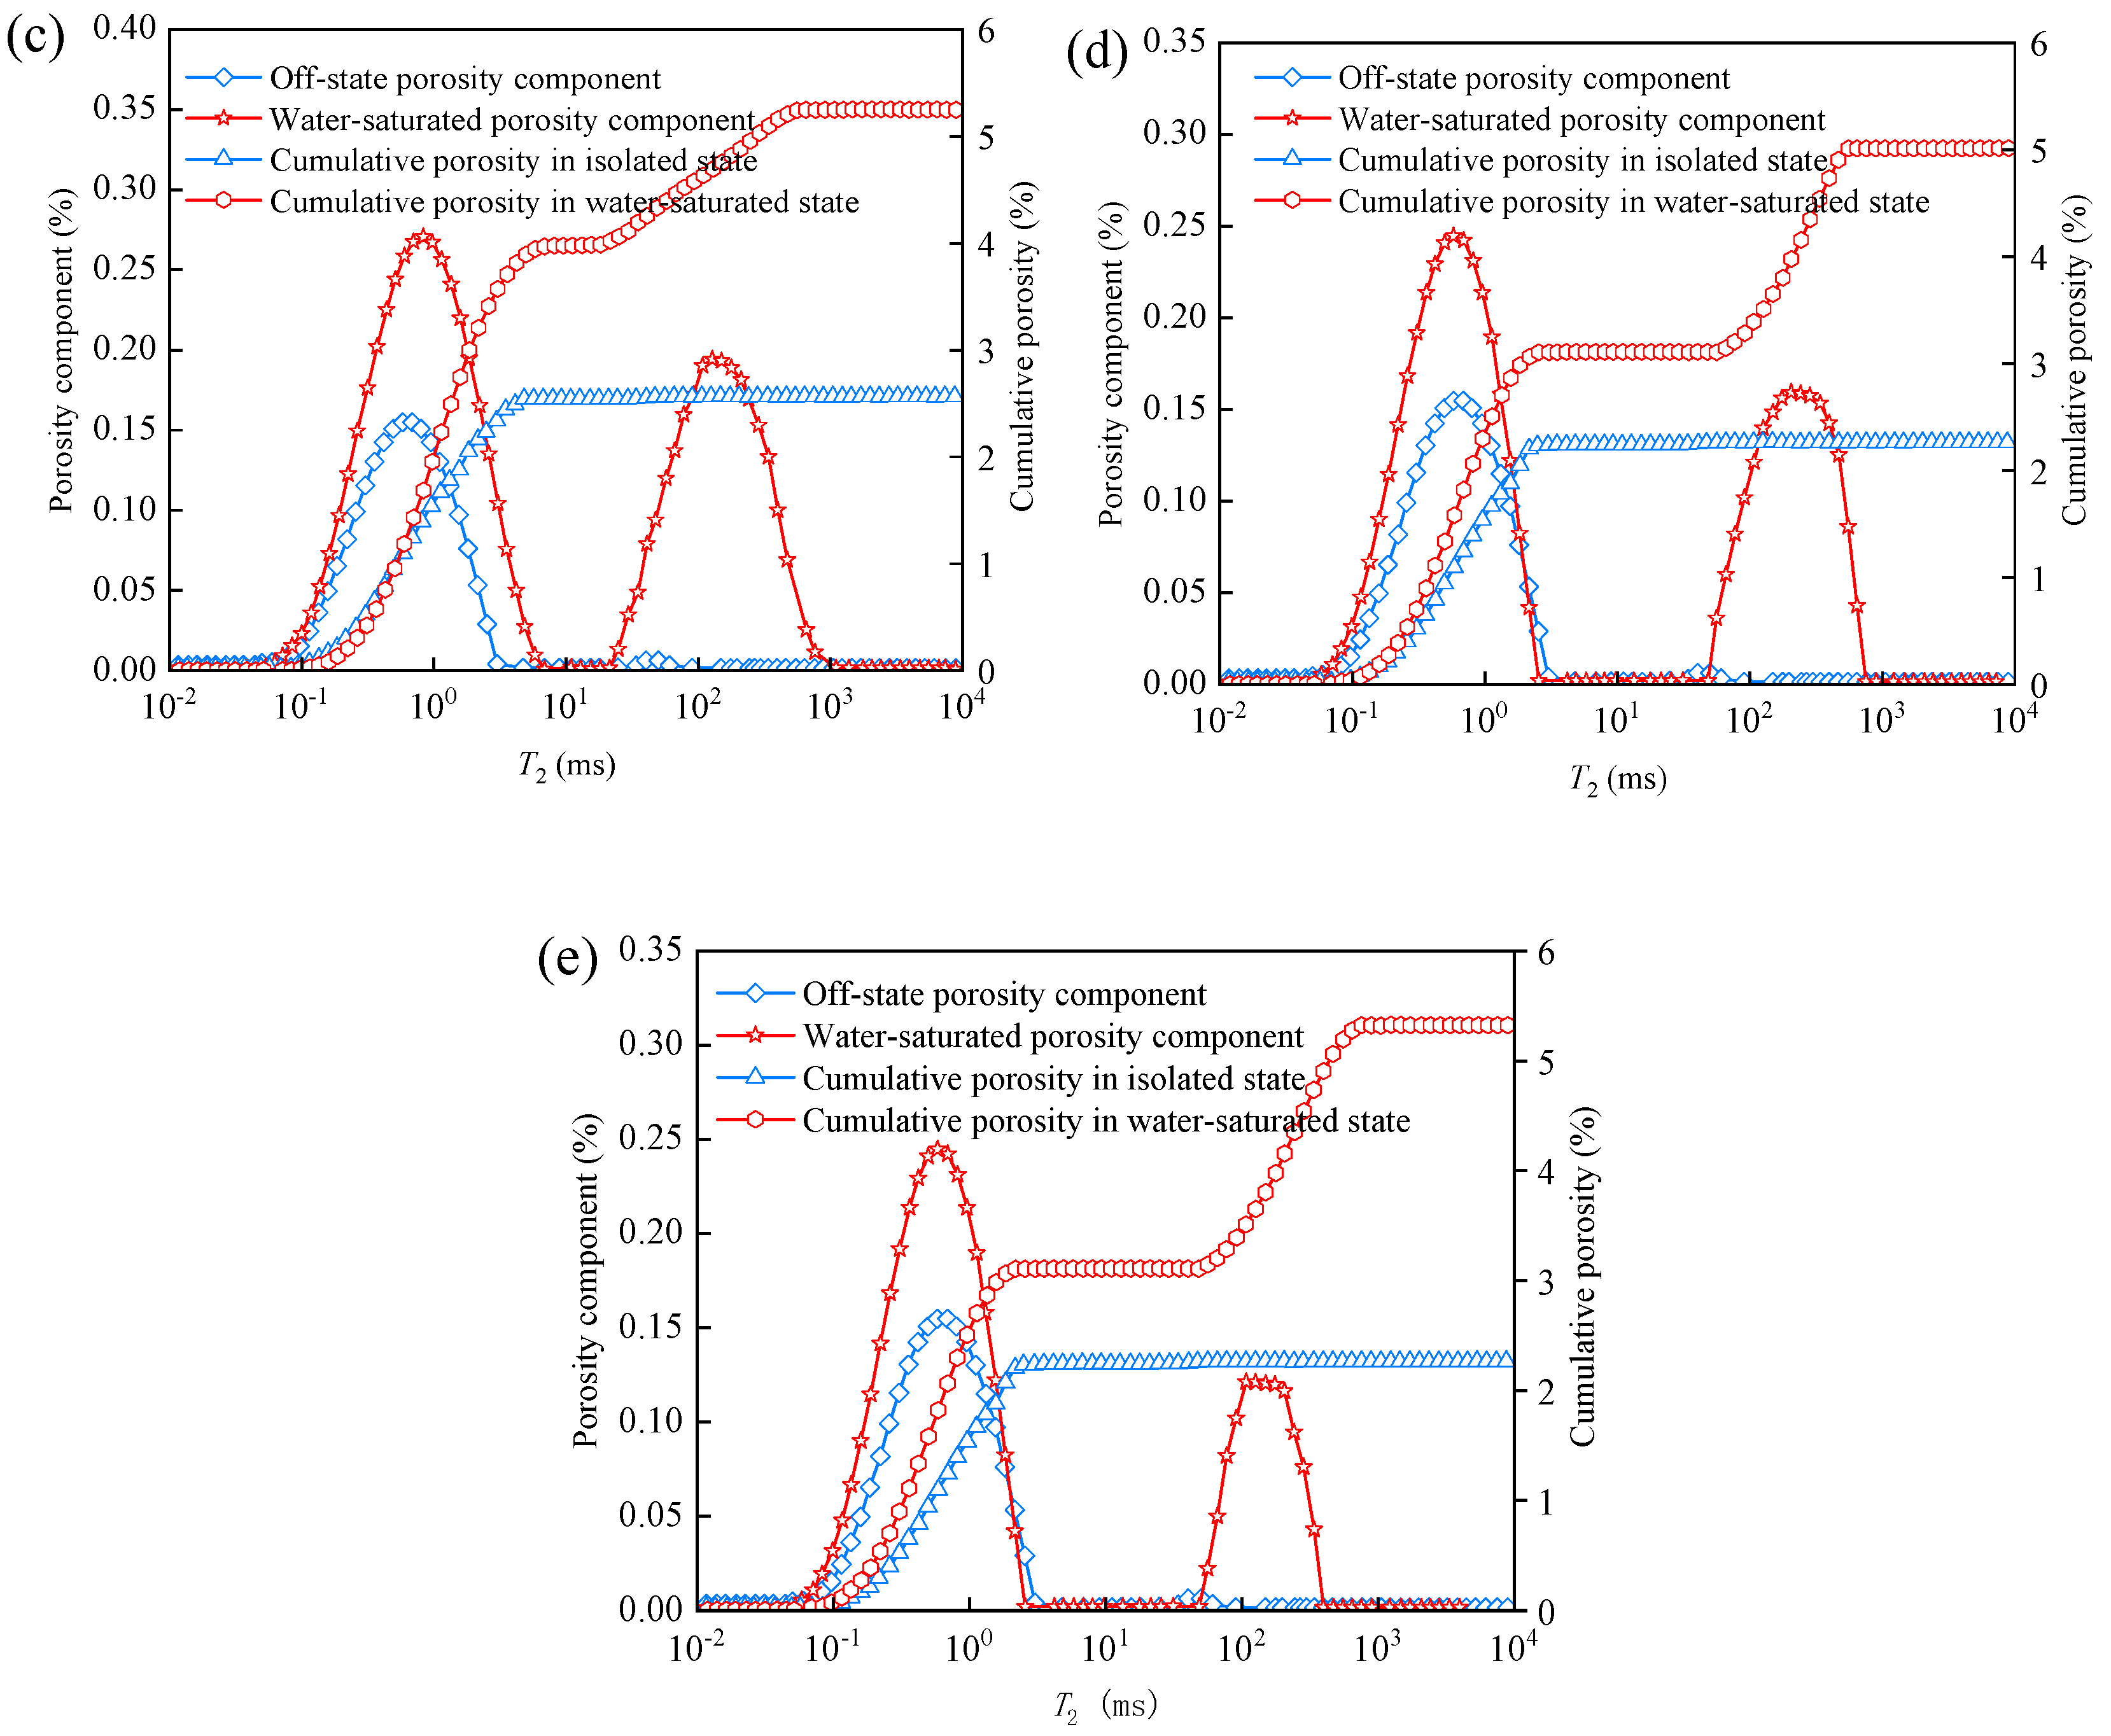
3.2. Changes in Porosity Fractions and Cumulative Porosity of Water-Saturated and Centrifuged Coal for Different Dissolution Leaching Durations

Figure 6 shows the changes in the porosity components and cumulative porosity of saturated and centrifuged coal after supercritical CO2 impregnation for different durations. As seen in Figure 6, with an increase in the supercritical CO2 impregnation time, the amplitude of the porosity components and cumulative porosity of the saturated coal first increased in the 5 d–10 d range and then decreased in the 10 d–20 d range. After the supercritical CO2 treatment, not only did the porosity amplitude increase, but the pore size distribution also became broader. The proportion of micropores and mesopores in the coal sample was significantly higher than that of macropores. The original coal sample had a porosity of 2.06%, but after 5 d, 10 d, 15 d, and 20 d, the porosity increased by 2.78%, 3.26%, 3.22%, and 2.86%, respectively. The porosity of the coal sample after supercritical CO2 impregnation showed a trend of first increasing and then decreasing.
This occurred because, in the presence of water, supercritical CO2 formed weakly acidic carbonic acid, which then rapidly decomposed to produce H⁺. These ions could interact with the mineral components of the coal sample, initiating geochemical reactions. The reaction characteristics of the minerals in coal are related to their chemical properties. Under acidic conditions, the carbonate minerals in coal react more intensively, leading to the dissolution of the associated elements. During the reaction process, minerals may be partially or entirely leached. For example, calcite can undergo dissolution in a carbonic acid solution, with the reaction equation given in Equations (3)–(5) [23]. This process also promotes the detachment of clay minerals, as shown in Equation (6) [23]. The leached minerals create new pores where the original minerals were located, thereby facilitating the development of micropores. This can lead to the dissolution of aluminosilicate minerals, such as feldspar, and the formation of secondary kaolinite precipitates, as described by the reactions in Equations (7) and (8) [23]. However, as the reaction progressed and the reaction time exceeded 10 days, a large number of bicarbonate ions in the water dissociated, reforming carbonate ions, which, in turn, led to the reformation of calcite crystals. The continuous accumulation of these crystals and precipitates may have clogged the previously opened channels, leading to a gradual decrease in the porosity of the coal body when the leaching times were 15 d and 20 d.
C O 2 + H 2 O H 2 C O 3
H 2 C O 3 H + + H C O 3
C a C O 3 ( C a l c i t e ) + H + C a 2 + + H C O 3
A l 2 S i 2 O 5 ( O H ) 4 ( K a o l i n ) + 6 H + 2 A l 3 + + 2 H 4 S i O 4 + H 2 O
K A l S i 3 O 8 ( P o t a s s i u m f e l d s p a r ) + 2 C O 2 + 11 H 2 O A l 2 S i 2 O 5 ( O H ) 4 ( K a o l i n ) + 2 K + + 2 H C O 3 + 4 H 4 S i O 4
N a A l S i 3 O 8 ( S o d a f e l d s p a r ) + 2 C O 2 + 11 H 2 O A l 2 S i 2 O 5 ( O H ) 4 ( K a o l i n ) + 2 N a + + 2 H C O 3 + 4 H 4 S i O 4
This was because after the coal came into contact with supercritical CO2, CO2 molecules entered the primary pores of the coal, promoting the development of primary fissures. Meanwhile, the entry of CO2 molecules created more new secondary pores and cracks, which may be influenced by gas migration, further increasing the porosity. Additionally, supercritical CO2 dissolved and extracted certain inorganic and organic minerals from the coal, enhancing the connectivity of the pores within the coal body. Pores that were blocked by mineral components were also connected, allowing for a more developed porosity and an overall increase in the coal sample’s porosity.

3.3. Time-Varying Characteristics of Gas Seepage in Coal Samples with Different Leaching Times

Figure 7 and Figure 8 show the gas flow-time curves of the single-component CO2 and CH4 for coal samples with different impregnation durations. As seen in the figures, CO2 and CH4 exhibited different flow characteristics in the same permeable coal. Both gases increased in their flow rate with the rising injection pressure, and the outlet flow rate showed a stepwise increase over time, while the outlet pressure remained almost unchanged. Additionally, under the same injection pressure, the outlet flow rate of CO2 exhibited a trend of first increasing and then decreasing as the coal impregnation time increased.
For the impregnation times of the raw coal sample, 5 d, 10 d, 15 d, and 20 d, the maximum outlet CO2 flow rates were approximately 1674 mL/min, 2455 mL/min, 7525 mL/min, 4996 mL/min, and 3486 mL/min, respectively. The maximum outlet CH4 flow rates were approximately 2730 mL/min, 3538 mL/min, 8831 mL/min, 6762 mL/min, and 5479 mL/min, respectively. Both CO2 and CH4 exhibited the highest outlet flow at 10 d. Compared with the 0 d impregnation, the outlet flow of CO2 and CH4 at 10 d increased by 4.49 times and 3.23 times, respectively.
This indicates that during the 5–10 d impregnation period, the pore structure of the coal changed, increasing the number of mesopores and macropores used for seepage. This led to an increase in the seepage channels, causing a macro-level increase in the outlet flow. However, during the 15 d–20 d period, the outlet flow of CO2 and CH4 decreased. This is because, during this period, supercritical CO2 dissolved the minerals in the coal. After mineral dissolution, the minerals deposited in larger pores, and the pores where minerals were dissolved became narrower. This narrowing of the pore openings resulted in a reduction in the effective seepage area, leading to a decrease in flow [24].
Taking the 10 d impregnation time as an example, at this point, the outlet CH4 flow rate was 1.17 times the CO2 flow rate. This indicates that CO2 encountered greater resistance to migration in the coal than CH4. The main reasons for this phenomenon are as follows:
(1)
The higher dynamic viscosity of CO2: Under the same pressure conditions, CO2 has a higher dynamic viscosity than CH4, which leads to greater flow resistance along the flow path [25].
(2)
CO2’s tendency to enter micronanopores: CO2 is more likely to enter micronano-sized pores due to its molecular properties, and it has a higher specific surface area compared with CH4. This allows CO2 to adsorb onto the surface of coal, increasing local resistance.
(3)
Transition of CO2 into a liquid-like state: As the injection pressure increases, CO2 undergoes a physical transition toward a liquid-like state, while CH4 remains in a gaseous state. The interactions between CO2 and the coal matrix create more resistance than those between CH4 and the coal. Thus, after impregnation, the permeability of CH4 in the coal is stronger than that of CO2.

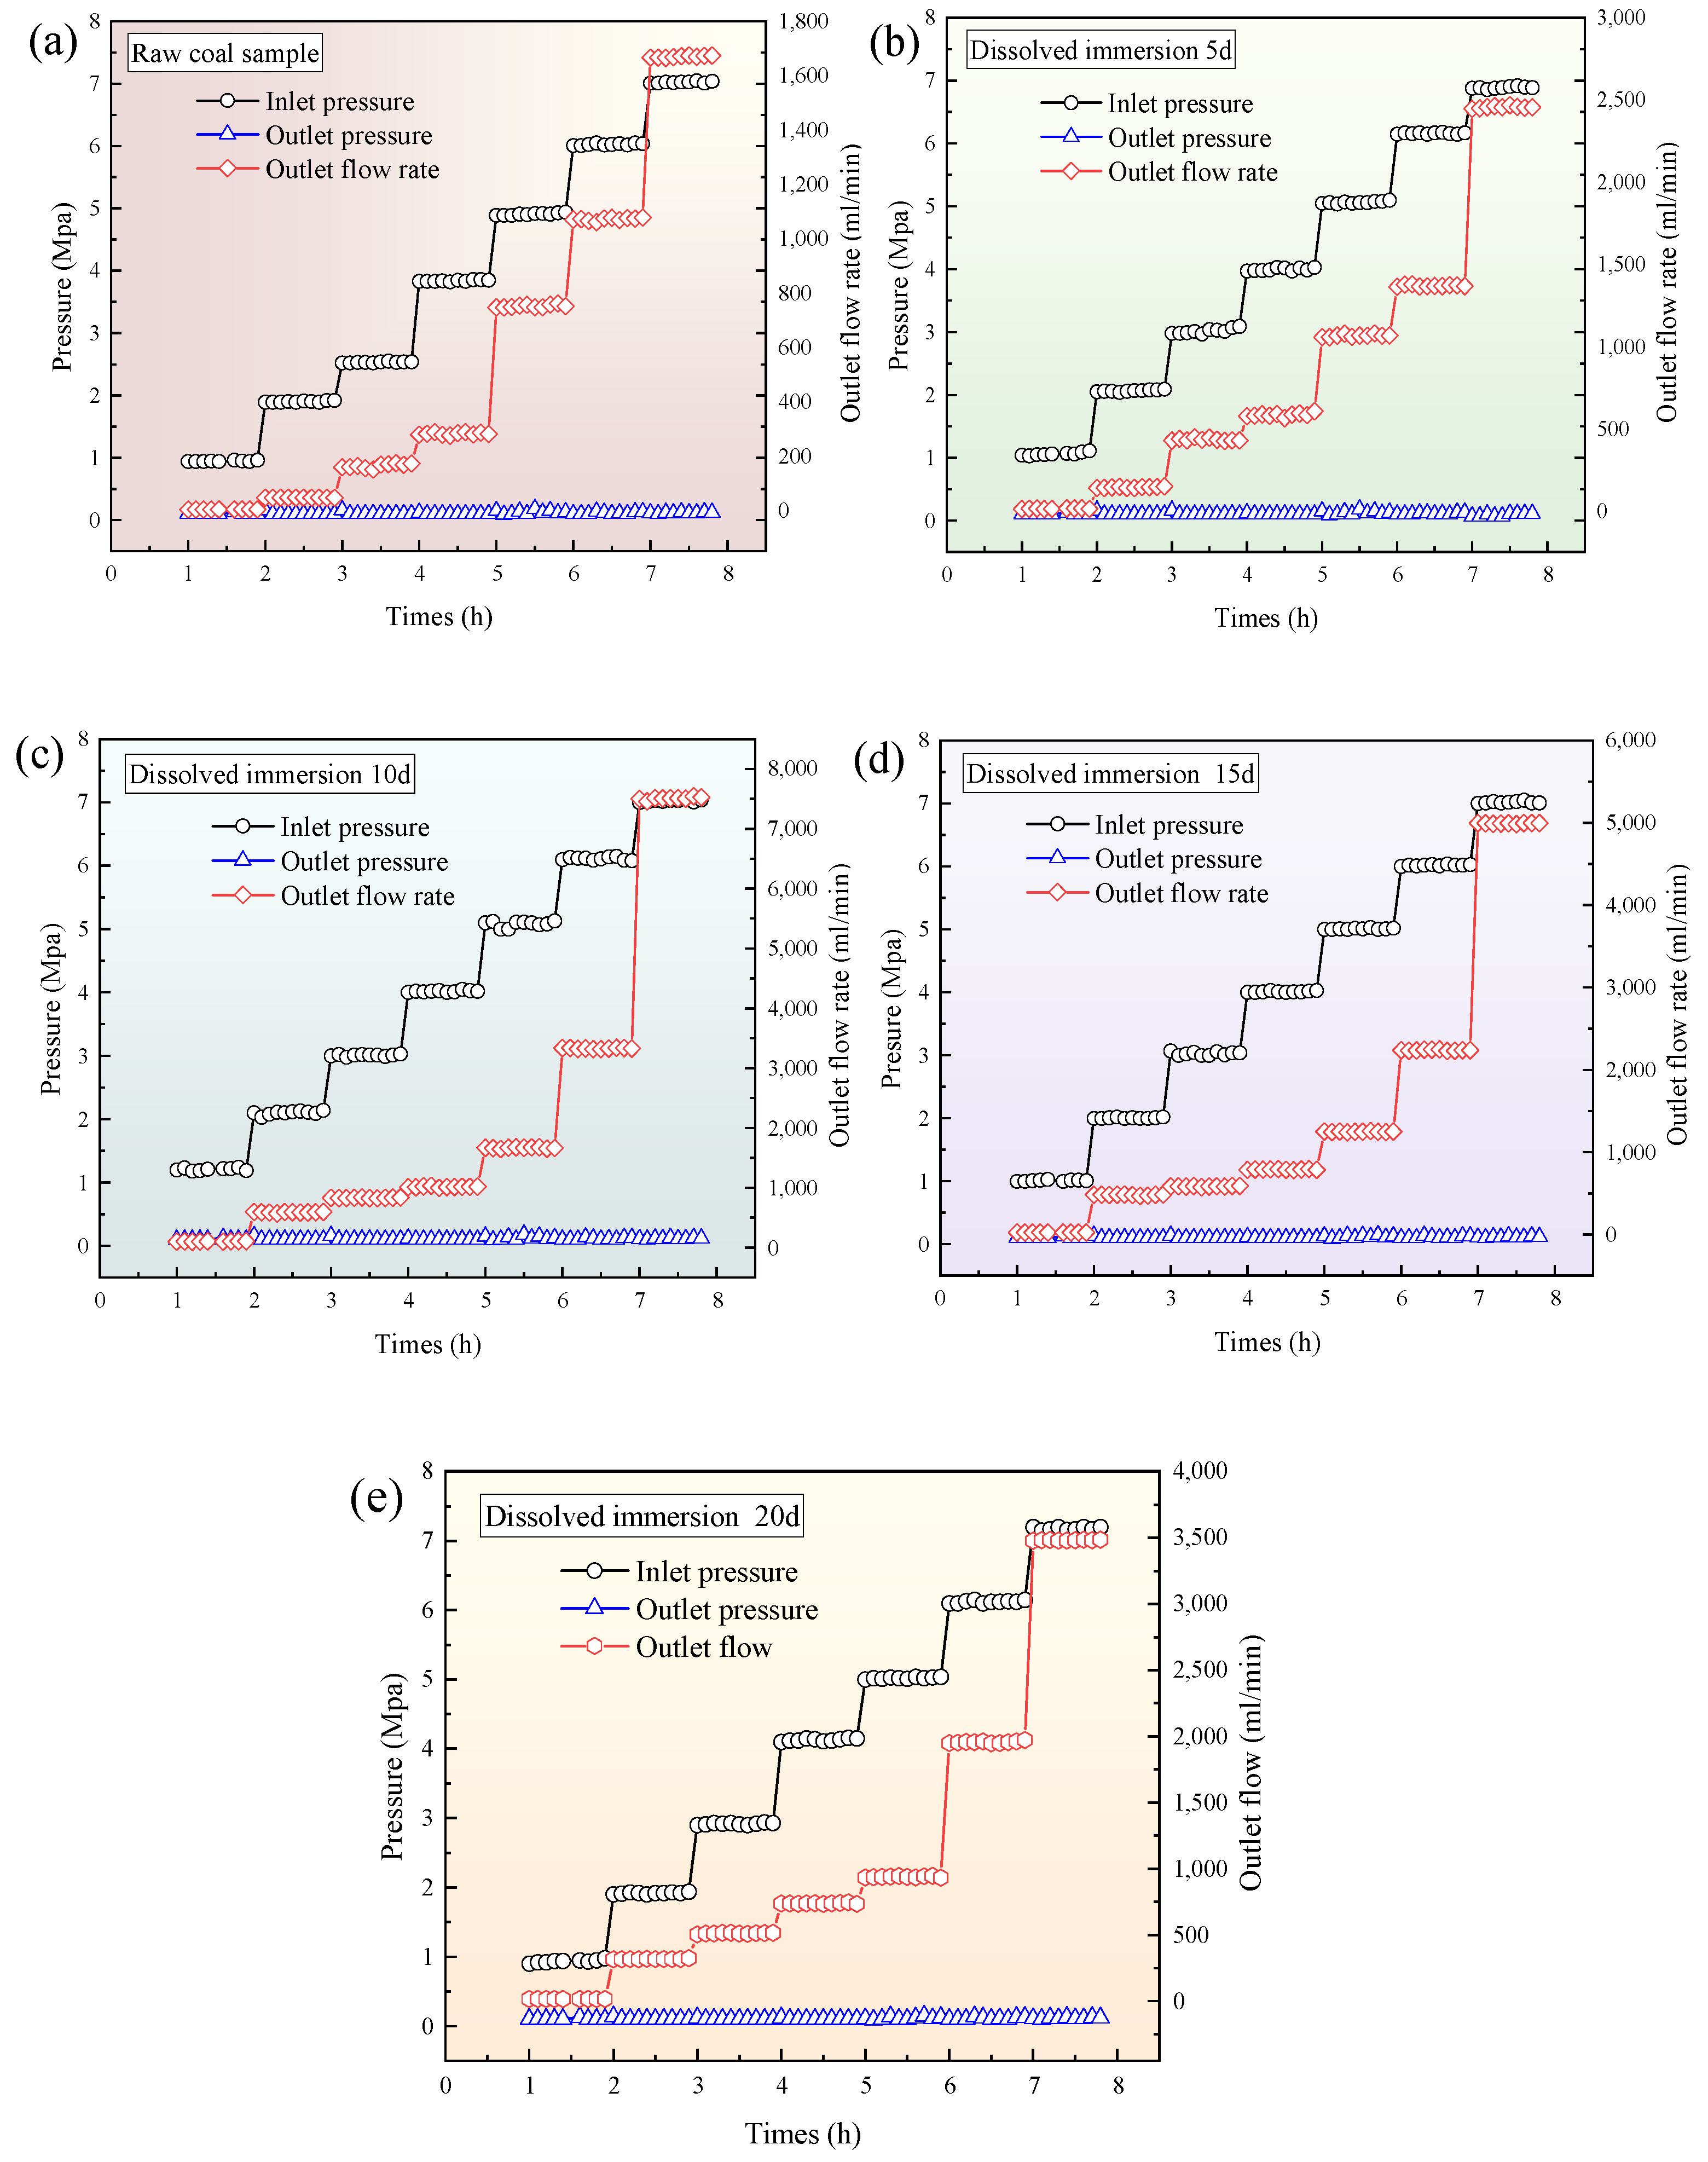
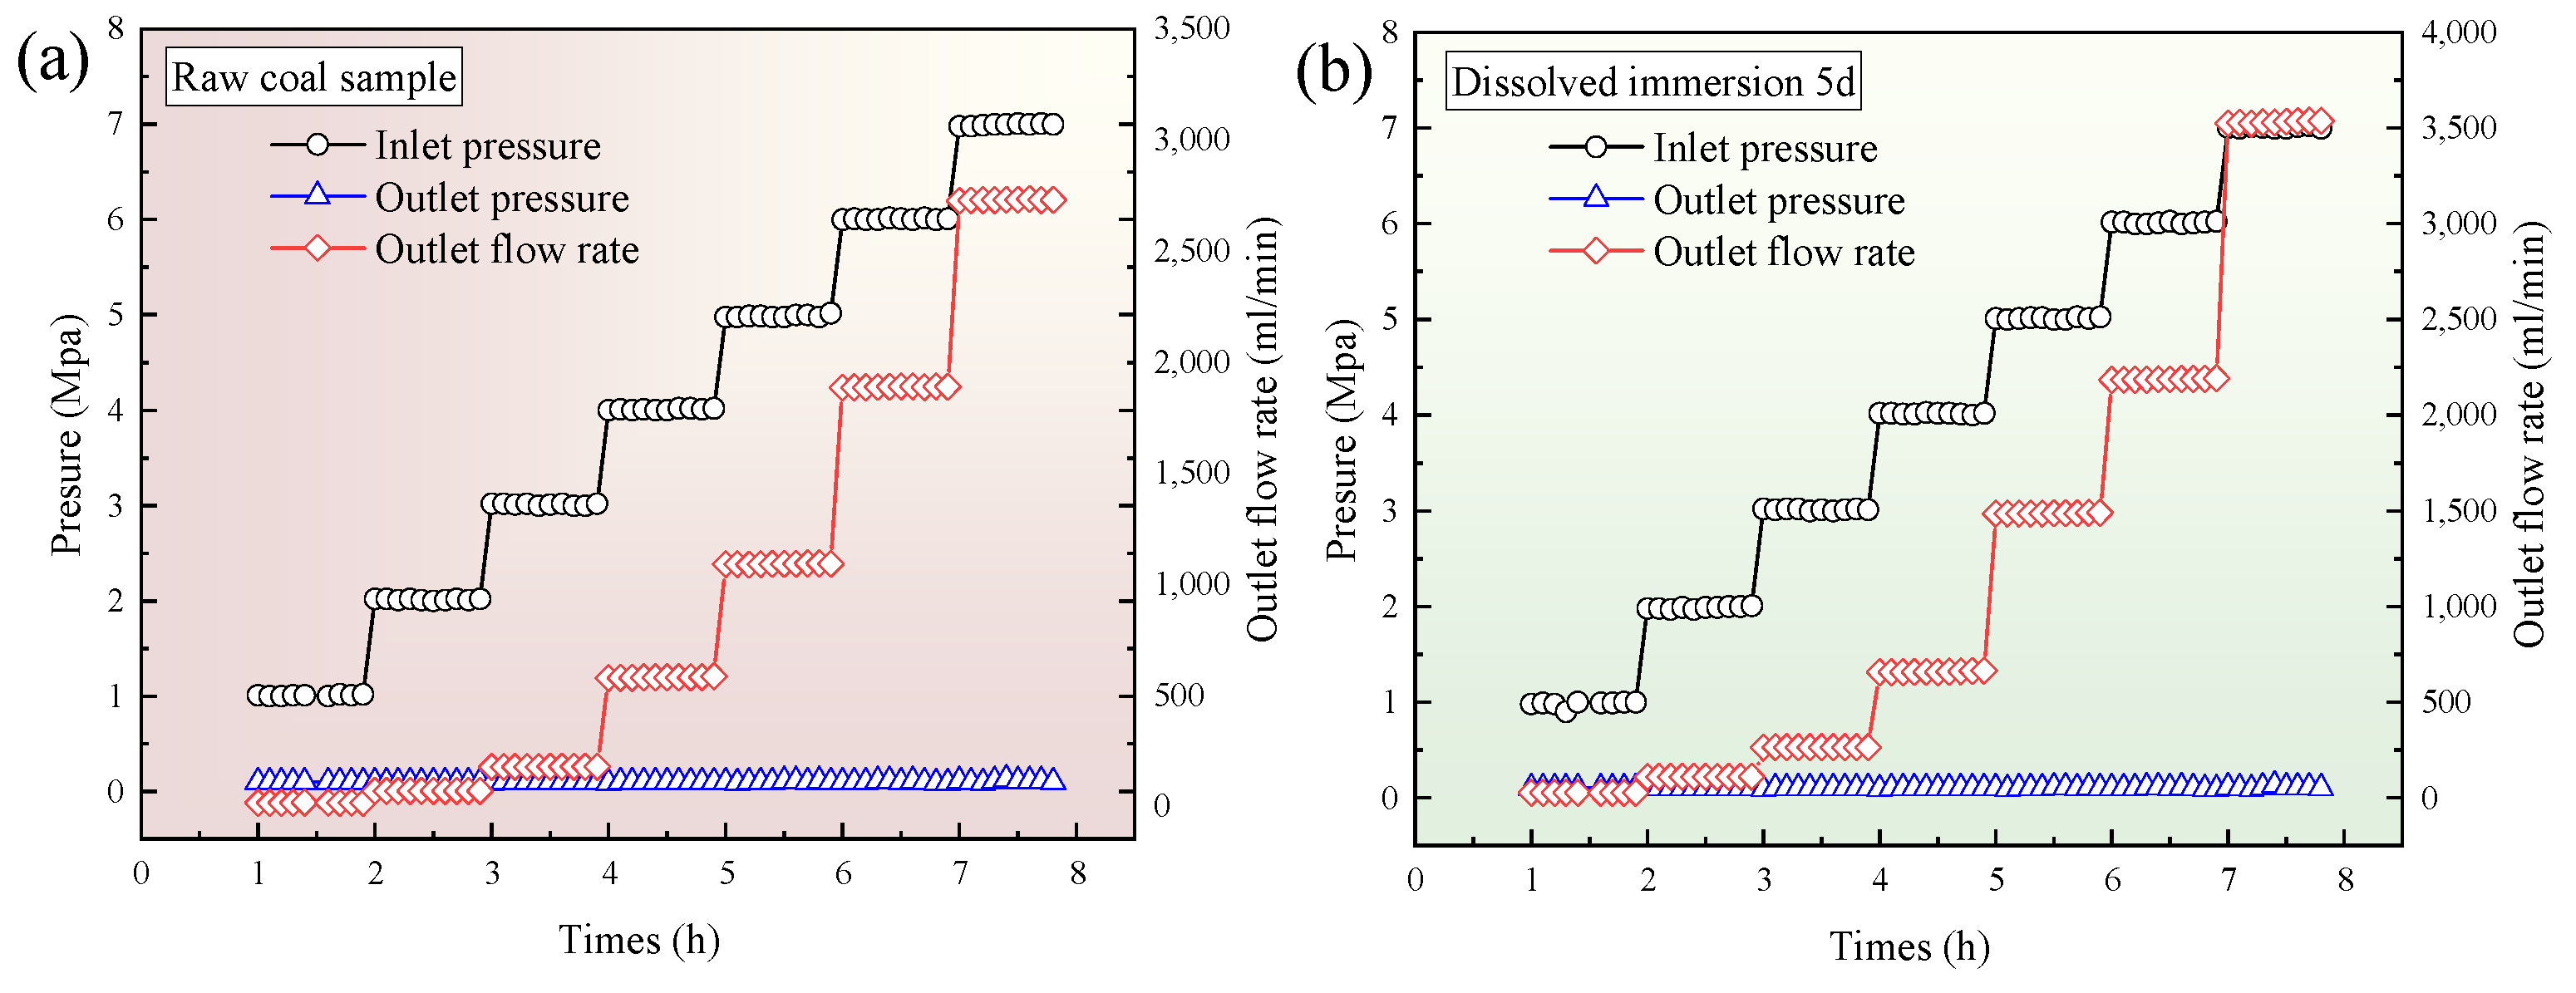
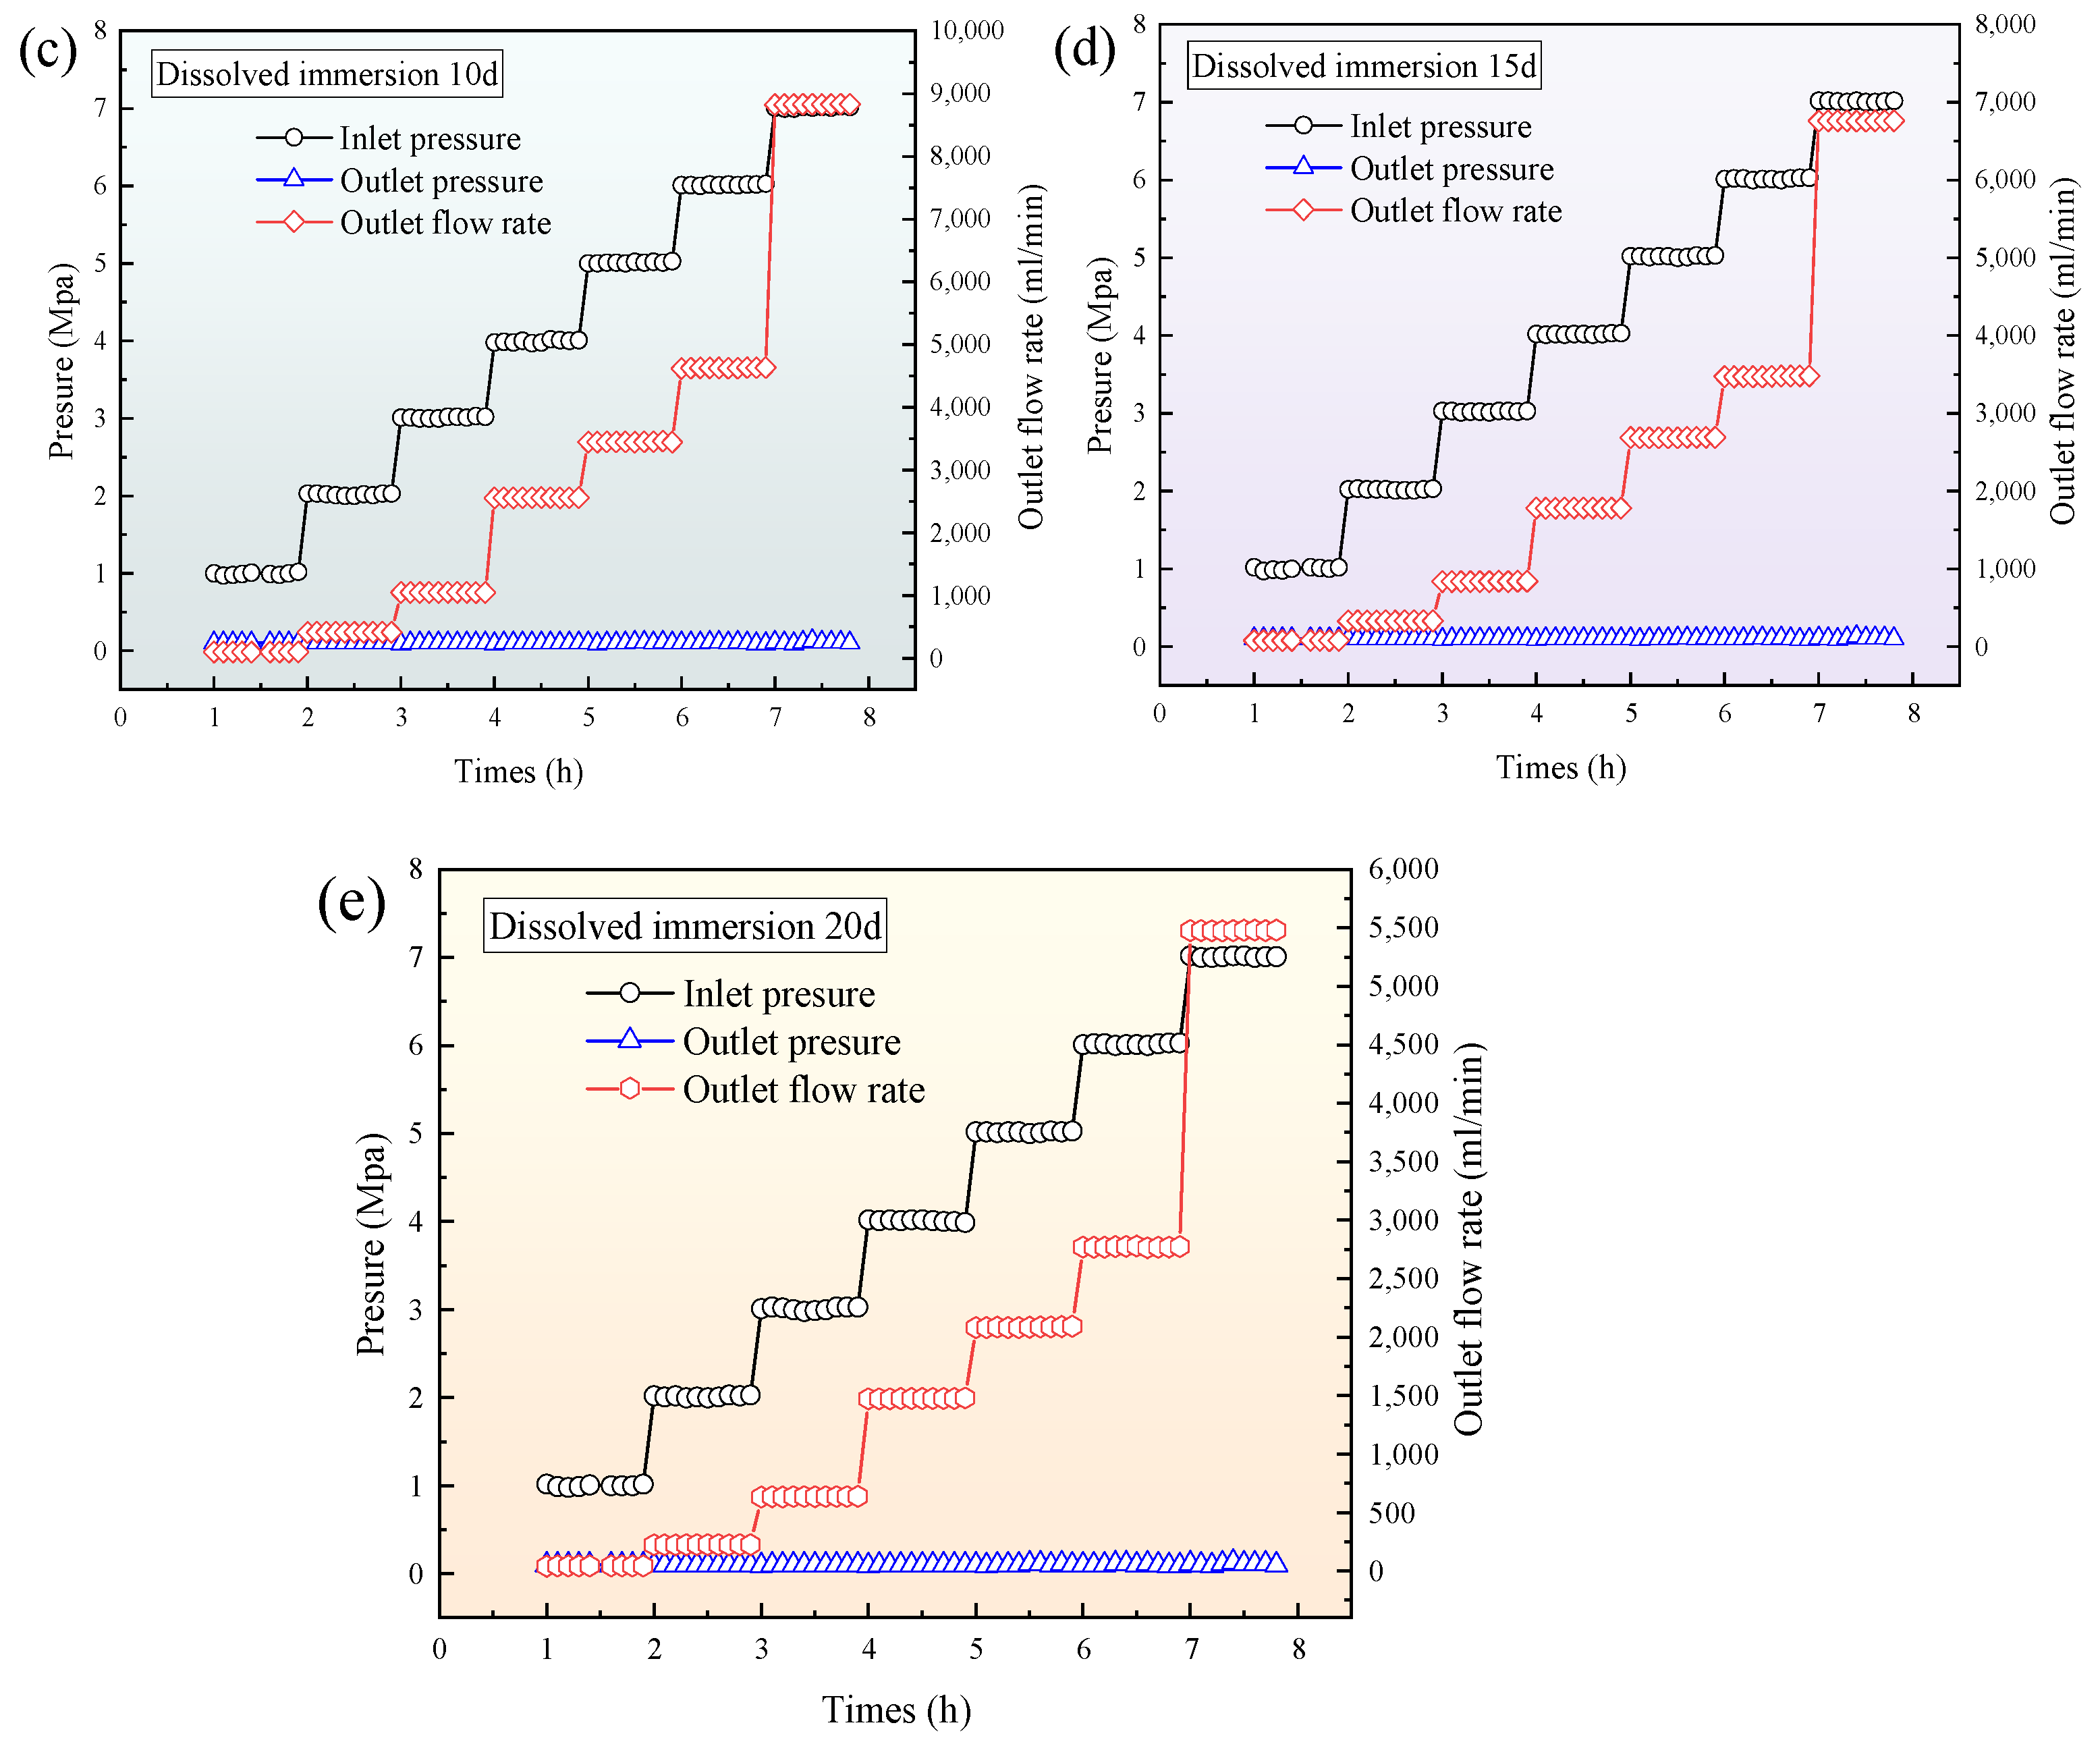
3.4. Relationship Between Outlet Flow Rate and Inlet Pressure of Single-Component CO2 and CH4 Gases with Different Leaching Times

Based on the results of the CO2 and CH4 gas seepage experiments, the relationship curves between the outlet flow rate of the single-component CO2 and CH4 gas and the injection pressure were plotted, as shown in Figure 9.
In the graph, it can be seen that the outlet flow rates of the CO2 and CH4 gases increased with the injection pressure in different impregnation time stages. The outlet flow rate changed with the pressure in two phases: a nonlinear phase (1–5 MPa) and a linear phase (5–7 MPa). As the injection pressure increased, the nonlinear characteristics gradually became less pronounced, and the gas flow transitioned toward the linear phase. This is because the gas flow in the coal was not only influenced by viscous resistance. Additionally, during the impregnation process, supercritical CO2 caused the extraction and dissolution of some organic and inorganic components within the coal, leading to the detachment of some organic matter from the coal’s macromolecular framework. The sample’s pores gradually increased, and the pores were connected through throats, with the pores and throats being more evenly developed. Since the binding force between small molecular substances and the coal’s macromolecular network structure was weak, it was easily weakened or destroyed and could be dissolved out by the solvent [26]. After the residual coal was extracted and dried, more transition pores and mesopores became apparent. This resulted in the transition of the gas flow from a nonlinear to a linear phase as the injection pressure increased during different impregnation times.

3.5. Relationship Between Seepage Pressure Gradient and Permeability of Single-Component CO2 and CH4 Gases with Different Leaching Times

The permeability of coal represents the ease with which fluids can pass through the coal column. Figure 10 illustrates the variation in the permeability of the single-component gases at different pressure gradients over different impregnation times. From Figure 10a, it follows that as the impregnation time of the coal column increased, the permeability of CO2 gas initially increased and then decreased. Between 5 d and 10 d of impregnation, the permeability showed an increasing trend, with an increasing rate of 131.7%. However, from 15 d to 20 d, the permeability started to decline, with a decreasing rate of 18.8%. Nevertheless, compared with the raw coal sample, the CO2 permeability still showed an overall improvement. When the coal column was impregnated for 10 days, CO2 gas molecules could move most easily through the coal column, and the maximum CO2 permeability was about 17.24 × 10⁻¹⁵ m2. This represented a 3.2-fold increase in permeability compared with the coal column with raw coal sample impregnation, indicating that the increase in the impregnation time enhanced the permeability of the coal column.
As the pressure gradient increased, the permeability of CO2 gas with different soaking times showed a pattern of initially decreasing and then increasing. The reason for this phenomenon is that, in the early stages of supercritical CO2 soaking, the pore structure of the coal gradually changed. The originally closed or narrow pores may have opened or expanded, making the gas flow channels smoother and, thus, increasing the flow rate. Secondly, after 10 d of soaking, due to the leaching effect, minerals within the coal were dissolved, causing the small pores to develop and transform into medium and large pores. This resulted in the transformation of the adsorption space into flow space, which increased the permeability. After 20 d of soaking, the coal structure underwent excessive changes. For example, some pores collapsed due to over-leaching, obstructing the flow channels and causing a decrease in permeability.
Additionally, during the supercritical CO2 dissolution process, CO2 occupied a significant number of adsorption sites within the pores and fractures of coal. Previous experimental studies have demonstrated that the reduction in surface free energy during CO2 adsorption is substantially greater than that during CH4 adsorption, indicating a higher adsorption capacity of CO2 compared with CH4 on the coal matrix surface [27]. This process causes an adsorption-induced swelling effect, resulting in increased flow resistance and reduced seepage velocity of CO2 within the coal seams [28]. As the pressure gradient increases, the effective stress gradually decreases, thereby enhancing CO2 seepage through the coal formation [29]. During CO2 adsorption, competitive adsorption occurs between CO2 and CH4 in the coal’s pores and fractures. Under identical conditions, gaseous CH4 possesses a lower dynamic viscosity than CO2, endowing it with a greater migratory capacity. Consequently, CH4 predominantly exists in a free state within the pore-fracture system. Therefore, in the CH4 permeability experiments, the permeability of the coal samples was higher compared with CO2. The CH4 permeability reached its maximum value of 18.30 × 10⁻¹⁵ m2 after 10 d of soaking, as shown in Figure 10b. The maximum values for 5 d, 15 d, and 20 d were 7.31 × 10⁻¹⁵ m2, 13.98 × 10⁻¹⁵ m2, and 11.39 × 10⁻¹⁵ m2, respectively. Compared with the permeability of the raw coal sample, which was 5.70 × 10⁻¹⁵ m2, the permeability after 5 d, 10 d, 15 d, and 20 d increased by 28.24%, 145.26%, and 99.8%, respectively. As the soaking time and pressure gradient increased, the permeability of free CH4 in the coal body gradually increased due to the changes in the pore structure and the leaching effect of supercritical CO2. These factors worked together to cause an increase in the permeability rate of the coal body.

4. Conclusions

Based on the results of this study, the following conclusions can be drawn:
(1)
The evolution of the coal′s pore structure with the supercritical CO2 immersion time showed a staged development characteristic. The original coal sample had a porosity of 2.06%, and after immersion for 5 d, 10 d, 15 d, and 20 d, the porosities increased by 2.78%, 3.26%, 3.22%, and 2.86%, respectively. This evolution process revealed a three-stage variation pattern of the coal porosity: “increase–stabilization–decline”. Based on this, it is suggested that in practical engineering applications, the treatment time should be controlled at around 10 d to achieve the optimal permeability enhancement effect.
(2)
After the supercritical CO2 soaking, during the single-component gas permeability experiment, the outlet flow rates of both CO2 and CH4 showed an initial increase followed by a decrease as the soaking time progressed. Both gases reached their maximum outlet flow at 10 d of soaking. Compared with the raw coal sample, the outlet flow rates of CO2 and CH4 at 10 d increased by 4.49 times and 3.23 times, respectively. After soaking, the CH4 permeability in the coal body was stronger than that of CO2.
(3)
As the pressure gradient increased, the permeability of the CO2 gas for different soaking times showed a characteristic of initially decreasing and then increasing. In contrast, the permeability of the CH4 gas showed a nonlinear increasing trend. When the supercritical CO2 soaking time reached 10 d, due to the extraction and leaching effects of supercritical CO2, the adsorption space within the coal body’s pores transformed into a flow space, resulting in the best permeability for both CO2 and CH4 gases during this stage.
This study investigated the evolution of the coal body porosity and gas seepage characteristics of CO2/CH4 under the influence of the supercritical CO2 solvent immersion time. The findings have theoretical implications for enhancing coalbed methane extraction and achieving CO2 geological storage. However, due to limitations in research methods and experimental conditions, there are still aspects of this study that require further exploration. The next step will involve researching the pore structure evolution and seepage characteristics of coals at different ranks subjected to supercritical CO2 immersion, based on the time effect. Additionally, this study will further explore the impact of the immersion time on the coalbed methane extraction efficiency and the micro-mechanism of CO2 sequestration.

Author Contributions

N.W.: data curation, writing—original draft, writing—review and editing. W.L.: data curation, formal analysis, investigation, supervision, and validation. T.L.: conceptualization, project administration, resources, investigation, and methodology. S.F.: resources, investigation, and methodology. R.L.: resources, investigation, and methodology. L.L.: writing—review and editing. All authors have read and agreed to the published version of the manuscript.

Funding

This research received no external funding.

Data Availability Statement

The data presented in this study are available on request from the corresponding author.

Conflicts of Interest

Author Ning Wang was employed by the company Shaanxi Coal Industry Company Limited. Authors Ning Wang and Tuanjie Li were employed by the company Huangling Mining Group Company Limited. The remaining authors declare that the research was conducted in the absence of any commercial or financial relationships that could be construed as a potential conflict of interest. The companies had no role in the design of the study; in the collection, analyses, or interpretation of data; in the writing of the manuscript, or in the decision to publish the results.

References

  1. Guo, H.; Tang, H.; Wu, Y.; Wang, K.; Xu, C. Gas seepage in underground coal seams: Application of the equivalent scale of coal matrix-fracture structures in coal permeability measurements. Fuel 2021, 288, 119641. [Google Scholar] [CrossRef]
  2. Qiu, L.; Dang, J.; Zhang, J.; Wang, M.; Liu, Q.; Si, L.; Jiang, Z.; Khan, M. Investigating nonlinear resistivity characteristics and mechanisms of coal during various loading stages. J. Appl. Geophys. 2025, 238, 105705. [Google Scholar] [CrossRef]
  3. Song, D.; Liu, Q.; Qiu, L.; Zhang, J.; Majid, K.; Peng, Y.; Zhao, Y.; Wang, M.; Guo, M.; Hong, T. Experimental study on resistivity evolution law and precursory signals in the damage process of gas-bearing coal. Fuel 2024, 362, 130798. [Google Scholar]
  4. Li, R.; Wen, H.; Fan, S.; Wang, H.; Cheng, X.; Mi, W.; Liu, B.; Liu, M. Migration characteristics of constant elements in the process of coal dissolution by liquid CO2. Energy 2024, 295, 131006. [Google Scholar] [CrossRef]
  5. Pang, M.; Pan, H.; Ji, B.; Zhang, H.; Zhang, T. Experimental investigation of flow regime transition characteristics of fractured coal bodies around gas extraction boreholes. Energy 2023, 270, 126758. [Google Scholar] [CrossRef]
  6. Zheng, C.; Jiang, B.; Xue, S.; Chen, Z.; Li, H. Coalbed methane emissions and drainage methods in underground mining for mining safety and environmental benefits: A review. Process Saf. Environ. Prot. 2019, 127, 103–124. [Google Scholar] [CrossRef]
  7. Wen, H.; Yan, L.; Jin, Y.; Wang, Z.; Guo, J.; Deng, J. Coalbed methane concentration prediction and early-warning in fully mechanized mining face based on deep learning. Energy 2023, 264, 126208. [Google Scholar] [CrossRef]
  8. Wen, H.; Cheng, B.; Zhang, D.; Jia, B.; Liu, X. Improving coalbed methane recovery in fragmented soft coal seams with horizontal cased well cavitation. Sci. Rep. 2024, 14, 29942. [Google Scholar] [CrossRef]
  9. Cai, J.; Yang, S.; Hu, X.; Song, W.; Song, Y.; Xu, Q.; Zhang, S. Risk assessment of dynamic disasters induced by gas injection displacement in coal seams. Process Saf. Environ. Prot. 2019, 128, 41–49. [Google Scholar] [CrossRef]
  10. Sun, Y.; Zuo, L.; Li, X.; Liu, X. Enhancing shale gas recovery by carbon dioxide injection: A method of carbon capture, utilization and storage (CCUS). Process Saf. Environ. Prot. 2023, 179, 484–492. [Google Scholar] [CrossRef]
  11. Fang, H.; Sang, S.; Liu, S.; Liu, S. Experimental simulation of replacing and displacing CH4 by injecting supercritical CO2 and its geological significance. Int. J. Greenh. Gas Control 2019, 81, 115–125. [Google Scholar] [CrossRef]
  12. Shen, W.; Ma, T.; Zuo, L.; Yang, X.; Cai, J. Advances and prospects of supercritical CO2 for shale gas extraction and geological sequestration in gas shale reservoirs. Energy Fuels 2024, 38, 789–805. [Google Scholar] [CrossRef]
  13. Lan, Y.; Yang, Z.; Wang, P.; Yan, Y.; Zhang, L.; Ran, J. A review of microscopic seepage mechanism for shale gas extracted by supercritical CO2 flooding. Fuel 2019, 238, 412–424. [Google Scholar] [CrossRef]
  14. Yu, Y.; Liu, J.; Yang, Y.; Wu, D.; Zhai, W.; Miao, F. Experimental study on coal seam permeability enhancement and CO2 permeability caused by supercritical CO2. Front. Earth Sci. 2023, 10, 1062580. [Google Scholar] [CrossRef]
  15. Jiang, R.; Yu, H. Interaction between sequestered supercritical CO2 and minerals in deep coal seams. Int. J. Coal Geol. 2019, 202, 1–13. [Google Scholar] [CrossRef]
  16. Niu, Q.; Cao, L.; Sang, S.; Zhou, X.; Wang, W.; Yuan, W.; Ji, Z.; Wang, H.; Nie, Y. Study on the anisotropic permeability in different rank coals under influences of supercritical CO2 adsorption and effective stress and its enlightenment for CO2 enhance coalbed methane recovery. Fuel 2020, 262, 116515. [Google Scholar] [CrossRef]
  17. Hashemi, S.S.; Zoback, M.D. Permeability evolution of fractures in shale in the presence of supercritical CO2. J. Geophys. Res. Solid Earth 2021, 126, e2021JB022266. [Google Scholar] [CrossRef]
  18. Li, W.; Liu, Z.; Su, E.; Cheng, Y. Experimental investigation on the effects of supercritical carbon dioxide on coal permeability: Implication for CO2 injection method. Energy Fuels 2018, 33, 503–512. [Google Scholar] [CrossRef]
  19. Long, H.; Lin, H.-F.; Yan, M.; Bai, Y.; Tong, X.; Kong, X.-G.; Li, S.-G. Adsorption and diffusion characteristics of CH4, CO2, and N2 in micropores and mesopores of bituminous coal: Molecular dynamics. Fuel 2021, 292, 120268. [Google Scholar] [CrossRef]
  20. Long, H.; Lin, H.; Yan, M.; Chang, P.; Li, S.G.; Bai, Y. Molecular simulation of the competitive adsorption characteristics of CH4, CO2, N2, and multicomponent gases in coal. Powder Technol. 2021, 385, 348–356. [Google Scholar] [CrossRef]
  21. Yao, Y.; Liu, D. Petrophysical properties and fluids transportation in gas shale: A NMR relaxation spectrum analysis method. J. China Coal Soc. 2018, 43, 181–189. [Google Scholar]
  22. Zhai, C.; Sun, Y.; Fan, Y.; Yang, P.; Ge, X.; Wu, F.; Xu, J.; Yu, X.; Liu, T.; Zhao, Y. Application and prospect of low-field nuclear magnetic resonance technology in accurate characterization of coal pore structure. J. China Coal Soc. 2022, 47, 828–848. [Google Scholar]
  23. Li, R.; Wen, H.; Wang, H.; Fan, S.; Mi, W.; Liu, B.; Cheng, X.; Liu, M. Experimental simulation of water-coal interactions during liquid CO2 injection into coal beds. Energy 2024, 295, 130986. [Google Scholar] [CrossRef]
  24. Wang, H.; Wen, H.; Li, Z.; Liang, R.; Wang, F.; Fan, S.; Li, R. Experimental study on microstructural modification of coal by liquid CO2 extraction. Fuel 2023, 348, 128631. [Google Scholar] [CrossRef]
  25. Si, L.; Zhang, H.; Wei, J.; Li, B.; Han, H. Modeling and experiment for effective diffusion coefficient of gas in water-saturated coal. Fuel 2021, 284, 118887. [Google Scholar] [CrossRef]
  26. Wang, L.; Su, X.; Zhao, W.; Xia, D.; Wang, Q. Enhancement of biomethane production from coal by supercritical CO2 extraction. J. CO2 Util. 2023, 74, 102545. [Google Scholar] [CrossRef]
  27. Nie, B.; Lu, H.; Li, X.; Li, L.; Lv, C.Q. Experimental study on the characteristic of coal deformation during gas adsorption and desorption process. J. China Coal Soc. 2015, 40, 754–759. [Google Scholar]
  28. Liu, Y.B.; Cao, S.G.; Li, Y.; Wang, J.; Guo, P.; Xu, J.; Bai, Y.J. Experimental study of swelling deformation effect of coal induced by gas adsorption. Chin. J. Rock Mech. Eng. 2010, 29, 2484–2491. [Google Scholar]
  29. Li, Y.; Yang, Z.; Ju, X.; Zhou, A. Adsorption and diffusion behavior of CH4 and CO2 in closed and open pores from Zhaozhuang coal. Energy Fuels 2022, 36, 2582–2590. [Google Scholar] [CrossRef]
Figure 1. Experimental platform for supercritical CO2 solubilization of coal bodies.
Processes 13 01419 g001
Figure 2. Single-component gas seepage experimental system.
Processes 13 01419 g002
Figure 3. Experimental samples after supercritical CO2 solubilization for different treatment times.
Processes 13 01419 g003
Figure 4. Experimental procedure.
Processes 13 01419 g004
Figure 5. T2 profile of coal samples in fully saturated water state ((a) Raw coal sample, (b) 5 d, (c) 10 d, (d) 15 d, and (e) 20 d).
Processes 13 01419 g005
Figure 6. Changes in porosity fractions and cumulative porosity of water-saturated and centrifuged coals for different dissolution leaching durations ((a) raw coal sample, (b) 5 d, (c) 10 d, (d) 15 d, and (e) 20 d).
Processes 13 01419 g006aProcesses 13 01419 g006b
Figure 7. Time-varying properties of CO2 gas seepage in coal samples with different leaching times ((a) raw coal sample, (b) 5 d, (c) 10 d, (d) 15 d, and (e) 20 d).
Processes 13 01419 g007
Figure 8. Time-varying properties of CH4 gas seepage in coal samples with different leaching times ((a) raw coal sample, (b) 5 d, (c) 10 d, (d) 15 d, and (e) 20 d).
Processes 13 01419 g008aProcesses 13 01419 g008b
Figure 9. Relationship between inlet pressure and flow rate of single-component gas seepage at different leaching times ((a) CO2 gas; (b) CH4 gas).
Processes 13 01419 g009
Figure 10. Relationship between pressure gradient and permeability of single-component gases with different solubilization times ((a) CO2 gas; (b) CH4 gas).
Processes 13 01419 g010
Table 1. Results of industrial analysis of coal sample.
DesignationIndustrial Analysis/%
(Mad)(Vad)(Aad)(FCad)
Benxi Group 8# coal sample0.7412.6426.0060.62
Note: Mad denotes moisture, Vad denotes volatile matter, Aad denotes ash, and FCad denotes fixed carbon.
Table 2. Experimental program of supercritical-state CO2 dissolution leaching of coal body.
Serial NumberDrying Time (h)Temperature (°C)Pressure (MPa)Dissolution Time (d)Note
18.065.08.0Raw coal sampleInsoluble leaching treatment
Supercritical CO2 dissolution leaching treatment
28.065.08.05.0
38.065.08.010.0
48.065.08.015.0
58.065.08.020.0
Table 3. Experimental program for one-component gas seepage.
Name of ExperimentSeepage GasInjection Pressure (MPa)Name of ExperimentSeepage GasInjection Pressure (MPa)
CO2 seepage experimentCO21.0CH4 seepage experimentCH41.0
2.02.0
3.03.0
4.04.0
5.05.0
6.06.0
7.07.0
Disclaimer/Publisher’s Note: The statements, opinions and data contained in all publications are solely those of the individual author(s) and contributor(s) and not of MDPI and/or the editor(s). MDPI and/or the editor(s) disclaim responsibility for any injury to people or property resulting from any ideas, methods, instructions or products referred to in the content.

