Article

Macroscopic Simulation Study on Inhomogeneity of Small Billet Continuous Casting Mold

College of Metallurgy and Energy, North China University of Science and Technology, Tangshan 063210, China
*
Authors to whom correspondence should be addressed.
These authors contributed equally to this work.
Processes 2025, 13(5), 1415; https://doi.org/10.3390/pr13051415
Submission received: 16 April 2025 / Revised: 29 April 2025 / Accepted: 30 April 2025 / Published: 6 May 2025
(This article belongs to the Section Energy Systems)

Abstract

:
In the steel industry, small billets have become the main type of billet for steel production due to the efficiency of the continuous casting process. However, the segregation that occurs during solidification remains a significant issue affecting billet quality. This study conducted a macroscopic segregation analysis on 172 mm × 172 mm small square billets and investigated the influence of various process parameters on the distribution of carbon within the cast billets. The results showed that an increase in superheat led to a 0.036% rise in the carbon difference and an increase in the central segregation value from 0.357% to 0.364%. Increasing the cooling intensity resulted in a 0.037% rise in the carbon difference and a decrease in the negative segregation value from 0.266% to 0.250%. Higher casting speeds caused the carbon difference to reach a minimum of 0.107% at a speed of 1.6 m·min−1, while the central segregation value reached its lowest point of 0.353% at a casting speed of 2.6 m·min−1.

1. Introduction

The steel industry is a vital pillar of the national economy and plays a key role in driving economic development [1,2]. Technological innovation is central to upgrading domestic products into high-performance materials [3,4]. In this context, ensuring the sustainable development of steel materials has become a strategic priority [5]. With the rapid advancement of continuous casting technology, small billets have emerged as important products in the steel industry due to their high production efficiency and broad range of applications, including building structures, mechanical manufacturing, and wire rod processing. During the continuous casting process, the mold plays a critical role. The surface quality of the mold directly affects the surface quality of the cast billet and the heat transfer during the casting process [6,7]. The complex flow behavior of molten steel within the mold, along with associated phenomena, significantly affects the quality of the cast billet [8,9]. Physical simulation experiments alone often fall short in fully capturing the dynamic behavior of the system due to simplifications and experimental limitations. Therefore, numerical simulation techniques are employed to complement physical experiments and provide a more comprehensive understanding of the casting process [10,11,12].
In continuous casting, the element segregation of molten steel within the mold is significantly influenced by process parameters such as superheat, cooling intensity and casting speed. Variations in these parameters alter the heat and mass transfer conditions during solidification, leading to inhomogeneous element distribution [13]. Element segregation is a critical factor affecting billet quality. Severe segregation can result in significant compositional variations within the billet, thereby compromising its overall quality. The segregation index can clearly highlight the impact of different process parameters on the macrosegregation of cast billets. Therefore, in the production of cast billets, special attention must be given to controlling segregation during the continuous casting process [14,15].
In recent years, extensive research has been conducted on the macroscopic segregation behavior of slabs within the mold. Regarding the macroscopic segregation of round billets, Dong et al. [16] developed a prediction model for segregation evolution in continuous casting and found that the Voller–Beckermann model produced the most accurate results. Yang et al. [17] established a 3D/2D multiphase solidification model using the Eulerian–Eulerian approach to predict the macrostructure and segregation of round billets. Their results showed that final electromagnetic stirring (F-EMS) not only improved central segregation but also induced the formation of negative segregation zones. Wu et al. [18] demonstrated that when two electromagnetic devices operated with opposite stirring directions and the EMSFN device parameters were set to 50 Hz and 400 A, the macroscopic segregation of carbon was significantly reduced compared to using only M-EMS. Kengo et al. [19] developed a numerical model to simulate negative segregation during continuous casting. The results indicated that negative segregation was most severe near slab corners when electromagnetic stirring was applied. Moreover, the phenomenon was effectively suppressed in the absence of electromagnetic stirring or at low casting speeds. For large square billets, Guan et al. [20] proposed a longitudinal coupling model to analyze the formation of V-shaped segregation under varying superheat and cooling rates. They found that reducing superheat suppressed the formation of V-shaped segregation, while a decrease in the cooling rate slightly increased segregation. Zhang et al. [21] studied the effect of initial mold temperature on macrosegregation during billet solidification. They concluded that a higher temperature gradient, enhanced early-stage heat convection, and delayed solidification led to more pronounced segregation. Ma et al. [22] established a coupled model involving fluid flow, solidification, and solute transport. The results showed that when the solid fraction at the center was 0.3, the model’s predictions closely matched experimental data. In studies on slab billets, Zhao et al. [23] investigated central segregation in thick slabs, establishing a segregation model and analyzing solute distribution under different ecological conditions. They identified the critical threshold for mitigating segregation under heavy reduction and highlighted the significant role of the negative diffusion coefficient. Chen et al. [24] developed a one-quarter symmetry model of the slab and validated it using experimental and simulation data. Their findings indicated that centerline segregation arises from solute redistribution and the progressive movement of the solidification front. Additionally, the solute distribution at the end of solidification was found to be highly dependent on the geometry of the liquid cavity.
Currently, both domestic and international studies have conducted extensive research on macroscopic segregation during the continuous casting of round billets [16,17,18,19], large square billets [20,21,22], and slab billets [23,24]. However, compared with these billet types, research on small square billets—particularly the simulation of macroscopic segregation control—remains relatively limited. Macroscopic segregation directly affects the internal quality and surface defects of small square billets [25]. Therefore, it is of great significance for this paper to study the carbon element segregation behavior in the continuous casting mold of small billets. In continuous casting molds, key process parameters such as superheat, cooling intensity and pouring speed have significant influences on the quality of the cast billet. Superheat affects the solidification duration and solute redistribution; cooling intensity determines the flow behavior of molten steel and the mold’s thermal exchange; and casting speed controls the solidification rate and grain structure. Properly optimizing these parameters ensures uniform element distribution and mechanical strength while reducing defect formation. Despite the important role of small square billets among various billet forms, studies focusing on the mold behavior of these billets are still insufficient. This study focuses on the macroscopic segregation model of the 172 mm × 172 mm small square billet continuous casting mold. In actual production, the superheat, cooling intensity and casting speed are controlled by adjusting the heating time of the molten steel, the flow rate of the cooling water and the amount of molten steel added. By adjusting different parameters (superheat, cooling intensity and casting speed), it simulates the distribution characteristics of carbon element in the mold, providing theoretical support for the actual production of small square billets.

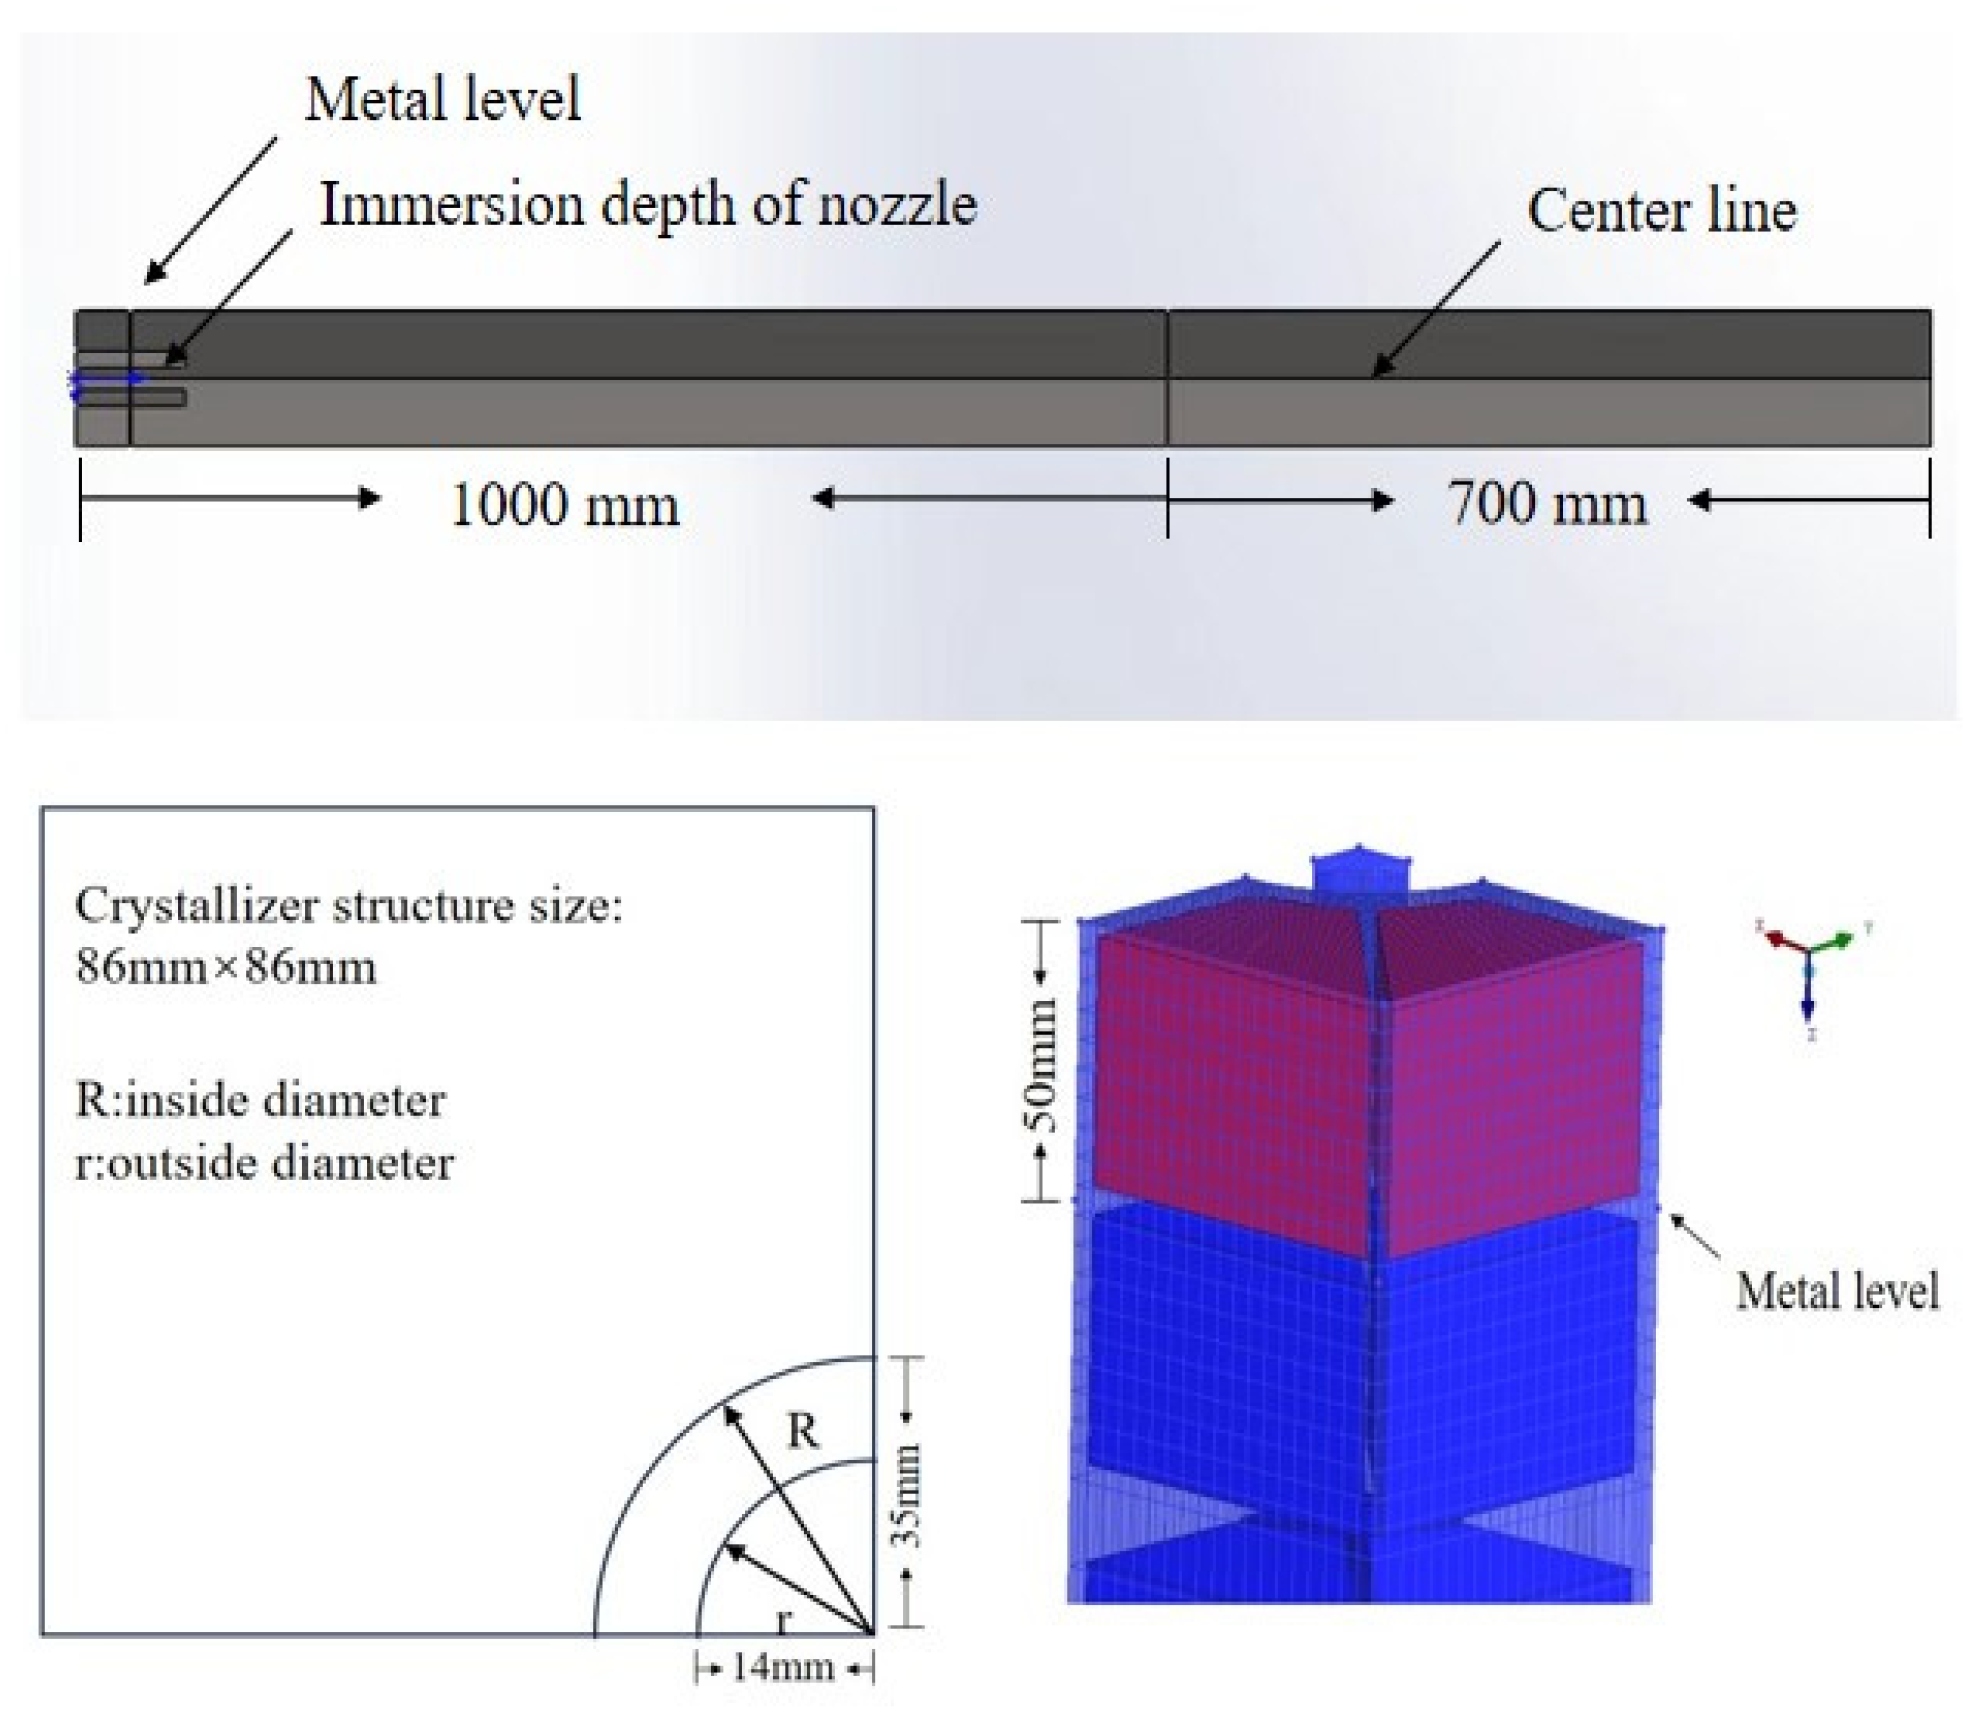
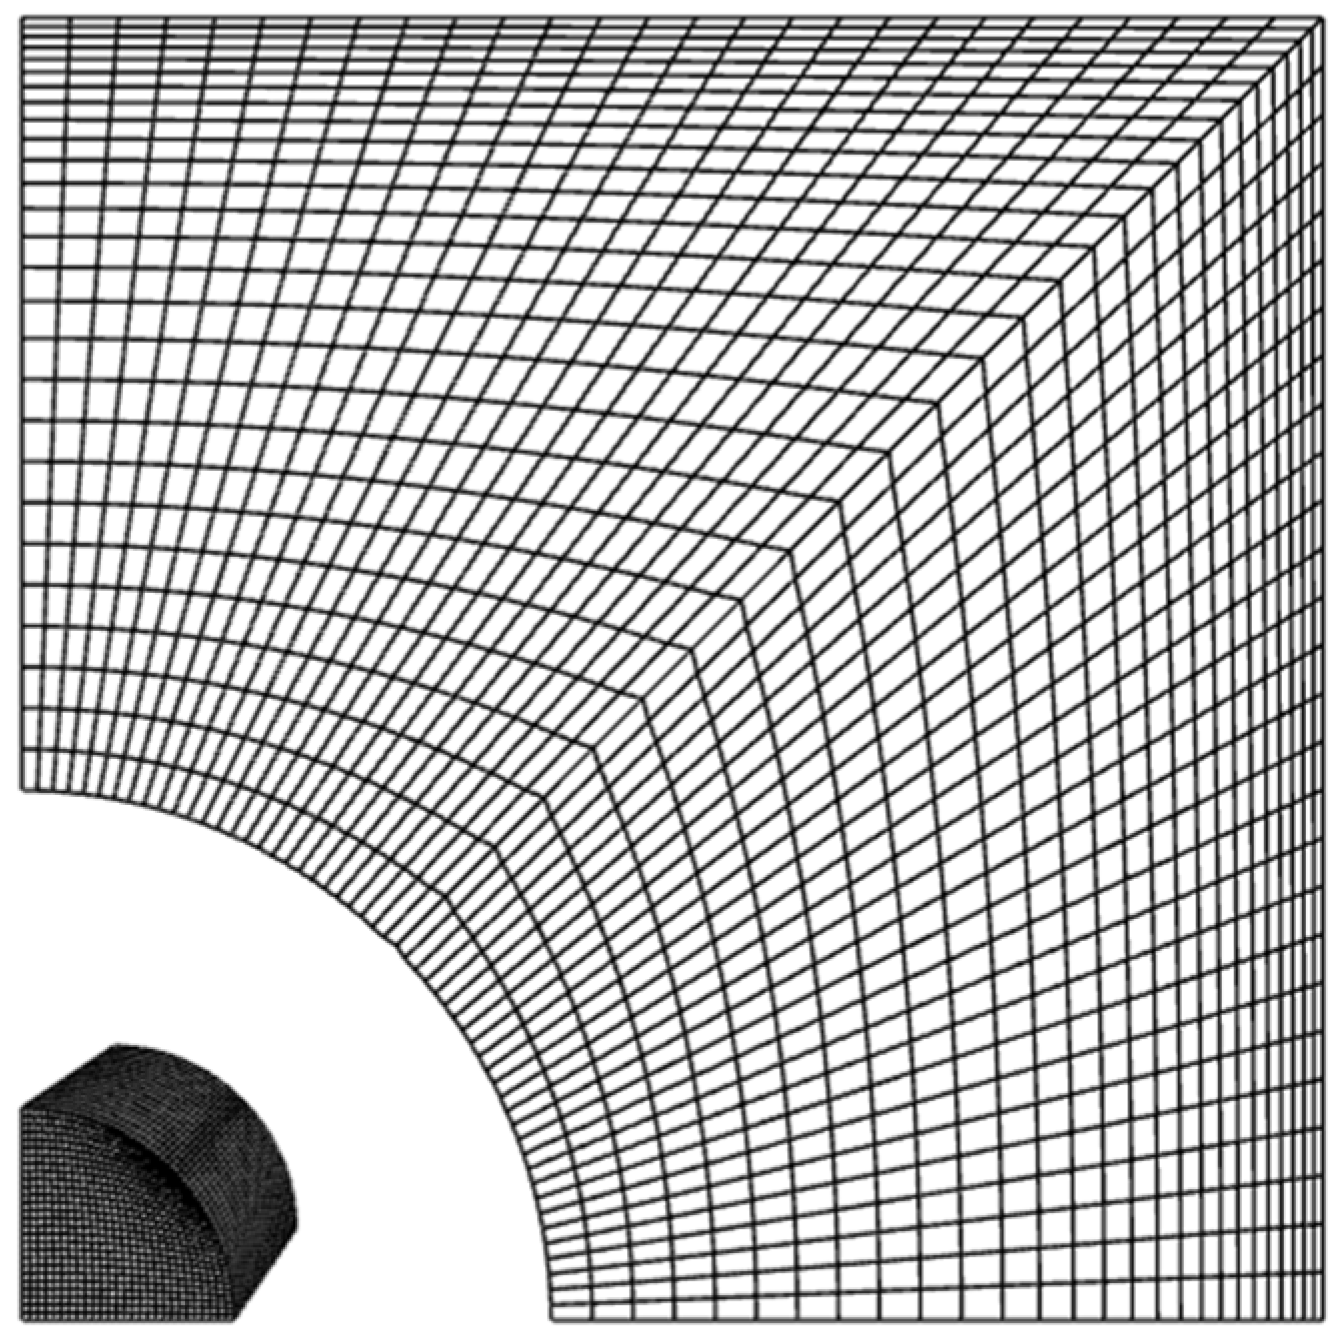
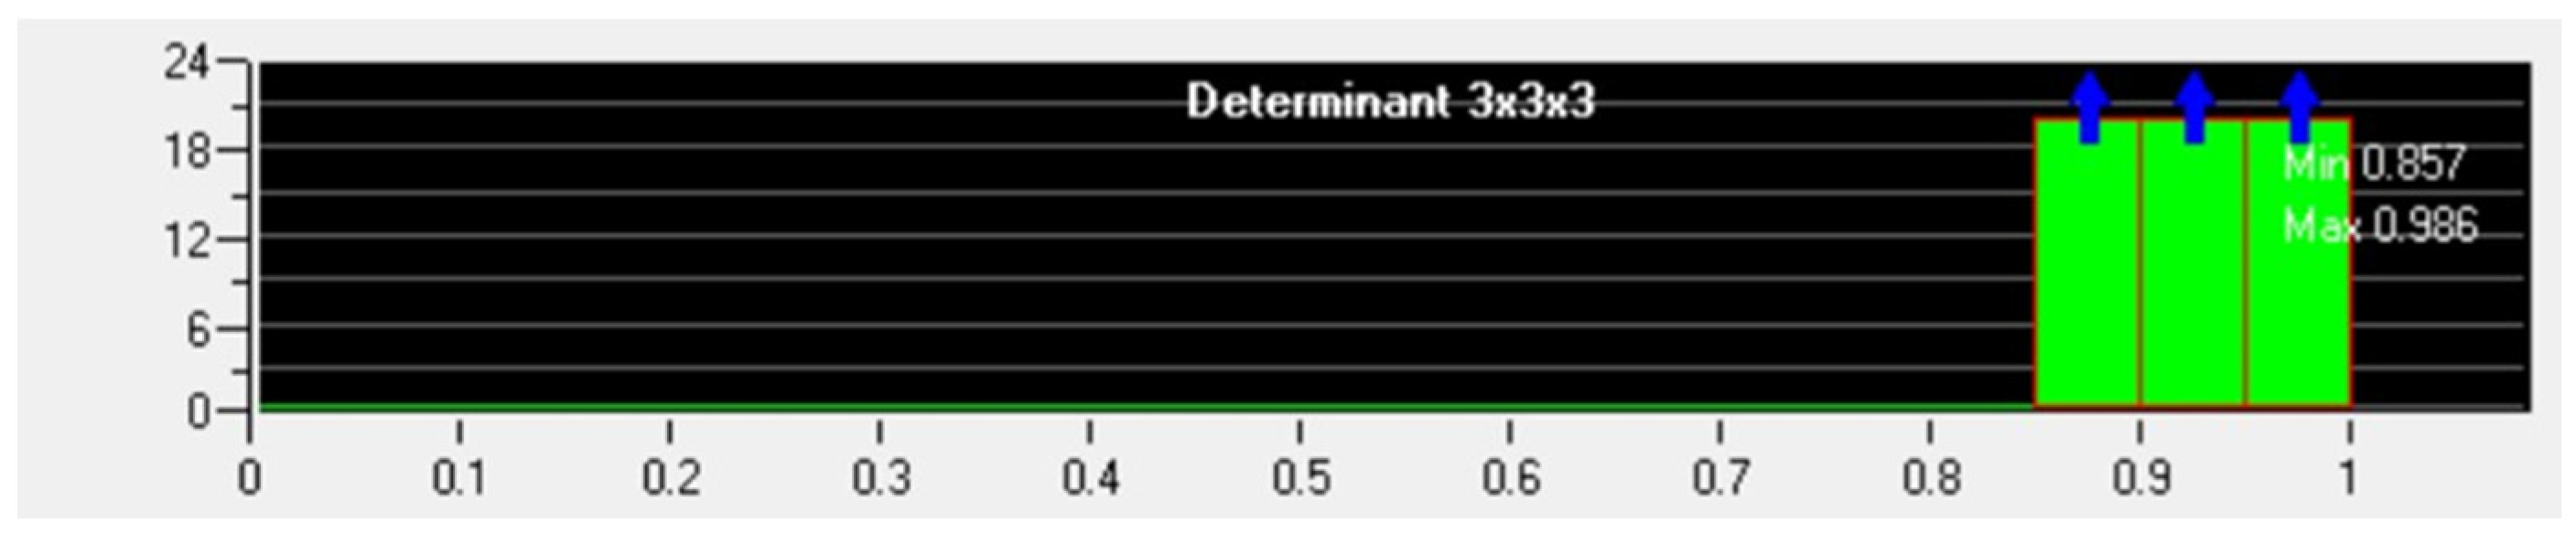
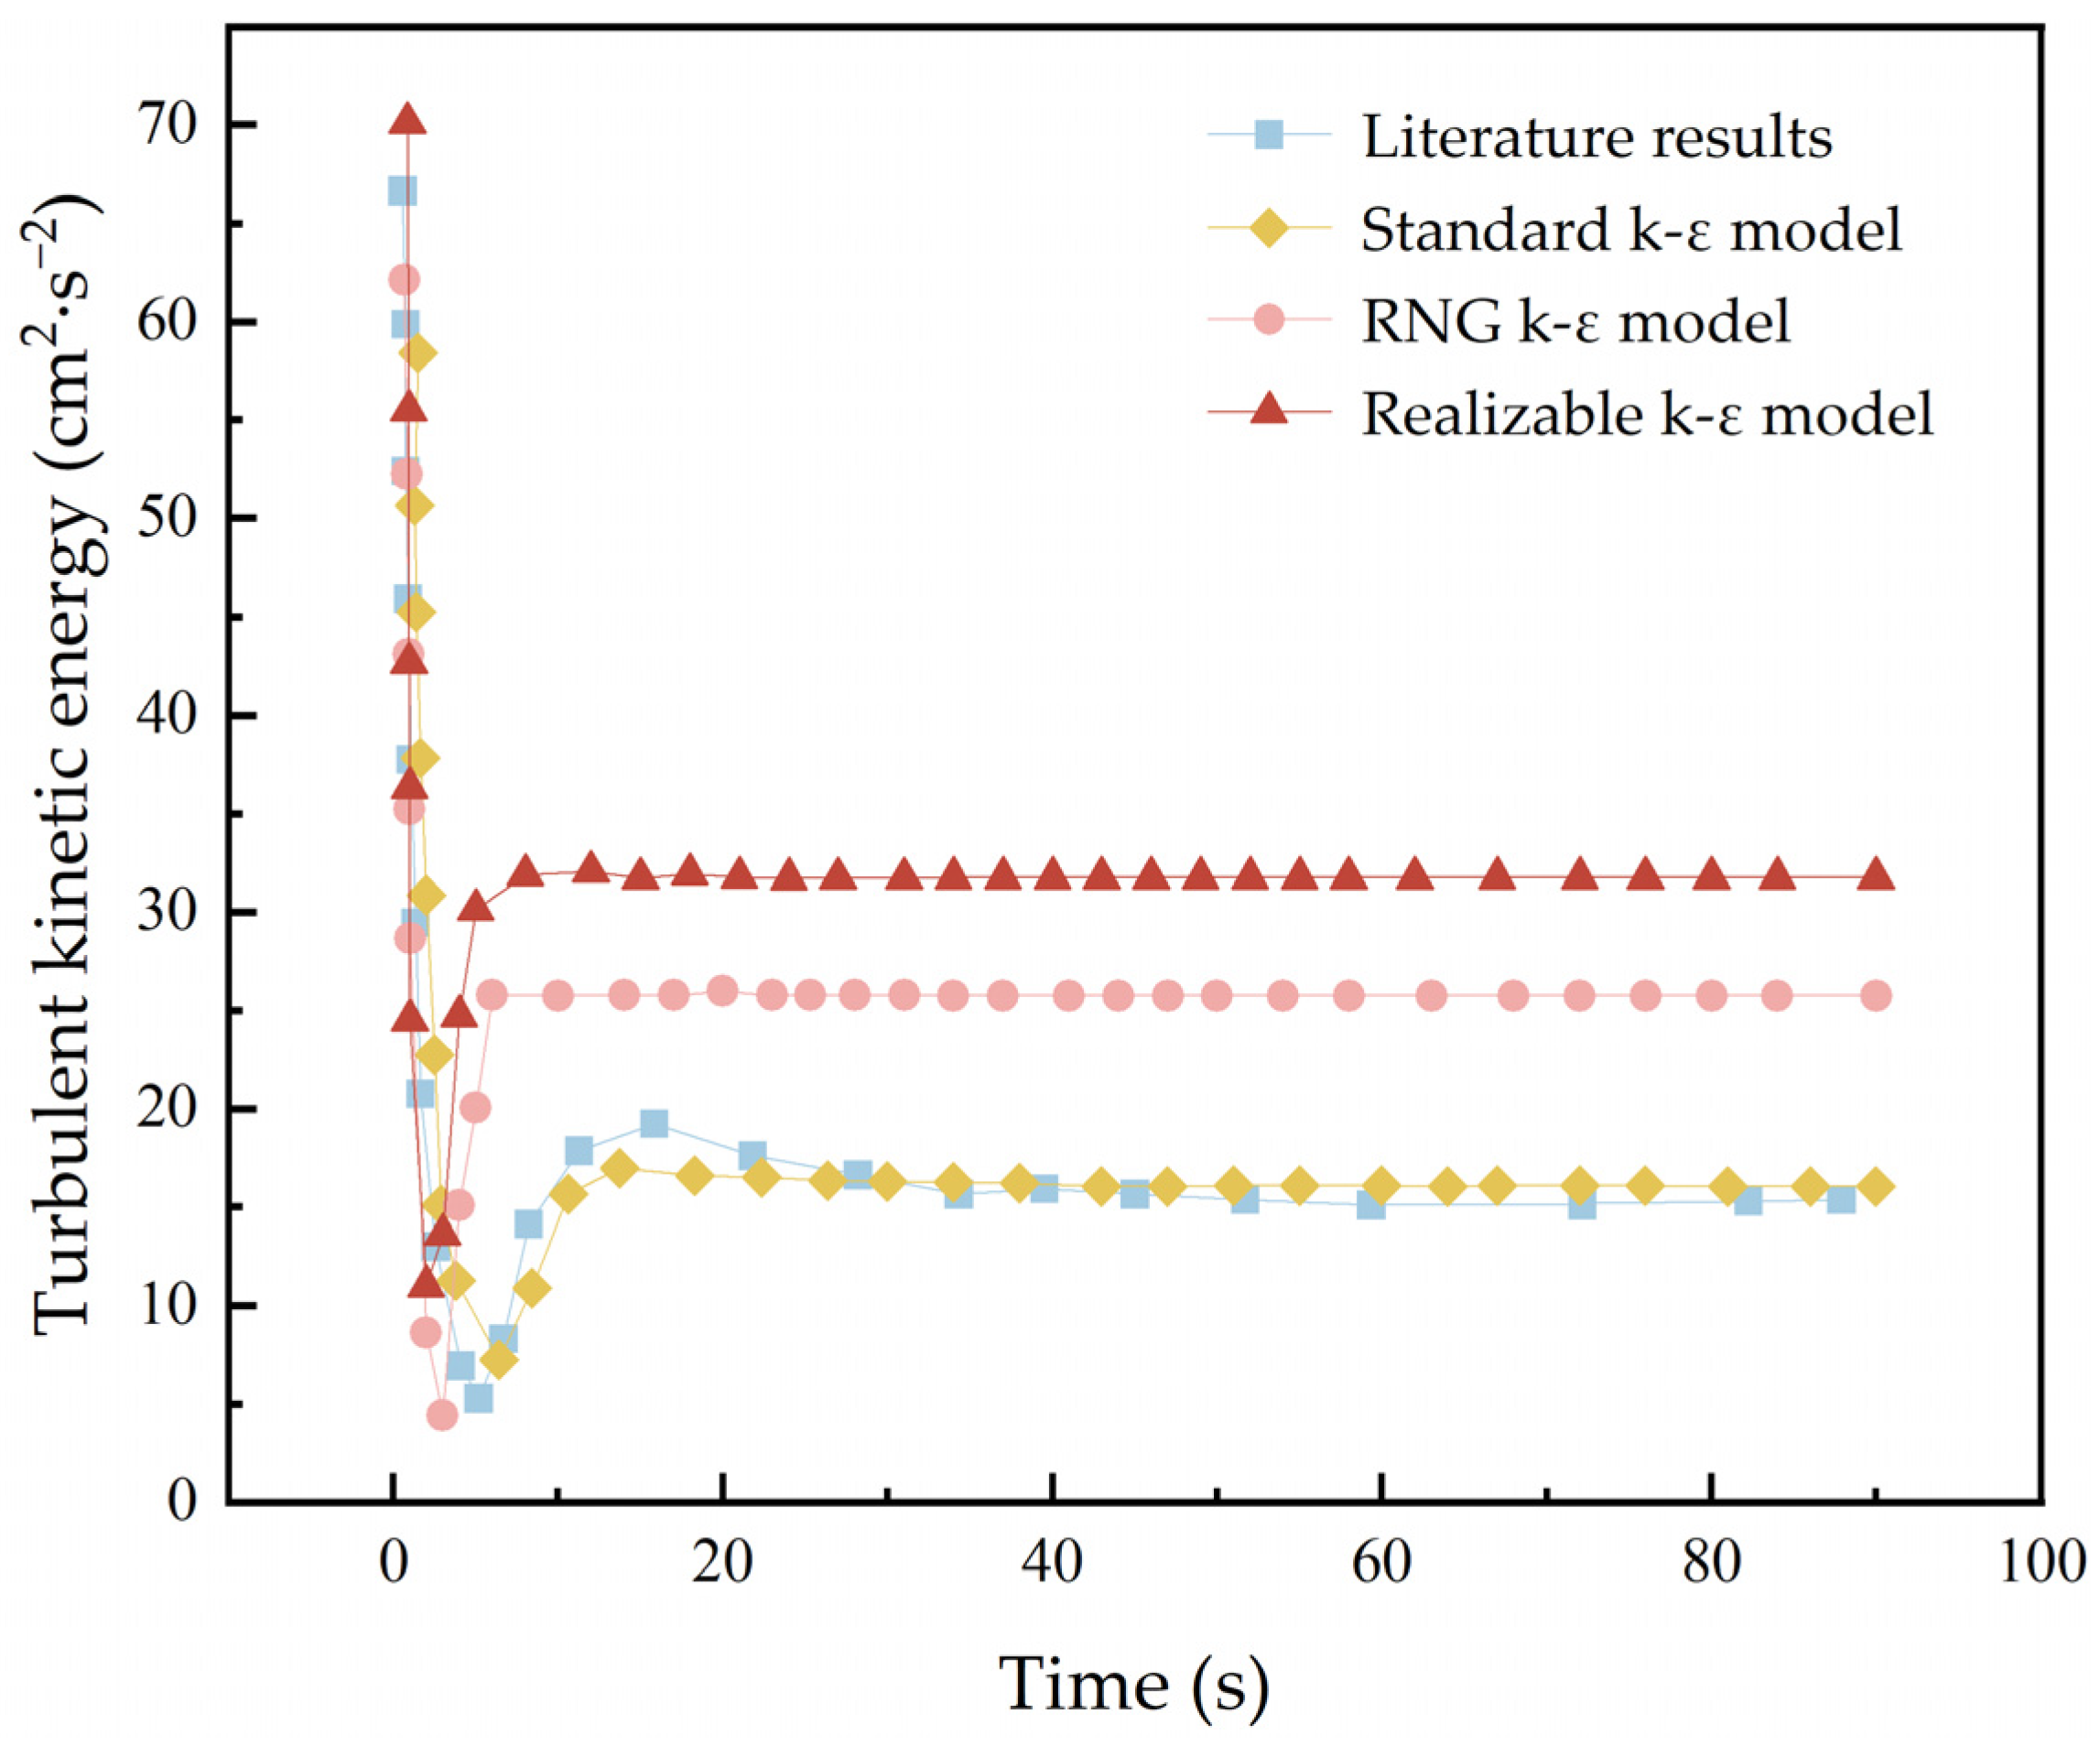
2. Model Development

In this study, a numerical model was developed for the continuous casting mold of square billets with dimensions of 172 mm × 172 mm. The model was based on real industrial dimensions to ensure both simulation accuracy and practical applicability. A straight-tube submerged entry nozzle (SEN) was selected instead of a side-port design, primarily to mitigate the risk of steel breakout caused by the high-velocity fluid erosion of the thin initial shell—an especially important consideration for small-section billets. Figure 1 illustrates the continuous casting mold, including both the overall dimensions and the mesh configuration. The mold length was set to 1000 mm to meet simulation requirements. To ensure the development of turbulent flow and avoid backflow phenomena in ANSYS Fluent simulations, the computational domain was extended by an additional 700 mm below the mold.
During continuous casting, molten steel flow entering the mold can be uneven and complex. A turbulence model was employed to effectively capture the intricate flow behavior, fulfilling the requirements for simulating turbulent flow and enhancing the accuracy and reliability of the numerical results [26].
A three-dimensional mathematical model was constructed to simulate flow, heat transfer, and solidification in the mold, based on its geometry and the SEN configuration. Owing to geometric symmetry, a simplified one-quarter model was built using the 2009 version ANSYS ICEM software 12.0 of 2009 by neglecting internal flow asymmetry. This approach improved computational efficiency while maintaining accuracy. The cross-section of the model was 86 mm × 86 mm, with the SEN having an inner diameter of 14 mm and an outer diameter of 35 mm. The immersion depth of the SEN was set to 80 mm. To closely replicate actual engineering conditions, a 50 mm-thick slag layer was added at the top of the mold to account for the effect of mold flux at the slag/metal interface. To enhance simulation precision, hexahedral meshing was used in both the SEN and mold computational domains, with local mesh refinement at key interfaces. Due to differences in operational conditions, the mesh density varied accordingly, requiring careful mesh adjustment to ensure optimal simulation performance.
Near the mold wall, the temperature gradient exhibits significant variations, making it essential to account for boundary layer effects. As shown in Figure 2, to ensure simulation accuracy—particularly in the analysis of heat transfer and solidification—mesh refinement was applied to the boundary layer of the model. After refinement, the total mesh count reached approximately 800,000.
In ANSYS Fluent simulations, maintaining high mesh quality is crucial for ensuring computational accuracy and stability. To assess the mesh quality of the mold model, the 3 × 3 × 3 determinant criterion in ANSYS ICEM software was applied, with a quality threshold set above 0.5. As shown in Figure 3, the generated mesh achieved a quality level exceeding 0.8, and no negative mesh elements were observed.
Research on macroscopic segregation is mainly based on the solute redistribution equation. It is believed that various types of macroscopic segregation phenomena in castings can be quantitatively described by fluid flow, mass transfer, and heat transfer, making the calculation in this regard possible. This paper is based on the framework included in the 2009 version of the commercial software Fluent, and a component transport model is used to describe the solute redistribution behavior during the solidification process of molten steel in the mold. The main mathematical expressions for the solute redistribution phenomenon include the lever rule, the Scheil law, and some improved back-diffusion models. Their mathematical expressions are as follows:
(1) The lever rule:
The lever rule is widely applied in phase equilibrium. It is assumed that the solute elements can diffuse infinitely in the solid and liquid phases.
ρ C i t + ρ f l u l C l , i + 1 f l u p = ρ f l D l , i C l , i + 1 f l D s , i C s , i
C s , i = k i C l . i
In Equation (1), D l . i represents the diffusion coefficient of the element in the liquid phase in m2·s−1 and D s , i denotes the diffusion coefficient of the element in the solid phase in m2·s−1.
(2) The Scheil equation (Scheil–Gulliver equation)
The Scheil equation primarily describes a scenario where the solid–liquid interface is in thermal equilibrium, with solute elements exhibiting no diffusion in the solid phase but being able to mix uniformly in the liquid phase, allowing for infinite diffusion in the liquid phase.
ρ C l , i t + ρ f l u l C l , i + 1 f l u p = f l ρ D l , i C l , i
k i C l , i t ρ 1 f l + t ρ 1 f l C l , i
On the basis of the original equation, the solute Fourier coefficient and back-diffusion coefficient are introduced, providing a more detailed consideration of the diffusion of solute elements in the solid phase [27].
ρ f l u l C l , i + 1 f l u p = f l ρ D l , i C l , i k i C l , i t ρ 1 f l + t ρ 1 f l C l , i β k i 1 f i ρ C l , i t
C s , i = k i C i 1 1 β k i 1 f l k i 1 1 β k i = k i C l , i
β = 2 α i
α i = D s , i · t f X 2 = 4 D s , i · t f λ 2 2
(3) The standardized segregation index reflects the segregation of carbon elements within the crystallizer and serves as an important criterion for measuring the degree of segregation. Its standardized segregation index is defined as Ci/Co, where Ci represents the actual concentration of carbon elements at a certain point, and Co denotes the average concentration of carbon elements. It includes Cn, the negative segregation index; Cc, the central segregation index; and Cm, the maximum positive segregation index. The closer the standardized segregation index is to 1, the more uniform the distribution of carbon elements [28].
(4) Boundary Condition Settings at the Mold Inlet
Since molten steel enters through the SEN, the inlet boundary condition is applied at the SEN inlet. A velocity inlet is specified as the boundary condition type, with the inlet velocity determined based on the casting speed using the principle of mass conservation. The temperature is set to the molten steel’s pouring temperature. The velocity conversion formula is as follows [29]:
v i n l e t = v o u t l e t A o u t l e t A o u t l e t
In Equation (9), v i n l e t represents the velocity at the mold inlet, m · s 1 ; v o u t l e t denotes the casting strand withdrawal speed, m · s 1 ; A i n l e t is the cross-sectional area of the mold inlet, m 2 ; and A o u t l e t is the cross-sectional area of the mold outlet, m 2 .
The initial values of turbulence properties k and ε at the inlet are as follows:
k = 0.01 v i n l e t 2
ε = 2 k 1.5 / d n o z z l e
In Equation (11), d n o z z l e is the equivalent hydraulic diameter, m .
(5) Considering the symmetry of the model and the internal flow, two central surfaces were designated as symmetry planes. The velocity component perpendicular to these symmetry planes was set to zero, while the normal gradients of all other physical quantities along the symmetry planes were also defined as zero.
(6) The outlet is located at the bottom of the mold model. To ensure mass conservation between the inlet and outlet and to allow full development of the fluid flow, the outlet boundary condition is defined as “outflow”.
(7) Remaining simulation parameters
The parameters used in this simulation are shown in Table 1.
(8) ANSYS Fluent solution algorithm selection
ANSYS Fluent provides two types of segregated solvers: the Pressure-Based Solver and the Density-Based Solver. The Pressure-Based Solver is particularly suitable for incompressible fluid simulations, as it first solves the velocity field using the momentum equations and subsequently corrects it with the pressure equation to satisfy the continuity condition. Since the pressure equation is derived from both continuity and momentum equations, this ensures that the simulated flow field satisfies the principles of mass and momentum conservation.
In this study, considering the fluid flow assumptions and the chosen governing equations, as well as practical computational considerations, a transient pressure-based solver is adopted. The SIMPLEC algorithm is used for pressure–velocity coupling, while the gradient and pressure are calculated using the least-squares cell-based method combined with the PRESTO (Pressure Staggering Option) scheme.
In finite element analysis (FEA), mesh density plays a critical role in determining solution accuracy [30]. While finer meshes generally yield more precise results, they also significantly increase computational costs in practical engineering applications. Beyond a certain refinement level, further mesh subdivision provides diminishing returns in accuracy. Therefore, it is important to apply finer meshes to critical regions of the model, while coarser meshes can be used in areas far from key constraints and loads. This approach optimizes computational efficiency by allocating resources to the most impactful areas of the simulation.
In numerical simulations of both steady-state and transient flows, verifying mesh independence is essential to ensure the accuracy and reliability of the results. This process helps determine the optimal mesh density required for precise calculations. In this study, the control variable method is employed: simulations are conducted using different mesh densities while keeping all other operating conditions, reference parameters, and boundary conditions constant.
The reference condition used for this analysis includes a nozzle immersion depth of 100 mm and a casting speed of 1.6 m·min−1. The primary evaluation criterion is the variation in molten steel velocity at the nozzle’s center cross-section over the entire simulation time. A total of five different mesh configurations, as summarized in Table 2, are compared to assess their impact on the velocity magnitude and to confirm mesh independence.
As shown in Figure 4, increasing the number of grid cells increases from 190,000 to 1,000,000 leads to a gradual reduction in velocity distribution deviation within the range of 100 mm to 500 mm. The results become increasingly consistent with finer grids, and the convergence behavior approaches a stable state. When the grid size is reduced to 6 mm, the velocity distribution closely matches that of the 4 mm grid, with minimal deviation. In contrast, an 8 mm grid results in noticeably greater deviation compared to the 6 mm case. These findings indicate that further mesh refinement beyond 6 mm yields diminishing returns in accuracy while significantly increasing computational cost. Therefore, the 6 mm grid is deemed sufficiently accurate and is selected as the reference mesh size for subsequent simulations.
To verify the accuracy of the simulation model used in this study, the effect of casting speed on the turbulent kinetic energy at the center of the mold liquid surface was compared to the results from Qiu et al. [31]. Figure 5 presents a comparison of the simulation results under different turbulence models with those from Qiu et al. The simulation parameters are as follows: a casting speed of 5 m·min⁻1 and nozzle immersion depth of 80 mm.
By comparing and analyzing the simulation results under three turbulence models with those from the literature, as shown in Figure 5, it can be observed that only the standard k-ɛ model produces simulation results that closely match the overall trend of the turbulent kinetic energy distribution curve in the literature. The error between the two is small, with the relative error falling within a range of less than 5%, which meets the accuracy requirements for engineering calculations. This indicates that the numerical model established in this study is highly reliable.

3. Results and Discussions

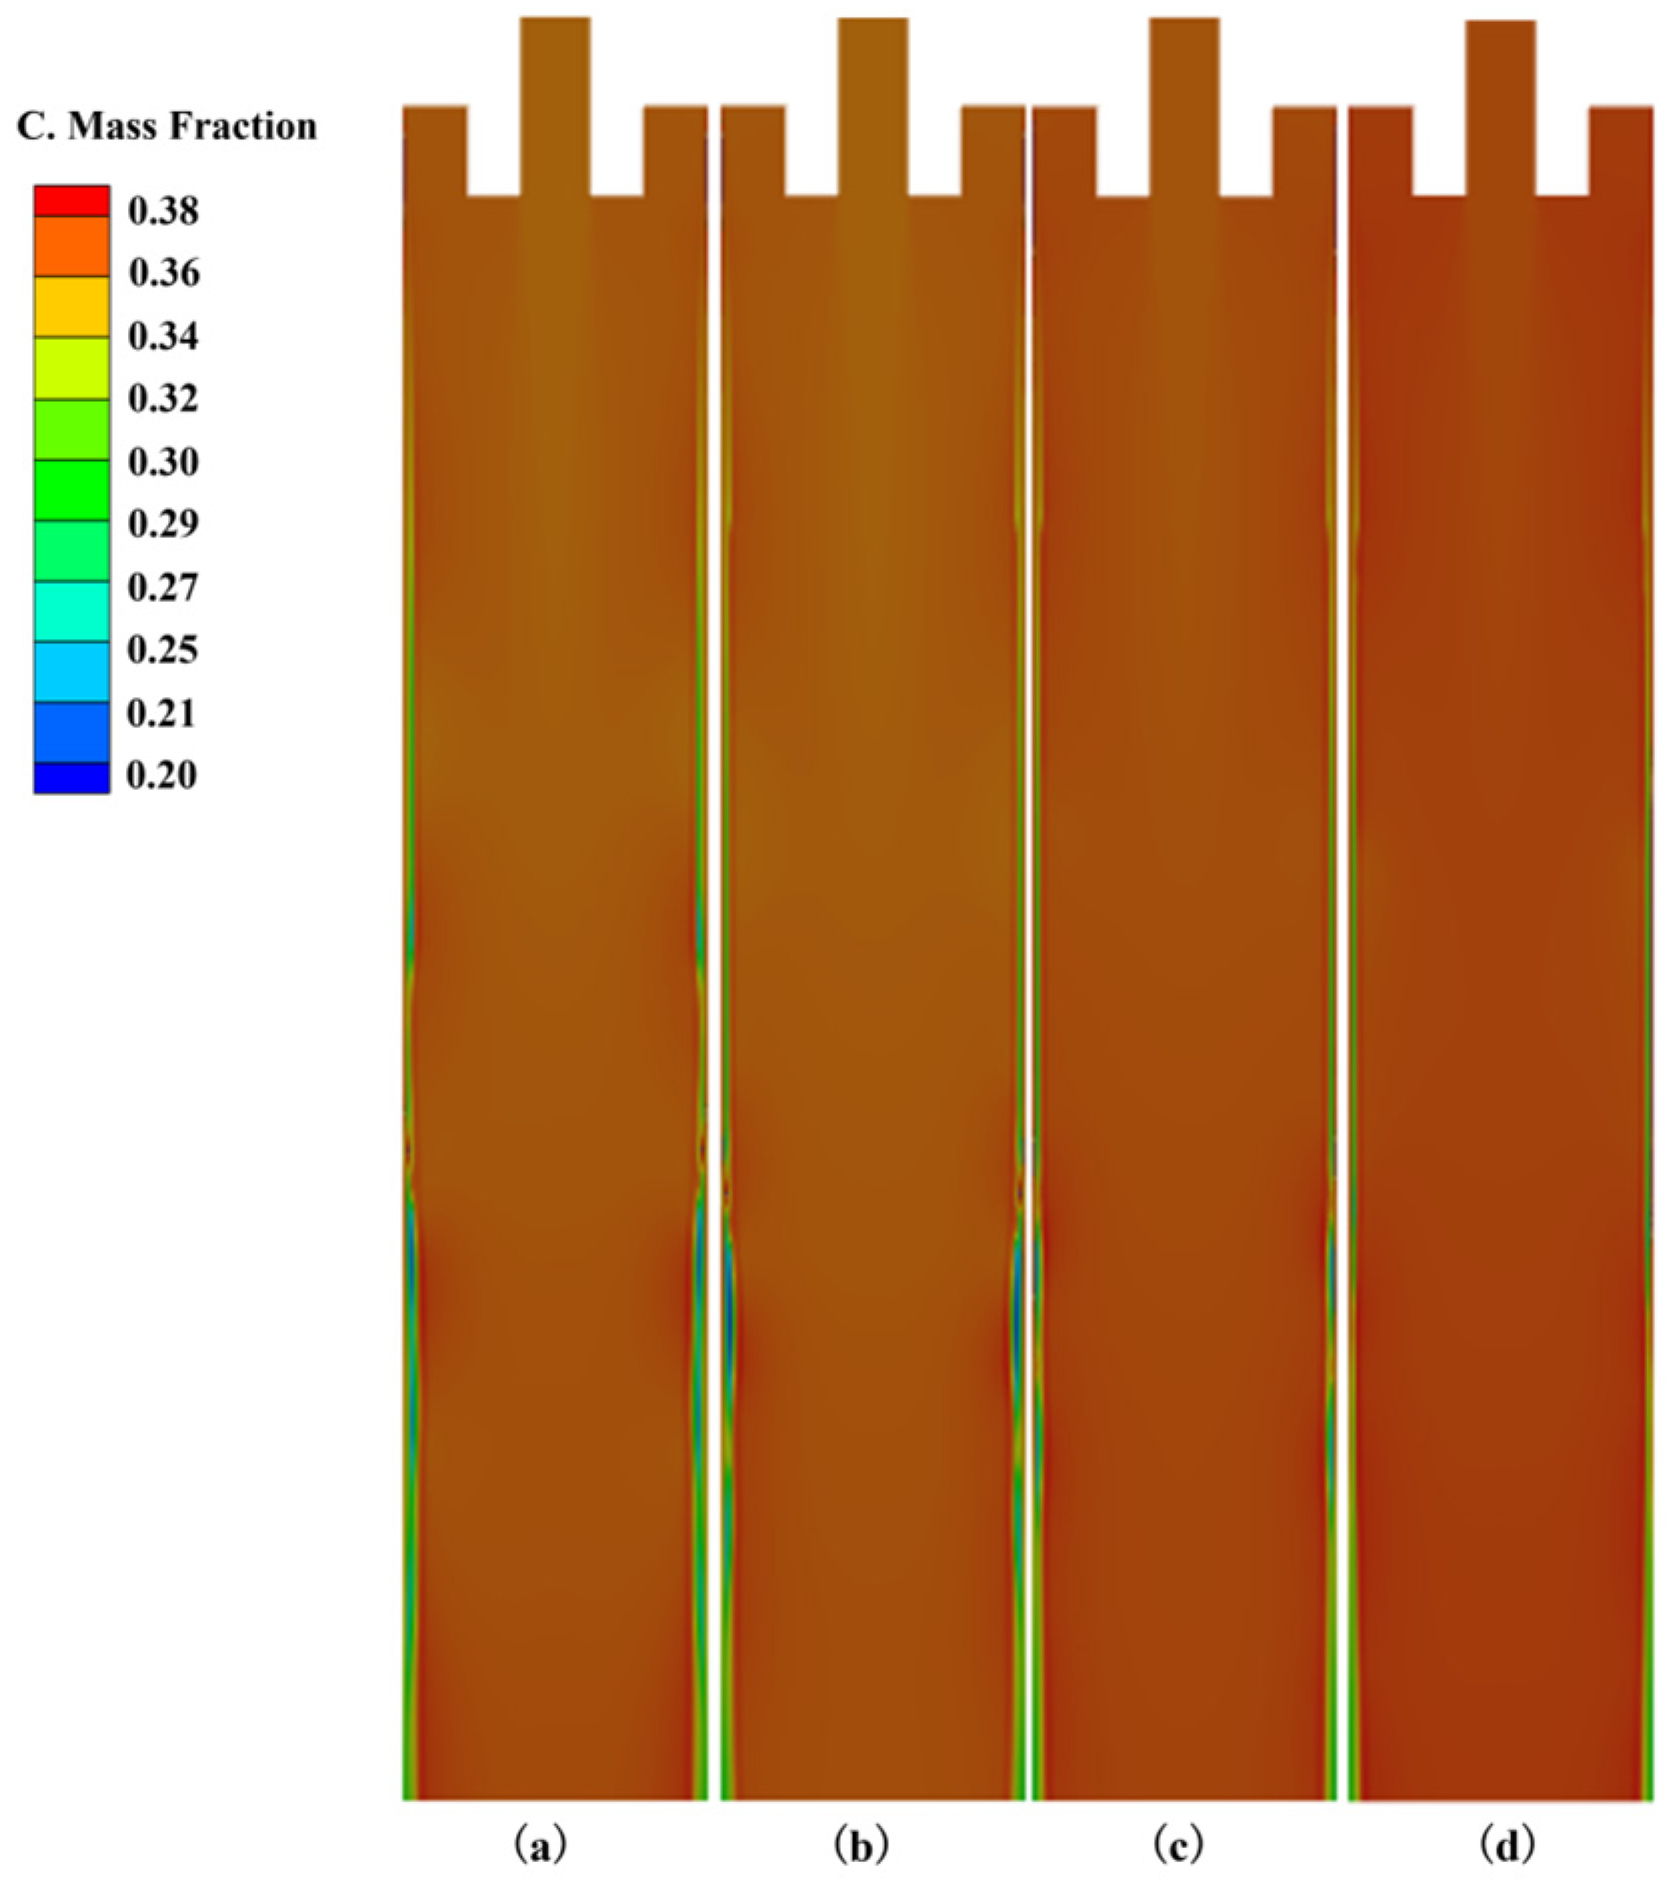
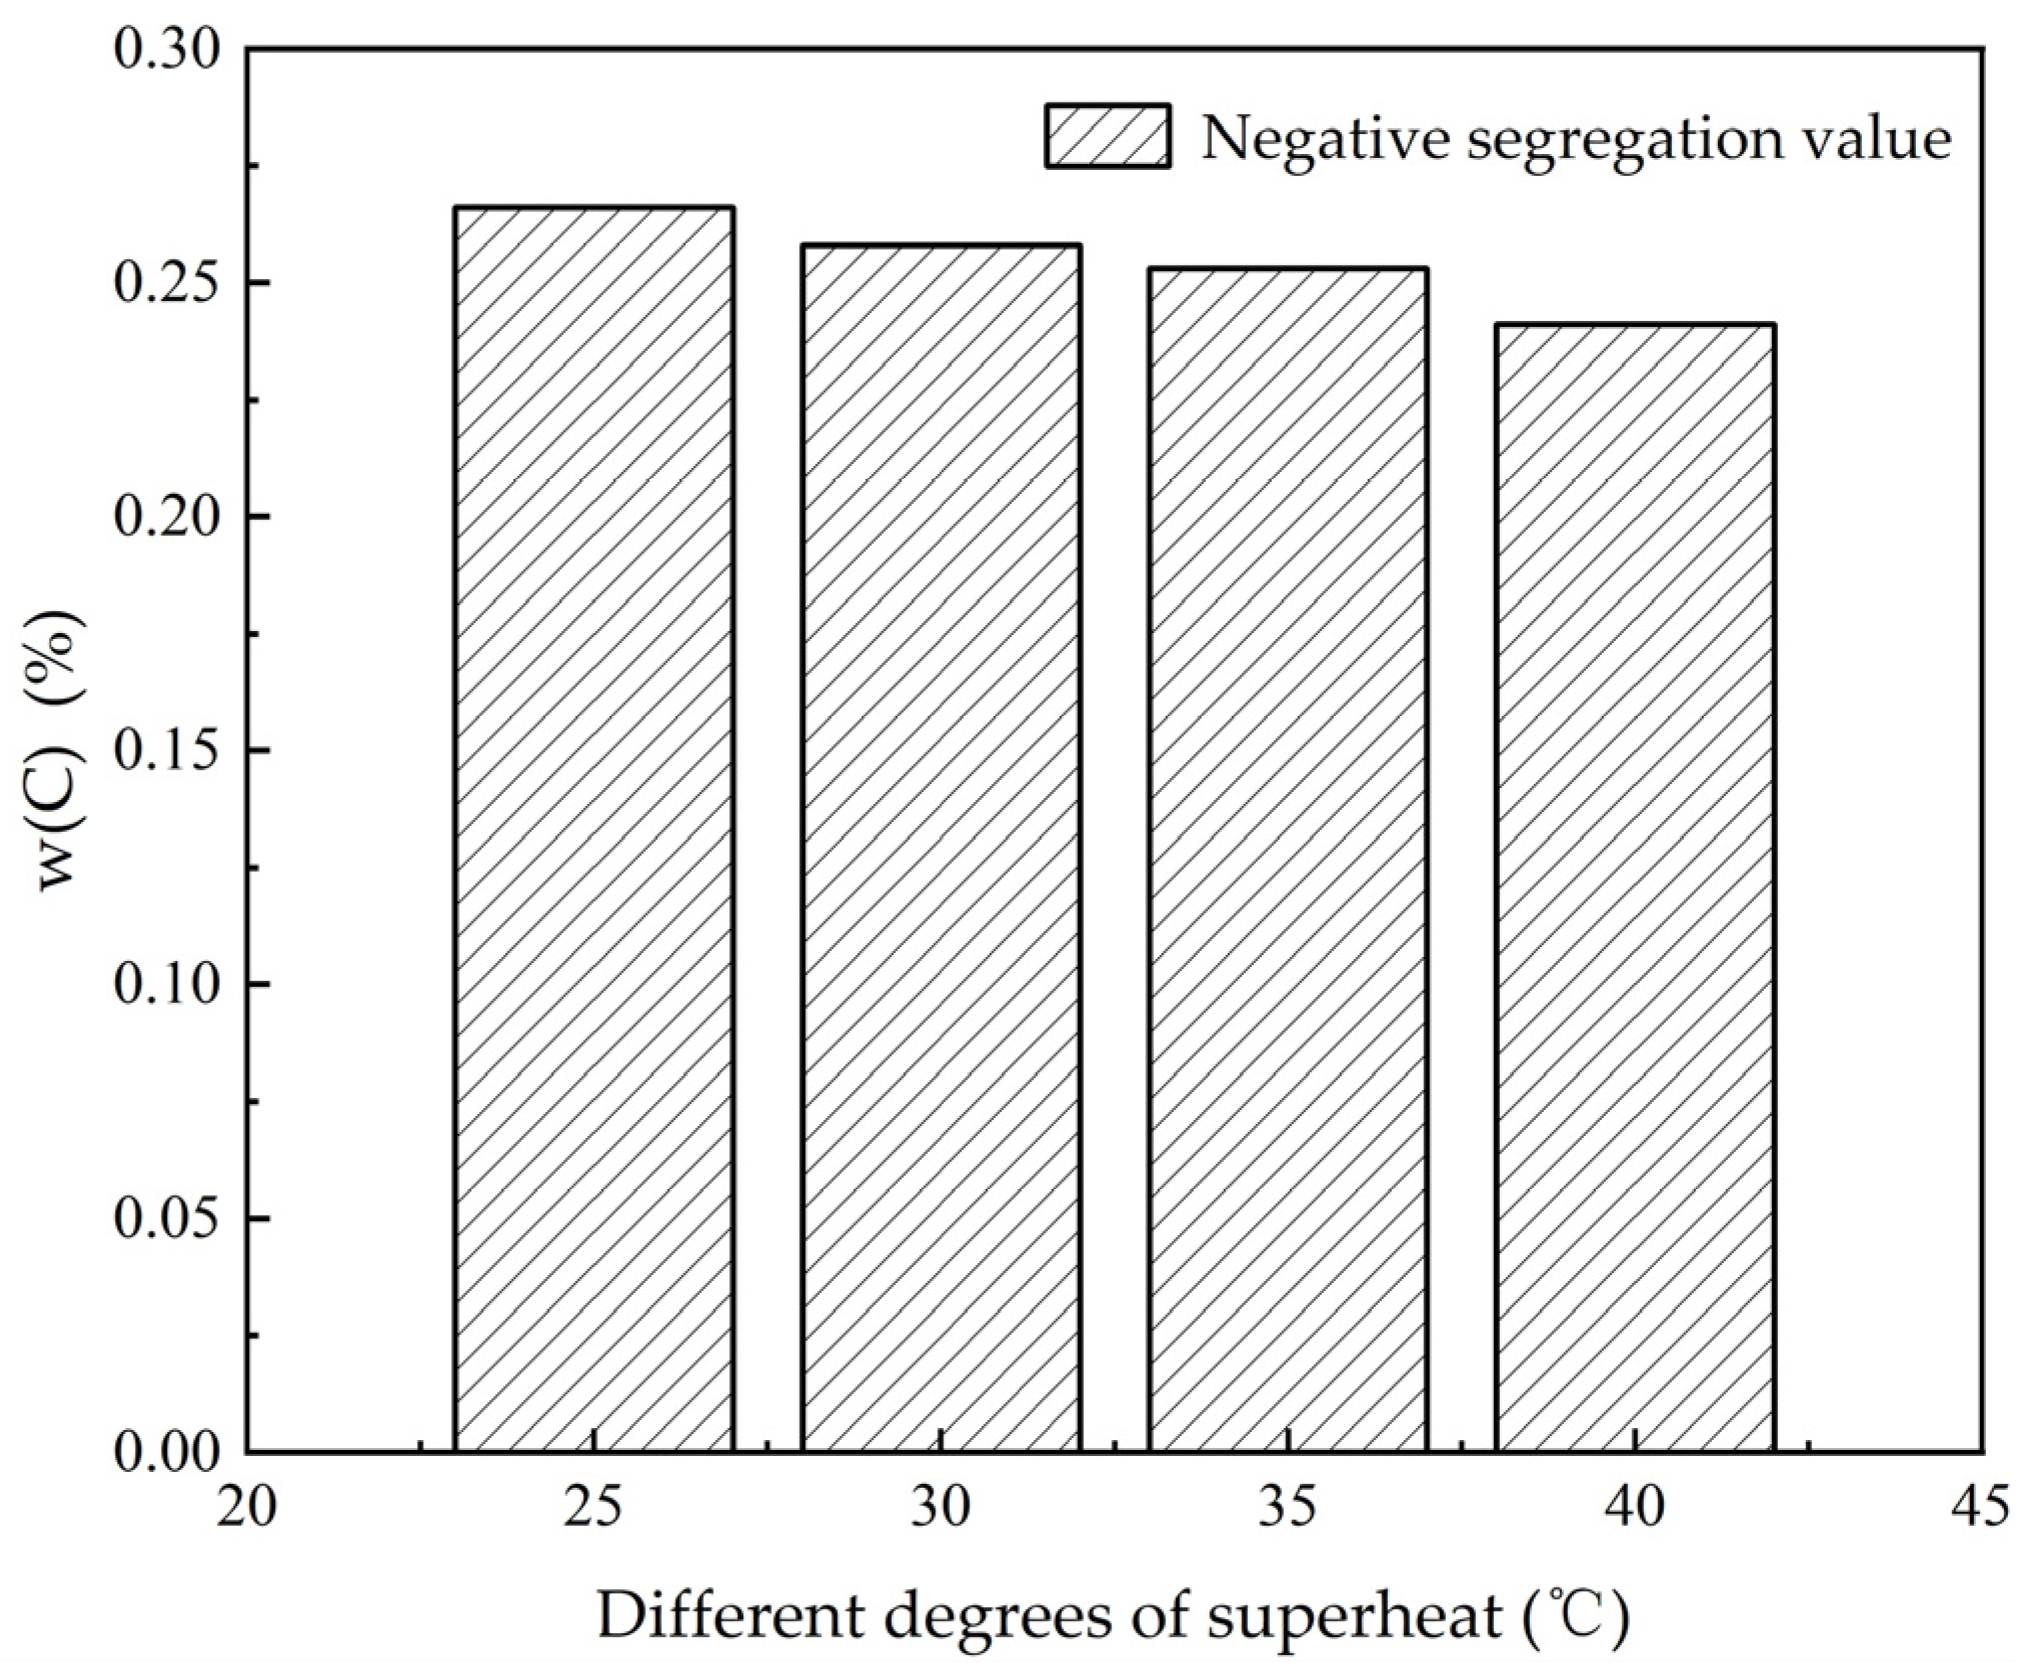
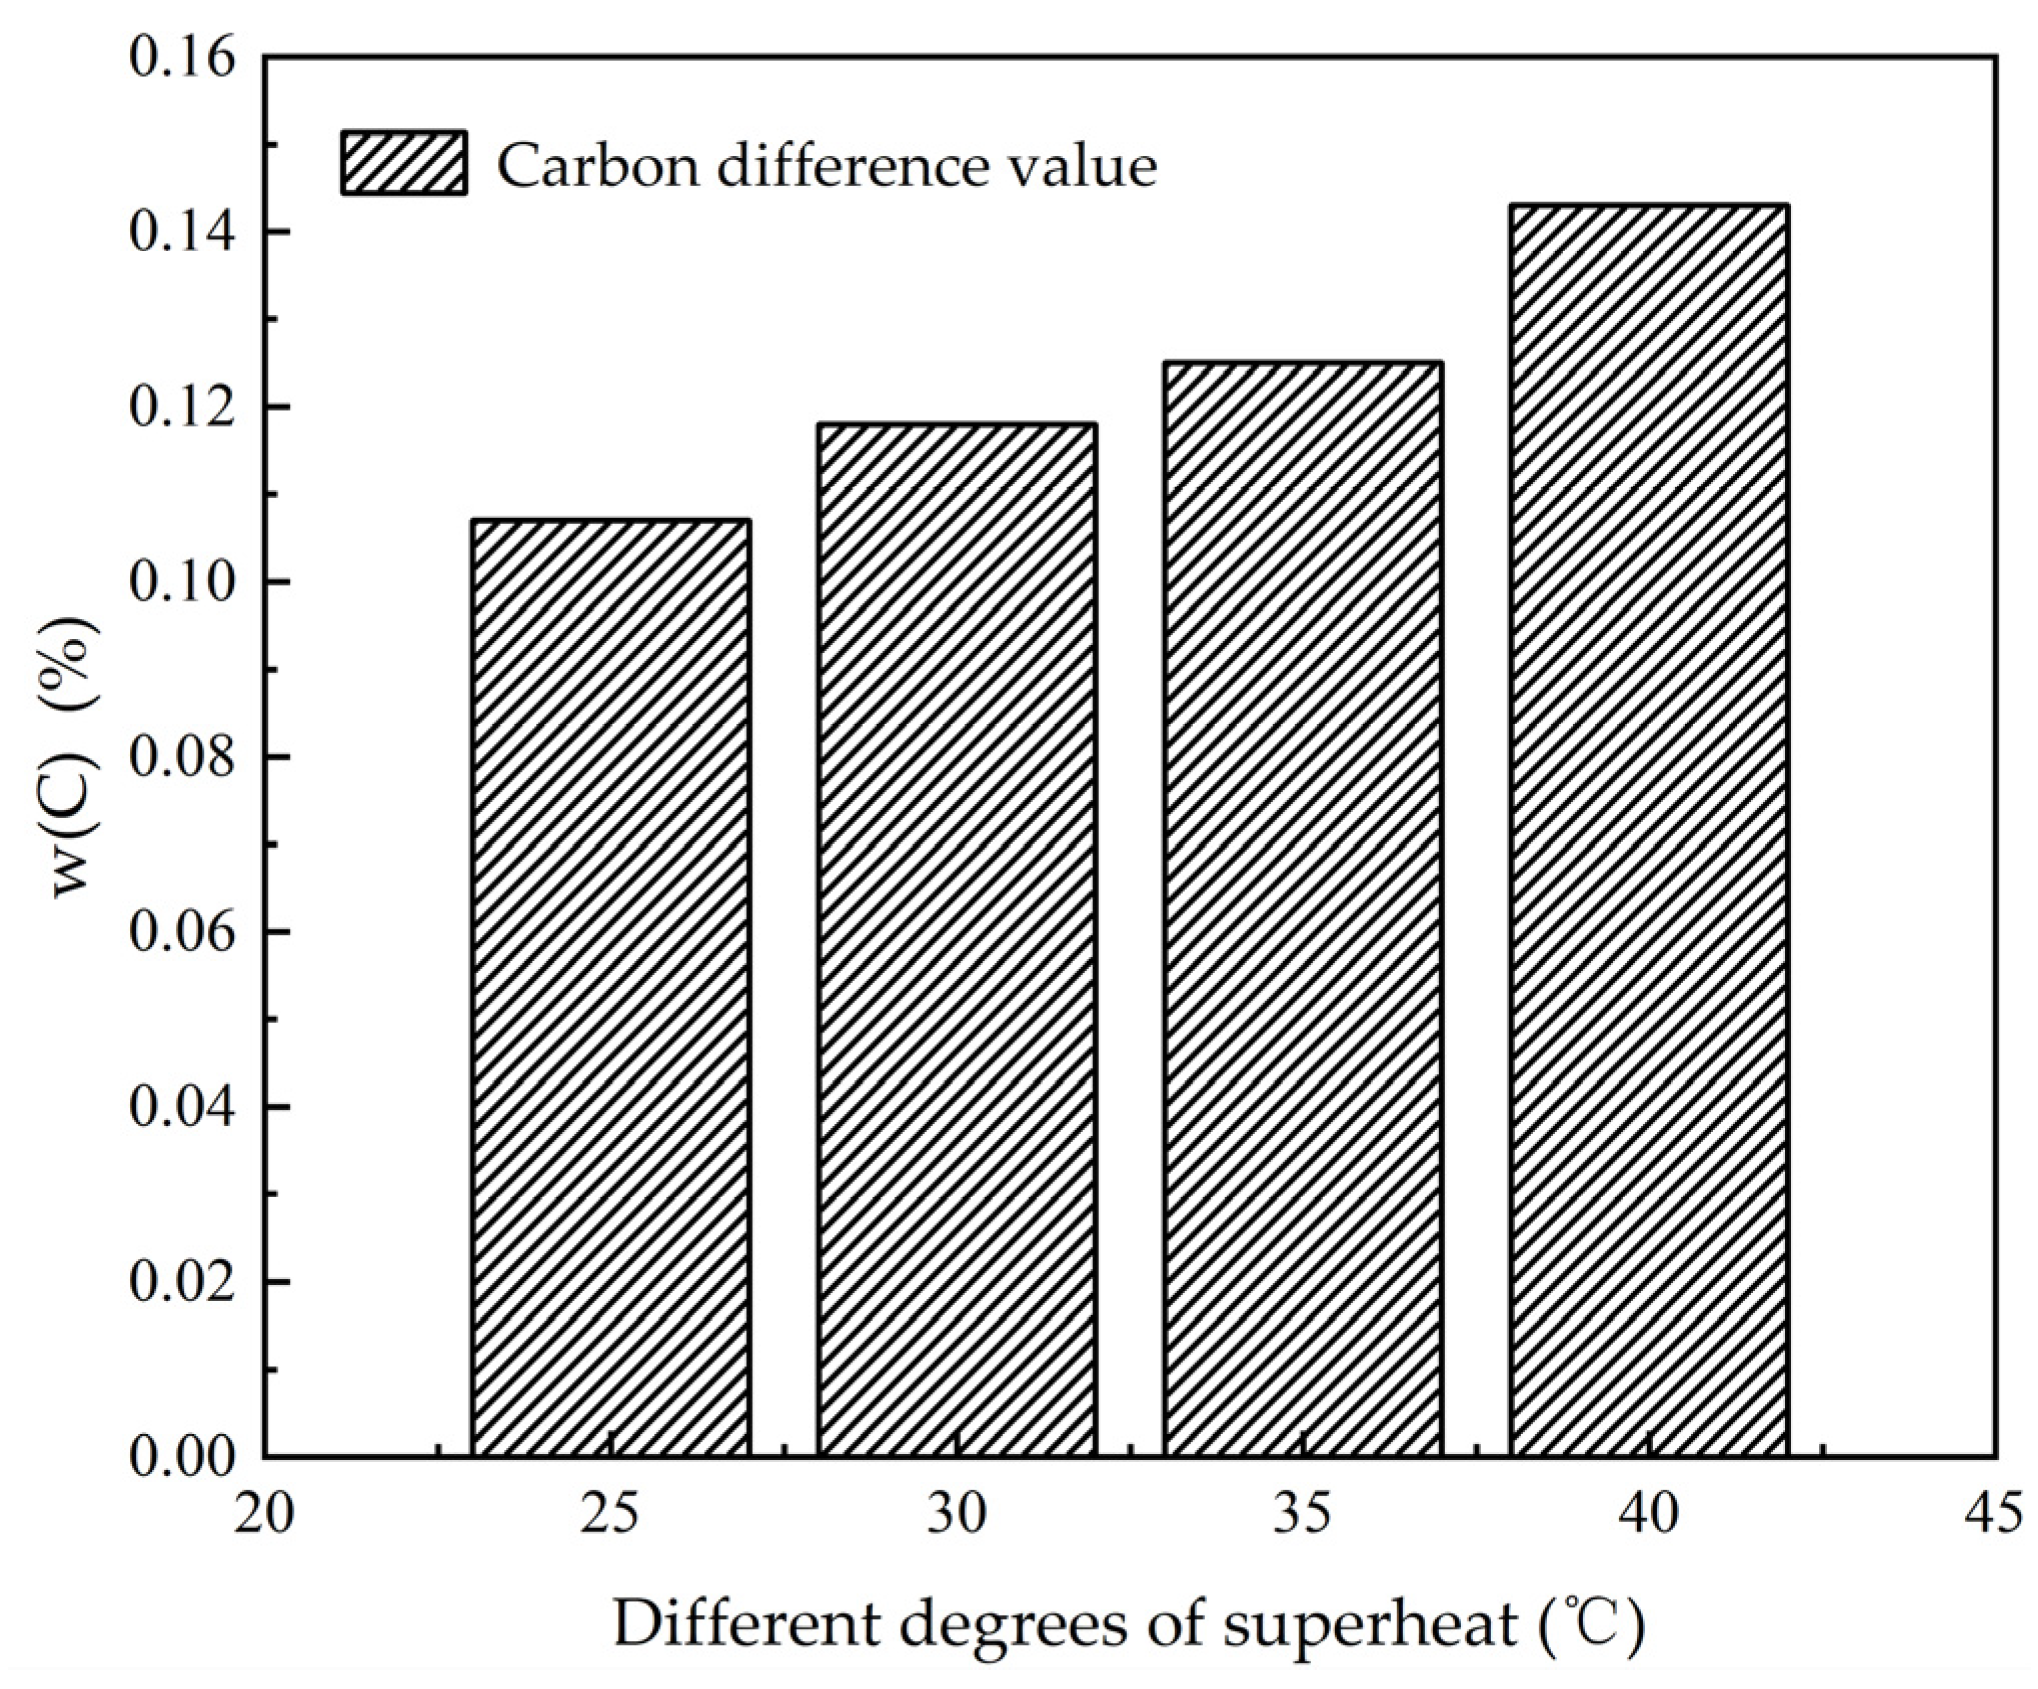
3.1. The Influence of Superheat Degree on Heat Transfer, Solidification and Macroscopic Segregation Phenomena

By applying different pouring processes with varying degrees of superheat, the phenomenon of macroscopic segregation can be effectively controlled [32,33]. To investigate the specific influence of superheat on the distribution of carbon, the casting speed was maintained at 1.6 m·min−1, and the average cooling intensity of the mold was kept constant at 1200 kW·m−2, with all other process conditions remaining unchanged. The step size used in the transient simulation is 0.001 s.
Figure 6 illustrates the distribution characteristics of the C element in the mold under different superheat conditions. It can be observed that as the pouring temperature increases, the diffusion behavior of carbon within the mold is significantly enhanced. An analysis of the carbon distribution curve after complete solidification (Figure 7) reveals that with increasing superheat, the expulsion of solute by the solidifying shell also intensifies, leading to a continuous accumulation of solute in the liquid phase and thus a stronger solute enrichment effect. This observation aligns with findings by Pan [34], who reported that increased superheat results in a reduction in equiaxed crystal content and more pronounced element segregation. For instance, when the superheat is 25 °C, the negative segregation value is 0.266%, whereas at 40 °C, it decreases slightly to 0.241%, with a difference of 0.025%. This suggests that higher superheat correlates with a rise in the negative segregation value in this region. Moreover, as shown in Figure 8, the variation range of the negative segregation value increases from 0.008% to 0.012% with higher superheat. These results indicate that during the metal solidification process, superheat has a significant impact on the distribution of solute elements.
From the distribution curve of the C element after complete solidification shown in Figure 7, it can be observed that following the occurrence of negative segregation, a subsequent upward trend of positive segregation emerges. During the continuous casting process, as molten steel is continuously withdrawn and solidifies, it gradually moves away from the primary action zone of the water jet. This displacement results in significant solute enrichment at the solidification front. As a result, the carbon concentration in the solid phase progressively increases until it reaches a critical threshold. At this point, both solidification and solute diffusion encounter increased resistance. The solute-rich liquid phase at the solidification front undergoes a phase transformation, which temporarily reduces the solute concentration in the remaining liquid and initiates a new cycle of solute enrichment. Due to the elevated solute concentration, the solidus temperature of the local liquid phase decreases accordingly. This leads to a narrowing of the two-phase region and makes the solute-rich molten steel more susceptible to solidification [35].
In the study of the macroscopic segregation behavior of carbon in the mold, Figure 9 presents the central segregation and the maximum positive segregation values under various superheat conditions. As shown in the figure, positive segregation exhibits a distinct trend with increasing superheat. When the superheat is 25 °C, positive segregation reaches its lowest value at 0.373%. However, as the superheat continues to rise, carbon accumulation intensifies. At a superheat of 40 °C, positive segregation peaks at 0.375%.
During the solidification process, solute elements gradually accumulate toward the center of the billet, leading to the formation of central segregation [36]. The extent of central segregation is influenced by the degree of superheat. At a superheat of 25 °C, the central segregation reaches its lowest value of 0.357%, whereas at 40 °C, it increases to a maximum of 0.364%. Analyzing the data across the superheat range of 25 °C to 40 °C, the maximum positive segregation changes by only 0.002%, while the central segregation increases by 0.007%. These results suggest that a lower superheat not only reduces central segregation but also positively influences both positive and negative segregation. Notably, the mitigation effect on negative segregation is more pronounced than on central segregation.
As illustrated in Figure 10, the overall carbon segregation values under different superheat conditions are presented. The figure shows that as the superheat increases, the carbon segregation value consistently rises, from 0.107% to 0.143%. Moreover, the rate of change in carbon segregation with increasing superheat becomes more significant. This further indicates that maintaining a lower superheat is beneficial for controlling the distribution of carbon in the mold. As shown in Table 3, with the superheat increasing from 20 °C to 40 °C, the negative segregation index decreases from 0.76 to 0.69; the central segregation index increases from 1.02 to 1.04; and the maximum segregation index remains virtually unchanged.

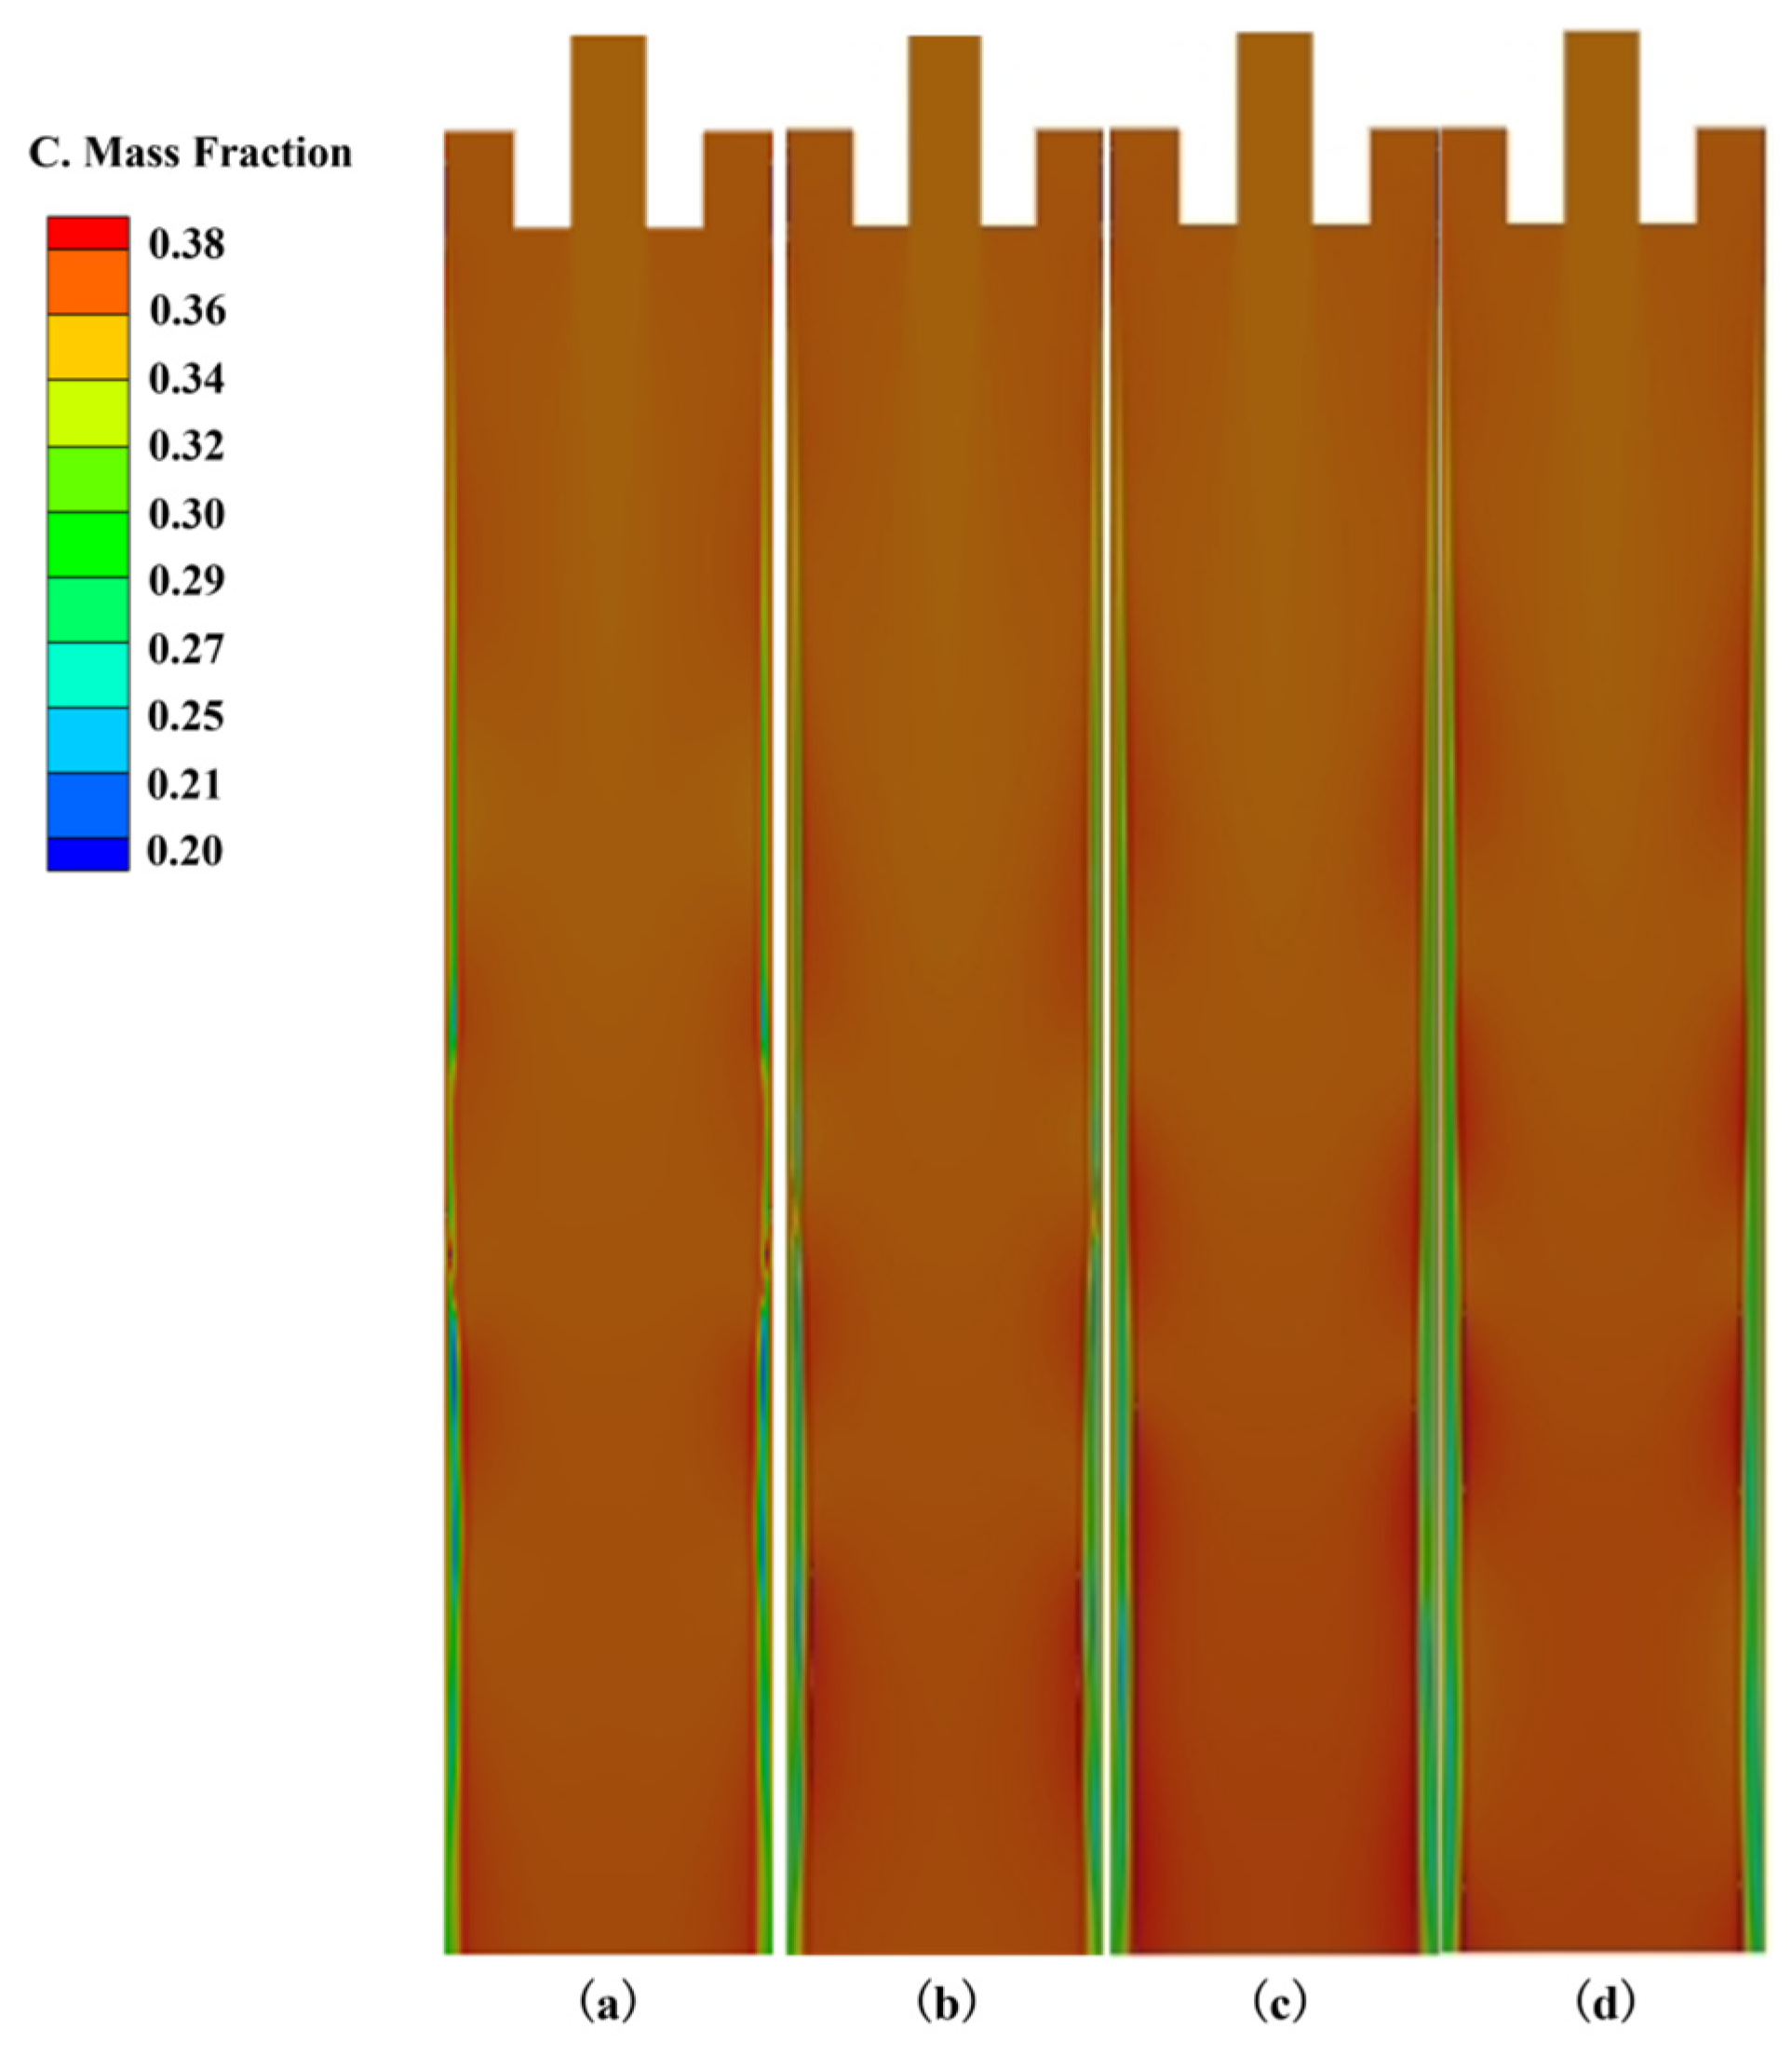
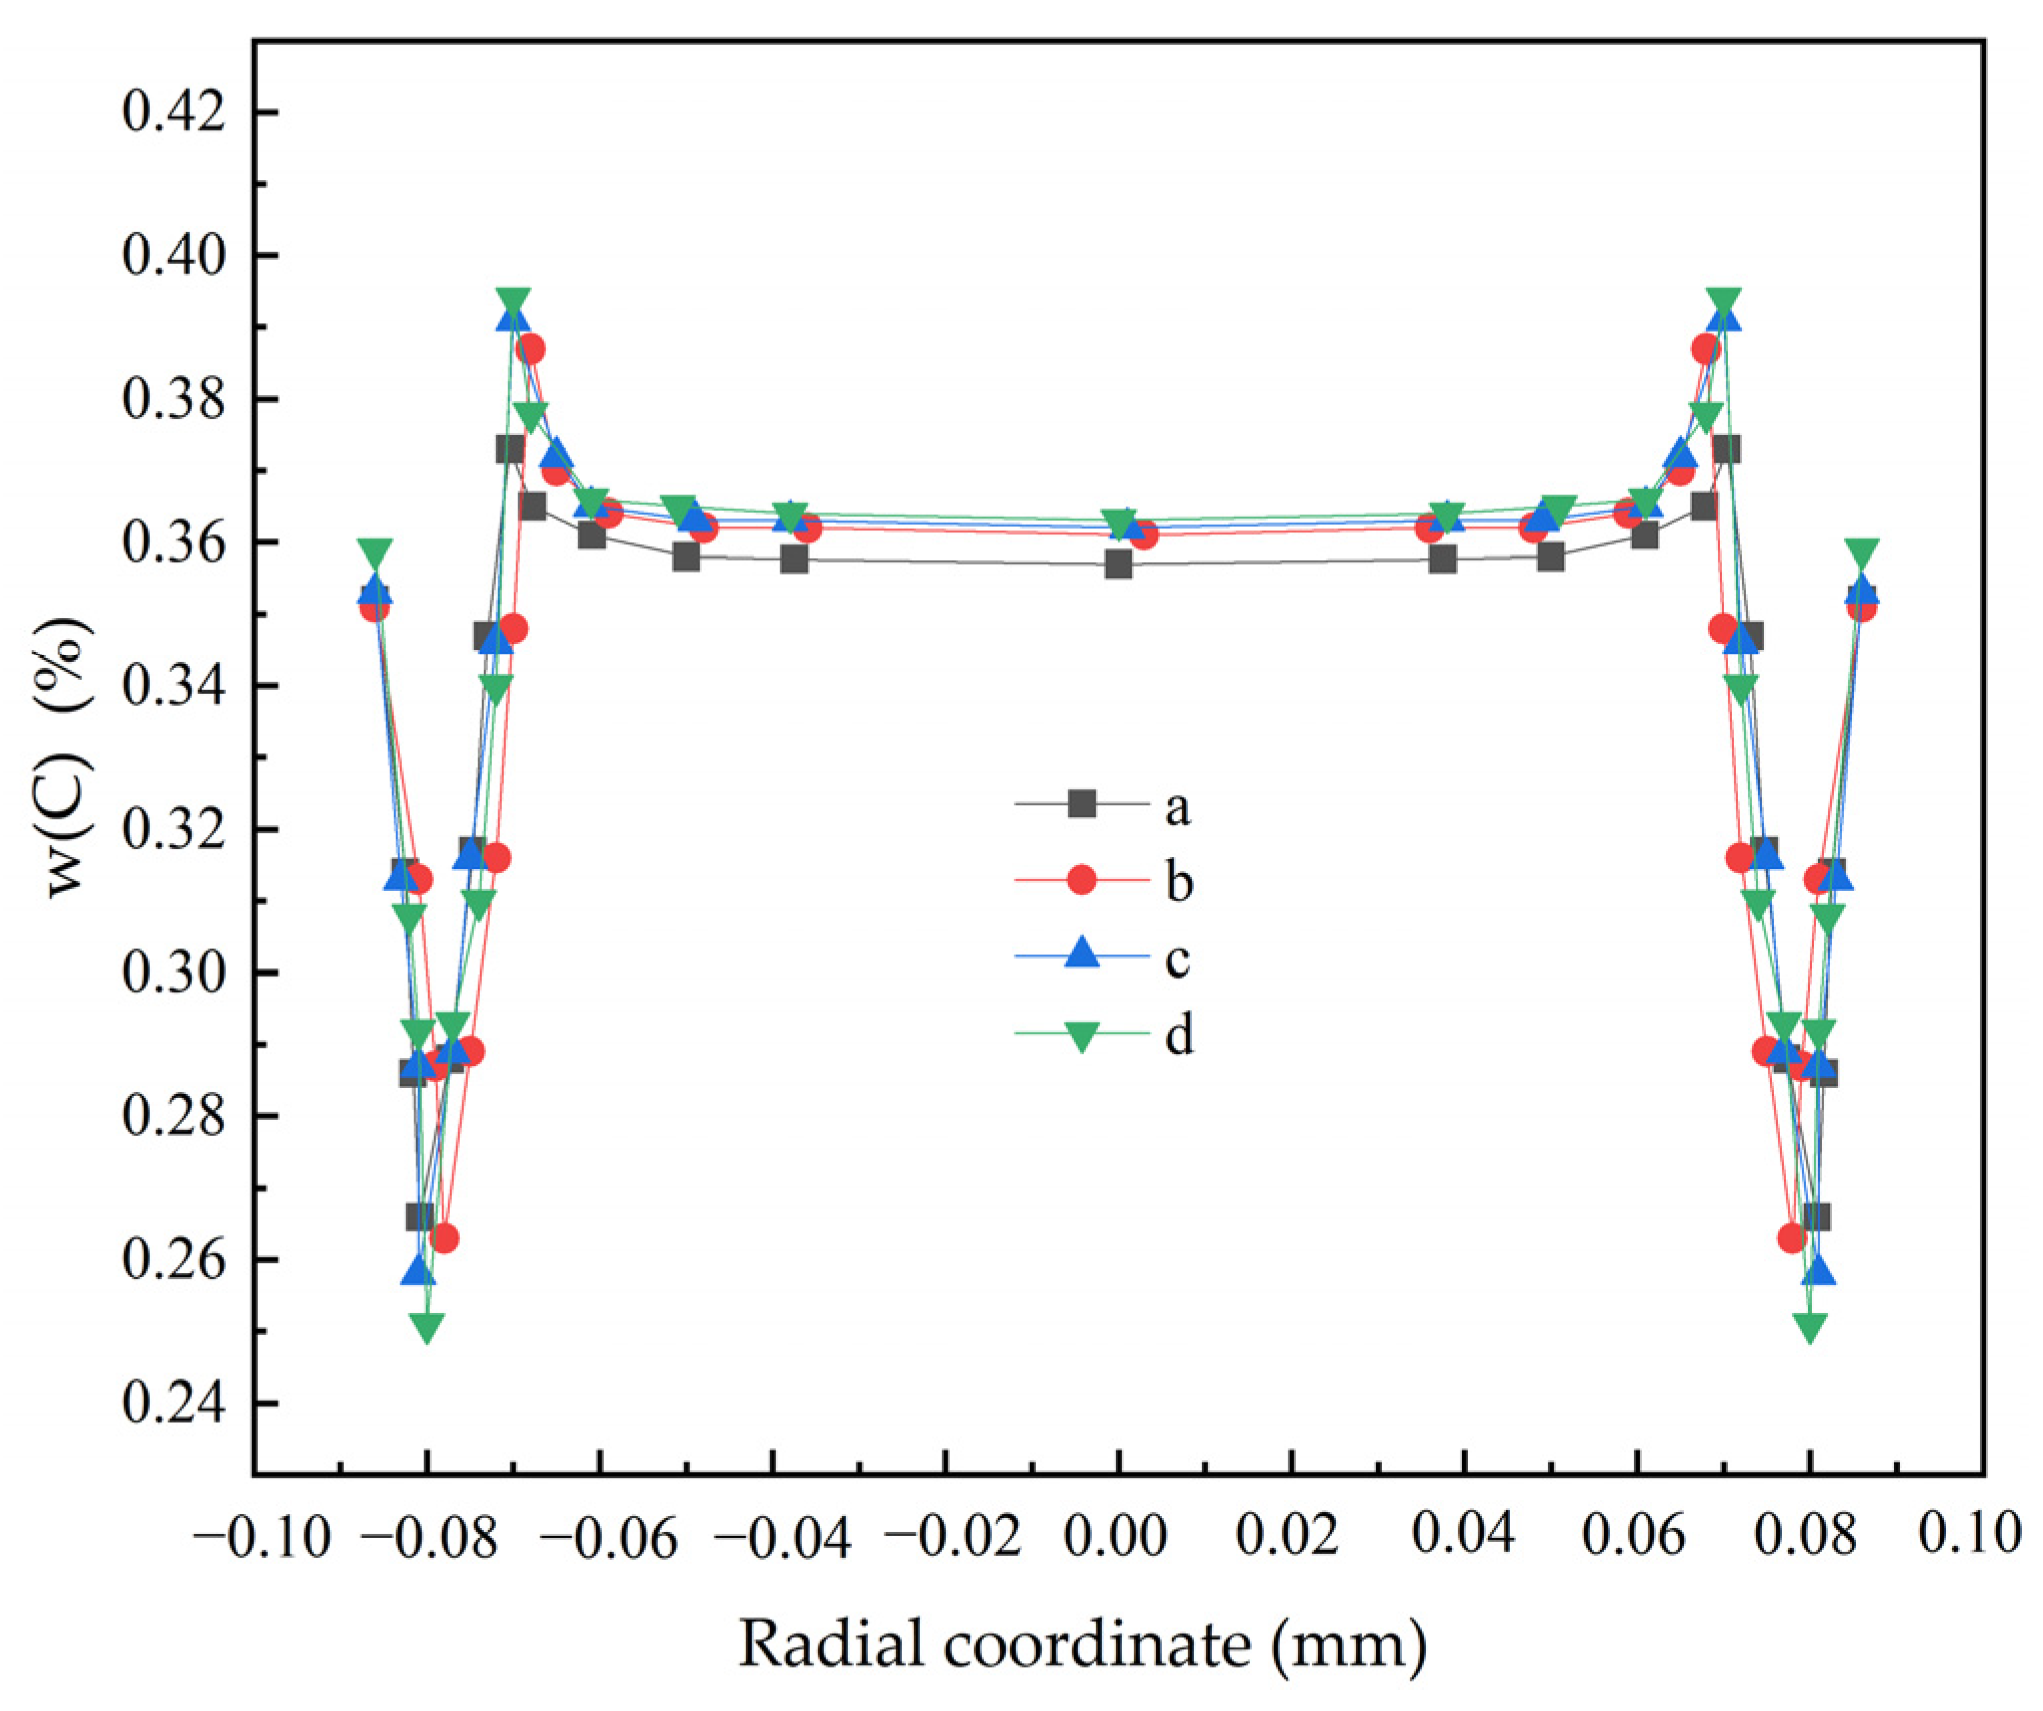
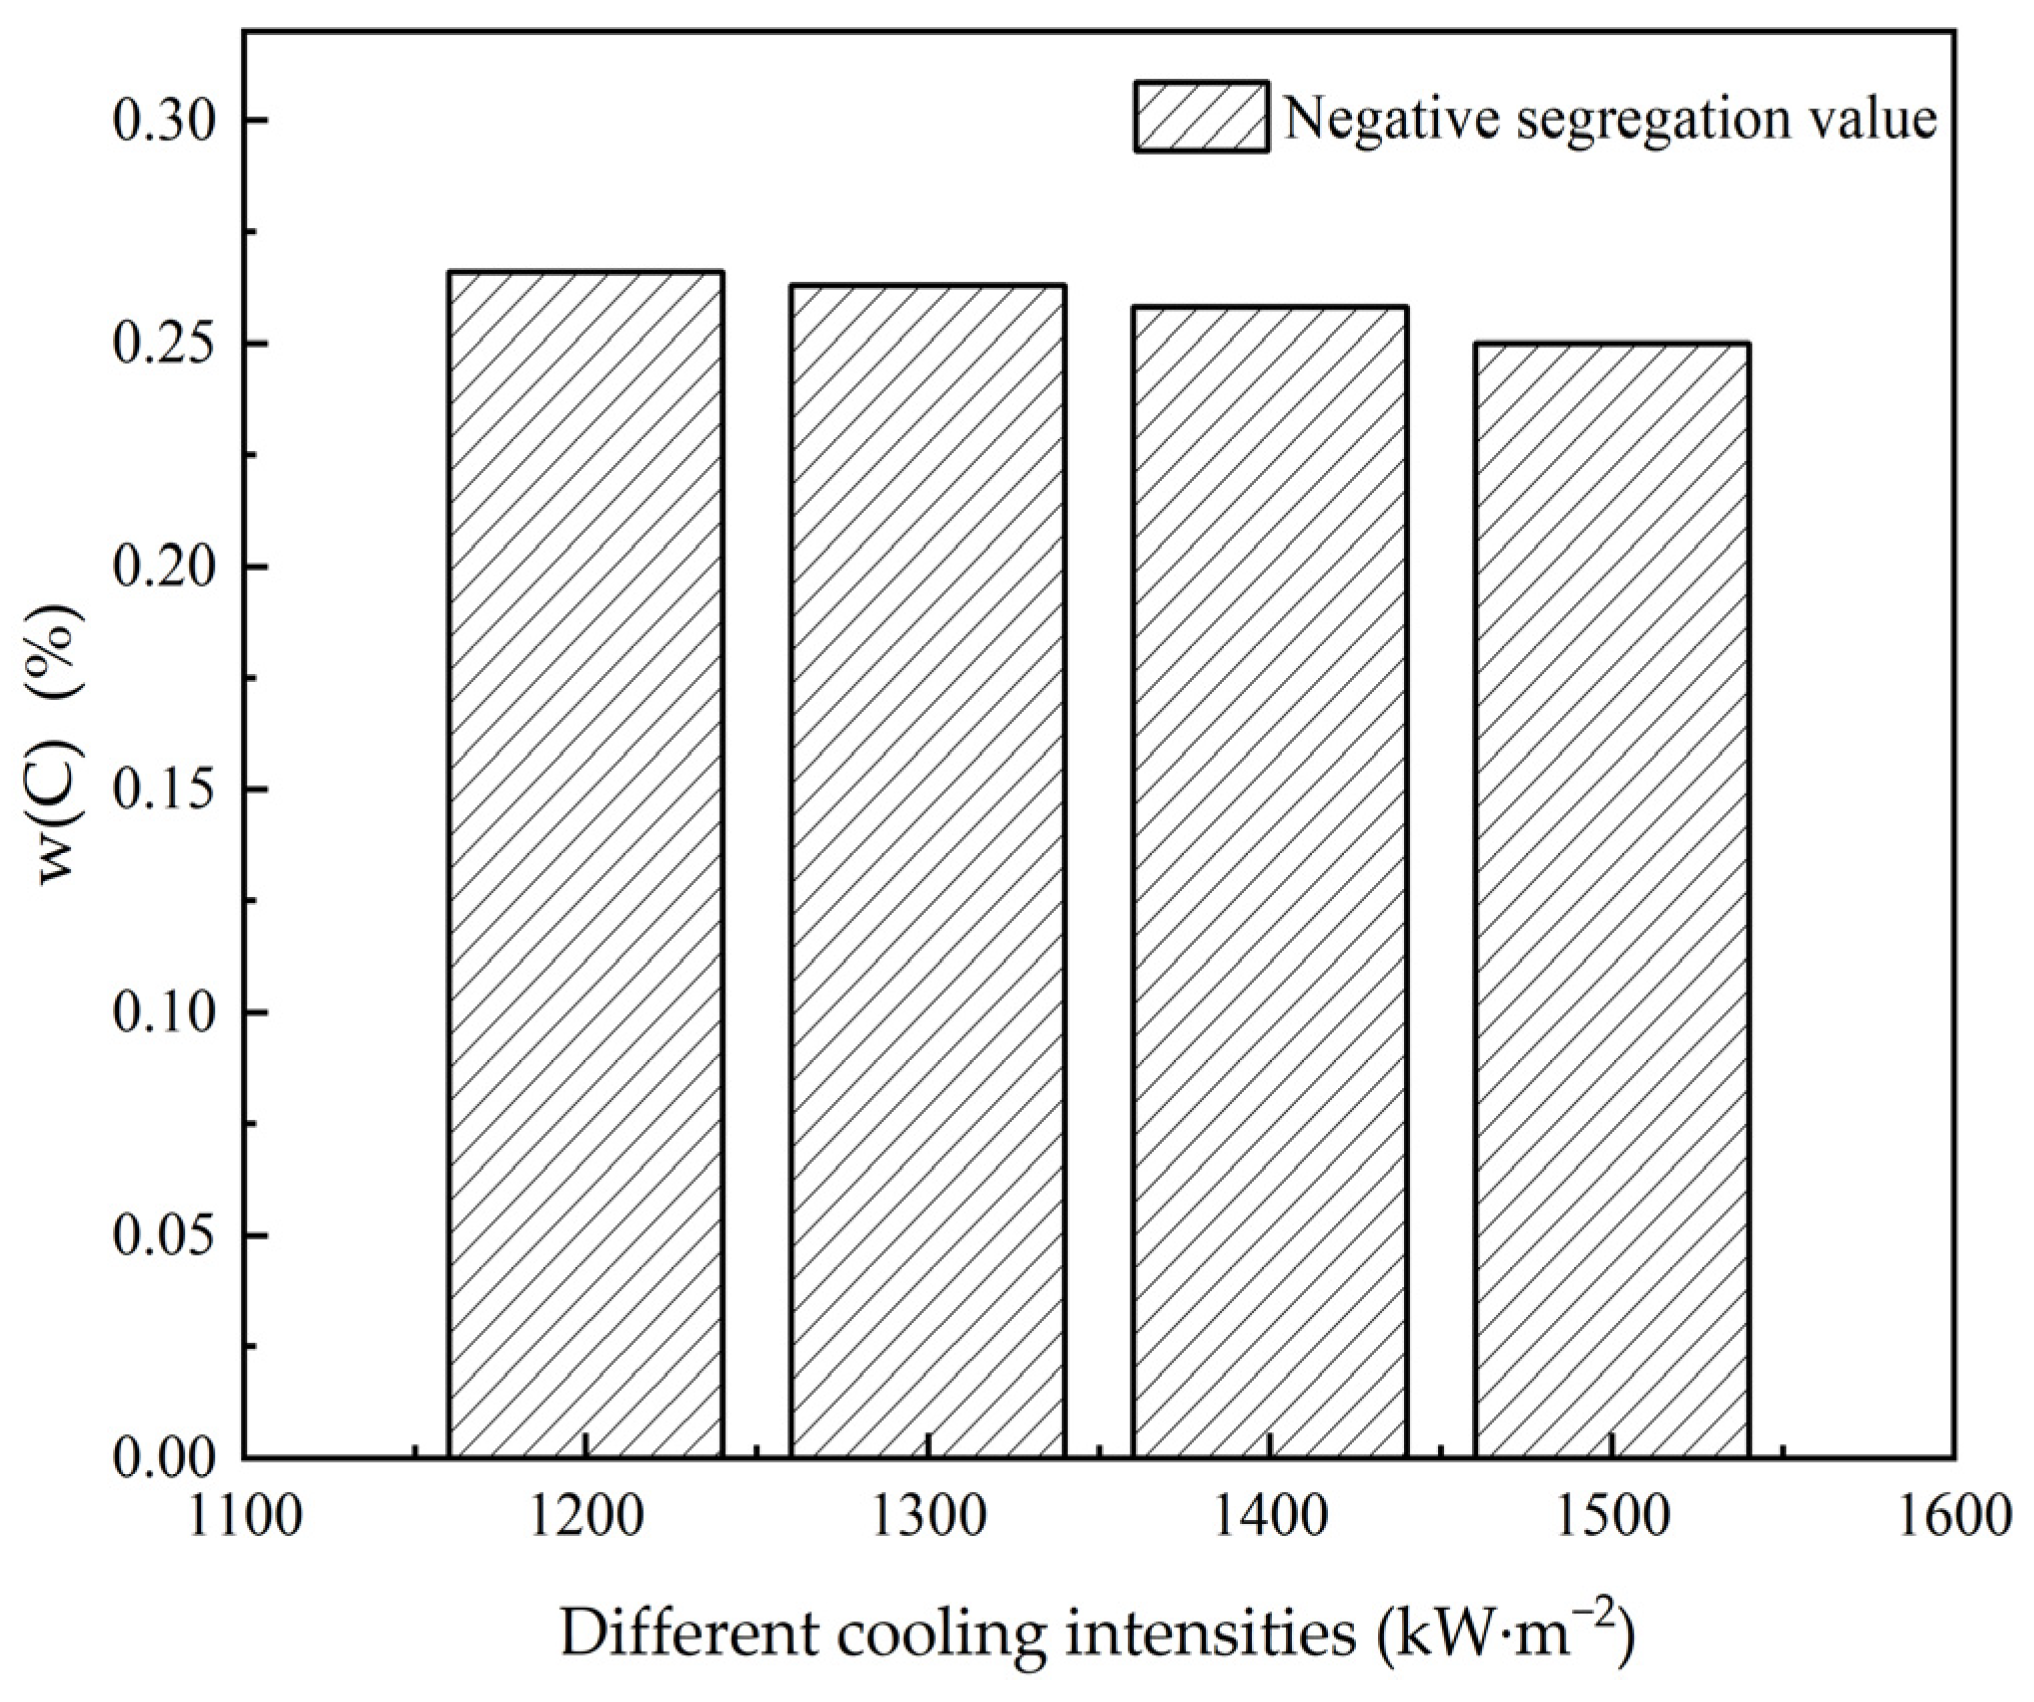
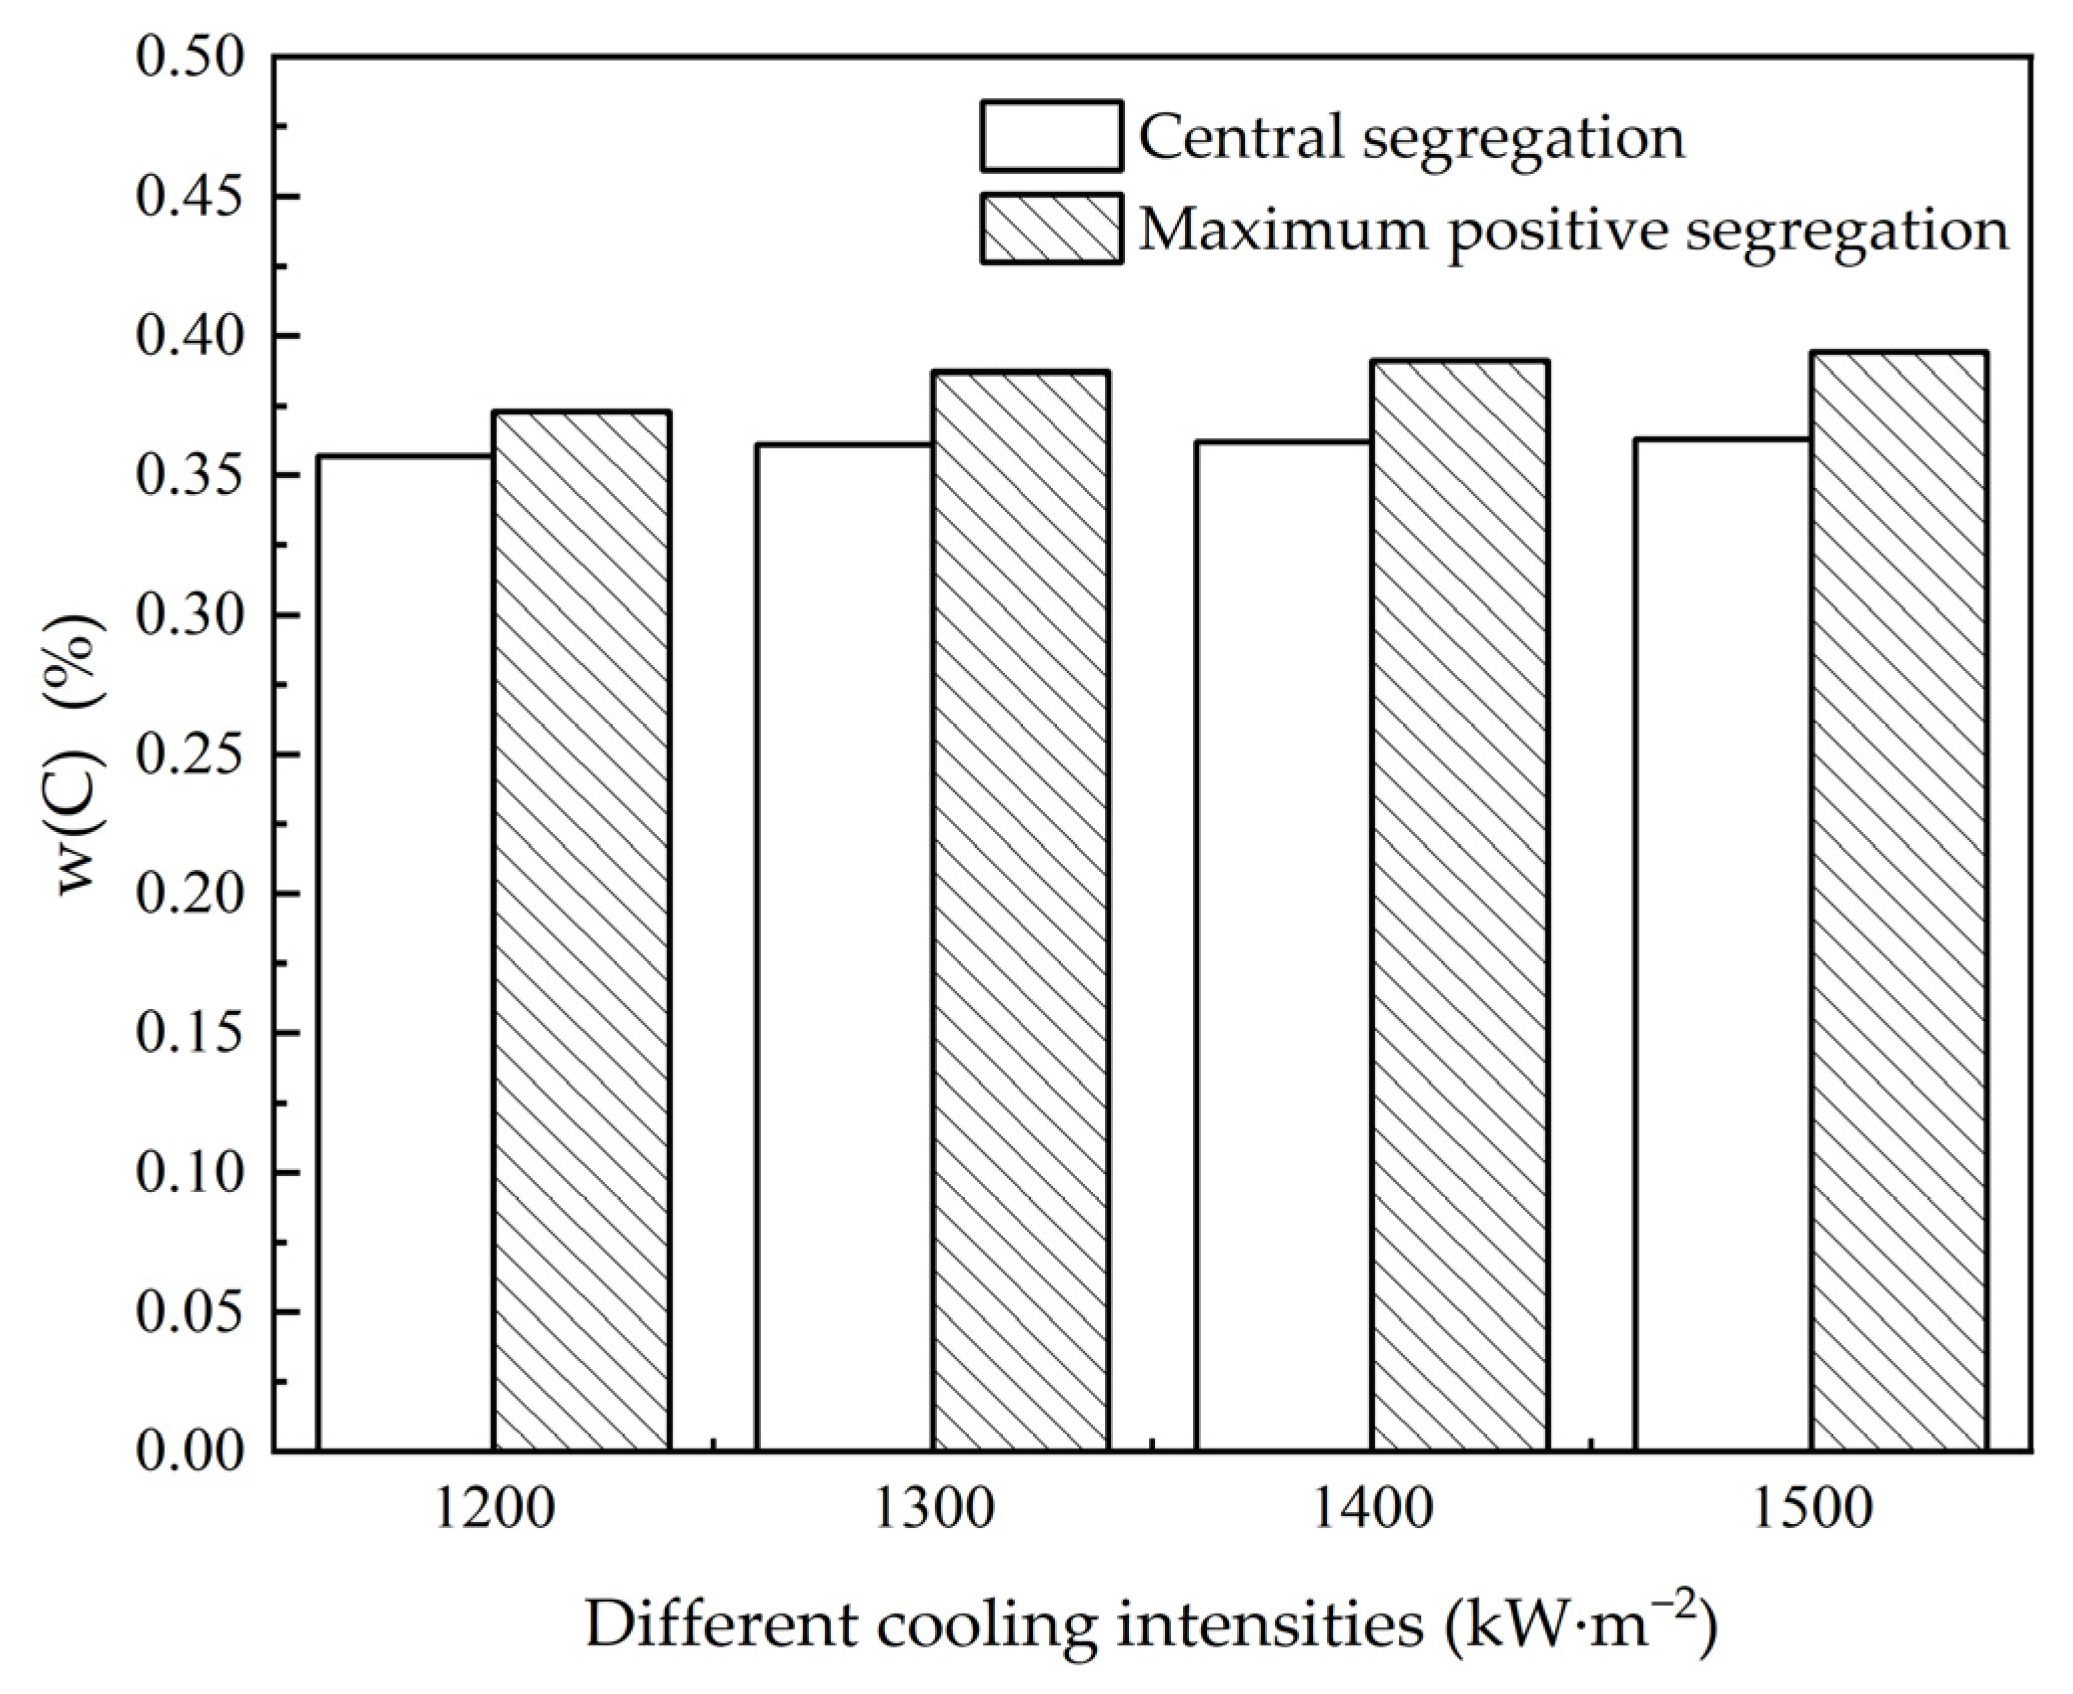
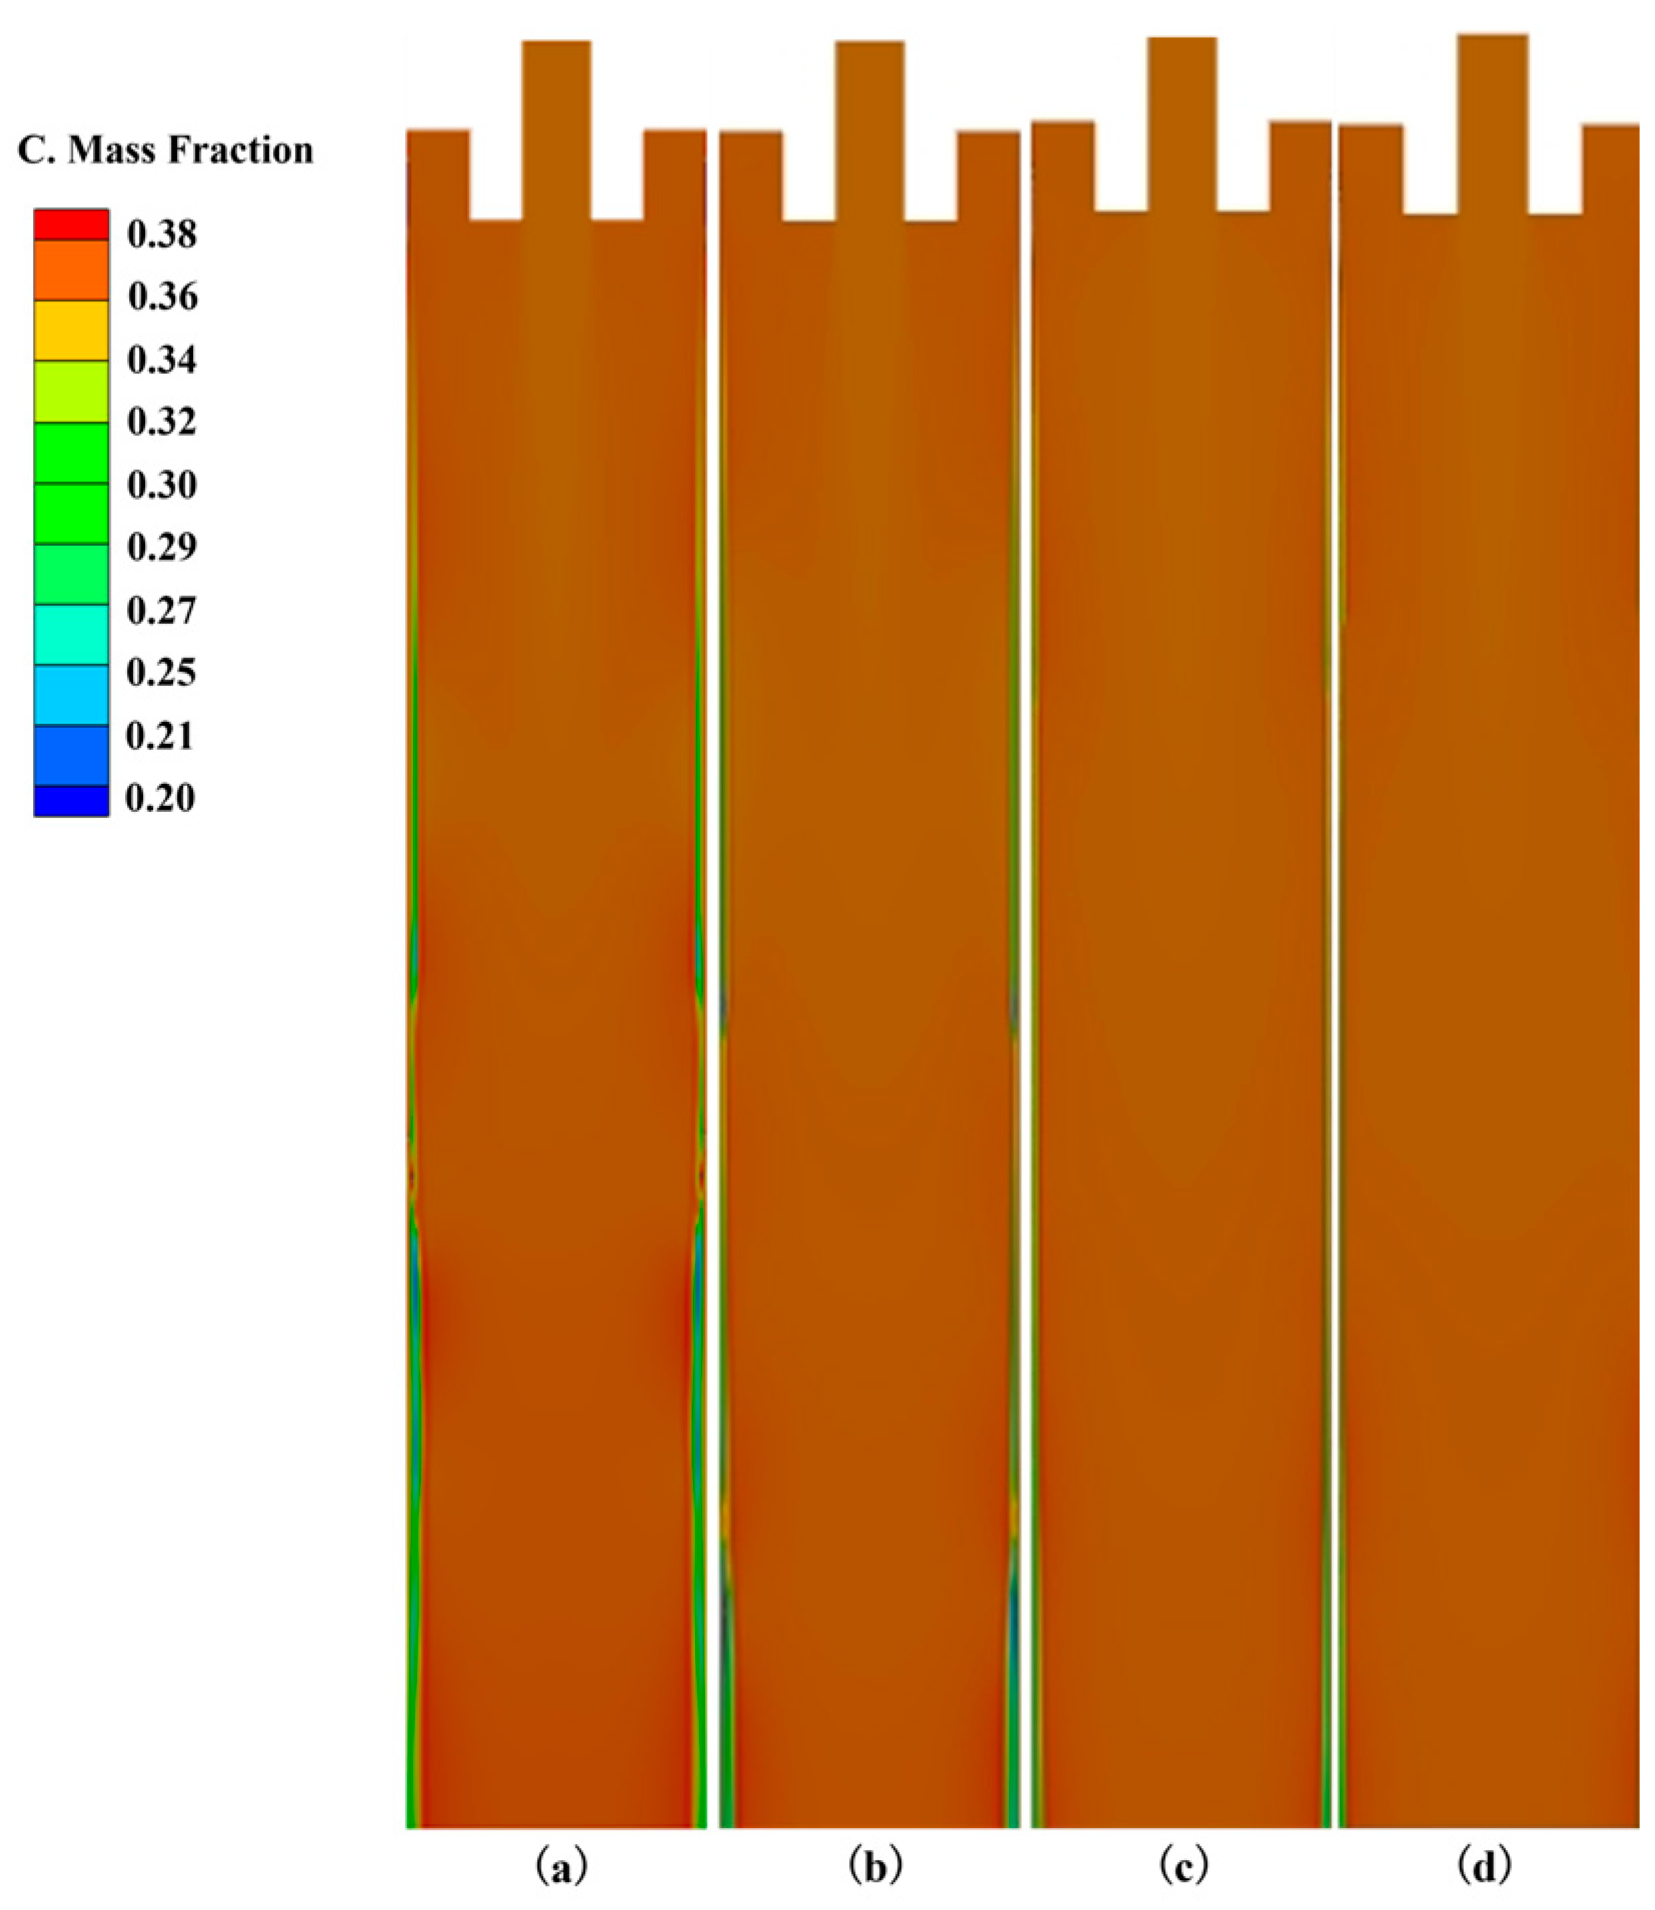
3.2. The Influence of Cooling Intensity on Heat Transfer, Solidification and Macroscopic Segregation Phenomena

Macroscopic segregation can be effectively controlled through casting processes with varying cooling intensities [37]. In this context, regulating the cooling intensity significantly shortens the solidification time, thereby limiting the diffusion period of solute elements and preventing them from fully migrating before being “captured” by the advancing solidification front. This mechanism effectively suppresses the formation of macroscopic segregation. Meanwhile, the resulting fine equiaxed crystal microstructure, characterized by a large grain boundary area, further impedes the bulk movement of solute elements, enhancing the control of macroscopic segregation [38].
To investigate the distribution of carbon under varying cooling intensities, the mold superheat was fixed at 25 °C, and the casting speed was maintained at a constant rate of 1.6 m·min−1. Additionally, the conditions in each cooling area were kept stable and unchanged. Based on these parameters, carbon segregation behavior was simulated under four different cooling intensity scenarios.
Figure 11 illustrates the distribution characteristics of carbon in the mold under different cooling intensities. Under varying cooling conditions, carbon exhibits noticeable diffusion behavior within the mold. As shown in the post-solidification carbon distribution curves in Figure 12, the central segregation level increases gradually with increasing cooling intensity, which is consistent with the findings of Wang [39] et al. When the cooling intensity was 1200 kW·m−2, the maximum negative segregation value was 0.266%. As the cooling intensity increased to 1500 kW·m⁻2, the negative segregation value decreased to a minimum of 0.250%. This indicates that while increasing the cooling intensity can influence segregation behavior, it tends to enhance negative segregation in certain regions. As depicted in Figure 13, the variation in negative segregation values across different cooling intensities increases from 0.003% to 0.008%. However, the extent of this variation remains relatively limited compared to the influence of superheat.
In the study on the macroscopic segregation phenomenon of C element in the crystallizer, Figure 14 shows the central segregation and the maximum positive segregation value under different cooling intensities. As shown in the figure, the maximum positive segregation exhibits a clear trend with increasing cooling intensity. At a cooling intensity of 1200 kW·m−2, positive segregation reaches its lowest value of 0.373%. When the cooling intensity increases to 1500 kW·m−2, the positive segregation value rises to a maximum of 0.394%.
As the solidification process progresses, the solute gradually accumulates toward the center of the billet, leading to the formation of central segregation, similar to the trend observed with varying overheat degrees. The central segregation value is also influenced by cooling intensity. At a cooling intensity of 1200 kW·m−2, the central segregation value reaches its minimum at 0.357%, while at 1500 kW·m−2, it increases to a maximum of 0.363%. The difference in central segregation is 0.006%, indicating that the change is relatively small.
Figure 15 illustrates the variation in the overall carbon difference value under different cooling intensities. From the figure, it is evident that at a cooling intensity of 1200 kW·m−2, the carbon difference value reaches its minimum at 0.107%. As the cooling intensity increases to 1500 kW·m−2, the carbon difference value rises to a maximum of 0.144%. This trend suggests that lower cooling intensities can effectively reduce the solidification rate, providing more time for solute elements (especially carbon) to diffuse and redistribute, thus enhancing the compositional uniformity of the molten steel. Conversely, higher cooling intensities accelerate the solidification process, causing solute elements to quickly accumulate at the solid–liquid interface. This leads to the pronounced segregation of solute elements and further exacerbates the uneven distribution of carbon. As shown in Table 4, with the cooling intensity increasing from 1200 kW·m−2 to 1500 kW·m−2, the negative segregation index decreases from 0.76 to 0.71; the central segregation index increases from 1.02 to 1.04; and the maximum segregation index increases from 1.07 to 1.13.

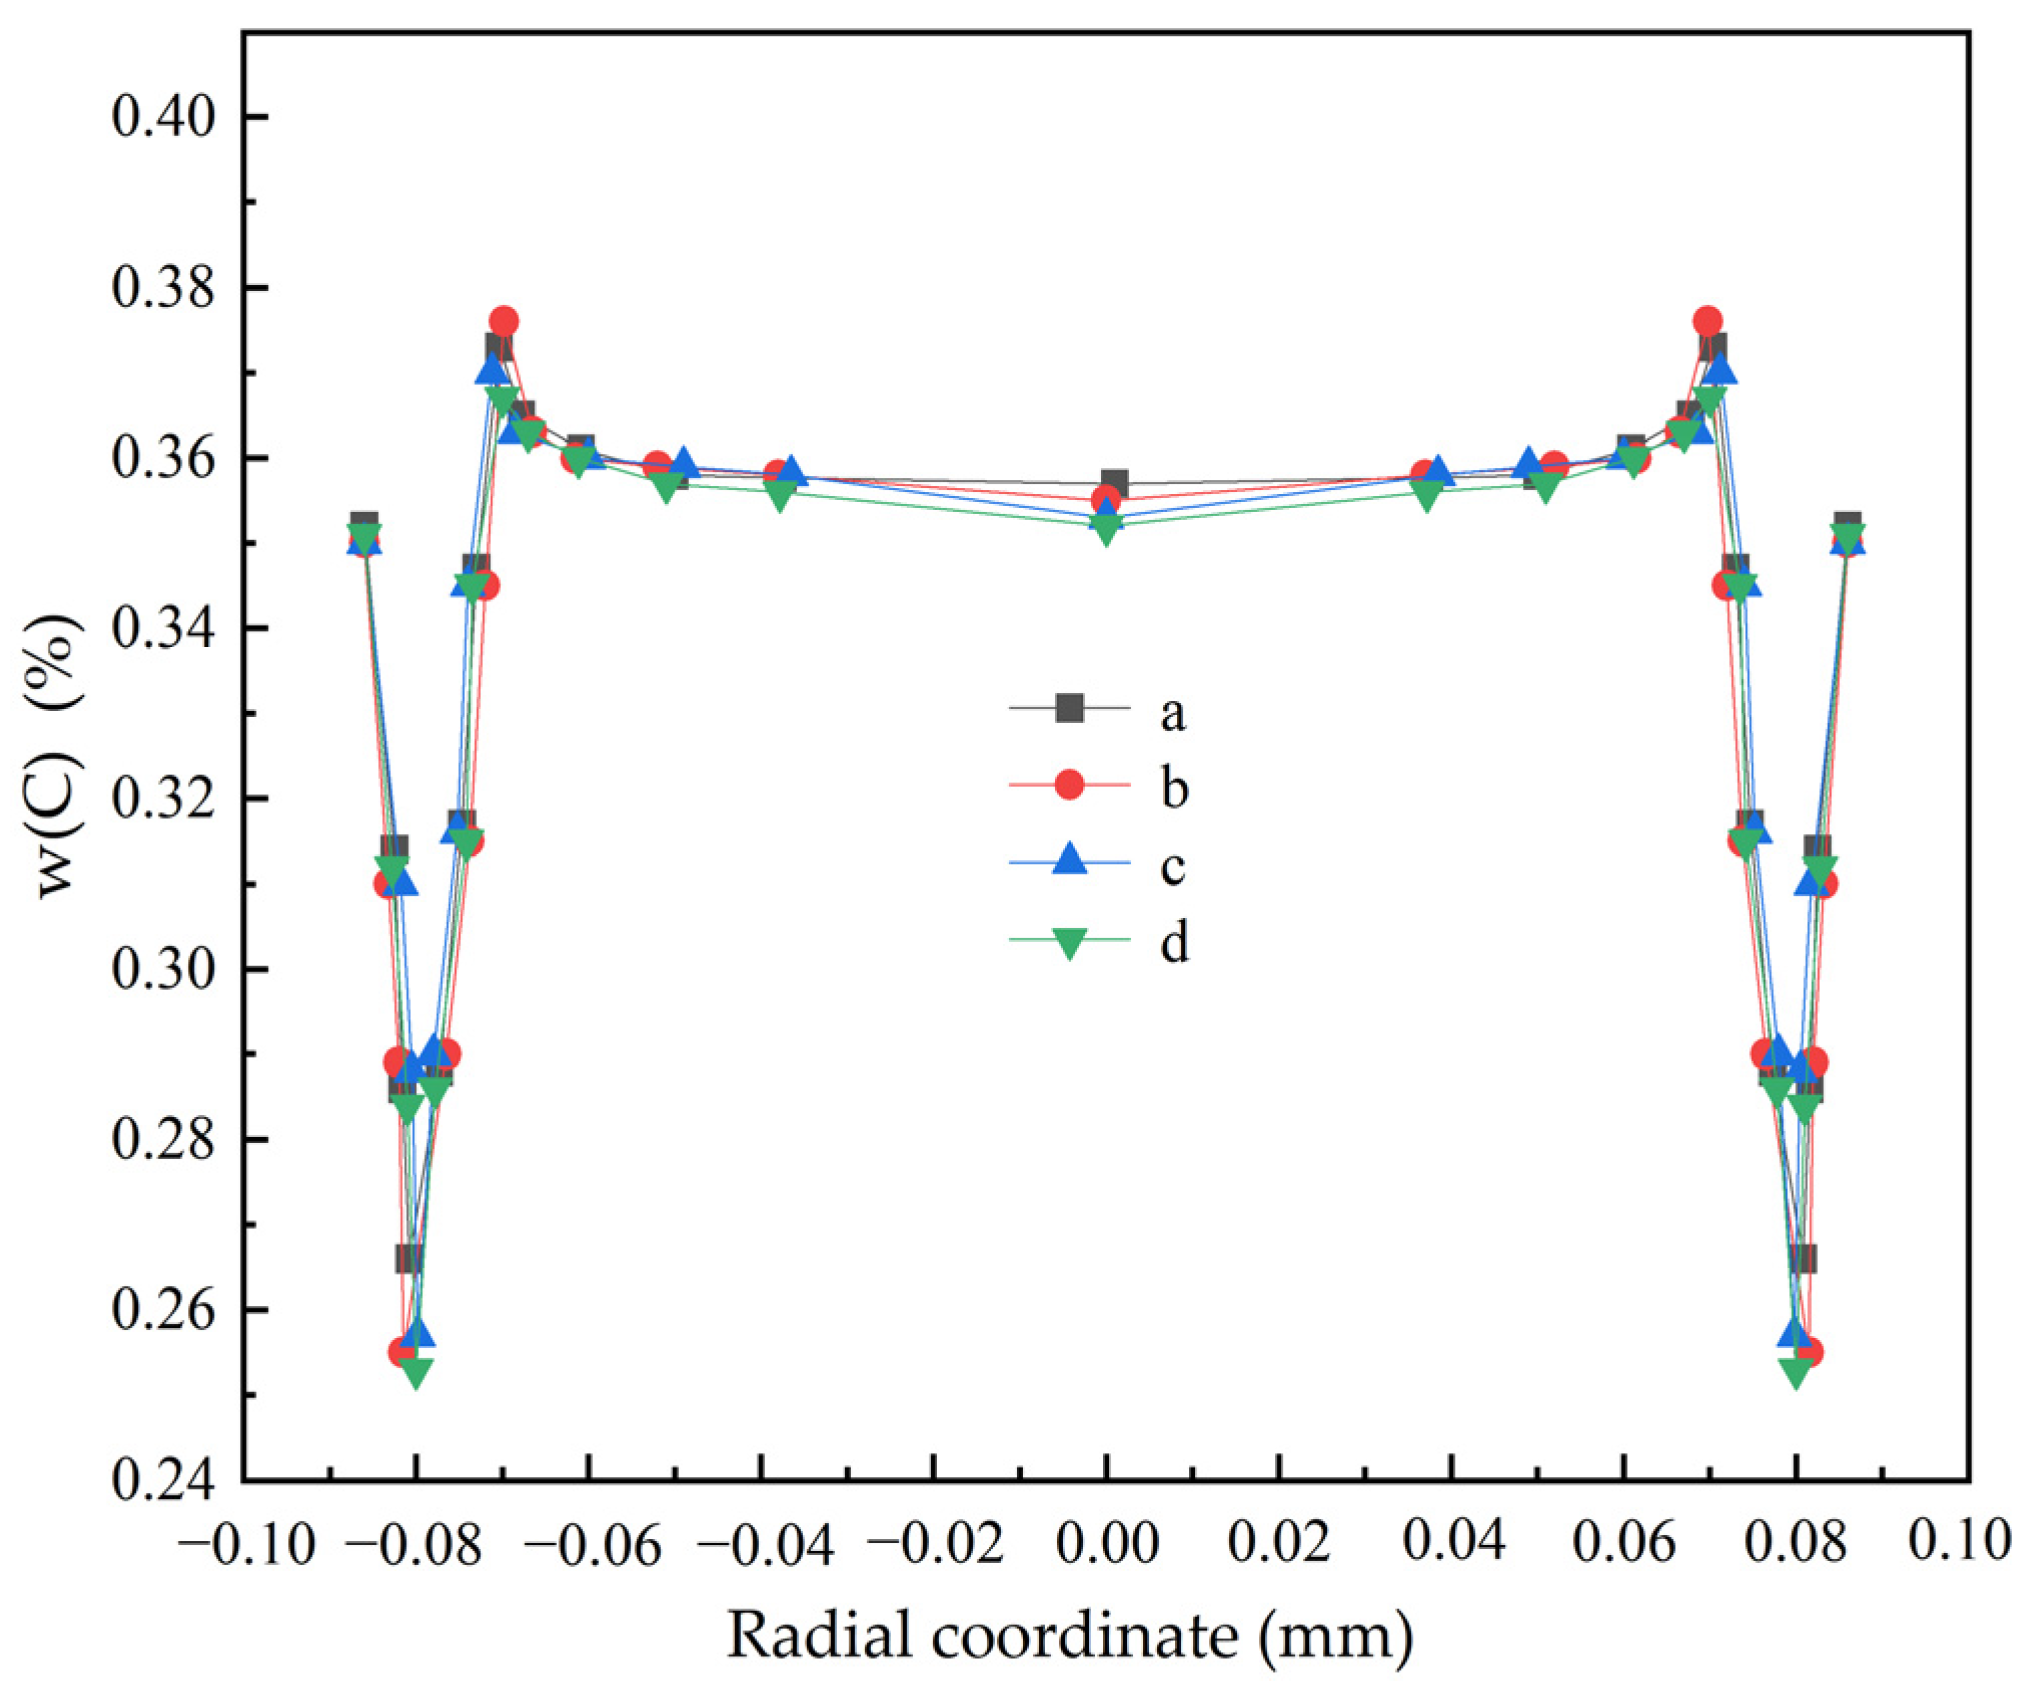
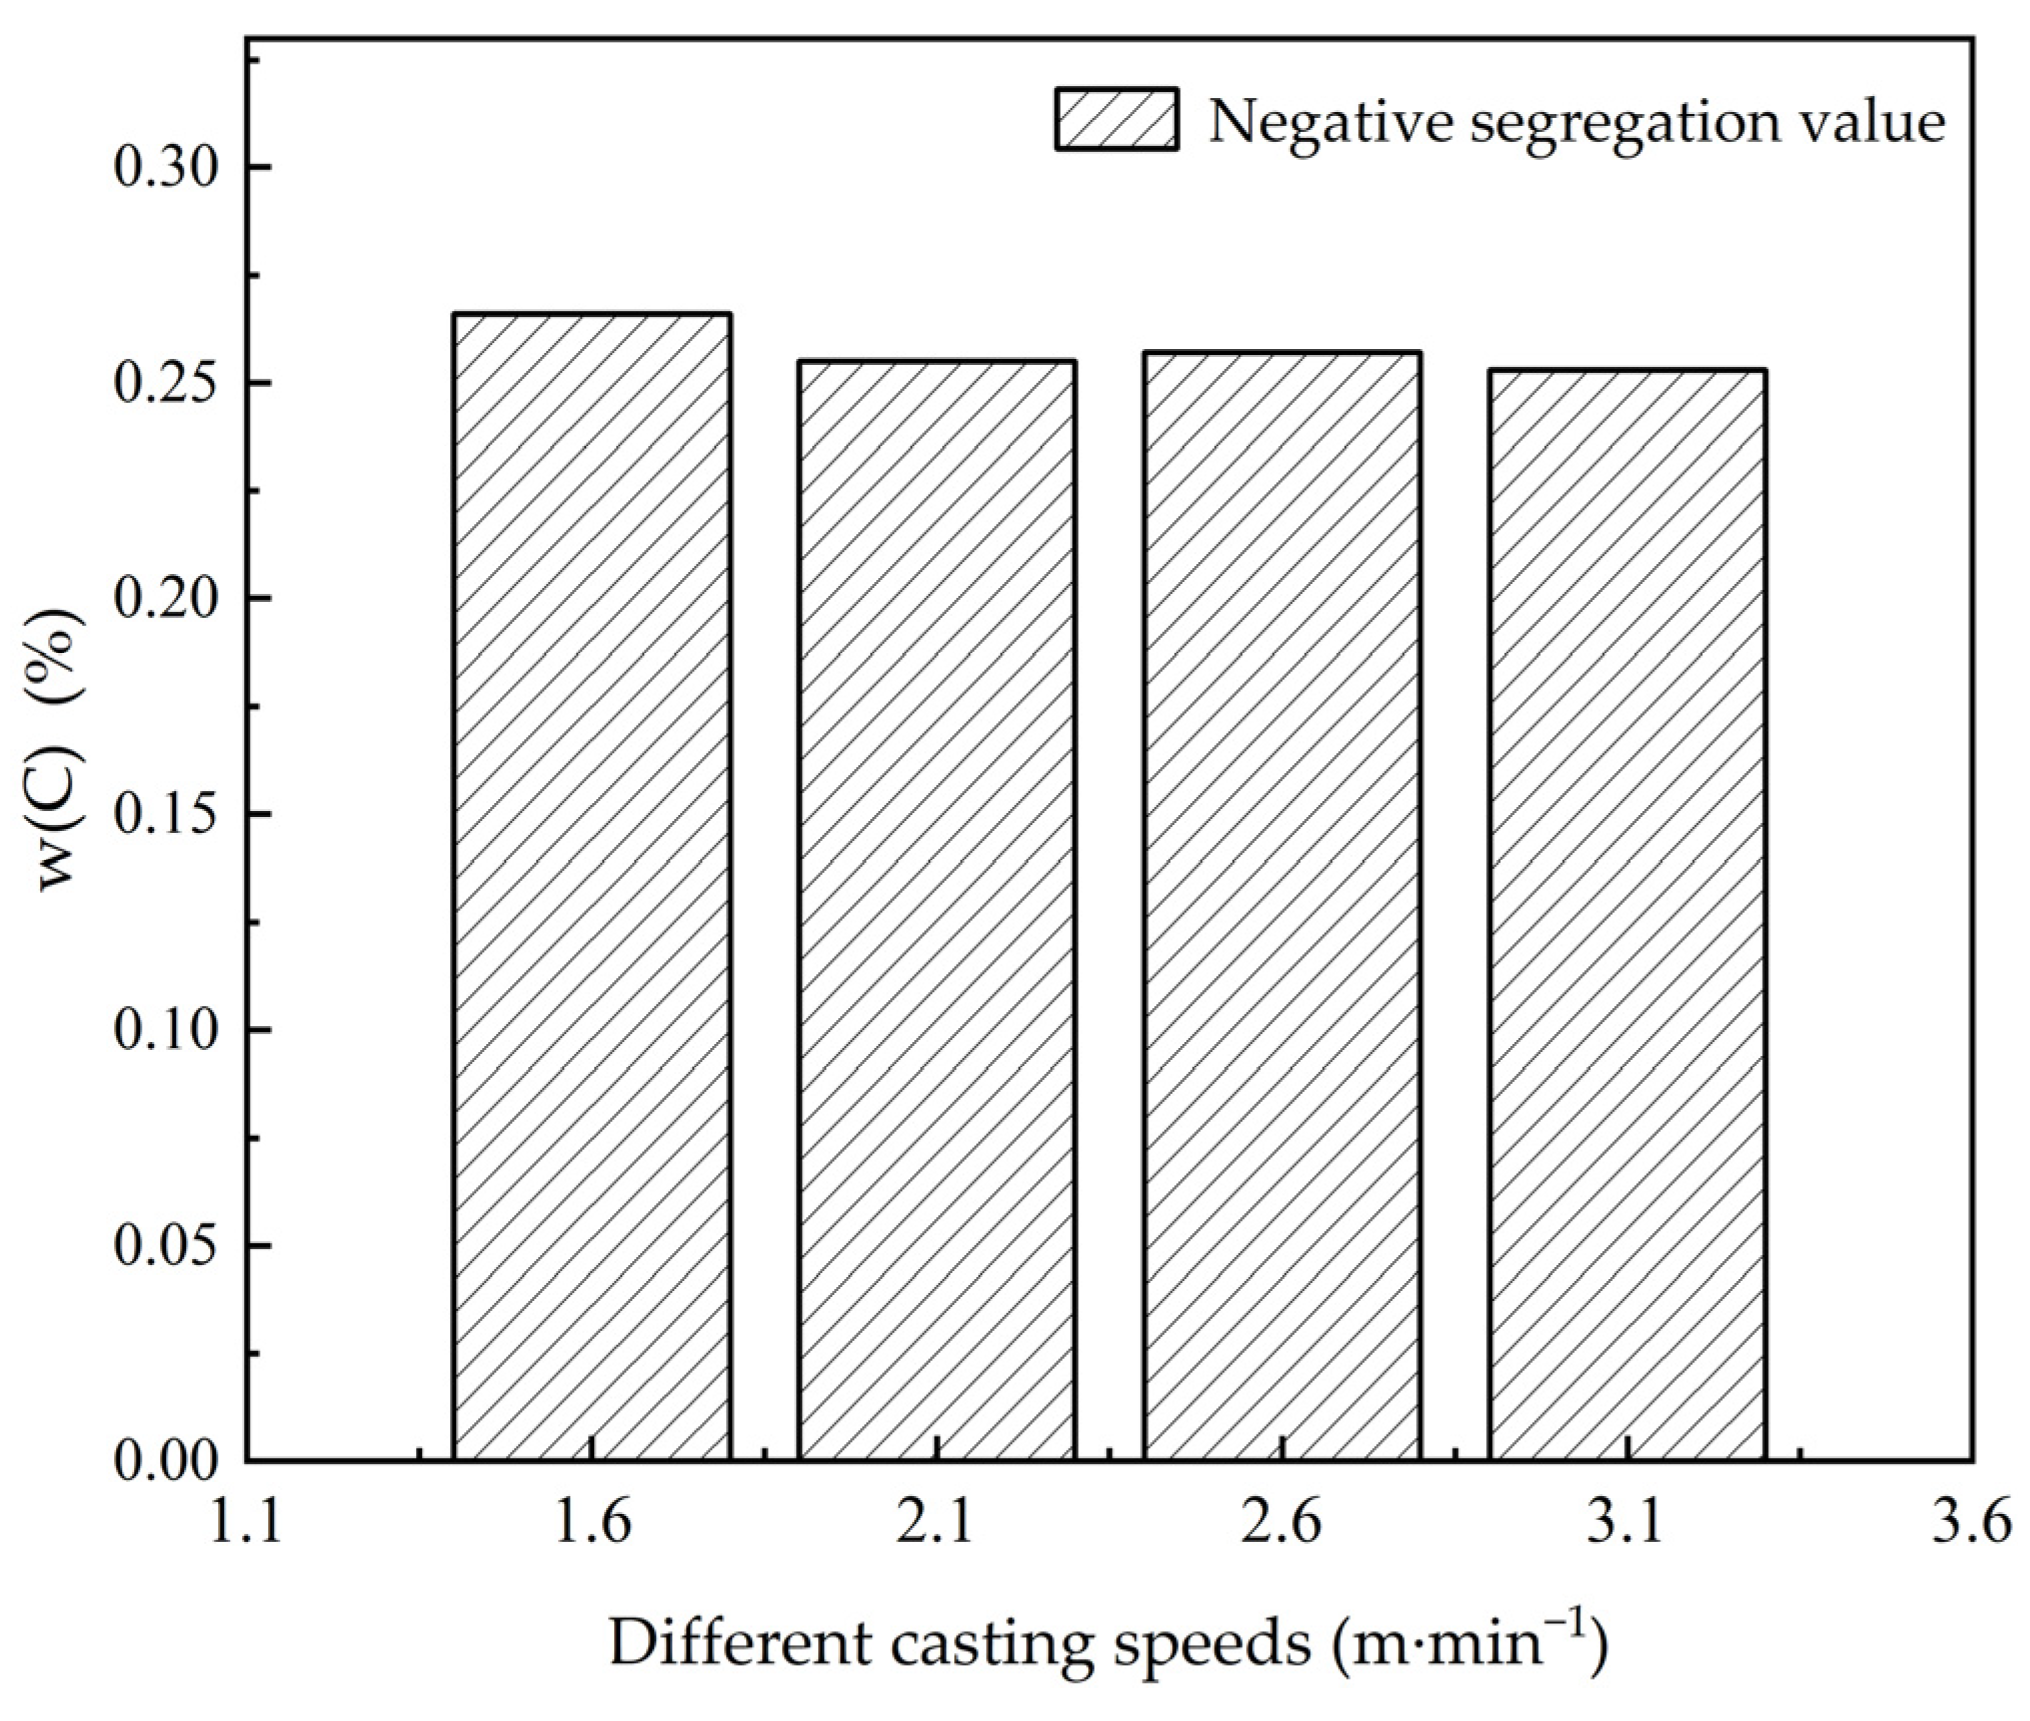
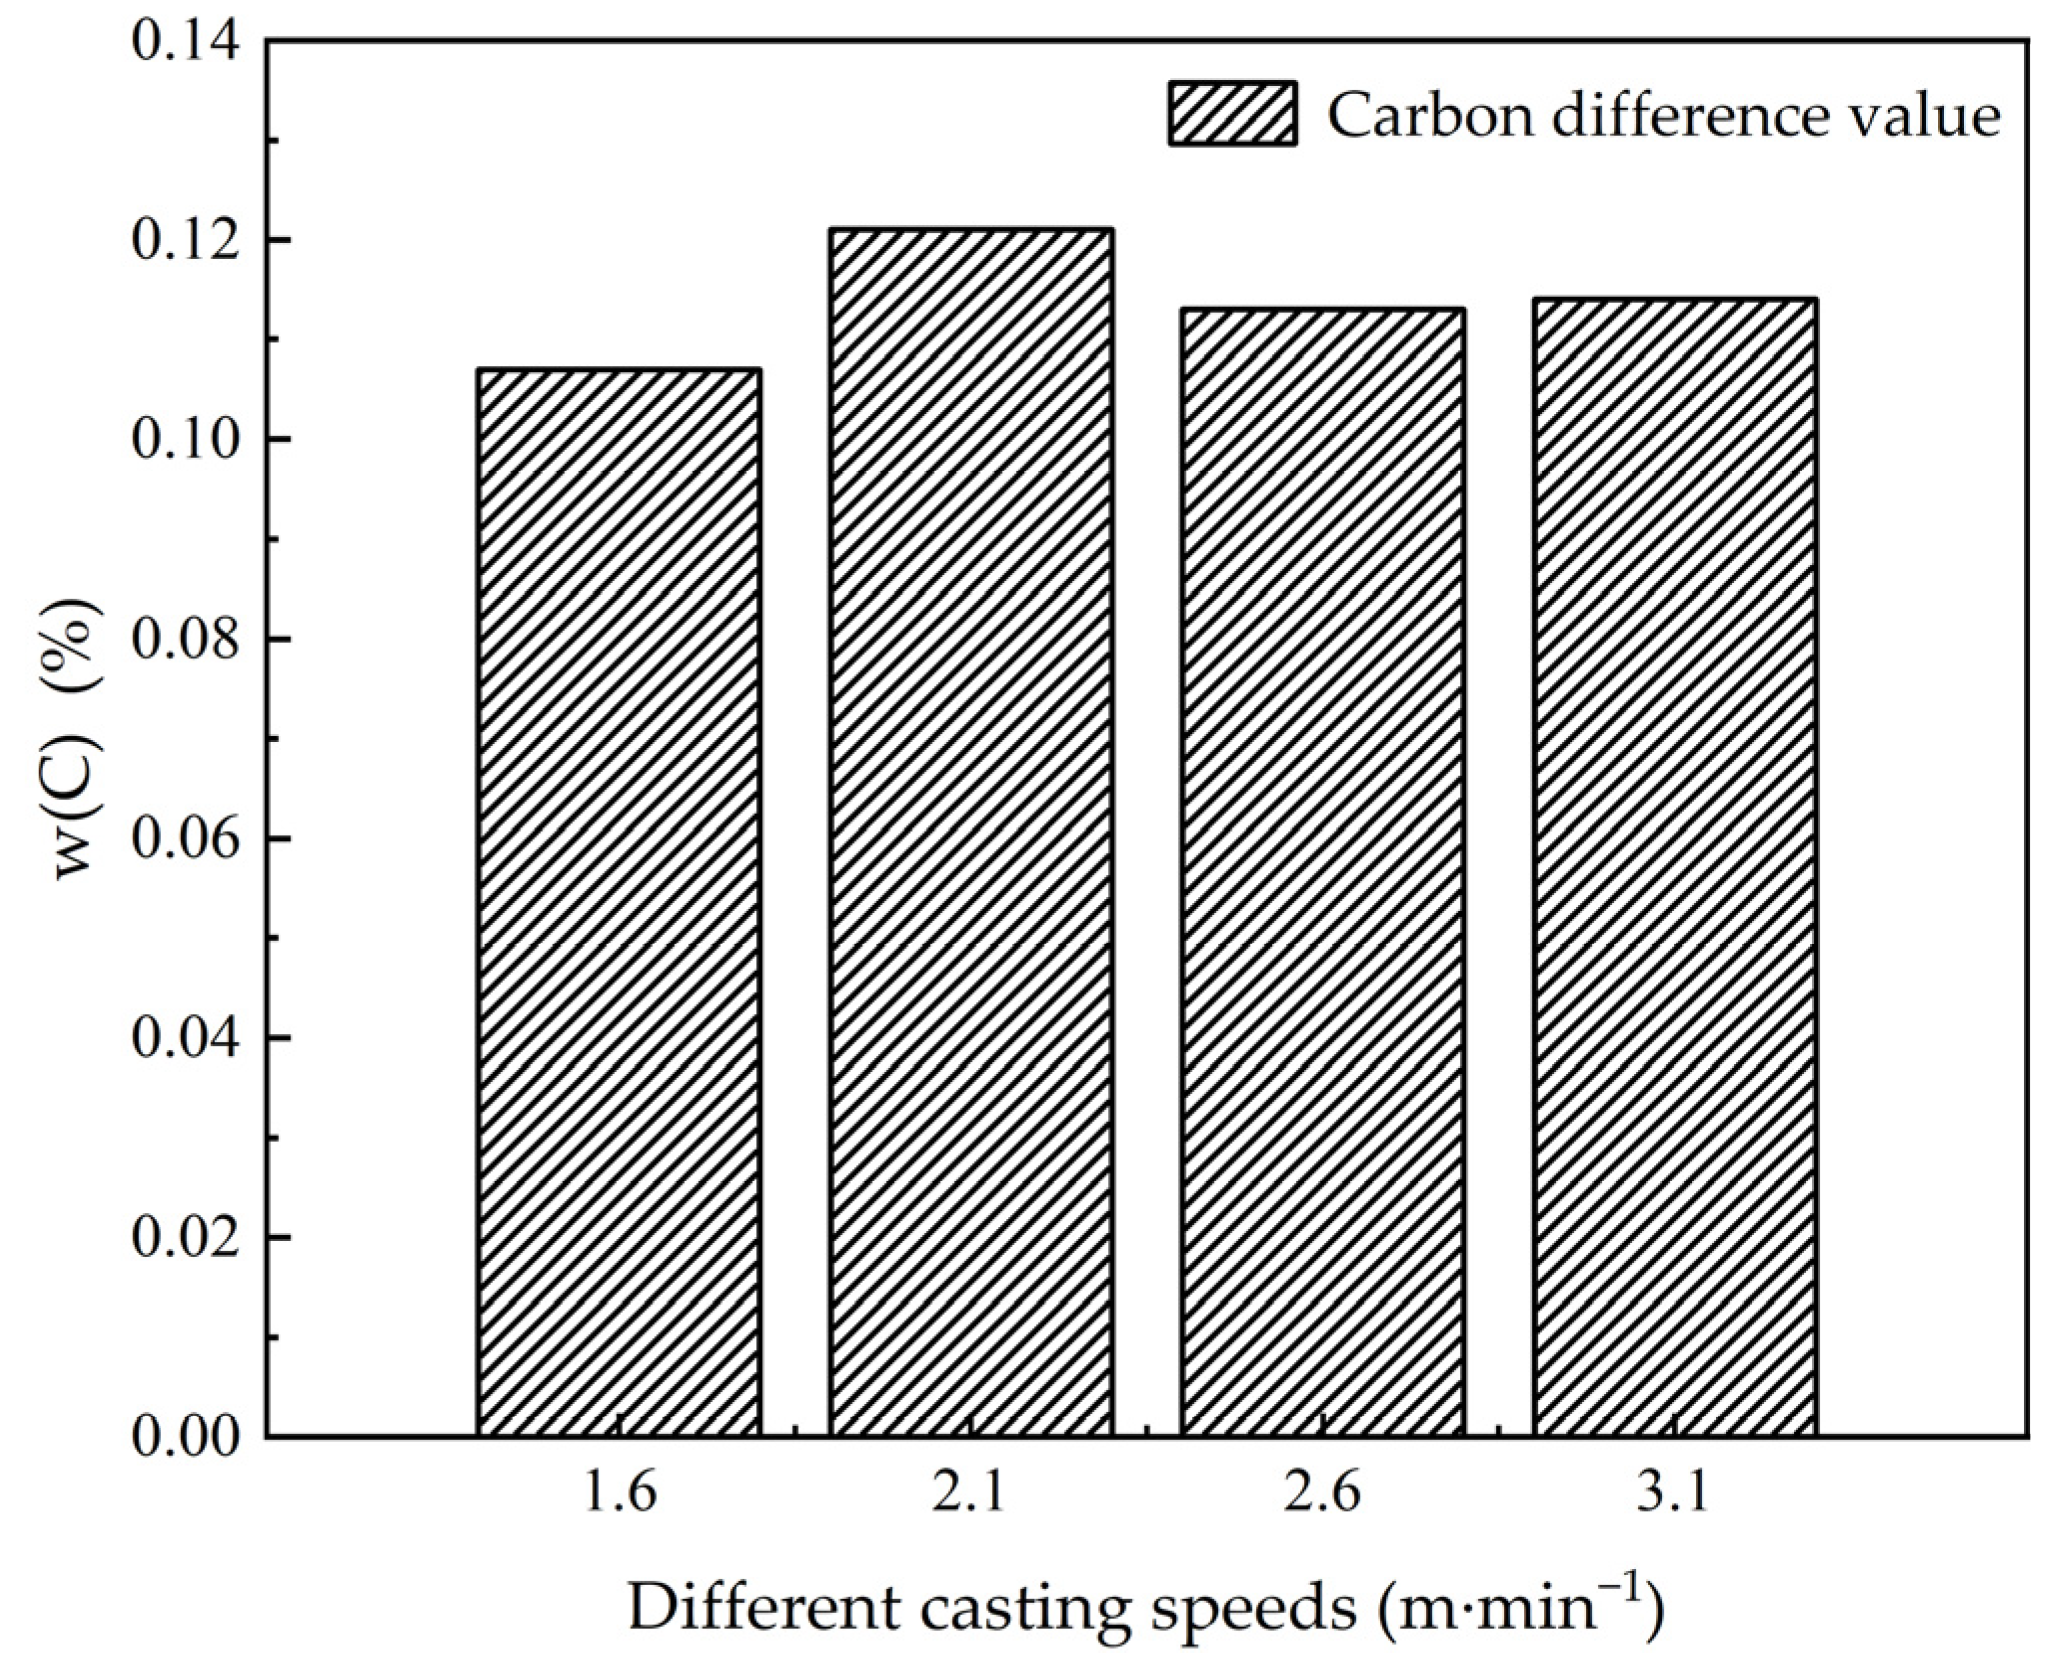
3.3. The Influence of the Casting Speed on Macroscopic Segregation

By adjusting the casting speed during the continuous casting process, macroscopic segregation can be effectively controlled [40]. To investigate the impact of different casting speeds on the distribution of carbon, the mold overheat was set to 25 °C, and the cooling intensity was kept constant at 1200 kW·m−2, with stable conditions maintained across all cooling zones.
Figure 16 presents the distribution characteristics of carbon in the mold under varying casting speeds. As shown in the carbon distribution curve after complete solidification in Figure 17, the degree of segregation in the central region decreases as the casting speed increases. This trend can be attributed to the reduced residence time of molten steel in the mold, which limits the diffusion of solute elements.
Due to the relatively short period of time, it is difficult for the solute elements to fully diffuse and aggregate in the central region. Therefore, the development of central segregation has been alleviated to some extent. Figure 18 shows the variation in negative segregation values under different casting speeds. From the figure, it can be seen that at a casting speed of 1.6 m·min−1, the negative segregation value reaches a maximum of 0.266%, whereas when the casting speed is increased to 3.1 m·min−1, the negative segregation value decreases to a minimum of 0.253%, with a difference of 0.013%. This result indicates that an increase in casting speed intensifies the flow of molten steel, further promoting the redistribution of solute elements and the formation of segregation, resulting in an increase in the degree of negative segregation.
In the study of the macroscopic segregation phenomenon of the carbon element in the mold, Figure 19 illustrates the central segregation and maximum segregation values under different casting speeds. As shown in the figure, with the increase in casting speed, the positive segregation value first increases and then decreases. When the casting speed reaches 2.1 m·min−1, the positive segregation value reaches its maximum at 0.376%. However, as the casting speed continues to increase, the positive segregation value decreases to a minimum of 0.367% when the casting speed reaches 3.1 m·min−1.
Similarly to the effects of overheat and cooling intensity, during the continuous solidification process of molten steel in the mold, the solute elements progressively accumulate towards the center of the billet, resulting in central segregation [41]. The central segregation value is also influenced by the casting speed. When the casting speed reaches 2.6 m·min−1, the central segregation value is at its minimum, 0.353%. In contrast, when the casting speed is 1.6 m·min−1, the central segregation value reaches its maximum at 0.357%. Unlike the non-linear patterns observed at maximum or minimum casting speeds, the central segregation value here does not follow a non-linear trend. The difference in central segregation values is 0.004%, and the change is relatively small.
Figure 20 illustrates the variation pattern of the overall carbon deviation value under different casting speeds. As shown in the figure, when the casting speed is 1.6 m·min⁻1, the overall carbon deviation value reaches its minimum of 0.107%. As the casting speed continues to increase, it rises to a maximum value of 0.121% when the casting speed reaches 2.1 m·min⁻1. The variation in the overall carbon deviation value does not follow a monotonic trend. Changing the casting speed affects negative segregation, positive segregation, and central positive segregation to varying degrees, but the influence is limited and not as pronounced as the effects of the degree of superheat and cooling intensity. No clear pattern emerges from the data. This observation aligns with the findings of Zhang et al. [42], who concluded that the influence of casting speed on the internal structure and composition distribution of the material is complex and does not follow a simple, single pattern. As shown in Table 5, with the drawing speed increasing from 1.6 m·min−1 to 3.1 m·min−1, the negative segregation index decreases from 0.76 to 0.72; the central segregation index increases from 1.02 to 1.06; and the maximum segregation index increases from 1.05 to 1.07.

4. Conclusions

This study systematically investigates the influence laws of superheat degree, cooling intensity and casting speed on the macroscopic segregation phenomenon of molten steel in the continuous casting mold through numerical simulation methods. A comparative analysis is conducted using the control variable method. Based on the segregation data for the carbon element, the following conclusions are drawn:
(1) The influence of superheat degree on macroscopic segregation was studied. It was found that when the steel bath superheat degree increased from 25 °C to 40 °C, the carbon difference value rose from 0.107% to 0.143%, the central segregation value increased from 0.357% to 0.364%, and the segregation index increased from 1.02 to 1.04. In lower superheat degree environments, the effect on central segregation and negative segregation was beneficial, with the improvement in negative segregation being more pronounced than in central segregation.
(2) The influence of cooling intensity on macroscopic segregation was studied. The data revealed that as the cooling intensity continuously increased, due to the accelerated heat exchange rate at the wall surface, the carbon segregation difference rose from 0.107% to 0.144%. Meanwhile, the negative segregation value changed from 0.266% to 0.250%, and the segregation index decreased from 0.76 to 0.71, indicating a deterioration in the degree of macroscopic segregation. This suggests that a lower cooling intensity provides more time for solute elements to diffuse and redistribute, improving the uniformity of carbon elements in the molten steel.
(3) The influence of casting speed on segregation was studied. The results showed that increasing the casting speed shortened the residence time of molten steel, which, due to strong convective effects, limited temperature homogenization and solute diffusion. This resulted in a maximum carbon segregation difference of 0.121% at a casting speed of 2.1 m·min−1 and a minimum central segregation value of 0.353% with a segregation index of 1.01 at a casting speed of 2.6 m·min−1, exhibiting a non-linear pattern.
(4) The influence of multiple process parameters on macroscopic segregation was investigated. Under the condition of 25 °C superheat and 1200 kWm−2 cooling intensity, the low superheat suppressed solute enrichment, while the lower cooling intensity prolonged diffusion time. As a result, the carbon difference value reached its lowest level at 0.107%, and the central segregation value was minimized at 0.357%. The coordinated distribution of multiple process parameters was shown to optimize the quality of the cast billet. Therefore, the results of this study can be extended to larger molds or different blank shapes.

Author Contributions

Methodology, X.H. and S.W.; formal analysis, S.H. and H.K.; draft writing, Z.D. and Z.L.; review, X.Y.; editing, Y.X. and J.L. All authors have read and agreed to the published version of the manuscript.

Funding

This research was funded by the Hebei Province Innovation Ability Improvement Plan (No. 23561001D) and the Hebei Province High School Science Research Project (BJK2024058). The APC was funded by the Hebei Province Innovation Ability Improvement Plan (No. 23561001D).

Data Availability Statement

Data are contained within the article.

Conflicts of Interest

The authors declare no conflicts of interest.

References

  1. Nian, Y.; Zhang, L.; Zhang, C.; Ali, N.; Chu, J.; Li, J.; Liu, X. Application Status and Development Trend of Continuous Casting Reduction Technology: A Review. Processes 2022, 10, 2669. [Google Scholar] [CrossRef]
  2. Liu, Z.; Li, Y.; Cheng, C.; Lan, P.; Wu, W. Study on Parameter Optimization of Diversion Wall in an Eight-Strand Tundish during Continuous Casting of Billet with High Casting Speed. Processes 2022, 10, 555. [Google Scholar] [CrossRef]
  3. Pang, X.; Li, H.; Wang, J.; Zhu, L.; Sun, L. Optimization of Billet Tube Mold Designs for High-Speed Continuous Casting. Processes 2023, 11, 3367. [Google Scholar] [CrossRef]
  4. Wang, G.; Chu, M. Green Steel Metallurgy Technology for Low Carbon Emission Reduction. Sci. Bull. 2020, 38, 68–76. [Google Scholar]
  5. Xu, L.; Pei, Q.W.; Han, Z.F.; Cui, J.; Pan, H.G.; Yao, Y.T. Influences of the Braking Effect of Ruler EMBr on Molten Steel Flow and Steel–Slag Interface Fluctuation in a Continuous Casting Mold. Processes 2023, 11, 33. [Google Scholar] [CrossRef]
  6. Paweł, K.; Paweł, S.; Grzegorz, K.; Szymon, K.; Krystian, F.; Michał, S.; Wojciech, Ś.; Anna, B.; Joanna, K.; Barbara, J.; et al. External Surface Quality of the Graphite Crystallizer as a Factor Influencing the Temperature of the Continuous Casting Process of ETP Grade Copper. Materials 2021, 14, 6309. [Google Scholar] [CrossRef]
  7. Dong, X.; Li, L.; Tang, Z.; Huang, L.; Liu, H.; Liao, D.; Yu, H. The Effect of Continuous Casting Cooling Process on the Surface Quality of Low-Nickel Austenitic Stainless Steel. Steel Res. Int. 2025, 2400957, Early View. [Google Scholar]
  8. Cho, S.; Thomas, G.B. Thomas. Electromagnetic Forces in Continuous Casting of Steel Slabs. Metals 2019, 9, 471. [Google Scholar] [CrossRef]
  9. Aboutaleb, M.M.; Lapointe, F.; D’Amours, J.; Isac, M.M.; Guthrie, R. Effects of Angle of Rotation of Submerged Entry Nozzle on Fluid Flows in a Square Billet Casting Mold. J. Met. 2018, 70, 2088–2095. [Google Scholar] [CrossRef]
  10. Bai, L.; Wang, B.; Zhong, H.G.; Ni, J.; Zhai, Q.J.; Zhang, J.Y. Experimental and Numerical Simulations of the Solidification Process in Continuous Casting of Slab. Metals 2016, 6, 53. [Google Scholar] [CrossRef]
  11. Ren, L.; Liu, W.; Ling, H.; Yang, J. Study on Multiphase Flow in a Wide-Width Continuous Casting Mold. Processes 2022, 10, 1269. [Google Scholar] [CrossRef]
  12. Yang, L. “13th Five-Year” key technology progress and thinking of steelmaking in China. Steel 2022, 57, 1–10. [Google Scholar]
  13. Gao, X.Z.; Yang, S.F.; Li, J.S.; Liao, H. Numerical Simulation on Optimization of Center Segregation for 50CrMo Structural Alloy Steel. High Temp. Mater. Processes. 2016, 35, 583–589. [Google Scholar] [CrossRef]
  14. Zeng, Q.; Xiao, C.; Li, J.L. Analysis of Micro-Segregation of Solute Elements on the Central Cracking of Continuously Cast Bloom. Metals 2021, 11, 382. [Google Scholar] [CrossRef]
  15. Song, S.C.; Sun, Y.H.; Wei, Y.H.; Liu, C.L. Control of macrosegregation at the steel gradient transition by submerged entry nozzle and mold electromagnetic stirring. Ironmak. Steelmak. 2024, 51, 675–691. [Google Scholar] [CrossRef]
  16. Dong, Q.P.; Zhang, J.M.; Liang, Q.; Yin, Y.B. Numerical Modeling of Macrosegregation in Round Billet with Different Microsegregation Models. ISIJ Int. 2017, 57, 814–823. [Google Scholar] [CrossRef]
  17. Yang, Y.W.; Luo, S.; Wang, W.L.; Zhu, M.Y. Multiphase Solidification Modeling of Solidification Structure Evolution and Macrosegregation of Round Bloom Continuous Casting Process with Mold Electromagnetic Stirring and Final Electromagnetic Stirring. Steel Res. Int. 2023, 95, 2300446. [Google Scholar] [CrossRef]
  18. Wu, C.L.; Liu, X.M.; Wang, Q.; He, M.; Zhu, X.W.; Li, D.W.; Zhao, J.L.; Hong, L. Macrosegregation Prediction by Evaluating Liquid Level Fluctuation in Round Billet Continuous Casting with Electromagnetic Nozzle Swirling Flow. Metall. Mater. Trans. B 2021, 52, 3571–3575. [Google Scholar] [CrossRef]
  19. Kengo, K.; Nobuhiro, O.; Shun, S.; Kento, K. Numerical Simulation of Macrosegregation in a Continuous Casting Mold with Electromagnetic Stirring. ISIJ Int. 2022, 62, 1862–1873. [Google Scholar]
  20. Guan, R.; Cheng, J.; Zhu, M.Y.; Deng, S.M. Numerical simulation of v-shaped segregation in continuous casting blooms based on a microsegregation model. Metall. Mater. Trans. B 2018, 49, 2571–2583. [Google Scholar] [CrossRef]
  21. Zhang, C.P.; Loucif, A.; Jahazi, M.; Morin, J.B. FEM Simulation of the Effect of Mold Initial Temperature on Carbon Macrosegregation in Large-Size Steel Ingots. Mater. Sci. Forum. 2022, 6351258–6351263. [Google Scholar] [CrossRef]
  22. Ma, H.T.; Zhang, J.M.; Yin, Y.B.; Yan, Z.Z.; Liu, H.Y. Numerical simulation on the centre macrosegregation during Billet continuous casting with the soft reduction. Ironmak. Steelmak. 2022, 49, 887–897. [Google Scholar] [CrossRef]
  23. Zhao, X.K.; Zhang, J.M.; Lei, S.W.; Wang, Y.N. The position study of heavy reduction process for improving centerline segregation or porosity with extra-thickness slabs. Steel Res. Int. 2014, 85, 645–658. [Google Scholar] [CrossRef]
  24. Chen, H.B.; Long, M.J.; Chen, D.F.; Liu, T.; Duan, H.M. Numerical study on the characteristics of solute distribution and the formation of centerline segregation in continuous casting (CC) slab. Int. J. Heat Mass Transf. 2018, 126, 843–853. [Google Scholar] [CrossRef]
  25. Qiao, T.H.; Wang, S.; Guan, R.; Zhu, X.L.; Ai, X.G.; Ji, Y.; Li, S.L. A Numerical Investigation into the Effect of Thermal Shrinkage and Solidification Shrinkage on the Microstructure and Macrosegregation for Continuous Casting Billet. Metall. Mater. Trans. B 2024, 55, 3663–3678. [Google Scholar] [CrossRef]
  26. Xu, L.; Pei, Q.W.; Han, Z.F.; Yang, S.; Wang, J.Y.; Yao, Y.T. Modeling Study on Melt Flow, Heat Transfer, and Inclusion Motion in the Funnel-shaped Molds for Two Thin-Slab Casters. Processes 2022, 10, 2738. [Google Scholar] [CrossRef]
  27. Dong, Q.D.; Zhang, J.M.; Yin, Y.B.; Wang, B. Three-Dimensional Numerical Modeling of Macrosegregation in Continuously Cast Billets. Metals 2017, 7, 209. [Google Scholar] [CrossRef]
  28. Gao, Y.B.; Bao, Y.P.; Wang, M.; Zhang, M.Y. On the Macrosegregation of Continuous Casting of High Carbon Steel Billet with Strand Reduction Process. Metals 2024, 14, 157. [Google Scholar] [CrossRef]
  29. Peng, J.; Yang, J.; Zhang, T.; Xu, G.J.; Liu, H.J.; Zhou, J.J.; Qin, W. Optimization of Flow Field in Slab Continuous Casting Mold with Medium Width Using High Temperature Measurement and Numerical Simulation for Automobile Exposed Panel Production. Metals 2019, 10, 9. [Google Scholar] [CrossRef]
  30. Li, X.L.; Li, B.K.; Liu, Z.Q.; Niu, R.; Liu, Y.Q.; Zhao, C.L.; Huang, C.D.; Qiao, H.S.; Yuan, T.X. Large Eddy Simulation of Multi-Phase Flow and Slag Entrapment in a Continuous Casting Mold. Metals 2018, 9, 7. [Google Scholar] [CrossRef]
  31. Qiu, D.J.; Zhang, Z.H.; Li, X.T.; Lv, M.; Xi, X.F. Numerical Simulation of the Flow Field in an Ultrahigh-Speed Continuous Casting Billet Mold. Metals 2023, 13, 964. [Google Scholar] [CrossRef]
  32. Wang, W.; Hou, Z.B.; Chang, Y.; Cao, J.H. Effect of superheat on quality of central equiaxed grain zone of continuously cast bearing steel billet based on two-dimensional segregation ratio. J. Iron Steel Res. Int. 2018, 25, 9–18. [Google Scholar] [CrossRef]
  33. Zhang, C.; Jahazi, M.; Tremblay, R. Simulation and experimental validation of the effect of superheat on macrosegregation in large-size steel ingots. Int. J. Adv. Manuf. Technol. 2020, 107, 167–175. [Google Scholar] [CrossRef]
  34. Pan, D.; Zhong, H.G.; Guo, Q.T.; Li, Y.T.; Xiao, Y.B.; Zhang, K.L. Research on solidification behavior of a high Mn steel during continuous casting based on solidification characteristic unit analysis. Mater. Lett. 2022, 327, 133028. [Google Scholar] [CrossRef]
  35. Jiang, D.B.; Zhang, L.F.; Wang, Y.D. Effect of mold electromagnetic stirring on solidification structure and solute segregation in continuous casting bloom. J. Iron Steel Res. Int. 2022, 29, 124–131. [Google Scholar] [CrossRef]
  36. Ma, H.T.; Zhang, J.M.; Cheng, R.; Wang, S.X. Numerical Simulation Study on Quality Control of the Center Macroscopic Segregation in the Continuous Casting Slab. Trans. Indian Inst. Met. 2019, 72, 825–835. [Google Scholar] [CrossRef]
  37. Zhong, H.G.; Wang, R.J.; Han, Q.Y.; Fang, M.T.; Yuan, H.Z.; Song, L.X.; Xie, X.; Zhai, Q.J. Solidification structure and central segregation of 6Cr13Mo stainless steel under simulated continuous casting conditions. J. Mater. Res. Technol. 2022, 20, 3408–3419. [Google Scholar] [CrossRef]
  38. Fang, X.; Yang, Y.G.; Mu, W.Z.; Yang, X.Y.; Zhang, H.L.; Mi, Z.L. Effects of the superheating degree and cooling intensity on the as-cast microstructure of CP780 thin slab. Int. J. Cast Met. Res. 2023, 36, 9–17. [Google Scholar] [CrossRef]
  39. Wang, F.K.; He, H.; Wang, W.L.; Zhang, L.; Chen, J.X.; Du, J.; Zeng, J. Effect of mold cooling intensity on the depression-type crack formation and mold flux infiltration during continuous casting process. Metall. Mater. Trans. B 2023, 54, 9. [Google Scholar] [CrossRef]
  40. Chen, G.; Li, J.T.; Yin, Z.K.; Xu, G.M. Improvement of microstructure and properties in twin-roll casting 7075 sheet by lower casting speed and compound field. Ceram. Mater. 2017, 127, 325–332. [Google Scholar] [CrossRef]
  41. An, H.H.; Bao, Y.P.; Wang, M.; Yang, Q.; Dang, Y.Y. Numerical and experimental investigation of solidification structure evolution and reduction of centre segregation in continuously cast GCr15 bloom. Ironmak. Steelmak. 2020, 47, 1063–1077. [Google Scholar] [CrossRef]
  42. Zhang, Y.; Ling, J.Q.; Yao, Z.W.; Liu, F.Z.; Dong, Q.P.; Nagaumi, H. Effect of casting speed on floating grains in direct-chill casting of aluminum alloys. Mater. Trans. 2023, 64, 2039–2314. [Google Scholar] [CrossRef]
Figure 1. Simulation model and computational grid.
Processes 13 01415 g001
Figure 2. Boundary layer mesh refinement.
Processes 13 01415 g002
Figure 3. Determinant 3 × 3 × 3.
Processes 13 01415 g003
Figure 4. Velocity comparison under different grids.
Processes 13 01415 g004
Figure 5. Comparison of simulation results between this paper and literature under influence of casting speed on turbulent kinetic energy of mold liquid surface.
Processes 13 01415 g005
Figure 6. Distribution of C element under different superheat degrees. (a) Degree of superheat 25 °C; (b) degree of superheat 30 °C; (c) degree of superheat 35 °C; (d) degree of superheat 40 °C.
Processes 13 01415 g006
Figure 7. Curve of C element distribution after complete solidification. (a) degree of superheat 25 °C; (b) degree of superheat 30 °C; (c) degree of superheat 35 °C; (d) degree of superheat 40 °C.
Processes 13 01415 g007
Figure 8. Negative segregation values under different superheat degrees.
Processes 13 01415 g008
Figure 9. Center segregation and maximum segregation values under different superheat degrees.
Processes 13 01415 g009
Figure 10. Carbon difference values under different superheat degrees.
Processes 13 01415 g010
Figure 11. Distribution of C element under different cooling intensities. (a) cooling intensity is 1200 kW·m−2; (b) cooling intensity is 1300 kW·m−2; (c) cooling intensity is 1400 kW·m−2; (d) cooling intensity is 1500 kW·m−2.
Processes 13 01415 g011
Figure 12. Curve of C element distribution after complete solidification. (a) cooling intensity is 1200 kW·m−2; (b) cooling intensity is 1300 kW·m−2; (c) cooling intensity is 1400 kW·m−2; (d) cooling intensity is 1500 kW·m−2.
Processes 13 01415 g012
Figure 13. Negative segregation values under different cooling intensities.
Processes 13 01415 g013
Figure 14. Center segregation and maximum segregation values under different cooling intensities.
Processes 13 01415 g014
Figure 15. Carbon difference values under different cooling intensities.
Processes 13 01415 g015
Figure 16. Distribution of C element under different casting speeds. (a) Casting speed is 1.6 m·min−1; (b) casting speed is 2.1 m·min−1; (c) casting speed is 2.6 m·min−1; (d) casting speed is 3.1 m·min−1.
Processes 13 01415 g016
Figure 17. Curve of C element distribution after complete solidification. (a) Casting speed is 1.6 m·min−1; (b) casting speed is 2.1 m·min−1; (c) casting speed is 2.6 m·min−1; (d) casting speed is 3.1 m·min−1.
Processes 13 01415 g017
Figure 18. Negative segregation values under different casting speeds.
Processes 13 01415 g018
Figure 19. Center segregation values and maximum segregation values under different casting speeds.
Processes 13 01415 g019
Figure 20. Carbon difference values under different casting speeds.
Processes 13 01415 g020
Table 1. The basic parameters of the simulation calculation.
Simulation ParametersValues
Mold dimension172 mm × 172 mm
Mold length1000 mm
The inner diameter14 mm
Extended length700 mm
Viscosity0.0065 Pa·s
Density7050 kg·m−3
Specific heat700 J·(kg−1·K−1)
Latent heat of solidification270,000 J·kg
Solidus temperature1703 K
Liquidus temperature1754 K
Table 2. Mesh size and corresponding number.
Case12345
Maximum size/mm4681012
Gird number/10,00010061302419
Table 3. Macroscopic under different superheating degrees.
Superheat Degrees (°C)Cooling
Intensities (kW·m−2)
Casting Speeds (m·min−1)Negative Segregation Value (%)Central Segregation Value (%)Maximum Positive Segregation Value (%)Carbon Difference Value (%)Cn/CoCc/CoCm/Co
2512001.60.2660.3570.3730.1070.761.021.07
3012001.60.2580.3590.3740.1180.741.031.07
3512001.60.2530.3600.37450.1250.721.031.07
4012001.60.2410.3640.3750.1430.691.041.07
Table 4. Macroscopic under different cooling intensities.
Superheat Degrees (°C)Cooling
Intensities (kW·m−2)
Casting Speeds (m·min−1)Negative Segregation (%)Central
Segregation Value (%)
Maximum Positive
Segregation Value (%)
Carbon
Difference Value (%)
Cn/CoCc/CoCm/Co
2512001.60.2660.3570.3730.1070.761.021.07
2513001.60.2630.3610.3870.1240.751.031.11
2514001.60.2580.3620.3910.1330.741.031.12
2515001.60.2500.3630.3940.1440.711.041.13
Table 5. Macroscopic under different casting speeds.
Superheat Degrees (°C)Cooling
Intensities (kW·m−2)
Casting Speeds (m·min−1)Negative Segregation (%)Central
Segregation Value (%)
Maximum Positive
Segregation Value (%)
Carbon
Difference Value (%)
Cn/CoCc/CoCm/Co
2512001.60.2660.3570.3730.1070.761.021.07
2512002.10.2550.3550.3760.1210.731.011.07
2512002.60.2570.3530.3700.1130.731.011.06
2512003.10.2530.3700.3670.1140.721.061.05
Disclaimer/Publisher’s Note: The statements, opinions and data contained in all publications are solely those of the individual author(s) and contributor(s) and not of MDPI and/or the editor(s). MDPI and/or the editor(s) disclaim responsibility for any injury to people or property resulting from any ideas, methods, instructions or products referred to in the content.

