Article

Thermodynamics-Guided Neural Network Modeling of a Crystallization Process

1
Department of Chemical and Biological Engineering, Korea University, 145 Anam-Ro, Seongbuk-Gu, Seoul 02841, Republic of Korea
2
Process Research Center, Petrochemicals R&D, LG Chem, Ltd., Seoul 07803, Republic of Korea
*
Author to whom correspondence should be addressed.
Processes 2025, 13(5), 1414; https://doi.org/10.3390/pr13051414
Submission received: 11 April 2025 / Revised: 29 April 2025 / Accepted: 4 May 2025 / Published: 6 May 2025
(This article belongs to the Section Separation Processes)

Abstract

:
Melt crystallization is a promising separation technique that produces ultra-high-purity products while consuming less energy and generating lower CO2 emissions than conventional methods. However, accurately modeling melt crystallization is challenging due to significant non-idealities and complex phase equilibria in multicomponent systems. This study develops and evaluates two neural network-based surrogate models for acrylic acid melt crystallization: a stand-alone (black-box) model and a thermodynamically guided (hybrid) model. The hybrid model incorporates UNIQUAC-based solid–liquid equilibrium constraints into the learning process. This framework combines first-principles thermodynamic knowledge—particularly activity coefficient calculations and mass balance equations—with multi-output regression to predict key process variables. Both models are rigorously tested for interpolation and extrapolation, with the hybrid approach demonstrating superior accuracy even under operating conditions significantly outside the training domain. Further analysis reveals the critical importance of accurate solid–liquid equilibrium (SLE) data for thermodynamic parameterization. A final case study illustrates how the hybrid approach can quickly explore feasible operating regions while adhering to strict product purity targets. These findings confirm that integrating mechanistic constraints into neural networks significantly enhances predictive accuracy, especially when processes deviate from nominal conditions, providing a practical framework for designing and optimizing industrial-scale melt crystallization processes.

1. Introduction

Melt crystallization is an advanced separation and purification technique that achieves ultra-high product purities, reaching up to 99.99% concentrations while maintaining relatively low energy consumption and environmental benefits. This process relies on comparatively small latent heat, which significantly lowers energy requirements and reduces CO2 emissions compared to more conventional methods [1,2,3,4]. These advantages have attracted considerable interest from industries looking for sustainable and low-emission processes for purifying chemicals such as acrylic acid—a versatile monomer widely used in superabsorbent polymers and adhesive coatings [5]. Achieving ultra-high-purity of acrylic acid is essential for maintaining product quality and performance. However, conventional separation methods can lead to thermal degradation and high energy consumption [6,7]. In contrast, melt crystallization, which occurs at temperatures near acrylic acid’s melting point, can avoid these issues while consistently achieving stringent purity targets.
Melt crystallization has excellent potential for producing ultra-high-purity products, but accurately modeling the process remains challenging. First-principles models, which are based on thermodynamic and kinetic relationships, maintain physical consistency and accurately capture phase equilibria and mass balances [8,9,10]. However, these models often require extensive parameter fitting, rely on simplifying assumptions, and demand significant computational resources. These issues become particularly pronounced in multicomponent melt crystallization, where strong hydrogen bonding and notable non-idealities complicate the development and validation of purely mechanistic models [11]. This can result in substantial errors if the underlying assumptions are violated. On the other hand, purely data-driven techniques—such as random forests [12], gradient boosting [13], or stand-alone neural networks [14]—often provide computational efficiency and can learn complex input–output relationships directly from data. However, these black-box methods usually do not incorporate thermodynamic or mass balance constraints, making them susceptible to producing infeasible predictions or exhibiting poor extrapolation performance when operating conditions deviate from the training dataset [15,16,17].
Hybrid or gray-box modeling frameworks, which combine mechanistic knowledge with data-driven learning, have been successfully applied in various chemical processes to enhance model interpretability and extrapolation accuracy [18,19,20]. For instance, hybrid models have proven useful in distillation, biochemical reactors, and other systems where partial process understanding can be integrated into neural network-based surrogates. Drawing inspiration from these successes, we propose a thermodynamics-guided neural network to model melt crystallization of acrylic acid. By integrating UNIQUAC-based solid–liquid equilibrium (SLE) constraints into the neural network training, we aim to maintain physical consistency while improving the model’s ability to capture complex, non-ideal phenomena. Our primary objective is to demonstrate that a hybrid neural network model can accurately capture the mass balance for single-stage melt crystallization while ensuring feasibility under off-design conditions—an area where purely data-driven models often fall short. From an industrial perspective, ensuring physically plausible predictions is crucial for process optimization, design scale-up, and real-time control. Additionally, extrapolating beyond the nominal domain or training data points is essential in many large-scale operations, where feed composition or process parameters can shift unexpectedly.
Hence, in this study, we present and compare two types of neural network models for the melt crystallization process of acrylic acid from a ternary mixture of acrylic acid, water, and acetic acid. The first type is a stand-alone (black-box) neural network model, while the second type is a thermodynamically guided (hybrid) neural network model that incorporates first-principles thermodynamic constraints. In the hybrid framework, we integrate solid–liquid equilibrium (SLE) data [11] and fundamental thermodynamic principles into the structure and training of the neural network. First, we begin by outlining a systematic workflow for generating training data using Latin Hypercube Sampling (LHS), a widely used stratified sampling approach to ensure diverse coverage of the design space [21]. This process combines a UNIQUAC-based solid–liquid equilibrium model with an iterative flowsheet simulation. Next, we construct stand-alone and hybrid neural networks employing multi-output regression to predict key process variables, including crystallizer temperature, stream compositions, and flow rates. We evaluate the models in both interpolation (within the training domain) and extrapolation (beyond the training domain) scenarios. Finally, we highlight how this hybrid model can efficiently explore the parameter space for melt crystallization design under stringent product purity requirements.

2. Process Description

This section outlines the methodology used to model and analyze the melt crystallization of acrylic acid from a ternary mixture of acrylic acid, water, and acetic acid. It begins with a solid–liquid phase equilibrium perspective (Section 2.1) and then moves on to a crystallization flowsheet simulation (Section 2.2), which utilizes these phase relationships for mass balance calculations. The data generation procedure (Section 2.3) describes how a Latin Hypercube Sampling (LHS) approach [21] systematically explores the process parameters. Finally, the input–output representation (Section 2.4) combines the thermodynamic and flowsheet information into a unified modeling framework suitable for neural network training.
To conduct the mass balance simulations for the crystallization flowsheet, we developed custom scripts in Python (version 3.8) utilizing the NumPy (version 1.23) and SciPy (version 1.7) libraries for numerical methods and optimization. We incorporated the UNIQUAC models and their parameter estimation through in-house routines, which were validated against experimental solubility data from our previous work [11]. We employed TensorFlow (version 2.4) to train the neural networks, taking advantage of built-in optimizers such as Adam for multi-output regression. All simulations and training were performed on a desktop workstation with a 6-core CPU and 16 GB of RAM.

2.1. Solid–Liquid Phase Equilibrium

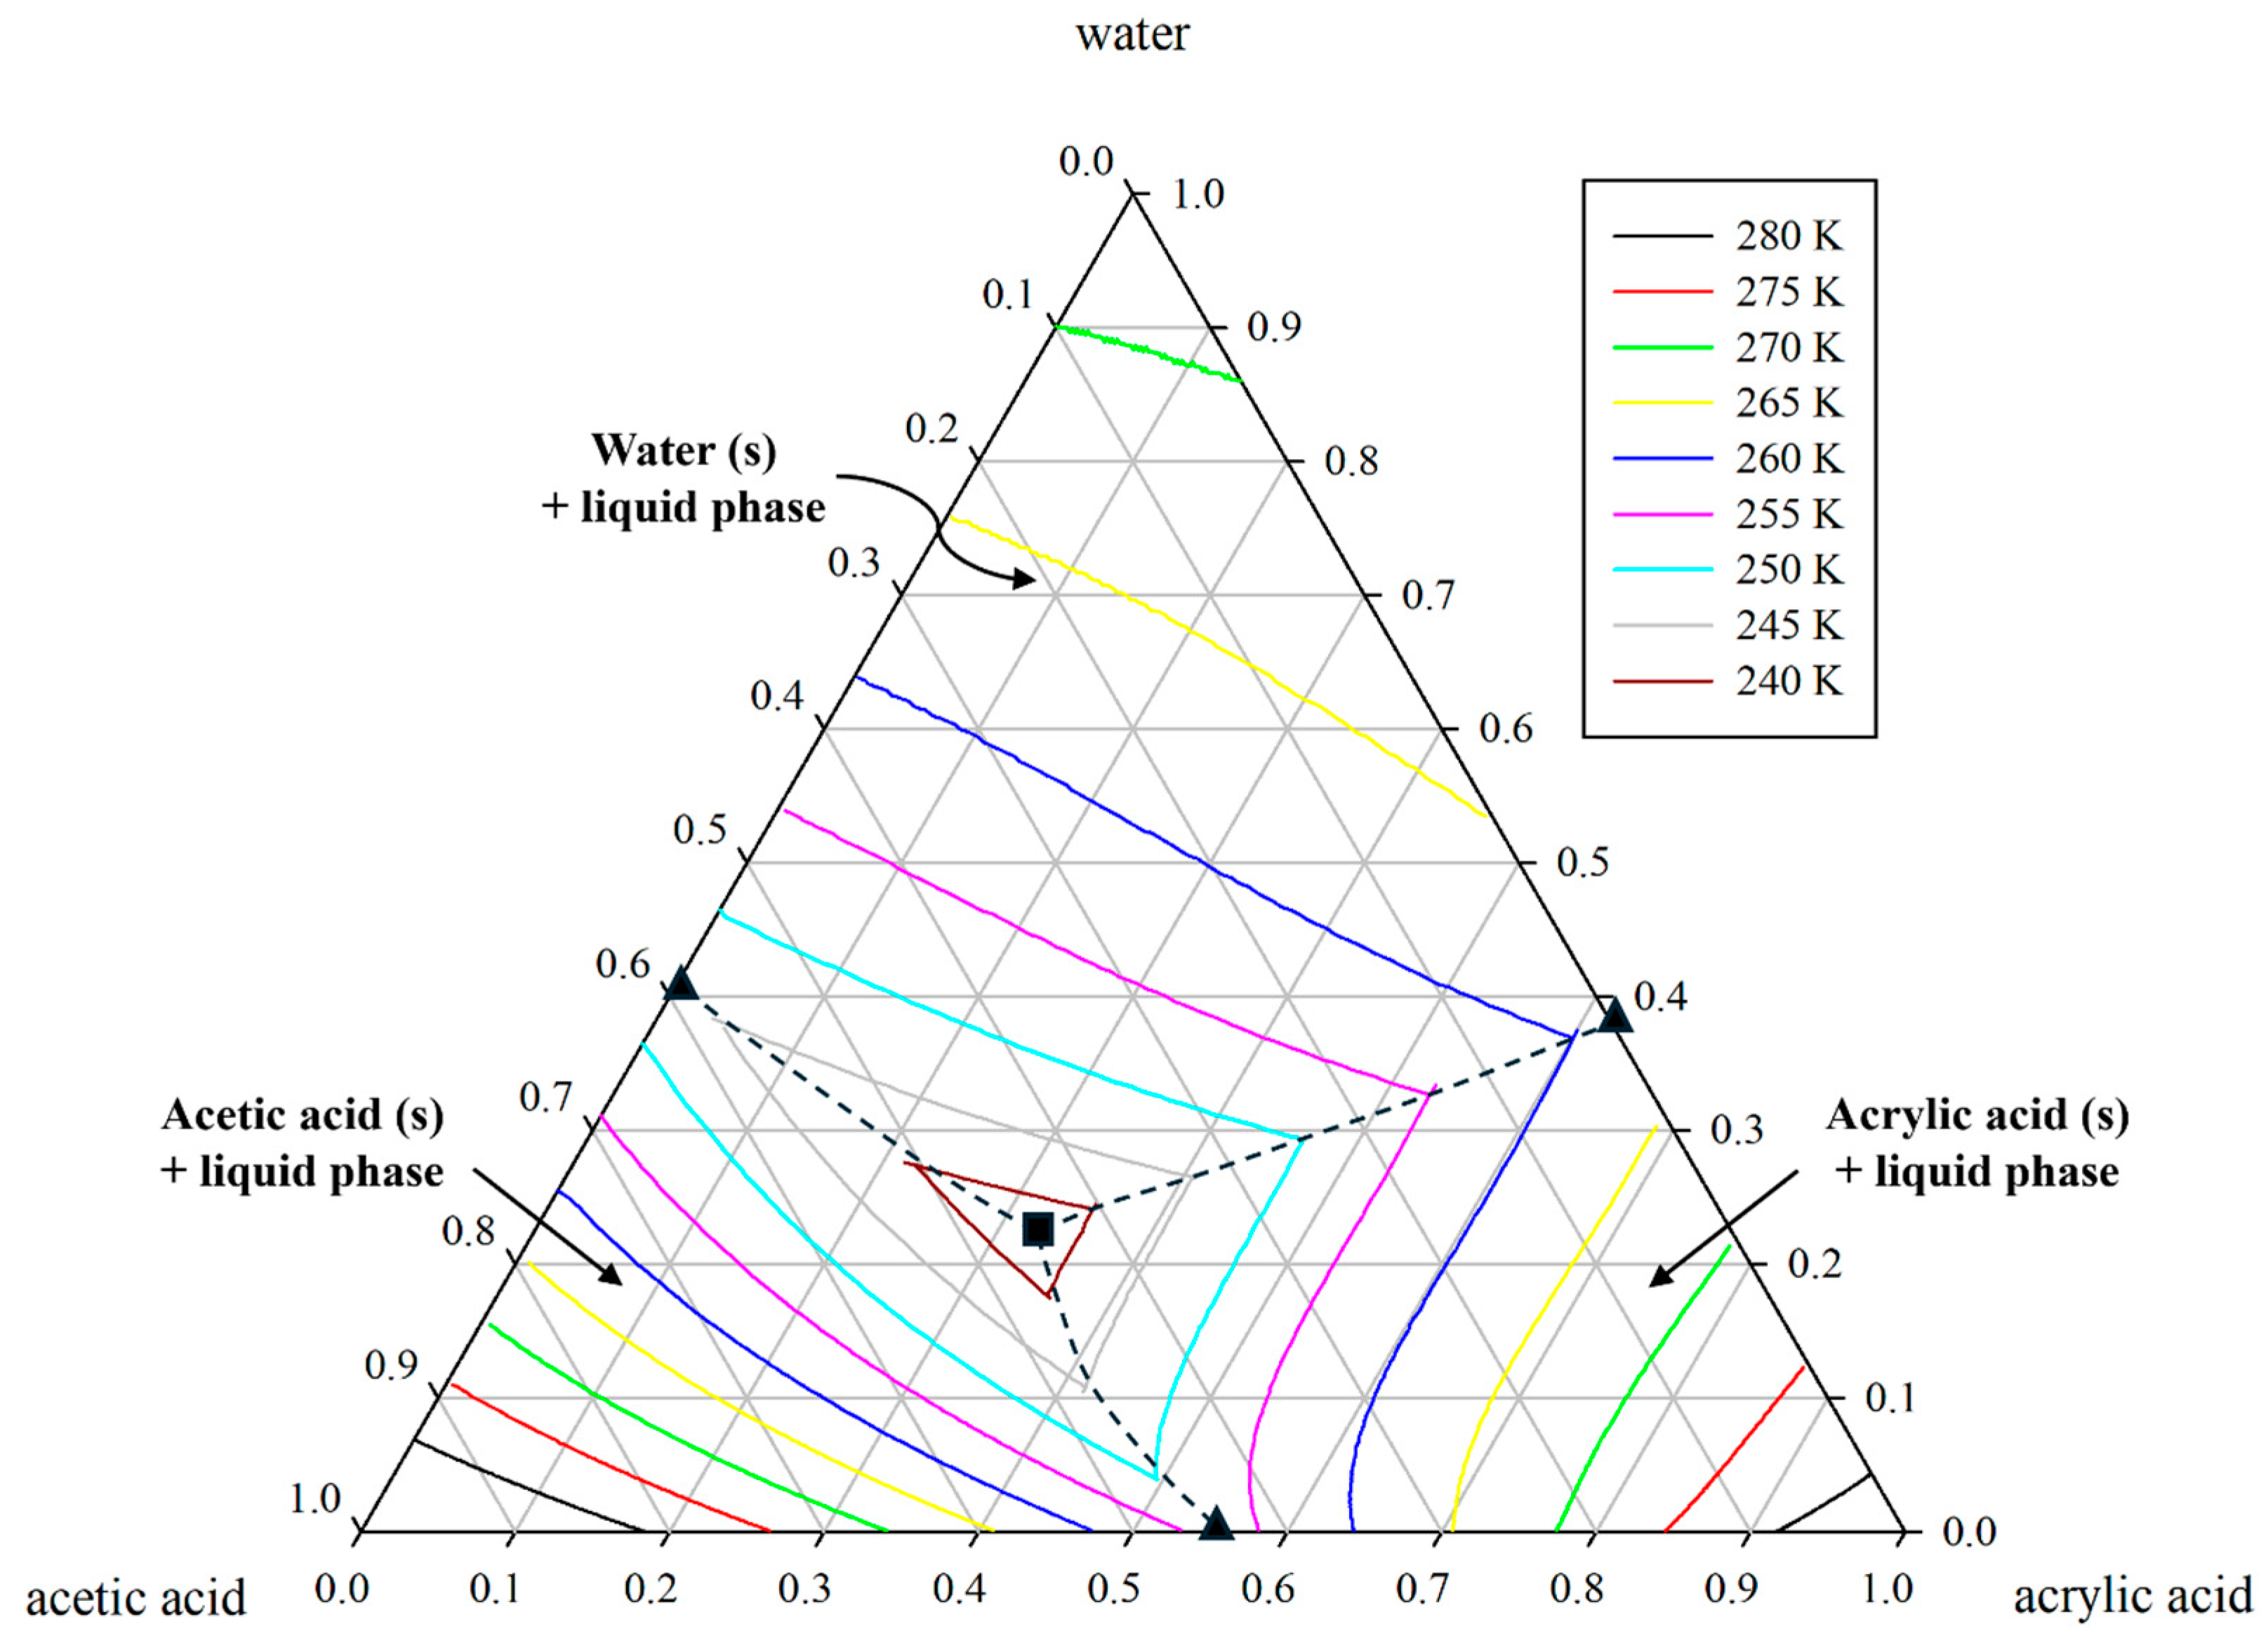
Figure 1 presents the ternary solid–liquid equilibrium (SLE) phase diagram for the acrylic acid, water, and acetic acid system. This phase diagram was calculated by fitting UNIQUAC parameters to combined binary and ternary experimental data. These parameters, thoroughly regressed in our previous study [11], capture intermolecular interactions, particularly the effects of hydrogen bonding.
Accurately identifying the binary and ternary eutectic points and thermodynamic boundaries is crucial for designing melt crystallization processes to achieve ultra-high-purity products. The polythermal projection in Figure 1 illustrates how variations in melt compositions and temperature affect the equilibrium between the solid and liquid phases. This information is crucial for identifying the feasible regions within the thermodynamic boundary where acrylic acid crystallizes exclusively and for accurately predicting the mass balance of the crystallization process.
The equilibrium concentration in the liquid melt at a given temperature for a multicomponent mixture can be calculated as shown in Equation (1):
l n   Υ i x i = Δ H f u s , i R T f u s , i 1 T f u s , i T ,
where Υ i is the activity coefficient, x i is the mole fraction, Δ H f u s , i the molar enthalpy of fusion, and T f u s , i the melting point temperature of component i . Since the acrylic acid, water, and acetic acid system is non-ideal, accurately estimating Υ i (via UNIQUAC [22]) is vital for capturing the complex molecular interactions and, consequently, the correct solid–liquid phase behavior.

2.2. Modeling of the Crystallization Process

2.2.1. Process Overview

A single-stage continuous crystallization process separates acrylic acid from a ternary feed consisting of acrylic acid, water, and acetic acid. Scheme S1 in supporting information illustrates the overall diagram of the process. The feed stream, with a known composition and flow, is mixed with a recycled mother liquor stream (ζ) to create the crystallizer feed. Inside the crystallizer, acrylic acid solidifies under solid–liquid equilibrium (SLE) conditions, producing a slurry. This slurry is then processed through a solid–liquid separation unit (such as a centrifuge or wash column) with a finite distribution coefficient ( k d i f f ) [9]. As a result, some impurities (water and acetic acid) may be entrained in the crystal product due to incomplete solid–liquid separation. The remaining mother liquor stream is divided into a recycle stream (ζ) and a purge stream to prevent excessive buildup of impurities.
Scheme S2 in supporting information provides a high-level flowchart that details these operations, along with the relevant Equation (1) and Equations (5)–(8) discussed in Section 2.2.2, Section 2.2.3, Section 2.2.4 and Section 2.2.5. The algorithm begins with an initial guess for the recycle stream (ζ) and crystallizer temperature. It then iteratively updates the solid–liquid equilibrium (using the UNIQUAC-based model), distribution coefficient ( k d i f f ), and the recycle–purge split (ζ) until the composition and flow of the recycle stream converges.
If a target crystal fraction ( χ t a r g e t ) is specified, an outer loop adjusts the temperature as outlined in Section 2.2.5 to ensure that the desired fraction of acrylic acid crystallizes at a steady state. This integrated approach guarantees that thermodynamic constraints and mass balance requirements are met.

2.2.2. Application of the Solid–Liquid Equilibrium

In this section, we focus on the crystallization of acrylic acid under thermodynamic constraints based on the UNIQUAC model. Let α represent the flow rate of acrylic acid that crystallizes from the feed. The total feed to the crystallizer consists of three components: (1) acrylic acid, (2) water, and (3) acetic acid.
We define T as the crystallization temperature and m ˙ i , f e e d as the flow rate of component i in the fresh feed. After partial crystallization, the remaining flow rate of acrylic acid in the mother liquor becomes ( m ˙ 1 , f e e d − α). In contrast, the flow rates of water and acetic acid in the mother liquor are m ˙ 2 , f e e d and m ˙ 3 , f e e d , respectively. We assume that no solid formation occurs for these impurities.
Thus, the total flow rate of the mother liquor after crystallization can be represented as:
m ˙ M L = m ˙ 1 , f e e d α + m ˙ 2 , f e e d + m ˙ 3 , f e e d ,
Let us define the total concentration in the mother liquor as n t o t = i = 1 3 n i . The liquid-phase fraction of the mother liquor is given by:
x 1 , M L = n 1 n t o t ,   x 2 , M L = n 2 n t o t ,   x 3 , M L = n 3 n t o t ,
To account for non-ideal interactions among the components, we compute the activity coefficients ( Υ i ) using the UNIQUAC model. By numerically solving the appropriate equation for α (the flow rate of crystallized acrylic acid), we can establish the solid–liquid equilibrium at a specified temperature T. This process is carried out using a simplex algorithm [23].

2.2.3. Distribution Coefficient and Imperfect Separation

Water and acetic acid become entrained in the crystal product due to incomplete solid–liquid separation. A single distribution coefficient ( k d i f f ) [9], defined as Equation (4), quantifies this effect.
k d i f f = i m p u r i t y   c o n c e n t r a t i o n   i n   s o l i d   p h a s e i m p u r i t y   c o n c e n t r a t i o n   i n   l i q u i d   p h a s e ,
The entrained ratio of impurities is assumed to be the same for both water and acetic acid. A lower value of this coefficient indicates a more efficient separation of these impurities from the acrylic acid crystals. For example, a value of 0.05 implies that approximately 5% of the impurity concentration in the mother liquor is carried into the crystalline product.
Following the determination of the flow rate (α) of acrylic acid that crystallizes (as discussed in Section 2.2.2), the impurity flow rate m ˙ i m p u r i t y , p r o d u c t is allocated to the product according to Equation (5), where w i denotes the mass fraction of component i.
w i m p u r i t y , p r o d u c t = k d i f f   w i m p u r i t y , m o t h e r   l i q ,
This relationship ensures that a fraction of the impurities from the mother liquor is entrained into the crystal product, thus maintaining mass balance consistency in the overall process.
Once the product stream is removed, the remaining mother liquor stream is divided into a recycle stream (returned to the crystallizer) and a purge stream to prevent excessive impurity buildup. Depending on the type of solid–liquid separation unit used (e.g., wash column, centrifuge, or simple filtration), typical values for the distribution coefficient ( k d i f f ) range approximately from 0.005 to 0.05 for wash columns, from 0.05 to 0.10 for centrifuges, and above 0.10 for simple filtration. These variations depend on the separation capabilities of the equipment [3]. Therefore, selecting an appropriate solid–liquid separation unit is crucial for achieving the desired purity of the crystals.
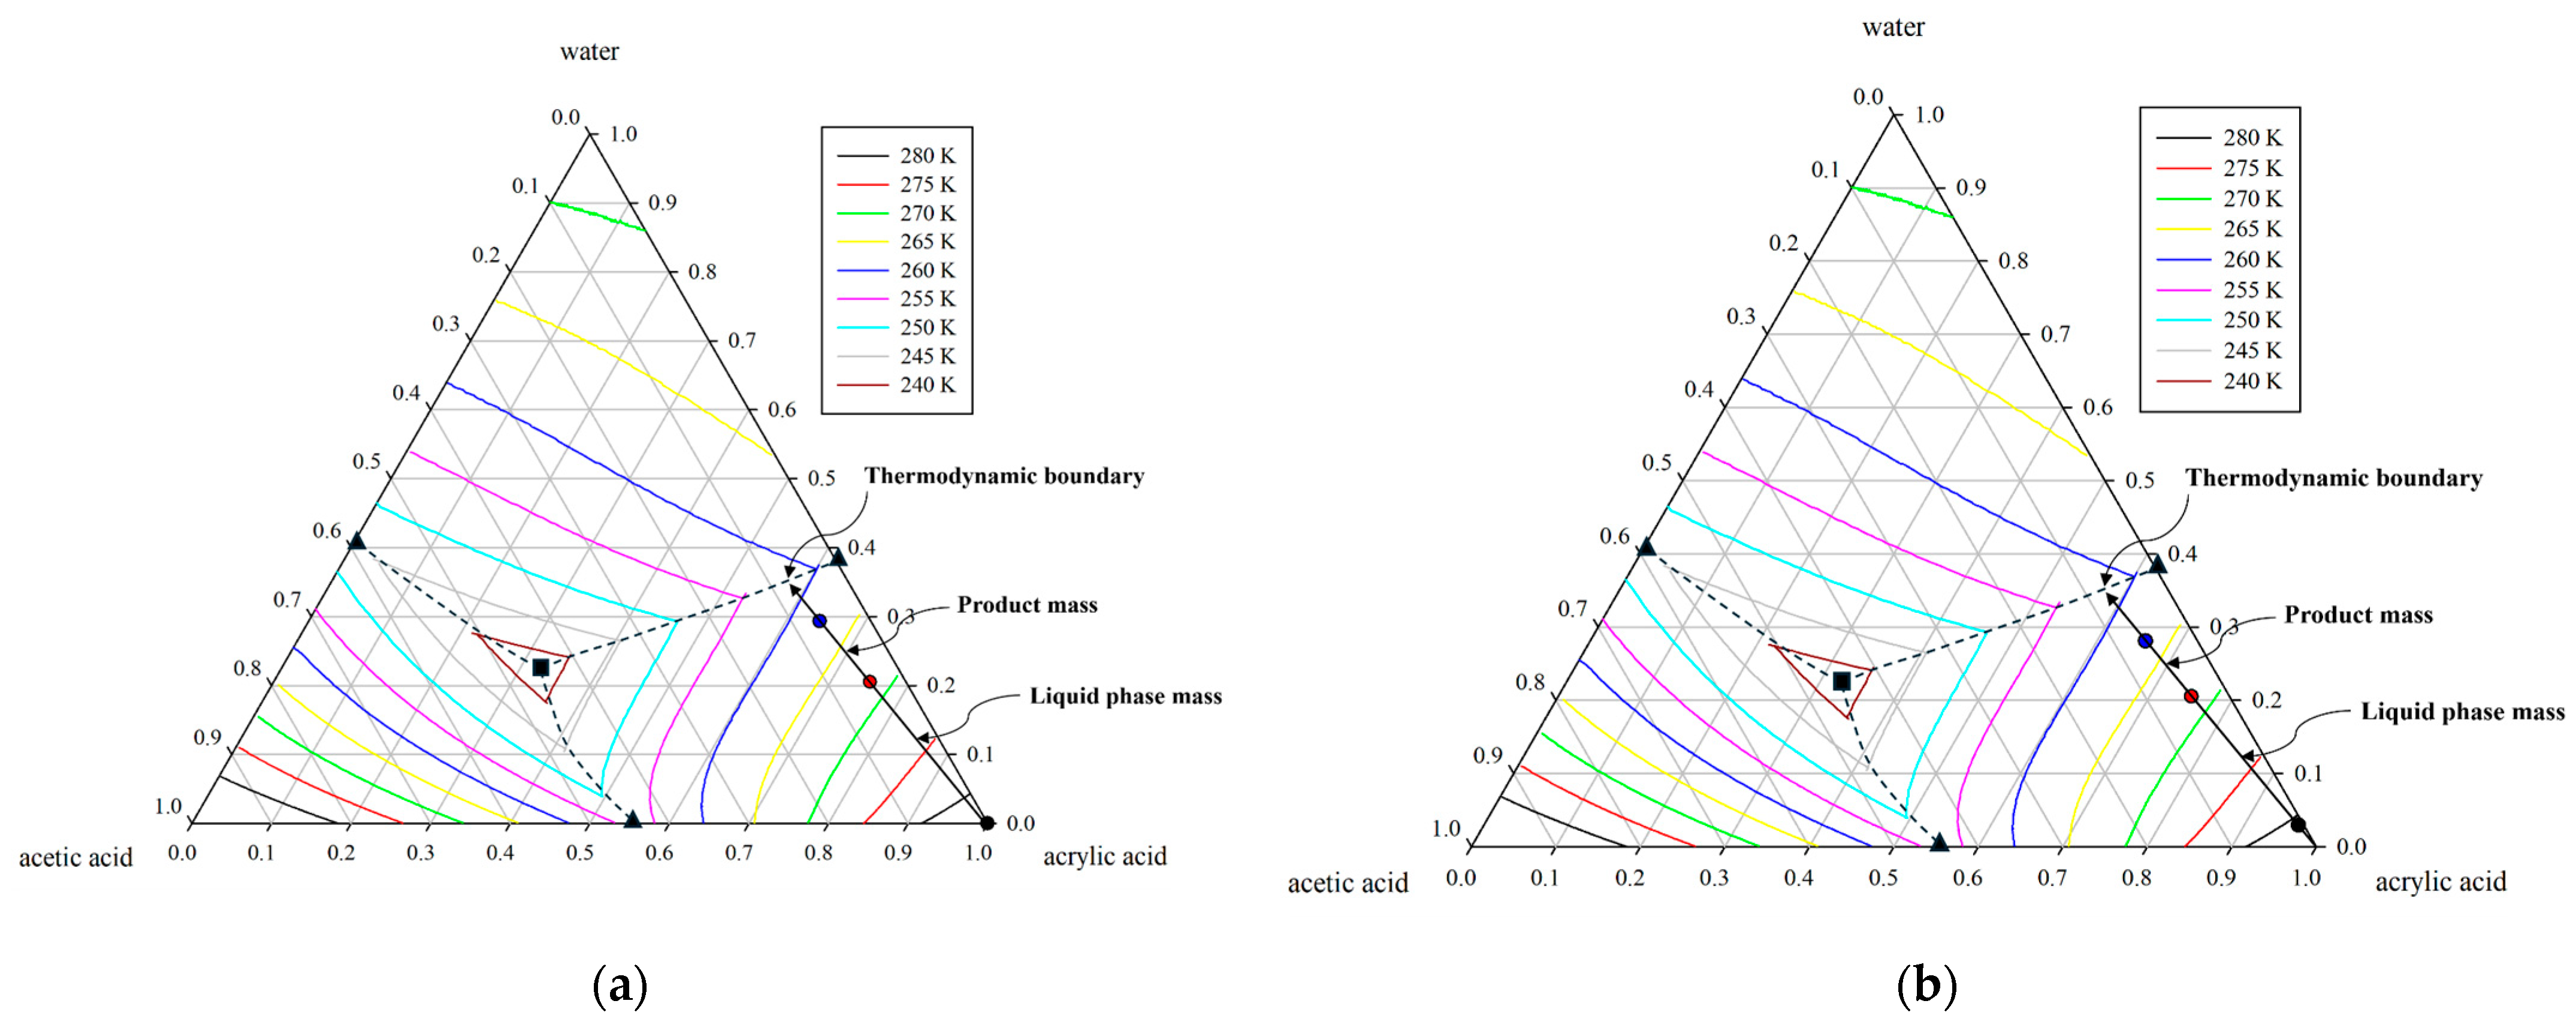
Figure 2a,b illustrate how changes in the distribution coefficient ( k d i f f ) affect the final product and mother liquor compositions under polythermal movements on the ternary solid–liquid equilibrium (SLE) diagram. In Figure 2a, a distribution coefficient ( k d i f f ) of 0 implies that there is no entrainment of impurities from the mother liquor into the product, resulting in a higher-purity acrylic acid stream. In contrast, Figure 2b shows a scenario where a higher distribution coefficient ( k d i f f ) allows a more significant fraction of water and acetic acid into the crystals. Consequently, the product purity decreases, and the composition of the mother liquor shifts accordingly. The markers (black, red, and blue) in Figure 2 represent the product, feed, and liquid-phase compositions across the temperature range, highlighting how thermodynamics (as discussed in Section 2.1) and distribution coefficient ( k d i f f ) jointly determine the outcome of the crystallization process.

2.2.4. Recycle, Purge, and Tear-Stream Convergence

After the solid–liquid separation, the mother liquor stream is partially recycled back to the crystallizer and partially purged to eliminate accumulated impurities. Let ζ represent the fraction of the recycled mother liquor flow. The flow rates for the recycle and purge streams can be expressed as follows:
m ˙ r e c y c l e = ζ m ˙ M L ,   m ˙ p u r g e = ( 1 ζ ) m ˙ M L ,
where m ˙ M L is the total mother liquor flow leaving the crystallizer. Since the composition of the recycled stream is unknown beforehand, a tear-stream approach is implemented. This begins with an initial guess for the mother liquor composition, followed by simulating the entire flowsheet (fresh feed crystallizer separation split). The resulting recycle outlet is then compared to the guessed recycle inlet. This process continues iteratively until the following convergence criterion is met:
m a x m ˙ r e c y l e ( k + 1 ) m ˙ r e c y l e ( k ) ,   w 1 , r e y c l e ( k + 1 ) w 1 , r e y c l e k , . . . ε ,
Here, k denotes the iteration index, and ε represents a small tolerance (e.g., 10 7 ). In practice, only a few iterations are typically needed for the mother liquor composition to stabilize at a steady-state solution.

2.2.5. Temperature Targeting for Specified Crystal Formation

In many practical situations, it is essential to achieve a specific crystal fraction χ t a r g e t (i.e., the ratio of the mass of the product crystals to the mass of the crystallizer feed) at a chosen operating temperature, T. An outer loop or bracketed root-finding routine [24] is used to adjust T until the desired condition is met.
f T = m ˙ p r o d u c t ( T ) m ˙ c r y s t a l l i z e r   f e e d χ t a r g e t = 0 ,
The function m ˙ p r o d u c t ( T ) is determined by executing the flowsheet (including the tear-stream approach discussed in Section 2.2.4) at each temperature T. A suitable bracket [ T m i n ,   T m a x ]—such as [220–290 K]—is established to ensure that the function values of f T m i n and f T m a x differ in sign, which allows a root-finding algorithm [24] to pinpoint the correct temperature.
This integrated thermodynamic and mass balance solution effectively underscores the relationship among feed composition, the distribution coefficient ( k d i f f ), the recycle ratio (ζ), and the specific crystal fraction ( χ t a r g e t ) in determining crystal product purity and overall yield. In industrial applications, handling slurries is crucial when choosing the crystallizer configuration and the target crystal fraction. Practical experience indicates that typical vessel-type crystallizers can manage slurries with a concentration (target crystal fraction) of approximately 30 wt% [1].

2.3. Data Generation

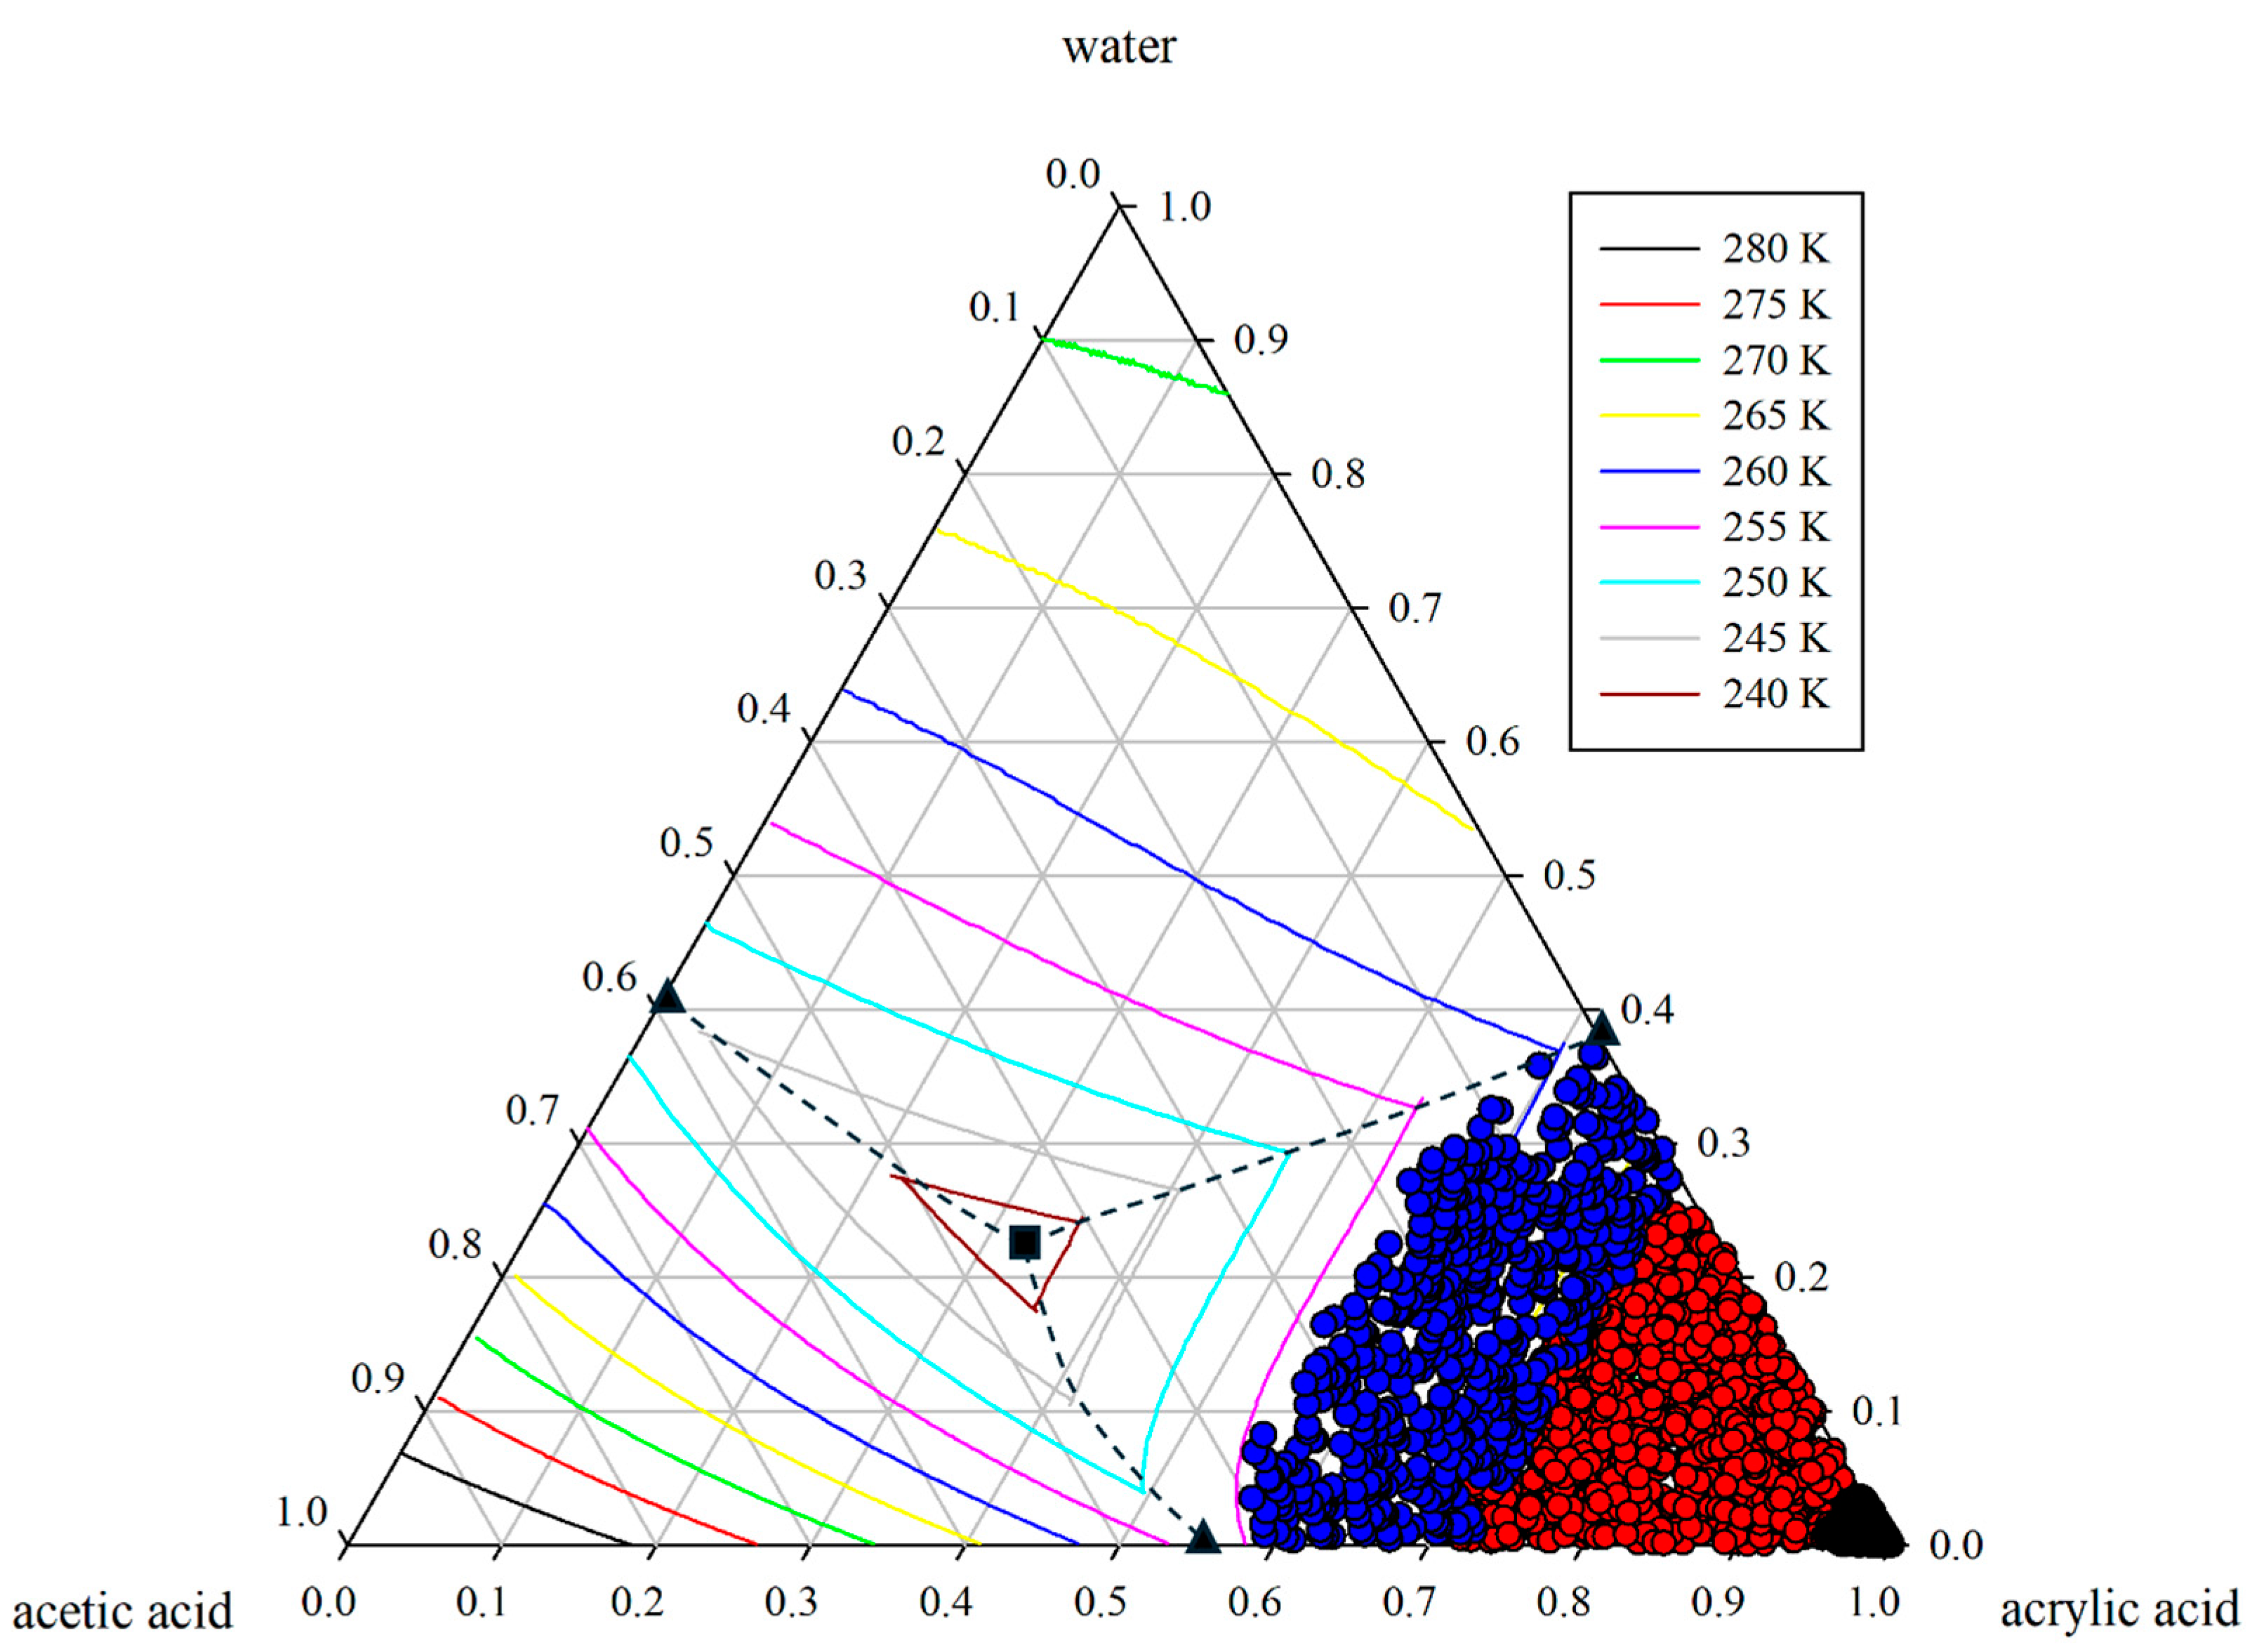
A Latin Hypercube Sampling (LHS) scheme [21] systematically explores the parameter space, which includes feed composition and flow, distribution coefficients ( k d i f f ), recycle ratios (ζ), and target crystal fractions ( χ t a r g e t ). Unlike simple random sampling, LHS strategically divides each input variable’s range into equal probability intervals and then selects one sample from each interval. This method ensures a more uniform and diverse representation of the design space, even when multiple parameters vary simultaneously. As a result, LHS generates a comprehensive set of input conditions for the crystallization flowsheet, capturing both typical and extreme operating scenarios. As illustrated in Figure 3, each sampled point is placed on the ternary solid–liquid equilibrium (SLE) phase diagram, ensuring comprehensive coverage of both typical and extreme crystallization scenarios.
For each sample, the simulation first calculates the crystallizer temperature required to achieve the specified crystal fraction. Then, it performs steady-state mass balances to determine stream flows and compositions ( χ t a r g e t ). Any infeasible points, such as negative component fractions or compositions outside the thermodynamic boundary, are discarded to ensure only valid operating conditions are retained. This LHS-based methodology generates a robust dataset of input–output observations, which serves as the foundation for subsequent hybrid neural network modeling, enhancing model generalizability across various process conditions.

2.4. Input–Output Representation of the Crystallization Process

The input–output relationships for the crystallization process are illustrated in Scheme S3 within the supporting information. Key process parameters—feed composition, feed flow, distribution coefficient ( k d i f f ), and recycle ratio (ζ)—serve as inputs for the flowsheet simulation. We specifically highlight feed composition and flow among these inputs because, in many industrial applications, multiple crystallization stages are often employed in series (for example, a second or even a third single-crystallizer unit). Varying the feed conditions at each stage is crucial for achieving the desired separation outcomes across the different units.
The thermodynamics-guided process (as discussed in Section 2.1, Section 2.2 and Section 2.3) calculates essential output variables, such as crystallizer temperature and the composition and flow of the crystallizer feed stream, product stream, mother liquor stream, recycle stream, and purge stream. Accurately predicting the mother liquor composition and flow is particularly important because, in large-scale processes, they are frequently recycled back to the crystallizer and other upstream operations, such as absorbers, distillation columns, or reactors [25]. Accurately capturing this information is vital for maintaining overall mass balance and preventing the accumulation of impurities throughout the plant.
Together, these paired inputs and outputs create a comprehensive dataset for training a hybrid neural network, ensuring that the learned model accurately reflects the ternary system’s fundamental thermodynamics and the flowsheet’s practical mass balance constraints.

3. Neural Network Models

3.1. Stand-Alone Neural Network Model

A purely data-driven neural network model can be a surrogate for an entire crystallization flowsheet, eliminating the need to incorporate explicit thermodynamic or mass balance equations. This model is trained using simulated datasets that cover various operating conditions, allowing it to learn complex input–output mapping. Typical input variables include the compositions and flow of acrylic acid, water, and acetic acid in the feed, distribution coefficient ( k d i f f ), and recycle ratio (ζ). The primary outputs include the crystallizer temperature and the composition and flow of the crystallizer feed stream, product stream, mother liquor stream, recycle stream, and purge stream.
Once the data are organized, feature scaling is applied to inputs and outputs. This step aligns all variables within comparable numerical ranges, enhancing the stability of the neural network [26]. A test subset—usually around 20% of the data—is reserved for evaluating the model’s generalization capabilities. The stand-alone model typically employs a multi-layer perceptron (MLP) architecture [27,28] with multiple hidden layers and ReLU activation functions. It is trained to minimize the mean squared error across all outputs [29]. In a multi-output regression setting, the network’s weights are adjusted to reduce the overall difference between predicted and observed values, effectively capturing the behavior of the flowsheet from the input conditions to the final output without relying on thermodynamic or mass balance equations. Further details on the modeling context, including hyperparameter selection and data preprocessing steps, are provided in the Supplementary Information.
Scheme S4 in supporting information illustrates this process, starting from the assembly of input–output datasets, followed by normalization, splitting the data into training and test sets, training a multi-output MLP, and finally, generating flow and composition predictions based purely on learned patterns. Once trained, the stand-alone neural network can quickly approximate the flowsheet outputs, although it operates without an embedded understanding of non-ideal solution thermodynamics or fundamental mass balances.

3.2. Hybrid (Gray-Box) Neural Network Model

A hybrid or gray-box neural network model combines first-principles process knowledge and data-driven learning, providing a more robust alternative to a purely data-driven approach for crystallization systems [18,19]. Mechanistic subroutines offer baseline estimates, such as UNIQUAC-based phase equilibrium calculations or simplified mass balance equations. The neural network then refines or corrects the complex aspects not adequately described by theory alone. This approach particularly applies to melt crystallization, where equilibrium relationships are well defined for key variables.
A typical hybrid framework starts with a baseline prediction for selected outputs, such as compositions at a nominal temperature or under the assumption of ideal separation. The neural network learns a residual adjustment—often in a transformed domain like logit space—to ensure that predicted compositions remain physically realistic (e.g., mass fractions within the range [0, 1]) and that fundamental constraints, such as total mass conservation, are not violated [30,31]. Flow rates for products, recycling, and purging can also be partly derived from thermodynamic principles and partly corrected by the neural network. Since partial domain knowledge is incorporated, hybrid models generally require fewer training data and tend to extrapolate more reliably than purely black-box models. Further details on the hybrid modeling framework, including specific residual architectures and training protocols, are available in the Supplementary Information.
Scheme S5 in the supporting information summarizes the significant steps in this hybrid approach, which involves incorporating UNIQUAC-based equilibrium estimates, applying consistent scaling and data partitioning, predicting crystallizer temperature and flow variables within thermodynamic boundaries, and refining composition predictions through a residual network. The training pipeline is typically more complex than a stand-alone network, often requiring additional sub-networks for each type of correction (e.g., different streams). However, it usually results in greater consistency with thermodynamic constraints and improved performance across various operating conditions.

3.3. Neural Network Model Evaluation

After training, the stand-alone and hybrid neural networks are evaluated on a held-out test set using two metrics: the coefficient of determination ( R 2 ) and the root mean squared error (RMSE). For a given output dimension k , we define:
R k 2 = i ( y k , t r u e i y k , p r e d ( i ) ) 2 i ( y k , t r u e i y ¯ k , t r u e ) 2 ,
R M S E = 1 N t e s t i ( y k , t r u e ( i ) y k , p r e d ( i )   ) 2 ,
Here, N t e s t is the total number of test samples, and y k , t r u e ( i ) and y k , p r e d ( i ) are the ground-truth and predicted values, respectively, for the k -th output of the i-th test sample. The quantity y ¯ k , t r u e is the mean of all ground-truth values for the k -th output in the test set. An R k 2 value closer to 1 indicates that the model predictions explain more of the variance in the observed data, whereas lower or negative values suggest weaker predictive performance. The RMSE measures the average magnitude of prediction errors, so lower RMSE values signify tighter agreement between predicted and true outputs.

4. Results and Discussion

This section evaluates the performance of stand-alone and hybrid neural network models in interpolation tasks (Section 4.1) and extrapolation tasks (Section 4.2). It also analyzes the influence of thermodynamic parameter selection (Section 4.3) and presents a case study on single-stage melt crystallization design (Section 4.4).
The baseline parameter ranges used for training are summarized in Table 1, which outlines the Latin Hypercube Sampling (LHS) domain for several factors: feed composition, feed flow, distribution coefficient ( k d i f f ), and recycle ratio (ζ). Each model was trained using this domain, with further evaluations conducted outside these ranges to assess its extrapolation capability.

4.1. Interpolation Performance

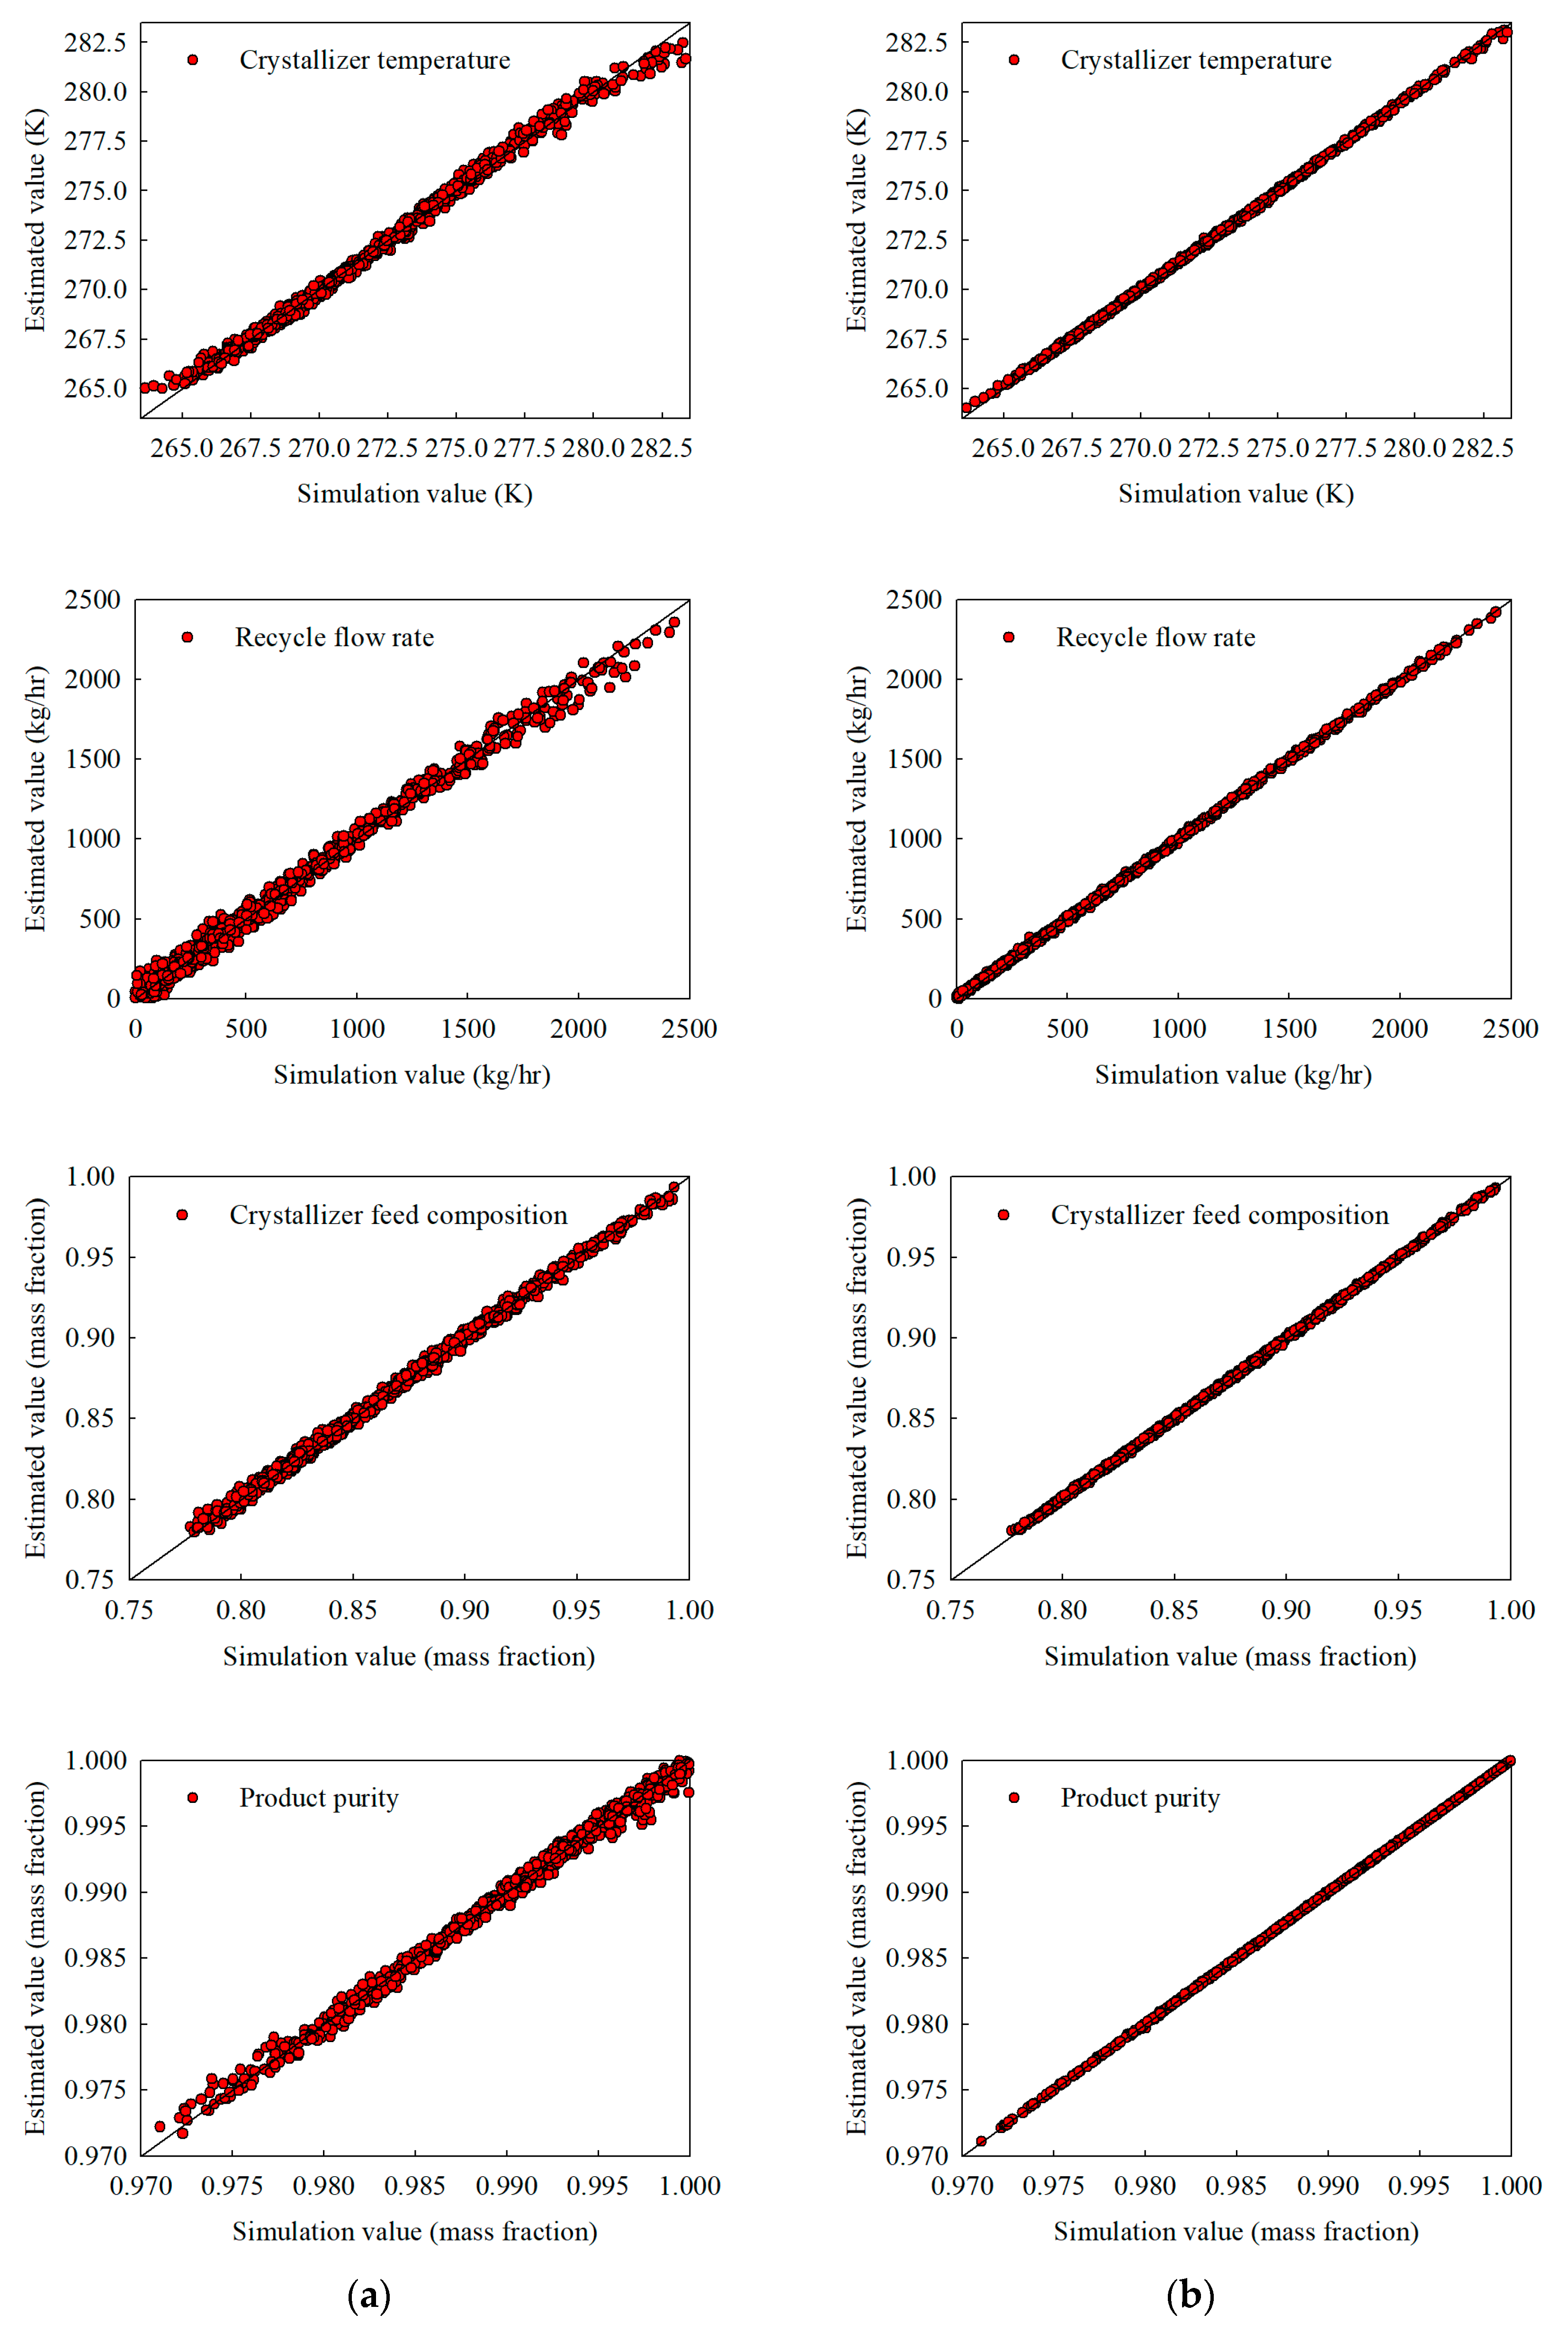
Both the stand-alone and hybrid neural network models were trained on datasets detailed in Table 1 to evaluate interpolation accuracy. Two sample sizes were considered: (i) 500 data points, which provide relatively sparse coverage, and (ii) 3000 data points, which offer denser coverage of the operating space. Table 2 compares the interpolation accuracies for the output variables (e.g., crystallizer temperature and the composition and flow of the crystallizer feed stream, product stream, mother liquor stream, recycle stream, and purge stream).
With 500 training samples, both models achieve high R 2 values (≥0.98). However, the hybrid model consistently exhibits lower RMSE values—especially for large flows such as recycle and mother liquor flow. For instance, the hybrid network reduces the recycle flow RMSE from 77.03 kg/h to 45.68 kg/h and the product flow RMSE from 83.22 kg/h to 42.28 kg/h compared to the stand-alone network.
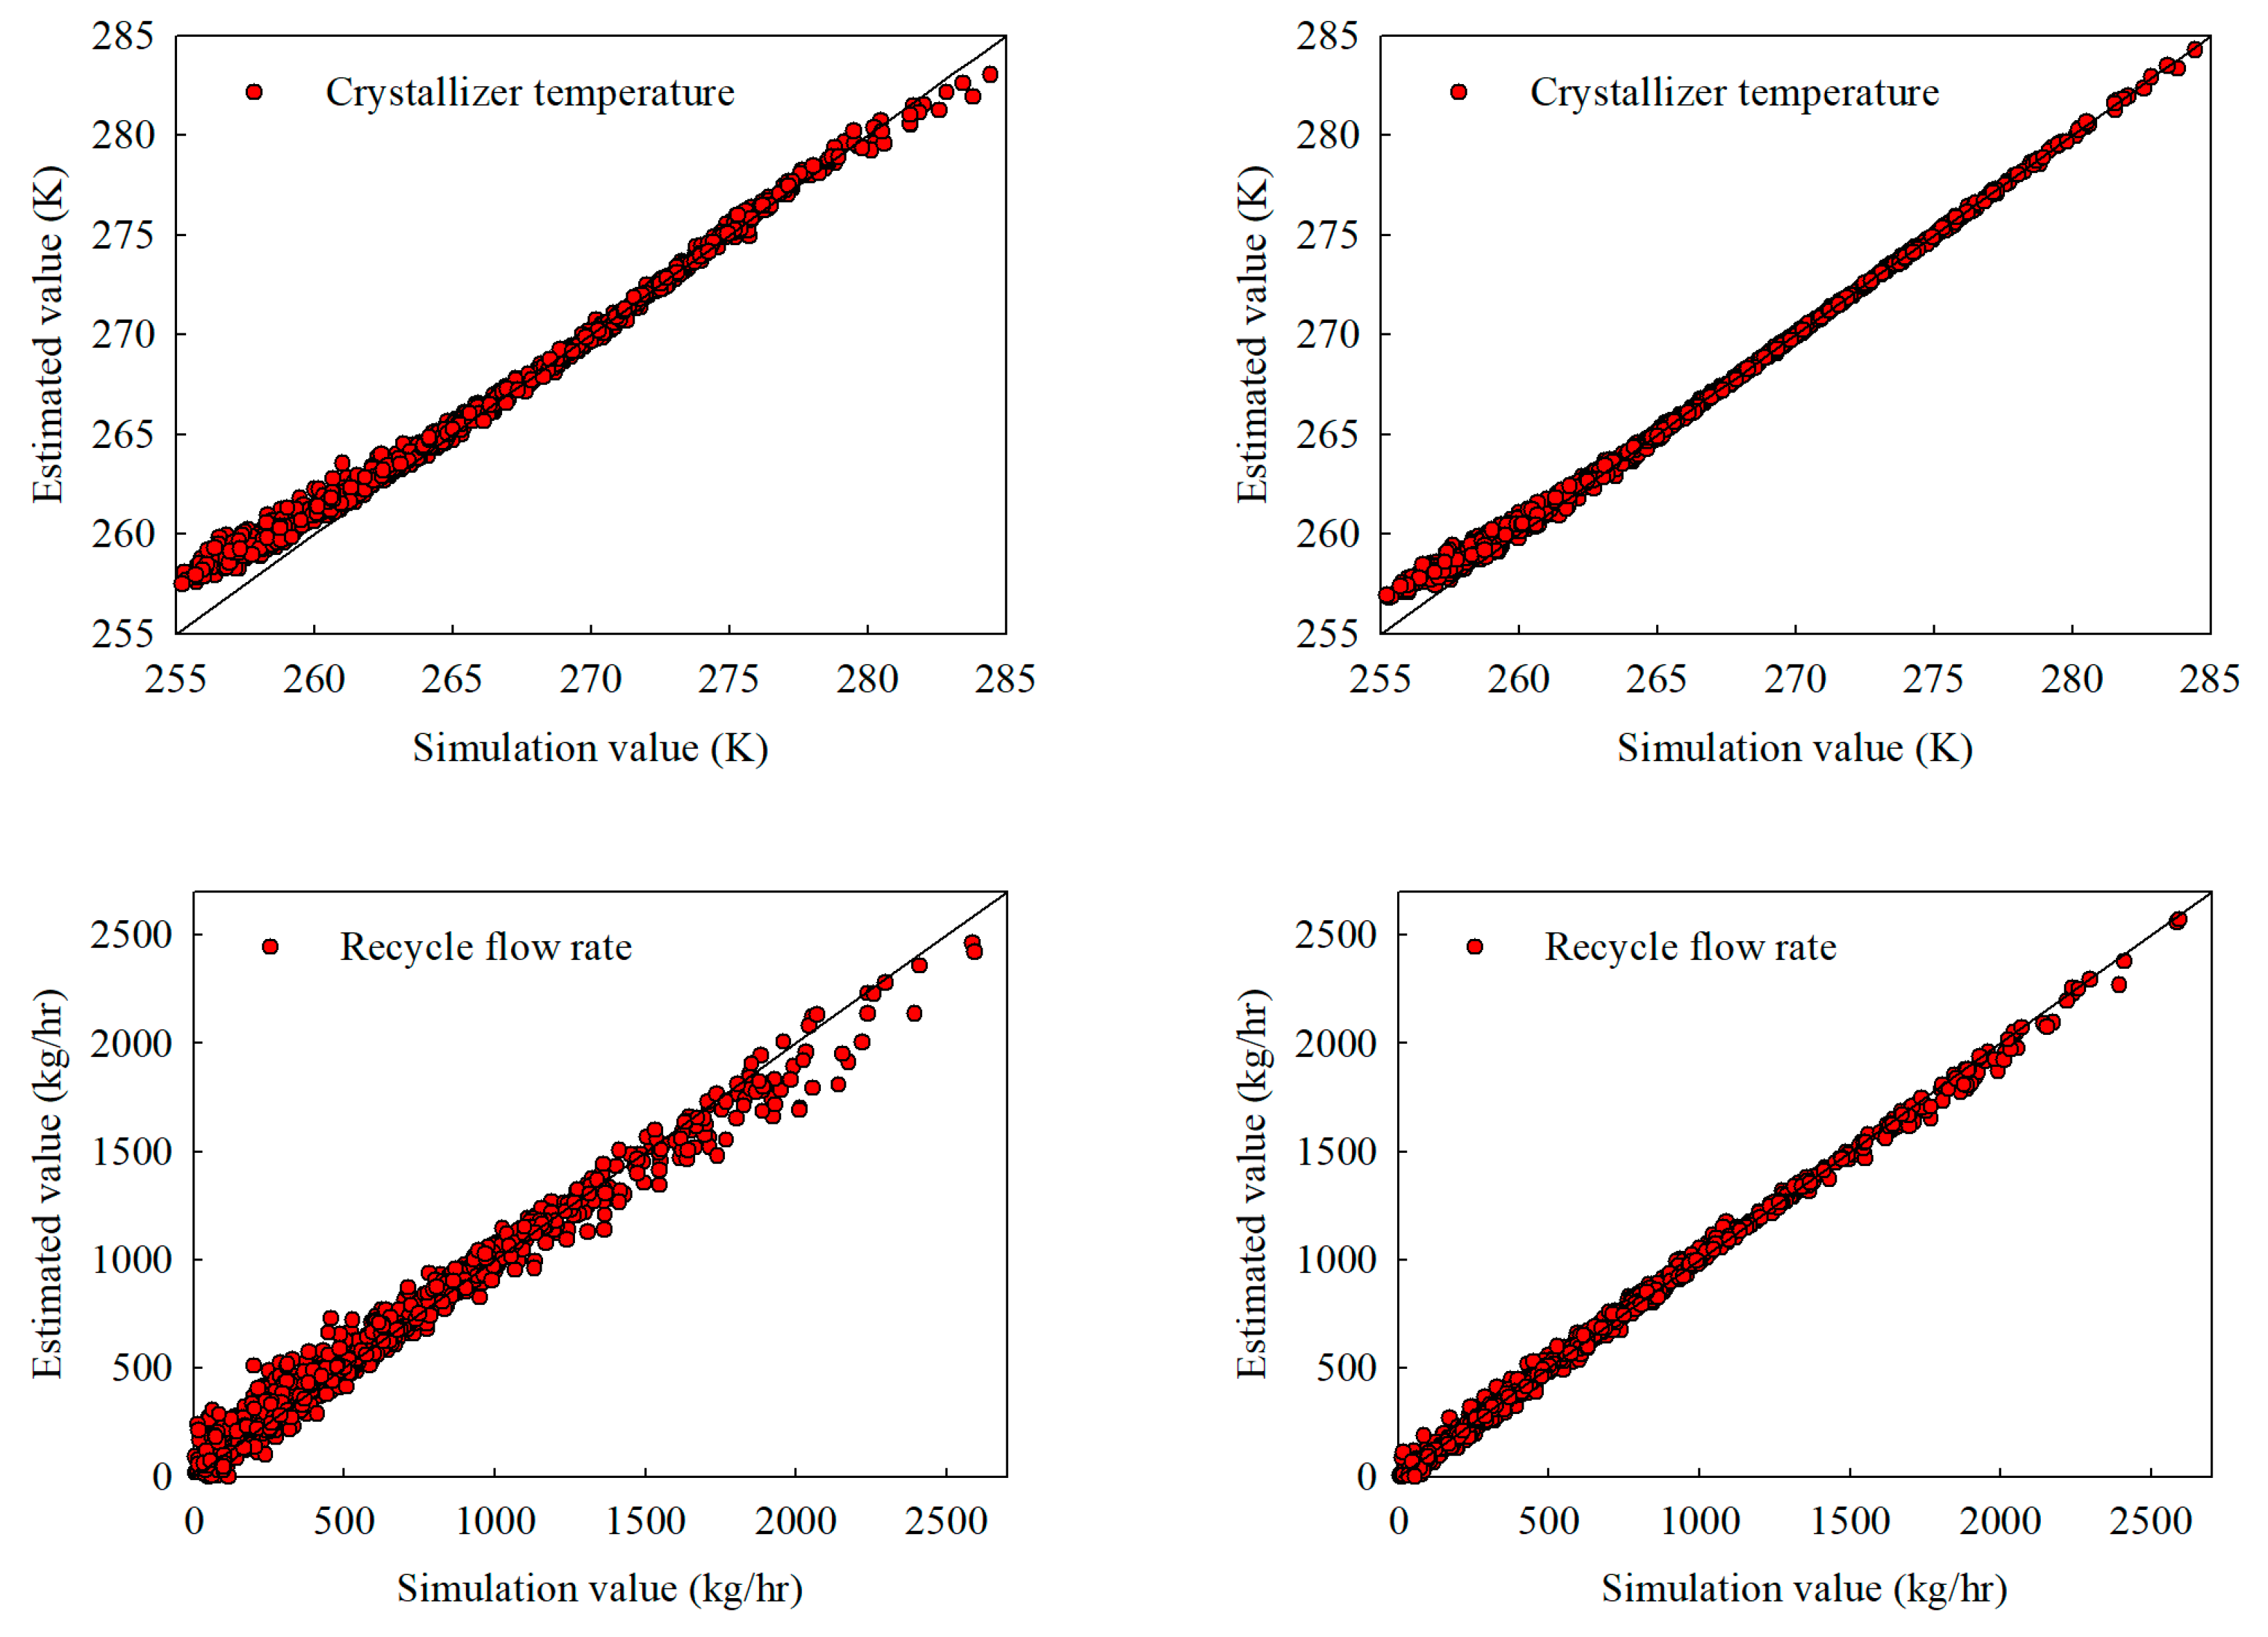
When the training set is increased to 3000 samples, both models benefit from the larger dataset, achieving higher R 2 values and lower RMSE. Notably, the hybrid network reaches near-perfect accuracy ( R 2 ≈ 1.000) for many outputs, showcasing its ability to leverage data-driven fitting and first-principles constraints. Although the stand-alone model also improves (e.g., the crystallizer temperature RMSE decreases from 0.426 K to 0.314 K), it still falls short of the hybrid model’s near-unity R 2 .
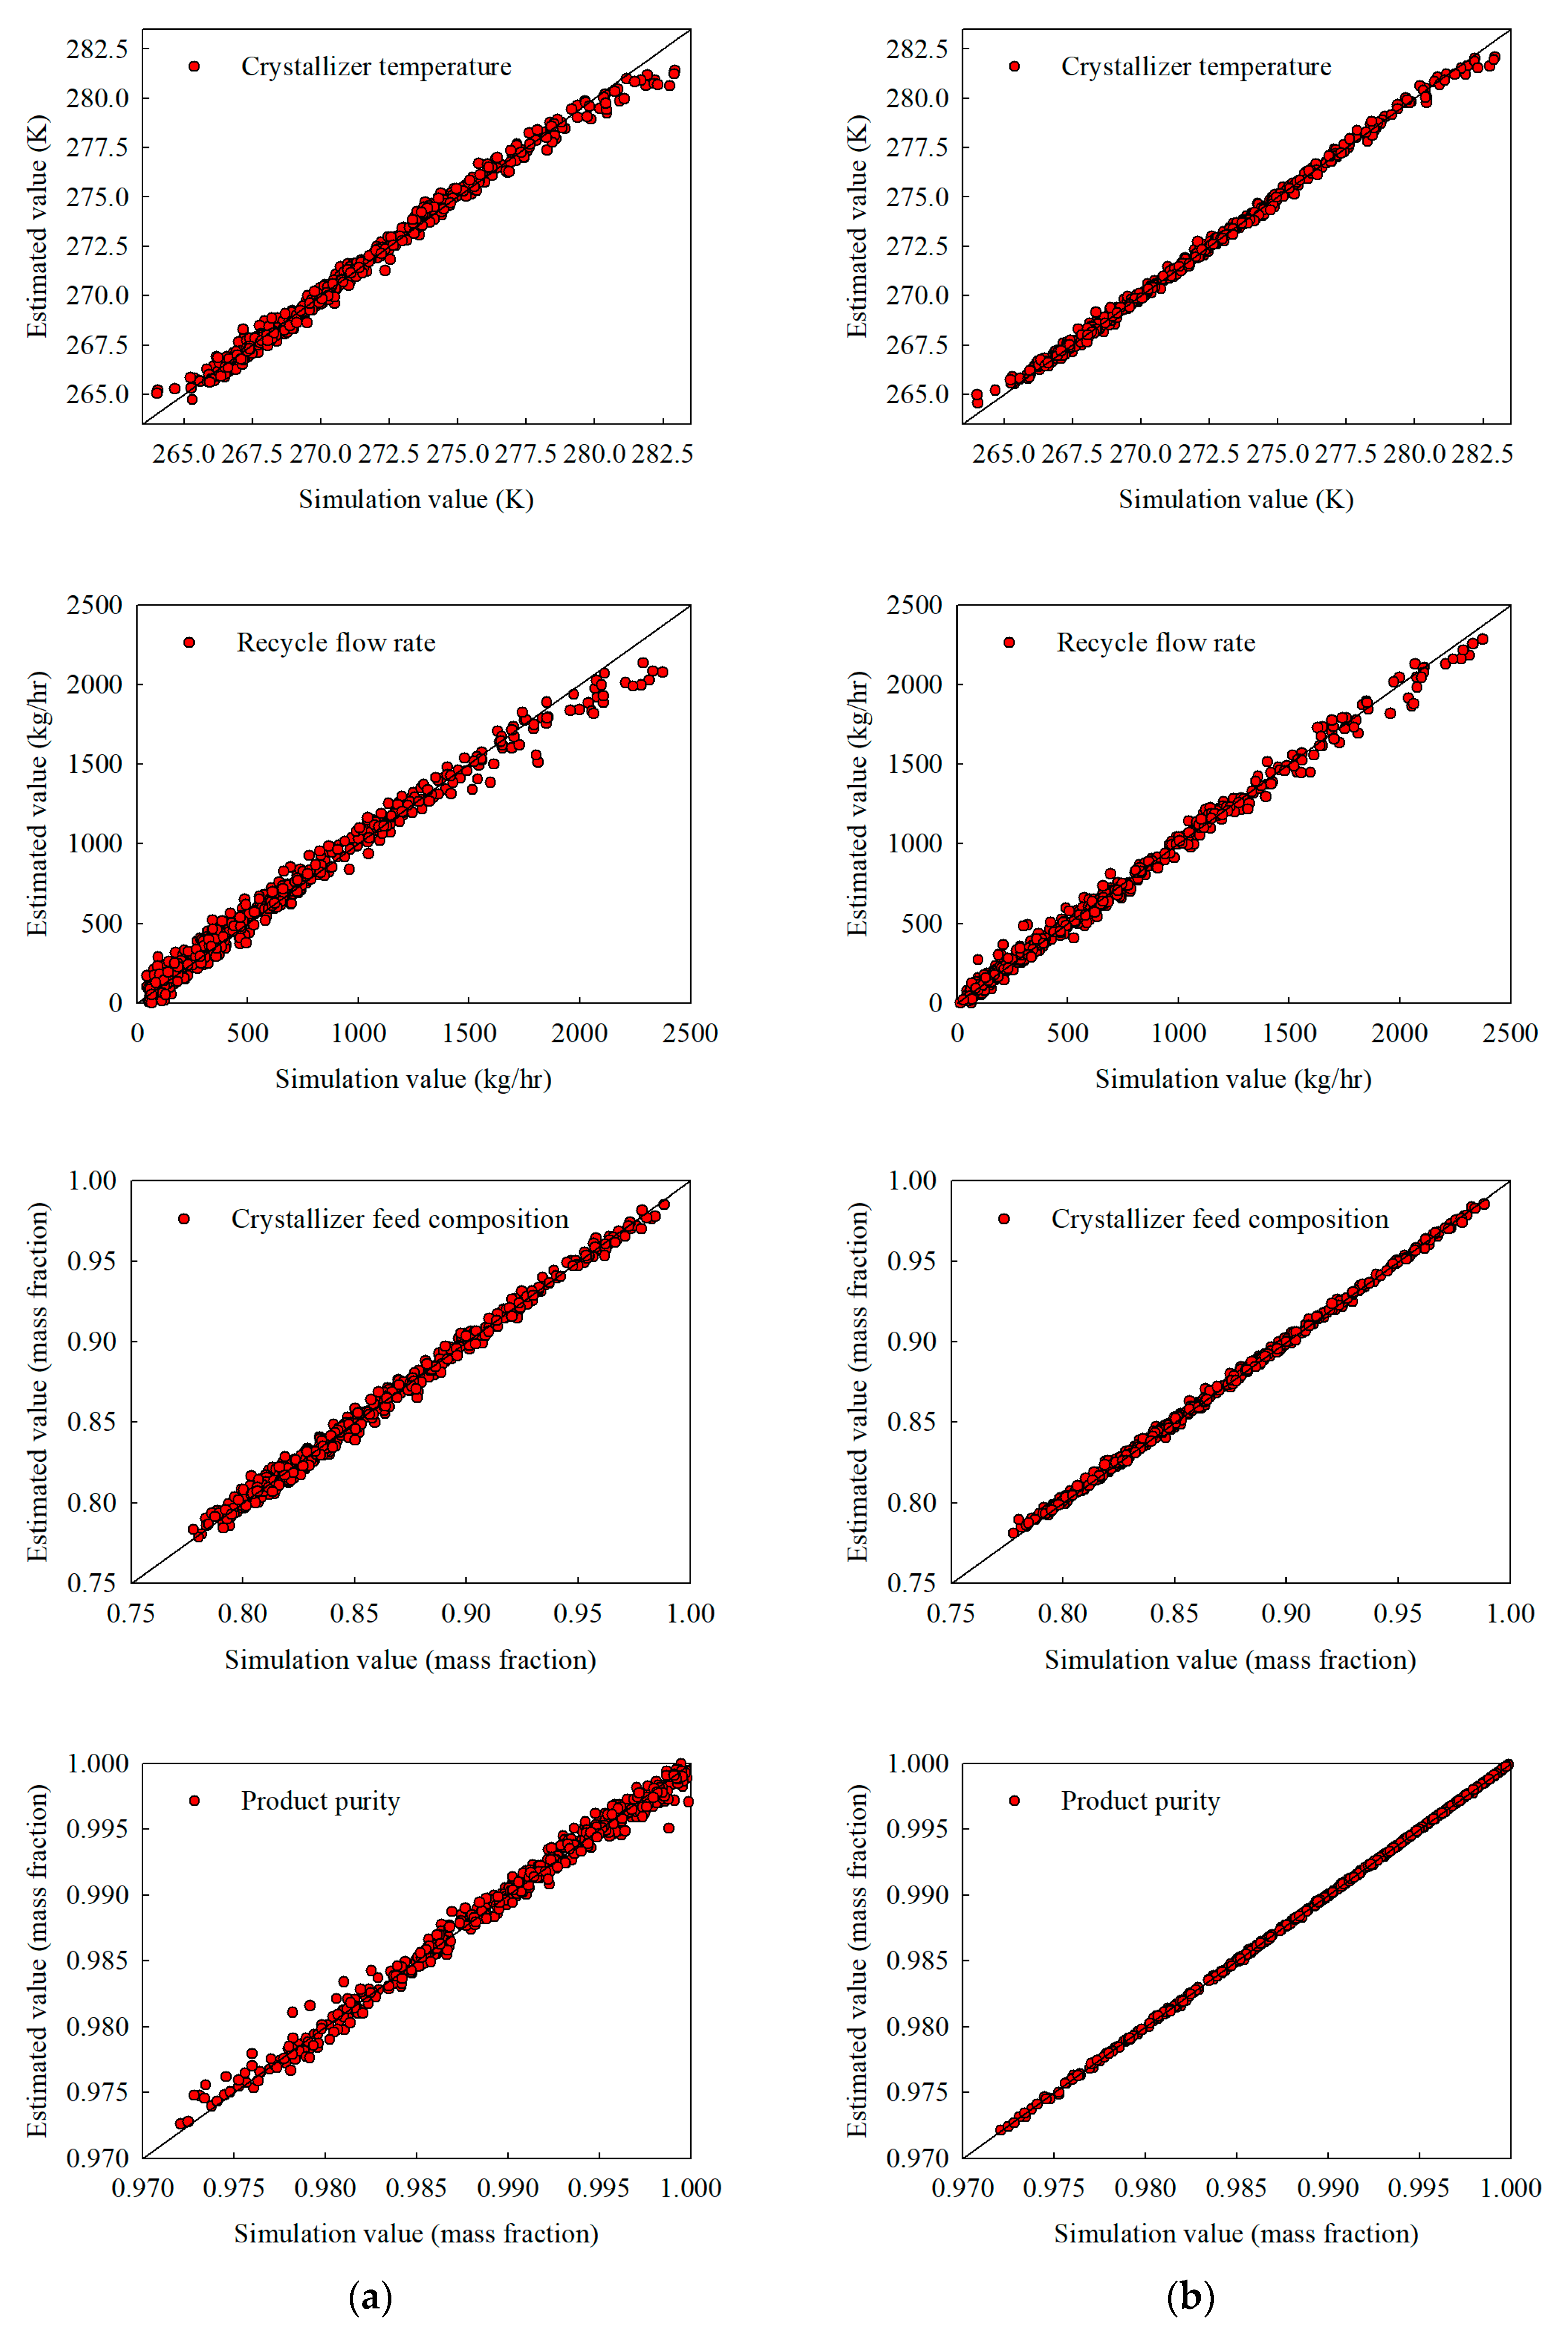
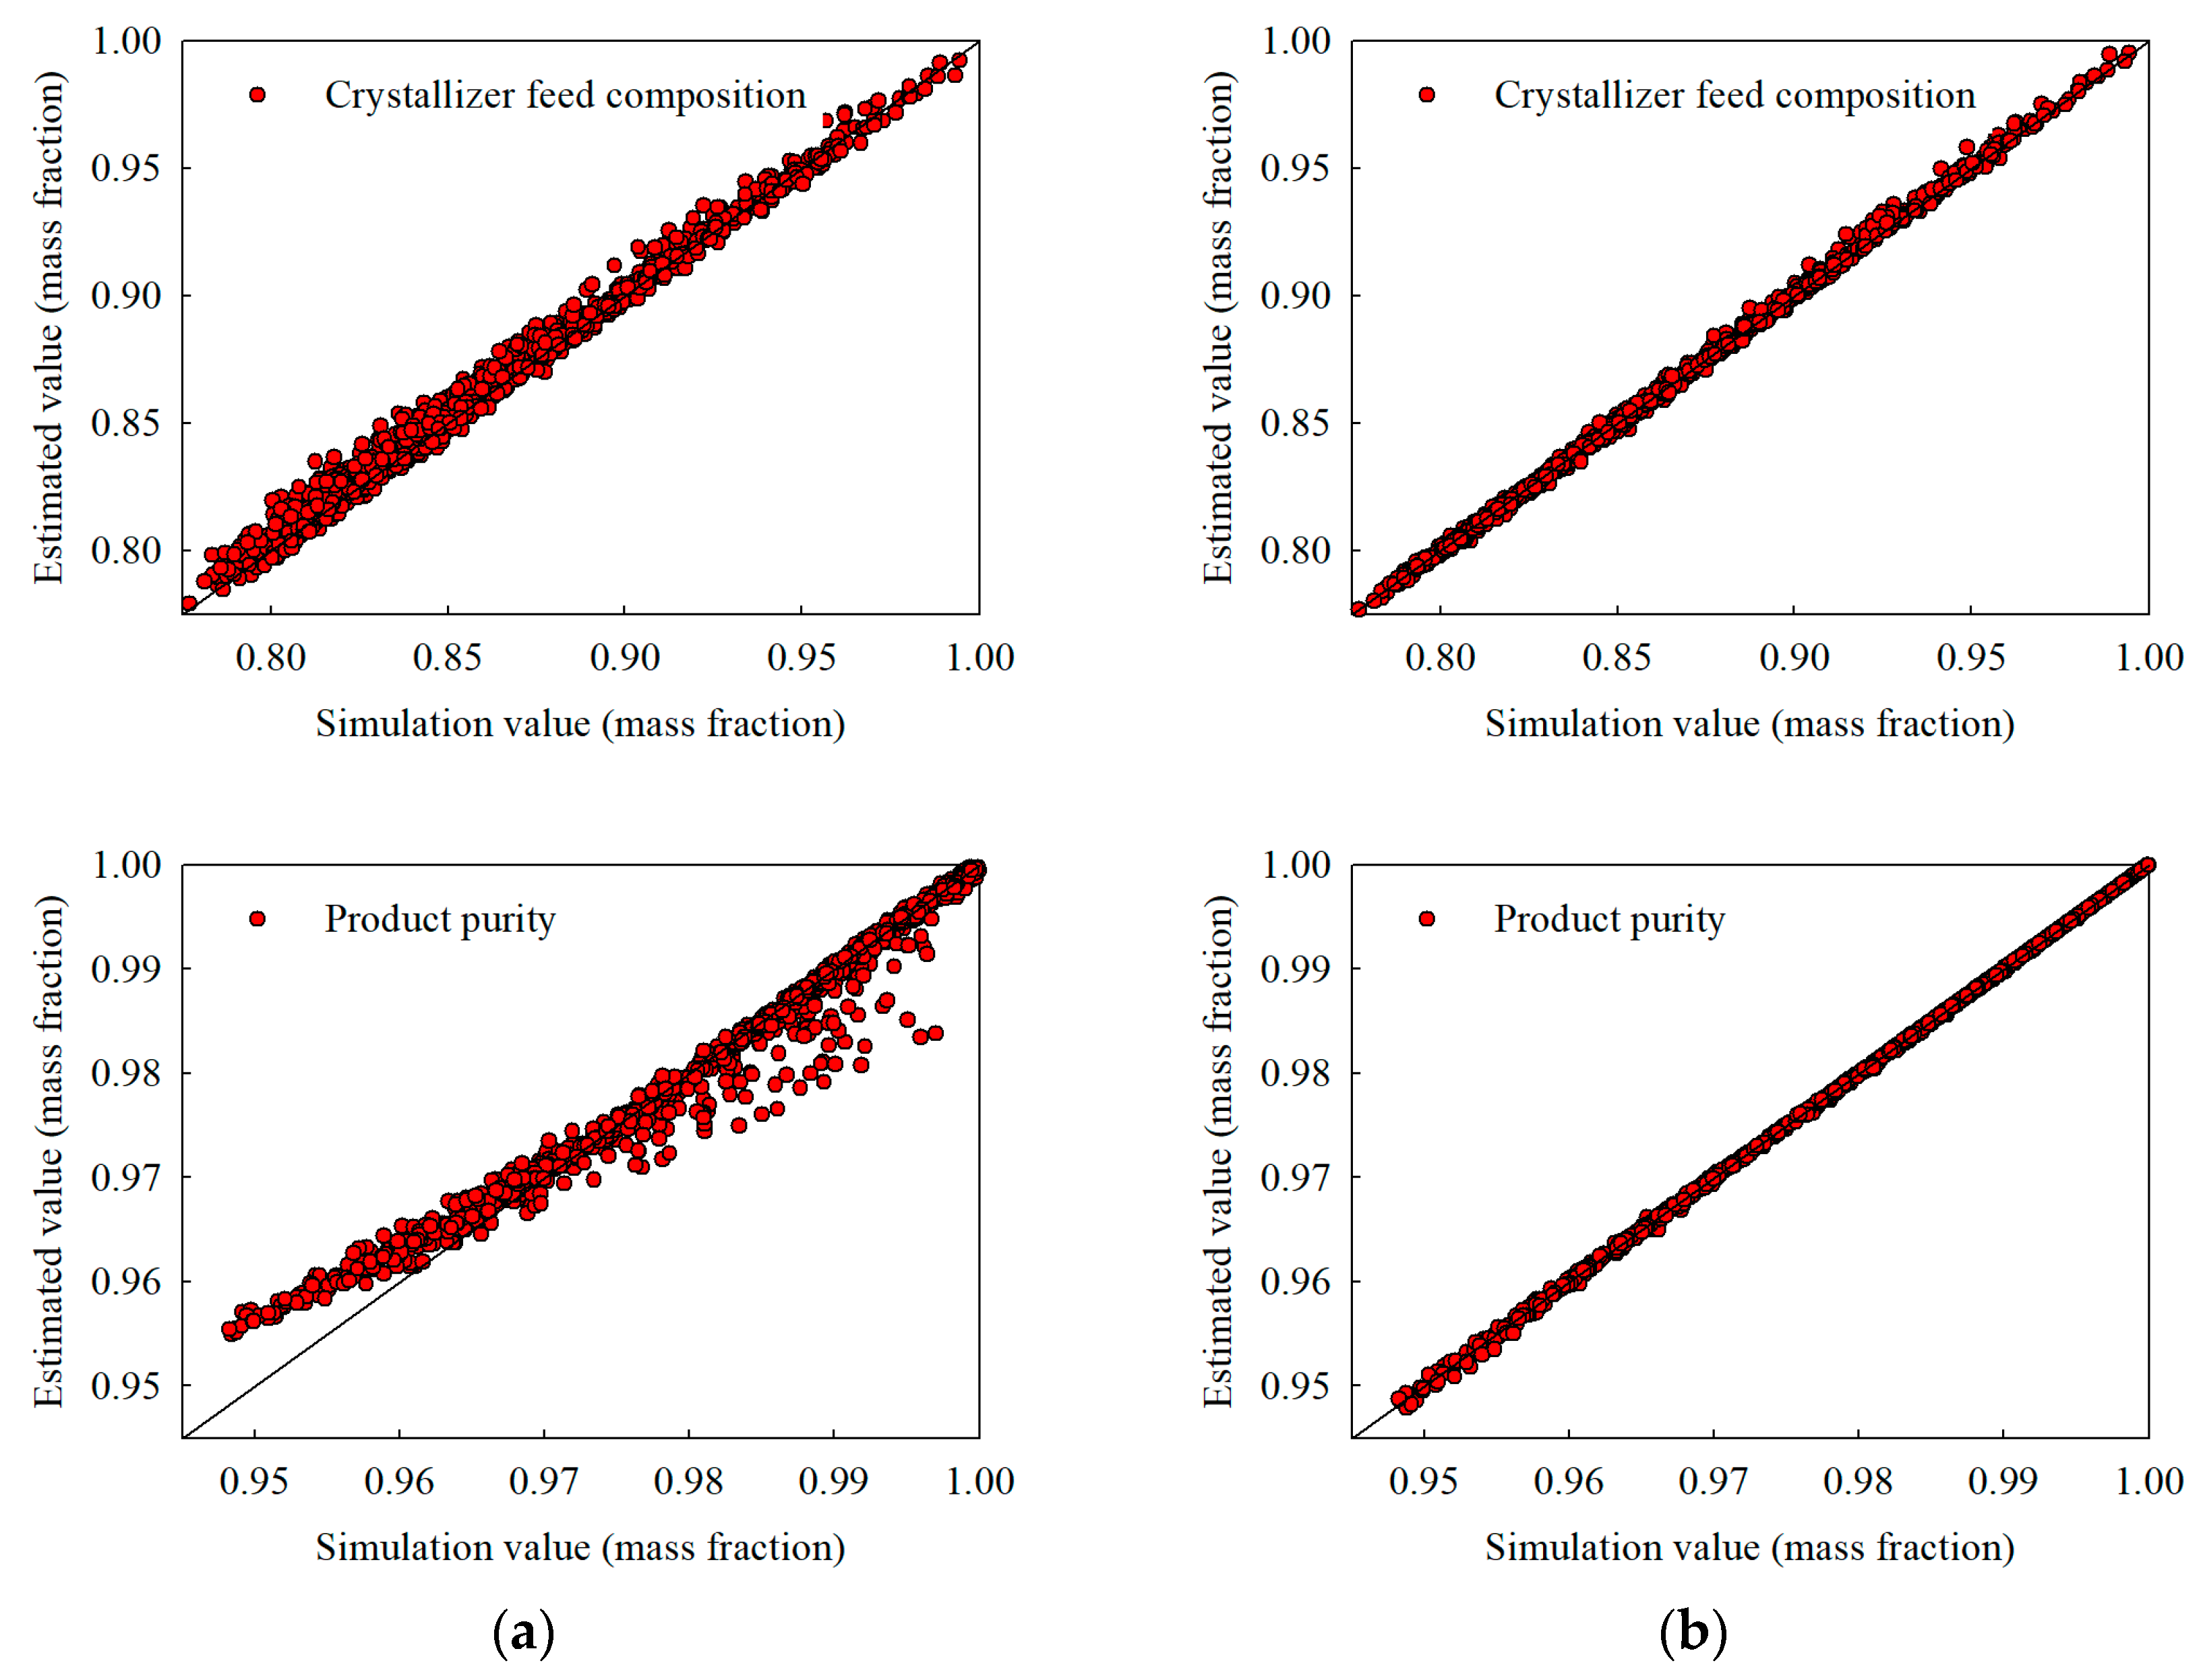
Figure 4 and Figure 5 illustrate these interpolation results for four representative outputs—crystallizer temperature, recycle flow, crystallizer feed composition, and product composition—using 500 and 3000 training samples, respectively. In each figure, the predictions of the hybrid model are more closely aligned with the diagonal line, indicating better overall accuracy and less systematic deviation compared to the stand-alone approach. This improvement is particularly noticeable for variables closely related to thermodynamic constraints and mass balances (e.g., compositions and major flow splits).
Overall, the interpolation results confirm that incorporating mechanistic knowledge yields higher fidelity predictions, especially when training data are limited. As the sample size increases, both approaches converge to high performance; however, the hybrid model consistently excels at capturing mass balance relationships and the effects of non-ideal solutions.

4.2. Extrapolation Performance

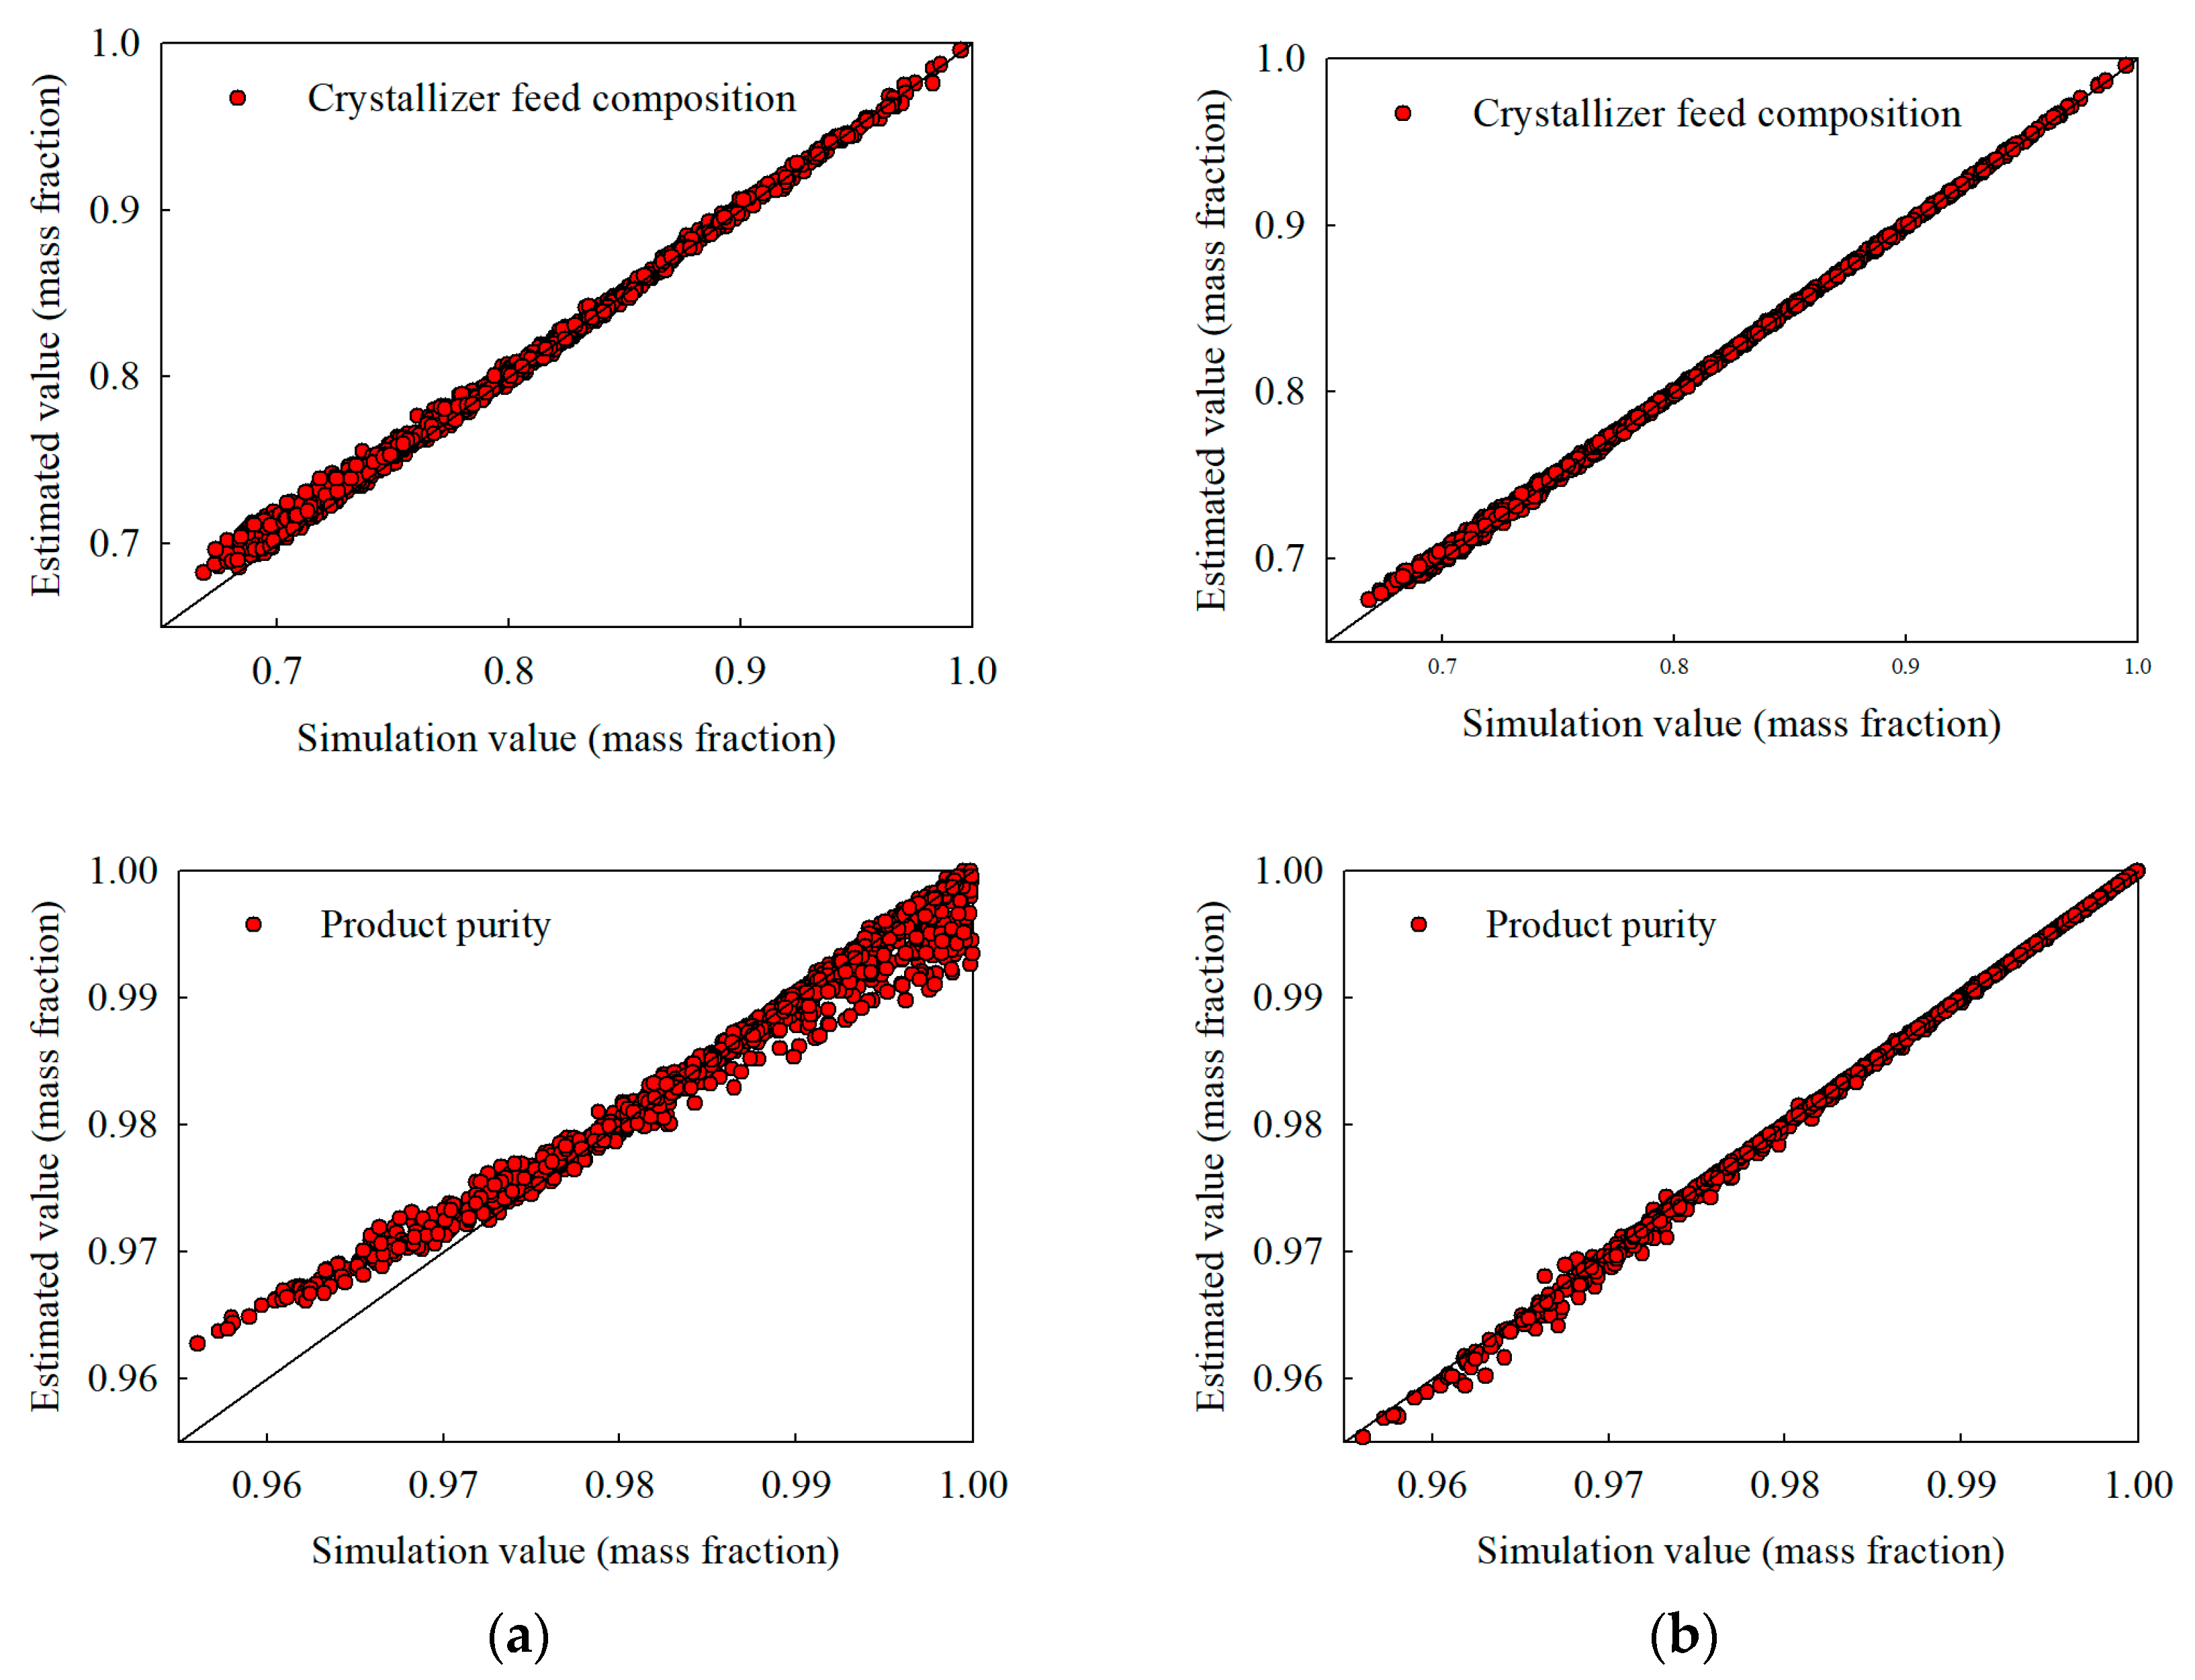
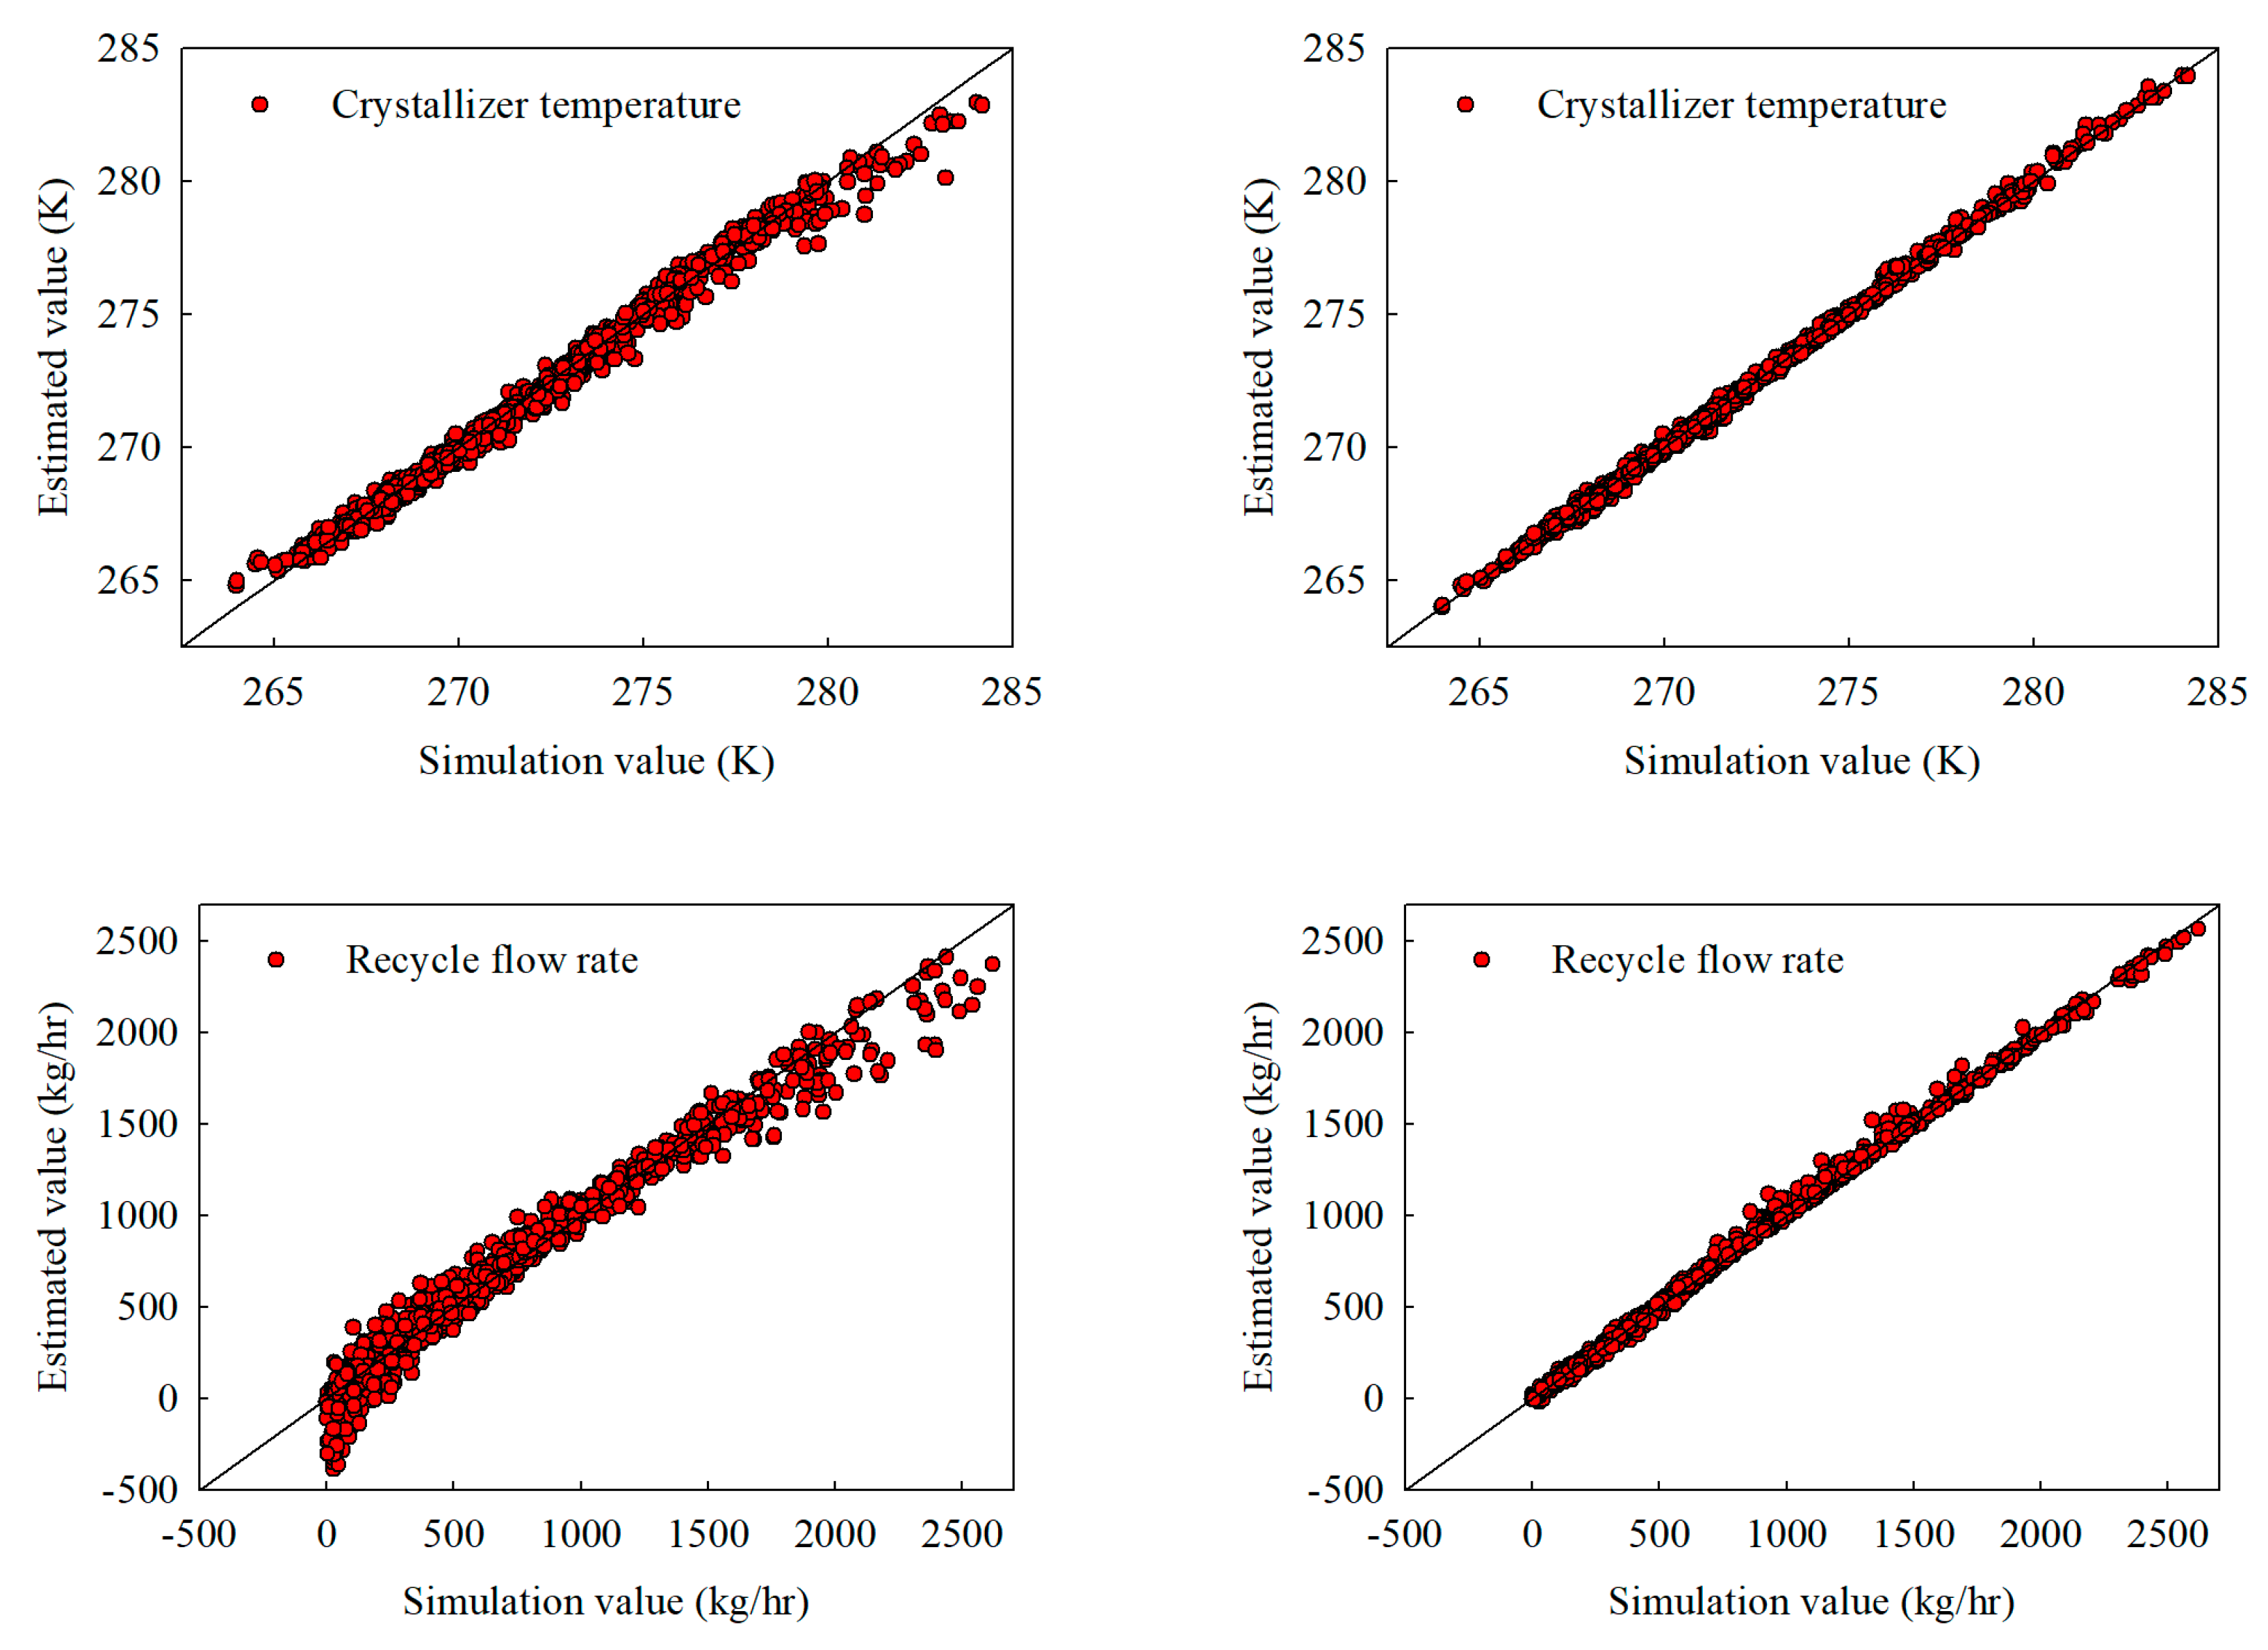
The extrapolation capabilities of the models were evaluated by applying them to operating conditions outside the domain specified in Table 1. Three main scenarios were tested: (1) broadening the acrylic acid feed composition to a range of 0.70–1.00 (with water content up to 0.25), (2) extending the distribution coefficient from 0.10 to 0.20, and (3) simultaneously expanding multiple parameters, which included acrylic acid composition (0.70–1.00), water (0.00–0.25), feed flow rate (1000–15,000 kg/h), recycle ratio (0.00–0.40), and distribution coefficient (0.00–0.20). Table 3, Table 4 and Table 5 summarize the results of this extrapolation performance.
In each scenario, the hybrid model demonstrated higher R 2 values and significantly lower root mean square errors (RMSEs) than the stand-alone model, indicating a more robust response to off-design conditions. For example, when the feed composition was broadened from 0.80–1.00 to 0.70–1.00, the stand-alone model exhibited an RMSE for a crystallizer temperature of 0.91 K. In contrast, the hybrid model achieved an RMSE of 0.48 K. Additionally, the RMSE for product flow decreased from 86.72 kg/h for the stand-alone model to 22.71 kg/h for the hybrid model. Similarly, when the distribution coefficient was extended beyond 0.10, the stand-alone model showed significant error growth in its predictions, whereas the hybrid network consistently maintained R 2 > 0.99. In a multi-parameter expansion involving acrylic acid composition (ranging from 0.70 to 1.00), water (from 0.00 to 0.25), feed flow (between 1000 and 15,000 kg/h), recycle ratio (from 0.00 to 0.40), and k d i f f (ranging from 0.00 to 0.20), the extrapolation deviations of the stand-alone model increased significantly, particularly at higher flow rates. In contrast, the hybrid model maintained high accuracy for all outputs. For example, the R 2 value for the recycle flow in the stand-alone model dropped to 0.893, while the crystallizer temperature’s root mean square error (RMSE) rose to 1.028 K. On the other hand, the hybrid model retained an R 2 value of 0.980 for recycle flow and an RMSE of just 0.498 K for temperature predictions. This demonstrates the superior robustness of the hybrid approach when multiple input parameters are pushed beyond their training range.
The hybrid model incorporates embedded thermodynamic constraints, such as mass balances and UNIQUAC-based solid–liquid equilibrium (SLE) calculations, which safeguard against unphysical predictions. By aligning with fundamental phase equilibrium and conservation laws, this hybrid framework ensures that the model’s learned function remains within the plausible limits of the process behavior, even when inputs deviate significantly from the training data. In contrast, a purely data-driven stand-alone approach lacks these first-principles “anchors” making it more prone to producing unrealistic outputs when extrapolating beyond its original calibration domain. As a result, the hybrid model yields more reliable and physically meaningful predictions across a broader range of operating conditions.
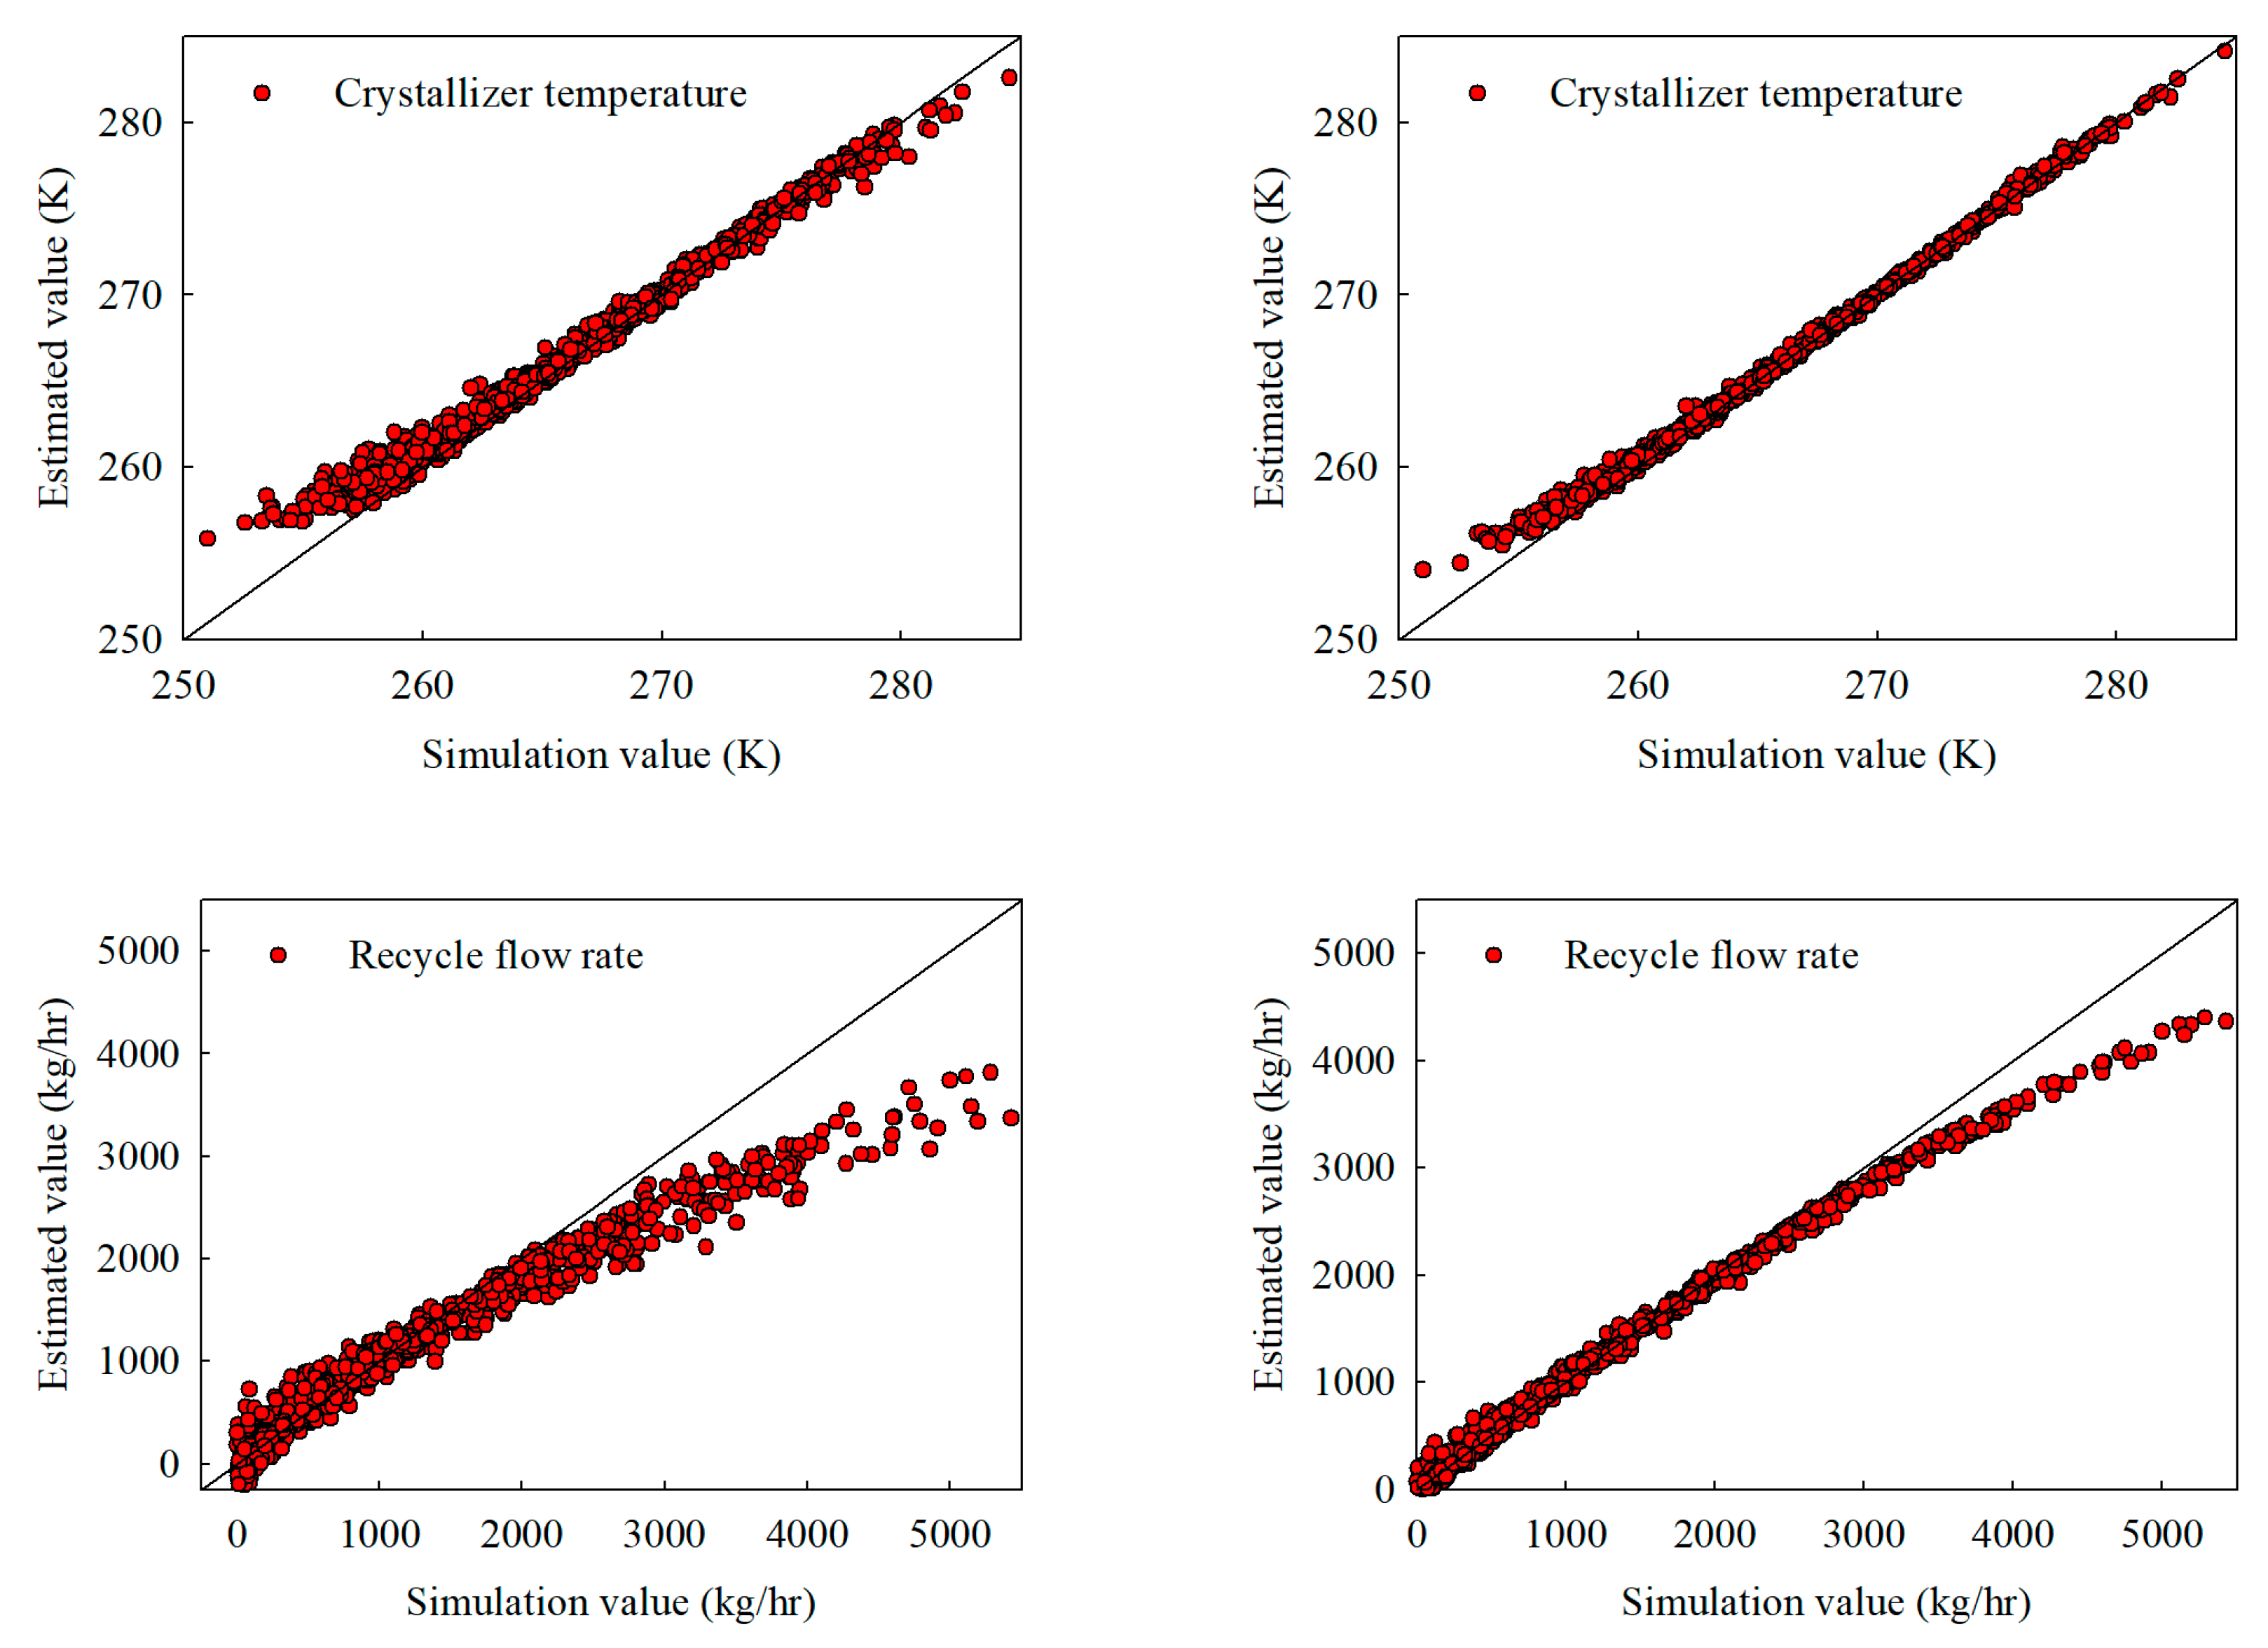
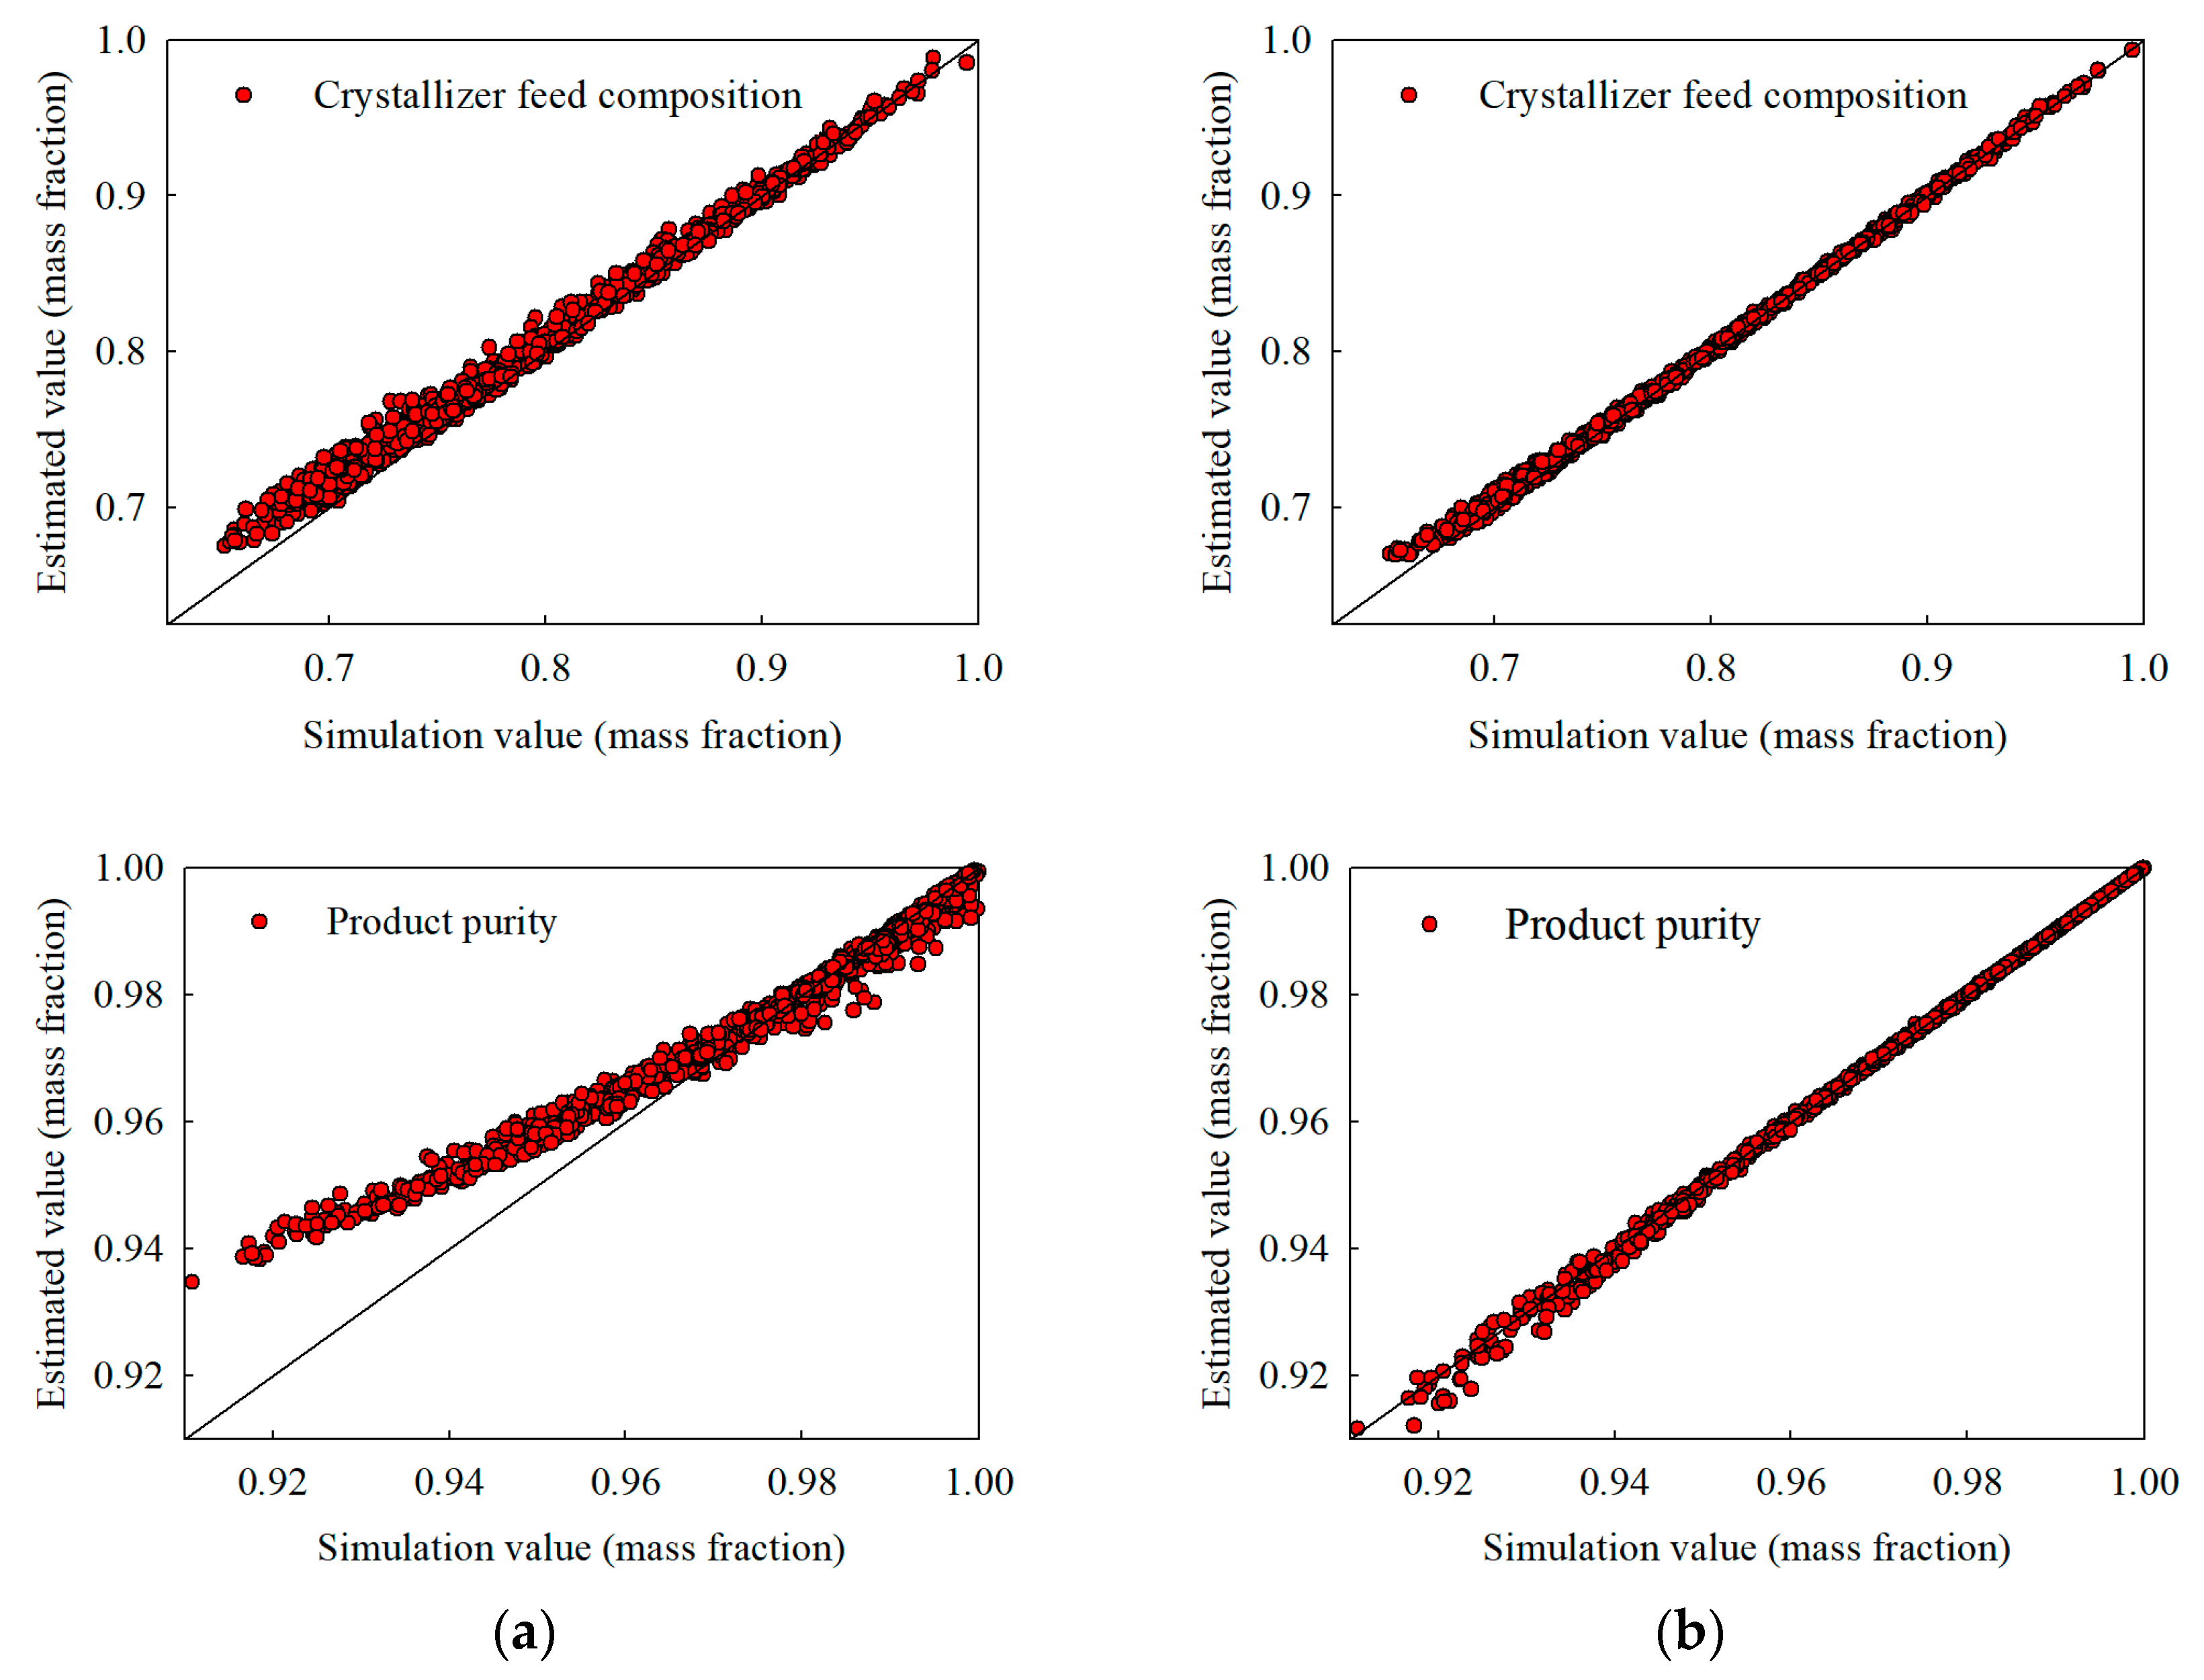
Figure 6, Figure 7 and Figure 8 illustrate the extrapolation results for four representative outputs: crystallizer temperature, recycle flow, crystallizer feed composition, and product composition. In each figure’s panel (a), the stand-alone model displayed increased scatter and systematic bias, indicating a tendency to over- or under-predict as inputs moved beyond the training domain. In contrast, panel (b) of each figure shows that the hybrid network consistently aligns more closely with the diagonal line, suggesting a better ability to maintain physically plausible relationships even under stress. This robustness stems from the integrated thermodynamic framework, which ensures that the model respects mass balances and accounts for non-ideal solution effects, even at extreme parameter values.
Overall, these extrapolation results underscore the significant advantage of combining first-principles knowledge with data-driven learning. While the stand-alone model performs well under trained conditions (see Section 4.1), it struggles to make reliable predictions once feed composition, separation efficiency, or flow rates exceed its calibration space. In contrast, the hybrid approach leverages mechanistic constraints to maintain stability and accuracy across a broader range of operating scenarios. It highlights its value for industrial crystallization design and optimization where off-design conditions are common.

4.3. Further Discussion on Thermodynamic Parameter Selection

A key factor in the success of the hybrid neural network approach is the quality of the underlying thermodynamic model. In this study, the UNIQUAC framework provides baseline activity coefficients for acrylic acid, water, and acetic acid, and the neural network refines any discrepancies as residual corrections. Naturally, if the UNIQUAC parameters fail to capture the major non-idealities, the hybrid model must compensate for a more significant systematic error, which can adversely affect accuracy and robustness.
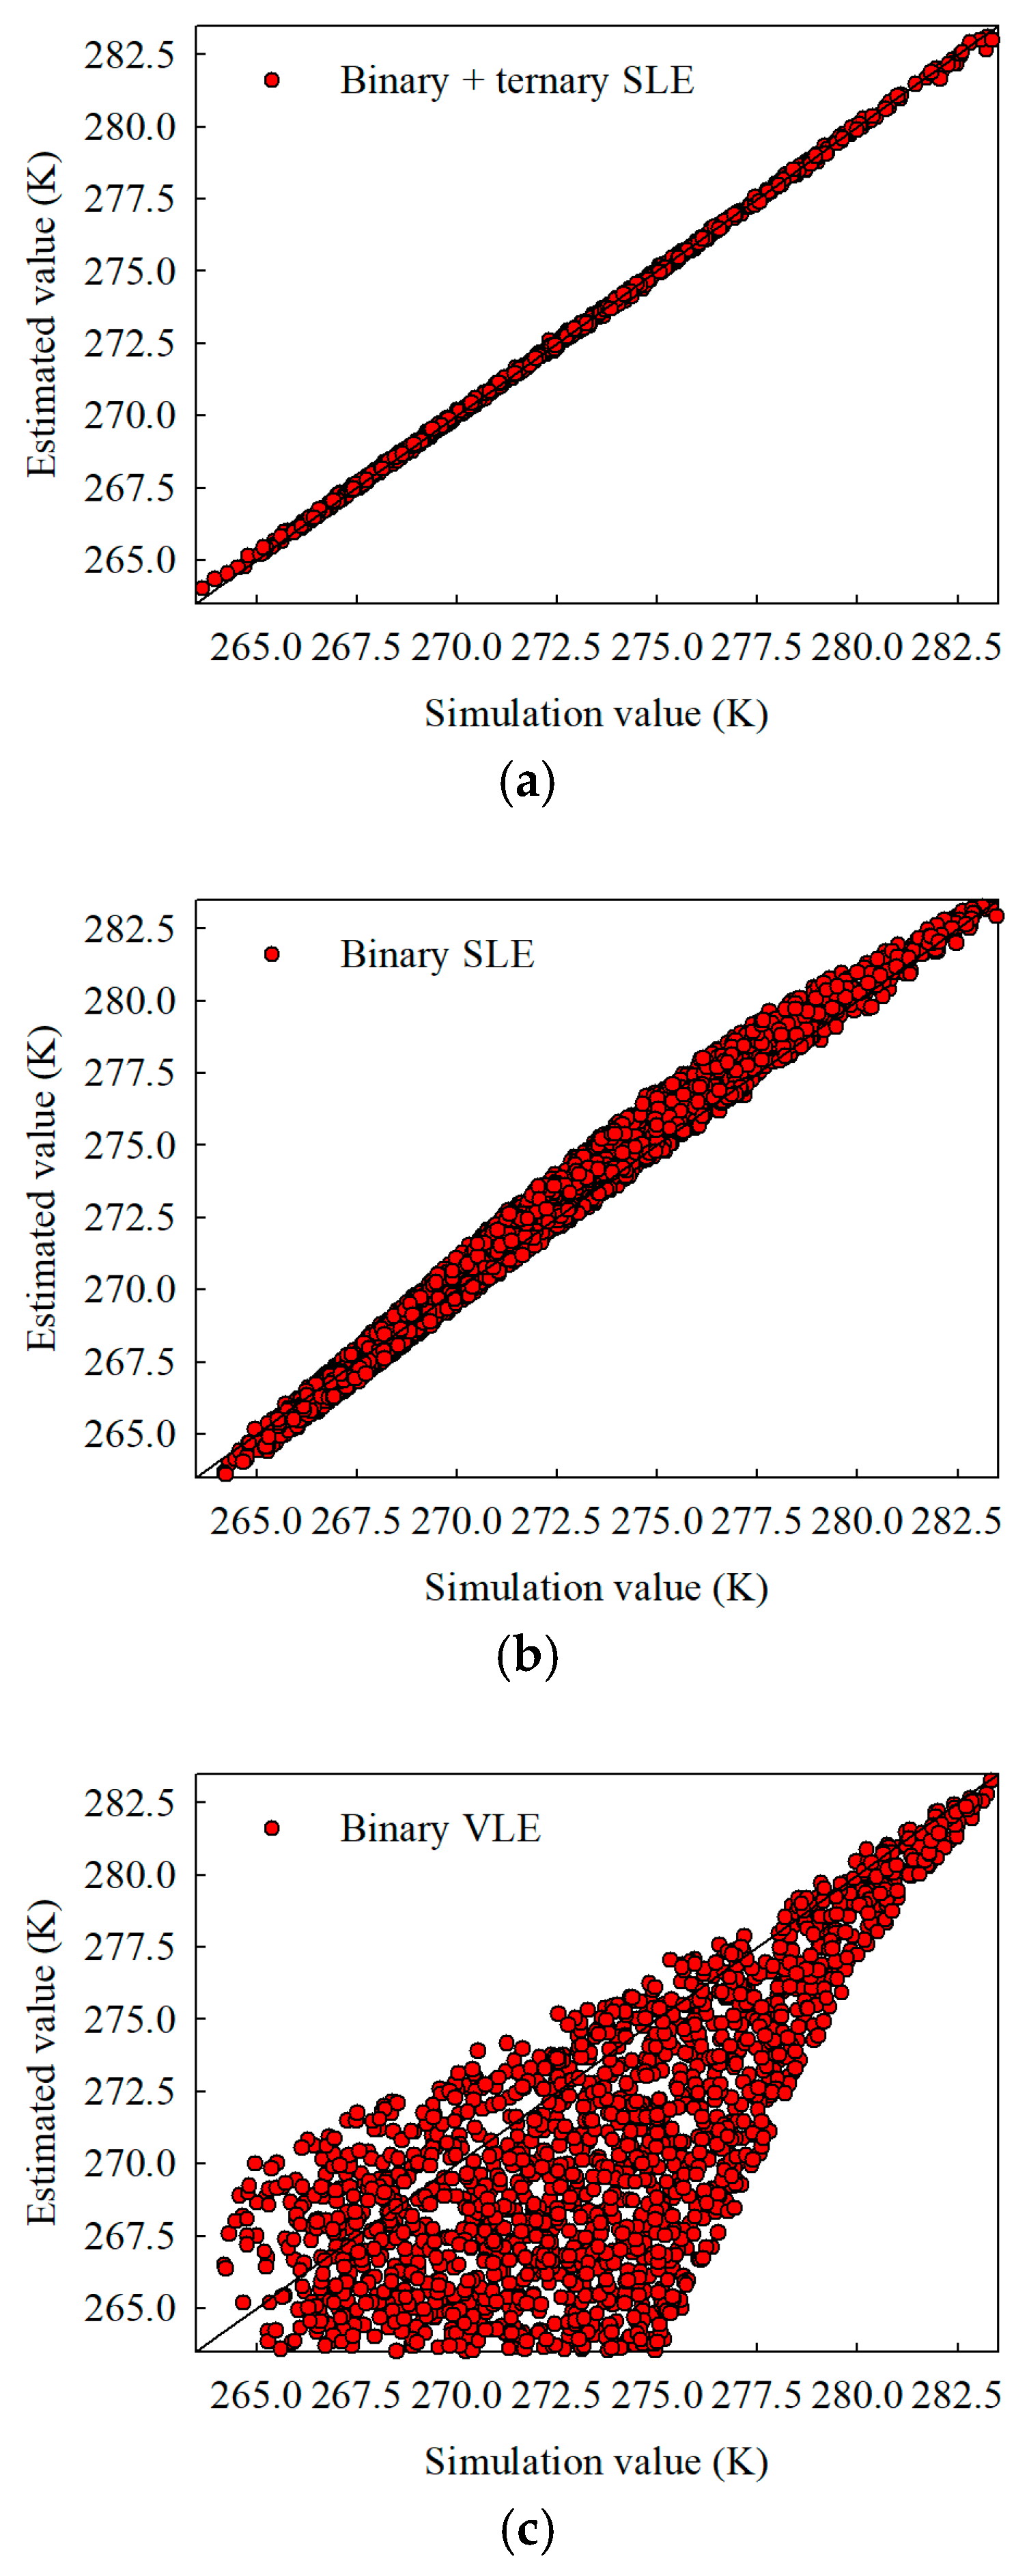
To examine this dependence, three different UNIQUAC parameter sets were tested for the hybrid network under interpolation conditions with 3000 training samples: (i) parameter fitted to both binary and ternary solid–liquid equilibrium data [11], (ii) parameters based exclusively on binary solid–liquid equilibrium (SLE) data [32,33], and (iii) parameters relying on binary vapor–liquid equilibrium (VLE) data [34]. Table 6 compares the resulting interpolation performance for crystallizer temperature. When combined binary–ternary SLE parameters are used, the hybrid model achieves near-perfect accuracy ( R 2 ≈ 1.000, RMSE = 0.081 K). By contrast, relying on binary SLE data alone leads to moderate errors (RMSE = 0.683 K), whereas using binary VLE parameters drastically degrades the model ( R 2 = −4.257, RMSE = 9.508 K). Figure 9 further illustrates these differences, showing predicted versus actual crystallizer temperatures for each parameter set. With the binary VLE parameters, the baseline UNIQUAC predictions deviate sharply, forcing the neural network to correct substantial systematic bias and often failing to stay within realistic thermodynamic bounds.
These results confirm that system-specific thermodynamic data—particularly for solid–liquid equilibrium—are essential for maximizing the hybrid model’s accuracy and physical consistency. While the residual learning component can partially correct moderate errors, a poorly calibrated thermodynamic baseline imposes an excessive correction burden on the neural network, limiting its reliability under interpolation and extrapolation. Consequently, for industrial crystallization processes, performing or acquiring direct SLE measurements (rather than relying solely on VLE or binary data) is recommended to ensure the most accurate UNIQUAC parameterization and, thus, the highest-fidelity hybrid model predictions.

4.4. Case Study: Single-Stage Melt Crystallization Design Using a Hybrid Neural Network Model

This section demonstrates how a hybrid neural network model can quickly identify the feasible operating region for single-stage melt crystallization process, especially under strict product purity constraints. By circumventing many of the computational overheads associated with detailed thermodynamic simulations, the hybrid model efficiently samples large portions of the operating parameter space, significantly reducing the time needed for process optimization.
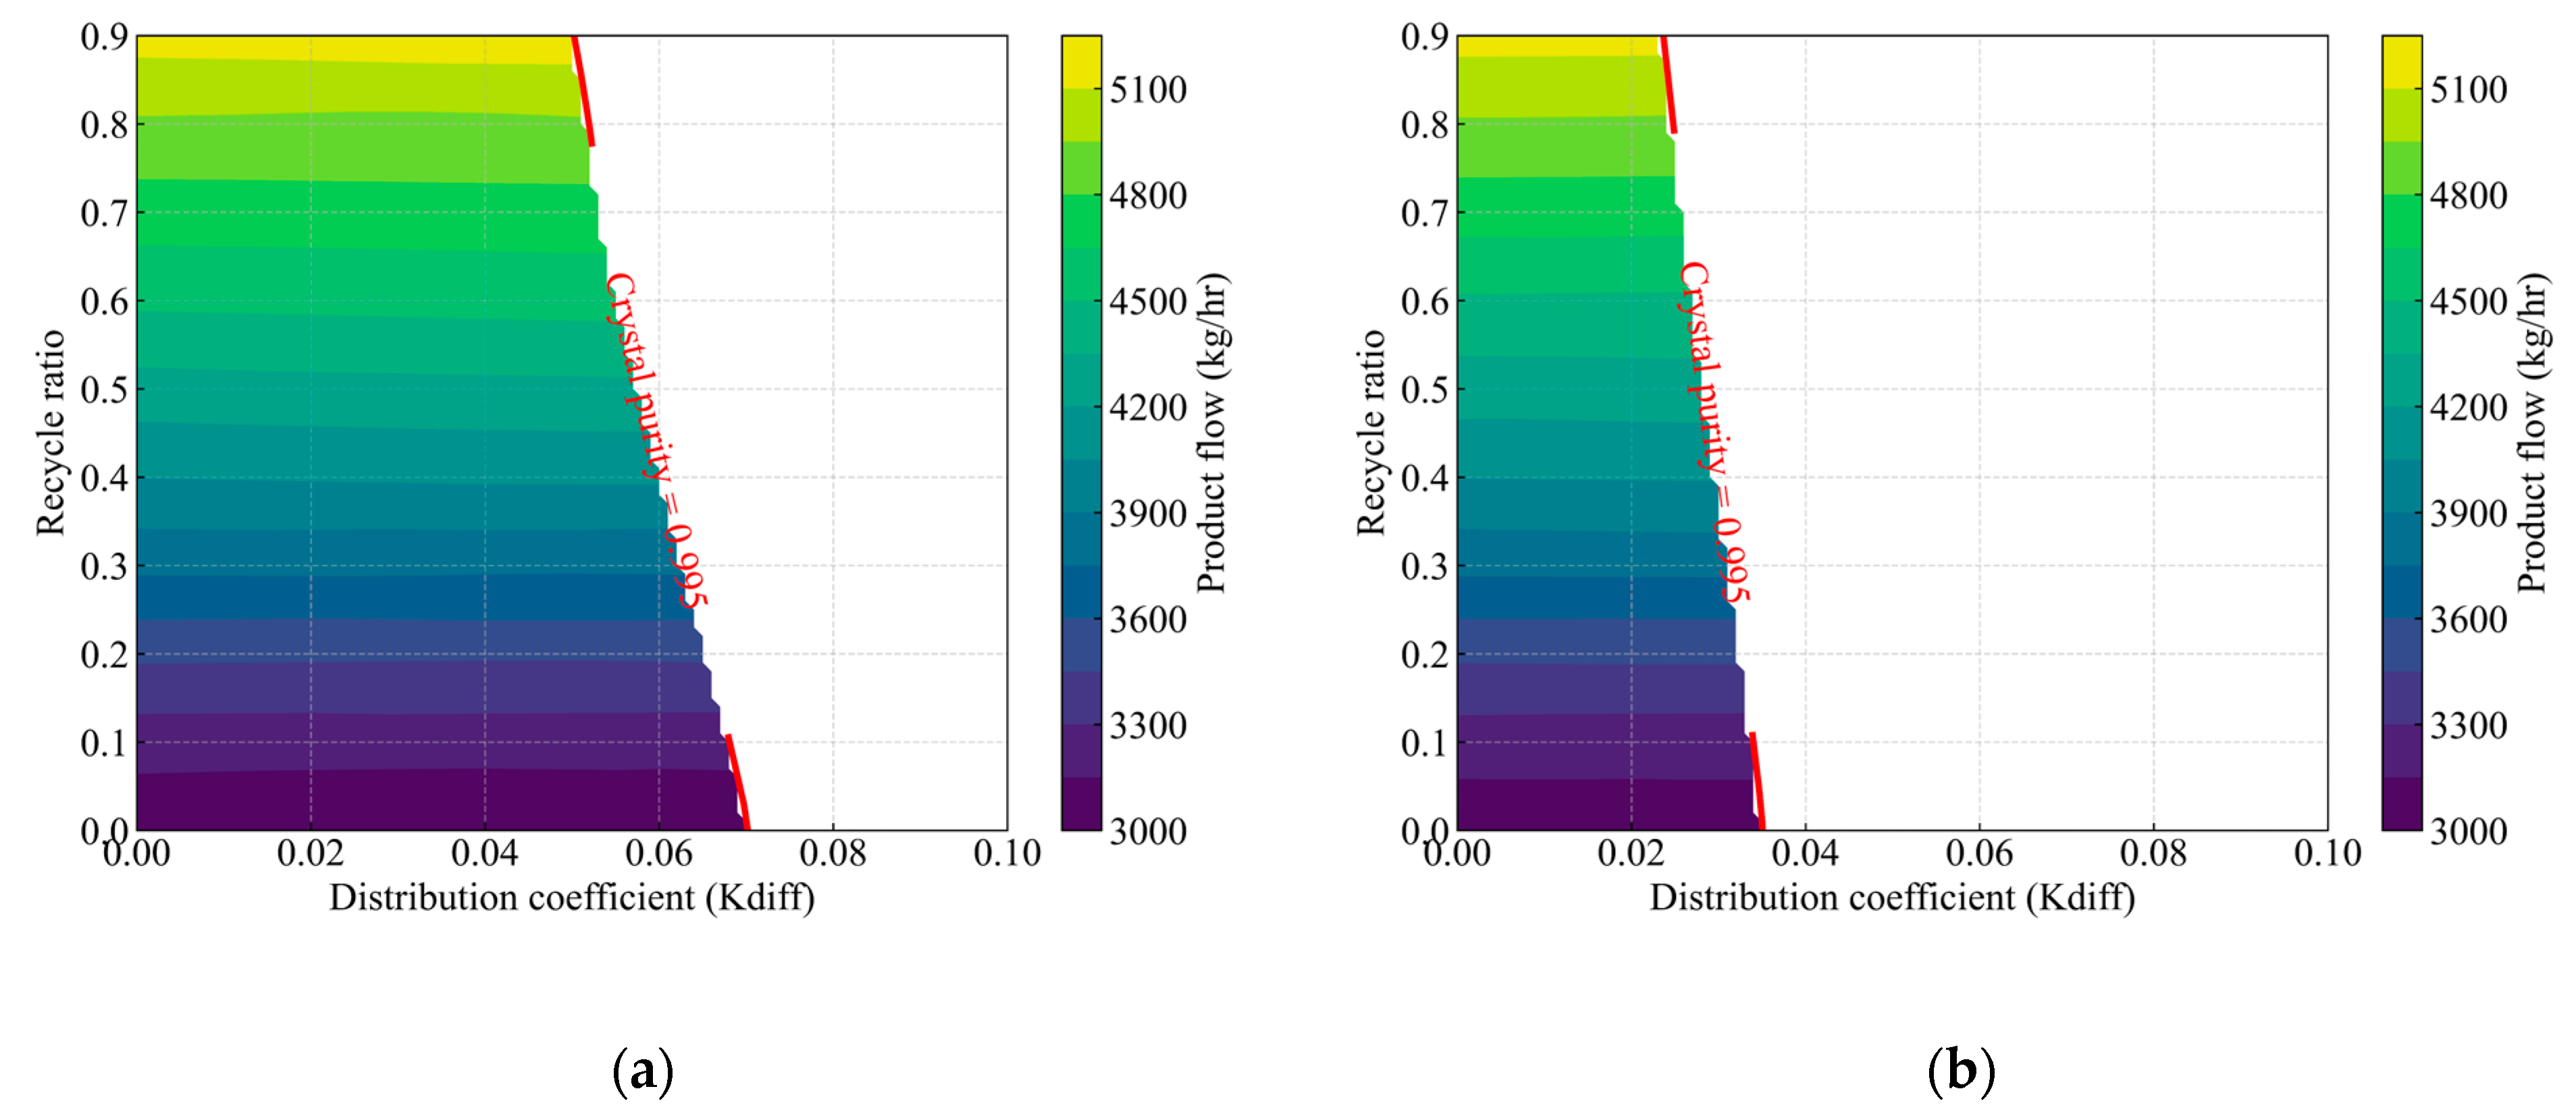
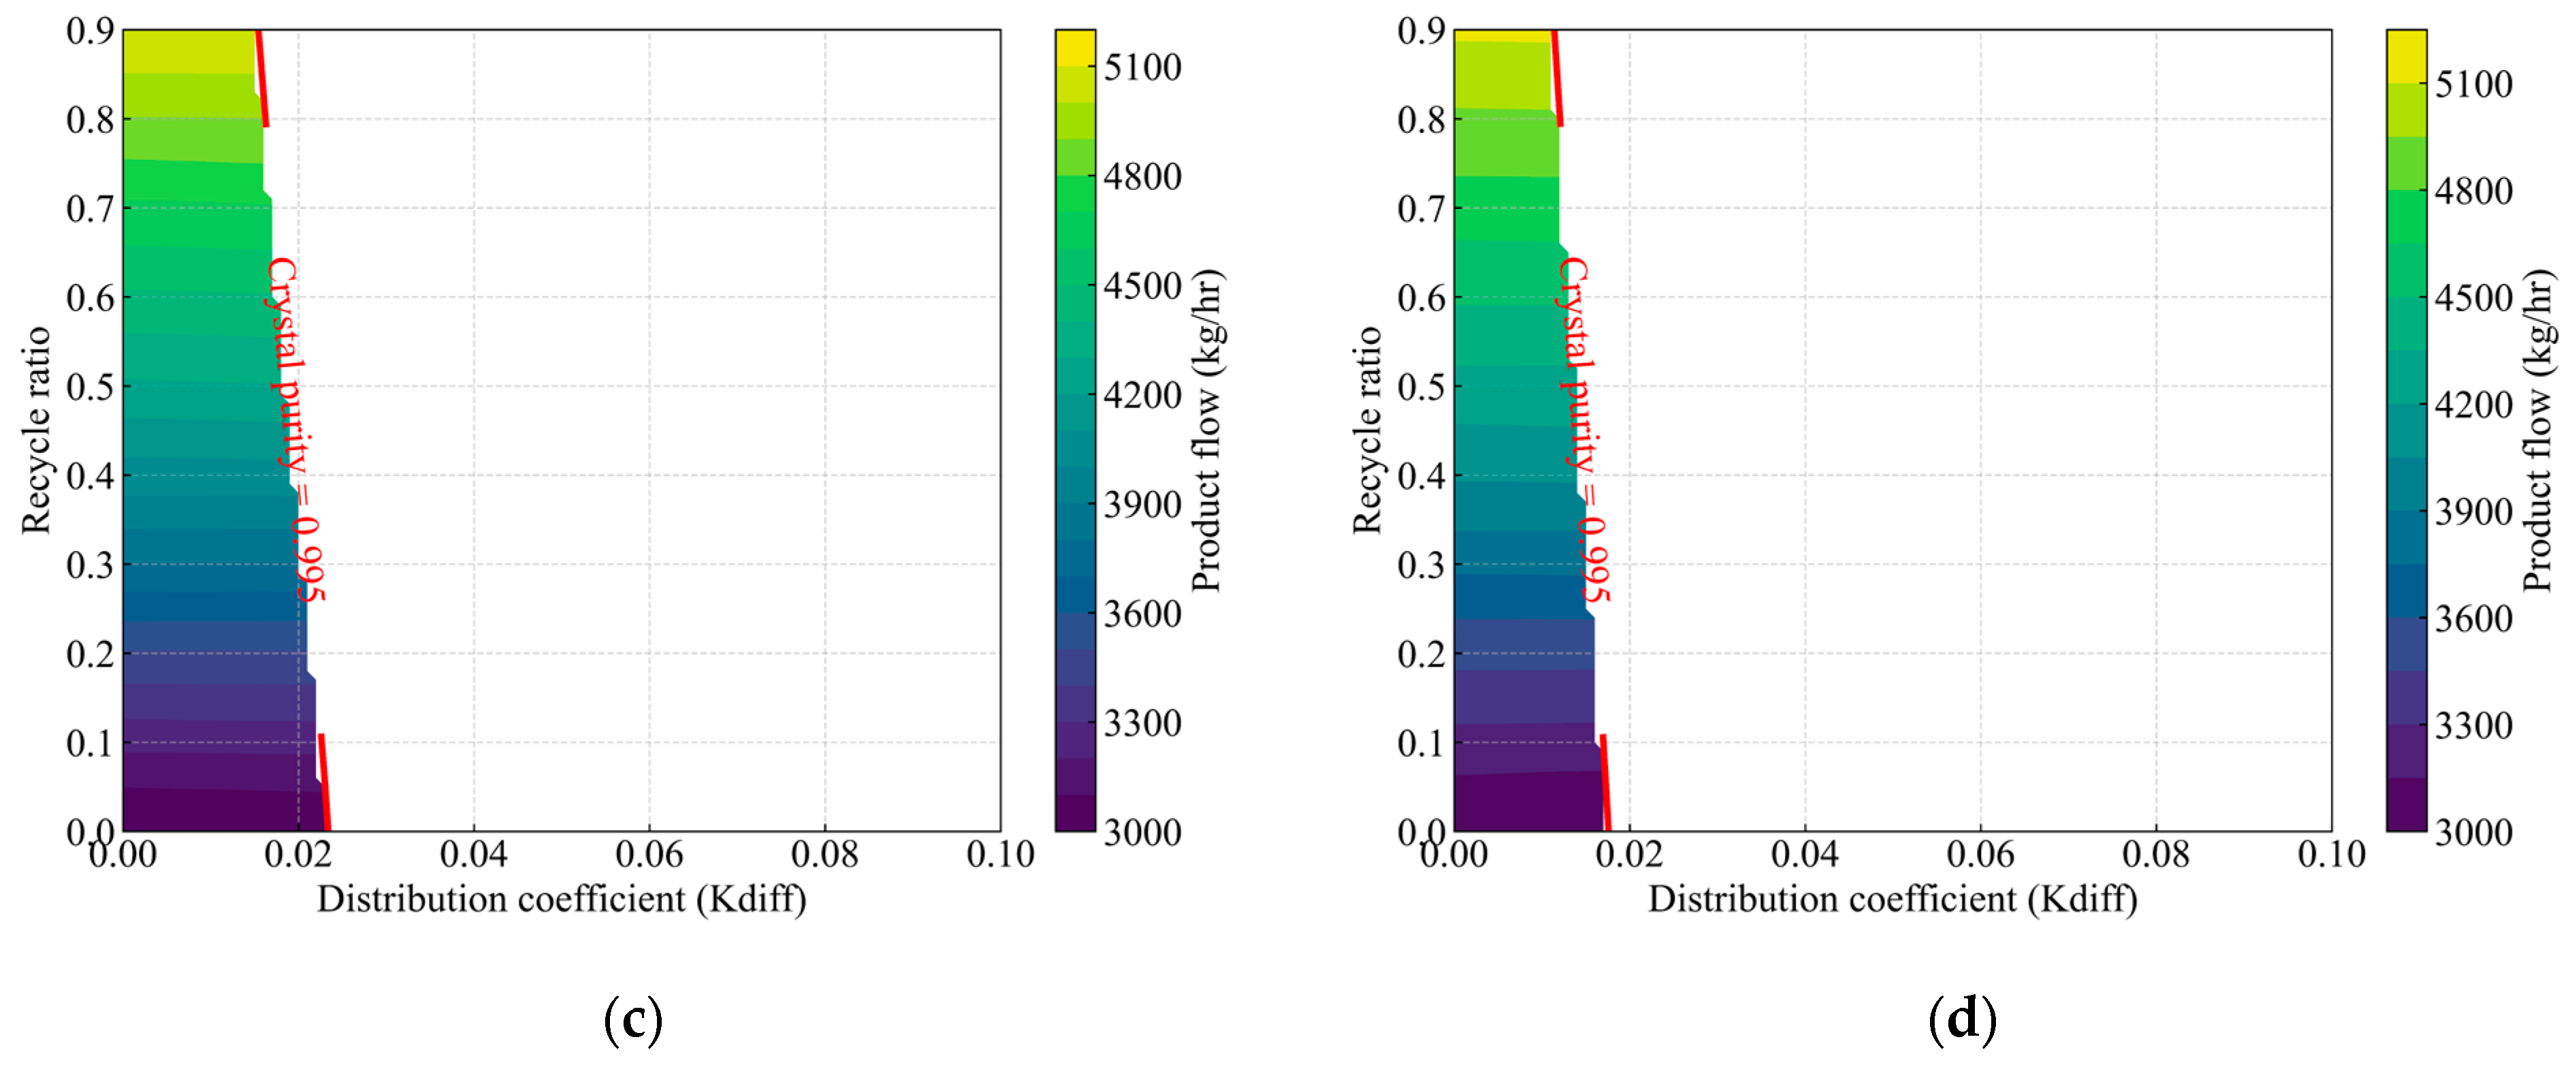
In this scenario, a product purity constraint of 99.5 wt% acrylic acid is imposed. The hybrid neural network model finds feasible combinations of the distribution coefficient ( k d i f f ) and the recycle ratio. Figure 10 presents these results for four feed compositions ranging from 80 to 95 wt% acrylic acid. The colored contours indicate the total product flow rate at each ( k d i f f , recycle ratio) operating condition. At the same time, the red-labeled isopleths mark the points where product purity reaches exactly 0.995, delineating the feasibility boundary.
As the recycle ratio increases, the product flow rate rises, reflecting a greater overall throughput. However, higher recycle ratios restrict the feasible region for achieving 99.5 wt% purity, as more impurities are continuously recirculated into the crystallizer. Lower feed compositions, such as 80 wt% acrylic acid, further limit the permissible range ( k d i f f ), suggesting that more effective solid–liquid separation techniques (e.g., wash columns or multiple washing steps) may be required to attain the desired purity level. Suppose k d i f f remains significantly large (indicating a low separation efficiency of the selected unit). In that case, multiple crystallization stages may be necessary instead of relying on a single-stage crystallizer to achieve the targeted high purity.
In practical applications, these contour and isopleth plots facilitate rapid “what-if” analyses for industrial design and operation. Rather than conducting computationally intensive crystallization simulations at every parameter point, the hybrid model quickly estimates product purity, throughput, and impurity accumulation under various conditions. Although this example focuses on a single crystallizer, the same approach can be extended to multi-stage processes or integrated with economic and energy considerations, providing a robust framework for identifying cost-effective, high-purity strategies for acrylic acid production.

4.5. Future Work

In addition to our current single-stage crystallization framework, our next objective is to perform a comprehensive techno-economic assessment of melt crystallization for acrylic acid production using our developed hybrid neural network model. This assessment will incorporate operating expenditures (OPEX), capital expenditures (CAPEX), total annualized costs (TACs), and greenhouse gas (CO2) emissions.
We plan to explore various configurations, including multi-stage crystallization units, hybrid distillation–crystallization processes, and cocurrent and countercurrent cascade schemes for continuous suspension-based melt crystallization. These extended studies aim to evaluate the potential of melt crystallization to outperform conventional separation processes in terms of energy efficiency, economic viability, and environmental impact.
By integrating robust modeling with comprehensive cost and sustainability metrics, we aim to demonstrate the broader applicability of melt crystallization as a competitive and eco-friendly alternative for industrial-scale acrylic acid purification.
Furthermore, although our current work shows strong predictive capabilities, it relies solely on simulated datasets derived from mass balance models and thermodynamic calculations. We plan to conduct lab-scale continuous solid–liquid separation experiments for acrylic acid under various operating conditions to address real-world performance. These experiments will allow us to measure solid–liquid separation efficiency—particularly for multicomponent feeds—and compare the results directly with the model’s predictions. Incorporating these empirical findings will help refine the hybrid neural network framework, ensuring it accounts for practical aspects such as wash column performance and potential non-idealities not captured by pure simulation. In this way, future experimental validation will enhance the reliability of our surrogate models and provide stronger guidance for industrial melt crystallization processes.

5. Conclusions

This study demonstrates that incorporating thermodynamics-guided neural network (NN) modeling significantly improves melt crystallization predictions in the acrylic–water–acetic acid system. By embedding UNIQUAC-based solid–liquid equilibrium (SLE) constraints, the hybrid model shows more accurate and robust performance than a stand-alone (black-box) NN, especially when operating conditions deviate from or extend beyond the training domain. Our results highlight the importance of high-quality thermodynamic parameterization: Combining binary and ternary SLE data minimizes residual corrections and enhances reliability.
From a practical perspective, the hybrid NN approach enables rapid “what-if” analyses for single-stage crystallization design, significantly reducing computational overhead compared to fully rigorous thermodynamic simulations. For example, at a target product purity of 99.5 wt%, the hybrid model quickly identifies feasible operating zones for the distribution coefficient and recycle ratio under varying feed compositions. This capability is particularly beneficial in large-scale acrylic acid production, where feedstock impurities may vary, and near real-time process optimization is often necessary.
However, the current study relies on thermodynamic-based mass balance simulations (conceptual design) and does not account for crystal size distribution effects, such as nucleation and growth rates. In future work, we plan to incorporate pilot-scale or real-plant data to validate and refine the model’s accuracy while including population balance considerations. Additionally, we aim to explore multi-stage crystallization or hybrid distillation–melt crystallization flowsheets and conduct comprehensive techno-economic analyses addressing capital expenditures (CAPEX), operational expenditures (OPEX), and CO2 emissions. With ongoing advancements, thermodynamics-guided neural networks have the potential to become a powerful tool for designing and optimizing sustainable, high-purity melt crystallization processes on an industrial scale.

Supplementary Materials

The following supporting information can be downloaded at: https://www.mdpi.com/article/10.3390/pr13051414/s1. It includes additional details regarding the neural network training procedures, architecture, and data preprocessing methods used in this study.

Author Contributions

Conceptualization, T.-H.K., S.-H.B., S.-J.Y., S.-K.L. and J.-W.K.; methodology, T.-H.K., S.-H.B., S.-J.Y., S.-K.L. and J.-W.K.; software, T.-H.K.; validation, T.-H.K., S.-H.B., S.-J.Y., S.-K.L. and J.-W.K.; writing—original draft preparation, T.-H.K.; writing—review and editing, J.-W.K.; supervision, S.-J.Y. and S.-K.L.; project administration, S.-K.L. and J.-W.K. All authors have read and agreed to the published version of the manuscript.

Funding

This research was funded by LG Chem, Ltd. Development of a Low-Carbon Separation Crystallization Process, grant number Q2327821.

Data Availability Statement

The original contributions presented in this study are included in the article. Further inquiries can be directed to the corresponding author.

Acknowledgments

This work was supported by Korea University and LG Chem, Ltd.

Conflicts of Interest

The authors declare that this study received funding from LG Chem, Ltd. The funder was not involved in the study design, collection, analysis, interpretation of data, the writing of this article or the decision to submit it for publication.

Abbreviations

The following abbreviations are used in this manuscript:
SLESolid–Liquid Equilibrium
UNIQUACUniversal Quasi-Chemical (activity coefficient model)
LHSLatin Hypercube Sampling
NNNeural Network
MLPMulti-layer Perceptron
RMSERoot Mean Squared Error
R 2 Coefficient of Determination
k d i f f Distribution Coefficient
VLEVapor–Liquid Equilibrium
OPEXOperating Expenditures
CAPEXCapital Expenditures
TACTotal Annualized Costs
CO2Carbon Dioxide

References

  1. Arkenbout, G.J.C. Melt Crystallization Technology; Technomic Publishing: Lancaster, PA, USA, 1995. [Google Scholar]
  2. Matsuoka, M.; Fukuda, T.; Takagi, Y.; Takiyama, H. Purification by Sweating of Organic Solid Solutions by Layer and Suspension Type Melt Crystallization Operations. J. Chem. Eng. Jpn. 1995, 28, 562–569. [Google Scholar] [CrossRef]
  3. Verdoes, D.; Arkenbout, G.; Bruinsma, O.; Koutsoukos, P.; Ulrich, J. Improved Procedures for Separating Crystals from the Melt. Appl. Therm. Eng. 1997, 17, 879–888. [Google Scholar] [CrossRef]
  4. Ulrich, J. Is Melt Crystallization a Green Technology? Cryst. Growth Des. 2004, 4, 879–880. [Google Scholar] [CrossRef]
  5. Mignon, A.; Vermeulen, J.; Graulus, G.-J.; Martins, J.; Dubruel, P.; De Belie, N.; Van Vlierberghe, S. Characterization of Methacrylated Alginate and Acrylic Monomers as Versatile SAPs. Carbohydr. Polym. 2017, 168, 44–51. [Google Scholar] [CrossRef] [PubMed]
  6. McNeill, I.; Sadeghi, S. Thermal Stability and Degradation Mechanisms of Poly (Acrylic Acid) and Its Salts: Part 1—Poly (Acrylic Acid). Polym. Degrad. Stab. 1990, 29, 233–246. [Google Scholar] [CrossRef]
  7. Sandid, A.; Esteban, J.; D’Agostino, C.; Spallina, V. Process Assessment of Renewable-Based Acrylic Acid Production from Glycerol Valorisation. J. Clean. Prod. 2023, 418, 138127. [Google Scholar] [CrossRef]
  8. Micovic, J.; Beierling, T.; Lutze, P.; Sadowski, G.; Górak, A. Design of Hybrid Distillation/Melt Crystallization Processes for Separation of Close-Boiling Mixtures. Chem. Ing. Tech. 2012, 84, 2035–2047. [Google Scholar] [CrossRef]
  9. Wellinghoff, G.; Wintermantel, K. Schmelzkristallisation–Theoretische Voraussetzungen und Technische Grenzen. Chem. Ing. Tech. 1991, 63, 881–891. [Google Scholar] [CrossRef]
  10. Franke, M.B.; Nowotny, N.; Ndocko, E.N.; Górak, A.; Strube, J. Design and Optimization of a Hybrid Distillation/Melt Crystallization Process. AIChE J. 2008, 54, 2925–2942. [Google Scholar] [CrossRef]
  11. Kim, T.H.; Jang, Y.O.; Baek, S.H.; Jung, S.Y.; Yoo, S.J.; Lee, S.K.; Kang, J.W. Solid–Liquid Equilibrium of Acrylic Acid, Water, and Acetic Acid Ternary System for Separation Process Design. Int. J. Thermophys. 2025, 46, 78. [Google Scholar] [CrossRef]
  12. Breiman, L. Random Forests. Mach. Learn. 2001, 45, 5–32. [Google Scholar] [CrossRef]
  13. Friedman, J.H. Stochastic Gradient Boosting. Comput. Stat. Data Anal. 2002, 38, 367–378. [Google Scholar] [CrossRef]
  14. Wang, S.-C. Artificial Neural Network. In Interdisciplinary Computing in Java Programming; Springer: Berlin/Heidelberg, Germany, 2003; pp. 81–100. [Google Scholar]
  15. Winz, J.; Engell, S. Data-Efficient Surrogate Modeling of Thermodynamic Equilibria Using Sobolev Training, Data Augmentation and Adaptive Sampling. Chem. Eng. Sci. 2024, 299, 120461. [Google Scholar] [CrossRef]
  16. Cozad, A.; Sahinidis, N.V.; Miller, D.C. A Combined First-Principles and Data-Driven Approach to Model Building. Comput. Chem. Eng. 2015, 73, 116–127. [Google Scholar] [CrossRef]
  17. Misener, R.; Biegler, L.J. Formulating Data-Driven Surrogate Models for Process Optimization. Comput. Chem. Eng. 2023, 179, 108411. [Google Scholar] [CrossRef]
  18. Psichogios, D.C.; Ungar, L.H. A Hybrid Neural Network–First Principles Approach to Process Modeling. AIChE J. 1992, 38, 1499–1511. [Google Scholar] [CrossRef]
  19. von Stosch, M.; Oliveira, R.; Peres, J.; de Azevedo, S.F. Hybrid Semi-Parametric Modeling in Process Systems Engineering: Past, Present and Future. Comput. Chem. Eng. 2014, 60, 86–101. [Google Scholar] [CrossRef]
  20. Bhutani, N.; Rangaiah, G.; Ray, A.K. First-Principles, Data-Based, and Hybrid Modeling and Optimization of an Industrial Hydrocracking Unit. Ind. Eng. Chem. Res. 2006, 45, 7807–7816. [Google Scholar] [CrossRef]
  21. Stein, M. Large Sample Properties of Simulations Using Latin Hypercube Sampling. Technometrics 1987, 29, 143–151. [Google Scholar] [CrossRef]
  22. Abrams, D.S.; Prausnitz, J.M. Statistical Thermodynamics of Liquid Mixtures: A New Expression for the Excess Gibbs Energy of Partly or Completely Miscible Systems. AIChE J. 1975, 21, 116–128. [Google Scholar] [CrossRef]
  23. Nelder, J.A.; Mead, R. A Simplex Method for Function Minimization. Comput. J. 1965, 7, 308–313. [Google Scholar] [CrossRef]
  24. Brent, R.P. Some Efficient Algorithms for Solving Systems of Nonlinear Equations. SIAM J. Numer. Anal. 1973, 10, 327–344. [Google Scholar] [CrossRef]
  25. Petrescu, L.; Fermeglia, M.; Cormos, C.-C. Life Cycle Analysis Applied to Acrylic Acid Production Process with Different Fuels for Steam Generation. J. Clean. Prod. 2016, 133, 294–303. [Google Scholar] [CrossRef]
  26. Goodfellow, I.; Bengio, Y.; Courville, A. Deep Learning; MIT Press: Cambridge, MA, USA, 2016. [Google Scholar]
  27. Popescu, M.-C.; Balas, V.E.; Perescu-Popescu, L.; Mastorakis, N. Multilayer Perceptron and Neural Networks. WSEAS Trans. Circuits Syst. 2009, 8, 579–588. [Google Scholar]
  28. Bishop, C.M. Neural Networks for Pattern Recognition; Oxford University Press: Oxford, UK, 1995. [Google Scholar]
  29. Kingma, D.P.; Ba, J. Adam: A Method for Stochastic Optimization. arXiv 2014, arXiv:1412.6980. [Google Scholar] [CrossRef]
  30. Raissi, M.; Perdikaris, P.; Karniadakis, G.E. Physics-Informed Neural Networks: A Deep Learning Framework for Solving Forward and Inverse Problems Involving Nonlinear Partial Differential Equations. J. Comput. Phys. 2019, 378, 686–707. [Google Scholar] [CrossRef]
  31. Ketkar, N. Introduction to Keras. In Deep Learning with Python: A Hands-On Introduction; Springer: Berlin/Heidelberg, Germany, 2017; pp. 97–111. [Google Scholar]
  32. Chubarov, G.; Danov, S.; Brovkina, G. Liquid-Solid Equilibrium in the Systems Acrylic Acid–Water, Acrylic Acid–Acetic Acid, and Methacrylic Acid–Water. J. Appl. Chem. USSR 1978, 51, 1796–1798. [Google Scholar]
  33. Faucon, M.-A. Recherches sur les Mélanges d’Eau et d’Acides Gras; Gauthier-Villars: Paris, France, 1909. [Google Scholar]
  34. Frenkel, M.D.; Chirico, R.D.; Diky, V.; Muzny, C.D.; Kazakov, A.F.; Magee, J.W.; Abdulagatov, I.M.; Kroenlein, K.G.; Diaz-Tovar, C.A.; Kang, J.W. ThermoData Engine (TDE) Version 7.0 (Pure Compounds, Binary Mixtures, Ternary Mixtures, Chemical Reactions) Standard Reference Database 103b; National Institute of Standards and Technology: Gaithersburg, MD, USA, 2012.
Figure 1. Ternary solid–liquid equilibrium (SLE) phase diagram for acrylic acid (1) + water (2) + acetic acid (3) system through polythermal projection using UNIQUAC model. The UNIQUAC parameters are derived from our previous study [11]. Symbols indicate the binary eutectic point (), the ternary eutectic point (), and the thermodynamic boundary (--).
Processes 13 01414 g001
Figure 2. Ternary solid–liquid equilibrium (SLE) phase diagrams illustrating polythermal trajectories under two distribution coefficient conditions: (a) k d i f f = 0.0 and (b) k d i f f = 0.1. The symbols ●, , and denote the product, feed, and liquid-phase compositions, respectively. The phase diagram also marks the binary eutectic point (), the ternary eutectic point (), and the thermodynamic boundary (--).
Processes 13 01414 g002
Figure 3. Ternary solid–liquid equilibrium (SLE) phase diagram illustrating data generation via Latin Hypercube Sampling (LHS). The symbols ●, , and denote the product, feed, and liquid-phase compositions, respectively. The phase diagram also marks the binary eutectic point (), the ternary eutectic point (), and the thermodynamic boundary (--).
Processes 13 01414 g003
Figure 4. Interpolation estimates obtained with 500 training samples for (a) the stand-alone NN and (b) the hybrid NN, illustrating crystallizer temperature, recycle flow, crystallizer feed composition, and product purity.
Processes 13 01414 g004
Figure 5. Interpolation estimates obtained with 3000 training samples for (a) the stand-alone NN and (b) the hybrid NN, illustrating crystallizer temperature, recycle flow, crystallizer feed composition, and product purity.
Processes 13 01414 g005
Figure 6. Extrapolation estimates under a broadened acrylic acid feed composition range of 0.70–1.00 (with water up to 0.25): (a) stand-alone NN and (b) hybrid NN, illustrating crystallizer temperature, recycle flow, crystallizer feed composition, and product purity.
Processes 13 01414 g006aProcesses 13 01414 g006b
Figure 7. Extrapolation estimates under a broadened distribution coefficient ( k d i f f ) range from 0.10 to 0.20: (a) stand-alone NN and (b) hybrid NN, illustrating crystallizer temperature, recycle flow, crystallizer feed composition, and product purity.
Processes 13 01414 g007aProcesses 13 01414 g007b
Figure 8. Extrapolation estimates under a multi-parameter expansion (acrylic acid composition 0.70–1.00, water 0.00–0.25, feed flow 1000–15,000 kg/h, recycle ratio 0.00–0.40, and k d i f f 0.00–0.20): (a) stand-alone NN, (b) hybrid NN, illustrating crystallizer temperature, recycle flow, crystallizer feed composition, and product purity.
Processes 13 01414 g008aProcesses 13 01414 g008b
Figure 9. Interpolation estimates for crystallizer temperature using 3000 training samples under (a) parameter fitted to both binary and ternary solid–liquid equilibrium data, (b) parameters based exclusively on binary solid–liquid equilibrium data, and (c) parameters relying on binary vapor–liquid equilibrium data.
Processes 13 01414 g009
Figure 10. Effect of the distribution coefficient and recycle ratio on product composition, highlighting the feasible operating region for the crystallization process. The colored contours indicate the product flow rate (kg/h) at each ( k d i f f , recycle ratio) operating condition, while the red-labeled lines (crystal purity = 0.995) represent isopleths defining the boundary at which crystal product purity reaches 0.995. Panels (a), (b), (c), and (d) correspond to feed compositions of acrylic acid at 95 wt%, 90 wt%, 85 wt%, and 80 wt%, respectively.
Processes 13 01414 g010aProcesses 13 01414 g010b
Table 1. Parameter ranges considered for sampling and training the neural network models. The target crystal fraction is fixed at 30 wt%.
Input VariableRangeUnit
Feed composition
x a c r y l i c   a c i d 0.8–1.0mass fraction
x w a t e r 0.0–0.16mass fraction
x a c e t i c   a c i d 0.0–0.04mass fraction
Feed flow1000–10,000kg/h
Distribution   coefficient   ( k d i f f ) 0.0–0.1-
Recycle ratio (ζ)0.0–0.3-
Target   crystal   fraction   ( χ t a r g e t ) 30%
Table 2. Interpolation performance using 500 vs. 3000 training samples for selected output variables. The coefficient of determination ( R 2 ) and the root mean squared error (RMSE) are shown for both the stand-alone and hybrid neural network models.
Output Variable500 Samples3000 Samples
(Stand-Alone NN)(Hybrid NN)(Stand-Alone NN)(Hybrid NN)
R2RMSER2RMSER2RMSER2RMSE
Crystallizer temperature0.9890.4260.9970.2230.9940.3141.0000.081
Product flow0.99183.2230.99842.2810.99652.5131.00011.288
Mother liquor flow0.992183.7220.99896.0190.997117.9301.00021.486
Recycle flow0.98177.0250.99345.6800.99250.2411.0009.580
Purge flow0.992152.0730.99876.5440.99794.1471.00020.509
Crystallizer feed flow0.993250.7510.998131.8250.996175.1551.00030.989
Product   composition   x 1 0.9900.0011.0000.0000.9940.0011.0000.000
Product   composition   x 2 0.9820.0011.0000.0000.9910.0001.0000.000
Product   composition   x 3 0.9840.0011.0000.0000.9900.0001.0000.000
Mother   liquor   composition   x 1 0.9940.0051.0000.0010.9970.0041.0000.000
Mother   liquor   composition   x 2 0.9910.0061.0000.0010.9970.0041.0000.000
Mother   liquor   composition   x 3 0.9940.0061.0000.0010.9970.0041.0000.000
Crystallizer   feed   composition   x 1 0.9940.0040.9990.0020.9970.0031.0000.001
Crystallizer   feed   composition   x 2 0.9930.0040.9980.0020.9970.0021.0000.001
Crystallizer   feed   composition   x 3 0.9930.0040.9980.0020.9970.0031.0000.001
Table 3. Extrapolation results under a broadened acrylic acid feed composition range of 0.70–1.00 (with water up to 0.25). Each row lists the coefficient of determination ( R 2 ) and root mean squared error (RMSE) for the stand-alone neural network and the hybrid neural network.
Output VariableStand-Alone NNHybrid NN
R2RMSER2RMSE
Crystallizer temperature0.9790.9140.9940.483
Product flow0.99086.7210.99922.710
Mother liquor flow0.994161.0330.99956.110
Recycle flow0.97976.9650.99728.296
Purge flow0.992151.3620.99948.039
Crystallizer feed flow0.991276.6590.99972.167
Product   composition   x 1 0.9630.0020.9990.000
Product   composition   x 2 0.9570.0020.9980.000
Product   composition   x 3 0.9550.0021.0000.000
Mother   liquor   composition   x 1 0.9930.0091.0000.002
Mother   liquor   composition   x 2 0.9940.0081.0000.002
Mother   liquor   composition   x 3 0.9900.0101.0000.001
Crystallizer   feed   composition   x 1 0.9920.0070.9990.002
Crystallizer   feed   composition   x 2 0.9960.0050.9990.002
Crystallizer   feed   composition   x 3 0.9950.0050.9990.002
Table 4. Extrapolation results under an extended distribution coefficient ( k d i f f ) range from 0.10 to 0.20, lying beyond the original training domain. Each row lists the coefficient of determination ( R 2 ) and root mean squared error (RMSE) for the stand-alone neural network and the hybrid neural network.
Output VariableStand-Alone NNHybrid NN
R2RMSER2RMSE
Crystallizer temperature0.9900.4110.9990.153
Product flow0.99089.7060.99930.654
Mother liquor flow0.993170.4590.99963.888
Recycle flow0.970102.2250.99827.533
Purge flow0.987197.1160.99954.496
Crystallizer feed flow0.993251.5320.99992.362
Product   composition   x 1 0.9680.0021.0000.000
Product   composition   x 2 0.9320.0021.0000.000
Product   composition   x 3 0.9370.0021.0000.000
Mother   liquor   composition   x 1 0.9940.0051.0000.001
Mother   liquor   composition   x 2 0.9920.0061.0000.001
Mother   liquor   composition   x 3 0.9880.0081.0000.001
Crystallizer   feed   composition   x 1 0.9880.0050.9990.002
Crystallizer   feed   composition   x 2 0.9860.0050.9980.002
Crystallizer   feed   composition   x 3 0.9940.0040.9980.002
Table 5. Extrapolation results under a multi-parameter expansion, where acrylic acid composition (0.70–1.00), water (0.00–0.25), feed flow (1000–15,000 kg/h), recycle ratio (0.00–0.40), and k d i f f (0.00–0.20) are all broadened beyond the original training domain. Each row lists the coefficient of determination ( R 2 ) and root mean squared error (RMSE) for the stand-alone and hybrid neural network models.
Output VariableStand-Alone NNHybrid NN
R2RMSER2RMSE
Crystallizer temperature0.9731.0280.9940.498
Product flow0.973233.0780.99861.957
Mother liquor flow0.980466.9140.999112.385
Recycle flow0.893380.1610.980164.496
Purge flow0.987302.8250.99981.968
Crystallizer feed flow0.985575.3080.999172.276
Product   composition   x 1 0.8960.0070.9980.001
Product   composition   x 2 0.8740.0050.9990.000
Product   composition   x 3 0.8720.0050.9970.001
Mother   liquor   composition   x 1 0.9880.0110.9980.004
Mother   liquor   composition   x 2 0.9910.0090.9990.002
Mother   liquor   composition   x 3 0.9860.0110.9990.003
Crystallizer   feed   composition   x 1 0.9700.0130.9980.004
Crystallizer   feed   composition   x 2 0.9900.0070.9980.003
Crystallizer   feed   composition   x 3 0.9870.0080.9980.003
Table 6. Interpolation results (3000 training samples) for the hybrid neural network under three different UNIQUAC parameter sets. Each cell shows the coefficient of determination ( R 2 ) and root mean squared error (RMSE) for the crystallizer temperature.
UNIQUAC Parameter SetR2RMSE (K)
Combined binary and ternary SLE1.0000.081
Binary SLE0.9730.683
Binary VLE−4.2579.508
Disclaimer/Publisher’s Note: The statements, opinions and data contained in all publications are solely those of the individual author(s) and contributor(s) and not of MDPI and/or the editor(s). MDPI and/or the editor(s) disclaim responsibility for any injury to people or property resulting from any ideas, methods, instructions or products referred to in the content.