Article

Pick-Up and Breakage Characteristics of Non-Spherical Particles Using CFD-DEM Coupling

1
Department of Mechanical and Electrical Engineering, Hebei Building Materials Vocation and Technical College, Qinhuangdao 066004, China
2
School of Mechanical Engineering, Yanshan University, Qinhuangdao 066004, China
*
Author to whom correspondence should be addressed.
Processes 2025, 13(5), 1408; https://doi.org/10.3390/pr13051408
Submission received: 2 April 2025 / Revised: 30 April 2025 / Accepted: 2 May 2025 / Published: 5 May 2025
(This article belongs to the Section Particle Processes)

Abstract

:
This study investigates the motion and fragmentation of non-spherical particles in pipeline pneumatic conveying, using gangue particles as the research object. The effects of airflow velocity and particle shape on the picking characteristics, as well as the influence of elbow angle, airflow velocity, particle size, and air pressure on particle crushing, were analyzed through a combination of Computational Fluid Dynamics and Discrete Element Method (CFD-DEM) coupled simulations and experiments. Orthogonal experiments were conducted to determine the optimal combination of parameters for minimizing particle breakage rates and pipeline pressure drops. The results show that the airflow velocity significantly affects the pick-up rate of particles, while particle shape also plays a key role, with higher sphericity resulting in lower pick-up rates. Among the factors influencing particle breakage, airflow velocity has the most pronounced effect, followed by elbow angle and particle size, whereas air pressure has a relatively minor impact. In terms of the pressure drop inside the pipeline, all factors—airflow velocity, elbow angle, particle size, and air pressure—exert considerable influence, with air pressure being the most critical factor. The optimal configuration for minimizing both particle breakage and pressure drop was determined to be an elbow angle of 150°, particle size ranging from 7 to 11 mm, airflow velocity of 20 m/s, and air pressure of 0.4 MPa.

1. Introduction

Gangue particles exist in substantial quantities worldwide and play significant roles across various fields, including their application as materials in engineering construction and the production of chemical products [1,2,3]. In underground tunnel excavation, the pipeline pneumatic conveying method is commonly employed for transporting gangue particles [4,5].
This technique uses airflow energy to transfer fixed particulate materials through a closed pipeline in a controlled manner. Pneumatic transport systems are characterized by their simplicity and ease of use, offering the ability to convey materials through vertical, horizontal, or inclined pipelines. Moreover, these systems can simultaneously perform cooling, heating, airflow classification, and drying operations [6,7]. The key attributes of pneumatic conveying include substantial transport volumes, long transport distances, high transport speeds, and the flexibility to discharge materials freely. However, challenges such as high energy consumption, material degradation, and equipment wear remain [8,9].
The properties of non-spherical particles significantly influence the pneumatic conveying performance. Factors such as shape, scale, and material composition affect the minimum airflow velocity required by the pneumatic system. Non-spherical particle models are frequently developed using 3D scanning and model reconstruction techniques. To start DEM simulation, the corresponding input parameters must be used to implement the contact model. The Hertz–Mindlin with JKR cohesive model is a cohesion contact model that also accounts for the influence of van der Waals forces within the contact zone and allows the user to model strongly adhesive systems, e.g., dry powders or wet materials. The Linear Cohesion model modifies a certain base contact model (e.g., the Hertz–Mindlin) by adding a normal cohesion force. The three models are implemented in EDEM via DEM solutions [10]. Hilton et al. [11] employed Discrete Element Method (DEM) simulations combined with gas flow analysis to demonstrate that particle shape critically impacts flow mode transitions. Spherical or near-spherical particles tend to transition to slug flow at high gas flow rates, whereas non-spherical particles shift toward dilute flow. Kruggel-Emden et al. [12] introduced a DEM-CFD framework to model particles with arbitrary shapes, revealing variations in the pressure drop, particle velocity distribution, rope dispersion, and fluid–particle interactions, all heavily influenced by particle shape. Lu et al. [13] reviewed advancements in the DEM modeling of non-spherical particles, covering aspects such as particle packing, flow dynamics in planar sheets, hopper discharge, and motion in vibrating beds and rotating cylinders. In addition, Lu analyzed two-phase particle flows, including gas–solid fluidized beds and pneumatic conveying systems. Chen et al. [14] studied the flow characteristics of rigid shotcrete materials during pneumatic conveying using numerical simulation and experimental methods, and obtained a linear relationship between the unit pressure drop and gas–solid ratio. Markauskas et al. [15] conducted laboratory tests under various strain conditions, assessing the mechanical and physical properties of materials. They examined the effects of particle stiffness, bond damping, mass flow rate, particle length, and gas inflow velocity, finding that particle stiffness notably influences both vertical pipe trajectories and pressure drop.
The CFD-DEM coupling method has become widely used for simulating pneumatic conveying processes involving non-spherical particles. Sung et al. [16] utilized computational particle fluid dynamics (CPFDs) simulations to study the relationship between particle size distribution and the fluid dynamics of dilute-phase gas transport systems. They observed that increasing the micro powder content decreased the pressure drop and particle velocity per unit length, but increased the particle size distribution’s width and standard deviation. Jägers et al. [17] developed a numerical degradation model based on selection and fragmentation functions to simulate wood particle degradation and fine particle formation during pneumatic conveying. They found particle–wall collisions to be the primary cause of particle fragmentation. Salman et al. [18] conducted numerical simulations on particles in horizontal pipelines, identifying axial resistance, airflow velocity gradients, and lateral spin-induced lift as the main forces influencing particle motion. Alkassar et al. [19] used CFD methods to simulate and analyze the fly ash flow in uniformly sized pipelines during dense-phase pneumatic conveying. Their findings indicated that large particles dominated the dense-phase region, while fine particles governed the dilute-phase region, with an intermediate state bridging these phases. Rajan et al. [20] proposed a two-dimensional, two-fluid model to study gas–solid heat transfer in dilute-phase pneumatic conveying processes, introducing a novel algorithm for solving control equations. Narimatsu et al. [21] investigated how particle size and density affect the fluid dynamics of vertical gas–solid transport, showing that a higher particle density and diameter increase the transition rates between dense and dilute phases.
Particle breakage is a critical factor influencing pneumatic conveying efficiency. Brosh et al. [22] integrated empirical fragmentation functions into CFD-DEM simulations to analyze flow field characteristics and particle breakage during pneumatic conveying. However, limited research addresses the fragmentation of multiple particles under these conditions. Zhou et al. [23] used CFD-DEM simulations to study coal fragmentation, finding that non-spherical aggregates are more prone to breakage. Higher sphericity improved particle aggregation integrity. Kong et al. [24] examined aquaculture pellet feed fragmentation in pneumatic conveying, revealing that higher inlet velocities increased fragmentation rates and energy loss, whereas larger bending radii reduced these effects. Sun et al. [25] employed DEM to investigate the transportation of non-spherical particles in horizontal screw conveyors, showing that particles with larger shape indices were more susceptible to damage during particle–wall collisions.
In conclusion, this study focuses on gangue particles, employing CFD-DEM coupled simulation and experimental methods to investigate the effects of particle morphology and airflow velocity on gangue particle transport. The research also examines how elbow angles, airflow velocities, particle sizes, and air pressures impact particle fragmentation characteristics. Through orthogonal experiments, the study identifies the optimal conditions for minimizing the particle fragmentation rates and pipeline pressure drops, facilitating the low-speed, dense-phase transportation of non-spherical gangue particles.

2. Methodology

2.1. Theoretical Basis

In pneumatic conveying, the state of particles is categorized into translational and rotational states, both of which adhere to Newton’s second law of motion. For any particle i, its state can be expressed mathematically, as shown in Equation (1).
m i v i t = m i g + F D i + F S i + F M i + j = 1 k i F i j I i ω i t = j = 1 k i M i j
In the formula, mi, vi, FDi, FSi, FMi, ki, Fij, Ii, ωi, and Mij are the mass, velocity, drag force, Saffman lift, Magnus lift, collision frequency, resultant force, moment of inertia, angular velocity, and resultant torque of the particles i , respectively, and g is the acceleration due to gravity.
In the pneumatic transportation of solid particles, variations in parameters such as the gas velocity, temperature, and pressure are generally minor. As a result, the gas-phase control equation can be accurately represented using only the mass conservation equation and the momentum conservation equation, while the energy conservation equation can be disregarded. However, to better simulate real-world conditions and enhance the precision and reliability of theoretical analyses, it is often necessary to modify and adapt the gas-phase control equations. Consequently, refining these equations is a crucial step in practical applications.
The gas mass conservation equation ensures that the increase in the mass of a gas unit over a given time is equal to the mass inflow during the same period. This relationship is described mathematically in Equation (2).
ρ a ε a t + ρ a ε a v a = 0
In the formula, ρ a is the gas density, ε a is the gas volume fraction, v a is the gas flow velocity, and is the Hamiltonian factor.
The momentum conservation equation for gas describes the principle of momentum conservation during gas movement. It states that the change in momentum of a gas over time equals the sum of all the external forces acting upon it. When using the Euler–Lagrange bilateral coupling approach, the momentum conservation equation takes the form shown in Equation (3).
ρ a ε a v a t + ρ a ε a v a v a = p a + τ a + ρ a ε a g S
In the formula, p a is the fluid unit pressure τ a is the air flow tension, and S is the interaction force between the gas and solid phases inside the unit.
S = 1 V F D + F S + F M + F B + F p + F τ
In the formula, V is the volume of the gas unit cell, F D , F S , F M , F B , F p , and F τ are the drag force, Saffman lift force, Magnus lift force, Basset force, pressure gradient force, and viscous force exerted on the particles, respectively.
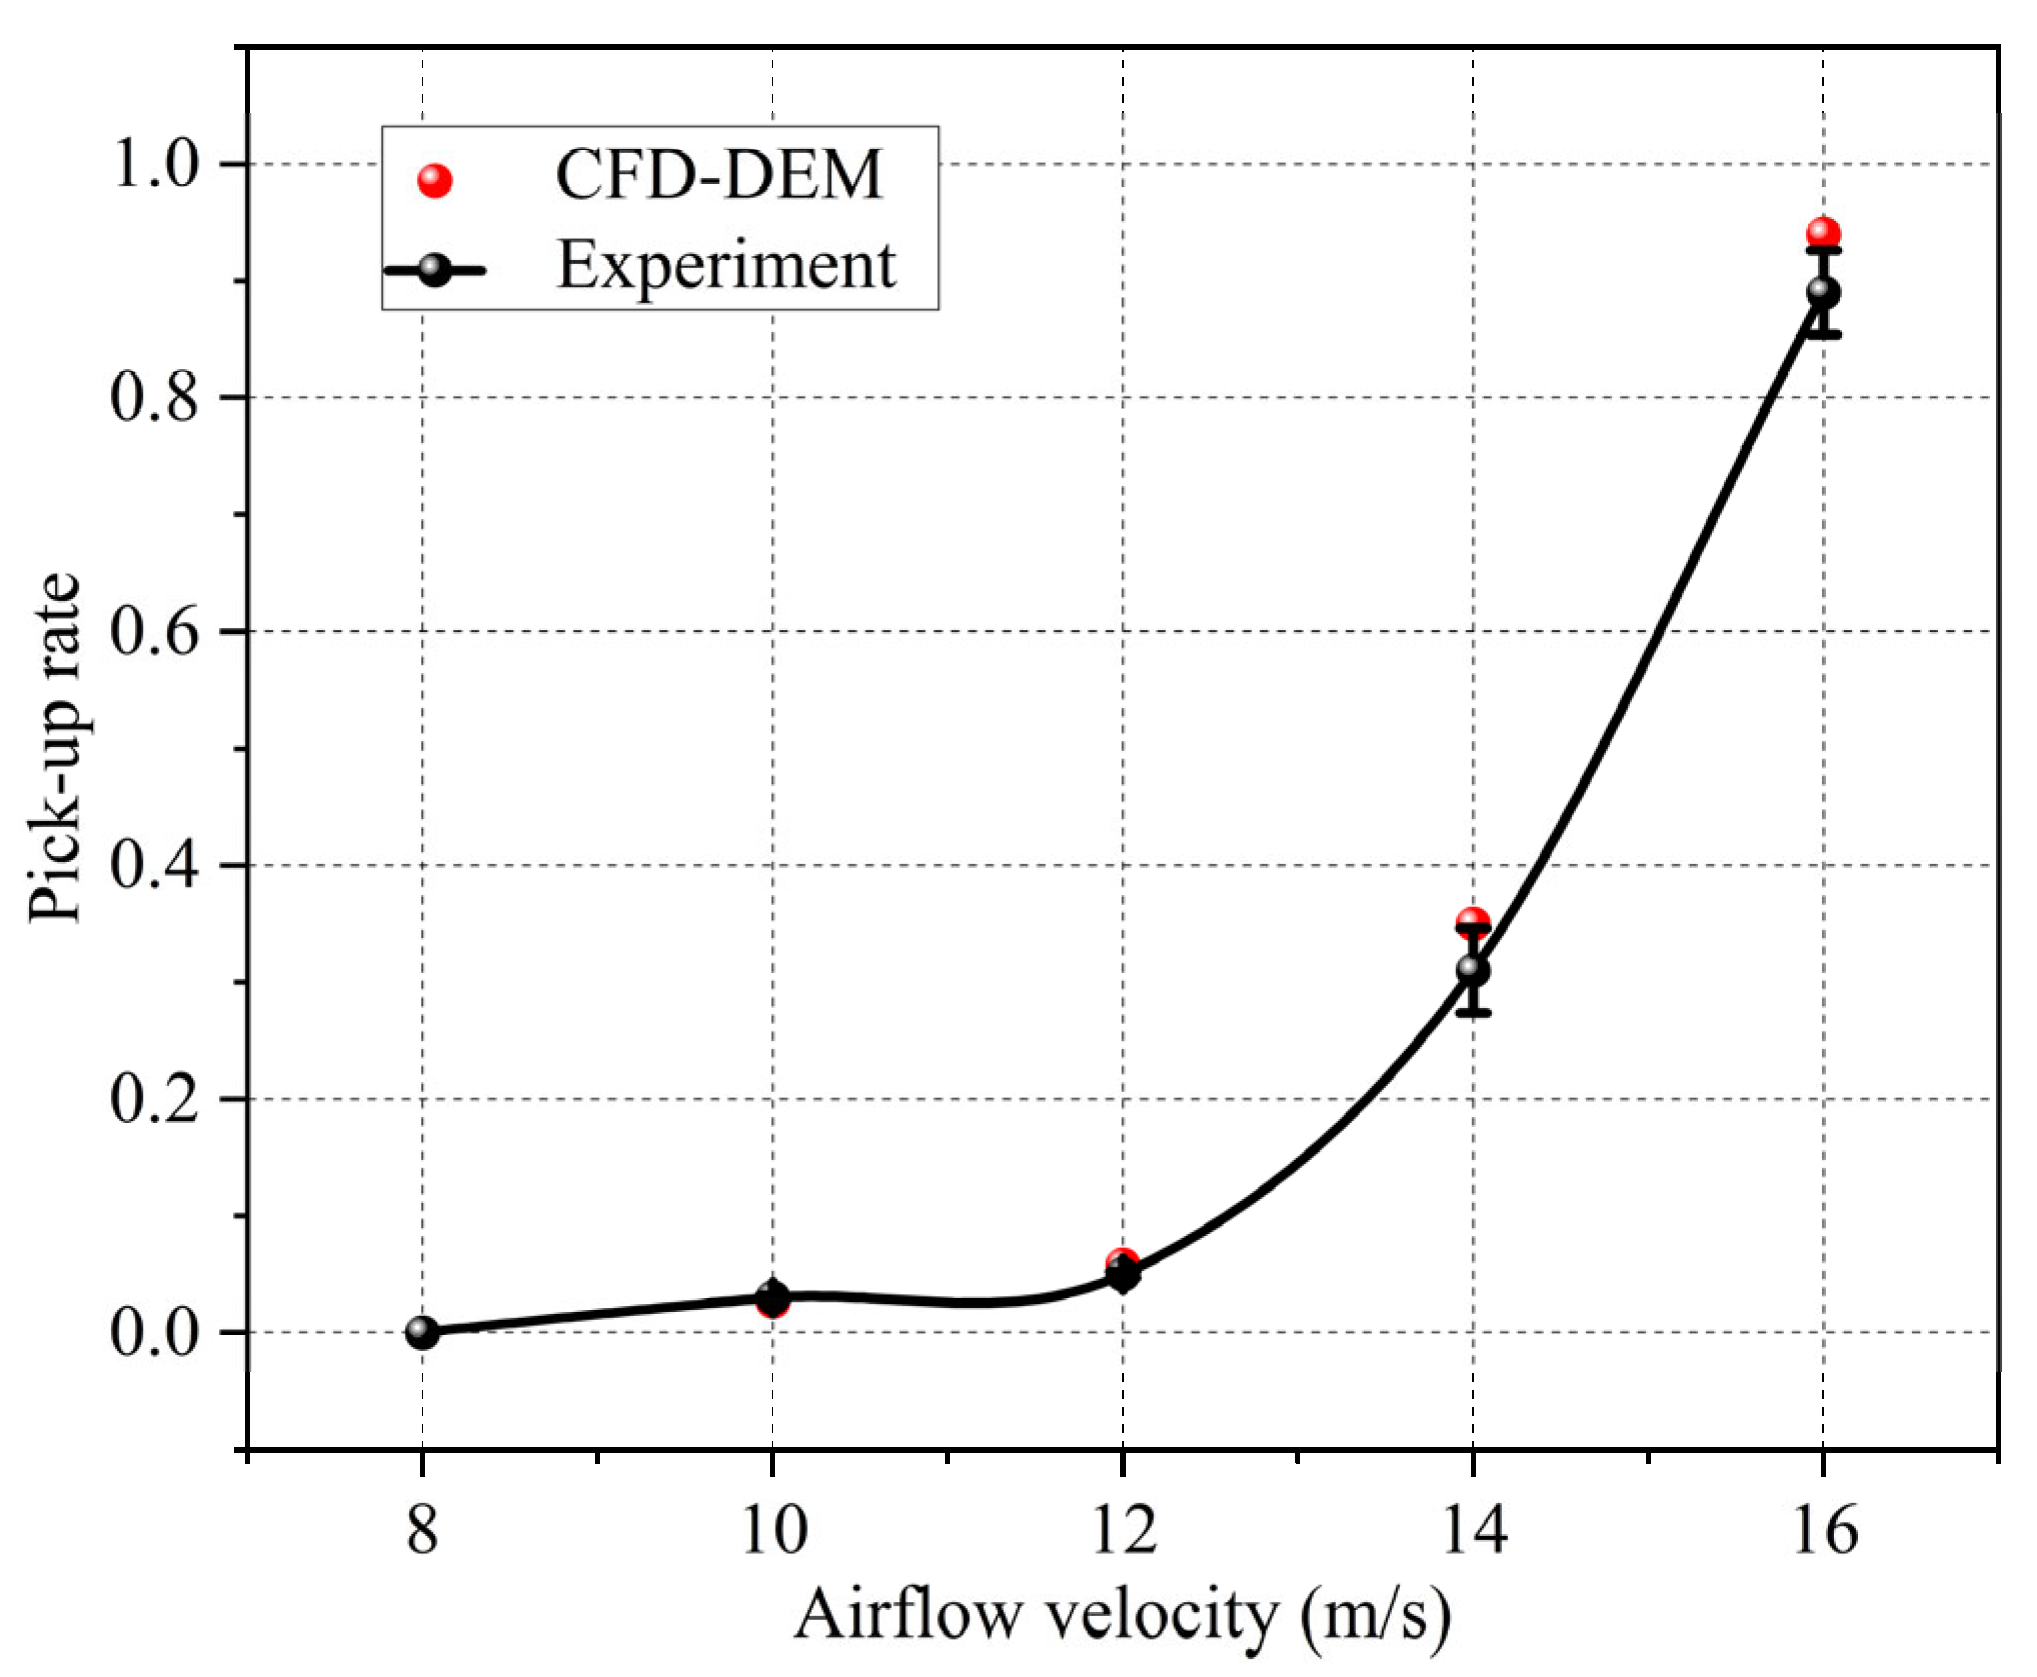
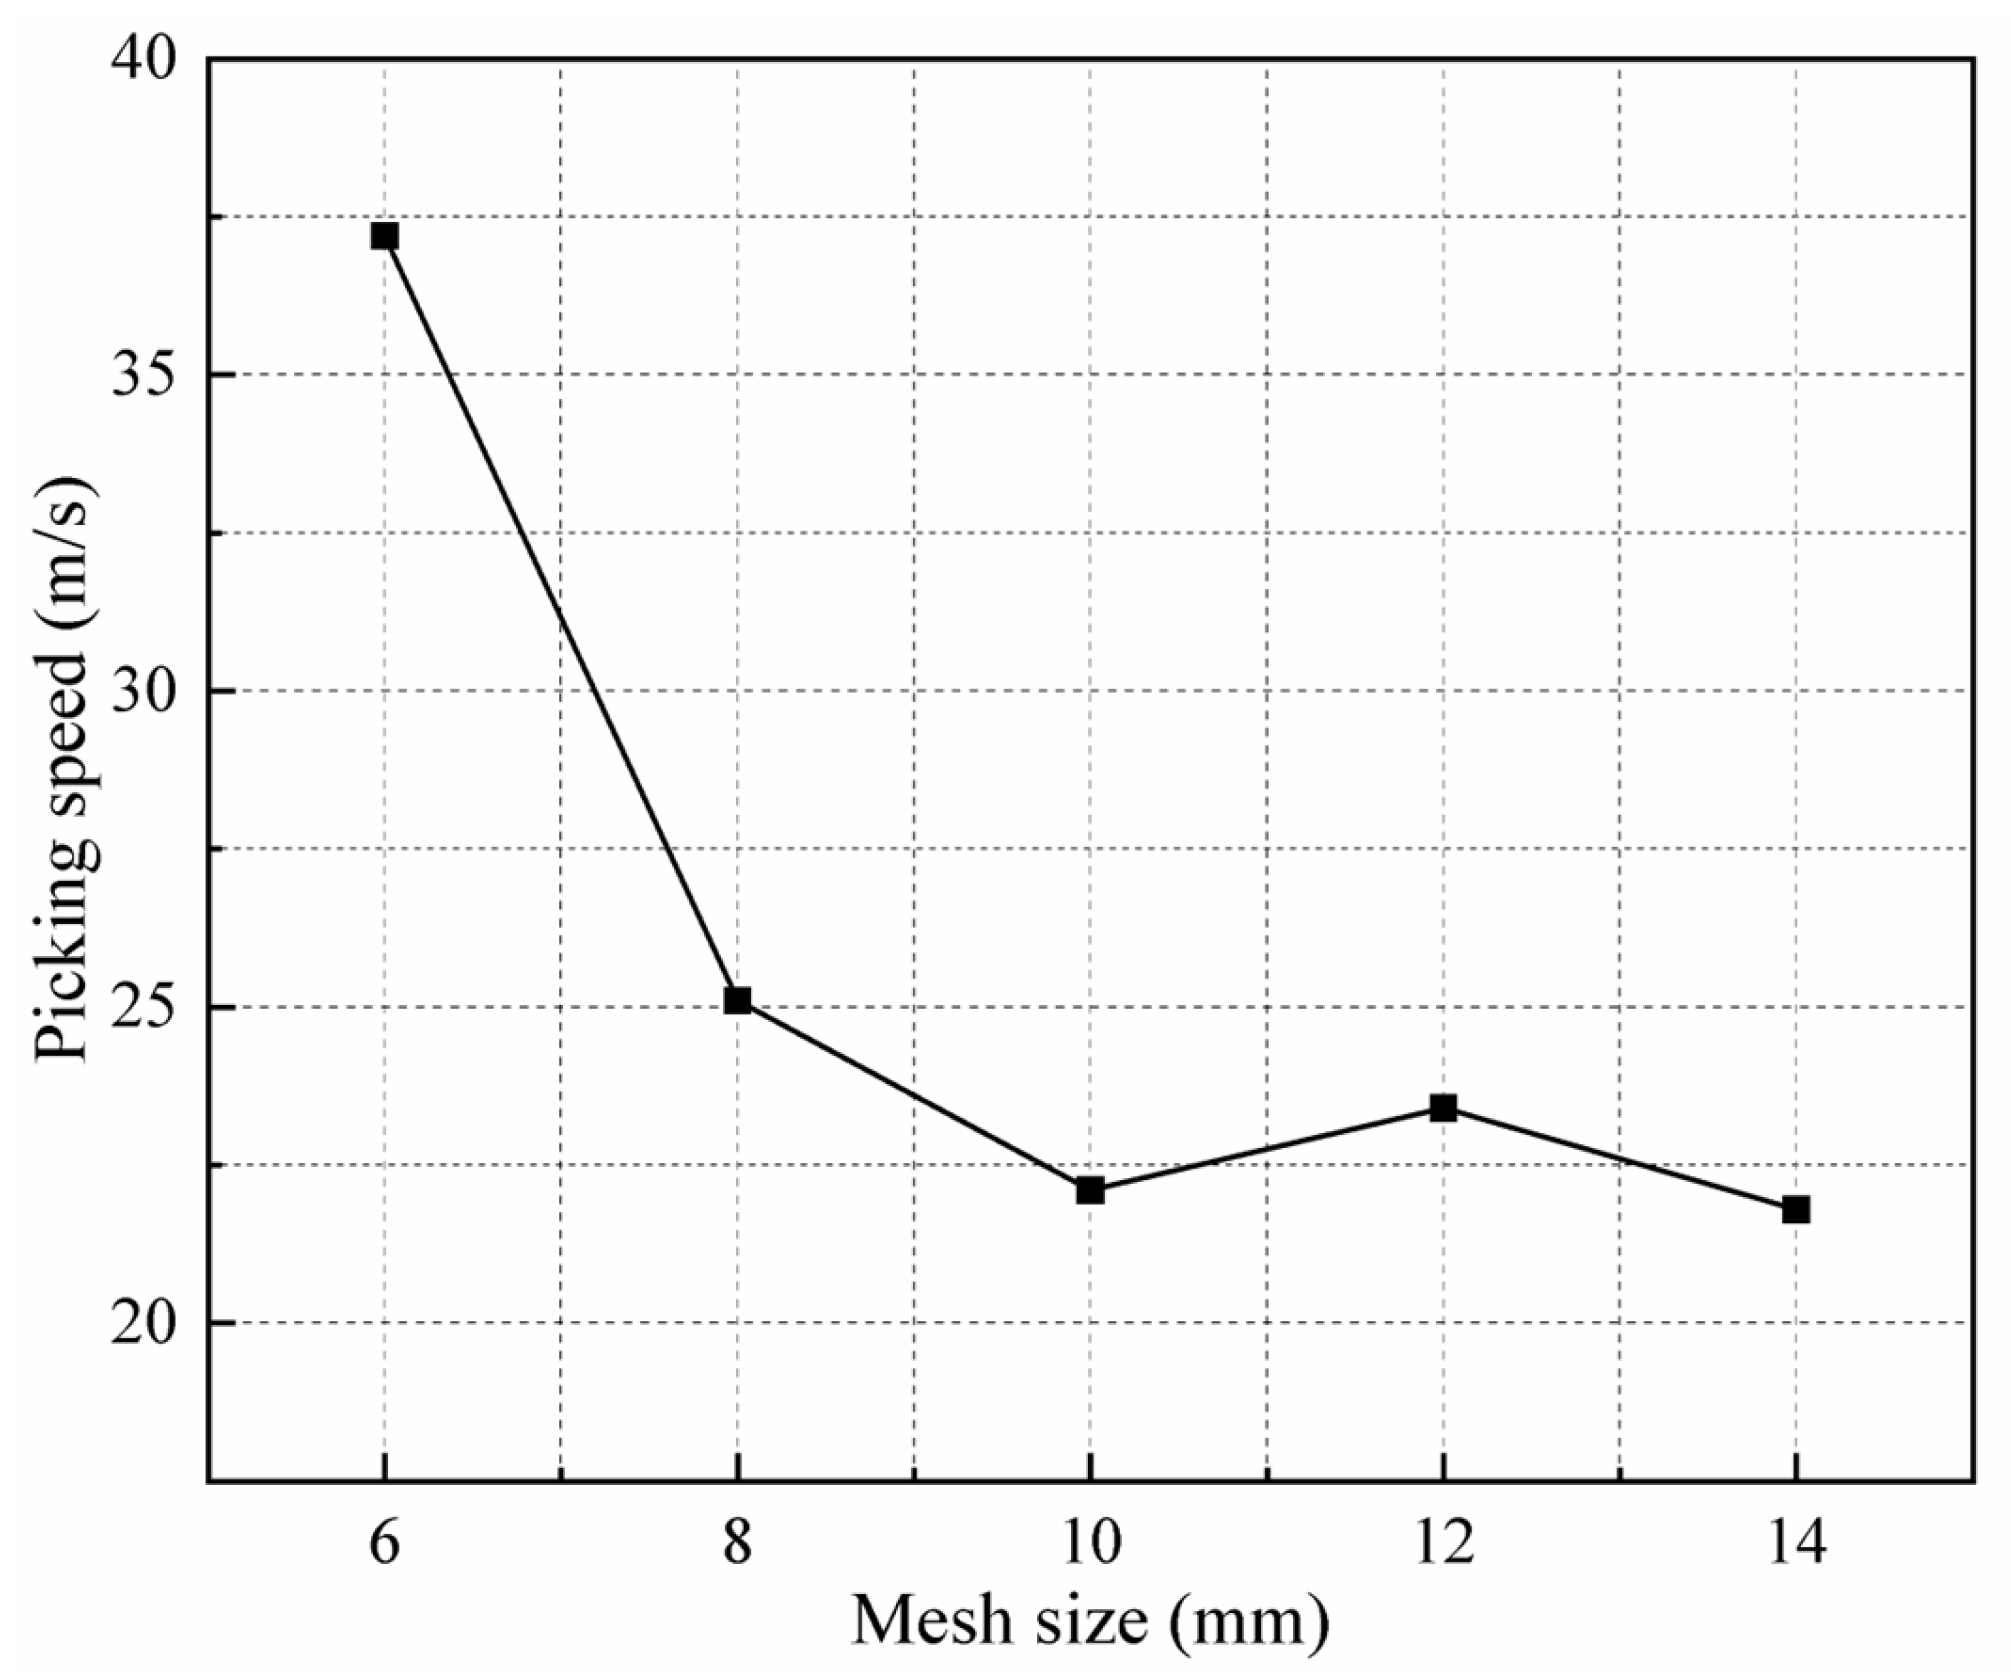
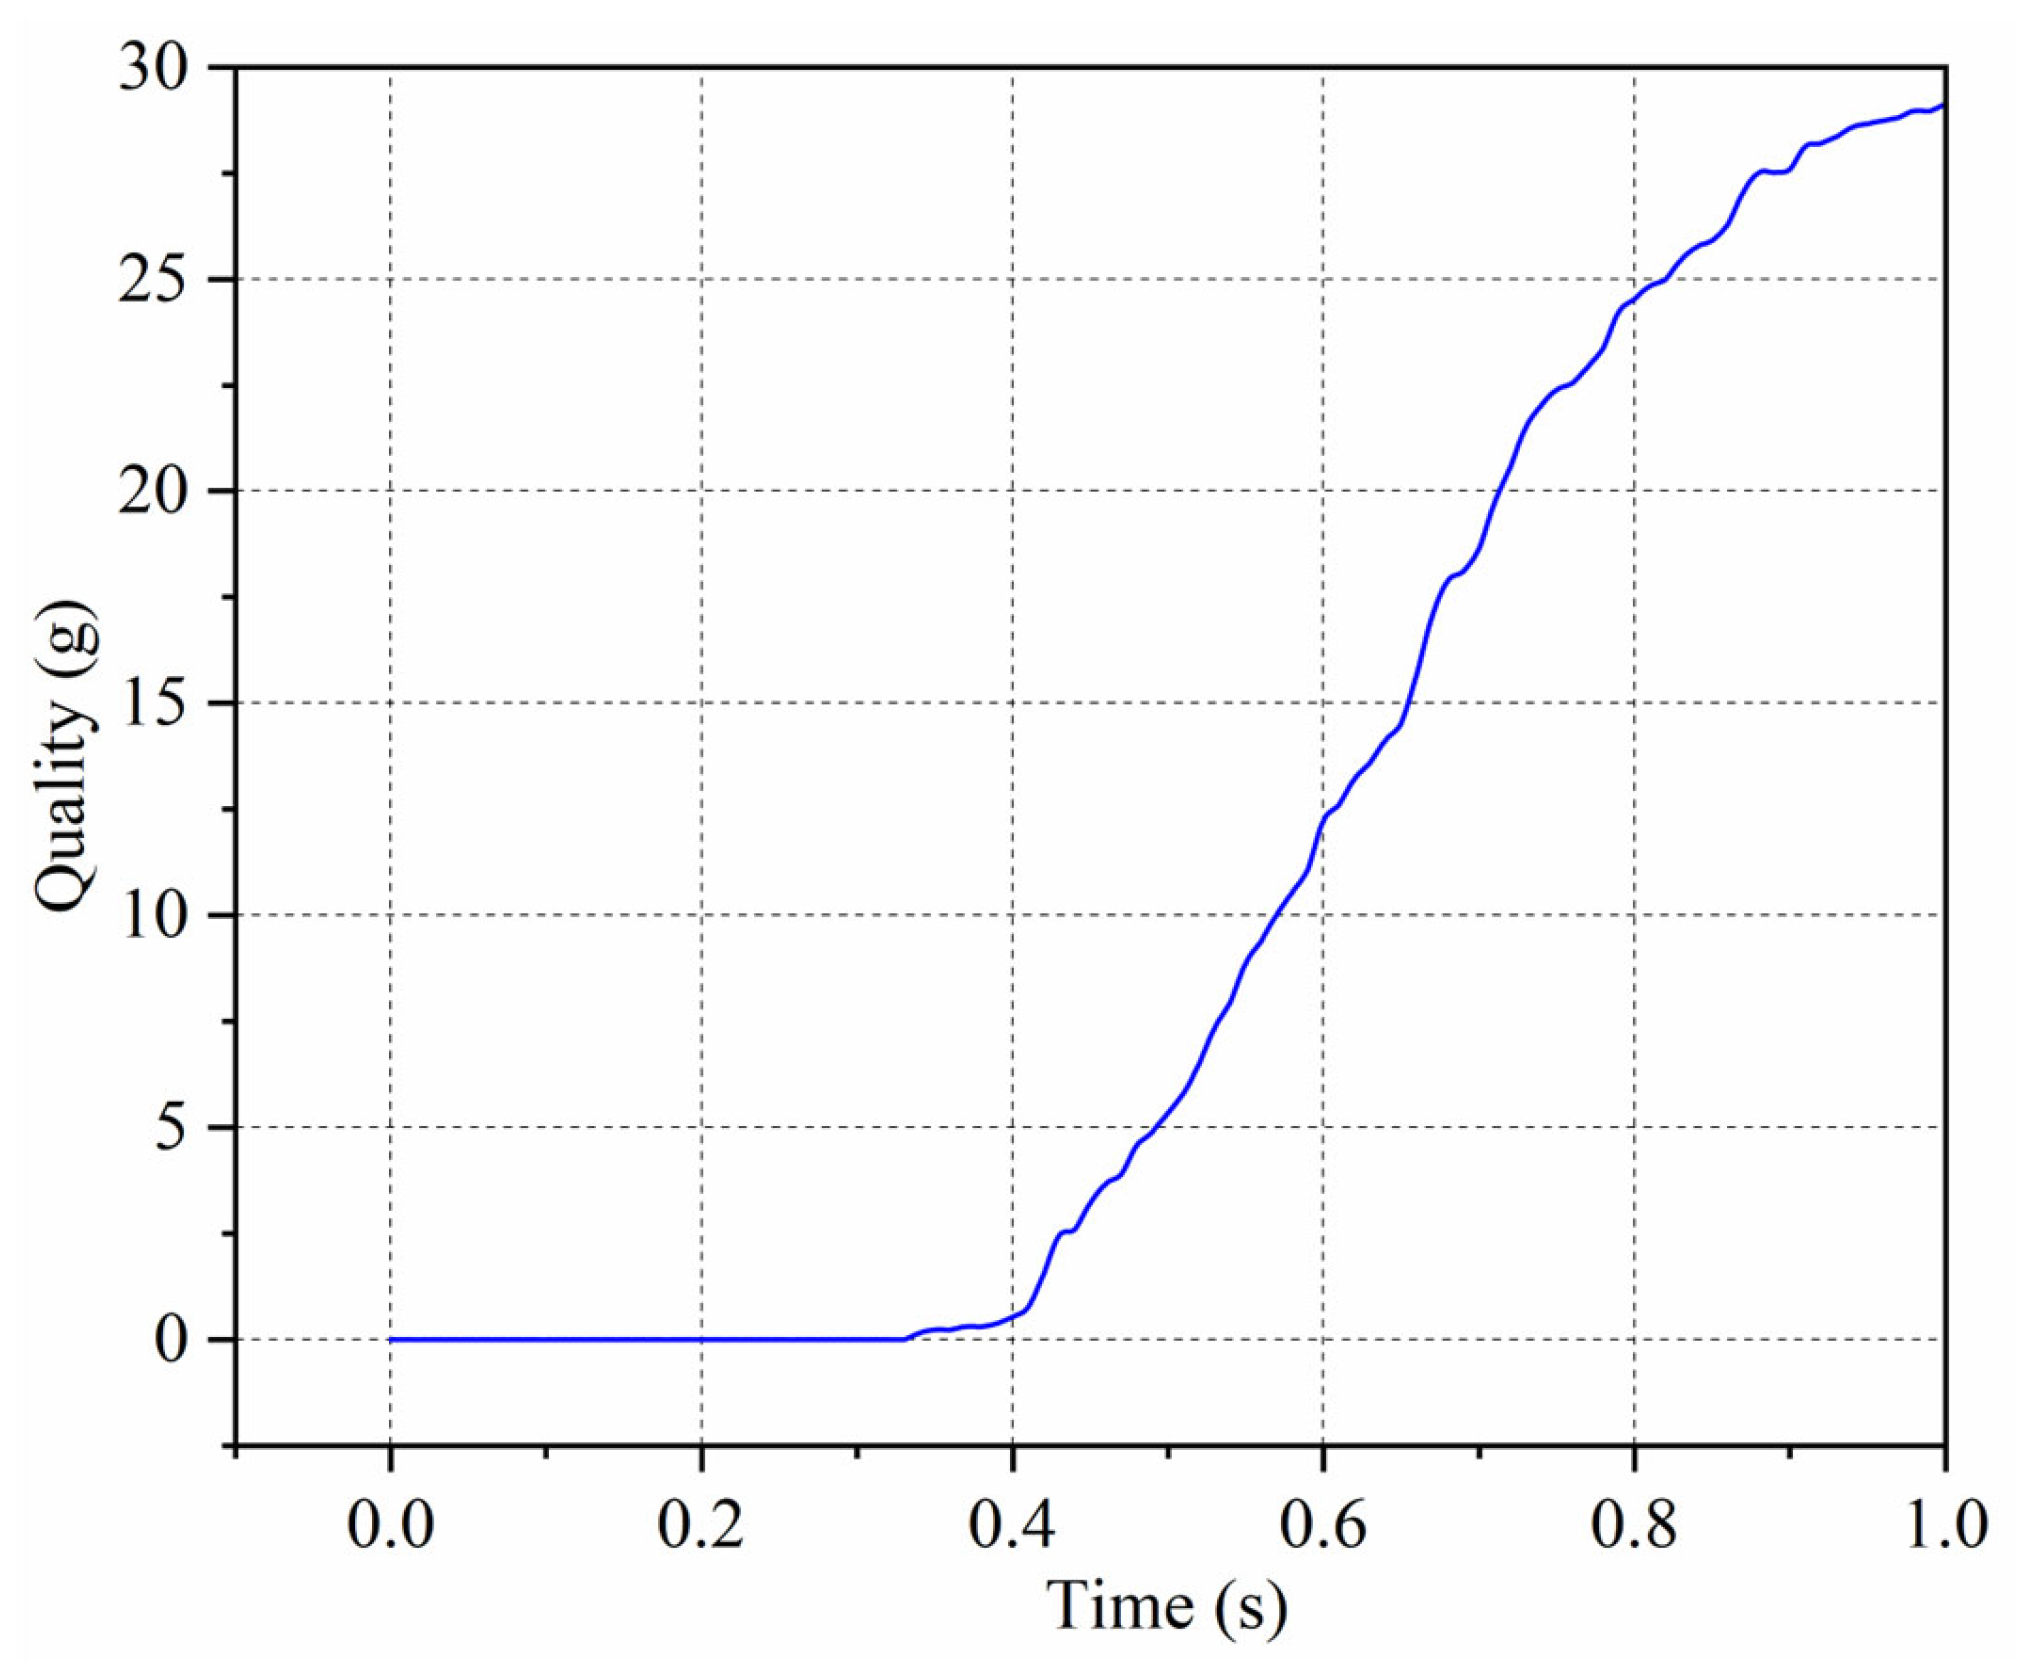
In pneumatic conveying, the airflow velocity significantly influences particle motion. The critical velocity, often referred to as the “picking speed”, is a key metric for assessing the system’s economic efficiency. It is defined as the minimum airflow velocity required for particles to lift and transition from sedimentation to suspension. Studies have shown that factors such as the particle density, particle size, flow field conditions, and pipeline geometry can alter the picking speed.
Kalman et al. investigated various Geldart particles, classifying them into three types based on particle size. They characterized the picking speed of particles with differing materials using modified Reynolds and Archimedes numbers [26,27,28]. For particles of varying sizes, the corrected particle Reynolds number is described in Equation (5).
R e p = 5 ( A r ) 3 / 7 , A r 16.5 R e p = 16.7 , 0.45 < A r < 16.5 R e p = 21.8 A r 1 / 3 , A r 0.45
In the formula, R e p is the modified particle Reynolds number and A r is the modified Archimedes number, where
A r = g d p 3 μ a 2 ρ p ρ a ρ a
In the formula, dp is the particle size and μa is the gas dynamic viscosity.
When the particle size is greater than 0.6 mm, the particles belong to Geldart D-class particles, and their picking speed is shown in Equation (7).
v pu = μ a R e p 1.4 0.8 e D / D 50 1.5 ρ a d p
In the formula, D is the diameter of the test pipeline, D50 = 50 mm.
Selecting the drag force model is crucial for gas–solid coupling. The calculation method for drag force f d is as follows:
f d = V p β u ν p / 1 ε f
where β represents the coefficient of resistance between the gas and solid phases and can be defined as follows:
β = 150 1 ε f 2 μ f ε f d p 2 2 + 1.75 1 ε f ρ f ε f d p u v i ε f < 0.8 3 4 C D 1 ε f ρ f d p u v i ε f ε f 0.8 2.65
where d p is the particle size and C D 
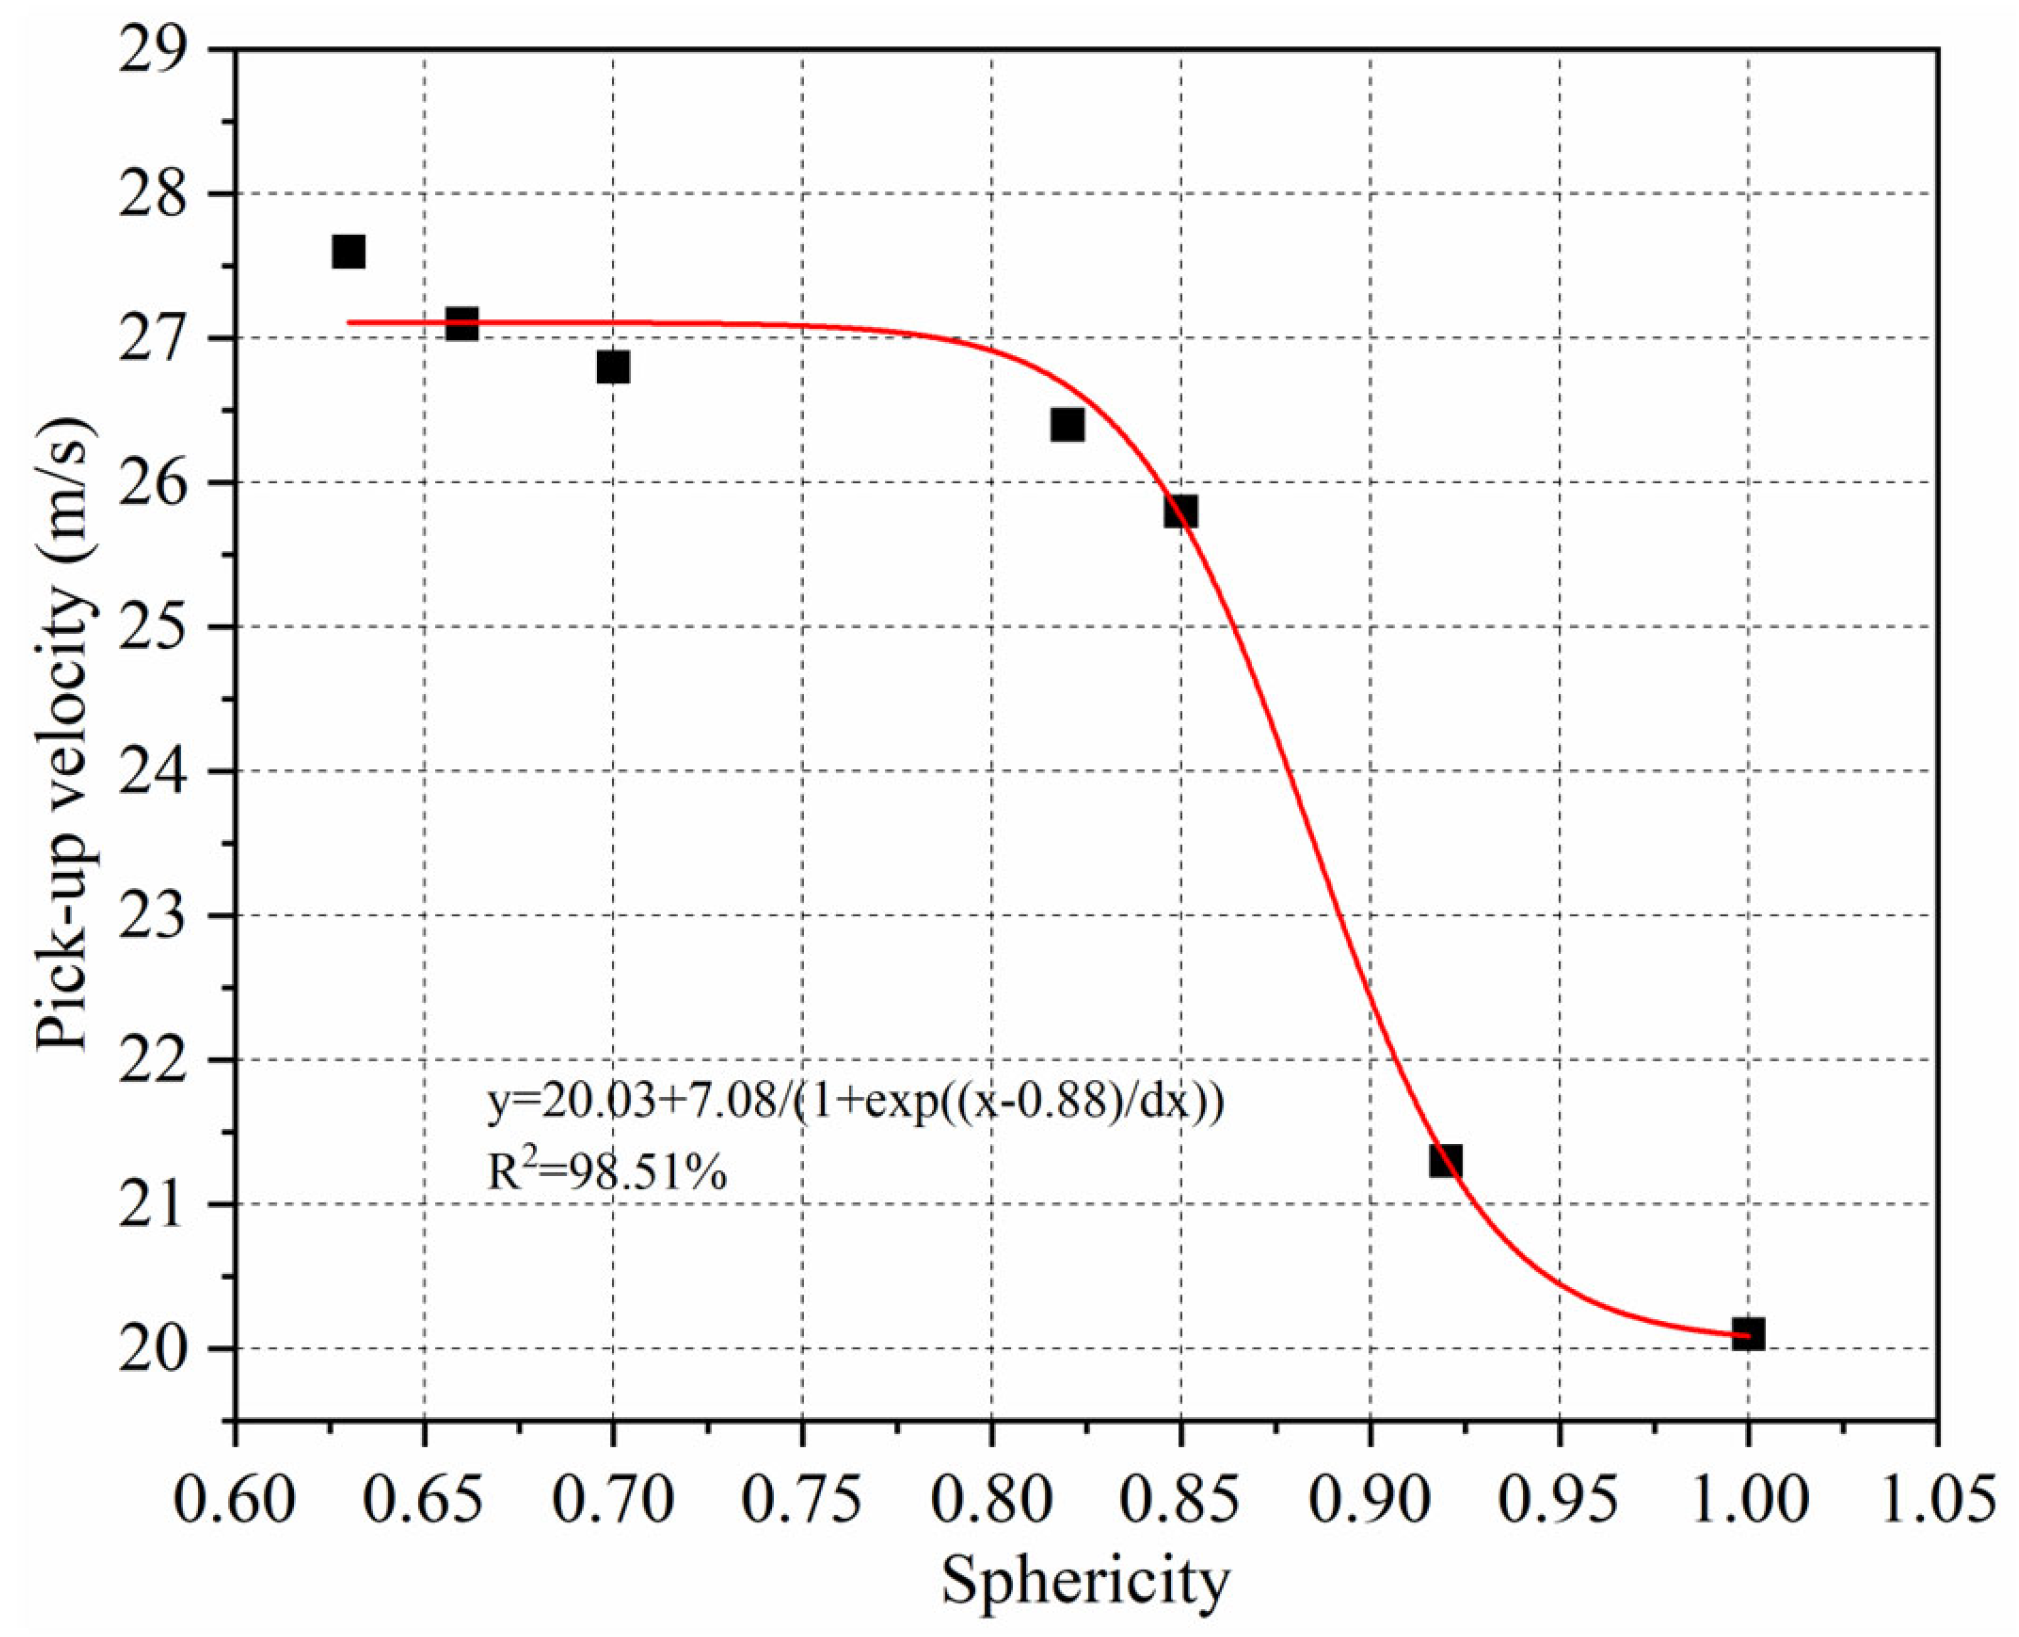
represents the drag coefficient, determining the magnitude of the drag transfer between the fluid and the particle. For non-spherical particles, this work uses the typical correlation proposed by Haider and Levenspiel [29]. The concept of sphericity is used in the correlation to quantify the effect of particle shape as follows:
C D = 24 R e R e B C 1 + D R e
In this formula, the local relative Reynolds number of particle i is represented by R e ε f ρ f d v u v i / μ f , where d v is the equivalent diameter, defined as the diameter of a sphere with the same volume as the corresponding non-spherical particle. The sphericity coefficients A, B, C, and D are given by the following:
A = e x p 2.3288 6.4581 φ + 2.4486 φ 2 B = 0.0964 + 0.5565 φ C = e x p 4.905 13.8944 φ + 18.42222 φ 2 10.2599 φ 3 D = e x p 1.4681 + 12.2584 φ 20.7322 φ 2 10.2599 φ 3
In the formula, φ represent the sphericity.

2.2. Size Characteristics of Non-Spherical Particles

Commonly used particle size and granularity are used to characterize the size of particles. The size of individual particles is represented by the particle size, while the size of particle populations is represented by the particle size.
(1)
Particle size of non-spherical particles
For particles with regular shapes, the particle size is often represented by their characteristic size. Spherical shapes are the simplest to analyze geometrically and physically. In theoretical studies, non-spherical particles are often approximated as spheres, with the spherical equivalent diameter being the most frequently employed parameter. Depending on the context, this equivalent diameter can be defined in terms of volume, specific surface area, drag, free fall, or other criteria, as detailed in Table 1.
(2)
Particle size of non-spherical particles
When analyzing the pneumatic conveying of non-spherical particles, it is essential to consider particle groups with varying sizes and shapes. Describing such groups involves determining the average particle size and size distribution. Various statistical methods can be used to calculate the average particle size, including the geometric mean diameter, arithmetic mean diameter, peak diameter, harmonic mean diameter, average surface area diameter, median diameter, and average volume diameter.
The choice of statistical method may result in different average particle sizes; therefore, the appropriate method should be selected based on the physical characteristics and specific requirements of the study. By dividing the particle population into several levels and designating the size of any given level as dc, the number of particles in that range nd can be used to calculate the surface area equivalent particle size and volume equivalent particle size for non-spherical particle groups, as shown in Equations (12) and (13).
d es = Σ ( n d d c ) 2 Σ n d 1 2 = Σ ( n d d es ) 2 Σ n d 1 2
d ev = Σ ( n d d c ) 3 Σ n d 1 3 = Σ ( n d d es ) 3 Σ n d 1 3
In the formula, des is the average surface area equivalent particle size of the non-spherical particle group, and dev is the average volume equivalent particle size of the non-spherical particle group.

2.3. Morphological Reconstruction of Non-Spherical Particles

Particle shape can be characterized using images of surface contours or edges. In pneumatic conveying systems, the particle shape directly influences the fluid resistance, as well as particle breakage and pipeline wear. Shape indices commonly include circularity, flatness, aspect ratio, and sphericity. Sphericity, a critical shape index, is defined as the ratio of the surface area of a sphere (with the same volume as the particle) to the particle’s surface area. This measure incorporates two key parameters—particle volume and surface area—both of which significantly affect the motion and dynamic behavior of non-spherical particles in pneumatic flow fields. Accordingly, this study uses sphericity as the primary index to characterize particle shape. The calculation formula for sphericity is provided in Equation (14).
φ = 4 π ( 3 V p 4 π ) 2 3 S p
In the formula, φ , Vp, and Sp represent the sphericity, volume, and surface area of non-spherical particles, respectively.

2.4. Experimental Apparatus

(1)
Experimental materials and screening
This experiment investigated six different particle sizes of gangue particles, ranging from 3–5 mm, 5–7 mm, 7–9 mm, 9–11 mm, and 11–13 mm to 13–15 mm. The filtering process utilized a three-layer mesh linear vibrating screen.
(2)
Experimental equipment
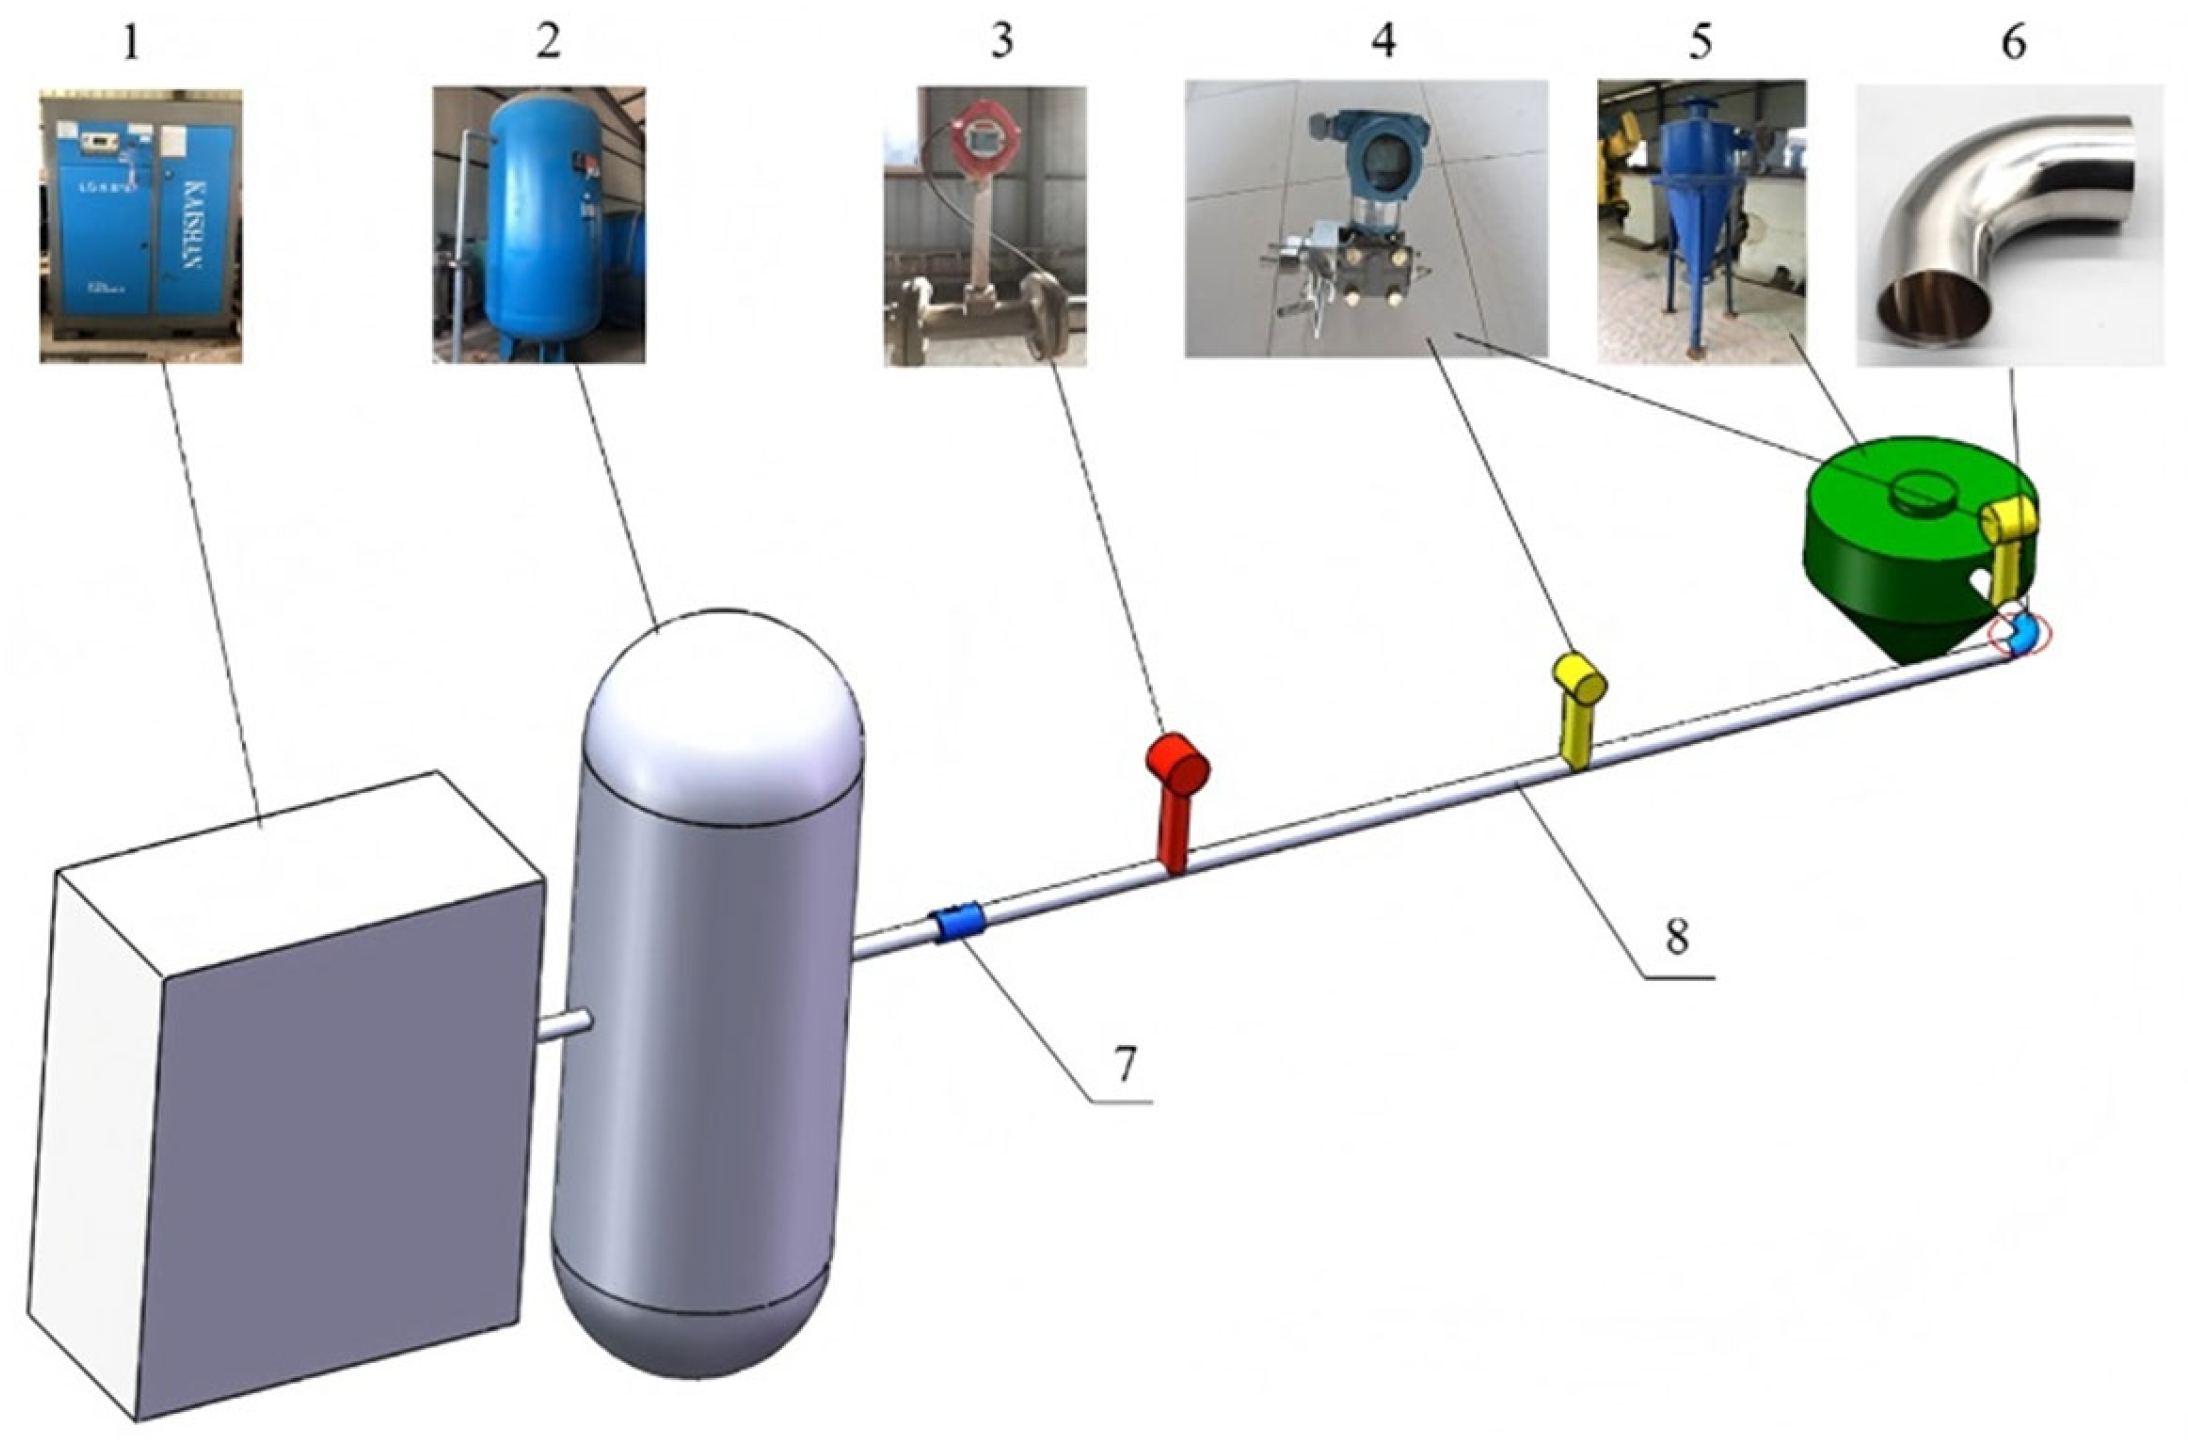
Figure 1 illustrates the pneumatic conveying system employed to study the transport of gangue particles of varying sizes in horizontal pipes. The air source of the experimental system adopts the Kongshan power frequency series screw air compressor, model BK37-8ZG, with a power supply of 37 kW, an air displacement of 6 m3/min, and a maximum supply pressure of 0.8 MPa. Use explosion-proof steel wire hose to connect the air outlet of the air compressor to the air storage tank, in order to stabilize the air pressure and slow down the airflow oscillation caused by the opening and closing of the air compressor. The design temperature of the gas storage tank is 105 °C, the design pressure is 1.1 MPa, the volume is 3 m3, and the flow meter range is 30–380 m3/h. It is equipped with a pressure gauge for measuring the air pressure inside the tank. When its reading is equal to the preset pressure of the air compressor, it represents that the air compressor has completed the current round of inflation and that the airflow has reached stability. The flow meter is SENLOD’s LUGB customized pressure output type, with temperature and pressure compensation. The measurement range is 35–380 m3/h, and its dial displays the cumulative flow rate and instantaneous flow rate. By reading the instantaneous flow rate, the instantaneous wind speed before particle feeding can be calculated.
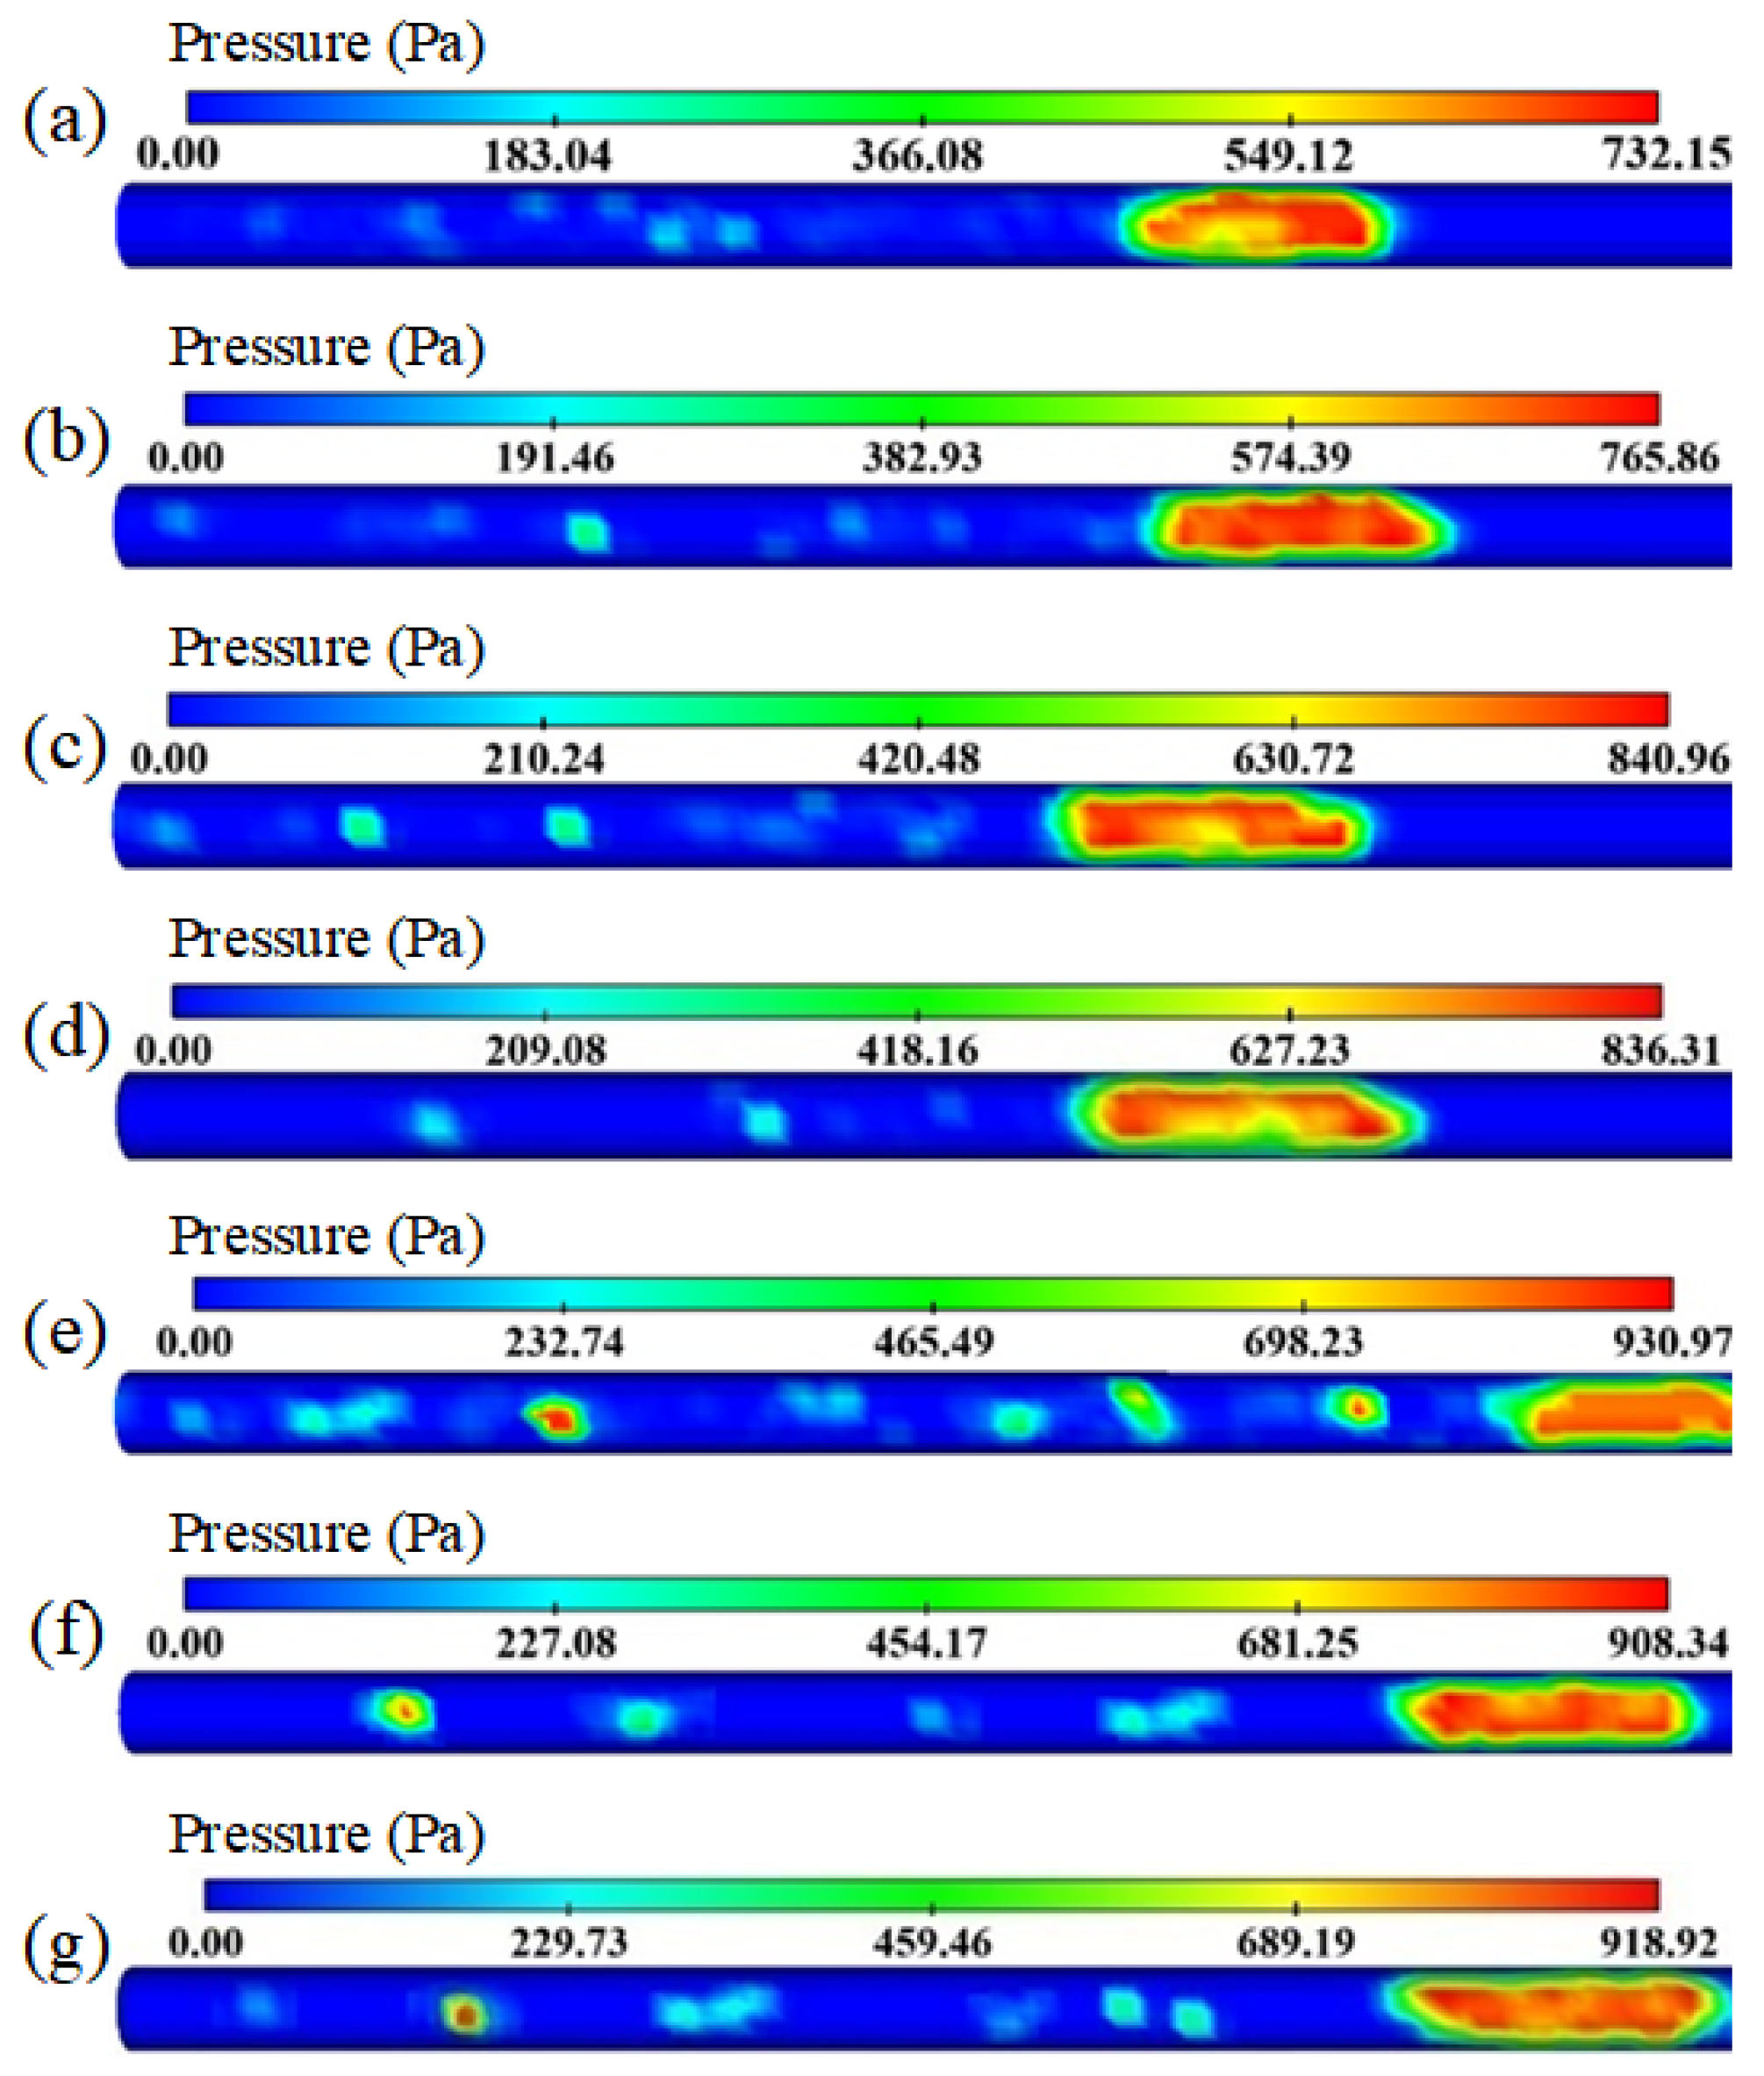
The position between the flowmeter and pressure transmitter is equipped with a Canon EOS R10 camera with a frame rate of 120 fps, used to observe the flow state of particles. A pressure gauge is installed at 20D to record the relationship between particle picking and pressure fluctuations, and to determine the pressure loss pattern of pneumatic conveying. The end of the conveying pipeline is a cyclone separator used to collect particles, weigh them, and calculate the picking rate.
The flowmeter and pressure transmitter are powered by a 24 V DC power supply and both output pressure signals. Their output terminals are connected to the Altay USB 3202N signal collector, which can be driven by the collector and computer to monitor the flow and pressure signals of the flow field in real time.
To prevent pipeline blockages, the pipeline’s inner diameter was chosen to be at least three times the size of the largest non-spherical particles, resulting in a conveying pipe with a 50 mm inner diameter. To stabilize the airflow measurement by the flowmeter, the distance between the flowmeter and the air valve was set to 50 times the pipe diameter (50D). The total length of the acrylic pipe from the flowmeter to the cyclone separator was 60D.

3. Results and Discussion

3.1. Influence of Airflow Velocity on Particle Picking Characteristics

The airflow velocity is a critical factor influencing particle movement. In this study, non-spherical particles were categorized by size, and experiments were conducted to assess the effects of airflow velocity on particle picking behavior.
Figure 2 depicts the selection of gangue particles sized 3–5 mm within an acrylic tube under a 16 m/s airflow velocity, as well as the picking behavior of non-spherical particles simulated numerically. The comparison shows a strong correlation between the experimental and simulated flow patterns, validating the accuracy of the CFD-DEM model in describing the gangue particle flow characteristics. Various particle sizes were tested by introducing air at different velocities to analyze the collection behavior across sizes.
Figure 3 presents the collection results for gangue particles sized 11–13 mm. The data show that no particle picking occurred at airflow velocities below 8 m/s. At 8 m/s, the airflow force was insufficient to overcome the friction between particles and the pipe wall, resulting in a picking mass and rate of 0 g and 0%, respectively. As the airflow velocity increased beyond 8 m/s, the particles began lifting, indicating that the applied force exceeded the resisting frictional forces.
Figure 4 provides a pressure cloud map illustrating the forces exerted by the gas on particle clusters at an airflow velocity of 10 m/s. F1 and F2 represent the forces applied by the airflow, while Ff represents the frictional force exerted by the pipe wall. At this velocity, the picking mass reached 15 g, with a picking rate of 3%. Although the airflow caused some particles to lift from the cluster, the gas velocity was insufficient to mobilize the remaining particles. This outcome suggests that the friction between particles exceeded the force applied by the airflow. However, when the gangue particles adhere to each other, the airflow is not enough to continue blowing the remaining gangue particles, indicating that the force applied by the airflow at this time is smaller than the frictional force between particles.
From Figure 4, it is evident that the pressure on particle clusters on the windward side of the pipe wall was higher than on the leeward side. This phenomenon occurs because the windward particles experience direct airflow force, while the compressed airflow in the flow area exerts additional squeezing forces, increasing the friction between the particle cluster and the lower pipe wall.
According to Newton’s second law, the frictional force between the windward particle clusters and the pipe wall equals the force exerted by the airflow on the clusters. Because the inter-particle friction exceeds the airflow force, the picking mass eventually stabilizes.
Table 2 summarizes the picking rates for particles of different sizes as airflow velocity increases. For gangue particles sized 3–5 mm, the picking rate increased marginally (1.5%, 1.05%, and 2.3%) when the airflow velocity rose from 8 m/s to 14 m/s. However, a sharp increase (20.65% and 21%) was observed when the velocity rose from 14 m/s to 18 m/s. Particles of other sizes exhibited similar trends. These results indicate that the initial growth in picking rates is slow during the early stages of increasing the airflow velocity. However, as the airflow velocity continues to rise, the growth rate of picking accelerates significantly. This finding highlights the substantial influence of the airflow velocity on the picking behavior of non-spherical particles.
To mitigate experimental randomness, the same experiment was conducted on particles of different sizes, with the results summarized in Figure 5. The figure shows that the picking rate of gangue particles exhibits a consistent trend across various particle sizes as the airflow velocity changes.

3.2. Influence of Particle Shape on Particle Picking Characteristics

The shape of particles significantly influences the picking characteristics of non-spherical particles in pipelines. Variations in particle shape can alter the picking speed; however, finding naturally occurring non-spherical particles with identical shapes is highly challenging. To address this, numerical simulation methods were employed to study the effects of particle shape on picking behavior.

3.2.1. Model and Parameter Settings

(1)
Creation of Non-spherical Particle Model
Using modeling techniques, non-spherical particles of various shapes were generated, as outlined in Table 3. Models 2 through 7 represent six distinct non-spherical particle shapes, while model 1 represents a spherical particle used as a reference for comparison. The radius of model 1 was set to 2 mm, yielding a volume of 3.35 × 10⁻⁸ m3, calculated using EDEM 2022 software. The other six non-spherical particle models were designed to match this volume.
(2)
Creation of a Container Model
A straight pipe model measuring 1.5 m in length and 50 mm in diameter was created in SolidWorks 2022 and imported into Workbench for mesh generation. A hexahedral mesh with a grid size of 10 mm, appropriate for particles of approximately 4 mm in diameter, was selected. The generated mesh was then imported into EDEM, where a cube collector was positioned at the pipeline outlet. The study on mesh independence is shown in Figure 6. As shown in the figure, selecting a 10 mm mesh can ensure the accuracy of the experimental results and improve simulation efficiency.
To avoid obstructing the airflow, the collector was configured with an open top, as depicted in Figure 7. The top surface of the collector and its interface with the straight pipe were removed, and a surface slightly lower than the cube’s side length was added on one side of the straight pipe to ensure the ventilation and proper collection of non-spherical particles.
(3)
Numerical study of boundary conditions
A CFD-DEM coupling method was employed for simulation. Particle clusters were stacked in EDEM, while the inlet air velocity was specified in Fluent. In the CFD calculations, pressure solvers and transient simulations were utilized. Turbulence effects were accounted for using the Realizable kε model. The CFD time step is set to 1 × 10⁻⁴ s, and the DEM time step is set to 1 × 10⁻⁶ s. This can not only capture the transient collisions of particles, ensuring the authenticity and accuracy of particle motion, but also ensure the synchronization of flow field updates with particle motion. The boundary conditions included a velocity inlet for the gas inlet, a pressure outlet for the gas outlet, and a non-slip condition for the pipe walls. The specific parameters of numerical simulation are shown in Table 4.

3.2.2. Simulation Process

A cylindrical particle factory with a 200 mm length and 50 mm diameter was positioned 400 mm from the pipeline inlet. The factory was set as static, with a particle generation mass of 0.1 kg. For instance, when generating particle 4 (as shown in Table 3), a stationary pile of particle 4 was created, as illustrated in Figure 8.
After connecting EDEM and Fluent, simulations were conducted according to the parameters in Table 3. The airflow velocity required to collect 30% of the particle mass within 1 s was defined as the picking speed. During the simulation, gas was introduced into the pipe, gradually picking up particle 4 and causing it to flow along with the gas, as shown in Figure 9. The movement of particles within the pipeline and collection device is depicted in Figure 10, where particles are seen moving in a cluster-like manner with the airflow.
Through repeated simulations, it was observed that particle 4 reached a collection mass of 30%, as demonstrated in Figure 11. At 1 s, the collector had accumulated 29.1 g of particles, corresponding to an airflow velocity of 25.8 m/s. This velocity was identified as the picking speed for non-spherical particle 4.
Figure 12 highlights the forces exerted by the seven particle types on the pipe wall. Spherical particles exerted the least force, while cylindrical particles exerted the most. The pile positions of spherical, double-spherical, flattened spherical, and three-dimensional particles were generally higher than those of cylindrical particles, non-spherical particle 1, and non-spherical particle 2. Cylindrical particles exhibited the furthest-back pile positions, with the highest peak force on the bottom half of the pipe wall. Conversely, spherical particles showed no such peak force in the latter half of the pipe wall. Because particle shape is not a qualitative variable, sphericity was introduced as a dimensionless parameter to differentiate non-spherical particle shapes while maintaining equivalent volumes. Using EDEM, the surface area and sphericity values for particles 1–7 were calculated for particles with the same diameter but different shapes. The results are summarized in Table 5.
Using the same method, simulations were conducted for non-spherical particles 2, 3, 5, 6, 7, and spherical particle 1. The measured picking speeds at a picking rate of 30% were 21.3 m/s, 26.4 m/s, 27.6 m/s, 26.8 m/s, 27.1 m/s, and 20.1 m/s, respectively. These results revealed that the picking speed of particles varies depending on their shape. To further investigate the differences in picking speeds among non-spherical particles during pneumatic conveying, a uniform airflow speed of 26 m/s and a simulation time of t = 1 s were applied to all seven particle types. The relationship between picking speeds and sphericity for particles 1–7 is summarized in Figure 13.
Figure 13 illustrates that the higher the sphericity of a non-spherical particle—indicating closer resemblance to a sphere—the lower its picking speed. Conversely, particles with lower sphericity, which deviate more from a spherical shape, exhibit higher picking speeds. This demonstrates that sphericity is inversely proportional to picking speed.

3.3. The Influence of Important Factors on Particle Crushing Characteristics

The pneumatic conveying system used to study the impact of various factors on particle breakage characteristics is shown in Figure 1. The system includes an air compressor for gas supply, a compressed air storage tank for stable airflow, a flow meter to monitor gas flow, pressure transmitters to measure pressure changes, a transparent acrylic pipeline for observation, an elbow joint, and a cyclone separator for material collection. Two pressure transmitters were installed—one near the particle pile and the other close to the cyclone separator—and were connected to a computer. The DHDAS V2.3 software recorded the electrical signals from the pressure transmitters.
The air compressor used had a gas production rate of 6.9 m3/min and a maximum airflow rate of 300 m3/h. The gas storage tank was designed to operate at 105 °C, with a pressure limit of 1.1 MPa and a volume of 3 m3. The flow meter range was set between 30–380 m3/h, while the pressure transmitters had a measurement range of 0.4–40 kPa. The pipeline, made of transparent acrylic, had an inner diameter of 50 mm. The distance between the air valve and the flow meter was set to 50D, and the total pipe length from the flow meter to the cyclone separator was 60D.
The gas is generated by an air compressor and stabilizes the airflow through a storage tank. Use two valves, one for controlling the flow and one for preventing backflow. The mass flow rate of gangue particles is 1 kg/s. When the particles are transported to the end of the system, they are classified by the cyclone separator according to particle size.
The particle breakage rate is defined as the proportion of the crushed particle mass after the experiment to the initial particle mass before the experiment.
P b r = m pb m pa m pb
where P b r is the particle breakage ratio, m pb is the initial mass of particles before the experiment, and m pa is the mass of the remaining particles after the experiment.
The pressure drop of the elbow is defined as the static pressure difference between the inlet and outlet of the pipe, which can reflect the energy consumption of the conveying system inside the pipe.
Δ P = P i n P o u t
where Δ P is the elbow pressure drop, and P i n and P o u t are the pressures of the elbow inlet and outlet, respectively.
The key factors influencing pneumatic conveying include the elbow angle (α), particle size (d), airflow velocity (va), and air pressure (Pa).
To optimize particle collection while minimizing energy consumption, airflow velocities of 20 m/s, 25 m/s, 30 m/s, and 35 m/s were tested, along with air pressures ranging from 0.4 MPa to 1.0 MPa. Particle sizes were divided into four groups: 7–9 mm, 9–11 mm, 11–13 mm, and 13–15 mm. Common elbow angles of 90°, 120°, 135°, and 150° were selected, as shown in Figure 14.
The specific experimental factors and levels are shown in Table 6.
To ensure accurate results, the orthogonal experimental method was employed. Table 7 outlines the design of the orthogonal experiments, incorporating the elbow angle, particle size, airflow velocity, and air pressure as factors. According to the standards of the orthogonal experimental method, each experimental factor is set at four levels. These factors are combined with the horizontal arrangement through an orthogonal table to obtain an L16 (45) orthogonal experimental scheme. The intersection points of each factor and different levels in Table 5 represent the selected values of this factor in this scheme. According to the requirements of orthogonal experiments, set a separate column to represent experimental error (E), to ensure the consistency and dependability of the experimental outcomes.
To minimize errors and randomness, each experiment was repeated three times, and the average values were calculated. After each experiment, the parameters were adjusted according to Table 7, and the process was repeated. The particle breakage mass was determined by subtracting the mass of unbroken particles from the total mass before the test. The particle breakage rate was calculated as the ratio of the broken mass to the total initial mass. The pressure drop, representing energy consumption, was derived from the static pressure difference measured by the two transmitters. The pressure drop was calculated using the relationship 10 mV = 1 kPa.
The particle breakage rates (Pbr) and pipeline pressure drops (ΔP) obtained from the orthogonal experiments are shown in Table 8.

3.3.1. Particle Breakage Rate

Table 9 presents the range analysis results, where kj represents the average test result corresponding to various factors and different levels j (j = 1, 2, 3, 4), and the range R quantifies the influence of each factor. A larger R value indicates a more significant impact on the experimental outcome. The maximum R value for airflow velocity (4.21) highlights its dominant influence on particle breakage during pneumatic conveying. The factors influencing the particle breakage rate are ranked as follows: airflow velocity > elbow angle > particle size > air pressure. Based on these findings, the optimal conditions for minimizing particle breakage are a 150° elbow angle, particle sizes of 13–15 mm, an airflow velocity of 20 m/s, and an air pressure of 0.8 MPa.
Based on the results obtained from Table 9, plot the relationship curve between different factors and the particle breakage rate, as shown in Figure 15.
Using the data in Table 9, a relationship curve between factors and the particle breakage rate was plotted (Figure 15). The results show that as the elbow angle increases, the particle breakage rate rises from 11.58% to 14.42%.
To further analyze this phenomenon, simulations were conducted by varying the elbow angle while keeping the other variables constant. The airflow velocity was set to 30 m/s, the particle size to 8 mm, and the air pressure to 0.4 MPa. The simulation results are shown in Figure 16.
From Figure 16, it is evident that the maximum force exerted by particles on the pipe wall occurs at a 90° elbow angle. As the elbow angle increases, the force gradually decreases, with the peak force position consistently located at the pipeline’s elbow. The peak force is most pronounced at a 90° elbow angle, while almost no peak force is observed at a 150° elbow angle.
To determine which factors significantly impact the variation in the particle breakage rate, analysis of variance (ANOVA) was conducted on the orthogonal experimental data. The analysis calculated the sum of squared deviations (SS), degrees of freedom (DF), mean square (MS), statistical measure (F), and significance (p) values. A p-value less of than 0.05 indicates a significant effect, with smaller p-values indicating stronger influence. The formula for SS is given in Equation (11):
S j = K 1 2 + K 2 2 + K 3 2 + K 4 2 m i = 1 n y i 2 n
In the formula, Kj is the sum of the variable values corresponding to the level of factor j, where j = 1, 2, 3, and 4; yi is the variable number sought; m is the factor level number; and n is the number of schemes.
The variance results of the factors affecting the particle breakage rate obtained through calculation are shown in Table 10.
The variance results are presented in Table 10, showing that the airflow velocity (p = 0.007) is the most significant factor affecting the particle breakage rate, followed by the elbow angle (p = 0.02) and particle size (p = 0.04). The air pressure (p = 0.362 > 0.05) has a negligible effect.
The findings reveal that a lower airflow velocity reduces the impact force of particles on the pipe wall, thereby decreasing particle breakage. In addition, increasing the elbow angle reduces the frequency and intensity of particle–wall collisions, further minimizing breakage. Consequently, special attention should be given to the airflow velocity, elbow angle, and particle size when evaluating particle breakage rates.

3.3.2. Pressure Drop Inside the Pipe

Table 11 summarizes the range analysis results for pressure drop in the orthogonal experiments. The largest range value, 1.52, corresponds to air pressure, indicating its dominant influence on pressure drop. The ranking of factors influencing pressure drop is as follows: air pressure > airflow velocity > particle size > elbow angle. Thus, the optimal configuration to minimize the pressure drop involves a 90° elbow angle, particle sizes of 7–9 mm, an airflow velocity of 20 m/s, and an air pressure of 0.4 MPa.
Based on the results obtained from Table 11, plot the relationship curve between different factors and the pressure drop inside the tube, as shown in Figure 17.
Figure 17 shows that among the tested elbow angles, the smallest pressure drop (4.64 kPa) occurs at a 150° elbow angle, while the largest (5.54 kPa) occurs at a 90° elbow angle. To better understand this trend, simulations were conducted with constant variables (airflow velocity: 30 m/s, particle size: 8 mm, and air pressure: 0.4 MPa) while varying the elbow angle. The results are shown in Figure 18.
From Figure 18, it is observed that at a 90° elbow angle, the particle velocity decreases significantly at the elbow. As the elbow angle increases, fewer particles experience velocity drops, and the overall particle pile velocity rises.
The variance analysis was also conducted on the pressure drop values obtained from the orthogonal experiment, and the results are shown in Table 12.
Variance analysis of the pressure drop values (detailed in Table 12) confirms that all four factors have significant effects (p < 0.05). However, the air pressure, with the smallest p-value, is the most influential. Reducing the air pressure decreases particle–wall collisions, thereby lowering both the pressure drop and particle breakage. The particle size, airflow velocity, and elbow angle also play significant roles and should be considered in system design.
Based on the above conclusions, it is evident that the airflow velocity, elbow angle, and particle size significantly impact the particle breakage rate, while the elbow angle, particle size, airflow velocity, and air pressure all have a notable effect on the pressure drop within the pipe.
When the elbow angle is set to 150°, both the particle breakage rate and pressure drop reach their minimum values. Thus, if the primary consideration is particle integrity, without regard to economic or spatial constraints, a 150° elbow angle is the optimal choice.
Exceeding a specific range of airflow velocity increases the particle breakage rate. At an airflow velocity of 20 m/s, both the particle breakage rate and the pressure drop inside the pipeline are minimized, while particles are still effectively picked up. Therefore, 20 m/s is the ideal airflow velocity.
In the orthogonal experiments, the optimal particle size for both evaluation metrics was determined to be 7–9 mm. In addition, when transporting particles of 9–13 mm, the pressure drop in bent pipes increased by only 0.08%. However, the crushing rate for particles sized 11–13 mm increased by 1.32% compared to particles sized 7–9 mm, whereas the increase for particles sized 9–11 mm was only 0.18%. Considering these findings holistically, selecting a particle size of 7–11 mm is recommended for balancing economic efficiency and minimizing increases in the breakage rates and pressure drops.
Lower air pressure can extend the service life of pipelines by reducing wear and tear. At an air pressure of 0.4 MPa, both the particle breakage rate and the pressure drop are minimized, with no pipeline blockages observed. Thus, 0.4 MPa is the preferred air pressure setting.
In summary, the optimal configuration for pneumatic conveying, derived from comparative analysis, is an elbow angle of 150°, a particle size range of 7–11 mm, an airflow velocity of 20 m/s, and an air pressure of 0.4 MPa.

4. Conclusions

This study investigates the effects of the airflow velocity and particle shape on picking characteristics, as well as the influence of the elbow angle, airflow velocity, particle size, and air pressure on particle breakage and pressure drop. The key conclusions are as follows:
(1)
Airflow velocity significantly affects the picking of gangue particles. When the airflow velocity increases, the picking amount of non-spherical particles of all sizes initially grows gradually. However, beyond a certain threshold, the picking amount increases sharply;
(2)
The particle shape also impacts the picking of non-spherical particles. The sphericity of non-spherical particles varies with shape, and comparative experiments reveal that higher sphericity corresponds to lower picking speeds;
(3)
Using the orthogonal experimental method, this study examined particle breakage rates and pipeline pressure drops under varying parameters, including particle size, flow field conditions, and elbow angle. Variance analysis, combined with experiments and simulations, demonstrated that the airflow velocity, elbow angle, and particle size significantly influence the particle breakage rates, with airflow velocity being the most critical factor. The air pressure has a relatively minor effect on breakage. Conversely, the air pressure has the most significant impact on the pipeline pressure drop, followed by the airflow velocity, particle size, and elbow angle;
(4)
The optimal solution obtained by comparing variables is an elbow angle of 150°, a particle size ranging from 7 to 11 mm, an airflow velocity is 20 m/s, and an air pressure is 0.4 MPa. This solution is not only cost-effective, but can also maintain pipeline life and particle integrity while reducing the particle breakage rate and pipeline pressure drop during transportation.
This study demonstrates the significant influence of airflow velocity on picking rates and the effect of particle shape on the pick-up rate of non-spherical particles. Higher sphericity results in lower picking rates. The recommended configuration—150° elbow angle, 7–11 mm particle size, 20 m/s airflow velocity, and 0.4 MPa air pressure—effectively reduces both the particle breakage rates and pressure drops. Future research will explore the effects of particle morphology and elbow structure on particle breakage rates and pipeline pressure drops, aiming to further optimize pneumatic conveying systems.

Author Contributions

Conceptualization, J.Z; methodology, J.Z.; validation, H.C. and Y.J.; investigation, H.C. and Y.J.; resources, Y.J.; writing—original draft, J.Z; writing—review and editing, H.C. and Y.J.; funding acquisition, Y.J. All authors have read and agreed to the published version of the manuscript.

Funding

This research was funded by the National Natural Science Foundation of China (Grant numbers: 52375134, 52005430).

Data Availability Statement

The data that support the findings of this study are available from the corresponding author upon reasonable.

Conflicts of Interest

The authors declare no conflicts of interest.

References

  1. Xia, W. The effect of coarse gangue particles during the coal flotation process. Energy Sources Part A Recovery Util. Environ. Eff. 2016, 38, 3001–3005. [Google Scholar] [CrossRef]
  2. Zhang, J.; Li, M.; Liu, Z.; Zhou, N. Fractal characteristics of crushed particles of coal gangue under compaction. Powder Technol. 2017, 305, 12–18. [Google Scholar] [CrossRef]
  3. Sun, Z.; Chen, L.; Gao, K.; Ma, G.; Ma, H.; Li, P.; Zhang, Y. Additional pressure loss coefficient of pneumatic conveying of moist-mixed materials for shotcrete based on CFD-DEM method. J. Build. Eng. 2023, 76, 107242. [Google Scholar] [CrossRef]
  4. Obukohwo, O.; Sowinski, A.; Mehrani, P.; Grosshans, H. CFD study of particle backflow in pneumatic conveying systems due to triboelectrification. Powder Technol. 2023, 418, 118285. [Google Scholar] [CrossRef]
  5. Wang, G.; Xu, W.; Yang, S.; Tang, D.; Hu, J. MP-PIC study of particle flow characteristics of pneumatic conveying process in a vertical pipe. Powder Technol. 2024, 431, 119074. [Google Scholar] [CrossRef]
  6. Zhou, J.; Shangguan, L.; Gao, K.; Wang, Y.; Hao, Y. Numerical study of slug characteristics for coarse particle dense phase pneumatic conveying. Powder Technol. 2021, 392, 438–447. [Google Scholar] [CrossRef]
  7. He, C.; Chen, X.; Wang, J.; Ni, H.; Xu, Y.; Zhou, H.; Xiong, Y.; Shen, X. Conveying characteristics and resistance characteristics in dense phase pneumatic conveying of rice husk and blendings of rice husk and coal at high pressure. Powder Technol. 2012, 227, 51–60. [Google Scholar] [CrossRef]
  8. Yang, D.; Li, J.; Du, C.; Zheng, K.; Liu, S. Particle size distribution of coal and gangue after impact-crush separation. J. Cent. South. Univ. 2017, 24, 1252–1262. [Google Scholar] [CrossRef]
  9. Zhang, C.; Li, B.; Song, Z.; Liu, J.; Zhou, J. Breakage mechanism and pore evolution characteristics of gangue materials under compression. Acta Geotech. 2022, 17, 4823–4835. [Google Scholar]
  10. Lupo, M.; Sofia, D.; Barletta, D.; Poletto, M. Calibration of DEM Simulation of Cohesive Particles. Chem. Eng. Trans. 2019, 74. [Google Scholar] [CrossRef]
  11. Hilton, J.E.; Cleary, P.W. The influence of particle shape on flow modes in pneumatic conveying. Chem. Eng. Sci. 2011, 66, 231–240. [Google Scholar] [CrossRef]
  12. Kruggel-Emden, H.; Oschmann, T. Numerical study of rope formation and dispersion of non-spherical particles during pneumatic conveying in a pipe bend. Powder Technol. 2014, 268, 219–236. [Google Scholar] [CrossRef]
  13. Lu, G.; Third, J.R.; Müller, C.R. Discrete element models for non-spherical particle systems: From theoretical developments to applications. Chem. Eng. Sci. 2015, 127, 425–465. [Google Scholar] [CrossRef]
  14. Chen, L.; Sun, Z.; Ma, H.; Pan, G.; Li, P.; Gao, K. Flow characteristics of pneumatic conveying of stiff shotcrete based on CFD-DEM method. Powder Technol. 2022, 397, 117109. [Google Scholar] [CrossRef]
  15. Markauskas, D.; Platzk, S.; Kruggel-Emden, H. Comparative numerical study of pneumatic conveying of flexible elongated particles through a pipe bend by DEM-CFD. Powder Technol. 2022, 399, 117170. [Google Scholar] [CrossRef]
  16. Sung, W.C.; Kim, J.Y.; Chung, S.W.; Lee, D.H. Effect of particle size distribution on hydrodynamics of pneumatic conveying system based on CPFD simulation. Adv. Powder Technol. 2021, 32, 2336–2344. [Google Scholar] [CrossRef]
  17. Jägers, J.; Brömmer, M.; Illana, E.; Wirtz, S.; Scherer, V. DEM-CFD simulation of wood pellet degradation by particle-wall impact during pneumatic conveying. Powder Technol. 2021, 391, 385–402. [Google Scholar] [CrossRef]
  18. Salman, A.D.; Gorham, D.A.; Szabó, M.; Hounslow, M.J. Spherical particle movement in dilute pneumatic conveying. Powder Technol. 2005, 153, 43–50. [Google Scholar] [CrossRef]
  19. Alkassar, Y.; Agarwal, V.K.; Pandey, R.K.; Behera, N. Analysis of dense phase pneumatic conveying of fly ash using CFD including particle size distribution. Part. Sci. Technol. 2021, 39, 322–337. [Google Scholar] [CrossRef]
  20. Rajan, K.S.; Pitchumani, B.; Srivastava, S.N.; Mohanty, B. Two-dimensional simulation of gas–solid heat transfer in pneumatic conveying. Int. J. Heat. Mass. Tran. 2007, 50, 967–976. [Google Scholar] [CrossRef]
  21. Narimatsu, C.P.; Ferreira, M.C. Vertical pneumatic conveying in dilute and dense-phase flows: Experimental study of the influence of particle density and diameter on fluid dynamic behavior. Braz. J. Chem. Eng. 2001, 18, 221–232. [Google Scholar] [CrossRef]
  22. Brosh, T.; Kalman, H.; Levy, A. DEM simulation of particle attrition in dilute-phase pneumatic conveying. Granul. Matter 2011, 13, 175–181. [Google Scholar] [CrossRef]
  23. Zhou, J.; Liu, Y.; Du, C.; Liu, S. Effect of the particle shape and swirling intensity on the breakage of lump coal particle in pneumatic conveying. Powder Technol. 2017, 317, 438–448. [Google Scholar] [CrossRef]
  24. Kong, X.; Liu, J.; Yang, T.; Su, Y.; Geng, J.; Niu, Z. Numerical simulation of feed pellet breakage in pneumatic conveying. Biosyst. Eng. 2022, 218, 31–42. [Google Scholar] [CrossRef]
  25. Sun, H.; Ma, H.; Zhao, Y. DEM investigation on conveying of non-spherical particles in a screw conveyor. Particuology 2022, 65, 17–31. [Google Scholar] [CrossRef]
  26. Kalman, H.; Satran, A.; Meir, D.; Rabinovich, E. Pickup (critical) velocity of particles. Powder Technol. 2005, 160, 103–113. [Google Scholar] [CrossRef]
  27. Rabinovich, E.; Kalman, H. Pickup, critical and wind threshold velocities of particles. Powder Technol. 2007, 176, 9–17. [Google Scholar] [CrossRef]
  28. Zhou, J.; Xu, L.; Du, C. Prediction of lump coal particle pickup velocity in pneumatic conveying. Powder Technol. 2019, 343, 599–606. [Google Scholar] [CrossRef]
  29. Haider, A.; Levenspiel, O. Drag coefficient and terminal velocity of spherical and nonspherical particles. Powder Technol. 1989, 58, 63–70. [Google Scholar] [CrossRef]
Figure 1. Pneumatic conveying system for gangue particles. 1. Air compressor 2. Gas storage tank 3. Flow meter 4. Pressure transmitter 5. Cyclone separator 6. Elbow 7. The throttle valve 8. Acrylic pipe.
Processes 13 01408 g001
Figure 2. Experimental and simulated particle flow patterns of gangue particles.
Processes 13 01408 g002
Figure 3. Pick-up rate curve of gangue particles with a particle size of 11–13 mm.
Processes 13 01408 g003
Figure 4. Simulation state and pressure cloud of gangue particles in the pipeline.
Processes 13 01408 g004
Figure 5. Effect of airflow velocity on the pick-up rate of particles with different sizes.
Processes 13 01408 g005
Figure 6. Study on mesh independence.
Processes 13 01408 g006
Figure 7. Simulation pipeline and cube collection device.
Processes 13 01408 g007
Figure 8. Particle pile formed by non-spherical particle 4 in the pipeline.
Processes 13 01408 g008
Figure 9. Pick-up state of non-spherical particles in the pipeline.
Processes 13 01408 g009
Figure 10. Velocity and motion state of non-spherical particles at t = 1 s.
Processes 13 01408 g010
Figure 11. Time-dependent curve of non-spherical particle collection quality.
Processes 13 01408 g011
Figure 12. Pressure exerted by particles at the bottom of the pipe wall: (a) particle 1; (b) particle 2; (c) particle 3; (d) particle 4; (e) particle 5; (f) particle 6; and (g) particle 7.
Processes 13 01408 g012
Figure 13. Influence of sphericity on picking speed.
Processes 13 01408 g013
Figure 14. Four common elbows with different angles: (a) 90°; (b) 120°; (c) 135°; and (d) 150°.
Processes 13 01408 g014
Figure 15. Trend of average particle breakage rate under different factors.
Processes 13 01408 g015
Figure 16. Particles exert pressure on elbow walls at different angles: (a) 90°; (b) 120°; (c) 135°; and (d) 150°.
Processes 13 01408 g016
Figure 17. Trend of average pressure drop variation under different factors.
Processes 13 01408 g017
Figure 18. Velocity of particles transported in pipes with different elbow angles: (a) 90°; (b) 120°; (c) 135°; and (d) 150°.
Processes 13 01408 g018
Table 1. Ball equivalent diameter of non-spherical particles.
SymbolNameCalculation FormulaPhysical Meaning
devVolume equivalent diameter 6 V v / π 3 Spherical diameter with the same volume as non-spherical particles
desEquivalent surface area diameter S c / π Spherical diameter with the same surface area as non-spherical particles
devsSpecific surface area equivalent diameter d ev 3 / d es 3 Spherical diameter with the same surface area and volume ratio
Table 2. Increase in the rate of picking up per 1 m/s for non-spherical particles with different particle sizes.
Particle Size (mm)Pick-Up Volume Increase Rate (%)
3–51.052.320.6521--
5–711.153.85729.5-
7–91.51261619
9–11211.51024.5-
11–1311329---
13–151.50.513923.5-
Table 3. Modeling of non-spherical particles.
Particle Code1234567
Particle diagramProcesses 13 01408 i001Processes 13 01408 i002Processes 13 01408 i003Processes 13 01408 i004Processes 13 01408 i005Processes 13 01408 i006Processes 13 01408 i007
Table 4. Physical and numerical parameters.
ItemDetailsIndexValue
CFDMaterialsAirDensity (kg/m3)1.225
Viscosity [kg/(m·s)]1.79 × 10−5
SteelDensity (kg/m3)7800
Boundary conditionsVelocity inletVelocity magnitude (m/s)15~30
Turbulent intensity (-)2.47~2.69%
Hydraulic diameter (mm)50
Pressure outletPressure (Pa)0
WallWall motionStationary wall
Shear conditionNo slip
Roughness height (mm)0.001
Roughness constant (-)0.5
Time step (s)1.00 × 10⁻⁴
DEMMaterialsParticleVolume (m3)3.35 × 10⁻⁸
Poisson’s ratio (-)0.25
Shear modulus (Pa)1.00 × 10¹⁰
Density (kg/m3)2300
WallPoisson’s ratio (-)0.3
Shear modulus (Pa)7.00 × 10¹⁰
Density (kg/m3)7800
Time step (s)1.00 × 10⁻⁶
InteractionInteractionParticle–particleCoefficient of restitution (-)0.55
Coefficient of static friction (-)0.68
Coefficient of rolling friction (-)0.15
Interaction contact modelHertz–Mindlin with JKR
Particle-wallCoefficient of restitution (-)0.5
Coefficient of static friction (-)0.5
Coefficient of rolling friction (-)0.05
Interaction contact modelHertz–Mindlin with JKR
Factory typeStatic state/0.1 kg
Table 5. Surface area and sphericity of particles 1–7.
Particle Number1234567
Particle diagramProcesses 13 01408 i008Processes 13 01408 i009Processes 13 01408 i010Processes 13 01408 i011Processes 13 01408 i012Processes 13 01408 i013Processes 13 01408 i014
Surface area (m2)2.25 × 10−52.44 × 10−42.71 × 10−42.64 × 10−43.57 × 10−43.41 × 10−43.21 × 10⁻⁴
Sphericity10.920.830.850.630.660.70
Table 6. Experimental factors and levels.
Levelα (°)d (mm)va (m/s)Pa (MPa)
1907–9200.4
21209–11250.6
313511–13300.8
415013–15351.0
Table 7. Orthogonal scheme design.
Programα (°)d (mm)va (m/s)Pa (MPa)E
1907–9200.41
2909–11250.62
39011–13300.83
49013–15351.04
51207–9250.84
61209–11201.03
712011–13350.42
812013–15300.61
91357–9301.02
101359–11350.81
1113511–13200.64
1213513–15250.43
131507–9350.63
141509–11300.44
1515011–13251.01
1615013–15200.82
Table 8. Measurement results of schemes 1–16.
SchemePbr (%)ΔP (kPa)
111.404.04
213.674.68
314.975.68
417.627.76
511.354.42
610.495.46
715.854.86
814.845.39
912.716.10
1013.785.81
1110.833.07
1212.585.51
1312.594.43
1410.823.37
1512.615.66
1610.275.09
Table 9. Analysis of particle crushing rate range.
αdvaPaE
k1b14.4212.0110.7512.6612.81
k2b13.1312.1911.5612.9813.01
k3b12.4813.3313.3413.1212.66
k4b11.5813.8314.9613.3612.44
R2.841.824.210.700.57
Rank23145
Table 10. Analysis of variance of particle breakage rate.
Source of VarianceSSDFMSFp
α17.1735.7218.210.020
d10.3833.4611.000.040
va36.75312.2538.970.007
Pa1.4730.491.560.362
E0.9430.31
Table 11. Analysis of pressure drop range.
αdvaPaE
k1d5.544.754.424.204.75
k2d5.034.824.824.404.69
k3d4.884.835.135.254.73
k4d4.645.695.685.724.82
R0.900.941.261.520.09
Rank43215
Table 12. Analysis of variance of pressure drop.
Source of VarianceSSDFMSFp
α1.6530.5526.530.012
d3.9131.3063.000.003
va3.3931.1354.710.004
Pa9.0533.02145.830.001
E0.0630.02
Disclaimer/Publisher’s Note: The statements, opinions and data contained in all publications are solely those of the individual author(s) and contributor(s) and not of MDPI and/or the editor(s). MDPI and/or the editor(s) disclaim responsibility for any injury to people or property resulting from any ideas, methods, instructions or products referred to in the content.

