
Optimal Maintenance Strategy Selection for Oil and Gas Industry Equipment Using a Combined Analytical Hierarchy Process–Technique for Order of Preference by Similarity to an Ideal Solution: A Case Study in the Oil and Gas Industry

 ,
,  ,
, 
Abstract
1. Introduction
2. Literature Review
2.1. Equipment Maintenance Strategies in the Oil and Gas Industry
2.2. Application of the MCDM in Selecting Maintenance Strategies
2.3. Criteria for Evaluating Maintenance Strategies
2.4. Research Gap
3. Methods and Materials
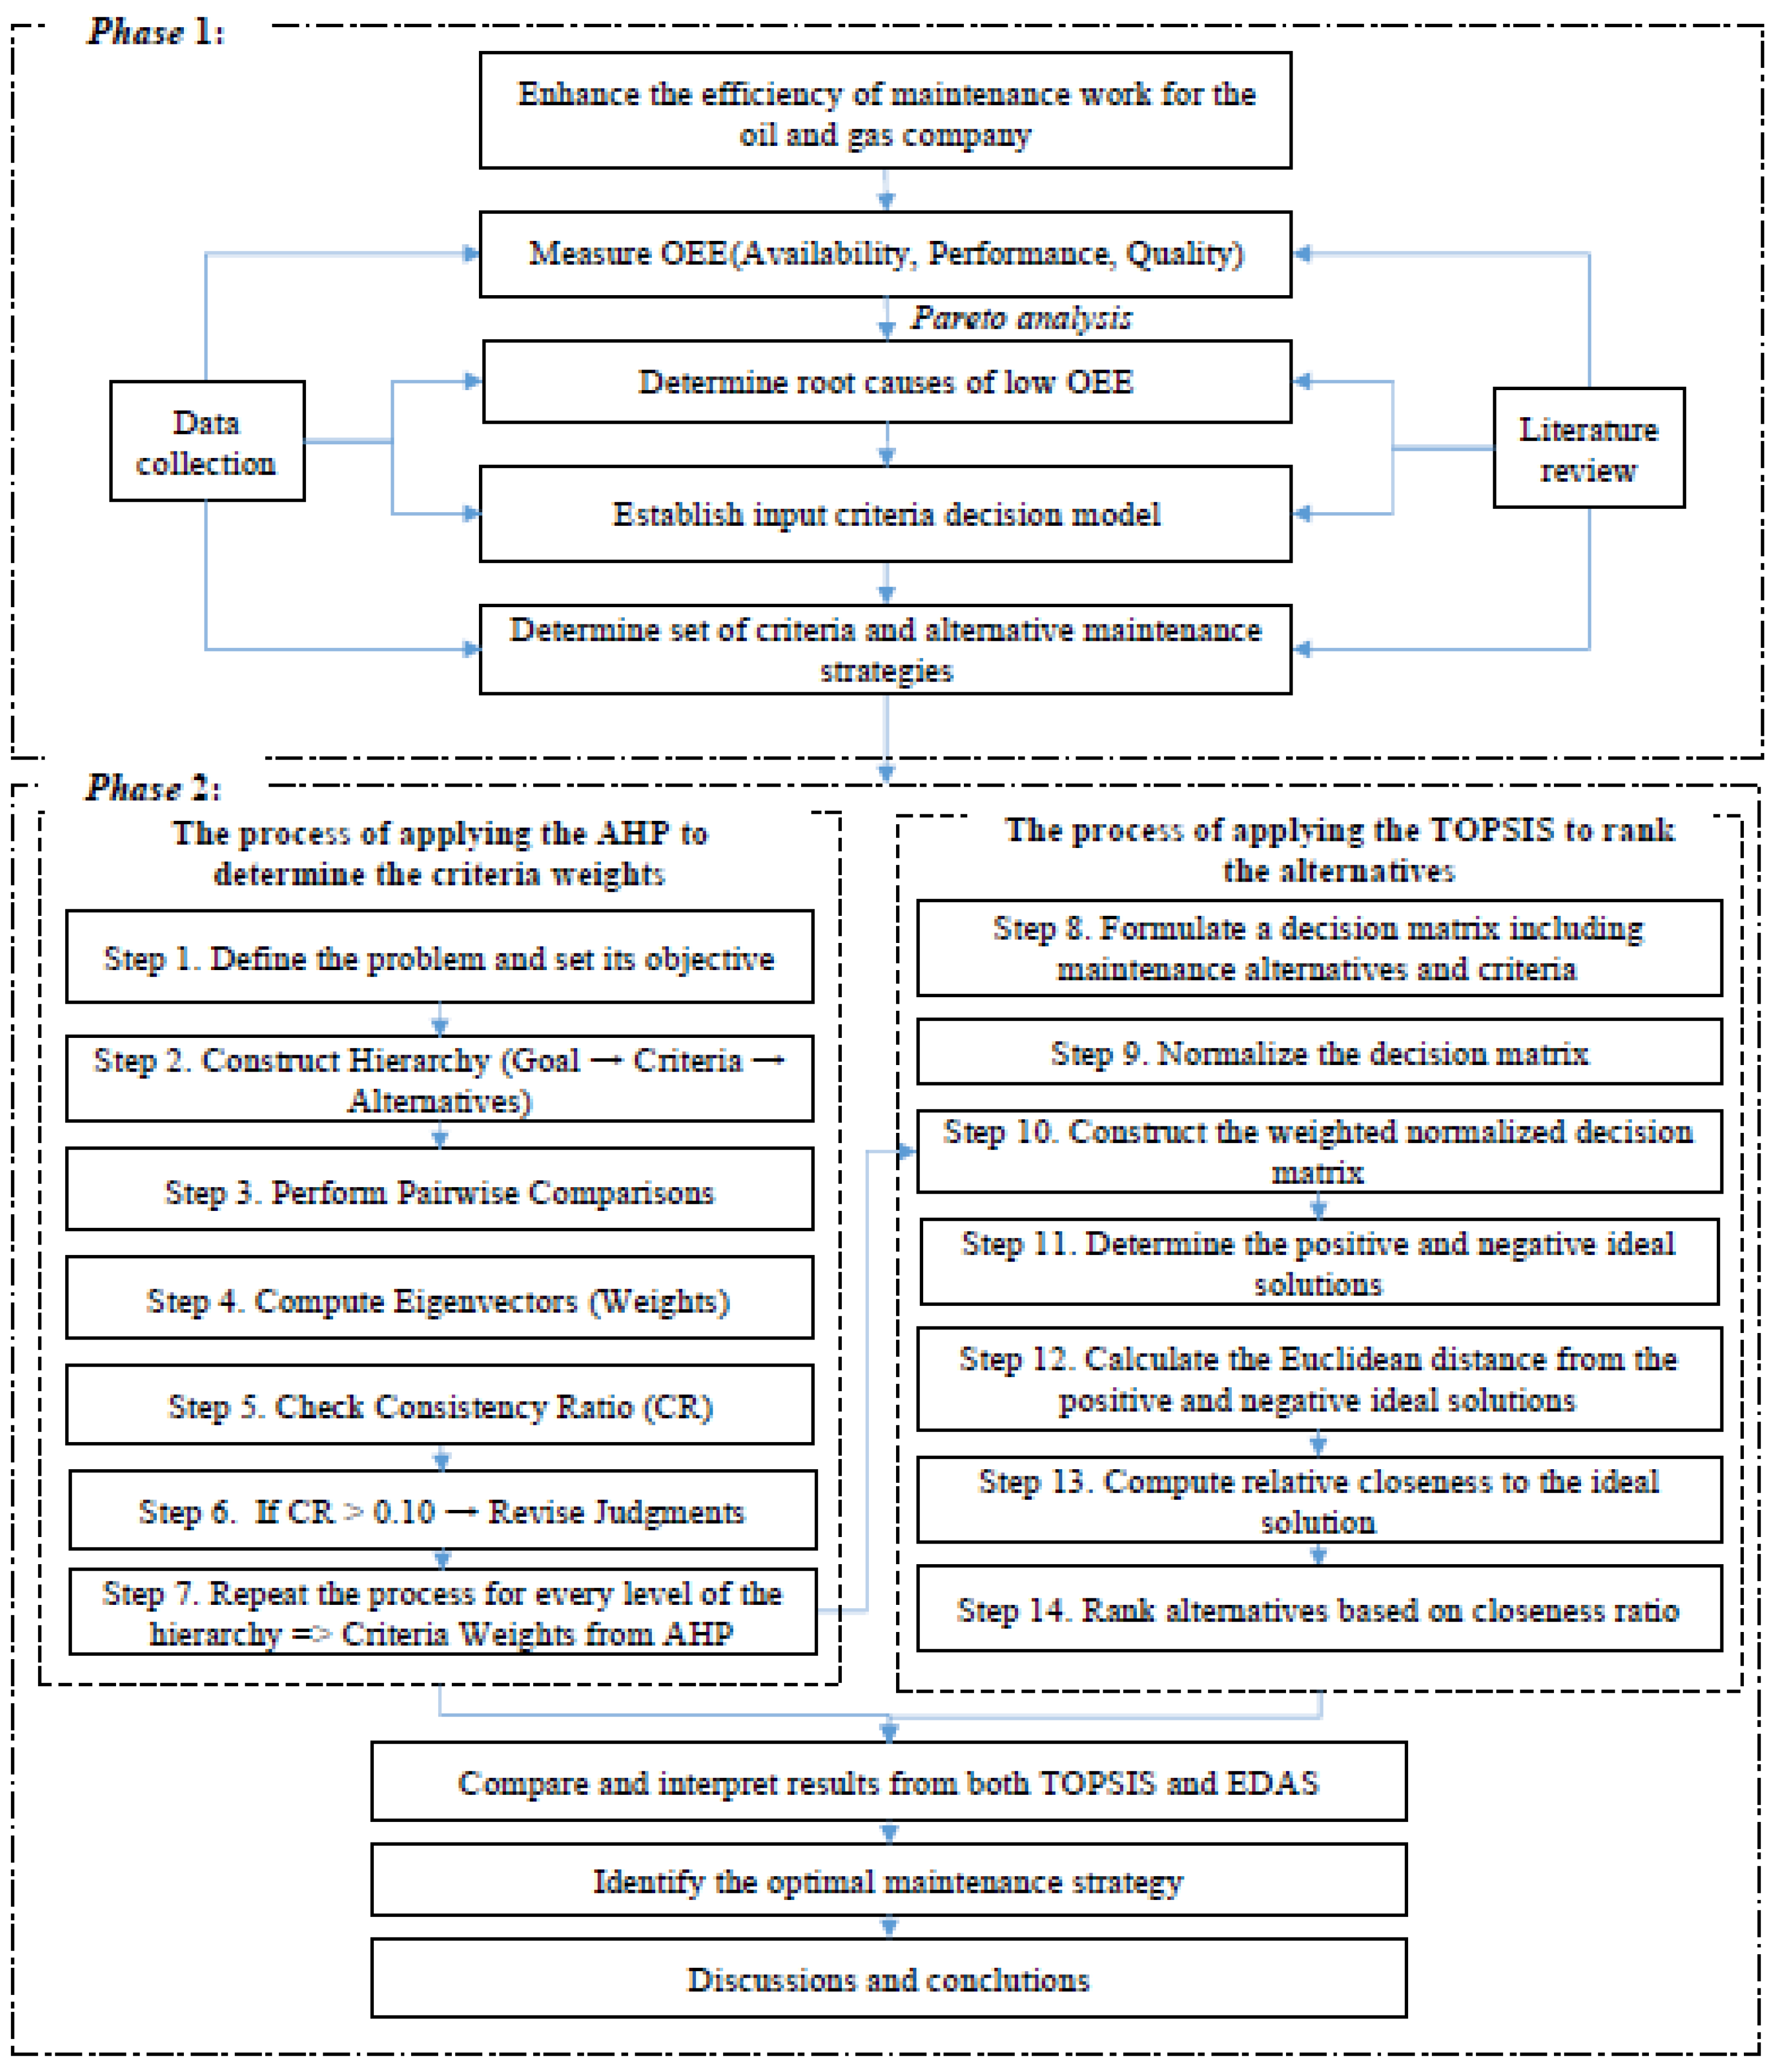
3.1. Methodology
3.1.1. Phase 1: Analyze Equipment Status Based on OEE Index and Identify Root Causes
- Availability: The time in which the equipment is ready to operate compared to the planned time.
- Performance: The actual speed of the equipment compared to the standard speed.
- Quality: The rate of products meeting quality requirements compared to the total number of products produced.
3.1.2. Phase 2—Multi-Criteria Decision-Making Using the AHP–TOPSIS Integrated Method and Verifying the Optimal Results
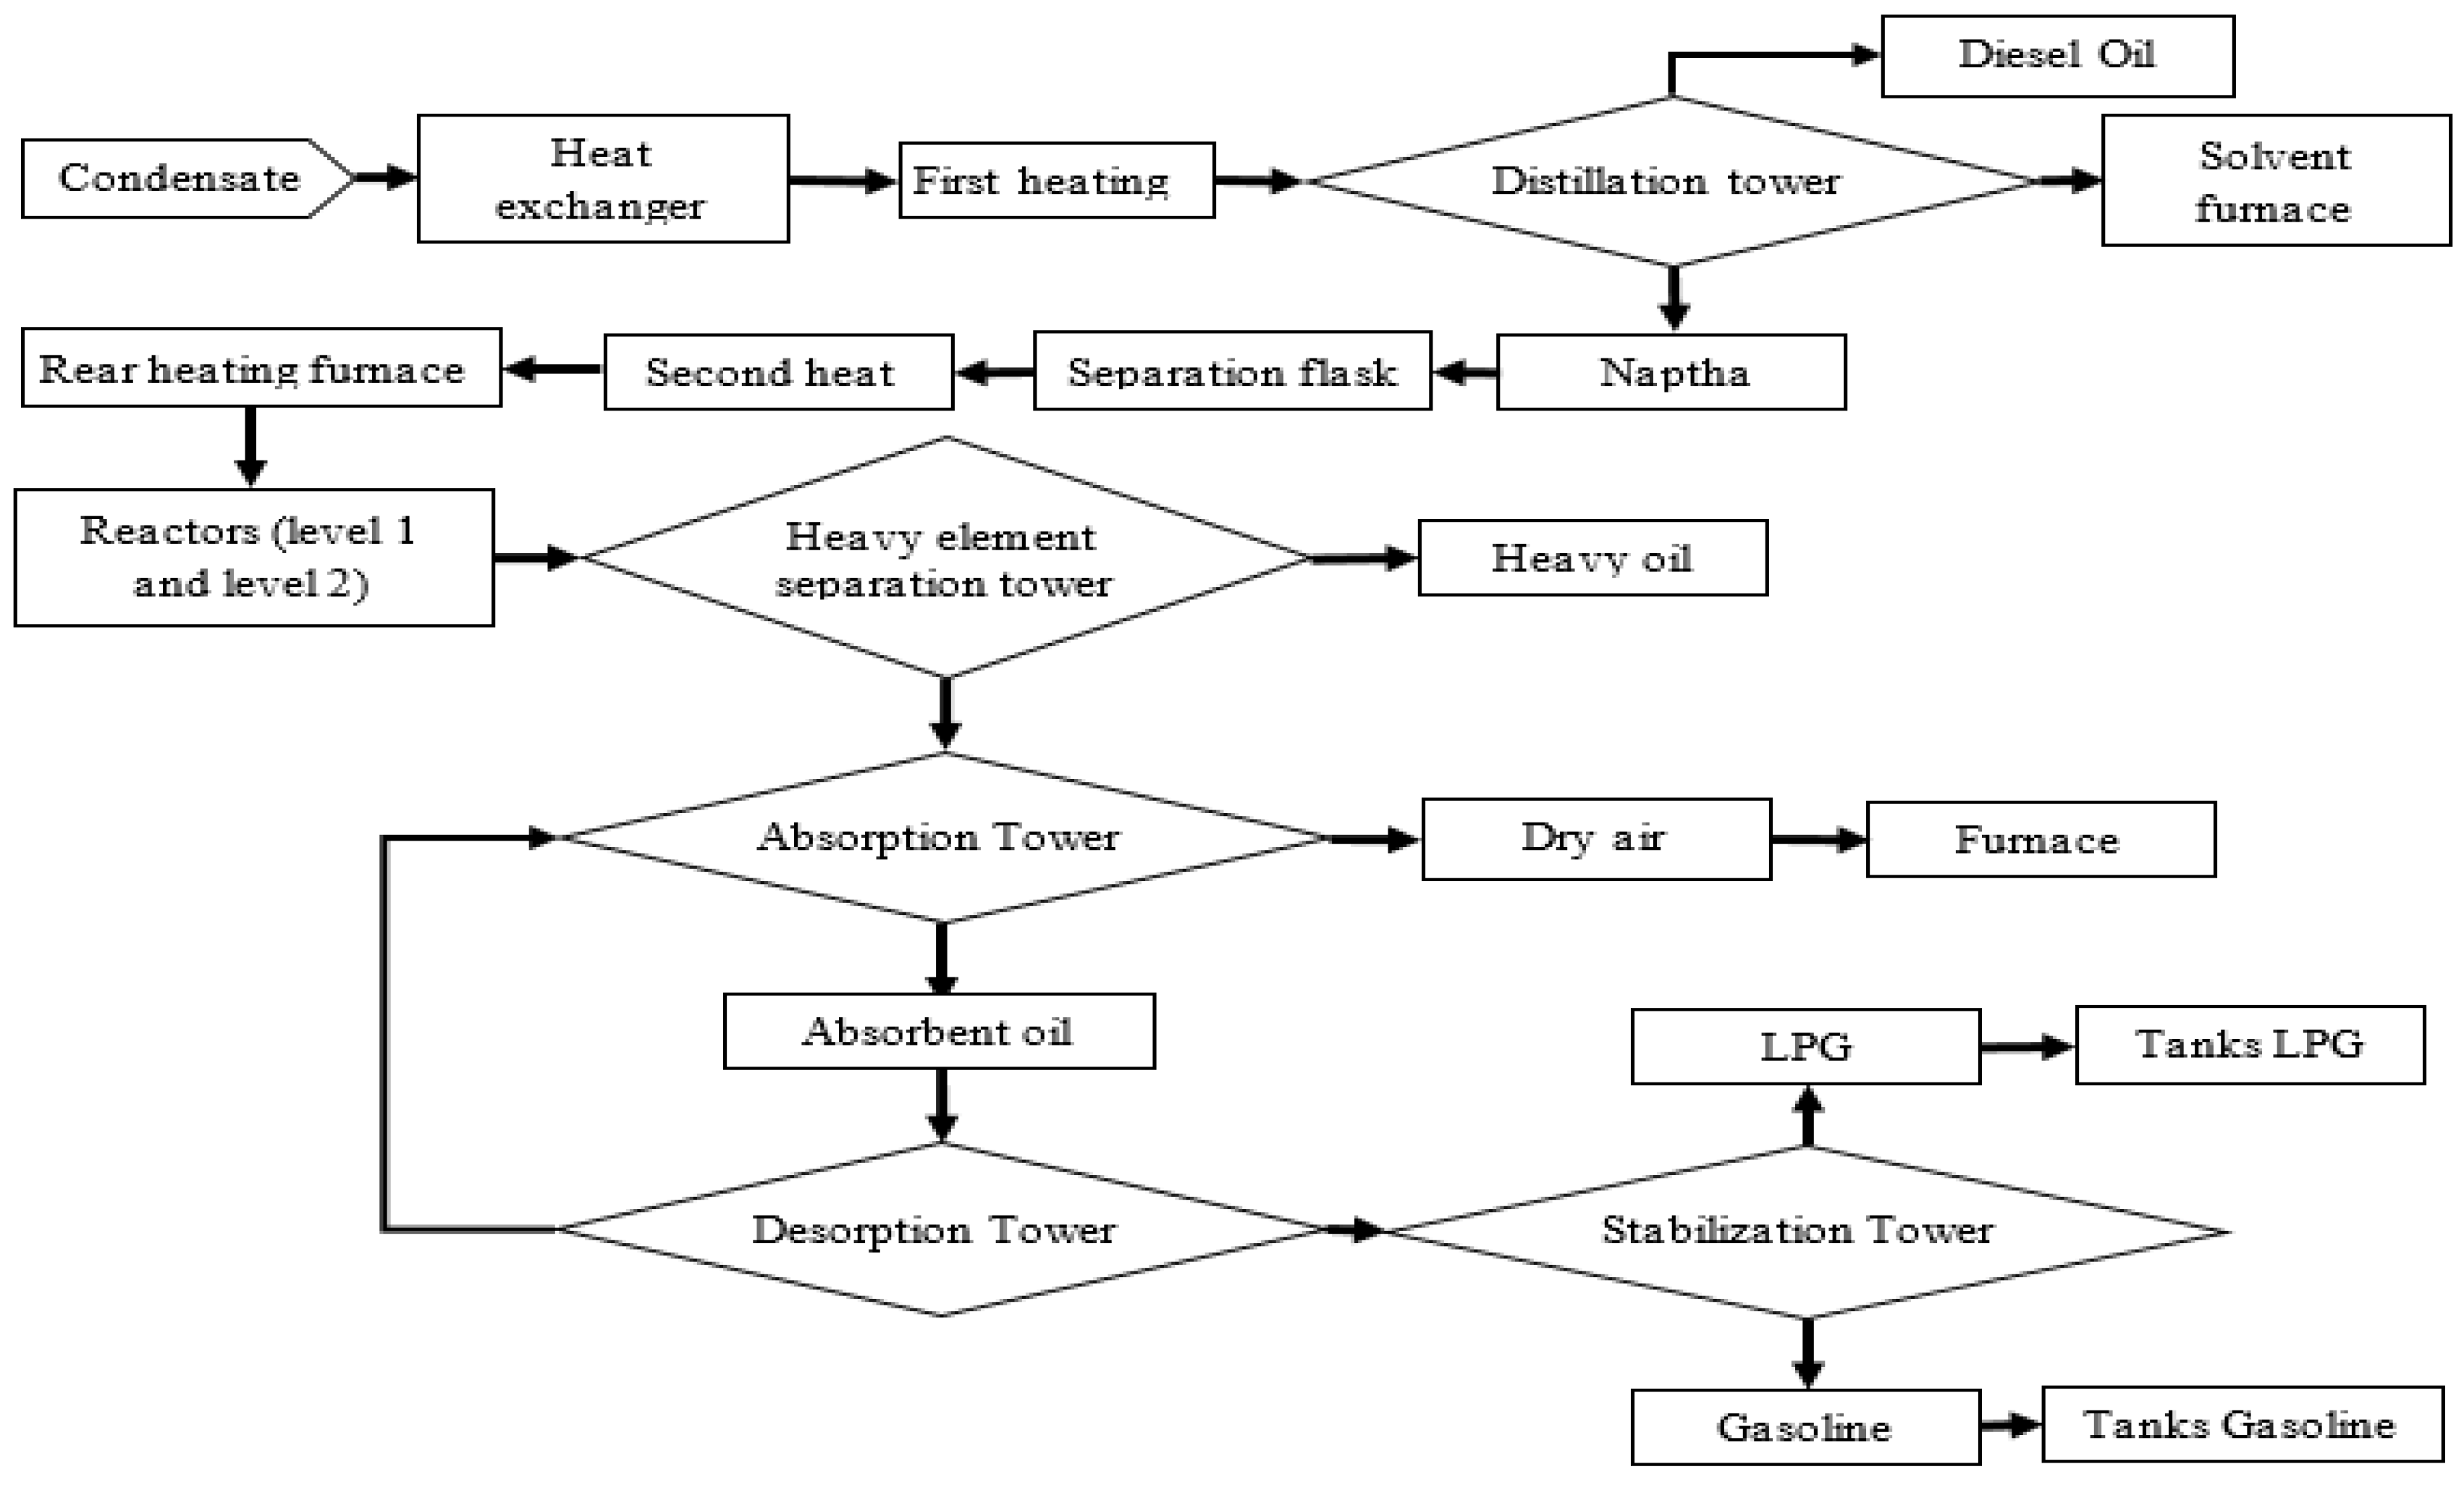
3.2. Materials
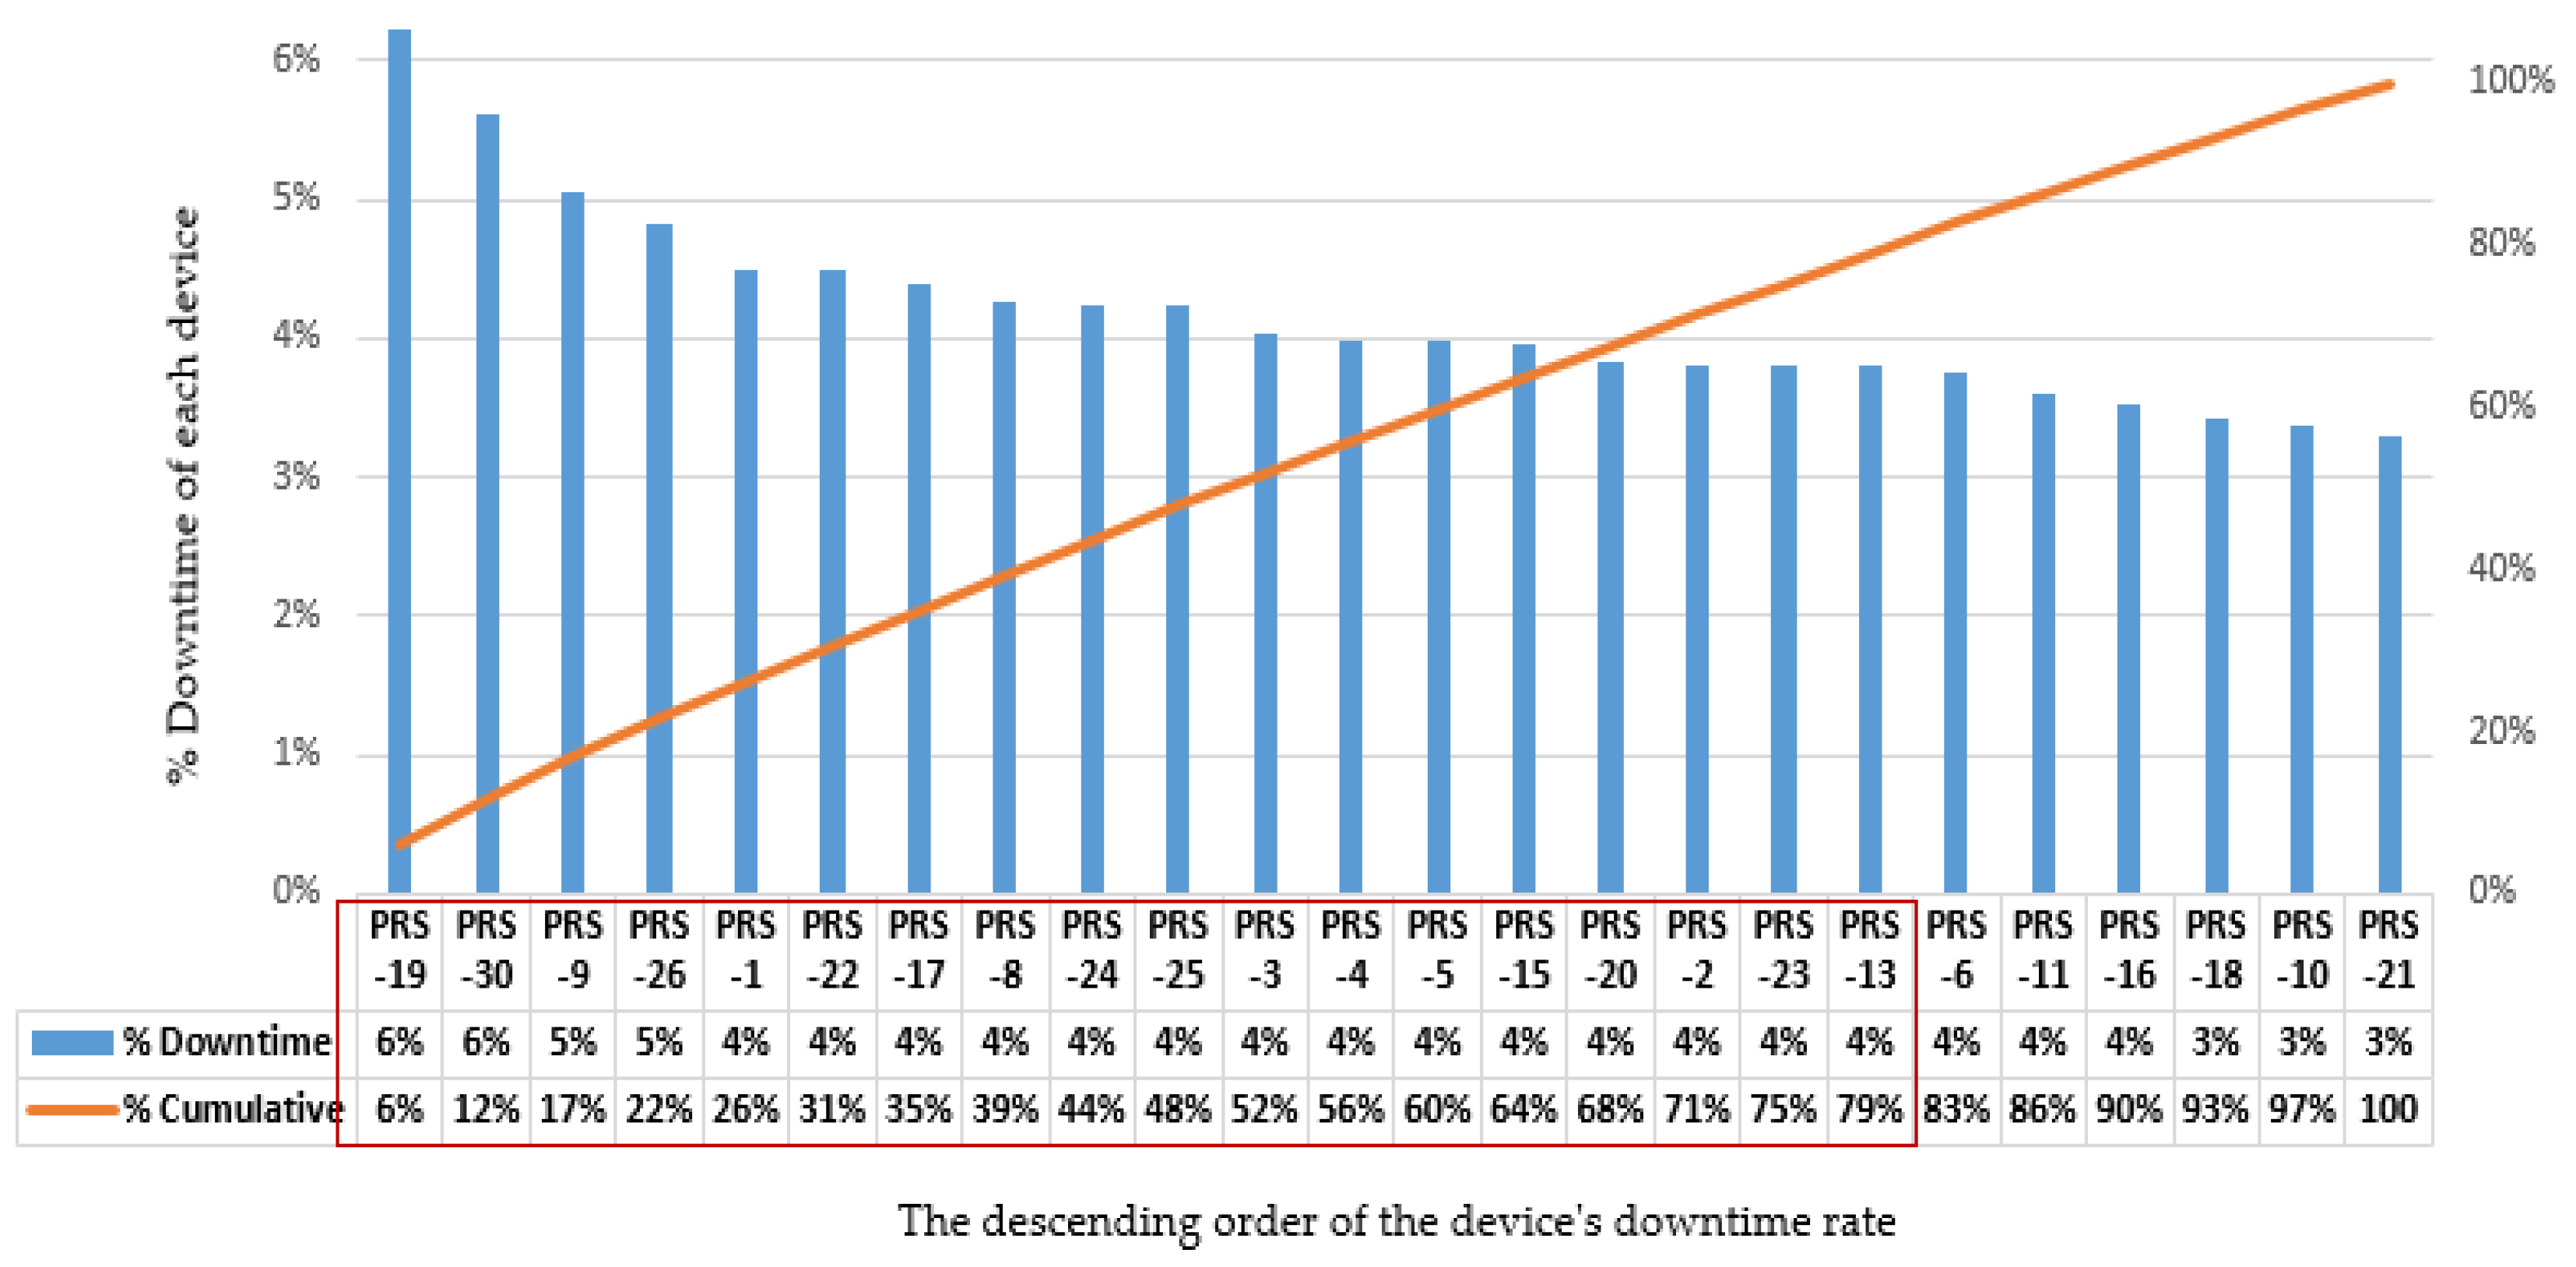
3.2.1. OEE Measurement and Identify Root Causes
3.2.2. Choosing a Maintenance Strategy
4. Results
5. Discussion
- Reliance on manual data: Data collection from personnel and manual recording can lead to bias or inconsistencies.
- Limited data scope: The data were collected from a single enterprise, while operational and maintenance factors can vary significantly across manufacturing facilities or industries.
- Limitations in applying modern technology: Although advanced strategies such as PdM or CBM have potential, they have not been widely deployed due to high investment and infrastructure requirements.
6. Conclusions
6.1. Findings
6.2. Contributions
6.3. Future Research Directions
Author Contributions
Funding
Data Availability Statement
Conflicts of Interest
References
- Velmurugan, R.S.; Dhingra, T. Maintenance strategy selection and its impact in maintenance function: A conceptual framework. Int. J. Oper. Prod. Manag. 2015, 35, 1622–1661. [Google Scholar] [CrossRef]
- Zhong, D.; Xia, Z.; Zhu, Y.; Duan, J. Overview of predictive maintenance based on digital twin technology. Heliyon 2023, 9, e14534. [Google Scholar] [CrossRef] [PubMed]
- Vyasa, V.; Xu, Z. Maintenance in automotive and aerospace applications—An overview. Int. J. Adv. Sci. Trans. 2024, 3, 349–361. [Google Scholar]
- Alsyouf, I. The role of maintenance in improving companies’ productivity and profitability. Int. J. Prod. Econ. 2007, 105, 70–78. [Google Scholar] [CrossRef]
- Dowlatshahi, S. The role of industrial maintenance in the maquiladora industry: An empirical analysis. Int. J. Prod. Econ. 2008, 114, 298–307. [Google Scholar] [CrossRef]
- Oluwatoyin, O.A.; Afolalu, S.A.; Monye, S.I. Maintenance Impact on Production Profitability in Industry—An Overview. In Proceedings of the 2024 International Conference on Science, Engineering and Business for Driving Sustainable Development Goals (SEB4SDG), Omu-Aran, Nigeria, 2–4 April 2024; IEEE: Piscataway, NJ, USA, 2024. [Google Scholar]
- Mostafa, S.; Lee, S.-H.; Dumrak, J.; Chileshe, N.; Soltan, H. Lean thinking for a maintenance process. Prod. Manuf. Res. 2015, 3, 236–272. [Google Scholar] [CrossRef]
- Kothamasu, R.; Huang, S.H. Adaptive Mamdani fuzzy model for condition-based maintenance. Fuzzy Sets Syst. 2007, 158, 2715–2733. [Google Scholar] [CrossRef]
- Pinjala, S.K.; Pintelon, L.; Vereecke, A. An empirical investigation on the relationship between business and maintenance strategies. Int. J. Prod. Econ. 2006, 104, 214–229. [Google Scholar] [CrossRef]
- Yang, L.; Zhao, Y.; Peng, R.; Ma, X. Opportunistic maintenance of production systems subject to random wait time and multiple control limits. J. Manuf. Syst. 2018, 47, 12–34. [Google Scholar] [CrossRef]
- Jaqin, C.; Alimudin, D.; Purba, H.H.; Aisyah, S. Performance Improvement of Injection Pump Machines Based on Overall Equipment Effectiveness: Case Study in Oil Company. In Proceedings of the 2019 1st International Conference on Engineering and Management in Industrial System (ICOEMIS 2019), Malang, Indonesia, 8–9 August 2019; Atlantis Press: Dordrecht, The Netherlands, 2019. [Google Scholar]
- Emovon, I.; Norman, R.A.; Murphy, A.J. Hybrid MCDM based methodology for selecting the optimum maintenance strategy for ship machinery systems. J. Intell. Manuf. 2018, 29, 519–531. [Google Scholar] [CrossRef]
- Seiti, H.; Hafezalkotob, A. Developing the R-TOPSIS methodology for risk-based preventive maintenance planning: A case study in rolling mill company. Comput. Ind. Eng. 2019, 128, 622–636. [Google Scholar] [CrossRef]
- Kirubakaran, B.; Ilangkumaran, M. Selection of optimum maintenance strategy based on FAHP integrated with GRA–TOPSIS. Ann. Oper. Res. 2016, 245, 285–313. [Google Scholar] [CrossRef]
- Wang, C.-N.; Pan, C.-F.; Nguyen, H.-P.; Fang, P.-C. Integrating fuzzy AHP and TOPSIS methods to evaluate operation efficiency of daycare centers. Mathematics 2023, 11, 1793. [Google Scholar] [CrossRef]
- Hemmati, N.; Rahiminezhad Galankashi, M.; Imani, D.; Mokhatab Rafiei, F. An integrated fuzzy-AHP and TOPSIS approach for maintenance policy selection. Int. J. Qual. Reliab. Manag. 2020, 37, 1275–1299. [Google Scholar] [CrossRef]
- Jamali, N.; Feylizadeh, M.R.; Liu, P. Prioritization of aircraft maintenance unit strategies using fuzzy Analytic Network Process: A case study. J. Air Transp. Manag. 2021, 93, 102057. [Google Scholar] [CrossRef]
- Bayoumi, A.; McCaslin, R. Internet of things–a predictive maintenance tool for general machinery, petrochemicals and water treatment. In Advanced Technologies for Sustainable Systems: Selected Contributions from the International Conference on Sustainable Vital Technologies in Engineering and Informatics, Proceedings of the BUE ACE1 2016, Cairo, Egypt, 7–9 November 2016; Springer: Berlin/Heidelberg, Germany, 2017. [Google Scholar]
- Hameed, A.; Khan, F. A framework to estimate the risk-based shutdown interval for a processing plant. J. Loss Prev. Process Ind. 2014, 32, 18–29. [Google Scholar] [CrossRef]
- Cai, Y.; Teunter, R.H.; de Jonge, B. A data-driven approach for condition-based maintenance optimization. Eur. J. Oper. Res. 2023, 311, 730–738. [Google Scholar] [CrossRef]
- Braglia, M.; Castellano, D.; Frosolini, M. An integer linear programming approach to maintenance strategies selection. Int. J. Qual. Reliab. Manag. 2013, 30, 991–1016. [Google Scholar] [CrossRef]
- Zhang, W.; Yang, D.; Wang, H. Data-driven methods for predictive maintenance of industrial equipment: A survey. IEEE Syst. J. 2019, 13, 2213–2227. [Google Scholar] [CrossRef]
- Alfahdi, K.; Gultekin, H.; Summad, E. A Novel Prognostics and Health Management Framework to Extract System Health Requirments in the Oil and Gas Industry. Int. J. Progn. Health Manag. 2024, 15, 2213–2227. [Google Scholar] [CrossRef]
- Prajapati, A.; Bechtel, J.; Ganesan, S. Condition based maintenance: A survey. J. Qual. Maint. Eng. 2012, 18, 384–400. [Google Scholar] [CrossRef]
- Zeinalnezhad, M.; Chofreh, A.G.; Goni, F.A.; Klemeš, J.J. Critical success factors of the reliability-centred maintenance implementation in the oil and gas industry. Symmetry 2020, 12, 1585. [Google Scholar] [CrossRef]
- Ylipää, T.; Skoogh, A.; Bokrantz, J.; Gopalakrishnan, M. Identification of maintenance improvement potential using OEE assessment. Int. J. Product. Perform. Manag. 2017, 66, 126–143. [Google Scholar] [CrossRef]
- Theissler, A.; Pérez-Velázquez, J.; Kettelgerdes, M.; Elger, G. Predictive maintenance enabled by machine learning: Use cases and challenges in the automotive industry. Reliab. Eng. Syst. Saf. 2021, 215, 107864. [Google Scholar] [CrossRef]
- Einabadi, B.; Mahmoodjanloo, M.; Baboli, A.; Rother, E. Dynamic predictive and preventive maintenance planning with failure risk and opportunistic grouping considerations: A case study in the automotive industry. J. Manuf. Syst. 2023, 69, 292–310. [Google Scholar] [CrossRef]
- Arinze, C.A.; Izionworu, V.O.; Isong, D.; Daudu, C.D.; Adefemi, A. Predictive maintenance in oil and gas facilities, leveraging ai for asset integrity management. Int. J. Front. Eng. Technol. Res. 2024, 6, 16–26. [Google Scholar] [CrossRef]
- Mallioris, P.; Aivazidou, E.; Bechtsis, D. Predictive maintenance in Industry 4.0: A systematic multi-sector mapping. CIRP J. Manuf. Sci. Technol. 2024, 50, 80–103. [Google Scholar] [CrossRef]
- Faghihinia, E.; Mollaverdi, N. Building a maintenance policy through a multi-criterion decision-making model. J. Ind. Eng. Int. 2012, 8, 14. [Google Scholar] [CrossRef]
- Pei, Y.; Liu, Z.; Xu, J.; Qi, B.; Cheng, Q. Grouping preventive maintenance strategy of flexible manufacturing systems and its optimization based on reliability and cost. Machines 2023, 11, 74. [Google Scholar] [CrossRef]
- Liu, X.-W.; Li, C.-Y.; Dang, S.; Wang, W.; Qu, J.; Chen, T.; Wang, Q.-L. Research on training effectiveness of professional maintenance personnel based on virtual reality and augmented reality technology. Sustainability 2022, 14, 14351. [Google Scholar] [CrossRef]
- Ng Corrales, L.d.C.; Lambán, M.P.; Hernandez Korner, M.E.; Royo, J. Overall equipment effectiveness: Systematic literature review and overview of different approaches. Appl. Sci. 2020, 10, 6469. [Google Scholar] [CrossRef]
- Prasetyo, Y.T.; Veroya, F.C. An application of overall equipment effectiveness (OEE) for minimizing the bottleneck process in semiconductor industry. In Proceedings of the 2020 IEEE 7th International Conference on Industrial Engineering and Applications (ICIEA), Bangkok, Thailand, 16–18 April 2020; IEEE: Piscataway, NJ, USA, 2020. [Google Scholar]
- Dovere, E.; Cavalieri, S.; Ierace, S. RFId systems for moveable asset management: An assessment model. Int. J. Prod. Res. 2017, 55, 1336–1349. [Google Scholar] [CrossRef]
- Hwang, G.; Lee, J.; Park, J.; Chang, T.-W. Developing performance measurement system for Internet of Things and smart factory environment. Int. J. Prod. Res. 2017, 55, 2590–2602. [Google Scholar] [CrossRef]
- Gupta, A.K.; Garg, R. OEE improvement by TPM implementation: A case study. Int. J. IT Eng. Appl. Sci. Res. 2012, 1, 115–124. [Google Scholar]
- Pant, S.; Kumar, A.; Ram, M.; Klochkov, Y.; Sharma, H.K. Consistency indices in analytic hierarchy process: A review. Mathematics 2022, 10, 1206. [Google Scholar] [CrossRef]
- Rios, R.; Duarte, S. Selection of ideal sites for the development of large-scale solar photovoltaic projects through Analytical Hierarchical Process–Geographic information systems (AHP-GIS) in Peru. Renew. Sustain. Energy Rev. 2021, 149, 111310. [Google Scholar] [CrossRef]
- Chakraborty, S. TOPSIS and Modified TOPSIS: A comparative analysis. Decis. Anal. J. 2022, 2, 100021. [Google Scholar] [CrossRef]
- Madanchian, M.; Taherdoost, H. A comprehensive guide to the TOPSIS method for multi-criteria decision making. Sustain. Soc. Dev. 2023, 1, 2220. [Google Scholar] [CrossRef]
- Orient Oil and Gas Joint Stock Company. Available online: https://www.topcv.vn/cong-ty/cong-ty-co-phan-dau-khi-dong-phuong/103004.html (accessed on 20 April 2025).
- Luo, T.; Wu, C.; Duan, L. Fishbone diagram and risk matrix analysis method and its application in safety assessment of natural gas spherical tank. J. Clean. Prod. 2018, 174, 296–304. [Google Scholar] [CrossRef]
- Van Nguyen, T. Research on solutions for connecting to marginal fields at Cuu Long basin to process and transport the products basing on existing petroleum technology and equipment. J. Min. Earth Sci. Vol. 2021, 62, 65–75. [Google Scholar] [CrossRef]

| No. | Device System Name | Mean Downtime (MDT) (h/time) | Mean Time Between Failures (MTBF) (h) | Availability (A) | ||||||
|---|---|---|---|---|---|---|---|---|---|---|
| 2021 | 2022 | 2023 | 2021 | 2022 | 2023 | 2021 | 2022 | 2023 | ||
| 1 | PRS-1 | 23.75 | 25.17 | 30.05 | 241.70 | 355.70 | 227.60 | 91.05 | 93.39 | 88.34 |
| 2 | PRS-2 | 21.67 | 22.58 | 28.39 | 328.73 | 290.28 | 263.61 | 93.82 | 92.78 | 90.28 |
| 3 | PRS-3 | 16.75 | 19.25 | 23.80 | 233.54 | 246.20 | 200.82 | 93.31 | 92.75 | 89.40 |
| 4 | PRS-4 | 25.70 | 25.67 | 31.93 | 324.70 | 339.33 | 292.51 | 92.67 | 92.97 | 90.16 |
| 5 | PRS-5 | 20.75 | 23.58 | 25.92 | 261.83 | 226.71 | 324.48 | 92.66 | 90.58 | 92.60 |
| 6 | PRS-6 | 20.58 | 21.62 | 27.74 | 222.75 | 315.30 | 322.66 | 91.54 | 93.58 | 92.08 |
| 7 | PRS-8 | 25.67 | 26.75 | 32.89 | 339.33 | 265.25 | 304.03 | 92.97 | 90.84 | 90.24 |
| 8 | PRS-9 | 23.75 | 24.67 | 29.62 | 278.32 | 232.98 | 195.00 | 92.14 | 90.42 | 86.81 |
| 9 | PRS-10 | 17.75 | 18.67 | 24.91 | 284.32 | 263.91 | 287.95 | 94.12 | 93.39 | 92.04 |
| 10 | PRS-11 | 18.75 | 20.30 | 25.14 | 273.25 | 216.46 | 339.86 | 93.58 | 91.43 | 93.11 |
| 11 | PRS-13 | 17.75 | 19.25 | 24.10 | 347.25 | 238.40 | 200.52 | 95.14 | 92.53 | 89.27 |
| 12 | PRS-15 | 18.75 | 20.22 | 25.15 | 231.54 | 216.54 | 287.71 | 92.51 | 91.46 | 91.96 |
| 13 | PRS-16 | 19.67 | 22.25 | 24.95 | 304.77 | 260.33 | 311.97 | 93.94 | 92.13 | 92.59 |
| 14 | PRS-17 | 25.67 | 25.67 | 30.98 | 266.33 | 311.25 | 271.09 | 91.21 | 92.38 | 89.74 |
| 15 | PRS-18 | 18.58 | 20.17 | 25.98 | 273.42 | 344.83 | 266.02 | 93.64 | 94.47 | 91.10 |
| 16 | PRS-19 | 33.83 | 32.76 | 41.92 | 303.09 | 240.99 | 223.53 | 89.96 | 88.03 | 84.21 |
| 17 | PRS-20 | 18.58 | 19.63 | 25.98 | 283.49 | 245.82 | 239.47 | 93.85 | 92.61 | 90.21 |
| 18 | PRS-21 | 17.58 | 19.26 | 24.26 | 319.34 | 246.19 | 300.18 | 94.78 | 92.74 | 92.52 |
| 19 | PRS-22 | 21.67 | 22.63 | 28.96 | 291.19 | 227.66 | 228.69 | 93.07 | 90.96 | 88.76 |
| 20 | PRS-23 | 21.67 | 24.23 | 28.89 | 243.78 | 356.64 | 308.03 | 91.84 | 93.64 | 91.43 |
| 21 | PRS-24 | 23.70 | 25.22 | 30.10 | 278.37 | 355.65 | 235.35 | 92.15 | 93.38 | 88.66 |
| 22 | PRS-25 | 21.75 | 22.73 | 28.48 | 221.58 | 259.85 | 295.96 | 91.06 | 91.96 | 91.22 |
| 23 | PRS-26 | 23.67 | 23.61 | 28.95 | 241.78 | 289.25 | 195.67 | 91.08 | 92.45 | 87.11 |
| 24 | PRS-30 | 32.53 | 32.78 | 33.97 | 291.91 | 259.22 | 231.48 | 89.97 | 88.77 | 87.20 |
| Time | Target Amount of Product | Actual Amount of Product | Total Amount of Quality | Processed Quantity | Availability Index (A) (%) | Performance Efficiency (PE) (%) | Quality Rate (Qr) (%) | OEE (%) |
|---|---|---|---|---|---|---|---|---|
| 2021 | 117,000 | 107,640 | 102,530.4 | 110,032 | 92.59 | 92.00 | 93.18 | 79.37 |
| 2022 | 115,700 | 104,130 | 101,334.4 | 107,640 | 92.07 | 90.00 | 94.14 | 78.01 |
| 2023 | 118,300 | 107,653 | 101,394.2 | 108,836 | 90.04 | 91.00 | 93.16 | 76.34 |
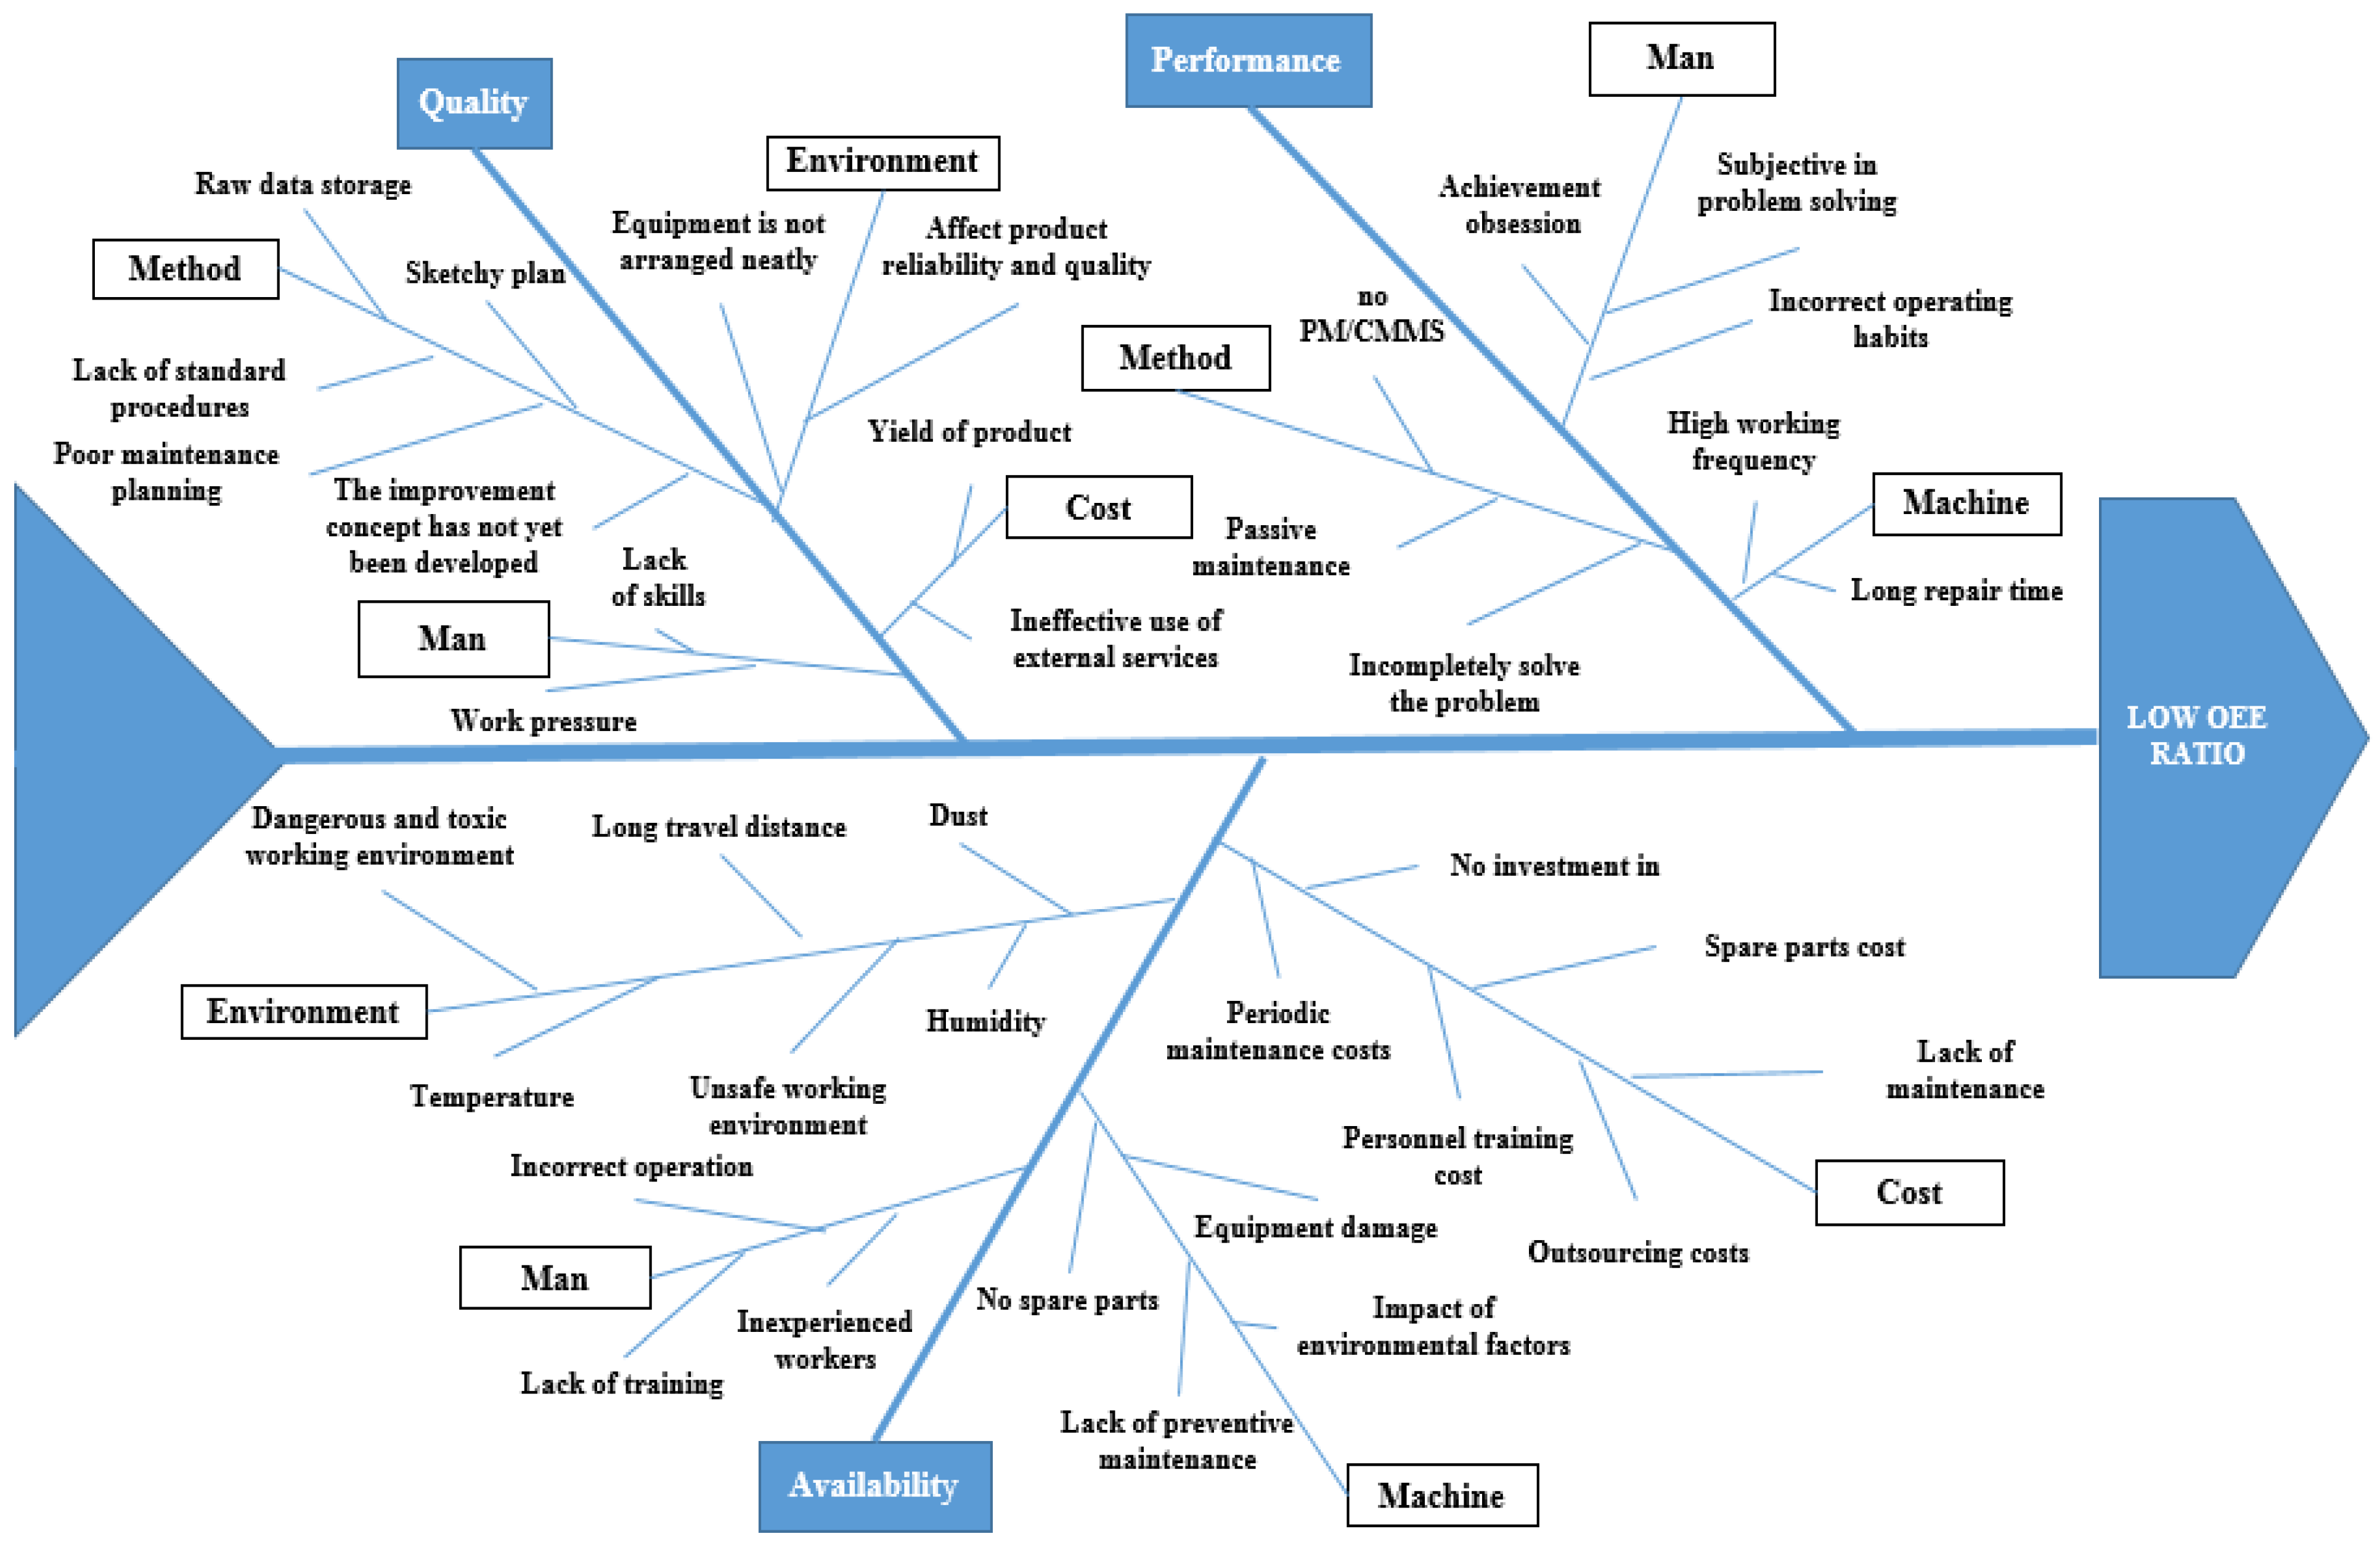
| Leading Causes | Impact on OEE Components | Detailed Description |
|---|---|---|
| Man | Availability, Performance, Quality | Lack of training, incorrect operation, incorrect operating habits, lack of skills |
| Machine | Availability, Performance | Equipment damage, no spare parts, long repair time |
| Method | Performance, Quality | Poor maintenance planning, lack of standard procedures, no PM/CMMS |
| Cost/Material | Availability, Quality | Lack of maintenance budget, no investment in improvement, ineffective use of external services |
| Environment | Quality, Availability | Temperature, humidity, dust, unsafe working environment, affect product reliability and quality |
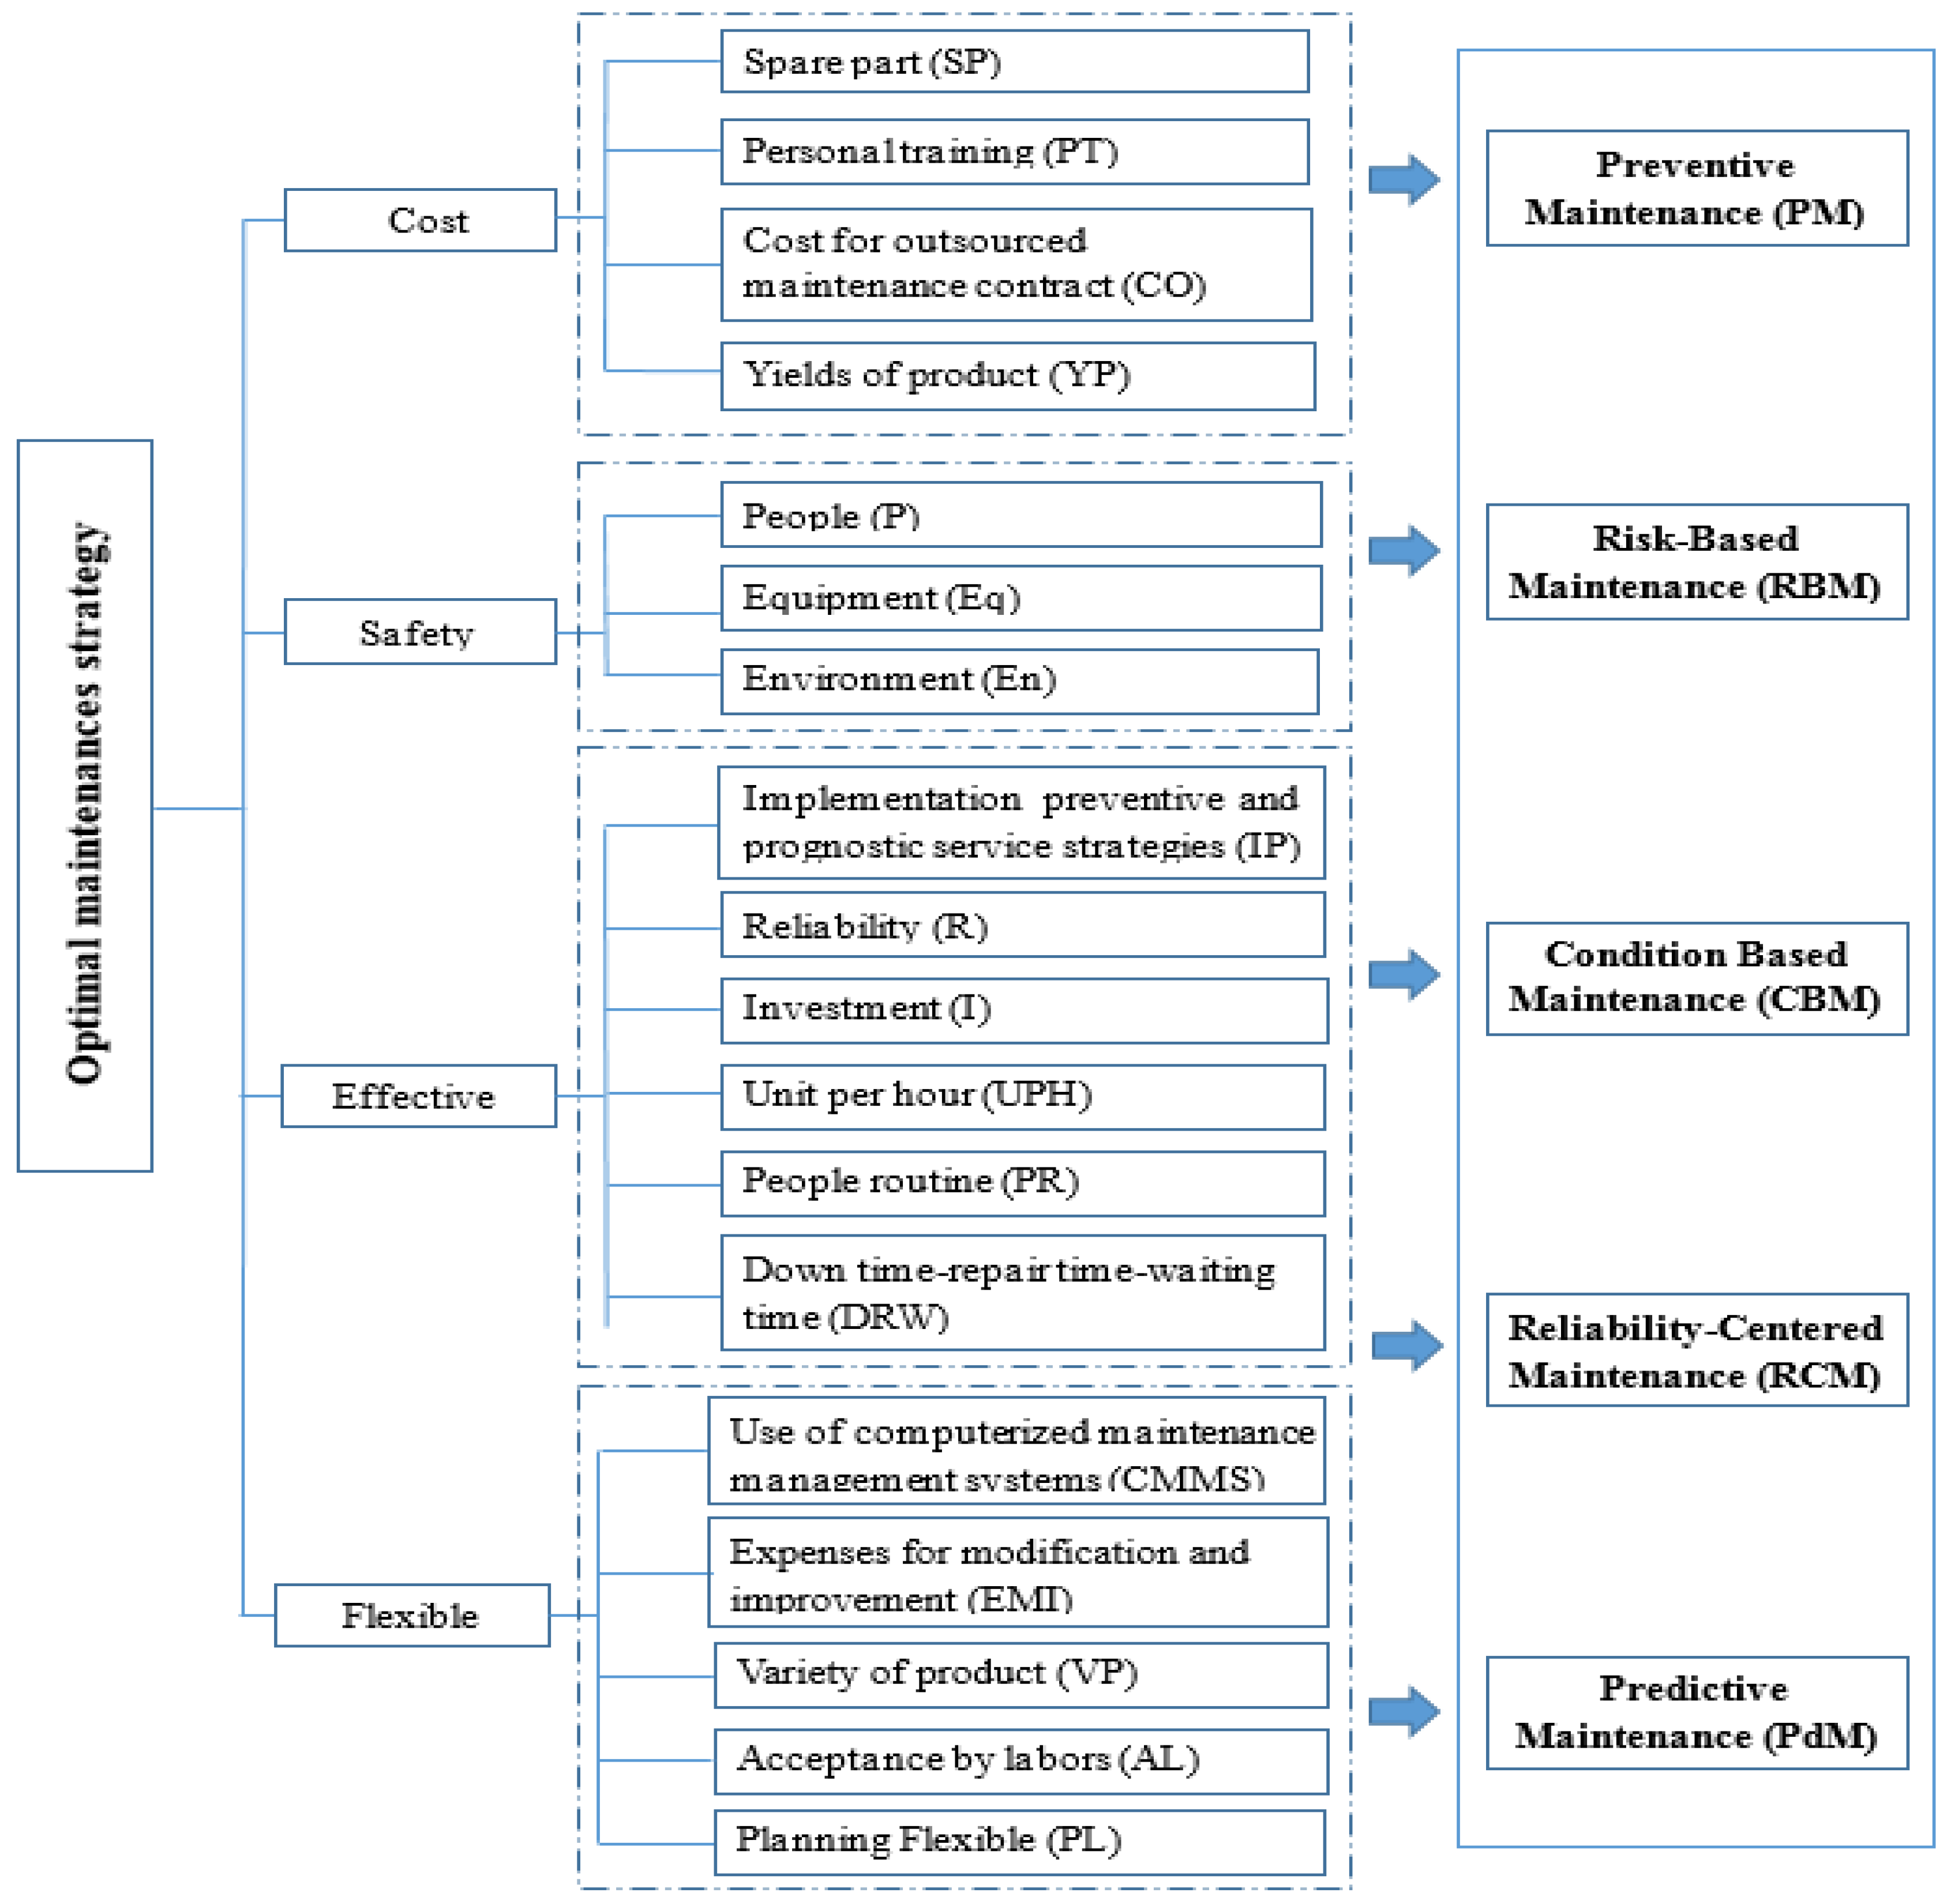
| AHP Criteria Group | Detailed Criteria (Link from Fishbone) | Impact on OEE |
|---|---|---|
| Cost | - Spare parts availability - Training cost - Outsourced maintenance cost - Productivity loss due to downtime | Availability, Quality |
| Safety | - Human safety - Equipment safety - Environmental safety | Quality, Availability |
| Efficiency | - Preventive/prognostic maintenance - Reliability - Investment capacity - Output per hour (UPH) - Operator habit/routine - Repair time/downtime | Availability, Performance, Quality |
| Flexibility | - Use of CMMS - Improvement cost - Product variety - Labor acceptance - Maintenance planning flexibility | Performance, Availability |
| Local Weights | Global Weights | CR | |||||||
|---|---|---|---|---|---|---|---|---|---|
| Cost | SP | PT | CO | YP | 0.055 | ||||
| SP | 1.000 | 0.333 | 4.000 | 0.333 | 0.175 | 0.010 | 0.079 | ||
| PT | 3.000 | 1.000 | 5.000 | 2.000 | 0.459 | 0.025 | |||
| CO | 0.250 | 0.200 | 1.000 | 0.333 | 0.075 | 0.004 | |||
| YP | 3.000 | 0.500 | 3.000 | 1.000 | 0.290 | 0.016 | |||
| Safety | P | Eq | En | 0.586 | |||||
| P | 1.000 | 5.000 | 2.000 | 0.556 | 0.326 | 0.052 | |||
| Eq | 0.200 | 1.000 | 0.200 | 0.090 | 0.053 | ||||
| En | 0.500 | 5.000 | 1.000 | 0.354 | 0.207 | ||||
| Effective | IP | R | I | UPH | PR | DRW | 0.256 | ||
| IP | 1.000 | 2.000 | 1.000 | 1.000 | 2.000 | 2.000 | 0.218 | 0.056 | 0.082 |
| R | 0.500 | 1.000 | 2.000 | 1.000 | 0.500 | 1.000 | 0.145 | 0.037 | |
| I | 1.000 | 0.500 | 1.000 | 0.333 | 2.000 | 2.000 | 0.161 | 0.041 | |
| UPH | 1.000 | 1.000 | 3.000 | 1.000 | 1.000 | 2.000 | 0.213 | 0.055 | |
| PR | 0.500 | 2.000 | 0.500 | 1.000 | 1.000 | 2.000 | 0.165 | 0.042 | |
| DRW | 0.500 | 1.000 | 0.500 | 0.500 | 0.500 | 1.000 | 0.097 | 0.025 | |
| Flexible | CMMS | EMI | VP | AL | PL | 0.102 | |||
| CMMS | 1.000 | 0.500 | 0.500 | 0.333 | 1.000 | 0.108 | 0.011 | 0.084 | |
| EMI | 2.000 | 1.000 | 0.333 | 0.333 | 2.000 | 0.152 | 0.016 | ||
| VP | 2.000 | 3.000 | 1.000 | 3.000 | 2.000 | 0.359 | 0.037 | ||
| AL | 3.000 | 3.000 | 0.333 | 1.000 | 3.000 | 0.273 | 0.028 | ||
| PL | 1.000 | 0.500 | 0.500 | 0.333 | 1.000 | 0.108 | 0.011 | ||
| Main Criteria | Sub Criteria | Maintenance Strategy | ||||
|---|---|---|---|---|---|---|
| PM | RBM | CBM | RCM | PdM | ||
| Cost | SP | 70 | 50 | 50 | 80 | 70 |
| PT | 90 | 90 | 70 | 90 | 90 | |
| CO | 60 | 30 | 50 | 40 | 30 | |
| YP | 30 | 20 | 40 | 40 | 20 | |
| Safety | P | 20 | 40 | 50 | 80 | 40 |
| EQ | 50 | 50 | 50 | 80 | 90 | |
| EN | 20 | 40 | 30 | 80 | 60 | |
| Effective | IP | 20 | 60 | 70 | 90 | 80 |
| R | 20 | 50 | 40 | 90 | 60 | |
| I | 70 | 70 | 60 | 90 | 80 | |
| UPH | 50 | 50 | 30 | 50 | 20 | |
| PR | 20 | 50 | 40 | 80 | 40 | |
| DRW | 70 | 40 | 30 | 40 | 20 | |
| Flexible | CMMS | 20 | 60 | 60 | 90 | 90 |
| EMI | 20 | 60 | 60 | 90 | 90 | |
| VP | 20 | 40 | 30 | 60 | 60 | |
| AL | 30 | 40 | 50 | 70 | 50 | |
| PL | 20 | 50 | 40 | 80 | 80 | |
| No. | Criteria | Maintenance Strategy | |||||||
|---|---|---|---|---|---|---|---|---|---|
| PM | RBM | CBM | RCM | PdM | WEIGHT | ||||
| 1 | SP | 0.005 | 0.003 | 0.003 | 0.005 | 0.005 | 0.010 | 0.005 | 0.003 |
| 2 | PT | 0.012 | 0.012 | 0.009 | 0.012 | 0.012 | 0.025 | 0.012 | 0.009 |
| 3 | CO | 0.003 | 0.001 | 0.002 | 0.002 | 0.001 | 0.004 | 0.003 | 0.001 |
| 4 | YP | 0.007 | 0.005 | 0.009 | 0.009 | 0.005 | 0.016 | 0.009 | 0.005 |
| 5 | P | 0.058 | 0.117 | 0.146 | 0.233 | 0.117 | 0.326 | 0.233 | 0.058 |
| 6 | EQ | 0.018 | 0.018 | 0.018 | 0.029 | 0.032 | 0.053 | 0.032 | 0.018 |
| 7 | EN | 0.037 | 0.073 | 0.055 | 0.146 | 0.110 | 0.207 | 0.146 | 0.037 |
| 8 | IP | 0.007 | 0.022 | 0.026 | 0.033 | 0.029 | 0.056 | 0.033 | 0.007 |
| 9 | R | 0.006 | 0.015 | 0.012 | 0.026 | 0.018 | 0.037 | 0.026 | 0.006 |
| 10 | I | 0.017 | 0.017 | 0.015 | 0.022 | 0.020 | 0.041 | 0.022 | 0.015 |
| 11 | UPH | 0.029 | 0.029 | 0.017 | 0.029 | 0.012 | 0.055 | 0.029 | 0.012 |
| 12 | PR | 0.008 | 0.019 | 0.015 | 0.030 | 0.015 | 0.042 | 0.030 | 0.008 |
| 13 | DRW | 0.018 | 0.010 | 0.008 | 0.010 | 0.005 | 0.025 | 0.018 | 0.005 |
| 14 | CMMS | 0.002 | 0.005 | 0.006 | 0.006 | 0.005 | 0.011 | 0.006 | 0.002 |
| 15 | EMI | 0.002 | 0.006 | 0.006 | 0.009 | 0.009 | 0.016 | 0.009 | 0.002 |
| 16 | VP | 0.007 | 0.015 | 0.011 | 0.022 | 0.022 | 0.037 | 0.022 | 0.007 |
| 17 | AL | 0.008 | 0.010 | 0.013 | 0.018 | 0.013 | 0.028 | 0.018 | 0.008 |
| 18 | PL | 0.002 | 0.004 | 0.003 | 0.007 | 0.007 | 0.011 | 0.007 | 0.002 |
| Maintenance Strategy | TOPSIS Method Results | EDAS Method Results | ||||||
|---|---|---|---|---|---|---|---|---|
| RANK | NSPi | NSNi | ASi | RANK | ||||
| PM | 0.212 | 0.022 | 0.095 | 5 | 0.049 | 0 | 0.024 | 5 |
| RBM | 0.141 | 0.075 | 0.347 | 4 | 0.044 | 0.364 | 0.204 | 4 |
| CBM | 0.131 | 0.092 | 0.414 | 3 | 0.120 | 0.461 | 0.291 | 3 |
| RCM | 0.009 | 0.212 | 0.961 | 1 | 1 | 0.854 | 0.927 | 1 |
| PdM | 0.126 | 0.100 | 0.443 | 2 | 0.257 | 0.469 | 0.363 | 2 |
| Strategy | Advantages | Disadvantages |
|---|---|---|
| RCM (Reliability-Centered Maintenance) | - Focuses on critical failure modes for optimal resource allocation - Balances cost, safety, and reliability - Proactively reduces unexpected breakdowns - Improves system reliability and availability | - Requires extensive data analysis and system knowledge - High initial implementation effort (e.g., training, FMEA tools) |
| PdM (Predictive Maintenance) | - Enables real-time failure prediction using advanced sensors and data analytics - Reduces unnecessary maintenance and extends equipment life - Supports better planning and resource use | - High initial investment in technology and infrastructure - Requires technical expertise for data interpretation |
| CBM (Condition-Based Maintenance) | - Avoids over-maintenance by acting only when the conditions warrant it - Effective in preventing unexpected breakdowns - Improves spare parts and labor utilization | - Demands continuous condition monitoring - Requires skilled personnel and adds system complexity |
| RBM (Risk-Based Maintenance) | - Prioritizes high-risk assets, ensuring efficient allocation of resources - Supports decision-making under uncertainty | - Lacks real-time condition monitoring - Can overlook lower-risk assets, leading to eventual inefficiencies |
| PM (Preventive Maintenance) | - Simple to implement and widely understood - Reduces chances of sudden equipment failure through scheduled checks | - Based on time/usage intervals, not actual equipment condition - Can lead to unnecessary downtime and increased cost |
Disclaimer/Publisher’s Note: The statements, opinions and data contained in all publications are solely those of the individual author(s) and contributor(s) and not of MDPI and/or the editor(s). MDPI and/or the editor(s) disclaim responsibility for any injury to people or property resulting from any ideas, methods, instructions or products referred to in the content. |
© 2025 by the authors. Licensee MDPI, Basel, Switzerland. This article is an open access article distributed under the terms and conditions of the Creative Commons Attribution (CC BY) license (https://creativecommons.org/licenses/by/4.0/).
Share and Cite
Wang, C.-N.; Hsueh, M.-H.; Tran Thi, D.-O.; Le, T.D.-M.; Dinh, Q.-T. Optimal Maintenance Strategy Selection for Oil and Gas Industry Equipment Using a Combined Analytical Hierarchy Process–Technique for Order of Preference by Similarity to an Ideal Solution: A Case Study in the Oil and Gas Industry. Processes 2025, 13, 1389. https://doi.org/10.3390/pr13051389
Wang C-N, Hsueh M-H, Tran Thi D-O, Le TD-M, Dinh Q-T. Optimal Maintenance Strategy Selection for Oil and Gas Industry Equipment Using a Combined Analytical Hierarchy Process–Technique for Order of Preference by Similarity to an Ideal Solution: A Case Study in the Oil and Gas Industry. Processes. 2025; 13(5):1389. https://doi.org/10.3390/pr13051389
Chicago/Turabian StyleWang, Chia-Nan, Ming-Hsien Hsueh, Duy-Oanh Tran Thi, Thi Diem-My Le, and Quang-Tuyen Dinh. 2025. "Optimal Maintenance Strategy Selection for Oil and Gas Industry Equipment Using a Combined Analytical Hierarchy Process–Technique for Order of Preference by Similarity to an Ideal Solution: A Case Study in the Oil and Gas Industry" Processes 13, no. 5: 1389. https://doi.org/10.3390/pr13051389
APA StyleWang, C.-N., Hsueh, M.-H., Tran Thi, D.-O., Le, T. D.-M., & Dinh, Q.-T. (2025). Optimal Maintenance Strategy Selection for Oil and Gas Industry Equipment Using a Combined Analytical Hierarchy Process–Technique for Order of Preference by Similarity to an Ideal Solution: A Case Study in the Oil and Gas Industry. Processes, 13(5), 1389. https://doi.org/10.3390/pr13051389