Article

Intelligent Classification Method for Tight Sandstone Reservoir Evaluation Based on Optimized Genetic Algorithm and Extreme Gradient Boosting

1
Sanya Offshore Oil & Gas Research Institute, Northeast Petroleum University, Sanya 572025, China
2
School of Computer & Information Technology, Northeast Petroleum University, Daqing 163318, China
3
School of Earth Sciences, Northeast Petroleum University, Daqing 163318, China
4
National Key Laboratory of Continental Shale Oil, Daqing 163712, China
5
Hainan Vocational University of Science and Technology, Haikou 571126, China
*
Author to whom correspondence should be addressed.
Processes 2025, 13(5), 1379; https://doi.org/10.3390/pr13051379
Submission received: 25 March 2025 / Revised: 27 April 2025 / Accepted: 28 April 2025 / Published: 30 April 2025

Abstract

:
Reservoir evaluation is essential in oil and gas exploration, influencing development decisions. Traditional classification methods are often limited by small sample sizes and low accuracy, restricting their effectiveness. To address this, we propose an intelligent classification method, GA-XGBoost, which integrates Genetic Algorithm (GA) optimization with Extreme Gradient Boosting (XGBoost) to enhance the classification accuracy in small-sample scenarios. The lithological, physical, and lithofacies characteristics of tight sandstone reservoirs are analyzed, and key evaluation parameters—including the mineral composition, porosity, permeability, oil saturation, and logging data (GR, SP, CAL, DEN, AC, LLS)—are selected. After data normalization, the GA-XGBoost model is developed and compared with SVM, XGBoost, and AdaBoost models. The experimental results demonstrate that GA-XGBoost achieves an 88.8% classification precision, outperforming traditional algorithms in both efficiency and accuracy. This study advances experiments on and the standardization of intelligent reservoir evaluations, providing a more reliable classification approach for tight sandstone reservoirs. Additionally, it contributes to the integration of geological exploration and computational intelligence, offering new insights into the application of machine learning in geosciences.

1. Introduction

With the rapid development of artificial intelligence technology, reservoir evaluation methods are gradually transitioning from traditional experience-based judgment to intelligent analysis. For a long time, the exploration and development industry has primarily relied on expert experience for a qualitative evaluation of tight sandstone reservoirs. This method not only involves a heavy workload and high labor costs but also is prone to subjective influence in the face of complex geological conditions, thereby constraining the efficient development of tight sandstone reservoirs [1,2,3]. In recent years, numerous researchers have dedicated themselves to solving reservoir evaluation problems using artificial intelligence technology [4], integrating logging data and core data based on computer technology for an efficient and accurate reservoir classification and evaluation. Therefore, the development of intelligent reservoir classification valuation methods is of great significance for improving oil and gas exploration and the development efficiency [5].
Currently, reservoir classification methods can be mainly divided into three categories: traditional evaluation and classification [6], single-parameter classification [7,8], and multi-parameter classification [9,10,11]. Traditional classification methods rely on geological parameters obtained from logging to analyze the influence of the structure, sedimentary environment, and diagenesis on the physical properties of tight sandstone reservoirs, and then evaluate the coupling relationships among different geological factors to classify the reservoirs. For example, Haitao Li et al. (2021) [12] proposed a tight sandstone reservoir evaluation method based on petrophysical experiments and utilized acoustic, resistivity, nuclear magnetic resonance, and other parameters to evaluate the reservoir quality. Shalaby et al. (2023) [13] conducted a comprehensive evaluation by combining such methods as rock physics, lithofacies analysis, and logging interpretation. However, due to significant differences in geological characteristics among different oilfields and reservoirs, traditional evaluation methods can hardly ensure widespread applicability, affecting the final evaluation results. Single-parameter reservoir classification methods primarily classify reservoirs based on a single parameter (such as porosity, permeability). For instance, JinLai et al. (2019) [14] used porosity to predict the carbonate reservoir quality. Abbas et al. (2019) [15] applied K-Means cluster analysis to reservoir electrofacies classification, achieving excellent predictive results. Such methods feature relatively simple model structures and lower computational costs, but they neglect the complex nonlinear relationships among parameters, leading to lower reservoir classification accuracy and making it difficult to meet the refined evaluation needs of tight sandstone reservoirs. Compared to traditional methods and single-parameter methods, multi-parameter classification methods combine artificial intelligence technology and integrate multiple parameters to improve the classification accuracy. XingLei Song et al. (2024) [16] proposed a machine learning model based on multiple parameters to classify reservoirs by fitting the relationship between initial productivity and the high-pressure mercury injection index. Pan et al. (2022) [17] established a reservoir quality evaluation method based on conventional logging. Xie et al. (2023) [18] introduced an evaluation classification method based on the principal component analysis clustering mean and effectively classified reservoirs using flexible membership degrees. Yingmin Cui et al. (2024) [19] proposed a classification method for tight sandstone reservoir flow units based on a neural network model and used logging curve parameters for reservoir classification. Long Chen et al. (2024) [20] classified reservoir types using parameters such as porosity, permeability, and flow unit factors through the K-means algorithm but did not consider other factors affecting the reservoir. Longfei Ma et al. (2022) [21] proposed a Gradient Boosting Decision Tree (GBDT) machine learning model, and selected parameters such as the porosity, permeability, resistivity, mud content, and sand-strata ratio for the reservoir evaluation and classification. This method addressed the issue of imbalanced logging data but neglected the impact of logging curve parameters on the reservoir evaluation. Yuanzheng Li (2020) [22] proposed a reservoir evaluation prediction method based on double-layer convolutional neural network, with a prediction accuracy of 82.1%. XueFei Lu et al. (2023) [23] introduced a reservoir classification method based on Multi-Kernel Support Vector Machine (MK-SVM) and constructed a multi-kernel model using different kernel function combinations, improving the adaptability and accuracy of the reservoir evaluation.
In recent years, the XGBoost algorithm (Extreme Gradient Boosting) has been widely applied in the geological field due to its efficient classification capability [24]. Qingjun Chu et al. (2024) [25] proposed a lithology logging curve prediction method based on the XGBoost algorithm. This method outperforms some neural network models in recognition accuracy; however, its reservoir evaluation only considers the single parameter of the photoelectric absorption cross-section index, without fully utilizing multi-parameter feature information. Wei Liu et al. (2023) [26] presented a reservoir identification and prediction model based on the XGBoost method, but it relies solely on the overall thickness parameter without considering other influencing factors. Zhao Wang et al. (2023) [27] introduced an evaluation method of unconsolidated sandstone heavy oil based on XGBoost, and selected six logging data as model inputs for reservoir classification. However, this method does not account for the influence of the pore throat structure on model prediction, which reduces the applicability of the model.
These studies have made good progress in reservoir classification and evaluation, but issues such as the low model precision and low sensitivity of key parameters still exist [28]. Based on the idea of “complementary advantages” [29], a Genetic Algorithm (GA) and Extreme Gradient Boosting (XGBoost) Classification Method for Intelligent Reservoir Evaluation was proposed in this paper. This method integrates GA’s global search capability in hyperparameter optimization with XGBoost’s efficient feature selection and nonlinear mapping capabilities in ensemble learning to enhance the prediction accuracy and stability of the model.
The GA-XGBoost method is outlined as below (see Figure 1): Step 1, using the SHAP (Shapley Additive Explanations) method to calculate the importance of various reservoir parameters and selecting lithological, physical, and lithofacies parameters as criteria for reservoir classification; Step 2, preprocessing the model through normalized noise reduction to provide high-quality data for subsequent model training: Step 3, utilizing GA for the global optimization search for hyperparameters of the XGBoost model to overcome the inefficiency of traditional parameter tuning and improve the model’s generalization ability; Step 4, applying the GA-optimized XGBoost model to reservoir classification tasks.

2. Overview of the Study Area

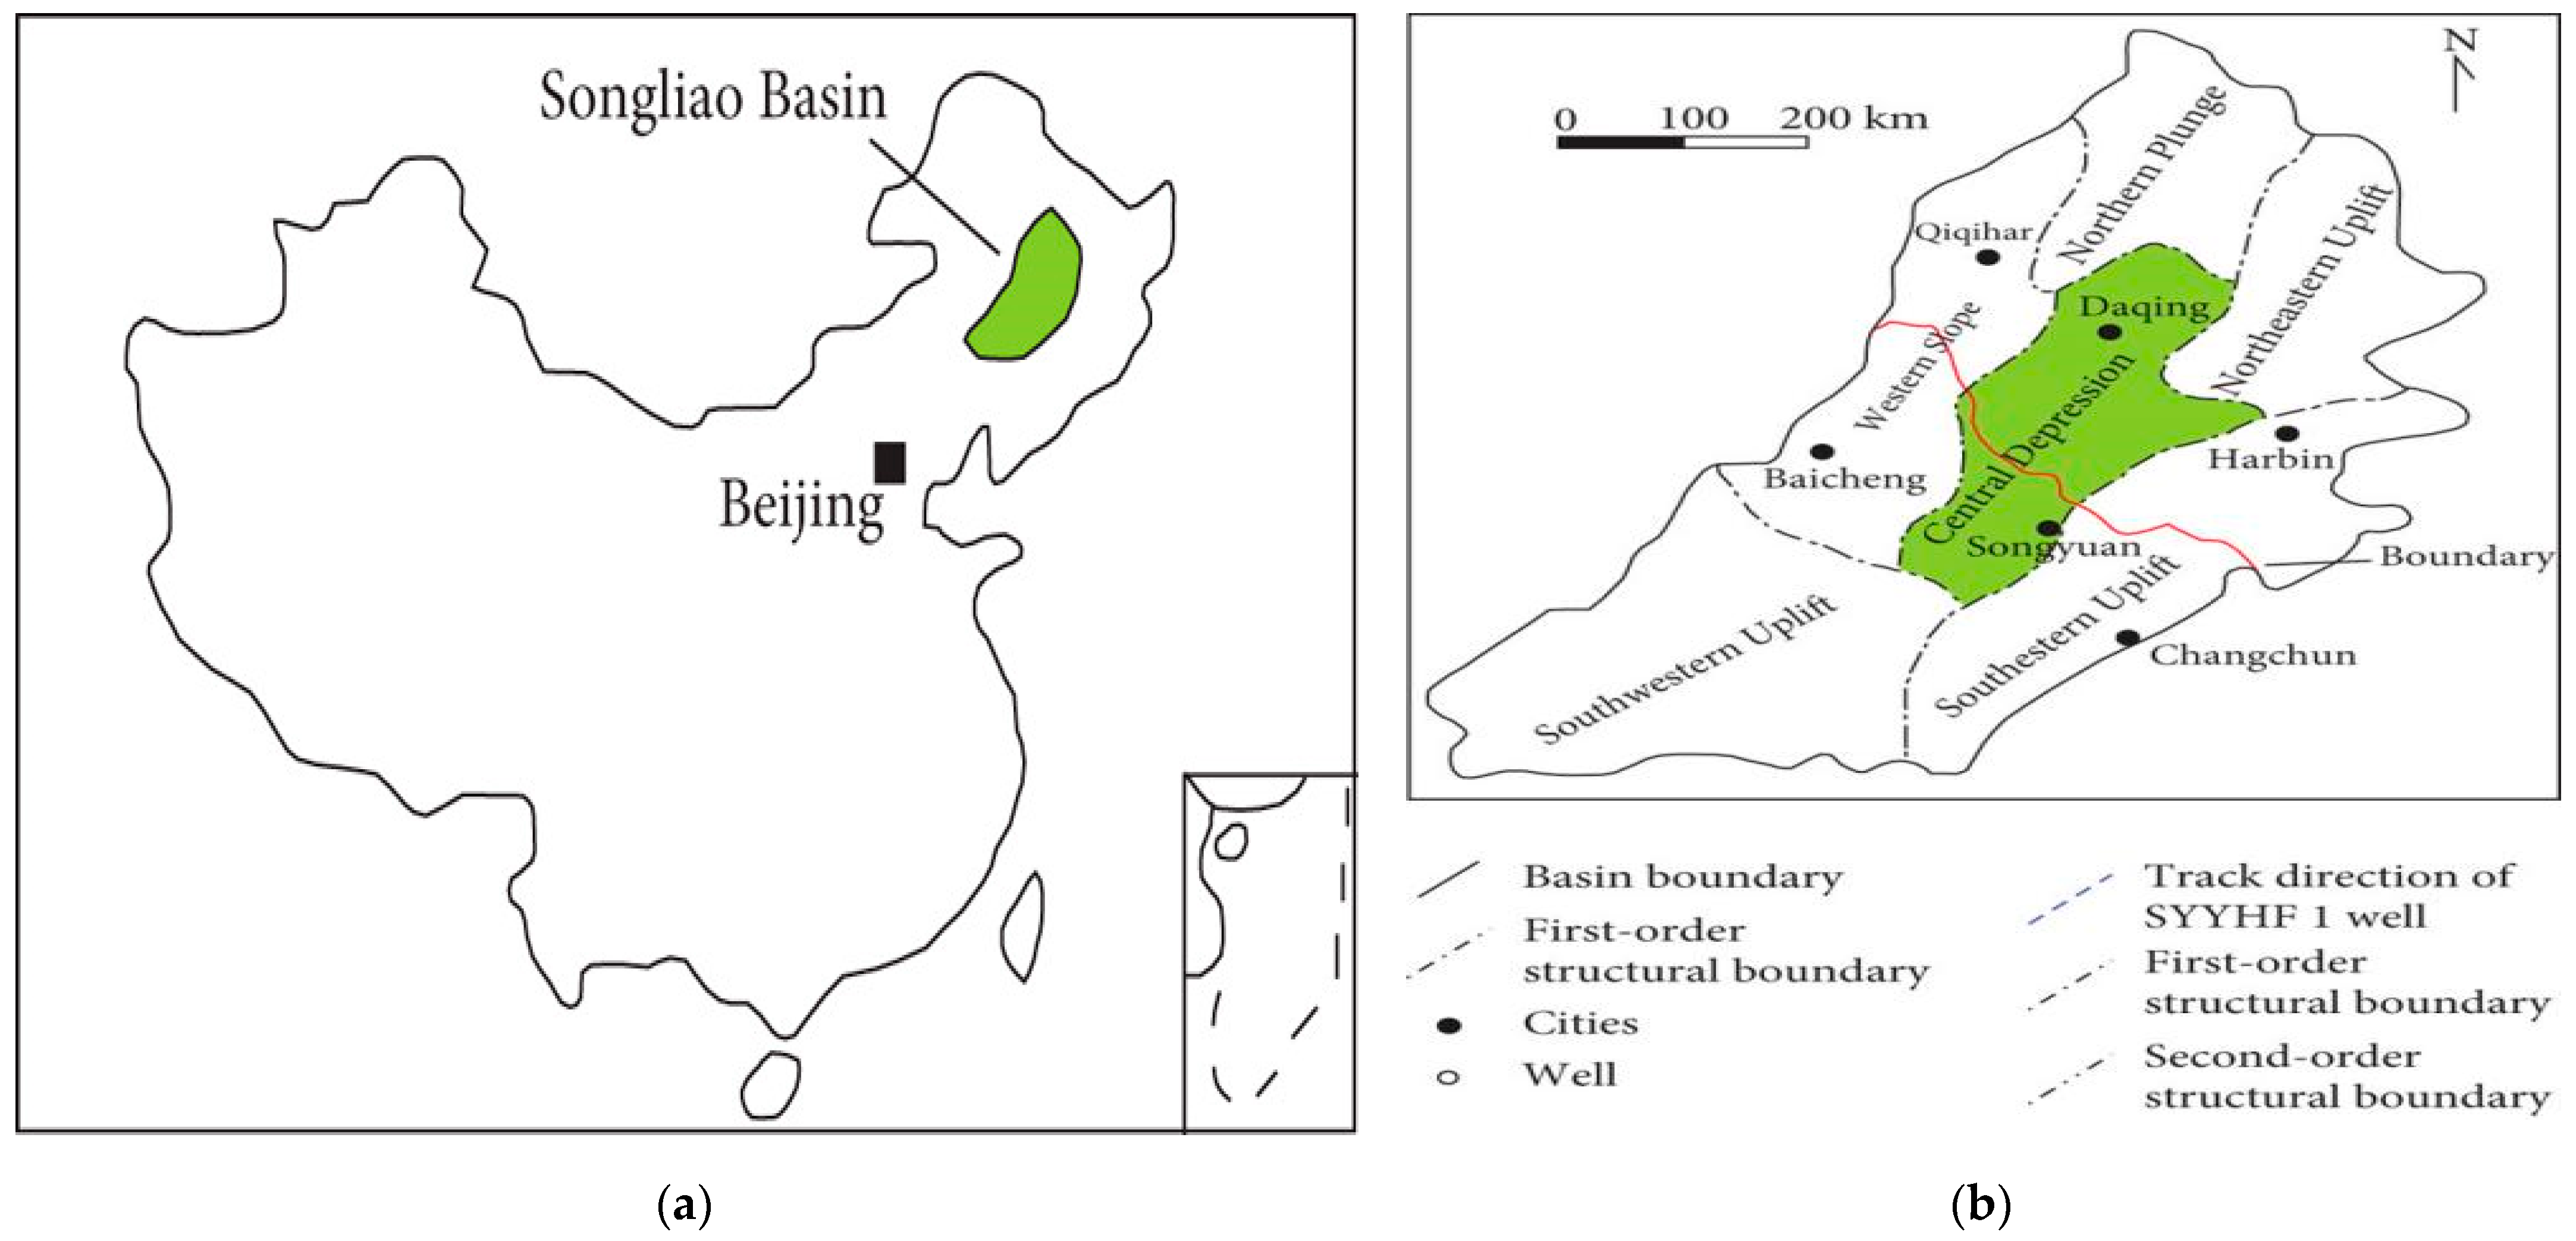
Fuyu Reservoir in Sanzhao Sag, as a crucial secondary tectonic unit of Songliao Basin, spans Daqing City, Anda City, and the Sanzhao area (Zhaodong, Zhaozhou and Zhaoyuan) in Heilongjiang Province (see Figure 2). The lithology of this reservoir primarily consists of fine sandstone, argillaceous sandstone, and mudstone, and the overall reservoir exhibits high density characteristics, which restrict its reservoir performance. The spatial distribution of the reservoir lithology is constrained by logging parameters, and the differences in physical properties among different lithological types directly determine the division precision of high-quality reservoirs. Therefore, an in-depth analysis of the reservoir lithological characteristics not only aids in accurately depicting the reservoir structure but also provides a crucial basis for subsequent reservoir classification and evaluation.

2.1. Lithological Characteristics of the Reservoir

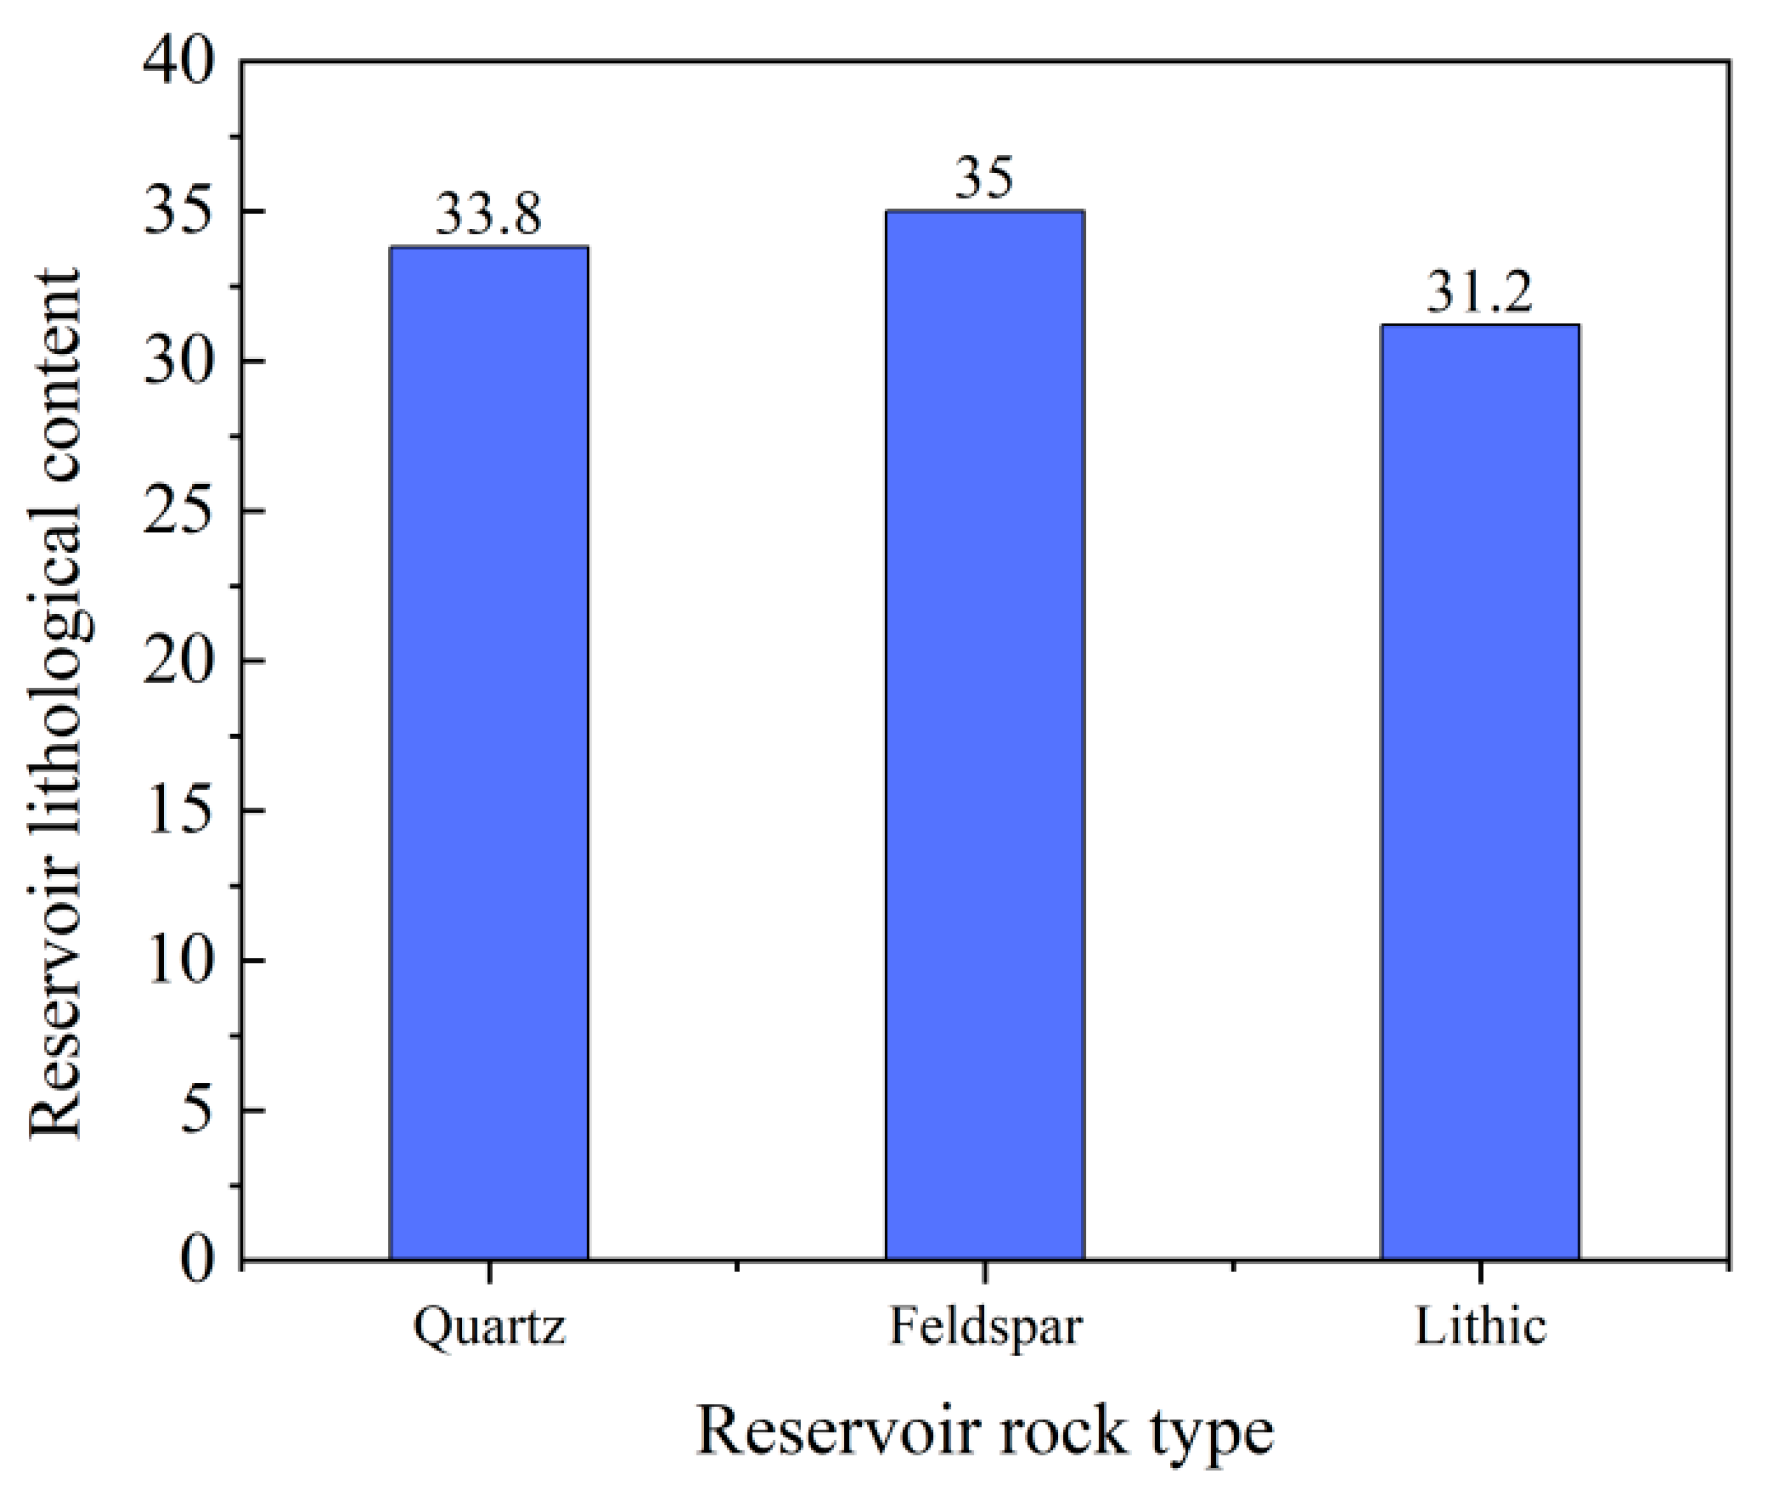
The reservoir lithology difference is one of the key bases for reservoir evaluations, which directly affects the physical characteristics and fluid distribution patterns of the reservoir. The sandstone types in Fuyu Reservoir are dominated by feldspar lithic sandstone, and its clastic content ranges from 78.6% to 82.5%, primarily composed of quartz, feldspar, and lithic fragments. Specifically, the average quartz content is 26.2–32.8%, the average feldspar content is 34.6–38.3%, and the lithic fragment content ranges from 29.7% to 38.2% (see Figure 3), reflecting the multi-source sedimentary characteristics of the reservoir.
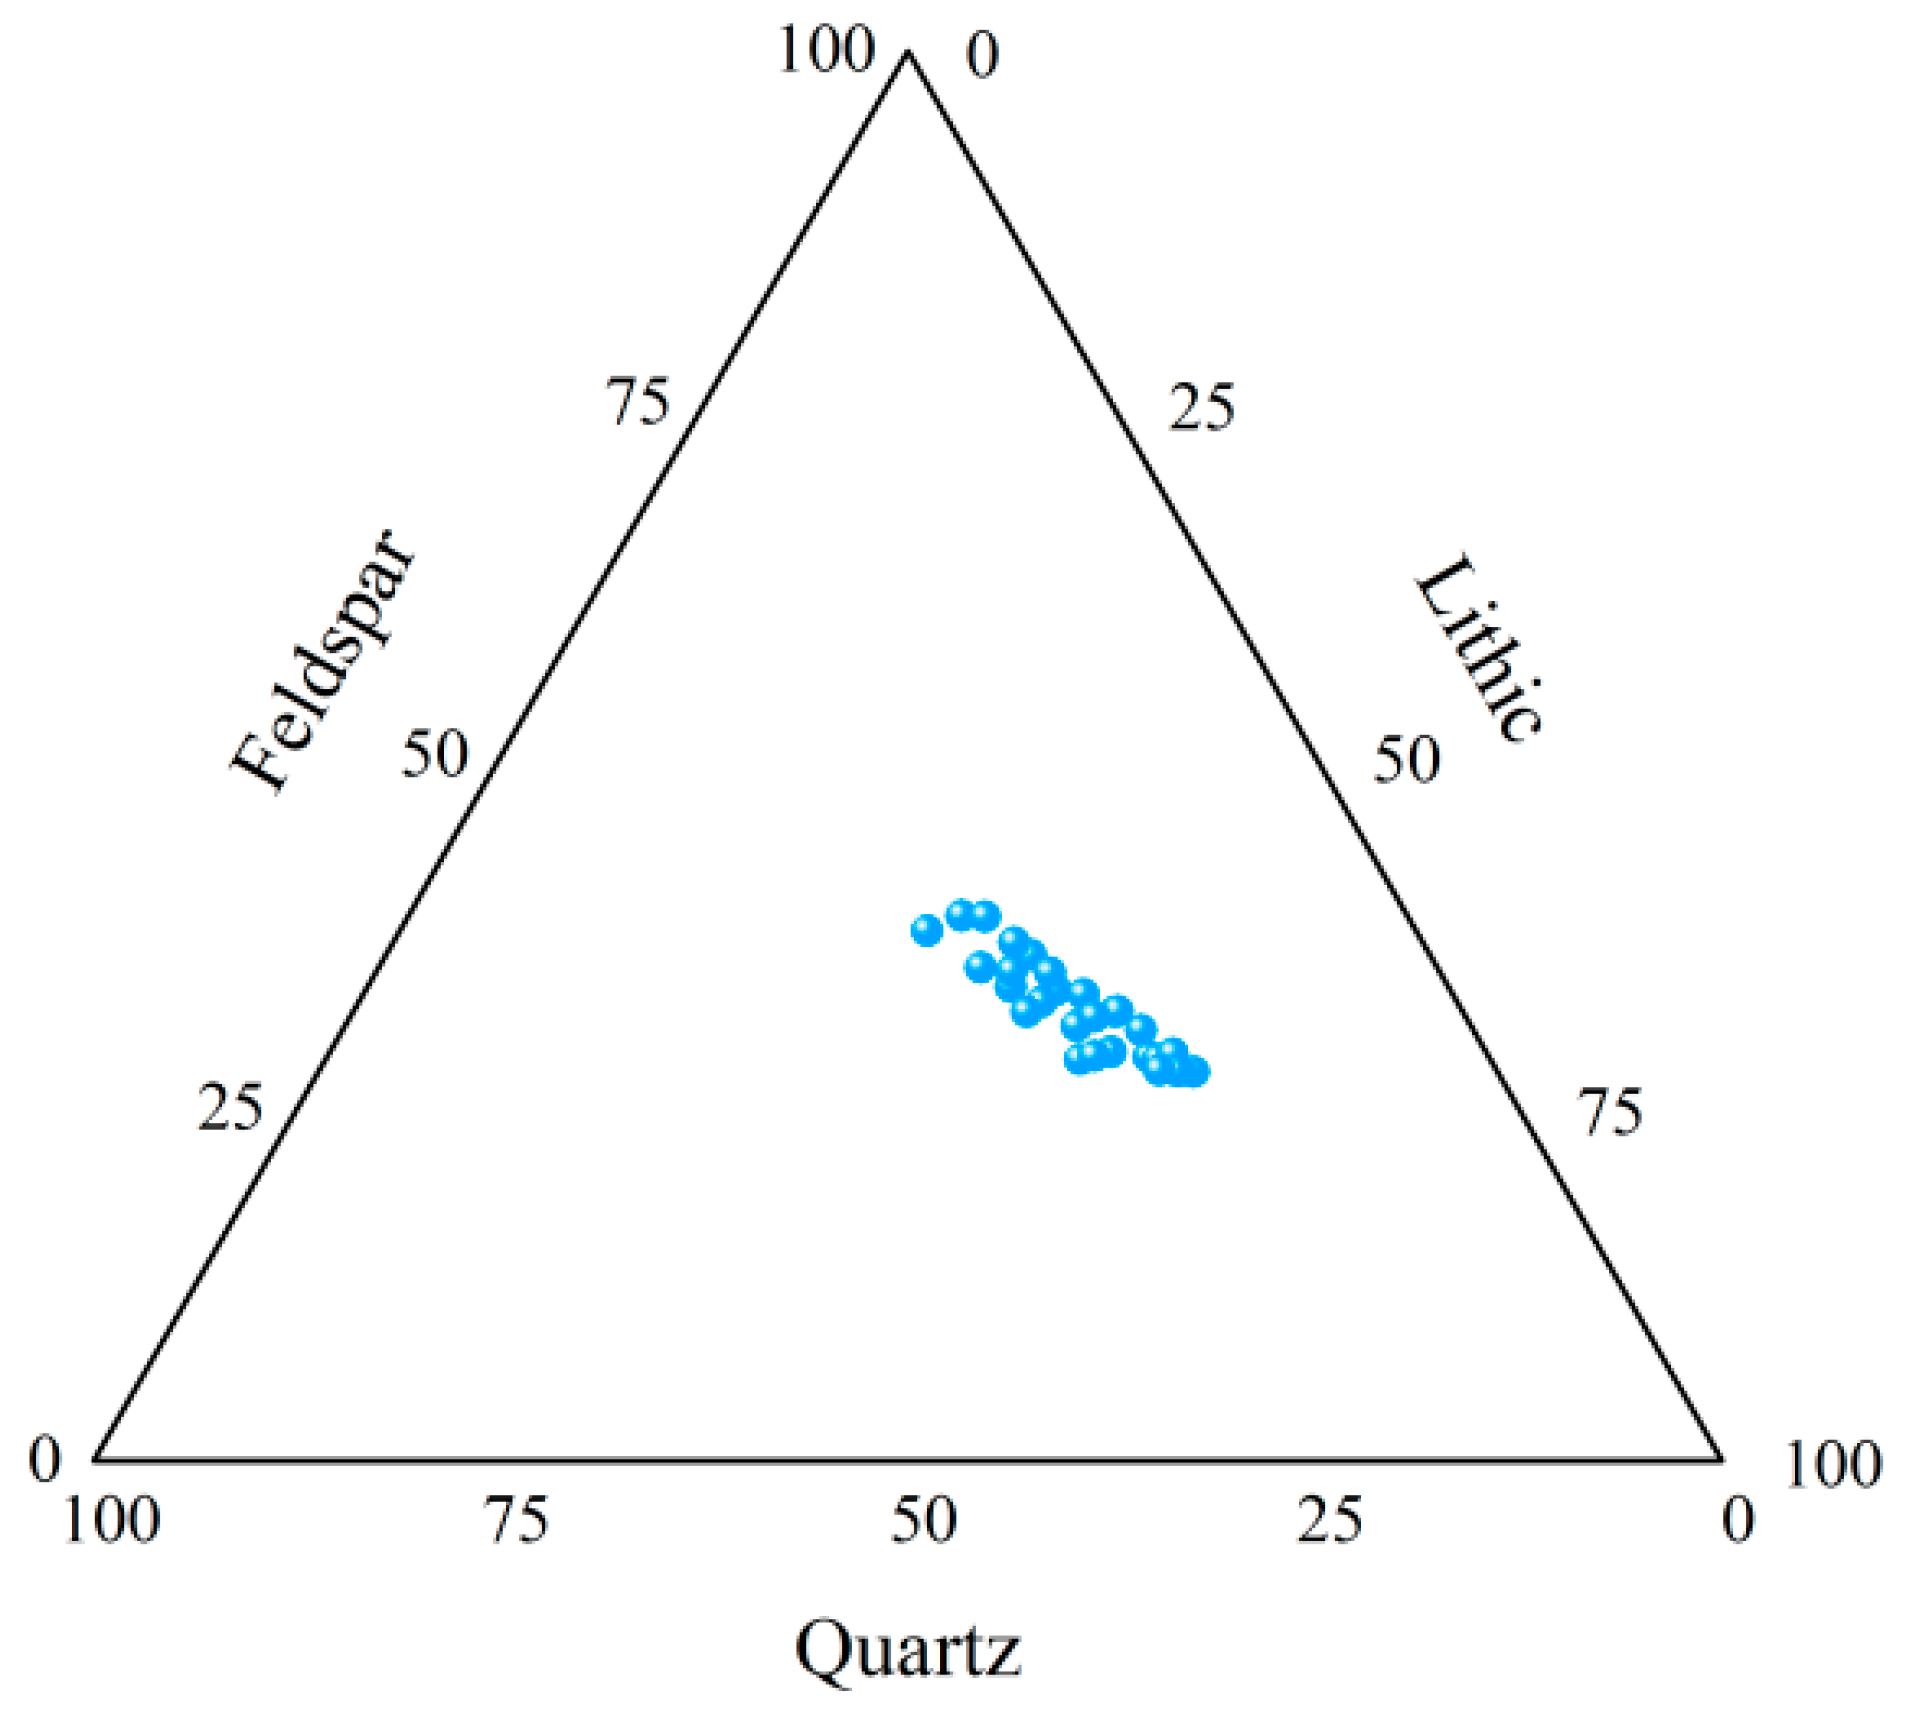
The triangulation of rock types in dense sandstone of the Fuyu Reservoir in Sanzhao Sag is shown in Figure 4 below. In the reservoir evaluation process, quartz, feldspar, and lithic fragments were selected as key input parameters to predict reservoir physical parameters and their spatial distribution characteristics, thereby establishing an accurate comprehensive reservoir evaluation system.

2.2. Physical Characteristics of the Reservoir

The physical property test results from three cored wells (B18, B183 and Z11) in the study area were selected (see Table 1). The porosity and permeability of wells B18 and B183 were generally poor, with an average porosity of 10.1%, a peak porosity of 10~12%, and a permeability distribution range of (0.03~2.6) ×10−3 μm.
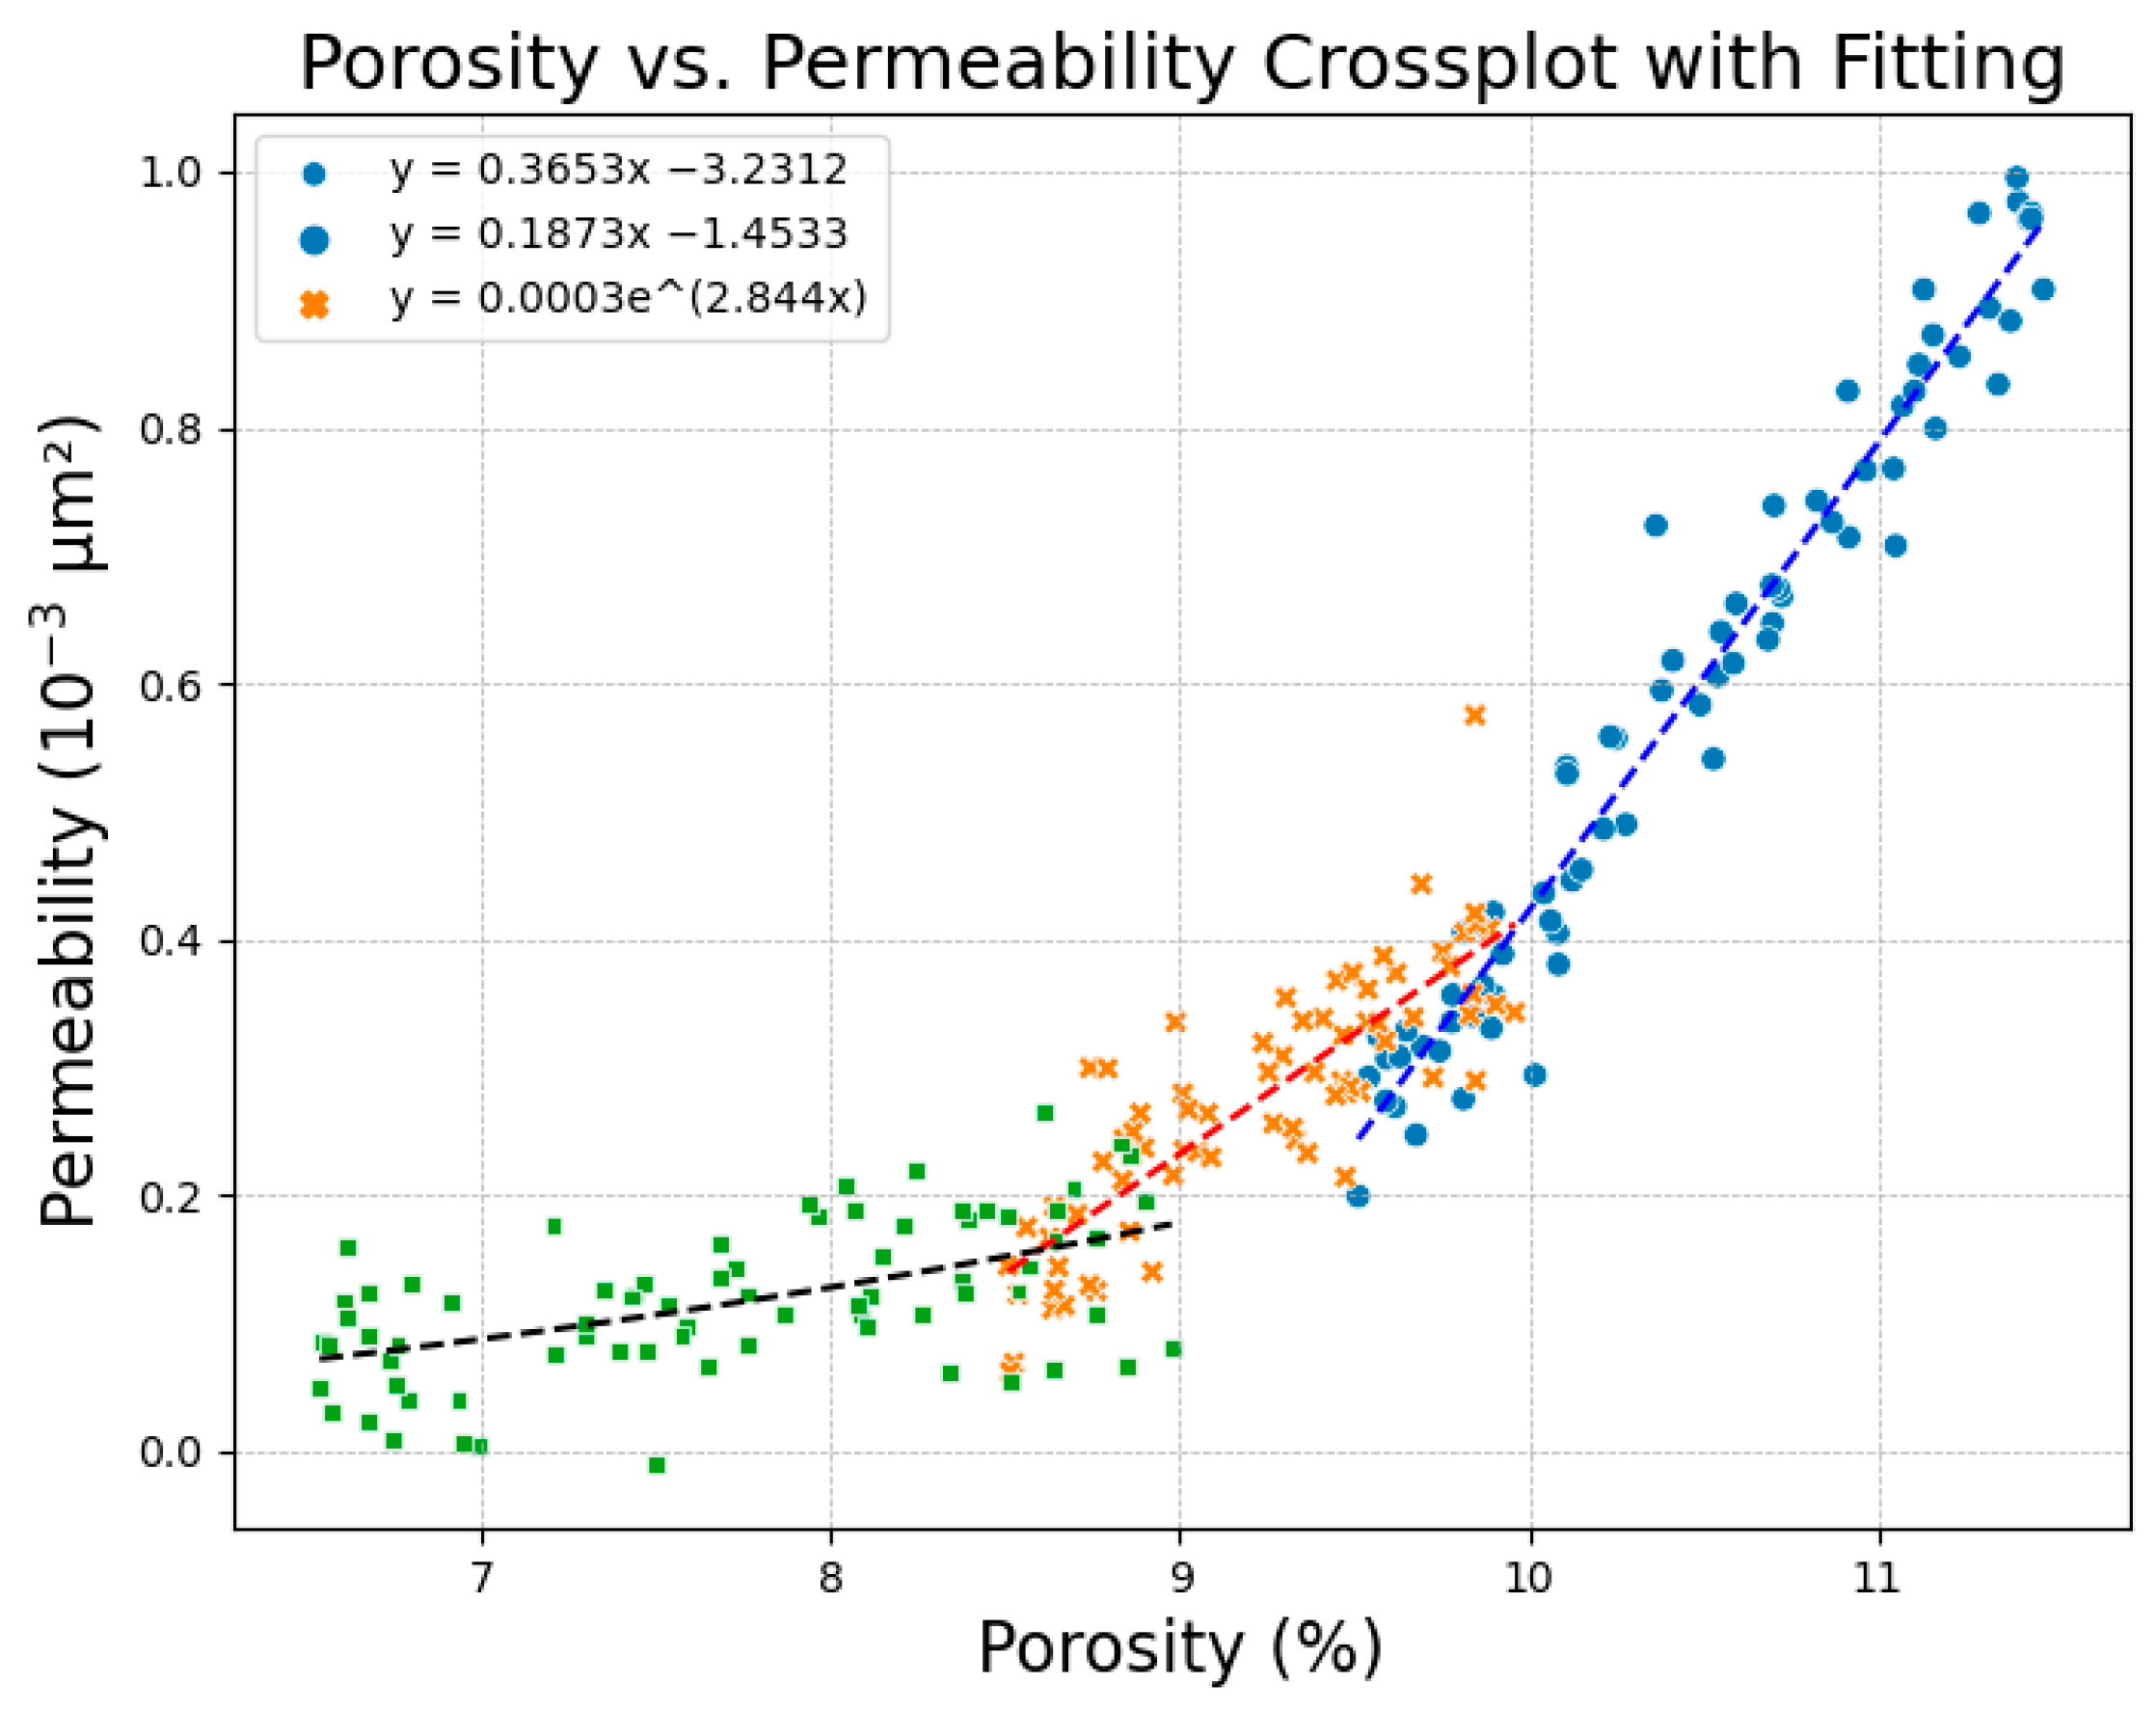
75 sets of data points were randomly selected from each type of reservoir to plot the relationship between porosity and permeability (see Figure 5). The results indicate a significant correlation between porosity and permeability, and the tightly distributed data points further verify that the characteristic that the reservoir is dominated by porosity tight sandstone. The fitting curve for high-porosity and high-permeability reservoirs has a larger slope, indicating that permeability is sensitive to porosity change, while the fitting curve for low-porosity and low-permeability reservoirs tends to be flat, reflecting the gradual changes in reservoir physical properties during lithological evolution. Therefore, porosity and permeability are important indicators for reservoir classification and evaluation as well as key parameters for revealing the evolution mechanism of reservoir physical properties [31].
The reservoir-forming mode of Fuyu Reservoir exhibits typical characteristics of “upper source, lower reservoir and backward flow”. The core mechanism lies in those faults, as the main channels for hydrocarbon migration, drive hydrocarbon to migrate from top to bottom. However, as hydrocarbons migrate vertically along fault channels, the filling potential energy decreases progressively, resulting in significant differentiation in oil saturation among reservoirs of equal physical properties at different burial depths and structural locations. Therefore, when conducting reservoir evaluation and classification, it is necessary to deeply analyze the spatial distribution patterns and controlling factors of oil-bearing property. Based on a detailed study of the oil–water distribution characteristics, combined with the degree of effective thickness development, distance from fault zones, differences in fault development types, and changes in saturation, the reservoir oil-bearing property can be classified into three categories: Category I reservoirs with oil saturation So > 55%, Category II reservoirs with oil saturation 35% ≤ So ≤ 55%, and Category III reservoirs with oil saturation So < 35%.

2.3. Lithofacies Characteristics of the Reservoir

The lithofacies types in the study area follow a division scheme of “lithological type + mineral composition + bedding structure”. Based on the lithological characteristics of dense sandstone, they are divided into three types: mudstone, sandstone, and sandstone transition rocks; based on the mineral composition, they are divided into fine sandstone and siltstone; and based on the bedding structure, they are divided into trough cross-bedding, tabular cross-bedding, parallel bedding, undulating bedding and horizontal bedding. By further classifying the lithofacies types, the following six specific types can be identified:
  • Tabular Cross-stratified Fine Sandstone, Sa
  • Troughed Cross-bedding Fine Sandstone, St
  • Parallel Stratified Fine Sandstone Facies, Sp
  • Undulating Stratified Fine Sandstone Facies, Sw
  • Horizontal Stratified Siltstone Facies, Fh
  • Undulating Bedding Argillaceous Siltstone, Fw
Subsequently, the principal component analysis (PCA) was used to calculate the contribution rate of logging curves in different lithofacies. First, the correlation between logging curve response characteristics and lithofacies was calculated, and the results were arranged in descending order. Then, partial and cumulative normalization processing was performed (see Table 2). Based on the results of the logging curve response characteristics, the six parameters with the highest contribution rates, GR, SP, CAL, DEN, AC, and LLS, were selected as input parameters for the reservoir evaluation and classification model.

3. Materials and Methods

This section elaborates on the research methods used in this study. First, the data from the Fuyu reservoir were analyzed, relevant feature parameters were selected, and the data were standardized. Then, the Genetic Algorithm was used to optimize the hyperparameters of the Extreme Gradient Boosting model to improve its performance. Finally, experiments were conducted to validate the effectiveness of the GA-XGBoost model. The model’s performance was evaluated by comparing it with other models, and its effectiveness in practical applications was verified.

3.1. Dataset Analysis

The statistical data, experimental logging data, and core data of the Fuyu Reservoir in Sanzhao Sag, Songliao Basin, were sourced from the Exploration and Development Research Institute of Daqing Oilfield Co., Ltd., Daqing, China (see Table 3).
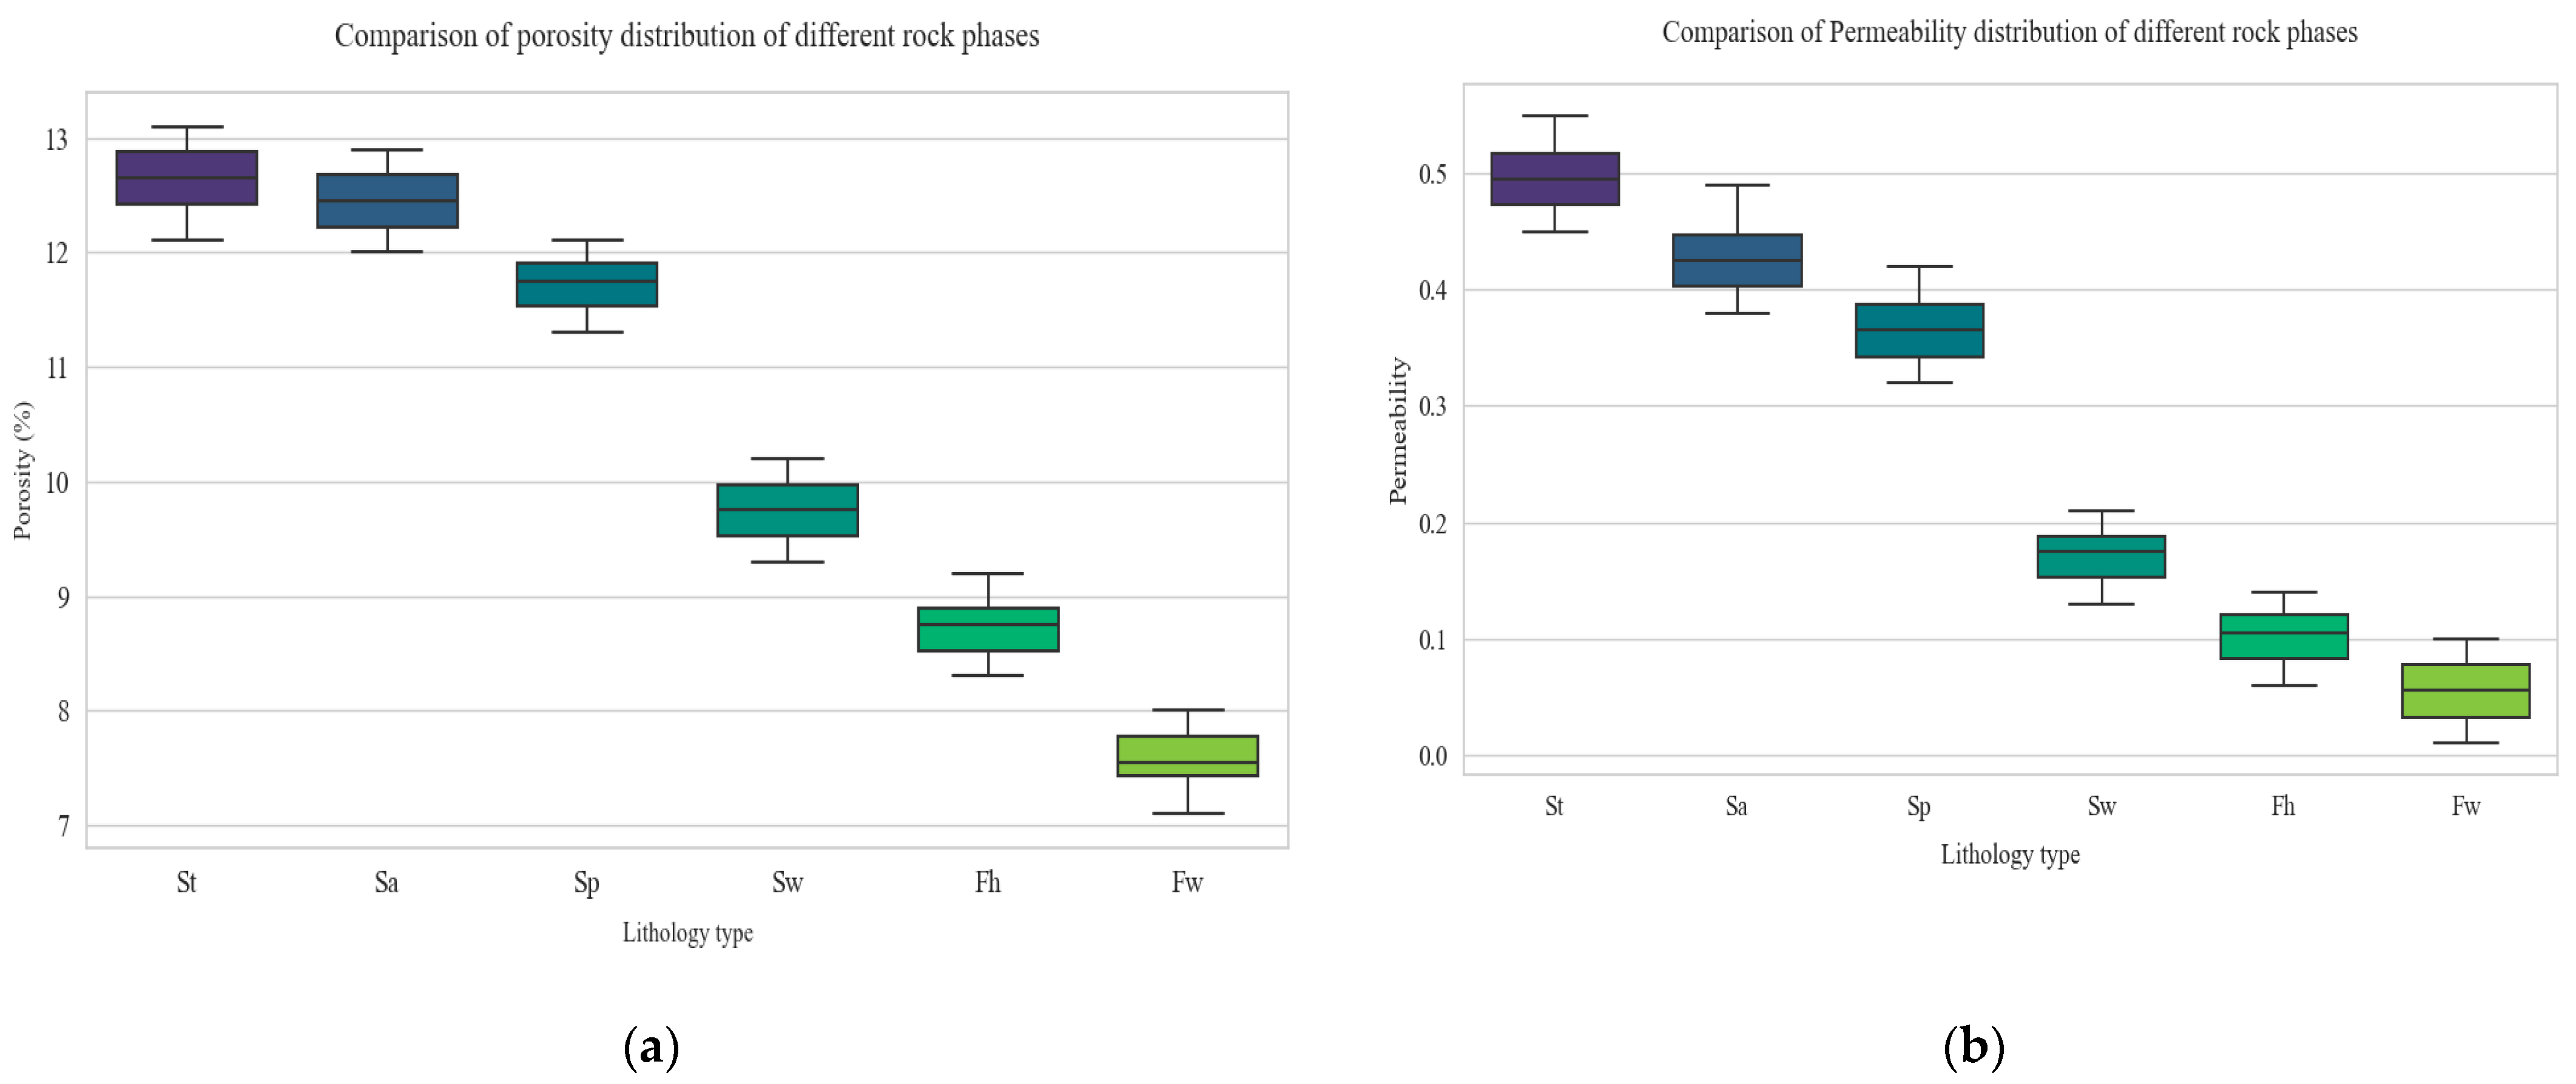
The porosity and permeability of various reservoir types classified by lithofacies are shown in Table 4 below, while Figure 6 provides a clearer illustration of the relationship between lithofacies types and the reservoir performance.
Based on the reservoir characteristics in the study area, Fuyu Reservoir in Sanzhao Sag, Songliao Basin can be classified into Class I, Class II and Class III reservoirs (see Table 5). Class I reservoirs primarily consist of fine sandstone and siltstone, and lithofacies types are mainly St, Sa and Sp. These reservoirs typically have the highest porosity (≥10%) and permeability (≥0.3 × 10⁻³ μm2), exhibiting the best reservoir performance. Class II reservoirs are dominated by fine sandstone and siltstone, and the main lithofacies are Sw. Their porosity ranges from 8% to 10%, and permeability from 0.1 to 0.3 × 10⁻³ μm2, indicating moderate reservoir performance. Class III reservoirs are mainly composed of siltstone and argillaceous siltstone, and the main lithofacies are Fh and Fw. These reservoirs have undergone strong diagenetic structure, resulting in dense pore structures. Consequently, their porosity is generally below 8%, and permeability is less than 0.1 × 10⁻³ μm2, greatly limiting fluid flow capacity.

3.1.1. Feature Parameter Selection

This paper aims to establish a scientific and reasonable evaluation index system for tight sandstone reservoirs by selecting related parameters of the lithology, reservoir physical property, and lithofacies type, and combining the SHAP method (Shapley Additive Explanations) for an in-depth data analysis to identify the critical logging parameters and physical characteristics for reservoir evaluations. The SHAP method, derived from game theory, can quantify the decision contribution of different features in machine learning models, and performs excellently in the explanatory analysis of nonlinear models [32,33]. Ultimately, 12 core evaluation parameters were selected from the perspectives of the reservoir microstructure, pore characteristics, lithofacies control factors, etc. These parameters include the following:
  • Mineral composition (quartz, feldspar, lithic)
  • Reservoir physical properties (porosity, permeability, oil saturation)
  • Logging curve parameters (GR, SP, CAL, DEN, AC, LLS)
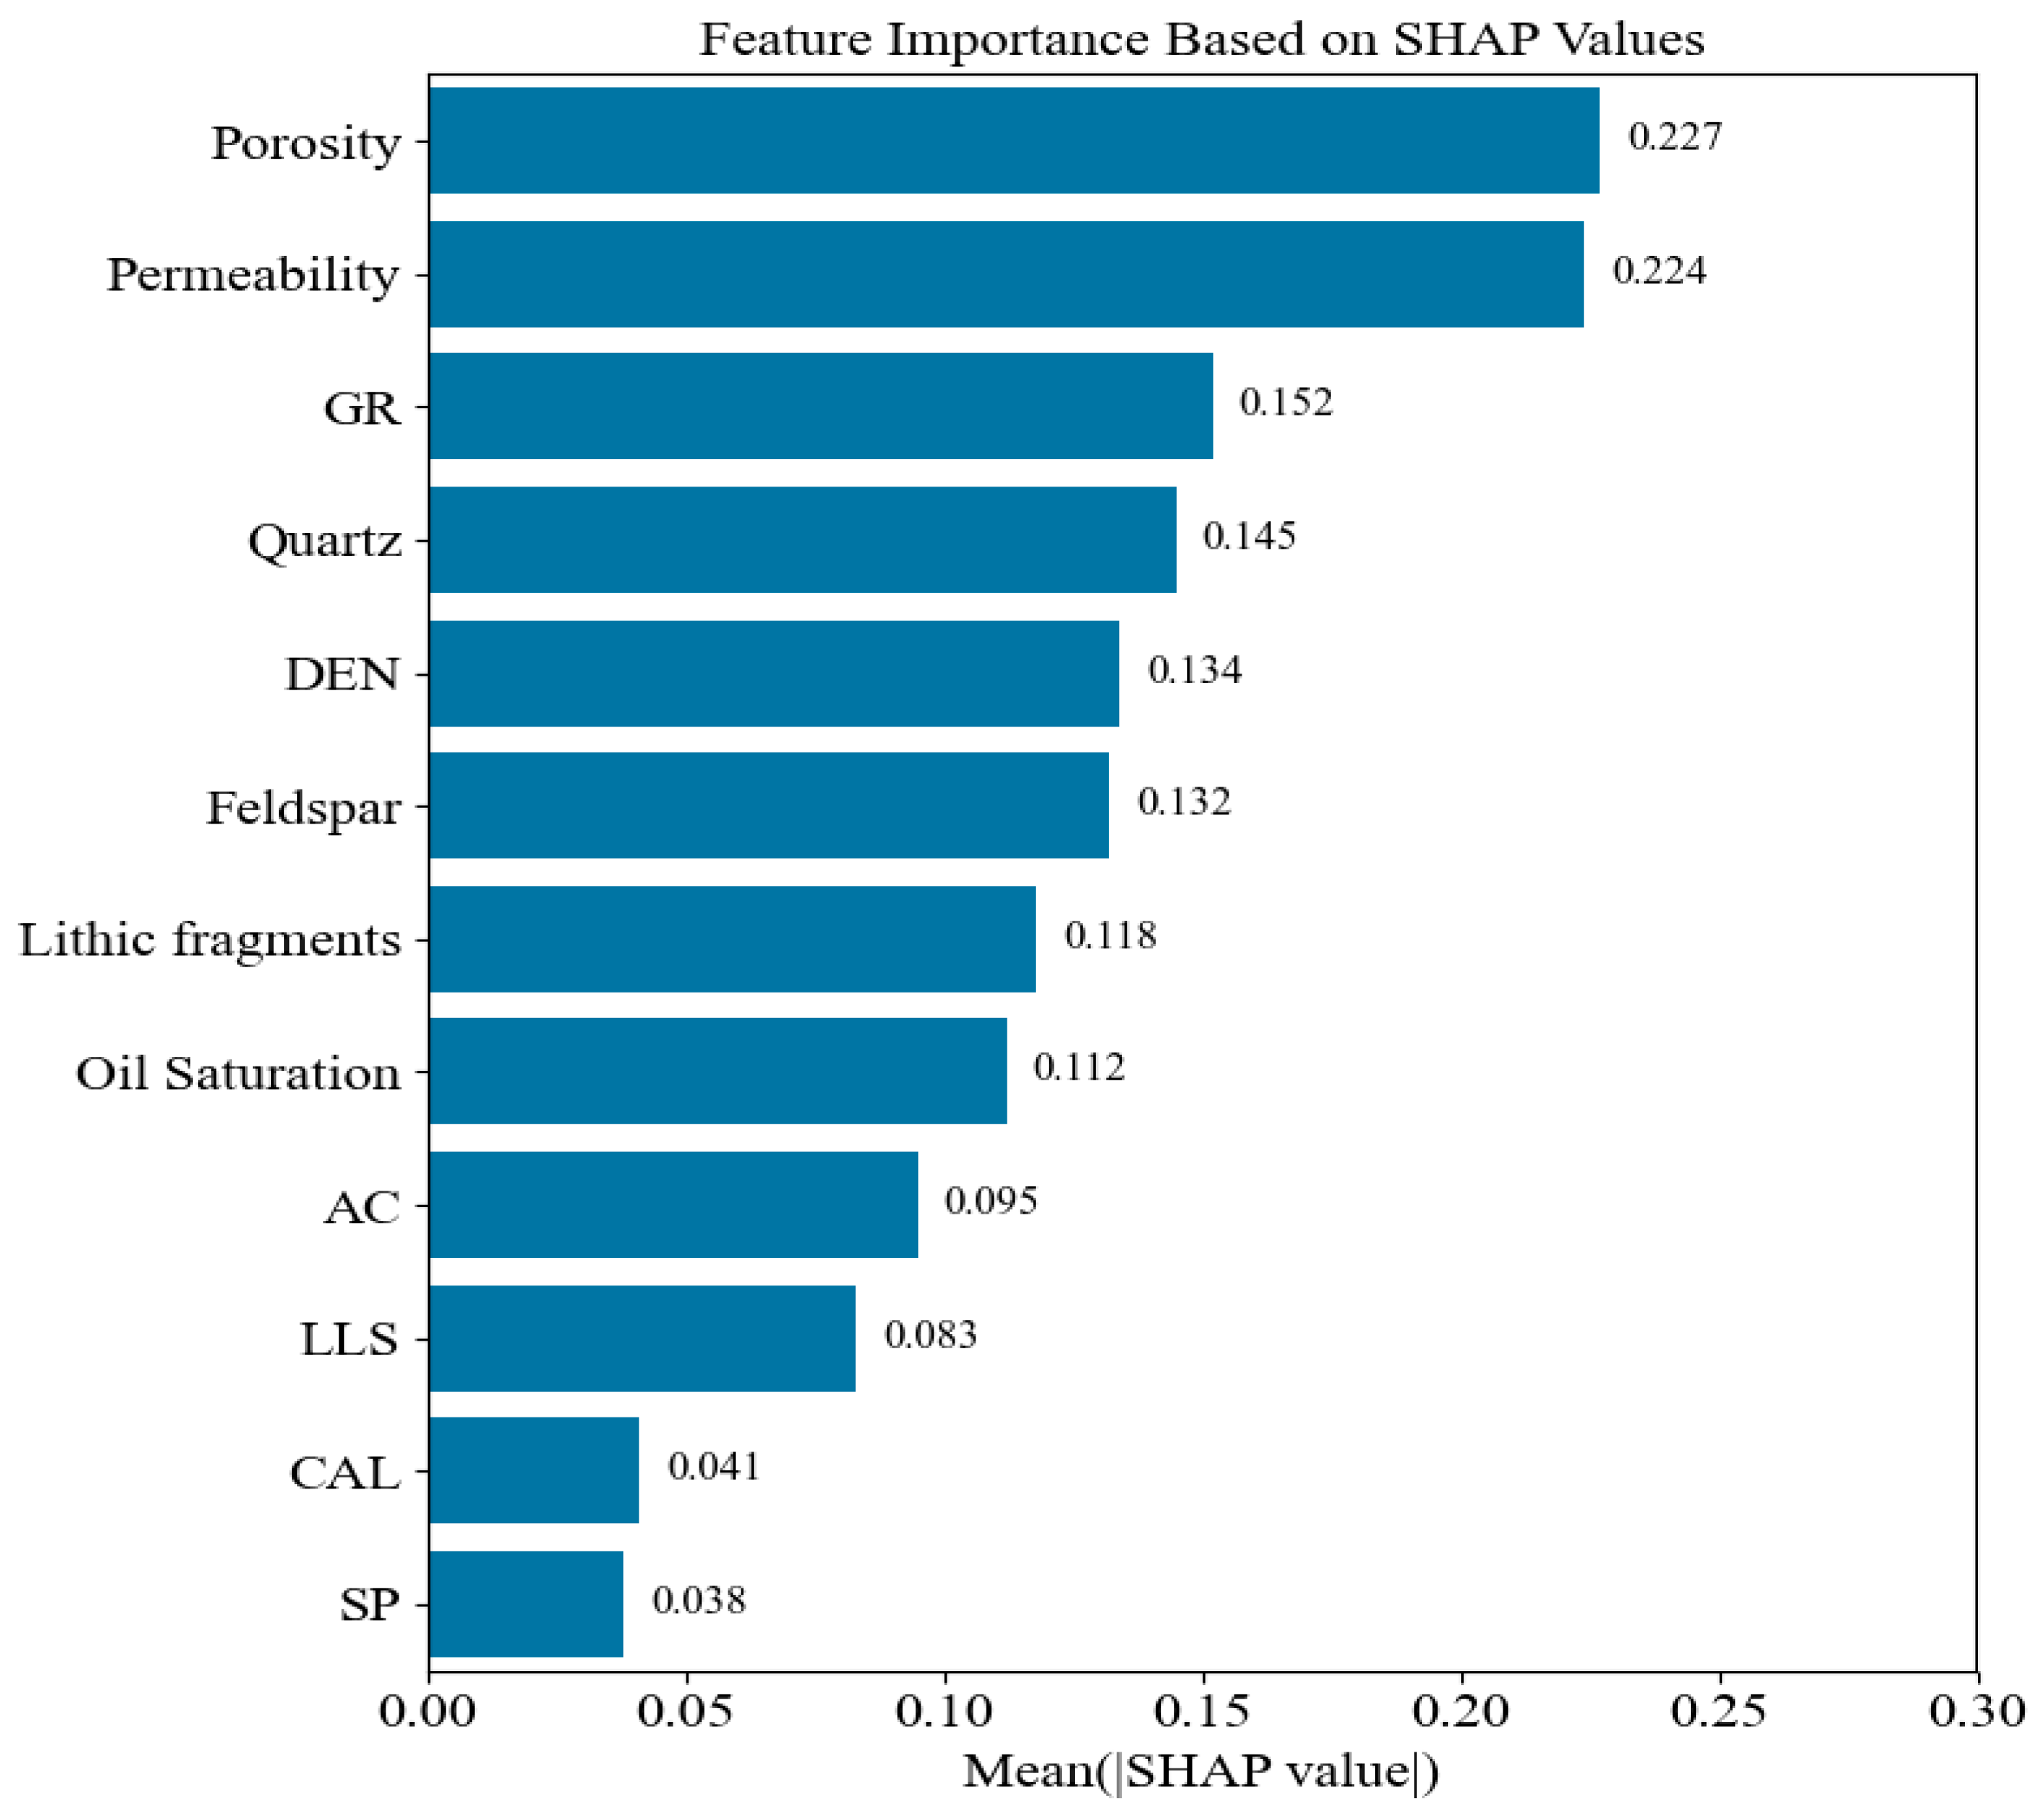
In this paper, the GA-XGBoost model was combined with the SHAP method for feature importance analysis to explore the impact of different logging parameters on reservoir classification decisions (see Figure 7). Firstly, a dataset comprising three types of reservoirs (Reservoir I, Reservoir II, Reservoir III) was constructed, and each type included 300 samples: quartz, feldspar, lithic fragments, porosity, permeability, oil saturation, GR, SP, CAL, DEN, AC and LLS. The data were divided into a training set (80%) and a test set (20%).
The results of feature importance analysis indicate that porosity (0.227) and permeability (0.224) have a particularly significant impact on reservoir classification. GR (0.152), DEN (0.134), and porosity (0.127) have a moderate impact on reservoir classification, while CAL (0.041) and SP (0.038) contribute less.

3.1.2. Data Preprocessing

Due to the diverse sources of logging curve data, there are often significant differences in the numerical scales of different parameters. For instance, GR values fluctuate over a wide range, while DEN and CAL values fluctuate only slightly. This imbalance in numerical scales may lead the model to assign excessive weight to some features during training while relatively neglecting other features with smaller numerical ranges. Therefore, before building the model, all features need to be standardized to reduce the scale difference between features and improve the convergence speed and stability of the model.
To map all feature parameters to the same scale range, the Min-Max Scaling method was employed in this paper to normalize all logging parameters to the interval [0, 1], thereby eliminating the impact of different numerical ranges among features. The calculation formula is shown in Equation (1) below:
x ¯ = x x min x max x min
where x represents the original data, x m i n and x m a x are the minimum and maximum values of that feature, respectively, and x ¯ denotes the normalized data value. This processing approach ensures that each feature participates in the model calculation with a similar numerical scale in the training process, preventing certain features with larger numerical values from dominating the model learning.

3.2. GA-XGBoost Model

GA-XGBoost integrates two powerful machine learning techniques, XGBoost and GA, showing significant advantages in reservoir evaluation and classification models. With excellent generalization ability and computational efficiency, XGBoost has gained widespread attention in solving nonlinear problems. However, this algorithm involves numerous hyperparameters, and the parameter space is complex. Traditional manual parameter tuning methods are not only inefficient but also prone to getting stuck in local optima, leading to underutilized model performance. To overcome this challenge, GA, as a bionic intelligent optimization algorithm, explores optimal hyperparameter combinations in an adaptive manner by simulating selection, crossover and mutation mechanisms in biological evolution, thereby enhancing the prediction ability and computational efficiency of XGBoost.
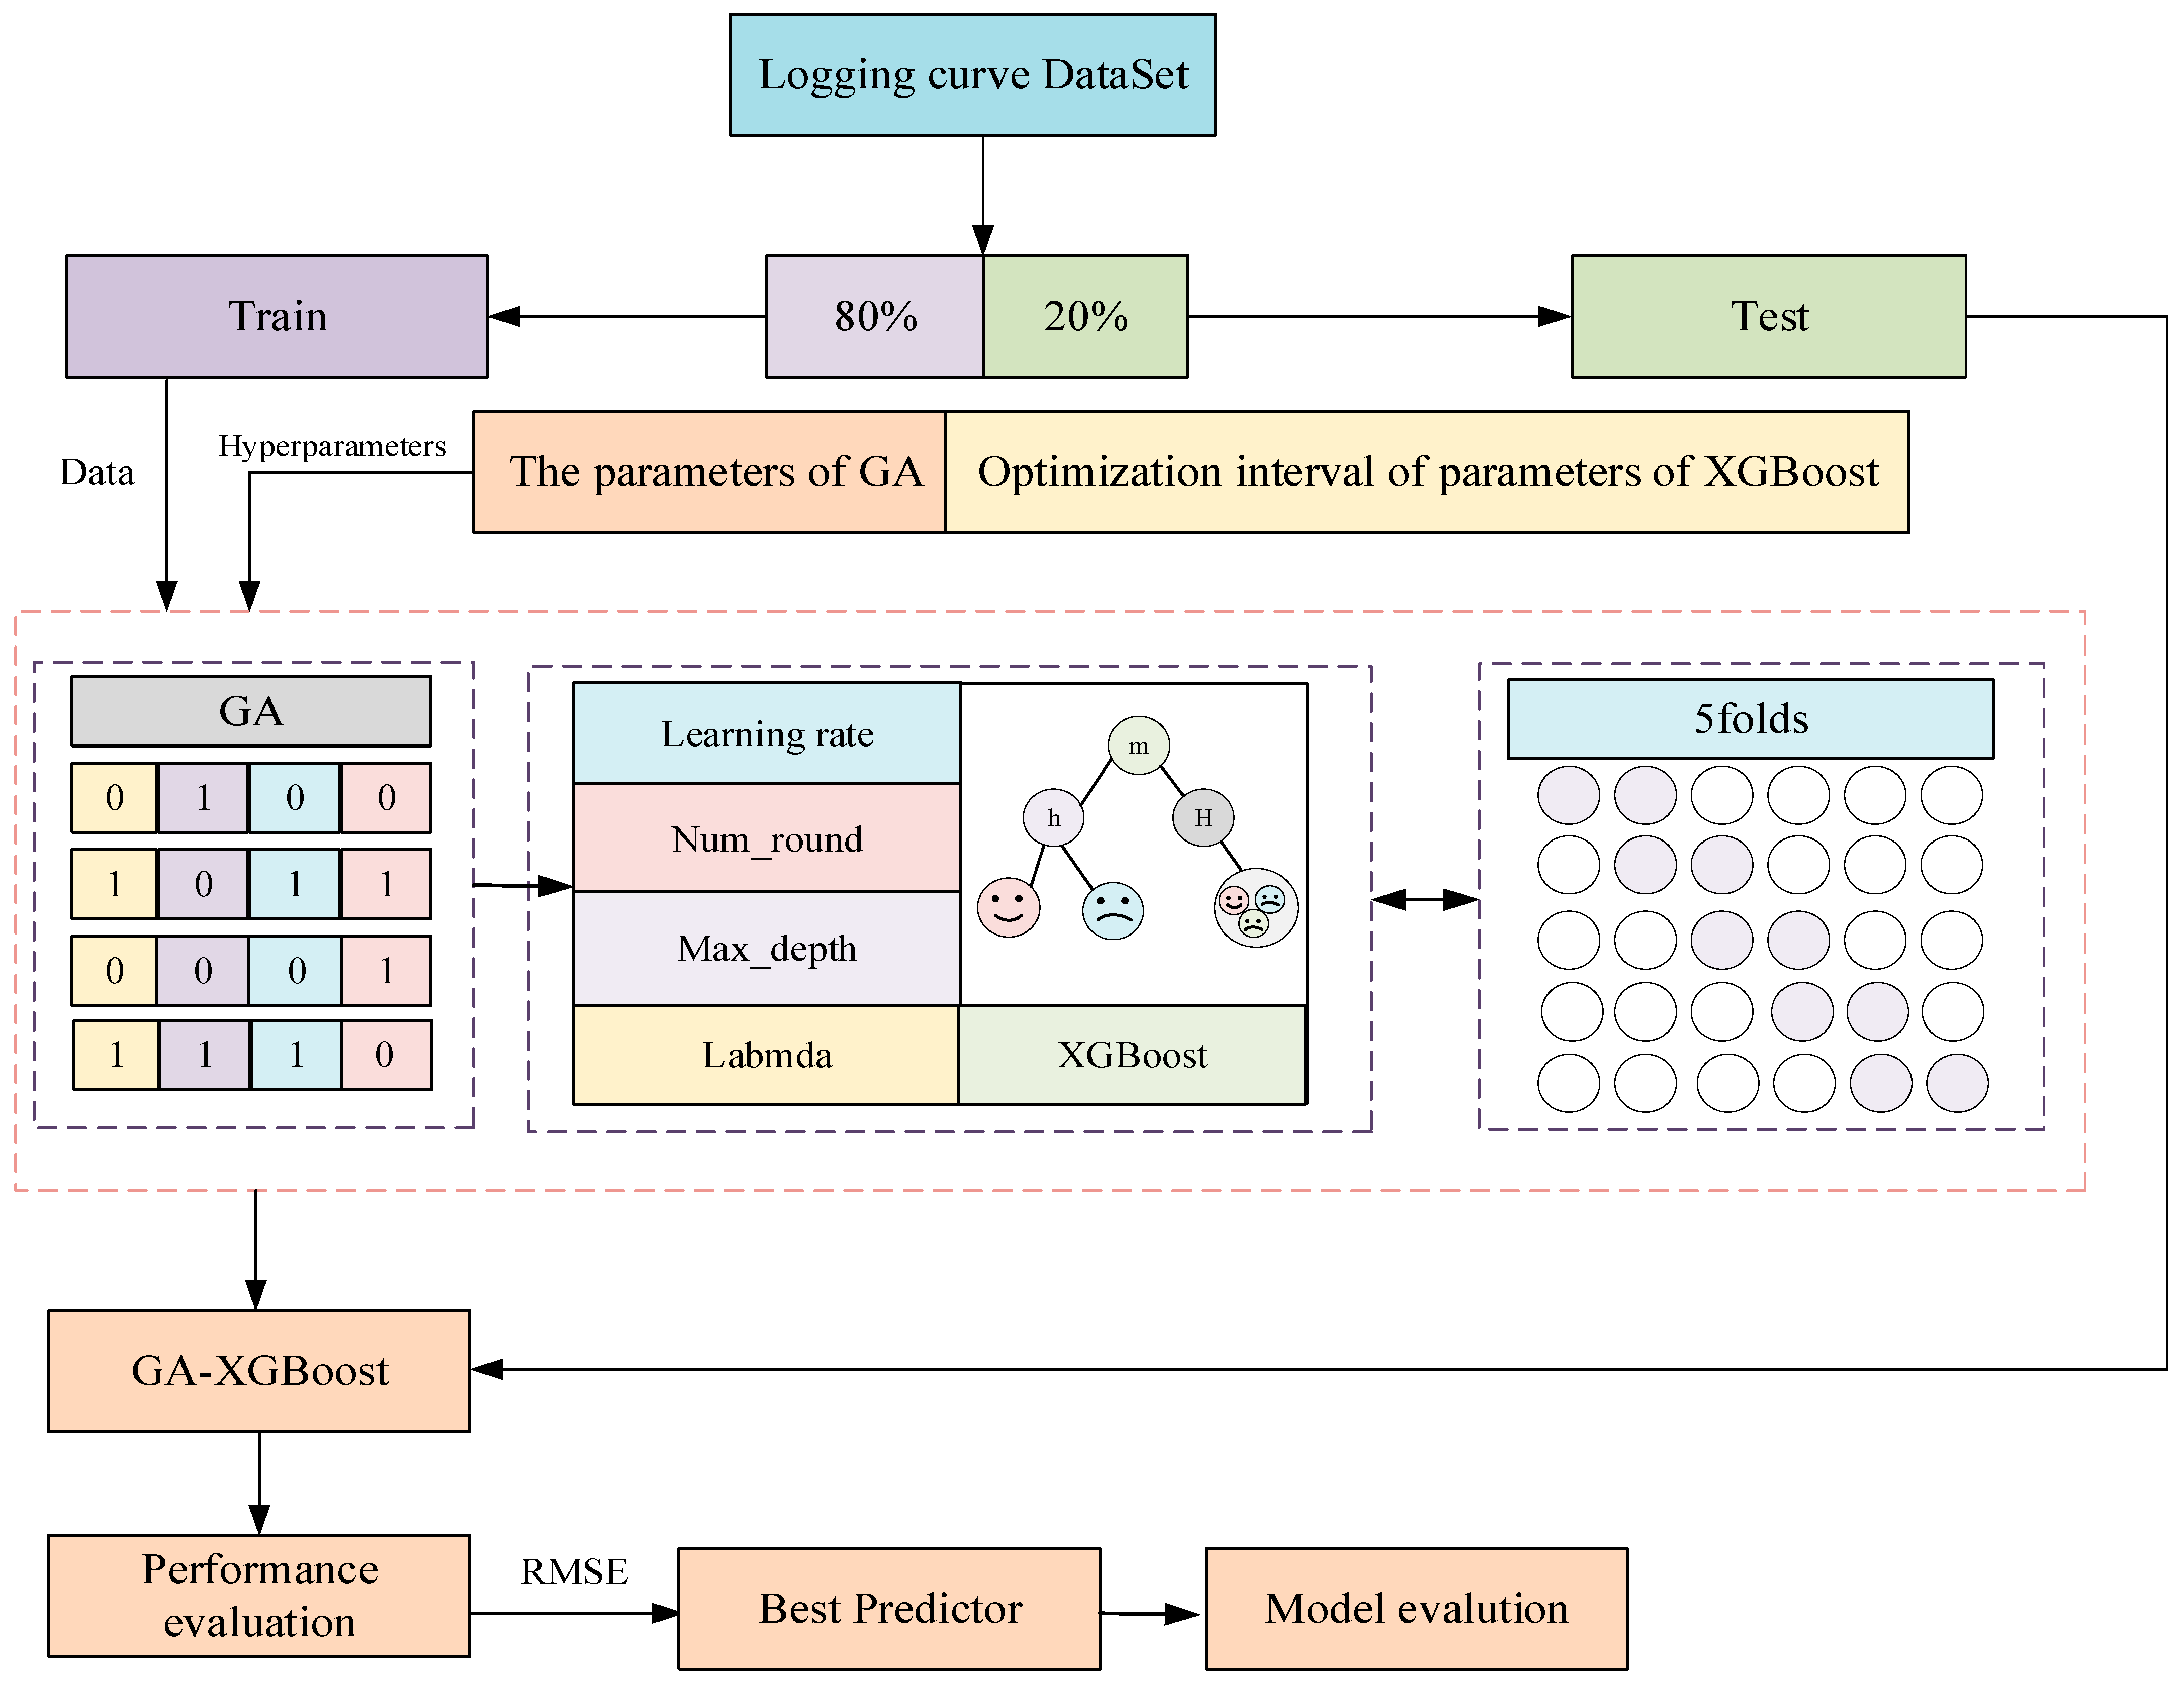
The core idea of GA-XGBoost consists of three stages: firstly, GA is utilized to optimize the key hyperparameters of XGBoost in the global search space, such as the learning rate, max depth, subsample rate, and regularization parameters, to overcome the limitations of manual parameter tuning; secondly, the optimal hyperparameter combinations obtained through iterative optimization based on the GA are applied to the XGBoost training process, further enhancing the model’s generalization ability and prediction accuracy; finally, the XGBoost classification model is trained under the optimized parameter configuration to achieve efficient reservoir feature learning and precise classification. The flowchart of the GA-XGBoost method is shown in Figure 8.

3.2.1. Extreme Gradient Boosting Algorithm

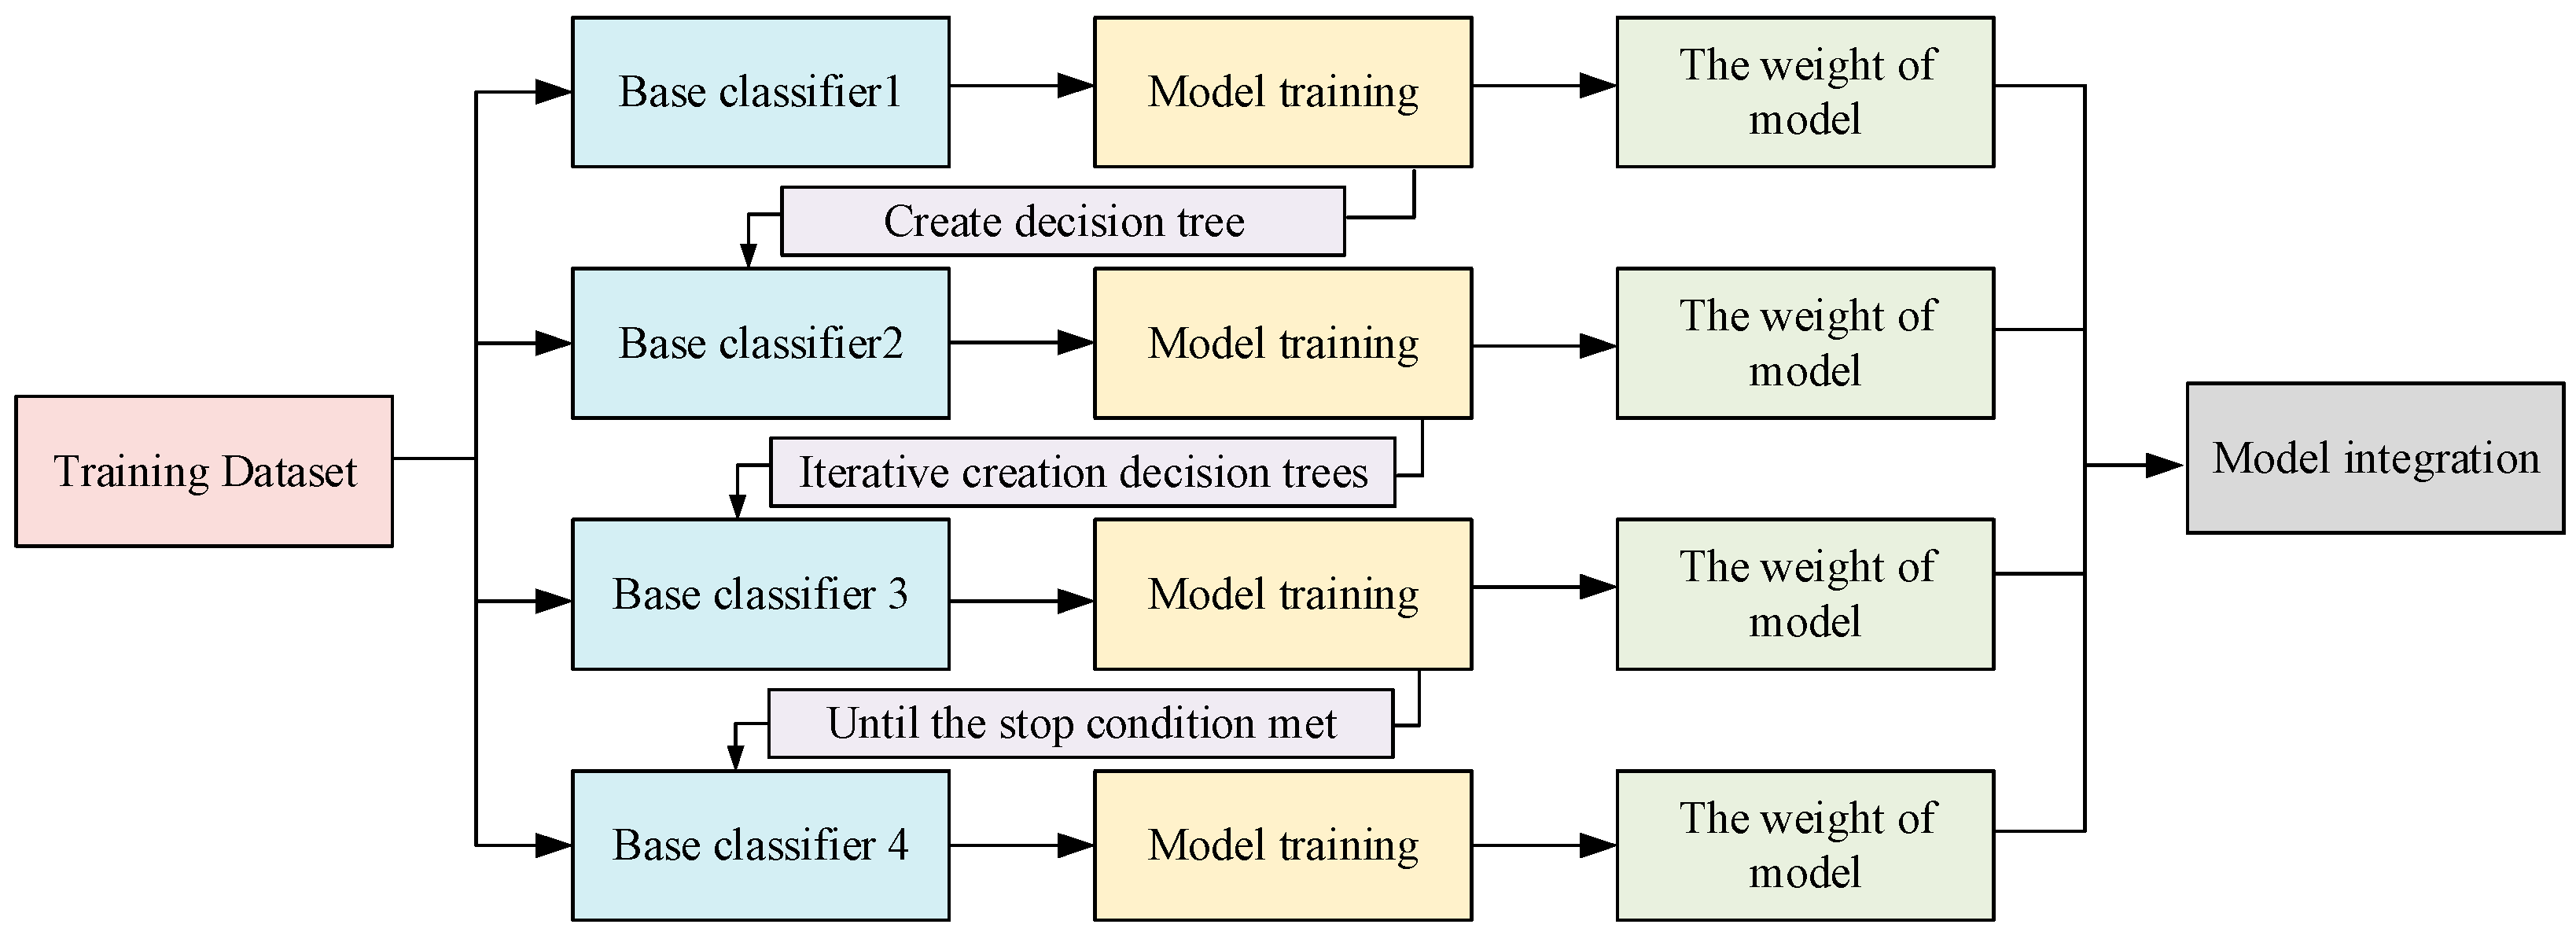
As a paradigm of ensemble learning algorithms, XGBoost iteratively integrates a series of weak learners to progressively fit residuals, thereby constructing a high-performance strong learner for efficient and accurate predictive analysis [34]. In solving nonlinear problems, XGBoost demonstrates stronger adaptability compared to traditional machine learning algorithms, and is therefore widely used in machine learning tasks such as classification and regression. Its optimized objective function is shown in Equation (2) below:
O b j ( r ) = i = 1 m L ( y i , y ^ i ( r ) ) + k = 1 r Ω ( g r )
where i denotes the i th sample in the dataset; m represents the total amount of data imported into the k th tree; r denotes all constructed trees; y ^ i denotes the true value; g r denotes the structural term of the tree model; L denotes the model loss function, describing the difference between the true value and the predicted value; and Ω ( g r ) denotes the complexity of the model, as shown in Equation (3) below:
Ω ( g r ) = γ T + 1 2 λ j T w 2
where, T denotes the number of leaf nodes in the tree, w denotes leaf weights, the γ parameter controls the number of leaves, and λ is a normalization coefficient. In the optimization process, XGBoost not only considers the error of the traditional loss function but also introduces constraints on model complexity. It mathematically optimizes generalization error and seeks the best balance in the variance-bias tradeoff to improve the model’s generalization ability. The workflow is shown in Figure 9.
Although XGBoost is regarded as one of the most competitive machine learning estimators currently and its superior performance has been widely recognized in classification and regression tasks, its model complexity and high sensitivity of hyperparameter settings still restrict its application in practical engineering to some extent.

3.2.2. Genetic Algorithm

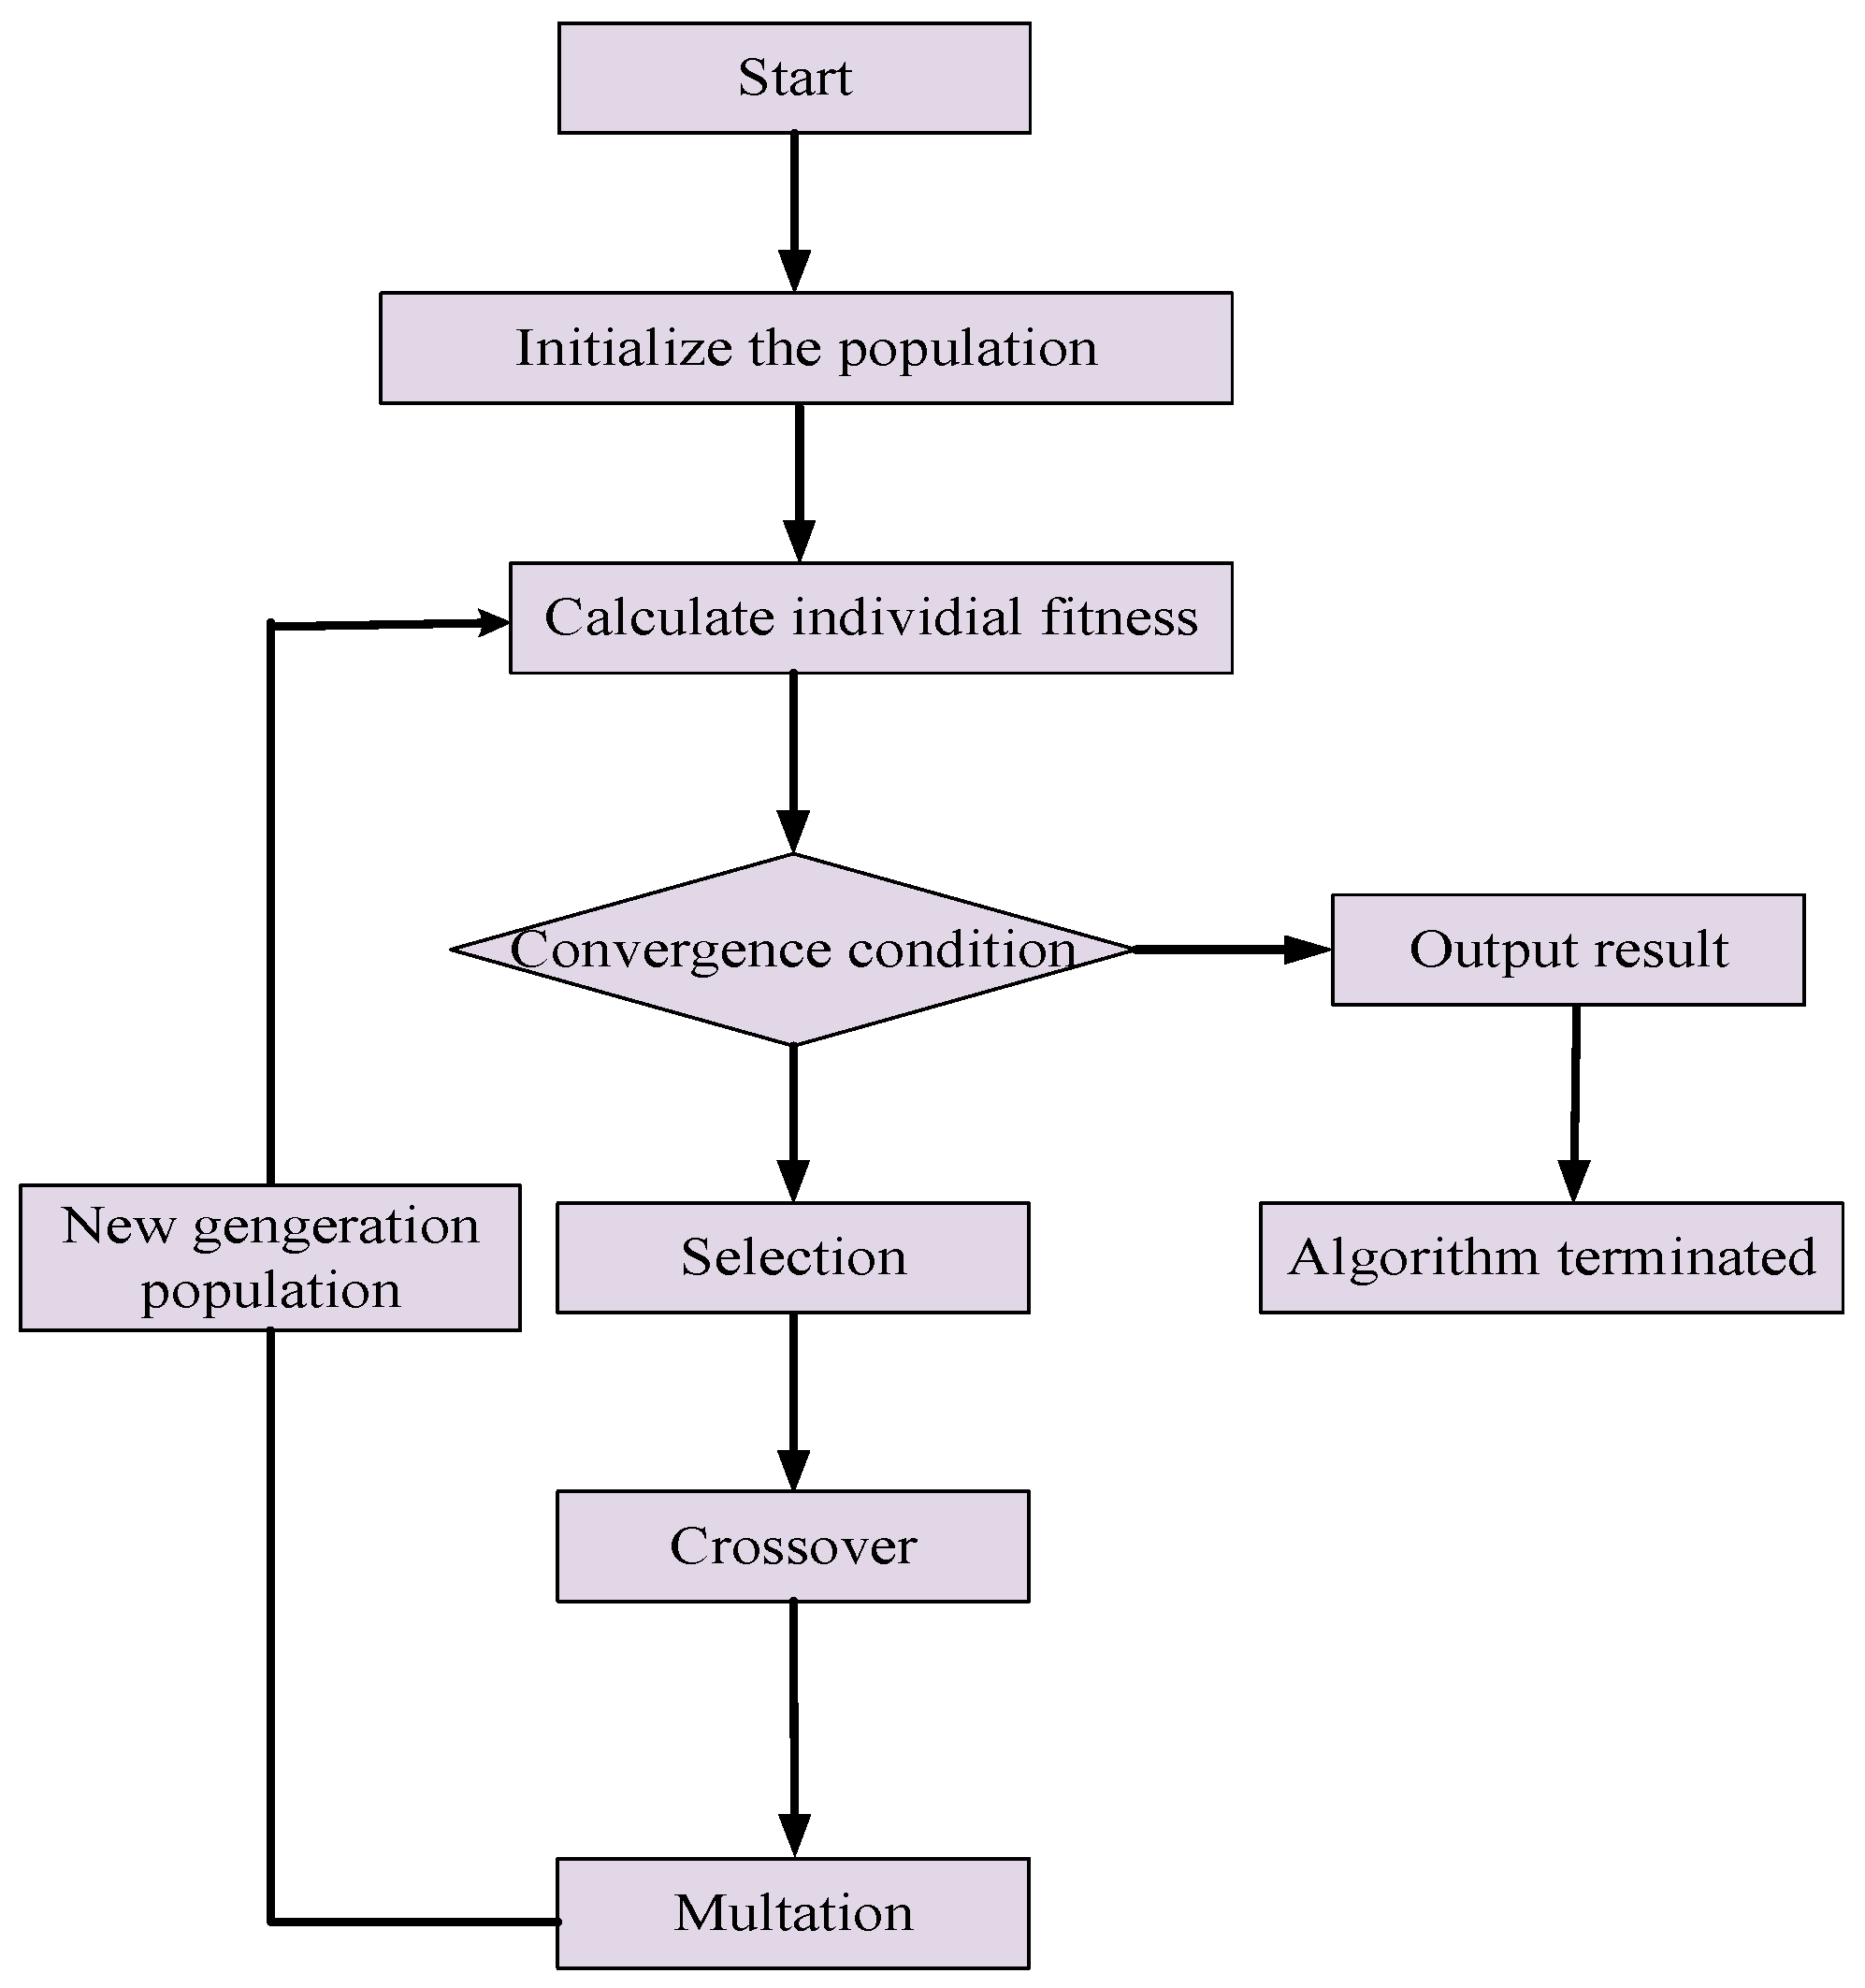
The GA is an optimization method inspired by natural evolution, which excels in finding optimal solutions in complex search spaces. Its core mechanism involves simulating the natural selection, crossover, and mutation processes in biological evolution, evaluating the fitness of individuals based on a fitness function, continuously improving the quality of the population through iterative optimization, and ultimately converging to a global optimal solution. In this paper, the powerful search capability of the GA was used to optimize the hyperparameters of the XGBoost model to enhance its training speed and prediction accuracy based on logging parameter and core data sets, thereby achieving efficient and precise reservoir classification. The specific flowchart of the GA is shown in Figure 10.
In this paper, a new GA-XGBoost model was constructed by combining the global search advantages of GA with the strong generalization capability of XGBoost. The GA not only significantly improves the search efficiency but also avoids falling into local optima in parameter tuning, thereby enhancing predictive performance. The GA primarily comprises three core operations: selection, crossover, and mutation.
(1)
Selection
The purpose of the selection operation is to pick individuals with higher fitness from the current population as parents. Assuming the population size is, and the fitness of an individual i is f ( x i ) , its probability of being selected is given by Equation (4):
P i = f ( x i ) j = 1 N f ( x j )
where P i represents the probability of individual i being selected; f ( x i ) represents the fitness value of individual i; x i represents the ith individual, which is a solution to the problem; N represents the population size, i.e., the total number of individuals in the population; and j = 1 N represents the sum of the fitness values of all individuals in the population.
(2)
Crossover
The crossover operation generates new individuals by combining the genes of two parent individuals. Assuming two parent individuals are x 1 and x 2 and a crossover point c is randomly selected, the offspring individuals can be represented by Equation (5):
x 1 = x 1 , 1 , , x 1 , c , x 2 , c + 1 , , x 2 , n x 2 = x 2 , 1 , , x 2 , c , x 1 , c + 1 , , x 1 , n
where x 1 x 2 represent the two parent individuals; x 1 x 2 represent the two offspring individuals generated; c represents the crossover point, indicating the gene at which crossover begins; and n represents the gene length of an individual.
(3)
Mutation
The purpose of the mutation operation is to randomly change an individual’s genes with a certain probability. For individuals encoded with real numbers, the formula for flipping each gene with a probability of P m is shown in Equation (6):
x i , j = 1 x i , j x i , j
where x i , j represents the ith gene after mutation and x i , j represents the jth gene before mutation.

3.2.3. GA-XGBoost Model Training

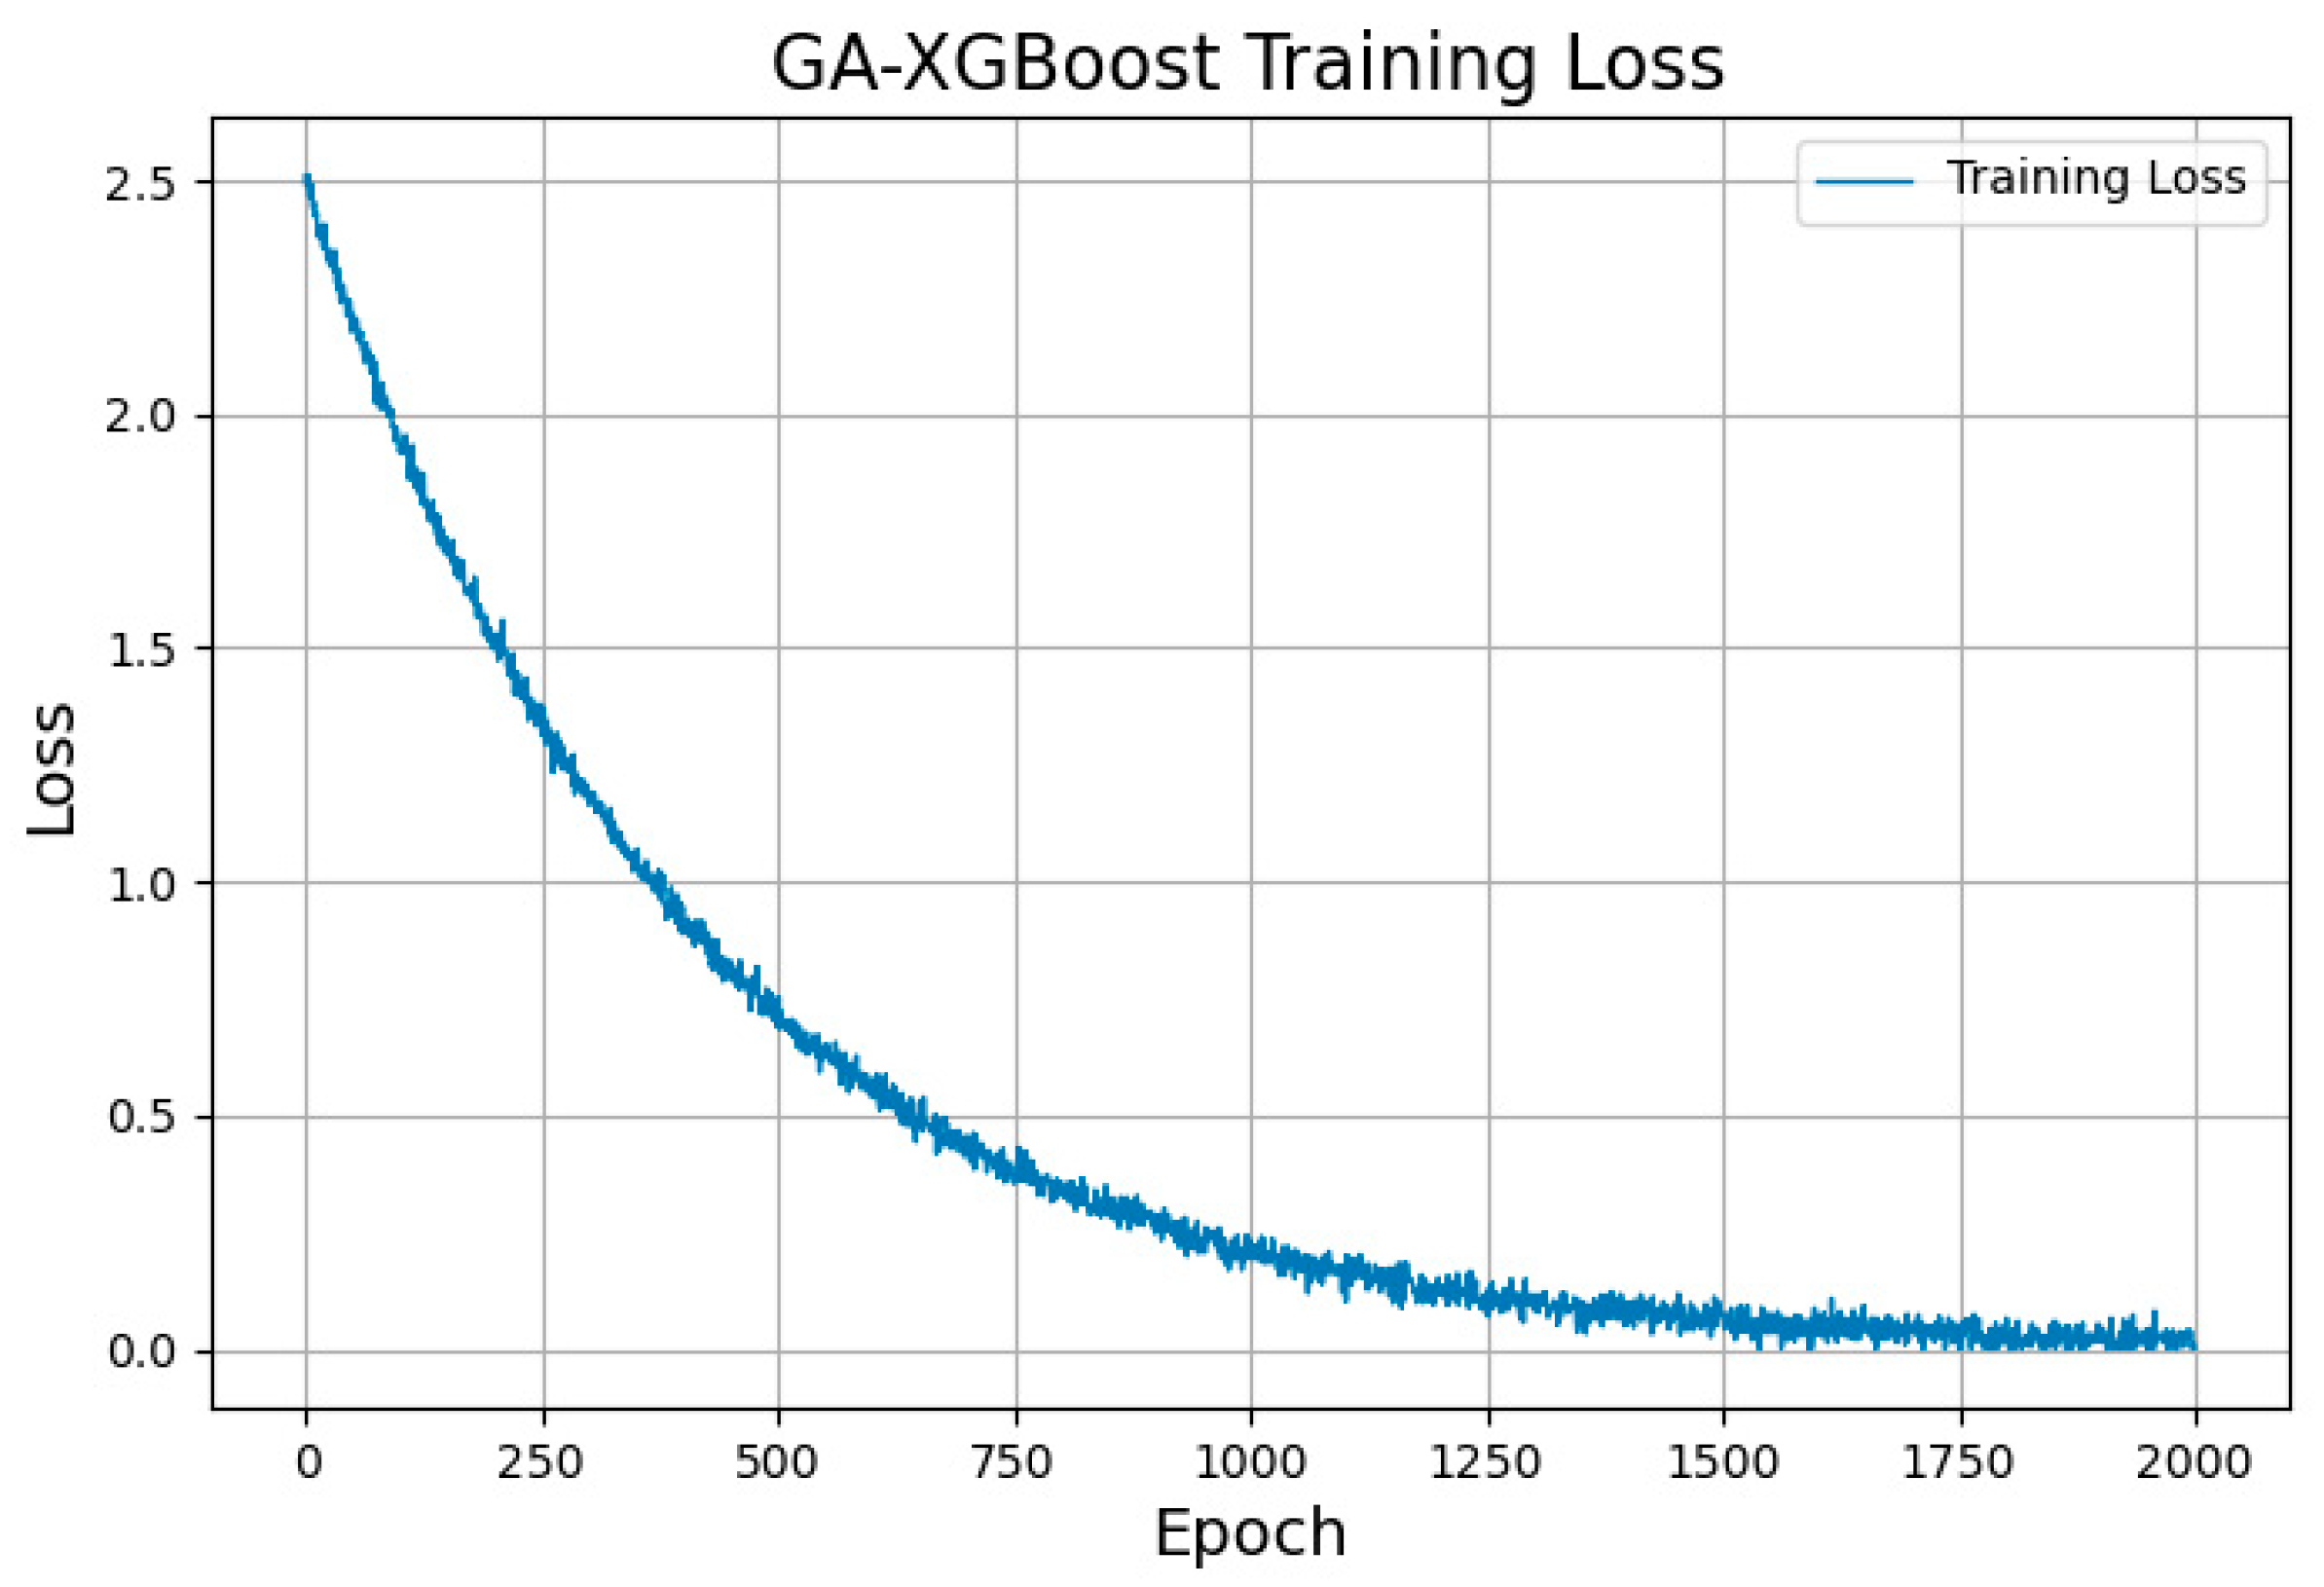
The GA-XGBoost model training process relies on GA to optimize hyperparameters while incorporating XGBoost’s gradient boosting framework to minimize the loss function. Specifically, GA searches for optimal hyperparameter combinations through natural selection, crossover, and mutation mechanisms, while XGBoost employs squared loss or logarithmic loss functions for gradient optimization to enhance the classification accuracy. The model training process is illustrated in Figure 11.
In the model training stage, the number of iterations was set to 2000. As shown in the figure, the loss decreases rapidly within the first 500 iterations and gradually converges to a stable state in the subsequent training, indicating that the model effectively fits the data after sufficient training and achieves superior classification performance.

3.3. Experimental Scheme

The reservoir in this area is a typical tight sandstone reservoir. The logging data from 16 wells completed in Zhou 6 Block, as described in Section 3.1, were used for reservoir identification and classification in this work area. In this paper, a model evaluation experiment, accuracy comparison experiment, confusion matrix model experiment, and single-well model experiment were carried out to verify the effectiveness of the proposed method. The specific parameters of the experimental equipment are as follows: CPU is Intel Xeon Silver 4210R, memory is 64G, GPU is RTX 6000/8000; the operating system is Ubuntu 20.04.3; the experimental framework is PyTorch 1.7.1.

3.3.1. Model Evaluation Experiment

To verify the effectiveness of the GA-XGBoost algorithm and its superiority in prediction tasks, three benchmark algorithms commonly used in regression prediction were selected as a comparative analysis for model evaluation experiments, namely SVM [35], XGBoost, and ADABoost [36]. The Precision, Recall, Accuracy, and F1 Score [37] were used in the experiment to evaluate the performance of the GA-XGBoost model. The specific calculation formulas are as follows:
Precision: Refers to the proportion of the number of correctly identified reservoir evaluation classifications in the total number of identifications, as shown in Equation (7):
Precision = T P / ( T P + F P )
Recall: Refers to the proportion of the number of correctly identified reservoir evaluation classifications in the total number of all required identifications, as shown in Equation (8):
Recall = TP / ( TP + FN )
F1 Score: Calculated based on Precision and Recall, as shown in Equation (9). The F1 Score range is [0, 1], and a higher value indicates a better identification effect.
F 1 = 2 × Precision × Re call Precision + Re call  
Then, the Mean Squared Error, Root Mean Squared Error, and Mean Absolute Error were used to evaluate the model [38]. Their main purpose is to measure the error between the model’s predicted values and the true values, thereby assessing the model’s performance. MSE refers to the mean squared error, which is defined as the average of the squares of the differences between the predicted values and the true values, as shown in Equation (10):
M S E = 1 n i = 1 n ( y i y ˜ i ) 2
where y i is the true value, y ˜ i is the predicted value, and n is the number of samples. RMSE refers to the root mean squared error, representing the average magnitude of the differences between the predicted values and the true values, as shown in Equation (11):
R M S E = 1 n i = 1 n ( y i y ˜ i ) 2
MAE refers to the mean absolute error, which is defined as the average of the absolute differences between the predicted values and the true values, as shown in Equation (12):
M A E = 1 n i = 1 n y i y ˜ i

3.3.2. Accuracy Comparison Experiment

To verify GA-XGBoost’s advantages over other models in classification precision per unit time, the control variable method was employed to conduct a comparative analysis among XGBoost, SVM, ADABoost and this model method to observe the trend of precision changes among different models for the same reservoir. The experimental data were obtained from four oil wells in Sanzhao Sag. Data from Wells B17 and B183 were used as training well data, totaling 1823 sets, while data from Wells X21 and Z11 were not trained, totaling 2118 sets (see Table 6). In the experiment, 1500 sets of data were randomly selected from both the training and test well data for the velocity evaluation experiment. To ensure data quality, data preprocessing was performed uniformly before the experiment.

3.3.3. Confusion Matrix Model Experiment

After completing the model evaluation experiment and accuracy comparison experiment, confusion matrix diagrams for the GA-XGBoost, XGBoost, SVM and ADABoost models were constructed. The classification effect of feature parameters was compared through confusion matrix diagrams.

3.3.4. Single-Well Model Experiment

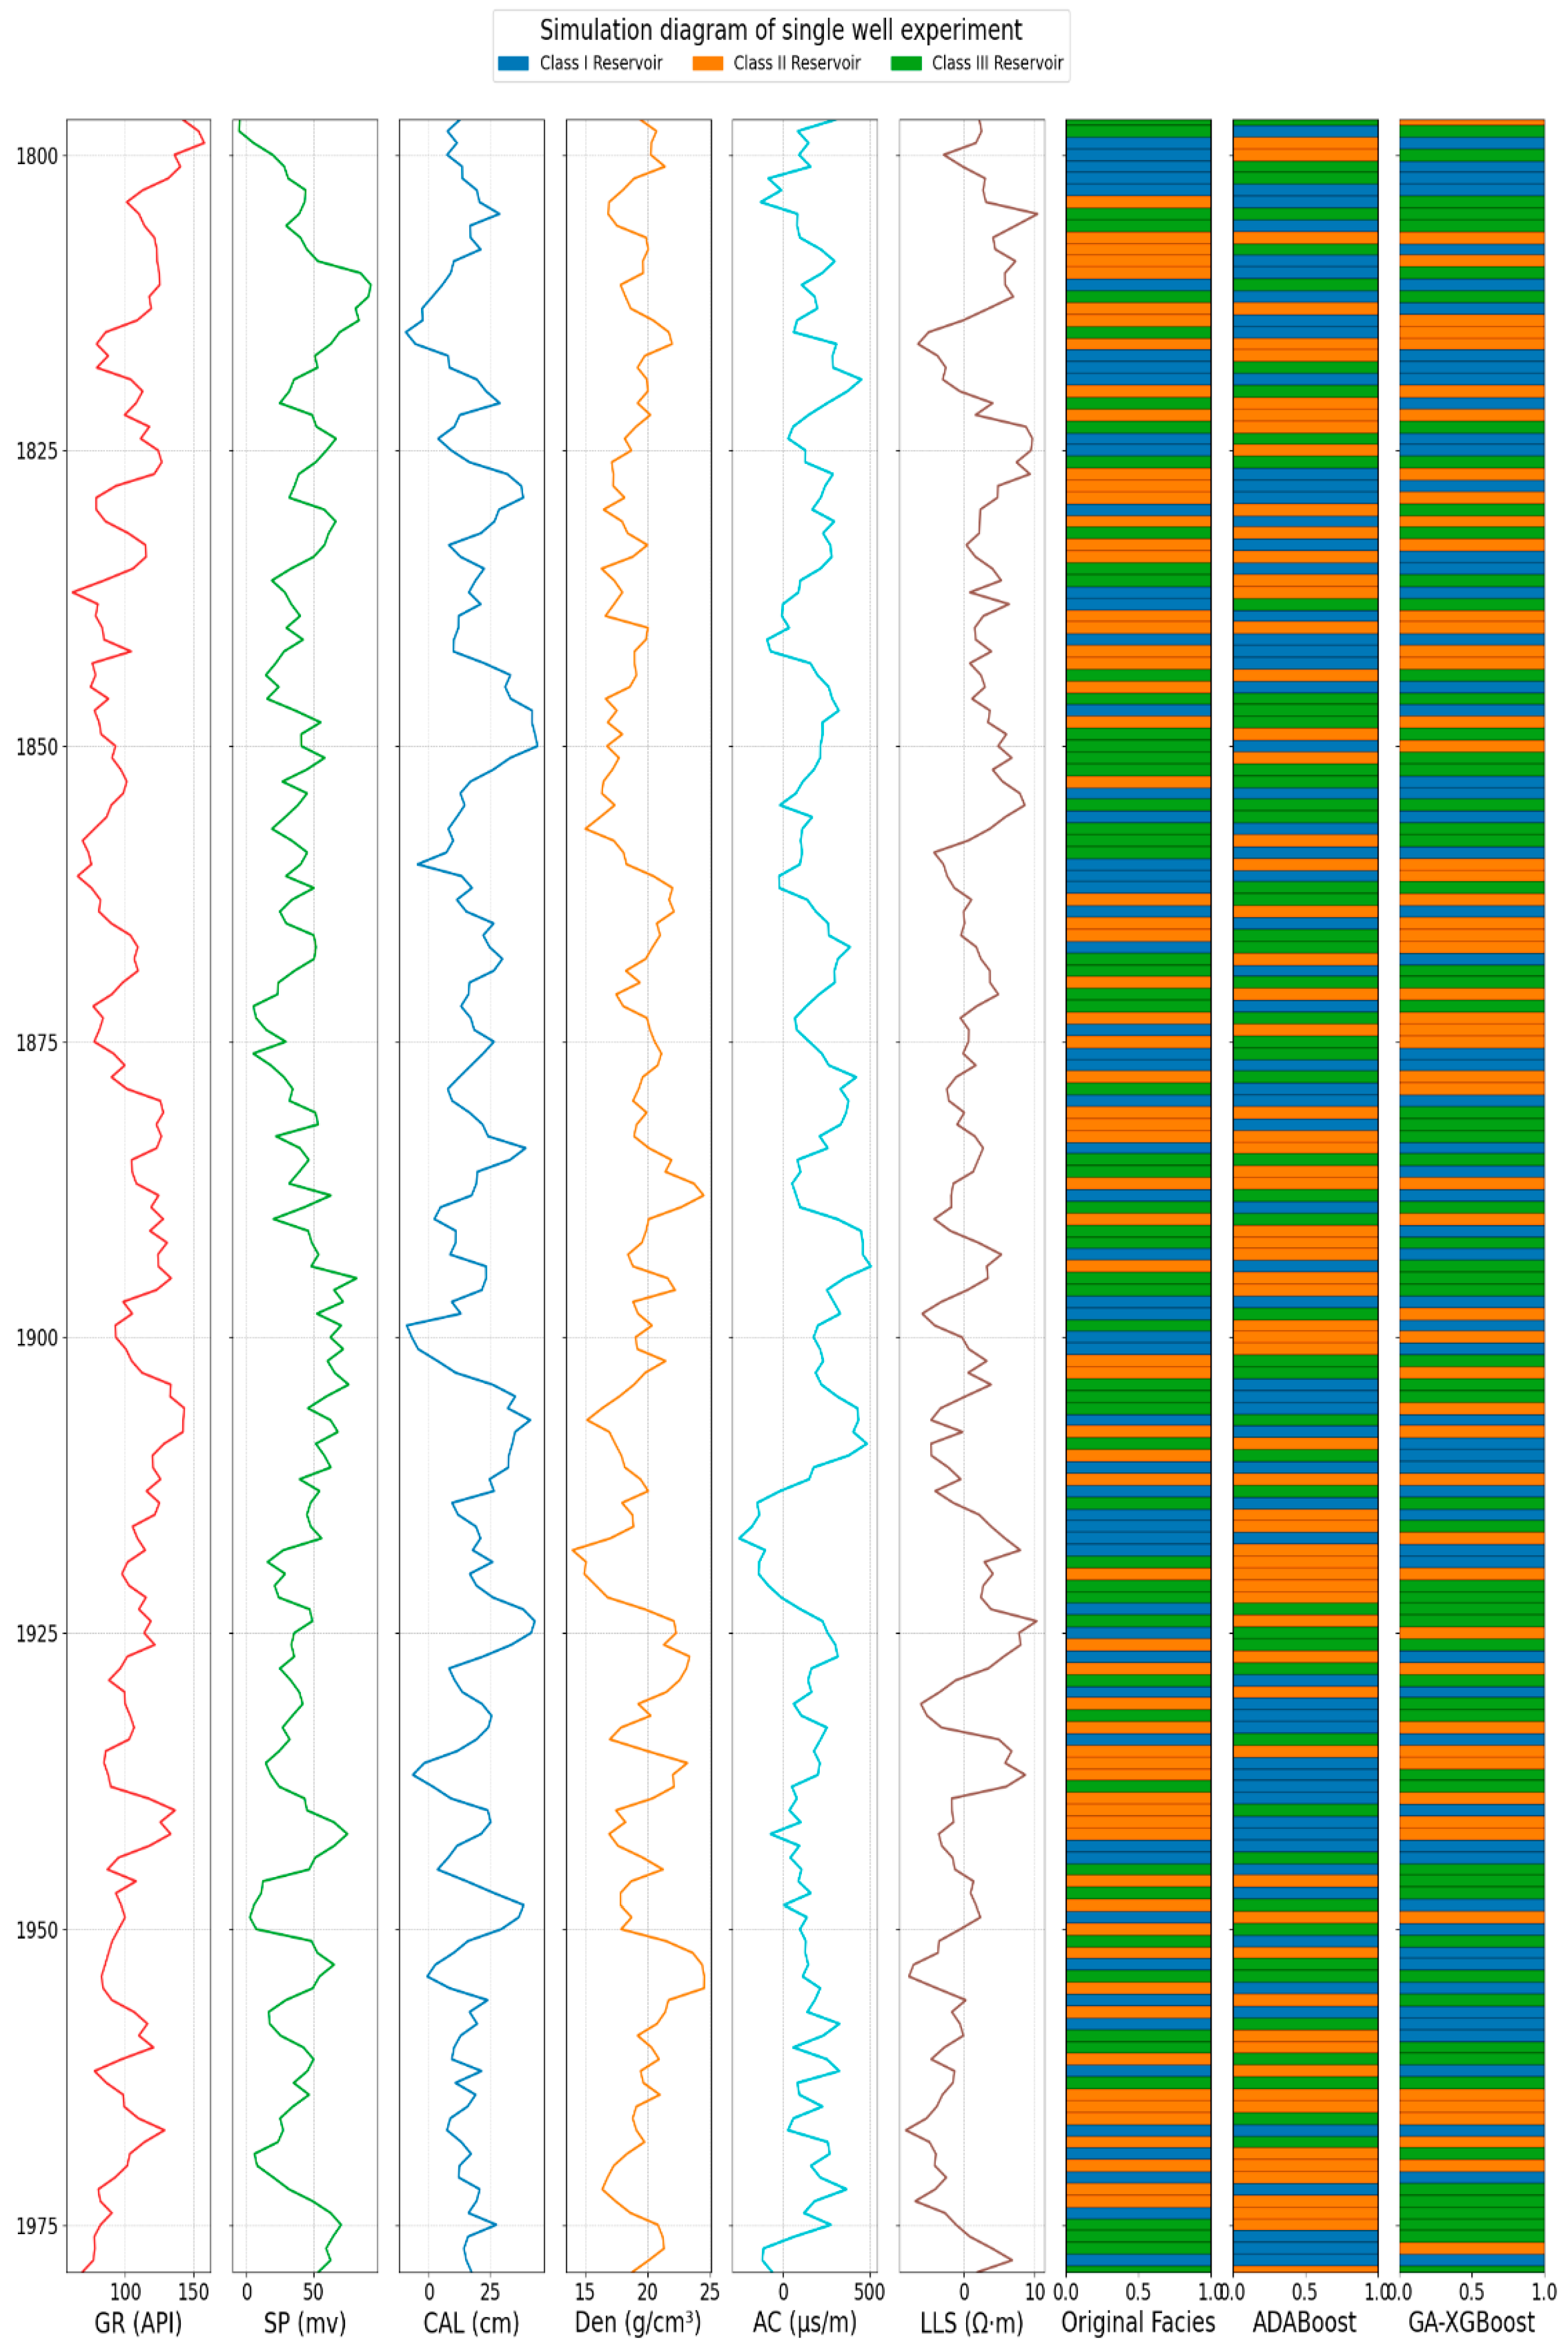
To further verify the effectiveness of the GA-XGBoost model in practical applications, an oil well in Fuyu Reservoir of Sanzhao Sag, Songliao Basin, was randomly selected in this experiment as the experimental object. The well depth range was set to 1798–1979 m. By comparing the true reservoir classification with the GA-XGBoost and ADABoost models, the recognition accuracy of the models at different depths was intuitively evaluated, ultimately obtaining the recognition precision of the single-well experiment.

4. Results

4.1. Model Evaluation Results

4.1.1. Precision, Recall, F1-Score Results

To objectively evaluate the performance, SVM, XGBoost, ADABoost, and the proposed model were used as benchmarks for comparison. The calculated results of Precision, Recall, Accuracy, and F1-score metrics for the four models are presented in Table 7 and Table 8 below.
Based on the classification prediction results in Table 7 and Table 8, the following conclusions can be drawn:
(1) Compared to other models, the GA-XGBoost model exhibits an improvement in Precision and Accuracy based on both the test set and training set, indicating that the algorithm combining GA and XGBoost exhibits certain advantages over the single algorithm.
(2) XGBoost slightly outperforms SVM in Precision and F1-score, suggesting that XGBoost has advantages in data classification capability, especially in comprehensive evaluation metrics.
(3) The advantages of GA-XGBoost in Recall and F1-score further demonstrate its robustness and reliability in reservoir classification and evaluation tasks. Therefore, the GA-XGBoost model can provide better technical support for subsequent reservoir evaluation and development.

4.1.2. RMSE, MSE, and MAE Results

To verify the evaluation metrics of the GA-XGBoost model, SVM, ADABoost, XGBoost, and the proposed model were used as benchmarks for a comparison. The calculated results of RMSE, MSE, and MAE metrics for the four models are presented in Table 9 below.
The experimental data in Table 9 show that GA-XGBoost achieves the best performance in all metrics, especially in the three core metrics of F1-score (0.937), RMSE (0.085), and MAE (0.063), significantly outperforming other models. This indicates that the GA-optimized XGBoost not only improves classification accuracy but also reduces prediction errors, demonstrating stronger stability and reliability.

4.2. Accuary Comparison Results

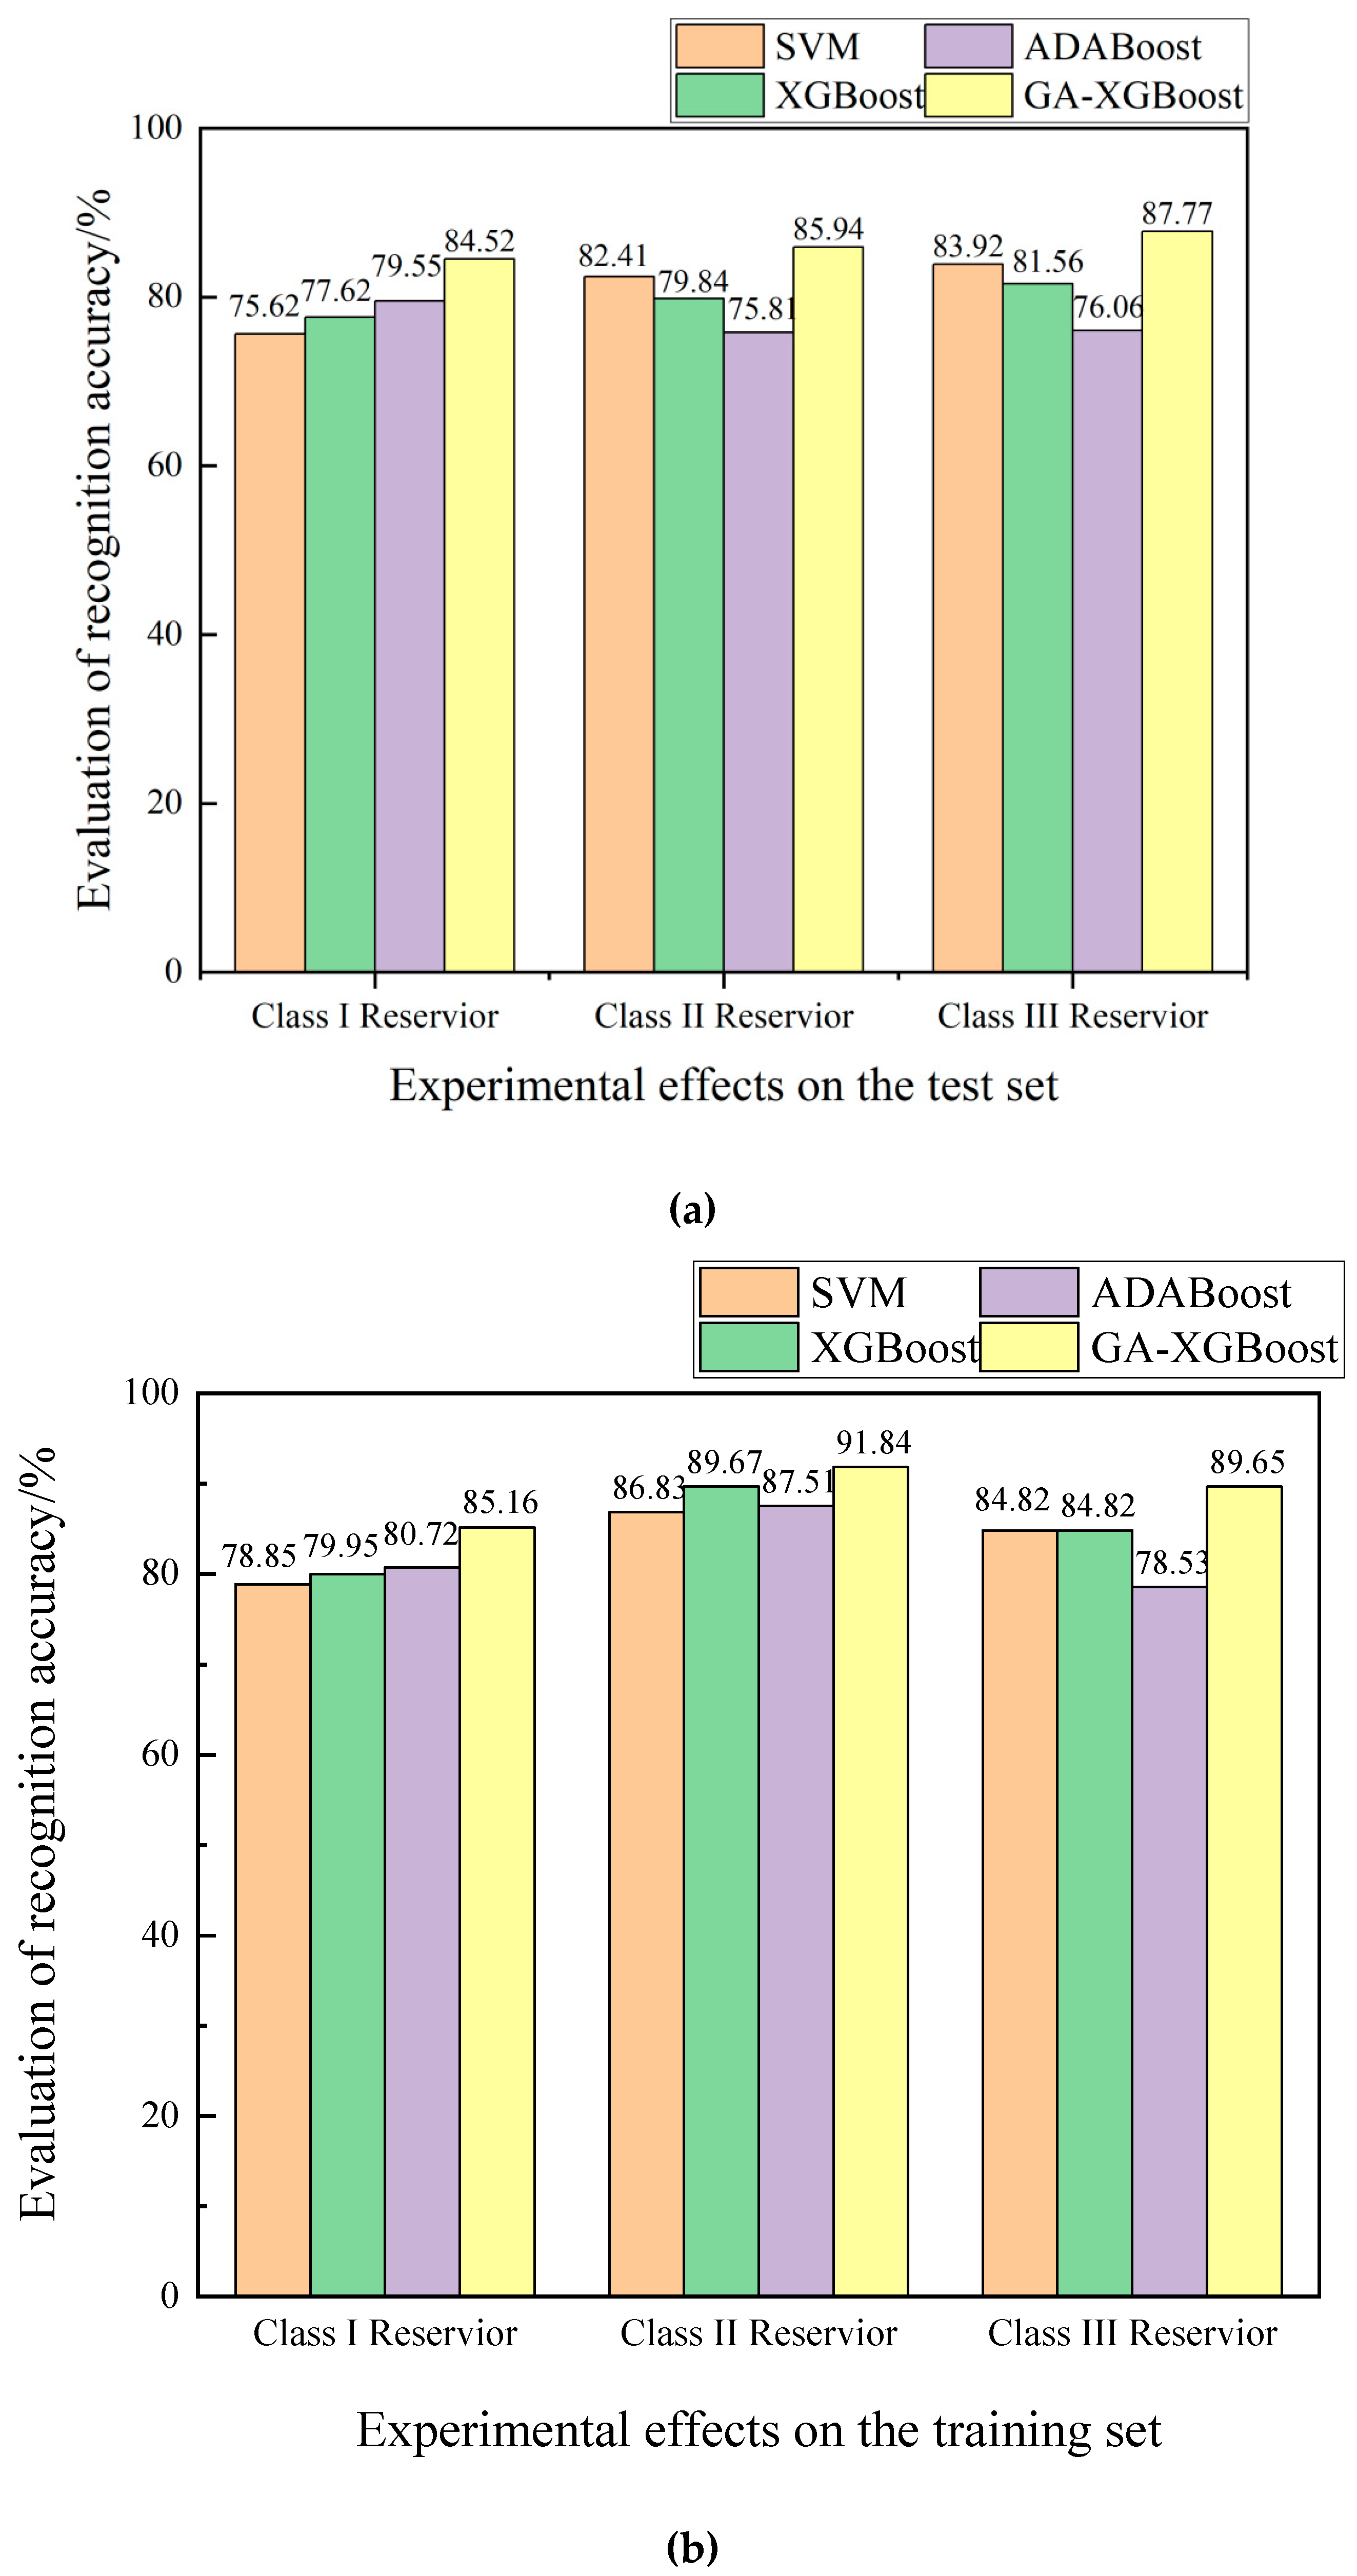
In the accuracy comparison experiment, SVM, XGBoost, ADABoost, and GA-XGBoost models were used to predict and classify three types of reservoirs. The prediction results are shown in Figure 12 below.
Based on the results on the test set and training set in Figure 12, the following conclusions can be drawn:
(1) The GA-XGBoost model performs best in all classification tasks: The recognition accuracy of the GA-XGBoost model is always higher than other models in both test and training sets. Especially for the Class III Reservoir, its recognition accuracy based on the test set and training set reaches 86.07% and 88.8%, respectively, remarkably outperforming other models.
(2) Compared to other ensemble learning methods, SVM performs moderately in all categories, indicating that a single traditional machine learning model has limited capabilities in reservoir identification tasks. The recognition accuracy of XGBoost and ADABoost is relatively close: they perform similarly based on most categories and outperform SVM but still fall below GA-XGBoost, suggesting that ensemble learning methods can effectively improve the reservoir identification precision.
(3) The overall trend in recognition accuracy among different models based on the training set and test set is consistent, indicating that the models have good generalization ability. Among them, GA-XGBoost has the best generalization performance, with the smallest gap between test set accuracy and training set accuracy.

4.3. Confusion Matrix Model Results

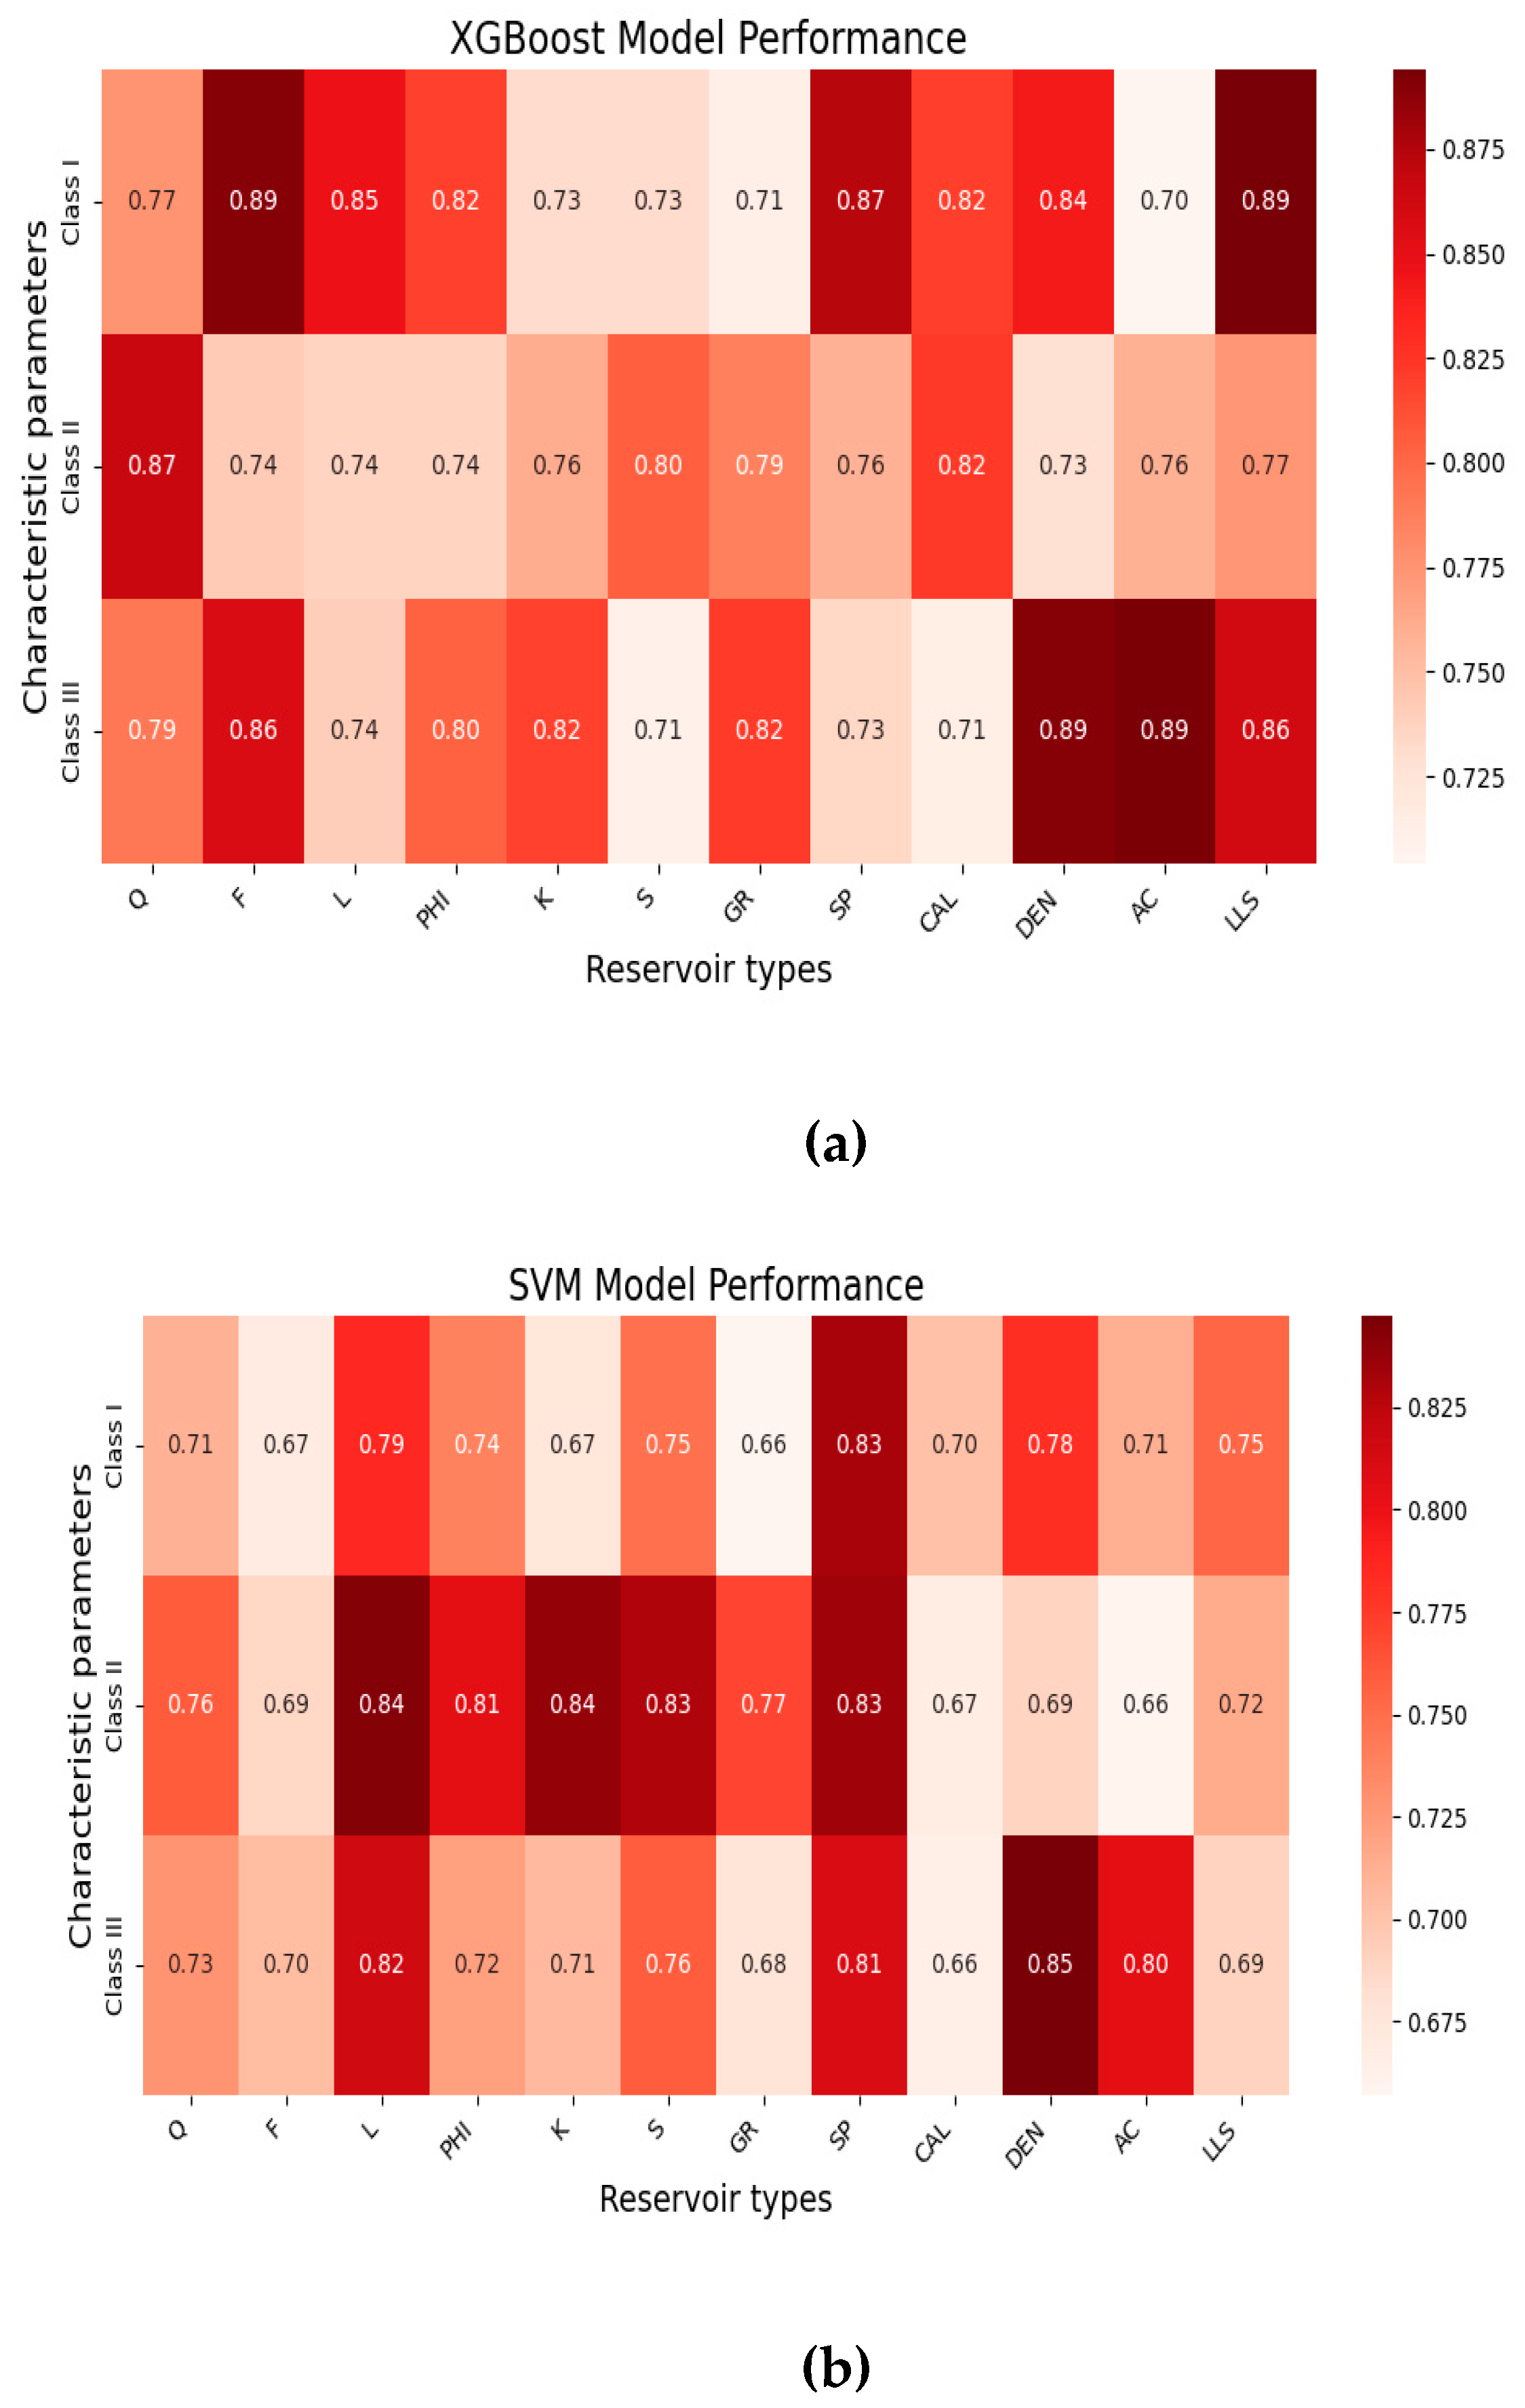
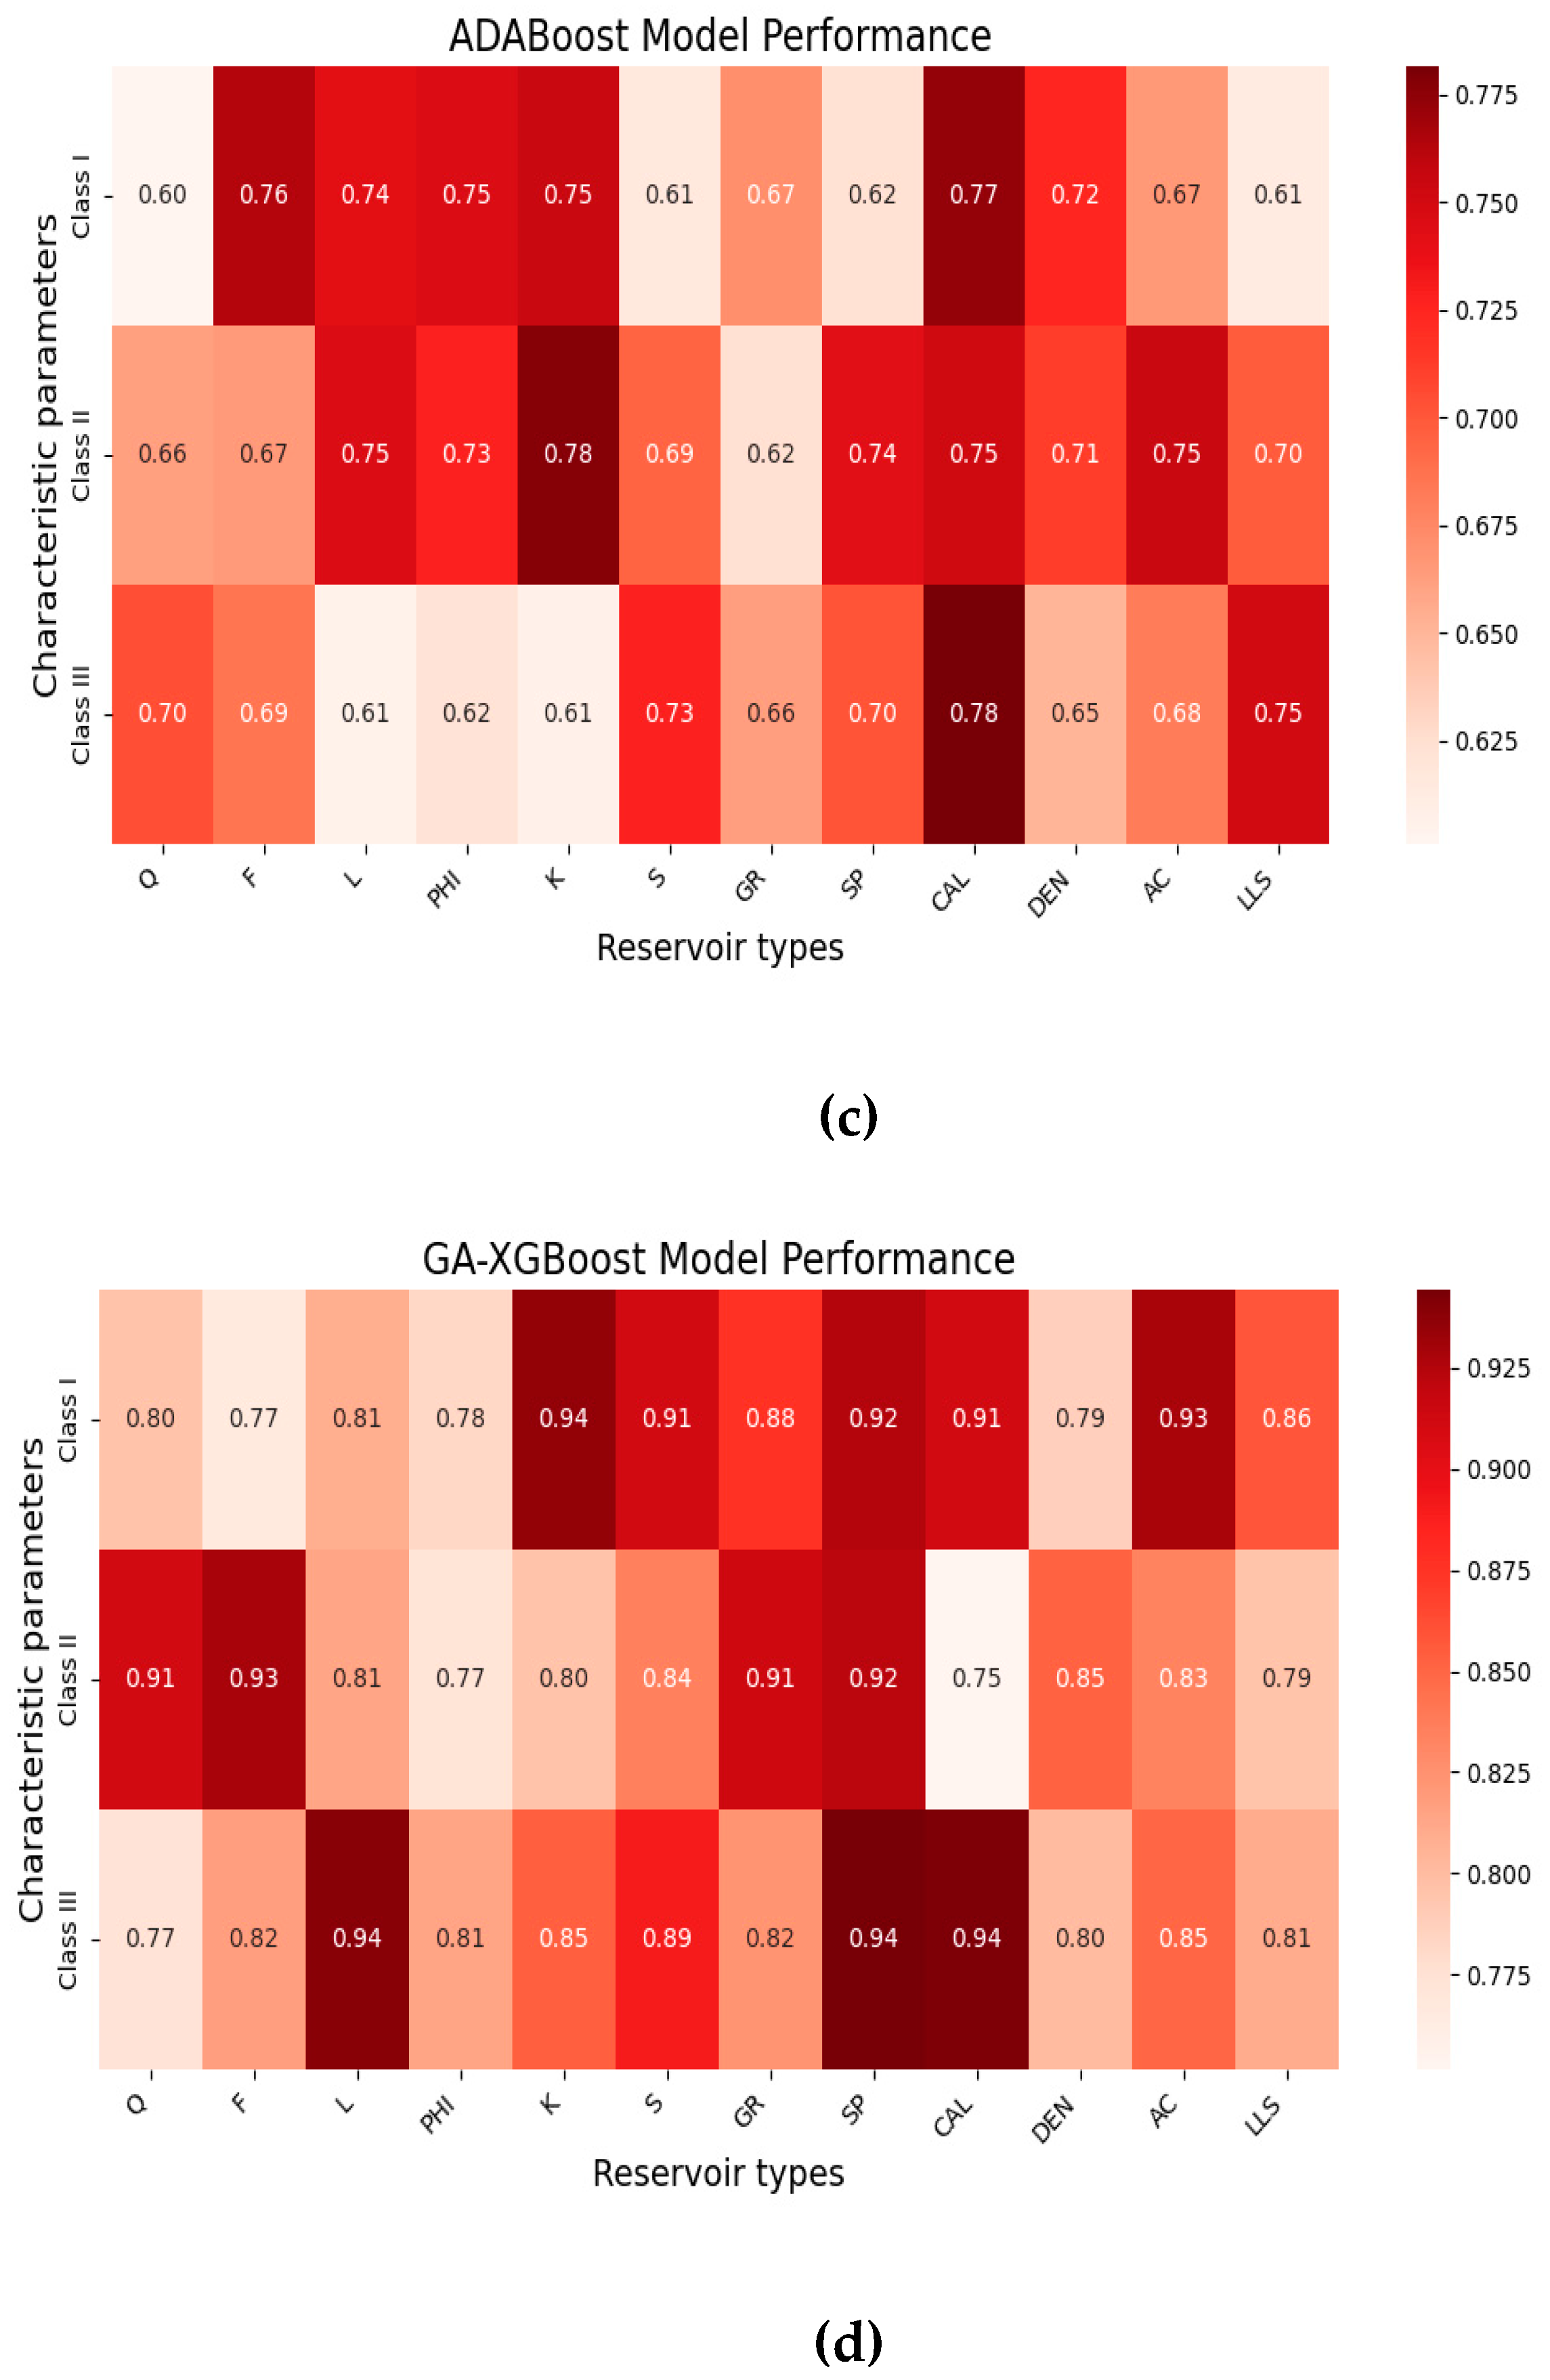
To validate the effectiveness of the GA-XGBoost model in reservoir evaluation and classification in the study area, two wells were randomly selected to predict Class I, Class II, and Class III reservoirs. Confusion matrices for the XGBoost, SVM, ADABoost and GA-XGBoost models were plotted, as shown in Figure 13 below.
Through the confusion matrix experiments in Figure 13, the following conclusions can be drawn:
(1) GA-XGBoost outperforms other models in predicting various reservoir types and feature parameters, with high Precision and Recall, especially in the recognition of GR, SP, and CAL parameters, indicating that GA-XGBoost has stronger feature learning capability.
(2) ADABoost performs the worst among all models, especially in the classification accuracy of key logging parameters, such as GR, SP, and DEN, suggesting that it has weaker robustness in complex reservoir classification tasks.
(3) By constructing confusion matrix models based on feature parameters, it can be observed that porosity and permeability, among physical properties, are important parameters affecting the reservoir classification and prediction models. In lithofacies characteristics, logging curve data, such as SP and AC, have a higher impact on model classification and prediction.

4.4. Single-Well Model Results

In the single-well lithofacies identification experiment, an oil well in Fuyu Reservoir of Sanzhao Sag, Songliao Basin, was randomly selected as the experimental subject, and the well depth range was set at 1798–1979 m (see Figure 14). The lithofacies prediction precision of this well reached 85.7%, outperforming the ADABoost method in prediction precision. The results fully demonstrate that the model proposed in this paper can be applied to actual reservoir evaluation and classification tasks, showing significant practical application value.

5. Discussion

The results obtained from the GA-XGBoost model highlight its effectiveness in tight sandstone reservoir evaluations. In the model evaluation experiment, GA-XGBoost outperformed the comparison models in all prediction metrics, particularly in Recall and F1-score. This indicates that the GA-XGBoost model excels in identifying and classifying reservoirs, providing strong technical support for future reservoir evaluation and development. In the accuracy comparison experiment, GA-XGBoost performed best across all classification tasks, particularly in the recognition of Class III reservoirs, where the accuracy in the test set and training set reached 86.07% and 88.8%, respectively. This demonstrates the model’s efficiency in handling different types of reservoirs and its ability to significantly improve the classification accuracy, especially in low-permeability, low-porosity reservoirs. The confusion matrix model experiment revealed that physical parameters such as the porosity and permeability, are critical factors influencing the model’s performance. In addition, logging parameters, such as the SP and AC, had a higher impact on model classification, suggesting that these parameters should be prioritized in future research to improve the model accuracy. In the single-well model experiment, GA-XGBoost achieved a high precision of 85.7%, proving its potential in practical reservoir identification tasks. Even in complex geological environments with varying well depths, the model maintained high accuracy, further validating its applicability in such environments.

Future Prospects

Currently, preliminary results have been achieved in the evaluation and classification of tight sandstone reservoirs based on artificial intelligence. However, as the diversity of feature parameter selection and the complexity of models increase continually, how to further enhance the accuracy and robustness of intelligent reservoir evaluation and classification methods in complex geological environments is a major issue to be addressed. For future improvement, the following points are worthy of further exploration:
(1) Fluid parameters are one of the important feature parameters in reservoirs, influencing the fluidity and recoverability of oil and gas. In future exploration, fluid parameters can be regarded as evaluation indicators for comprehensive reservoir analyses through logging data, core analysis, and geological modeling.
(2) Currently, the GA-XGBoost model is mainly applied to tight sandstone reservoir evaluation and classification. To expand its application scope and achieve broader intelligent identification, future research can focus on other geological features (such as mudstone and shale), deeply analyzing the differences in mudstone and shale reservoirs in the physical properties, chemical composition, and microstructure. By optimizing the architecture and parameter settings of the GA-XGBoost model, it can better suit the identification needs of different target areas and further promote the intelligent and accurate development of reservoir evaluation methods in the field of geology.

6. Conclusions

In this study, an intelligent evaluation method for tight sandstone reservoirs based on an optimized Genetic Algorithm (GA) and Extreme Gradient Boosting (XGBoost) was proposed. The results demonstrate that the GA-XGBoost model significantly outperforms traditional machine learning methods in terms of the classification accuracy and efficiency. By combining GA for hyperparameter optimization and XGBoost for efficient feature selection, the model effectively handles complex reservoir data, providing reliable and stable prediction results. This method not only offers an innovative solution for the evaluation of tight sandstone reservoirs but also provides an effective approach for integrating low-cost logging and core data. The proposed approach significantly improves the decision-making efficiency in underground resource development and exploration, showcasing its strong practical application value.

Author Contributions

Writing, Original draft, Software, Z.M.; Investigation, Formal analysis, C.L.; Investigation, Resources, Z.L.; Writing—Review, T.L.; Project administration, K.Z.; Application of statistical, H.M.; Date Curation, Y.Y.; Supervision, L.L.; Supervision, J.H.; Editing, S.Z. All authors have read and agreed to the published version of the manuscript.

Funding

This research received no external funding.

Data Availability Statement

Due to policy reasons, we can present only part of the data in the Article. In the future, we will release the code and data in accordance with the policy.

Acknowledgments

This research is supported by the National Natural Science Foundation of China (Grant No. 42172161); Key Research and Development Project of Hainan Province (Grant No. GXGS003); Heilongjiang Provincial Natural Science Foundation Sponsored Project (Grant No. LH2022D011); Basic Research Fund Project of Heilongjiang Provincial Education Department (Grant No. 2024YSKYFX-01); Daqing City Guiding Science and Technology Plan Project (Grant No. zd-2024-05).

Conflicts of Interest

The authors declare no conflicts of interest.

Abbreviations

The following abbreviations are used in this manuscript:
XGBoostExtreme Gradient Boosting
ADABoostAdaptive Boosting
GAGenetic Algorithm
SVMSupport vector machine
GRGamma Ray
SPSpontaneous Potential
CALCaliper Log
DENDensity
ACAcoustic
LLSShallow lateral resistivity
SHAPShapley Additive Explanations
GA-XGBoostGenetic Algorithm-Extreme Gradient Boosting

References

  1. Liu, C.; Zhou, B.; Wang, B.S.; Wang, H.; You, Q.; Zhao, G.; Dai, C.L. Synthesis of temperature and salt resistance silicon dots for effective enhanced oil recovery in tight reservoir. Pet. Sci. 2024, 21, 3390–3400. [Google Scholar] [CrossRef]
  2. Bai, Z.; Tan, M.; Li, B.; Shi, Y.; Zhang, H.; Li, G. Fluid Identification Method of Nuclear Magnetic Resonance and Array Acoustic Logging for Complex Oil and Water Layers in Tight Sandstone Reservoir. Processes 2023, 11, 3051. [Google Scholar] [CrossRef]
  3. Liu, D.; Qiu, F.; Liu, N.; Cai, Y.; Guo, Y.; Zhao, B.; Qiu, Y. Pore structure characterization and its significance for gas adsorption in coals: A comprehensive review. Unconv. Resour. 2022, 2, 139–157. [Google Scholar] [CrossRef]
  4. Chen, H.; Ding, C.; Du, Y.; Wang, J. Advances in Reservoir Evaluation Research. Geol. Sci. Technol. Inf. 2015, 34, 66–74. [Google Scholar]
  5. Pu, Q.; Xie, J.; Li, X.; Zhang, Y.; Hu, X.; Hao, X.; Zhang, F.; Zhao, Z.; Cao, J.; Li, Y.; et al. Single-Factor Comprehensive Reservoir Quality Classification Evaluation─ Taking the Hala’alat Mountains at the Northwestern Margin of the Junggar Basin as an Example. ACS Omega 2023, 8, 37065–37079. [Google Scholar] [CrossRef] [PubMed]
  6. Gharavi, A.; Abbas, K.A.; Hassan, M.G.; Haddad, M.; Ghoochaninejad, H.; Alasmar, R.; Shigidi, I. Unconventional reservoir characterization and formation evaluation: A case study of a tight sandstone reservoir in West Africa. Energies 2023, 16, 7572. [Google Scholar] [CrossRef]
  7. Wang, Y.; Cheng, S.; Zhang, F.; Feng, N.; Li, L.; Shen, X.; Yu, H. Big data technique in the reservoir parameters’ prediction and productivity evaluation: A field case in western South China sea. Gondwana Res. 2021, 96, 22–36. [Google Scholar] [CrossRef]
  8. An, P.; Cao, D.; Yang, X.; Zhang, M. Research and Application of Reservoir Classification Method Based on Deep Learning. In Electronic, Proceedings of the CPS/SEG Beijing 2018 International Geophysical Conference & Exhibition, Beijing, China, 24–27 April 2018; China Petroleum Society: Beijing, China; Society of Exploration Geophysicists: Beijing, China; School of Geosciences, China University of Petroleum (East China): Beijing, China; Exploration and Development Research Institute, PetroChina Jidong Oilfield Company: Beijing, China, 2018; p. 4. [Google Scholar]
  9. Ren, Y.; Wei, W.; Zhu, P.; Zhang, X.M.; Chen, K.Y.; Liu, Y.S. Characteristics, classification, and KNN-based evaluation of paleokarst carbonate reservoirs: A case study of Feixianguan Formation in northeastern Sichuan Basin, China. Energy Geosci. 2023, 4, 100156. [Google Scholar] [CrossRef]
  10. Liu, J.J.; Liu, J.C. An intelligent approach for reservoir quality evaluation in tight sandstone reservoir using gradient boosting decision tree algorithm—A case study of the Yanchang Formation, mid-eastern Ordos Basin, China. Mar. Pet. Geol. 2021, 126, 104939. [Google Scholar] [CrossRef]
  11. Jiang, D.L.; Chen, H.; Xing, J.P.; Shang, L.; Wang, Q.H.; Sun, Y.C.; Zhao, Y.; Cui, J.; Lan, D.C. A novel method of quantitative evaluation and comprehensive classification of low permeability-tight oil reservoirs: A case study of Jidong Oilfield, China. Pet. Sci. 2022, 19, 1527–1541. [Google Scholar] [CrossRef]
  12. Li, H.; Deng, S.; Xu, F.; Niu, Y.; Hu, X. Multi-parameter logging evaluation of tight sandstone reservoir based on petrophysical experiment. Acta Geophys. 2021, 69, 429–440. [Google Scholar] [CrossRef]
  13. Shalaby, M.R.; Thota, S.T.; Norsahminan, D.N.P.; Kamalrulzaman, K.N.; Matter, W.S.; Al-Awah, H. Reservoir quality evaluation using petrophysical, well-log analysis, and petrographical description: A case study from the Carboniferous-Permian Kulshill group formations, southern Bonaparte Basin, Australia. Geoenergy Sci. Eng. 2023, 226, 211738. [Google Scholar] [CrossRef]
  14. Lai, J.; Pang, X.; Xiao, Q.; Shi, Y.; Zhang, H.; Zhao, T.; Qin, Z. Prediction of reservoir quality in carbonates via porosity spectrum from image logs. J. Pet. Sci. Eng. 2019, 173, 197–208. [Google Scholar] [CrossRef]
  15. Abbas, M.A.; Al Lawe, E.M. Clustering analysis and flow zone indicator for electro facies characterization in the Upper Shale Member in Luhais Oil Field, Southern Iraq. In Proceedings of the Abu Dhabi International Petroleum Exhibition & Conference, Abu Dhabi, United Arab Emirates, 11–14 November 2019; Society of Petroleum Engineers: Calgary, AB, Canada, 2019. [Google Scholar]
  16. Song, X.; Feng, C.; Li, T.; Zhang, Q.; Pan, X.; Sun, M.; Ge, Y. Quantitative classification evaluation model for tight sandstone reservoirs based on machine learning. Sci. Rep. 2024, 14, 20712. [Google Scholar] [CrossRef] [PubMed]
  17. Pan, B.; Wang, X.; Guo, Y.; Zhang, L.; Ruhan, A.; Zhang, N.; Li, Y. Study on reservoir characteristics and evaluation methods of altered igneous reservoirs in Songliao Basin, China. J. Pet. Sci. Eng. 2022, 212, 110266. [Google Scholar] [CrossRef]
  18. Wu, B.H.; Xie, R.H.; Xiao, L.Z.; Guo, J.F.; Jin, G.W.; Fu, J.W. Integrated classification method of tight sandstone reservoir based on principal component analysis—Simulated annealing genetic algorithm—Fuzzy cluster means. Pet. Sci. 2023, 20, 2747–2758. [Google Scholar] [CrossRef]
  19. Cui, Y.; Yang, J.; Rao, L.; Yang, S.; Jiang, Y.; Lu, K.; Yan, C. Classification and evaluation of flow units in tight sandstone reservoirs based on neural network model: A case study of Chang 6 Oil Layer Group in the Northern Part of WQ Area, Ordos Basin. J. Xi’an Shiyou Univ. (Nat. Sci. Ed.) 2024, 39, 22–30. [Google Scholar]
  20. Chen, L.; Ji, W.; Wang, D. Logging Evaluation Method for Tight Sandstone Reservoirs Based on Cluster Analysis. Petrochem. Ind. Appl. 2024, 43, 50–54. [Google Scholar]
  21. Ma, L.; Xiao, H.; Tao, J.; Zheng, T.; Zhang, H. An intelligent approach for reservoir quality evaluation in tight sandstone reservoir using gradient boosting decision tree algorithm. Open Geosci. 2022, 14, 629–645. [Google Scholar] [CrossRef]
  22. Li, Y. Research on Reservoir Pore Structure Evaluation and Reservoir Classification Prediction Methods Based on Deep Learning. Ph.D. Thesis, China University of Petroleum, Beijing, China, 2020. [Google Scholar] [CrossRef]
  23. Lu, X.; Xing, X.; Hu, K.; Zhou, B. Classification and evaluation of tight sandstone reservoirs based on MK-SVM. Processes 2023, 11, 2678. [Google Scholar] [CrossRef]
  24. Zheng, D.Y.; Hou, M.C.; Chen, A.Q.; Zhong, H.T.; Qi, Z.; Ren, Q.; You, J.C.; Wang, H.Y.; Ma, C. Application of machine learning in the identification of fluvial-lacustrine lithofacies from well logs: A case study from Sichuan Basin, China. J. Pet. Sci. Eng. 2022, 215, 110610. [Google Scholar] [CrossRef]
  25. Chu, Q.; Ge, Y.; Tong, M.; Wang, Y.; An, L.; Yu, C.; Jia, X. Lithology logging curve prediction method based on XGBoost algorithm. Well Logging Technol. 2024, 48, 748–754. [Google Scholar] [CrossRef]
  26. Liu, W.; Chen, Z.; Hu, Y.; Xu, L. A systematic machine learning method for reservoir identification and production prediction. Pet. Sci. 2023, 20, 295–308. [Google Scholar] [CrossRef]
  27. Wang, Z.; Tang, H.; Hou, Y.; Shi, H.; Li, J.; Yang, T.; Meng, W. Quantitative evaluation of unconsolidated sandstone heavy oil reservoirs based on machine learning. Geol. J. 2023, 58, 2321–2341. [Google Scholar] [CrossRef]
  28. Wang, C.; Wang, Z.; Dong, H.; Lauria, S.; Liu, W.; Wang, Y.; Fadzil, F.; Liu, H. Fusionformer: A novel adversarial transformer utilizing fusion attention for multivariate anomaly detection. IEEE Trans. Neural Netw. Learn. Syst. 2025, in press. [Google Scholar] [CrossRef] [PubMed]
  29. Liu, T.; Liu, Z.; Zhang, K.; Li, C.; Zhang, Y.; Mu, Z.; Liu, F.; Liu, X.; Mu, M.; Zhang, S. Intelligent Identification Method for the Diagenetic Facies of Tight Oil Reservoirs Based on Hybrid Intelligence—A Case Study of Fuyu Reservoir in Sanzhao Sag of Songliao Basin. Energies 2024, 17, 1708. [Google Scholar] [CrossRef]
  30. Huo, Z.P.; Hao, S.B.; Liu, B.; Zhang, J.C.; Ding, J.H.; Tang, X.; Li, C.R.; Yu, X.F. Geochemical characteristics and hydrocarbon expulsion of source rocks in the first member of the Qingshankou Formation in the Qijia-Gulong Sag, Songliao Basin, Northeast China: Evaluation of shale oil resource potential. Energy Sci. Eng. 2020, 5, 1450–1467. [Google Scholar] [CrossRef]
  31. Alatefi, S.; Abdel Azim, R.; Alkouh, A.; Hamada, G. Integration of multiple Bayesian optimized machine learning techniques and conventional well logs for accurate prediction of porosity in carbonate reservoirs. Processes 2023, 11, 1339. [Google Scholar] [CrossRef]
  32. Li, Z. Extracting spatial effects from machine learning models using local interpretation methods: An example of SHAP and XGBoost. Comput. Environ. Urban Syst. 2022, 96, 101845. [Google Scholar] [CrossRef]
  33. Xi, H.; Luo, Z.; Guo, Y. Reservoir evaluation method based on explainable machine learning with small samples. Unconv. Resour. 2025, 5, 100128. [Google Scholar] [CrossRef]
  34. Chen, T.; Guestrin, C. XGBoost: A scalable tree boosting system. In Proceedings of the 22nd ACM SIGKDD International Conference on Knowledge Discovery and Data Mining, San Francisco, CA, USA, 13–17 August 2016; pp. 785–794. [Google Scholar]
  35. Joachims, T. Making Large-Scale SVM Learning Practical; Technical Report No. 1998,28; TU Dortmund University: Dortmund, Geramny, 1998. [Google Scholar]
  36. Schapire, R.E. Explaining AdaBoost. In Empirical Inference: Festschrift in Honor of Vladimir N. Vapnik; Springer: Berlin/Heidelberg, Germany, 2013; pp. 37–52. [Google Scholar]
  37. Antariksa, G.; Muammar, R.; Lee, J. Performance evaluation of machine learning-based classification with rock-physics analysis of geological lithofacies in Tarakan Basin, Indonesia. J. Pet. Sci. Eng. 2022, 208, 109250. [Google Scholar] [CrossRef]
  38. Hodson, T.O. Root mean square error (RMSE) or mean absolute error (MAE): When to use them or not. Geosci. Model Dev. Discuss. 2022, 15, 5481–5487. [Google Scholar] [CrossRef]
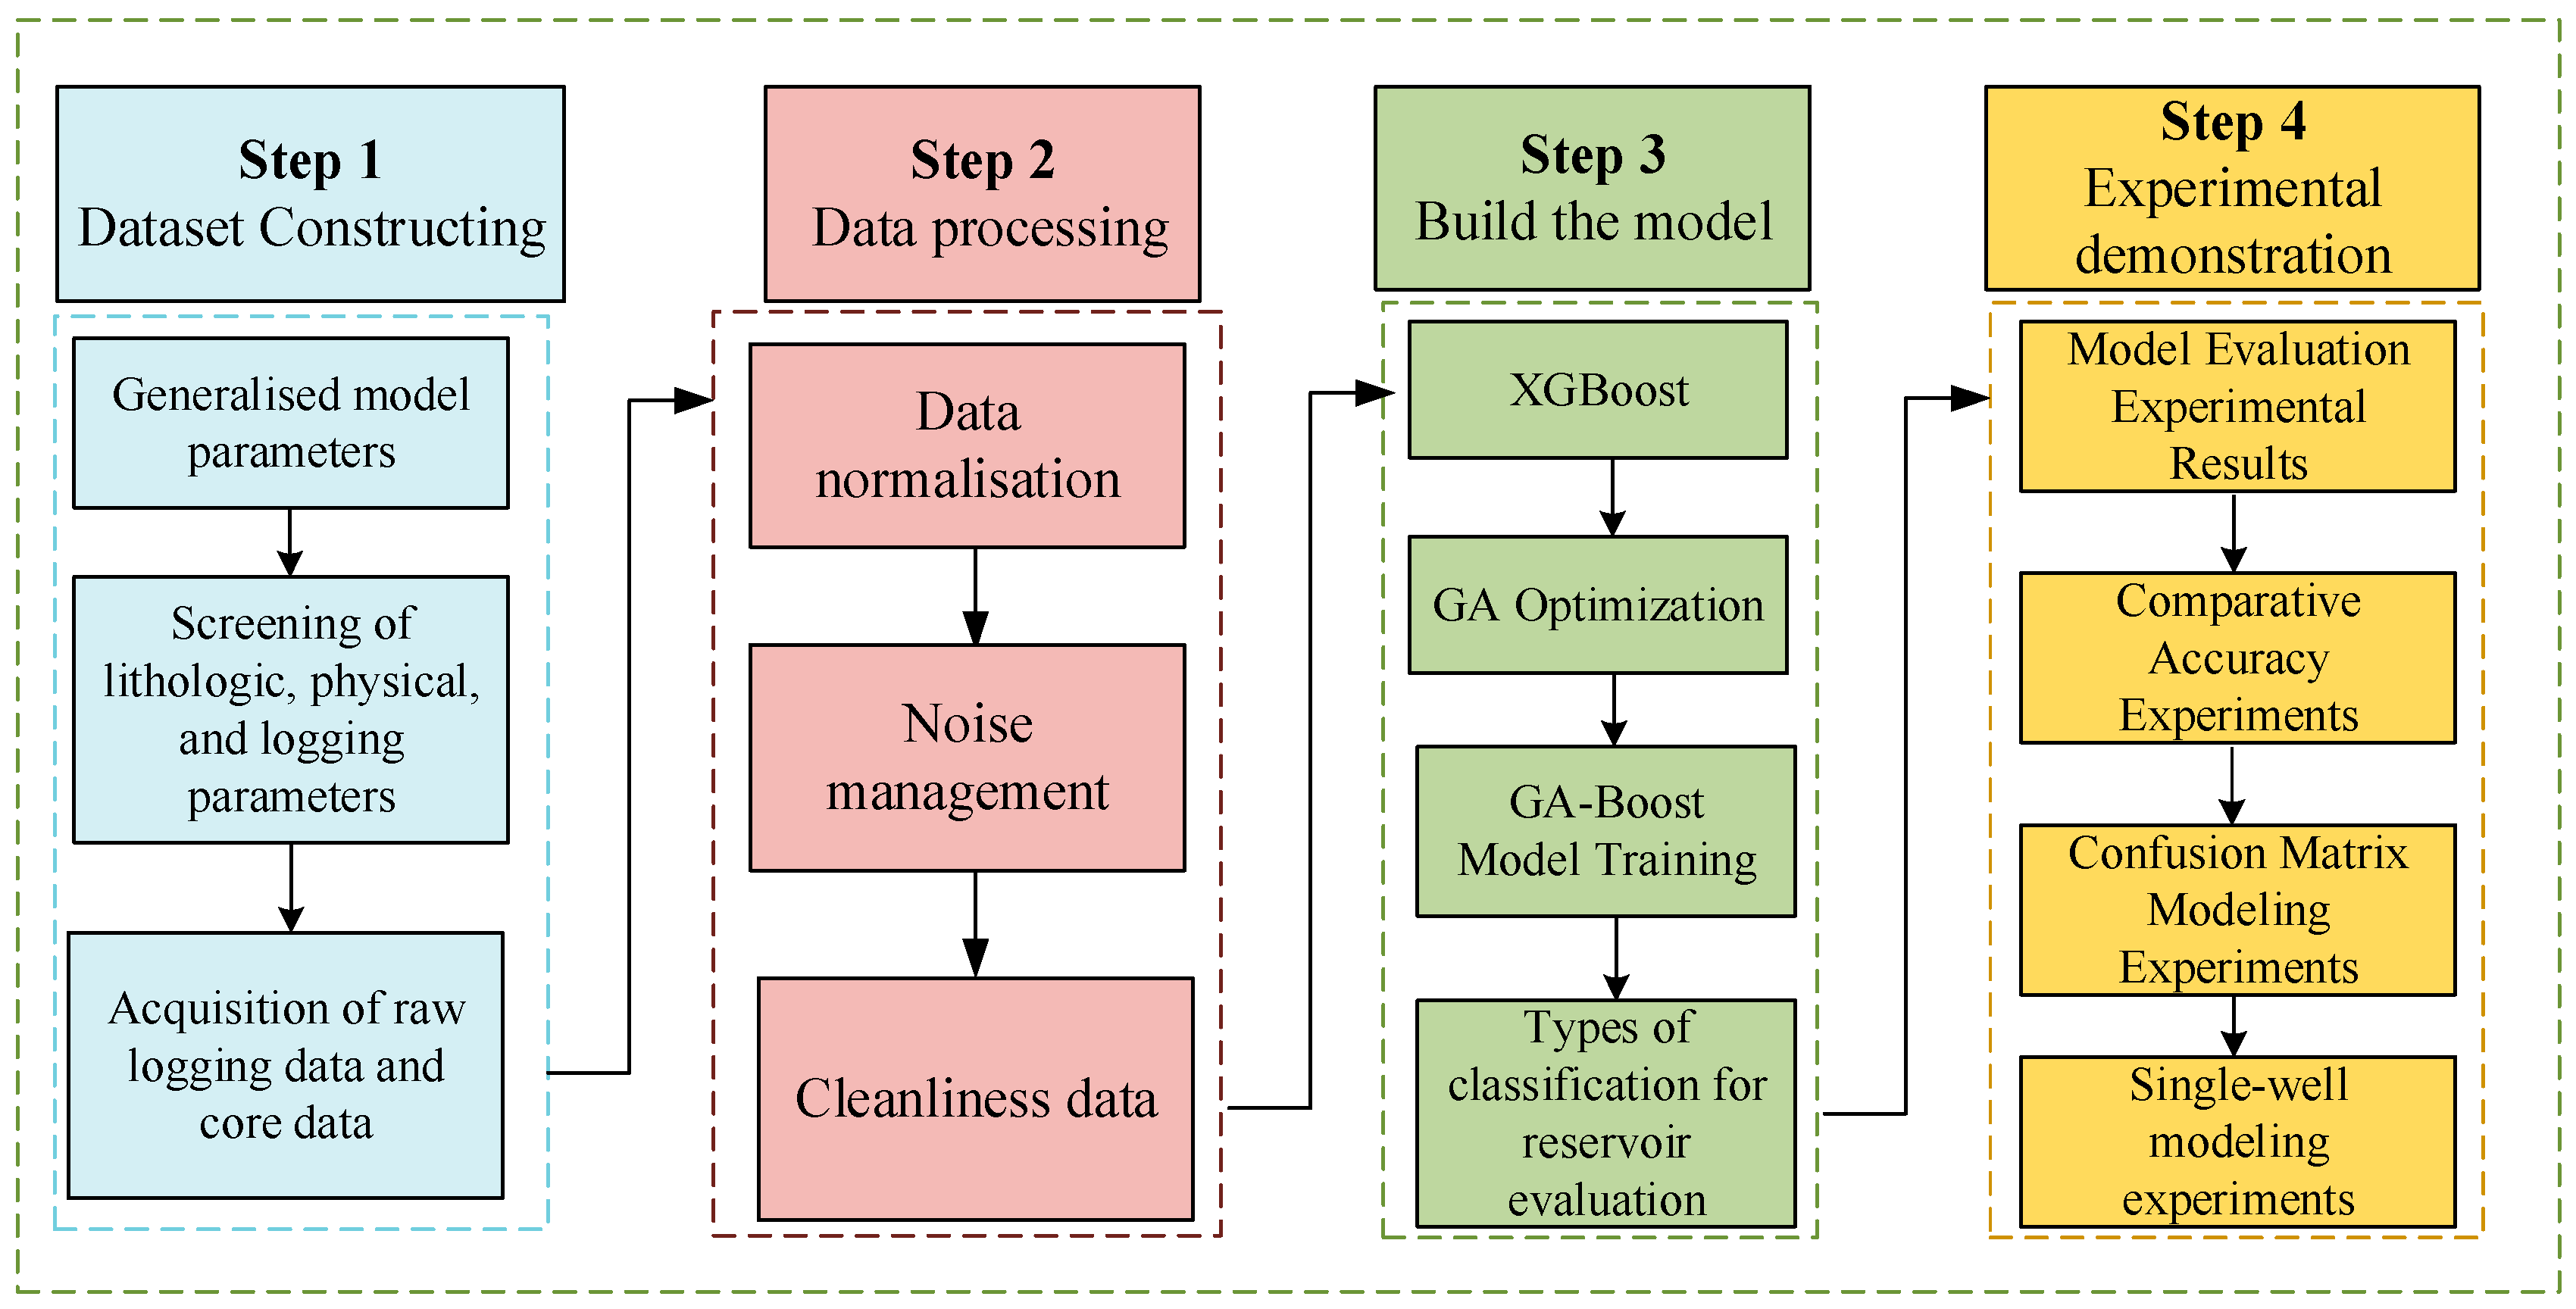
Figure 1. GA-XGBoost Overall Flowchart.
Processes 13 01379 g001
Figure 2. Location of Study Area and Structural Unit Division of Songliao Basin (modified from [30]). (a) Geographical location of study area in China (b) Structural unit and boundary division of Songliao Basin.
Processes 13 01379 g002
Figure 3. Histogram of the relative content of clastic components in reservoirs.
Processes 13 01379 g003
Figure 4. Triangulation of rock types in dense sandstone.
Processes 13 01379 g004
Figure 5. Relationship between porosity and permeability of different types of reservoirs.
Processes 13 01379 g005
Figure 6. Physical Characteristics of Different Types of Lithofacies in Fuyu Reservoir of Zhou 6 Block. (a) Comparison of Porosity Distribution of Different Rock Phases. (b) Comparison of Permeability Distribution of Different Rock Phases.
Processes 13 01379 g006
Figure 7. SHAP importance rating scale.
Processes 13 01379 g007
Figure 8. Flowchart of GA-XGBoost model algorithm.
Processes 13 01379 g008
Figure 9. XGBoost workflow chart.
Processes 13 01379 g009
Figure 10. Genetic Algorithm flowchart.
Processes 13 01379 g010
Figure 11. GA-XGBoost training loss.
Processes 13 01379 g011
Figure 12. Comparison of Reservoir Model Precision. (a) Experimental Effects on the Test Set. (b) Experimental Effects on the Training Set.
Processes 13 01379 g012
Figure 13. Confusion matrix experimental results. (a) XGBoost model performance. (b) SVM model performance. (c) ADA boost model performance. (d) GA-XGBoost model performance.
Processes 13 01379 g013aProcesses 13 01379 g013b
Figure 14. Simulation diagram of single-well model results.
Processes 13 01379 g014
Table 1. Physical Parameters of Different Horizons in Zhou 6 Block of Sanzhao Sag, Songliao Basin.
StratumLithologicalPorosityPermeabilityQuartz ContentFeldspar ContentDebris Content
B18 laminationSiltstone10.6%0.75 mD23.5%30.5%32.5%
B183 laminationSilty sandstone11.3%0.73 mD24.7%32.8%33.2%
Z11 laminationSiltstone12.5%0.77 mD25.6%33.7%32.4%
Table 2. Results of applying principal component analysis to response characteristics of the logging curve.
Response CharacteristicsGRSPCALDENACLLSCNLRT
Relevance0.86880.68460.56930.42700.43280.41710.12410.1668
Sections0.86881.55352.12282.44972.56882.68392.89552.9463
Normalization0.33760.60360.82470.95180.96160.94410.92310.9171
Table 3. Reservoir core statistics of Fuyu Reservoir in Sanzhao Sag, Songliao Basin.
OrderWellCoring Depth (m)Length (m)OrderWellCoring Depth (m)Length (m)
TopBottomTopBottom
1B71872.7002081.100208.409F4641835.951939.3091.45
2B171858.0252043.475185.4510H23-61800.0201831.17031.15
3B181836.0012139.951303.9511S521719.0001872.000153.00
4B1021914.5001963.40048.9012S5411818.0251946.975128.95
5B1831895.0121906.96211.9513S551754.0001793.95039.95
6B2111774.991792.5917.6014X212130.372149.1618.79
7F1881835.0391939.989104.9515X232070.262131.9961.52
8F3611765.3251808.475125.1516Z111809.351826.4615.92
Table 4. Graded porosity and permeability parameters for lithologic reservoirs.
Reservoir TypesReservoir NameMean PorosityMean Permeability
Class ISt12.42%0.48 mD
Class ISa12.26%0.42 mD
Class ISp11.83%0.38 mD
Class IISw9.83%0.19 mD
Class IIIFh8.72%0.13 mD
Class IIIFw7.64%0.09 mD
Table 5. Evaluation indexes of tight sandstone reservoir in Fuyu Reservoir.
Evaluation ParametersReservoir Class IReservoir Class IIReservoir Class III
LithologyFine sandstone/SiltstoneFine stone/SiltstoneSiltstone/Muddy siltstone
Porosity/%≥109–10<8
Permeability/10−3 μm≥0.30.2–0.3<0.1
So/%>5535–55<35
GR/API58.69~92.8961.18~107.6472.51~108.94
SP/mv47.93~−14.8448.24~−11.2361.5~−14.5
CAL/cm8.47~9.568.47~9.178.47~9.02
DEN/g/cm³2.35~2.592.4~2.642.44~2.58
LLS/Ω·m3.12~5.755.75~7.827.82~10.51
AC/μs/m65.81~77.3261.41~79.7658.55~74.48
Table 6. Speed evaluation experimental data and number of data sets.
Well NumberWell TypeData Volume
B17Training well872
B183Training well951
X21Testing well1392
Z11Testing well726
Table 7. Evaluation metrics for training set classification prediction.
ModelPrecisionRecallAccuracyF1
SVM0.720.770.760.74
XGBoost0.760.780.770.81
ADABoost0.820.840.810.83
GA-XGBoost0.840.850.880.87
Table 8. Evaluation metrics for test set classification prediction.
ModelPrecisionRecallAccuracyF1
SVM0.720.770.760.74
XGBoost0.760.780.770.81
ADABoost0.820.840.810.83
GA-XGBoost0.840.850.880.87
Table 9. Comparison of errors in reservoir evaluation and classification models.
ModelPredicted Class I ReservoirPredicted Class Reservoir II
RMSEMSEMAERMSEMSEMAE
SVM1.908.303.003.3722.212.05
XGBoost3.0319.332.132.8510.830.39
ADABoost1.9112.843.661.6210.413.10
GA-XGBoost0.8611.402.302.3510.692.29
ModelPredicted Class Reservoir III
RMSEMSEMAE
SVM1.0417.903.11
XGBoost0.991.032.65
ADABoost1.532.161.37
GA-XGBoost0.9410.951.61
Disclaimer/Publisher’s Note: The statements, opinions and data contained in all publications are solely those of the individual author(s) and contributor(s) and not of MDPI and/or the editor(s). MDPI and/or the editor(s) disclaim responsibility for any injury to people or property resulting from any ideas, methods, instructions or products referred to in the content.