Article

Study of the Scale-Up Method and Dynamic Performance of the Forced-Air Self-Aspirating Flotation Machine

1
State Key Laboratory of Mineral Processing, BGRIMM Technology Group, Beijing 100160, China
2
School of the Mechanical Engineering, University of Science and Technology Beijing, Beijing 100083, China
*
Author to whom correspondence should be addressed.
Processes 2025, 13(5), 1316; https://doi.org/10.3390/pr13051316
Submission received: 10 March 2025 / Revised: 10 April 2025 / Accepted: 23 April 2025 / Published: 25 April 2025
(This article belongs to the Special Issue Mineral Processing Equipments and Cross-Disciplinary Approaches)

Abstract

:
The forced-air self-aspirating flotation machine is the core equipment for achieving a horizontal configuration in a large-scale flotation circuit. During scale-up, power consumption increases significantly due to the requirement for a greater pulp suction volume, while flotation dynamics deteriorate. Therefore, it is difficult to meet the horizontal configuration requirement for a large-scale flotation process. In this study, the key factors influencing pulp suction capacity were analyzed, revealing that as impeller submergence depth increases, pulp suction capacity decreases sharply, while power consumption rises, which was determined to be the main limitation in scaling up a forced-air self-aspirating flotation machine. To address these challenges, a new design concept for large-scale forced-air self-aspirating flotation machines was developed, featuring an impeller–stator system positioned in the middle of a trough. This design eliminated the issue of the impeller moving farther from the overflow weir and prevented increasing pulp suction resistance during scale-up. Additionally, an independent design of the upper blades was introduced based on pulp suction demand, and the design method and scale-up equations for the new impeller were established. An industrial experiment system based on a 50 m3 forced-air self-aspirating flotation machine was established to verify the developed design schemes. The new impeller with a middle placement design achieved the best separation performance, exhibited low unit pulp suction power consumption, and demonstrated the most favorable overall performance. Using CFD simulations, the flow pattern and dynamic performance were calculated, including the pulp suction volume, circulation volume, and gas–liquid dispersion for large-scale forced-air self-aspirating flotation machines. The first and largest 160 m3 large-scale forced-air self-aspirating flotation cell was successfully developed and applied in a copper–sulfur mine, where the function of self-absorbing pulp was achieved and power consumption was effectively controlled. Finally, the feasibility and accuracy of the new large-scale forced-air self-aspirating flotation machine design and scale-up method were verified. In this paper, a large forced-air self-aspirating flotation machine is designed and developed which is capable of supporting horizontally configured large-scale flotation processes. This innovative approach significantly simplifies the processing layout and reduces both the equipment configuration complexity and energy consumption, offering a more efficient and cost-effective solution for large-scale mineral processing operations.

1. Introduction

In mineral processing circuits, a flotation bank typically comprises 3–4 flotation machines, with the overall circuit configuration consisting of multiple sequential stages including roughing and scavenging banks [1]. The flotation machine configurations that dominate industrial practice include the stepped configuration and the horizontal configuration [2]. The stepped configuration requires sufficient height differences between successive flotation banks to enable gravity-driven pulp transport, while intermediate products (such as froth) require pumping between banks [3]. In contrast, the horizontal configuration facilitates pulp transport, including feeding and middling transfer through forced-air self-aspirating flotation machines [4]. For instance, Shen Zhengchang [5] employed one roughing and three scavenging configurations in a 50 m3 flotation circuit. Their results showed that the horizontal configuration could achieve a 3.2 m reduction in vertical elevation requirements, a 32% decrease in plant footprint length, and a 24% reduction in overall floor area. Compared with a stepped configuration, the horizontal configuration demonstrates significant advantages in circuit configuration optimization, auxiliary equipment reduction, power consumption minimization, and operational cost efficiency. This comparative analysis conclusively demonstrates the technical and economic superiority of horizontal configuration design in modern flotation plant engineering.
The core innovation of horizontal-configuration technology lies in the forced-air self-aspirating flotation machine, which simultaneously circulates pulp and transports feeding/middling streams. Early implementations of horizontal-configuration technology primarily utilized air-induced self-aspirating flotation machines named “A”-type, which came from Russia [6], with a maximum volume limited to 2.8 m3. BGRIMM [7] subsequently developed an air-induced self-aspirating flotation machine named “SF”-type to replace “A”-type units, achieving volumes up to 16 m3.
Responding to the change in mineral resource characteristics, equipment advancements led to the successful development of new air-induced self-aspirating flotation machines named the “BF” and “GF” series [8,9], reaching up to 40 m3. However, the suction performance of these machines remains constrained by fixed parameters, including impeller speed and submergence depth, which prevent the independent adjustment of the air superficial velocity. This limitation causes three operational challenges when processing variable ores, requiring airflow modifications such as reduced process adaptability, froth instability, and separation efficiency degradation.
The technological limitation of fixed parameters can be resolved through forced-air self-aspirating flotation machines that enable independent adjustment of the air superficial velocity. The initial implementation of this concept was the Denver DR-2 flotation machine developed in the United States [10]. However, its complex mechanical design and operational instability prevented successful industrial implementation, ultimately leading to its discontinuation. Modern Denver DR pneumatic flotation machines have reverted to a stepped configuration. Shen Zhengchang [11] addressed this challenge by developing the forced-air self-aspirating flotation machine named the “XCF” series, which could meet the engineering requirements of a horizontal configuration. Forced-air self-aspirating flotation machines with a horizontal configuration have become the preferred solution for Chinese mineral processing plants handling up to 5000 t/d [12].
The evolution of mineral resource characteristics has driven the industry toward large-scale processing plants for bulk mineral exploitation [13,14]. However, the current technological constraints of large-scale forced-air self-aspirating flotation machines leave limited configuration options [15,16], forcing the stepped configuration to remain the default choice for processing bulk minerals such as copper and molybdenum ores in roughing/scavenging circuits [17,18]. Three critical challenges emerge during machine scale-up, including exponentially increasing power consumption, intensified pulp surface turbulence, and degradation of suction efficiency. Although a 50 m3 forced-air self-aspirating flotation machine was developed in 2001 [4], progress toward further scale-up has stagnated. This technological plateau has prevented breakthrough engineering applications of the horizontal configuration in large-scale flotation circuits, particularly for plants exceeding a 10,000 t/d capacity. The industry continues to seek solutions that balance scale-up requirements with energy efficiency and hydrodynamic stability.
The scale-up of flotation cells remains a critical challenge in flotation equipment advancement. Current research efforts concentrate on large-scale development and engineering conversion of conventional air-forced flotation machines (non-pumping type), for which significant progress has been achieved in scaling up. Leading institutions or manufacturers including Metso, BGRIMM, and FLSmidth have successfully implemented 600+ m3 flotation units [19,20,21]. At present, BGRIMM’s 800 m3 prototype is undergoing industrial trials in a copper mine in China. Metso’s approach [22] applies similarity principles combined with CFD simulations. Nelson M.G. and Gorain’s framework [23,24] established dimensionless criteria (Froude number, Fr; flow number, Ca; and power number, Np) for self-aspirating machines. Shen Zhengchang [25] implemented trend extrapolation through equivalent Reynolds numbers, geometrical similarity, and kinematic similarity. Shi Shuaixing [16,26] developed a method that redefines and quantifies the internal dynamics zones and further introduced the idea of asynchronous amplification in different dynamic zones for new large-scale flotation machines. During the same period, advanced computational fluid dynamics (CFD) and new experimental fluid dynamics (EFD) were mainly used in the optimization and amplification design [22,27,28,29,30,31,32,33,34,35]. Advanced multiphase flow techniques such as PEPT, PIV, and LDV can provide deeper insights into the internal flow characteristics and fundamental mechanisms within flotation machines, thereby facilitating the development of large-scale flotation machines [36,37,38]. Alexander [39] developed the use of the bubble surface area flux (Sb) as the scale-up criterion, with the assumption that the flotation rate has a linear relation with Sb. Arbiter [40] introduced the effect of the mixing regime from batch (plug flow equivalent) to plant (N-perfect mixers in series) on the flotation time required to reach the same recovery to study hydrodynamics and scale-up methods. Yianatos, J. conducted continuous research on flotation process scale-up methods and flotation machine performance evaluation techniques, making significant contributions to the field [17,41]. Specifically, Yianatos, J. investigated the amplification of the equipment through the residence time distribution characteristics of the flotation machine [42,43]. Moreover, Yianatos, J. presented an approach to evaluate the performance of a bank considering a model structure with a single cell consisting of two different zones, the collection and froth zones, and a distributed system [44]. Furthermore, Yianatos, J. evaluated the effect of particle size and liberation on flotation scale-up factors [45]. Yianatos, J. also revealed the limiting factors for large-scale flotation machines by analyzing the effects of bubble loading and froth recovery on flotation efficiency [46]. Mesa and Brito-Parada [13] claimed that a better understanding of flotation scale-up is required and new studies must consider the pulp and froth zones separately. Existing geometric similarity principles face implementation barriers when scaling forced-air self-aspirating flotation cells beyond current limits without altering their original architectural framework. Key engineering challenges remain in terms of maintaining structural integrity during scale-up, preserving suction efficiency in enlarged units, and balancing power consumption with hydrodynamic performances.
Conventional scale-up methodologies for forced-air self-aspirating flotation machines employ coupled impeller enlargement, which synchronously increases the upper-/lower-blade dimensions with speed. In standard configurations, the upper blades typically occupy 60–70% of the lower blade’s surface area while consuming 25–35% of the total energy input. The original scaling-up approach creates critical power efficiency challenges. For instance, a 160 m3 unit designed through the traditional scale-up method requires >280 kW of installed power, while the equivalent air-forced flotation machines require about 160 kW of energy (56% lower demand). The upper-blade pulp suction alone is expected to consume about 70–100 kW of energy, which will be even higher if the pulp is delivered directly via a pump.
Fundamental design flaws create an energy–performance paradox. The large power requirement results in larger stirring speeds and impeller diameters, which leads to deterioration in metallurgy performances. In short, the original impeller design and scale-up method produced an impeller with a high power consumption, and thus the mismatch between the power consumption, the capacity of the pulp suction, and the metallurgy performance became progressively worse.
This study established a 200 L laboratory-scale forced-air self-aspirating flotation machine system to investigate the impact of operational parameters on power consumption and slurry suction capacity. Through systematic analysis, fundamental constraints were identified in conventional scale-up methodologies. A new redesigned large-scale forced-air self-aspirating flotation machine was developed. This machine consists of an innovative impeller design and methods for equipment scale-up to address scale-up challenges. Using computational fluid dynamics (CFD), the largest 160 m3 forced-air self-aspirating flotation machine was developed. CFD simulations identified performance parameters such as pulp suction capacity, circulation capacity, and power consumption. The dynamic performances of the flotation machine were analyzed using industrial pulp tests, which validated the developed scale-up methodology. This study provides engineering foundations for the implementation of horizontal configurations for large-scale flotation circuits.

2. Forced-Air Self-Aspirating Flotation Machine

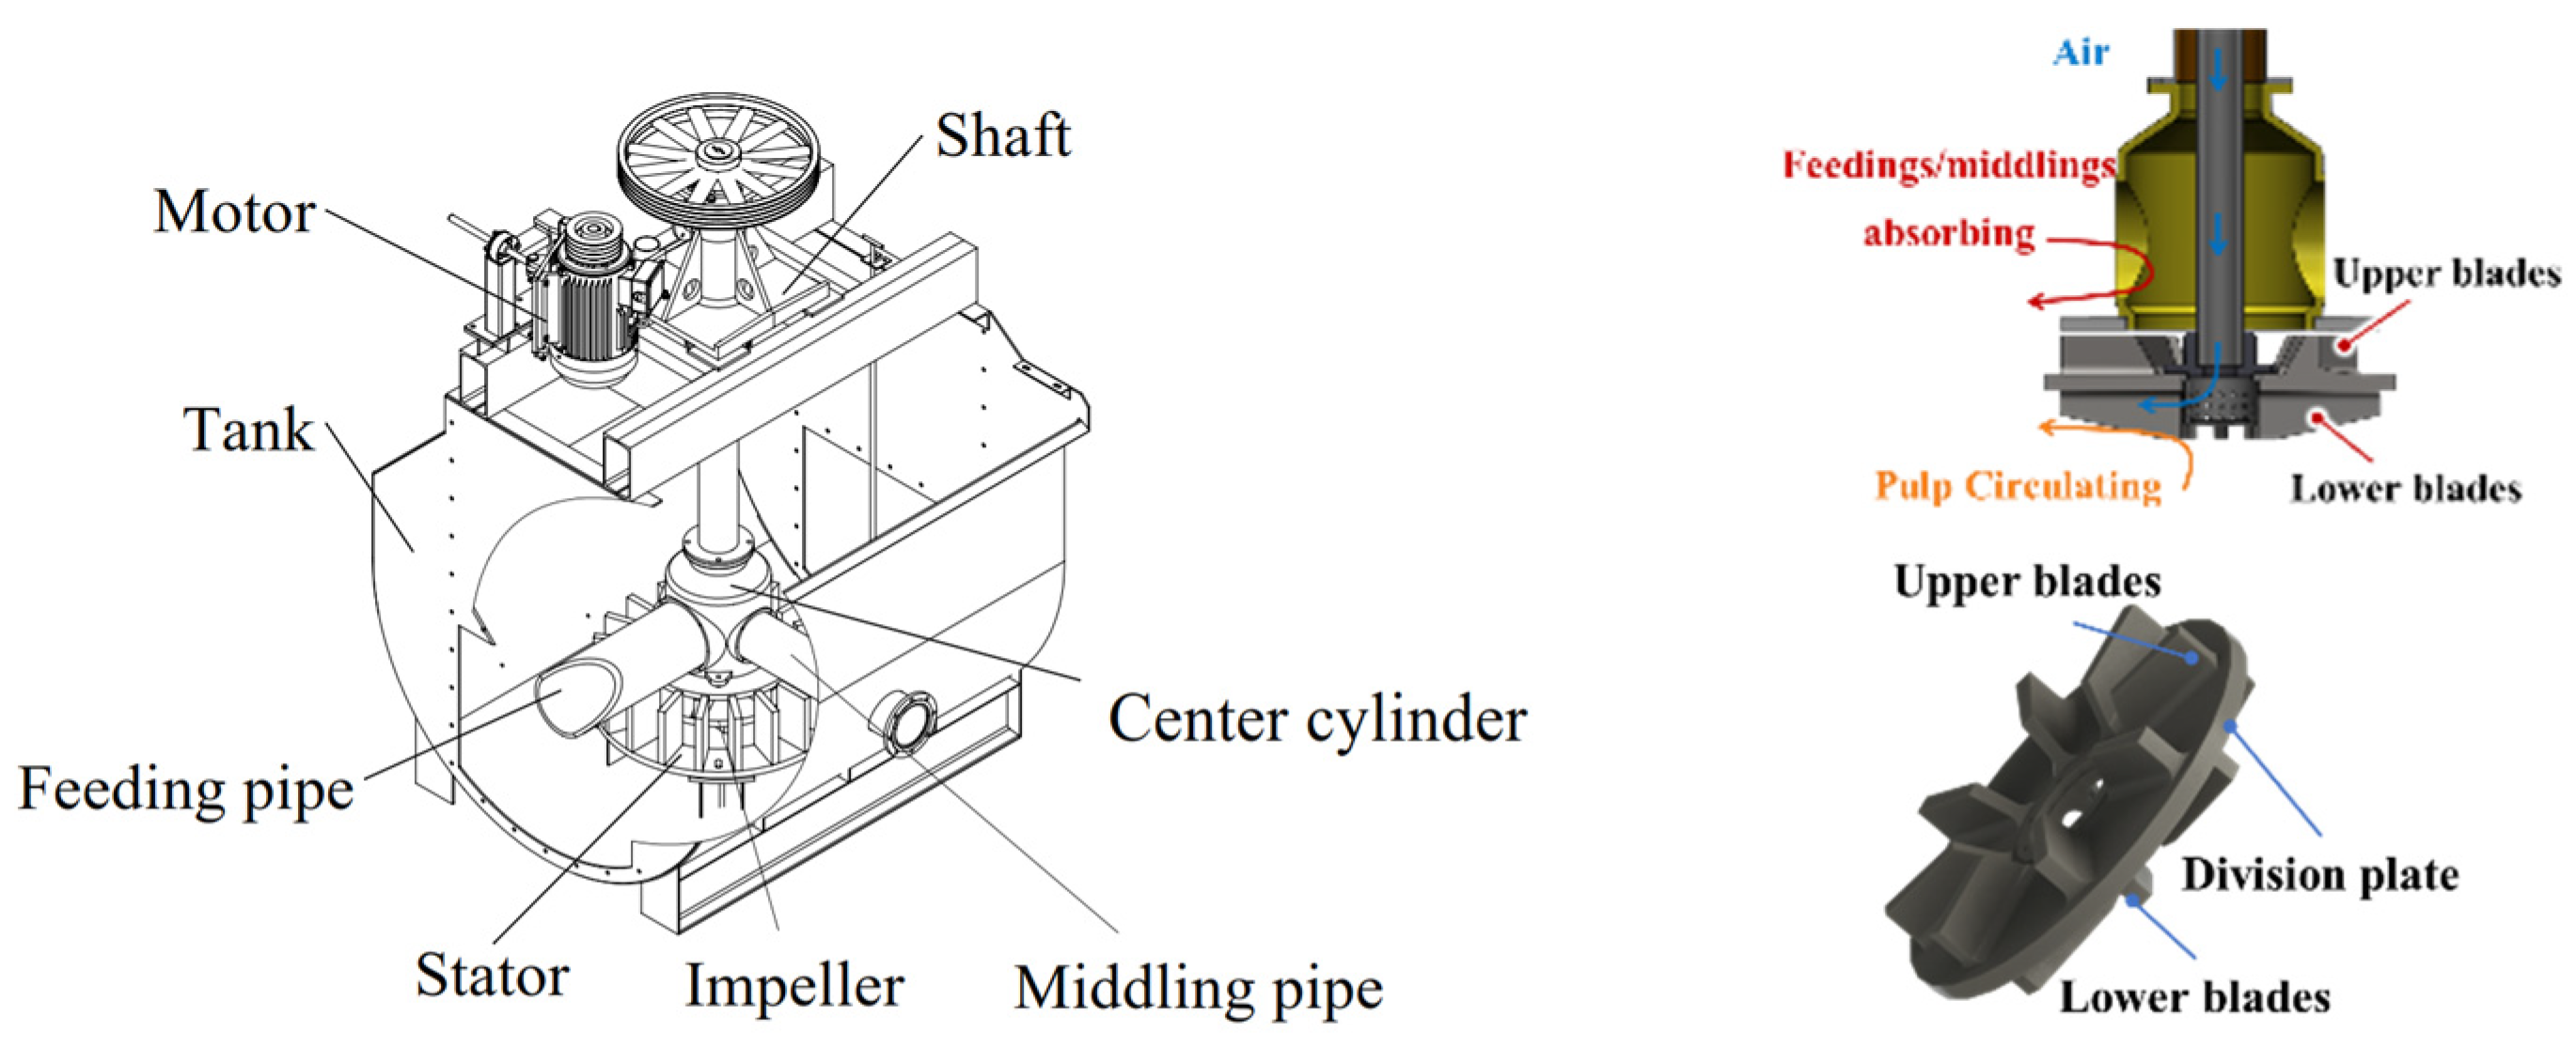
2.1. Conventional Forced-Air Self-Aspirating Flotation Machine

The conventional forced-air self-aspirating flotation machine and its impeller are shown in Figure 1. The impeller incorporates two types of blade with independent working zones, i.e., the impeller is divided into upper and lower blades separated by a disk to create distinct functional areas. Compressed air supplied through the hollow shaft enters the lower-blade zone, where the lower blades circulate pulp within the tank and disperse air. Simultaneously, the upper blades generate localized negative pressure to pump feeding or middling streams. This configuration resolves the critical challenge of enabling the impeller–stator system to achieve negative-pressure suction of feeding/middling in a positive-pressure aeration environment while maintaining internal pulp circulation [47]. By integrating these dual functions, the forced-air self-aspirating flotation machine addresses the conflicting requirements of slurry transport and hydrodynamic stability under pressurized operating conditions.

2.2. Methods

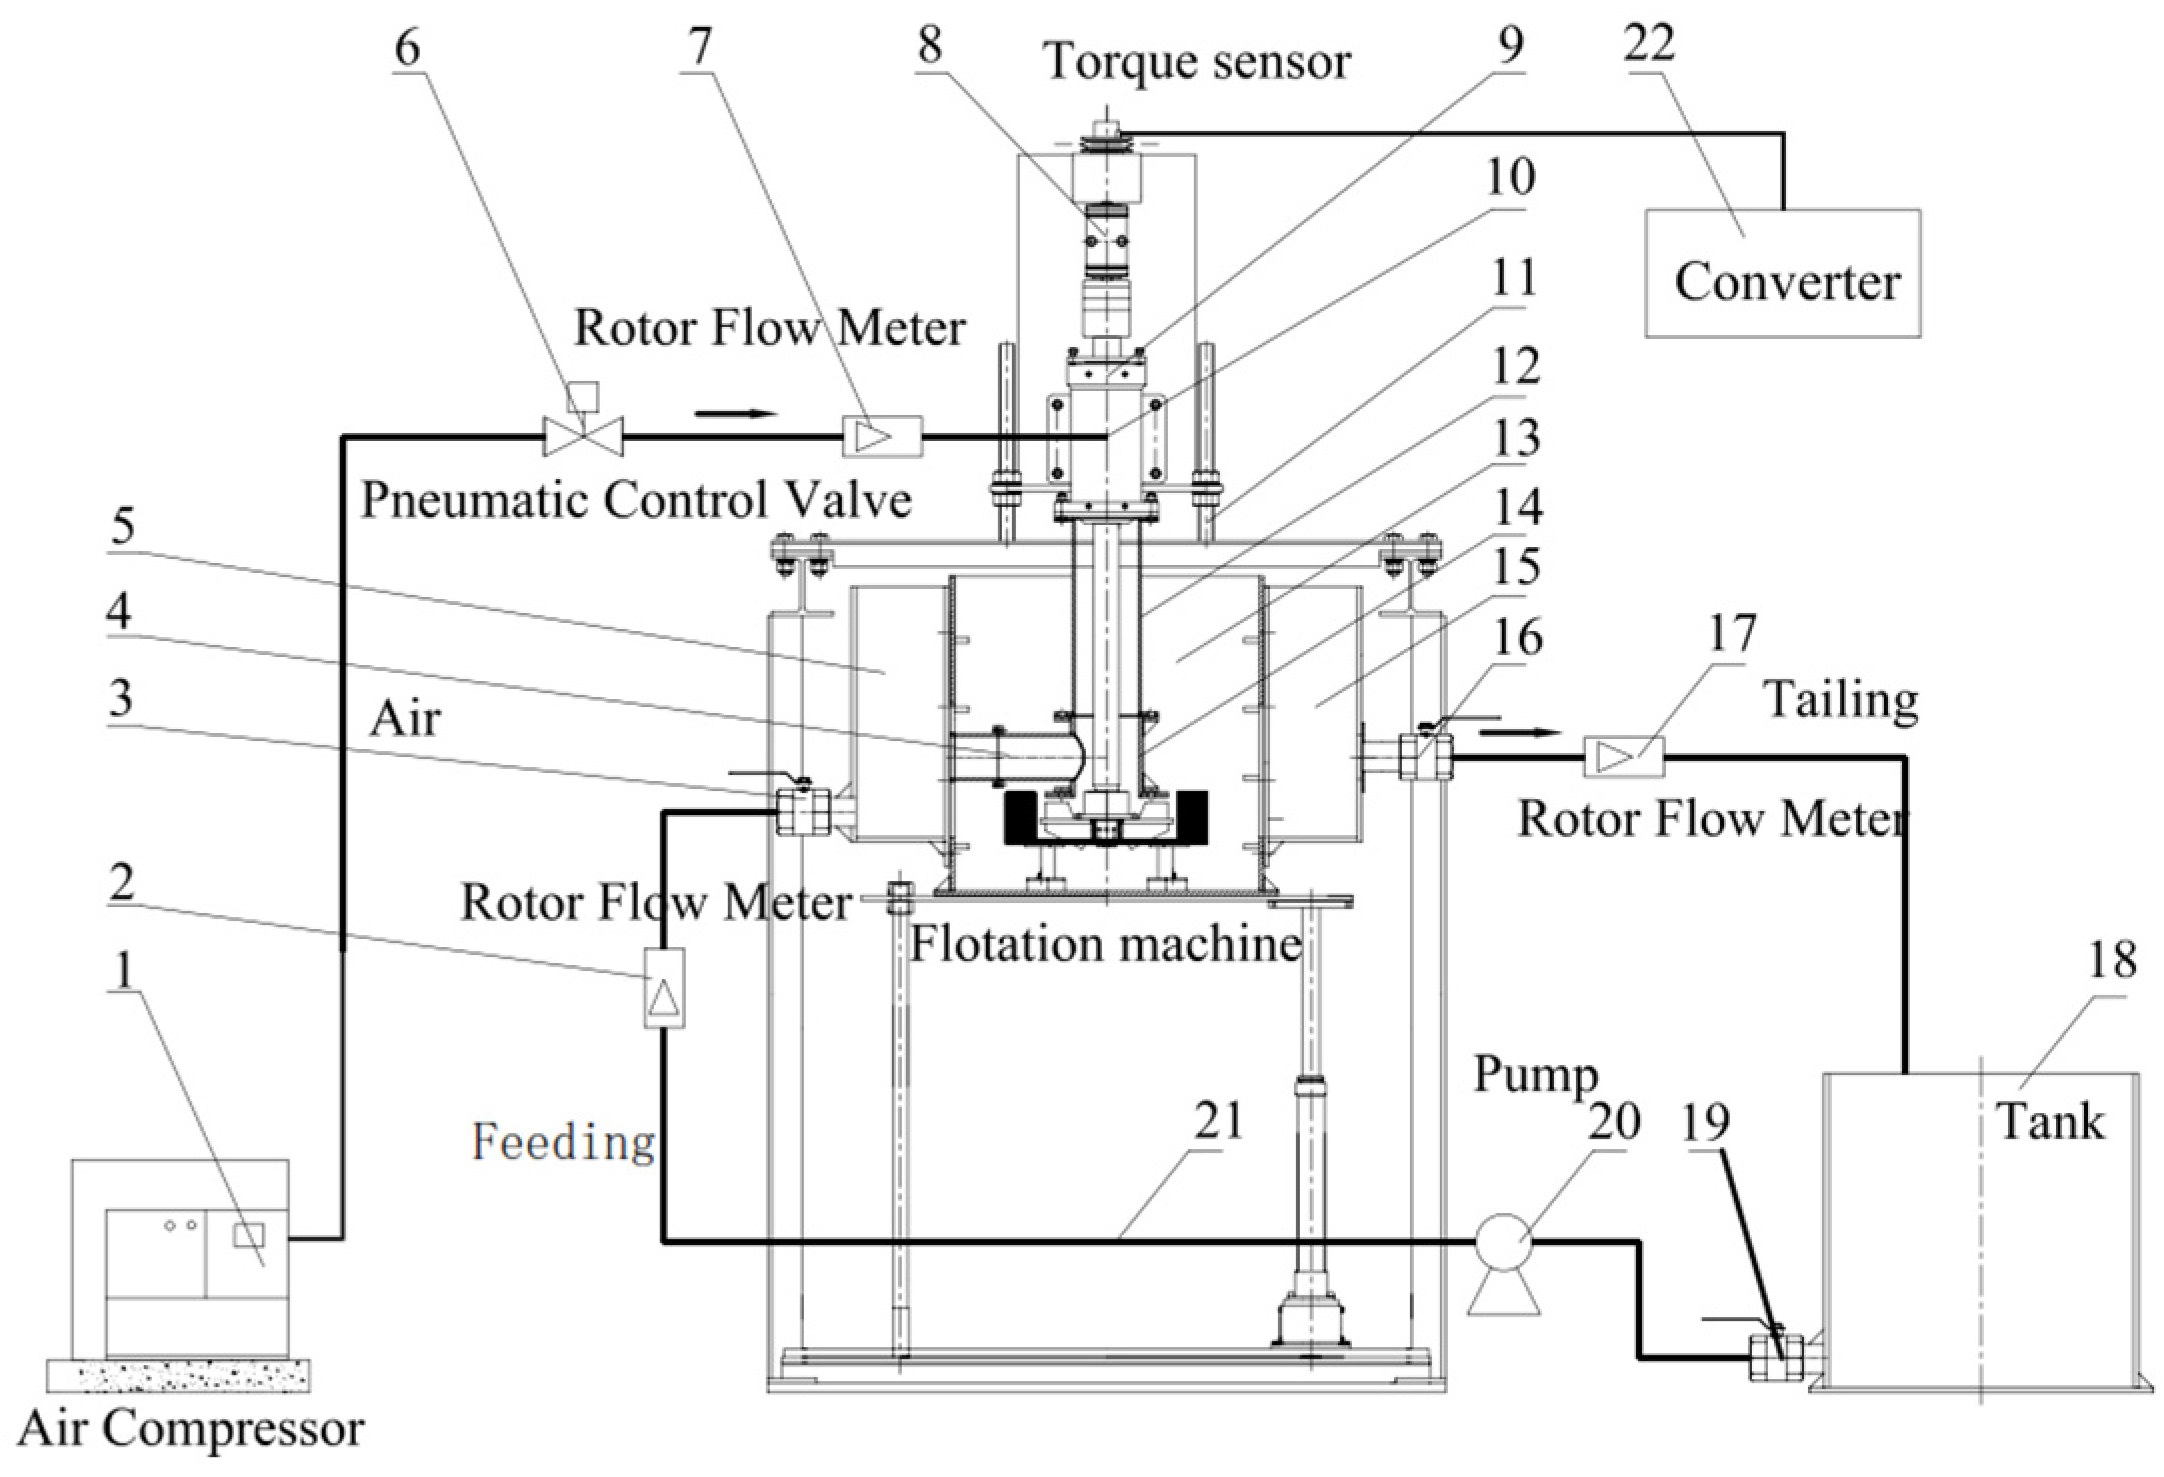
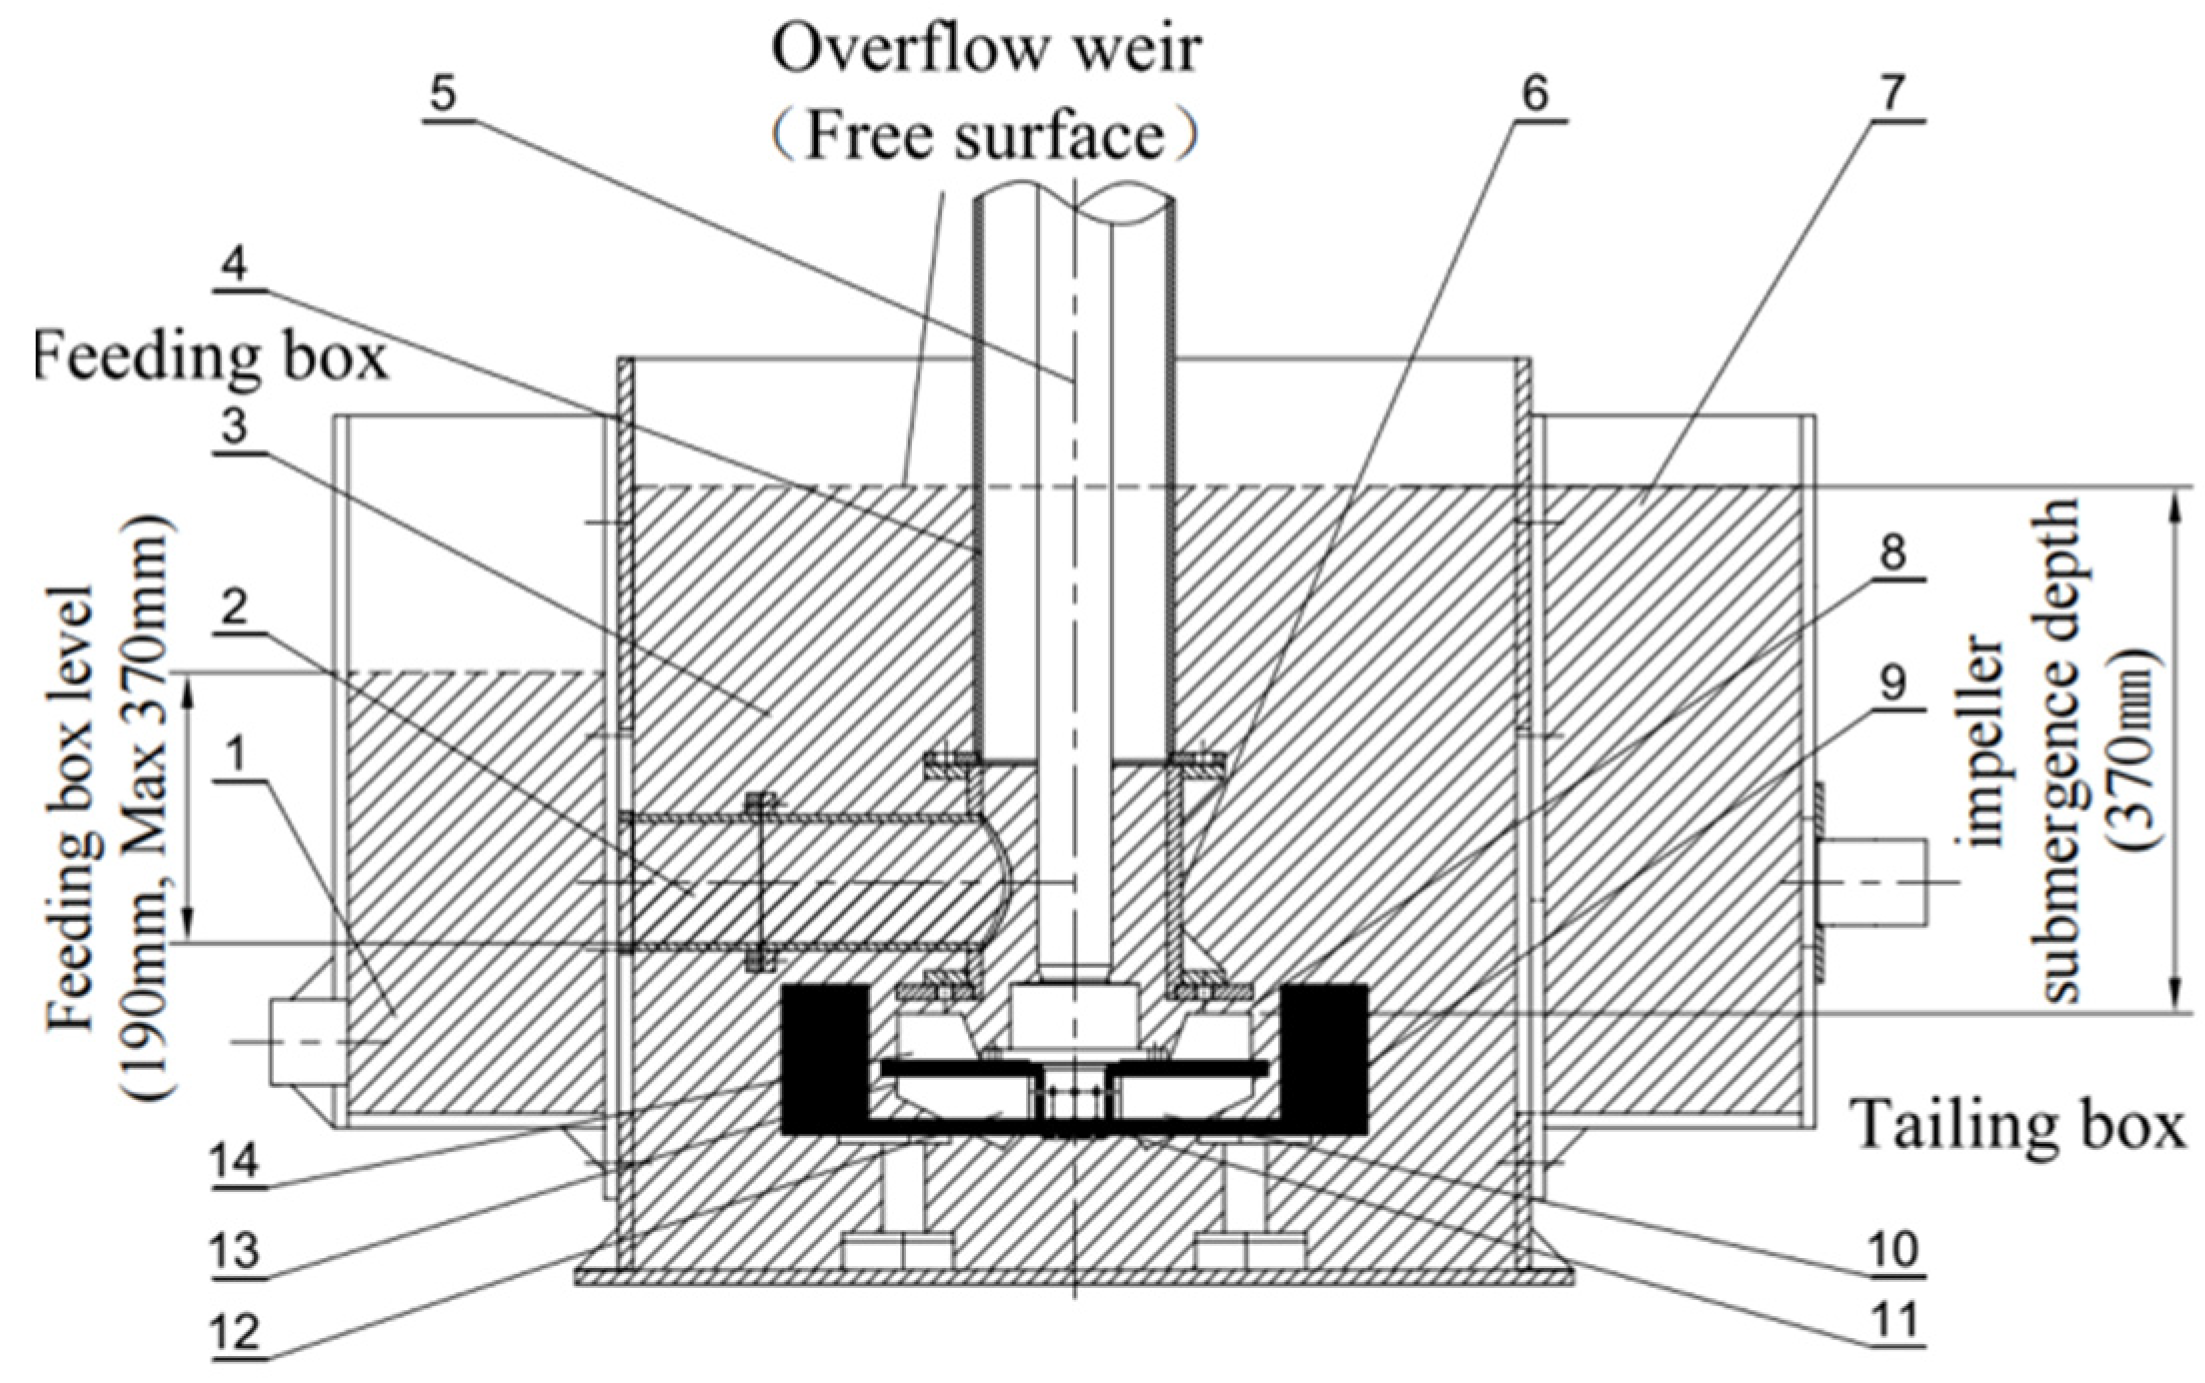
2.2.1. Experiment System of the Forced-Air Self-Aspirating Flotation Machine

Forced-air self-aspirating flotation machines were investigated, from a 200 L laboratory flotation machine to a 160 m3 industrial flotation machine. The self-designed 200 L forced-air self-aspirating flotation machine system is shown in Figure 2. The test system consists of an experimental 200 L flotation machine, feeding box, tailing box, gas supply system, test instrumentation, and auxiliary equipment. The 200 L forced-air self-aspirating flotation machine comprises a motor, hollow shaft, impeller, stator, cover plate, center cylinder, connecting tube, feeding pipe, and tank (shown in Figure 3). The square tank body is constructed from 12 mm thick plexiglass for flow visualization. The impeller–stator system consists of a center cylinder, cover plate, stator, impeller, and air distributor. The main parameters of the 200 L experimental unit are detailed in Table 1.
The flotation machine’s speed is controlled using a frequency converter that is manufactured by Asea Brown Boveri (ABB). The air superficial velocity is regulated through a ball valve and quantified using a glass-tube rotor flowmeter. Shaft torque measurements are acquired via a torque sensor. During suction capacity testing, water transport is controlled by a calibrated ball valve and measured with a turbine electromagnetic flowmeter. Critical operational parameters and measurement accuracies are documented in Table 2.

2.2.2. Industrial Experiment System of the Forced-Air Self-Aspirating Flotation Machine

An industrial test system was established based on the largest forced-air self-aspirating flotation machine currently used in engineering applications, with a tank volume of 50 m3. This experiment system was set up at a titanium magnetite concentrator owned by the Baowu Group; it enables both hydrodynamic studies and flotation separation studies for titanium magnetite. The system mainly consists of a feeding box, a flotation machine, and a tailing box. The main parameters of the experiment system are listed in Table 3. To facilitate condition testing, the flotation machine is equipped with a variable frequency motor, with an installed power of 132 kW. The motor speed can be adjusted using a SINAMICS G120X frequency converter, manufactured by Siemens, Nanjing, China, which also measures the power consumption of the flotation machine.
The principle of slurry suction capacity testing is illustrated in Figure 4. The water from the concentrator flows into the feeding box and is drawn into the flotation machine through the feeding pipe via self-suction and then discharged from the tailing box. A control cone valve is installed on the tailing box, and by adjusting its opening, the liquid level inside the flotation machine is kept stable, ensuring a balance between inflow and outflow. An EMF8301-(300) electromagnetic flowmeter manufactured by Beijing Gallop High & new Tech. Co., Ltd., Beijing, China, is installed on the feeding pipeline to measure the water flow rate. When the liquid levels in the feeding box and flotation machine remain stable, the measurement results from the flowmeter directly reflect the slurry suction capacity of the forced-air self-aspirating flotation machine under the given operating conditions.
This industrial experiment system enables evaluation of the slurry suction capacity and power consumption of the flotation machine under different operational and structural parameters and verifies the feasibility of the developed large-scale forced-air self-aspirating flotation machine design.

3. Scale-Up Challenges for Forced-Air Self-Aspirating Flotation Machines

3.1. Influencing Factors of Pulp Suction Capacity and Power Consumption in Flotation Machines

The pulp suction capacity of a forced-air self-aspirating flotation machine constitutes a critical scaling parameter requiring systematic investigation. Understanding the key factors that influence pulp suction capacity is essential for analyzing hydrodynamic performance and optimizing scale-up strategies. Investigating the impact of key operating parameters on both the pulp suction capacity and power consumption is crucial. Two primary operating parameters that influence the pulp suction capacity are the impeller speed and air superficial velocity. Engineering practice typically monitors feeding/middling box liquid levels relative to the suction pipe base as an operational indicator of whether the pulp suction capacity is sufficient. Therefore, the distance between the liquid surface in the feeding box and the bottom of the feeding pipe, commonly referred to as the feeding box level, serves as an important parameter. Additionally, another potential influencing factor is the impeller submerged depth, which is defined as the distance between the upper blade surface of the impeller and the overflow weir. This parameter may significantly impact pulp suction performance and overall flotation efficiency (Figure 3).

3.2. Scale-Up Limitations in Forced-Air Self-Aspirating Flotation Machines

Figure 5 illustrates the variation in torque and pulp suction with increasing air superficial velocity at different feeding box levels, measured at a design speed of 330 rpm. The test results show that power consumption decreases as air superficial velocity increases, regardless of the feeding box level. This decline follows a similar trend across all cases, with an average torque reduction of 30% when increasing the air superficial velocity from 0 cm/s to 2.0 cm/s. Concurrently, the pulp suction capacity demonstrates progressive decline with elevated air superficial velocities, averaging a 20% reduction under identical feeding box conditions. This indicates that while the air superficial velocity has a significant impact on power consumption, its effect on pulp suction is relatively weaker than that of power consumption. These findings highlight the complexities involved in scaling up forced-air self-pumping flotation machines, particularly in balancing energy efficiency with pulp suction performance.
Figure 6 illustrates the torque and pulp suction capacity variations versus impeller submergence depth at different air superficial velocities (constant 330 rpm impeller design speed). Both parameters exhibit inverse proportionality to air superficial velocity across all submergence depths from 220 mm to 370 mm. For a constant impeller submergence depth, both the pulp suction capacity and torque decrease as the air superficial velocity increases. Without aeration, as the impeller submergence depth increases from 220 mm to 370 mm, the pulp suction capacity drops significantly, by nearly 100 L/min (18%), while the torque shows a slight increase. At an air superficial velocity of 1.67 cm/s, the pulp suction capacity decreases by 88 L/min (20%) as the impeller submergence depth increases from 220 mm to 370 mm, and similarly, the torque exhibits a small increasing trend. A significant decrease in pulp suction capacity suggests a reduction in flotation machine load, which would typically lead to lower torque. However, in reality, the torque increases, indicating a rise in pulp suction resistance. As flotation machines scale-up using conventional structures, shown in Figure 1, the impeller submergence depth inevitably increases, leading to a reduction in pulp suction capacity and an increase in power consumption. This increased resistance is a core reason why scaling up forced-air self-aspirating flotation machines is challenging.
Therefore, as flotation machines are scaled up, the overflow weir (or free-liquid surface) of these machines becomes increasingly distant from the impeller. This results in greater resistance for self-absorbing pulp, making it more challenging for the upper blades to create the negative pressure gradient necessary for pulp absorption. Consequently, there may be a requirement to enhance the impeller speed, diameter, and area of the upper blades to meet the suction capacity requirements. However, increasing the mixing intensity of the upper blades to accommodate higher pulp suction capacities leads to a corresponding amplification in the design of the lower blades. With the same speed for the lower blades, their mixing intensity also significantly increases. In reality, the upper blades serve dual functions such as suctioning and mixing pulp. This can lead to an excessive mixing intensity of the dual upper blades and lower blades. As a result, after scaling up, the impeller–stator system of conventional forced-air self-aspirating flotation machines cannot generate a three-phase flow environment conducive to mineral separation. Furthermore, when the conventional forced-air self-aspirating flotation machine is scaled up to 50 m3, the power consumption has increased sharply, far exceeding that of conventional air-forced flotation machines. In addition, the economic benefit has also deteriorated significantly.
The impeller speed, air superficial velocity, feeding box level, and impeller submerged depth are the critical parameters that have a significant effect on the pulp suction capacity and power consumption. As the impeller submergence depth increases, the pulp suction capacity decreases sharply, while the power consumption tends to rise. This is the main limitation in scaling up forced-air self-aspirating flotation machines.

4. Scale-Up Design Method of Large-Scale Forced-Air Self-Aspirating Flotation Machines

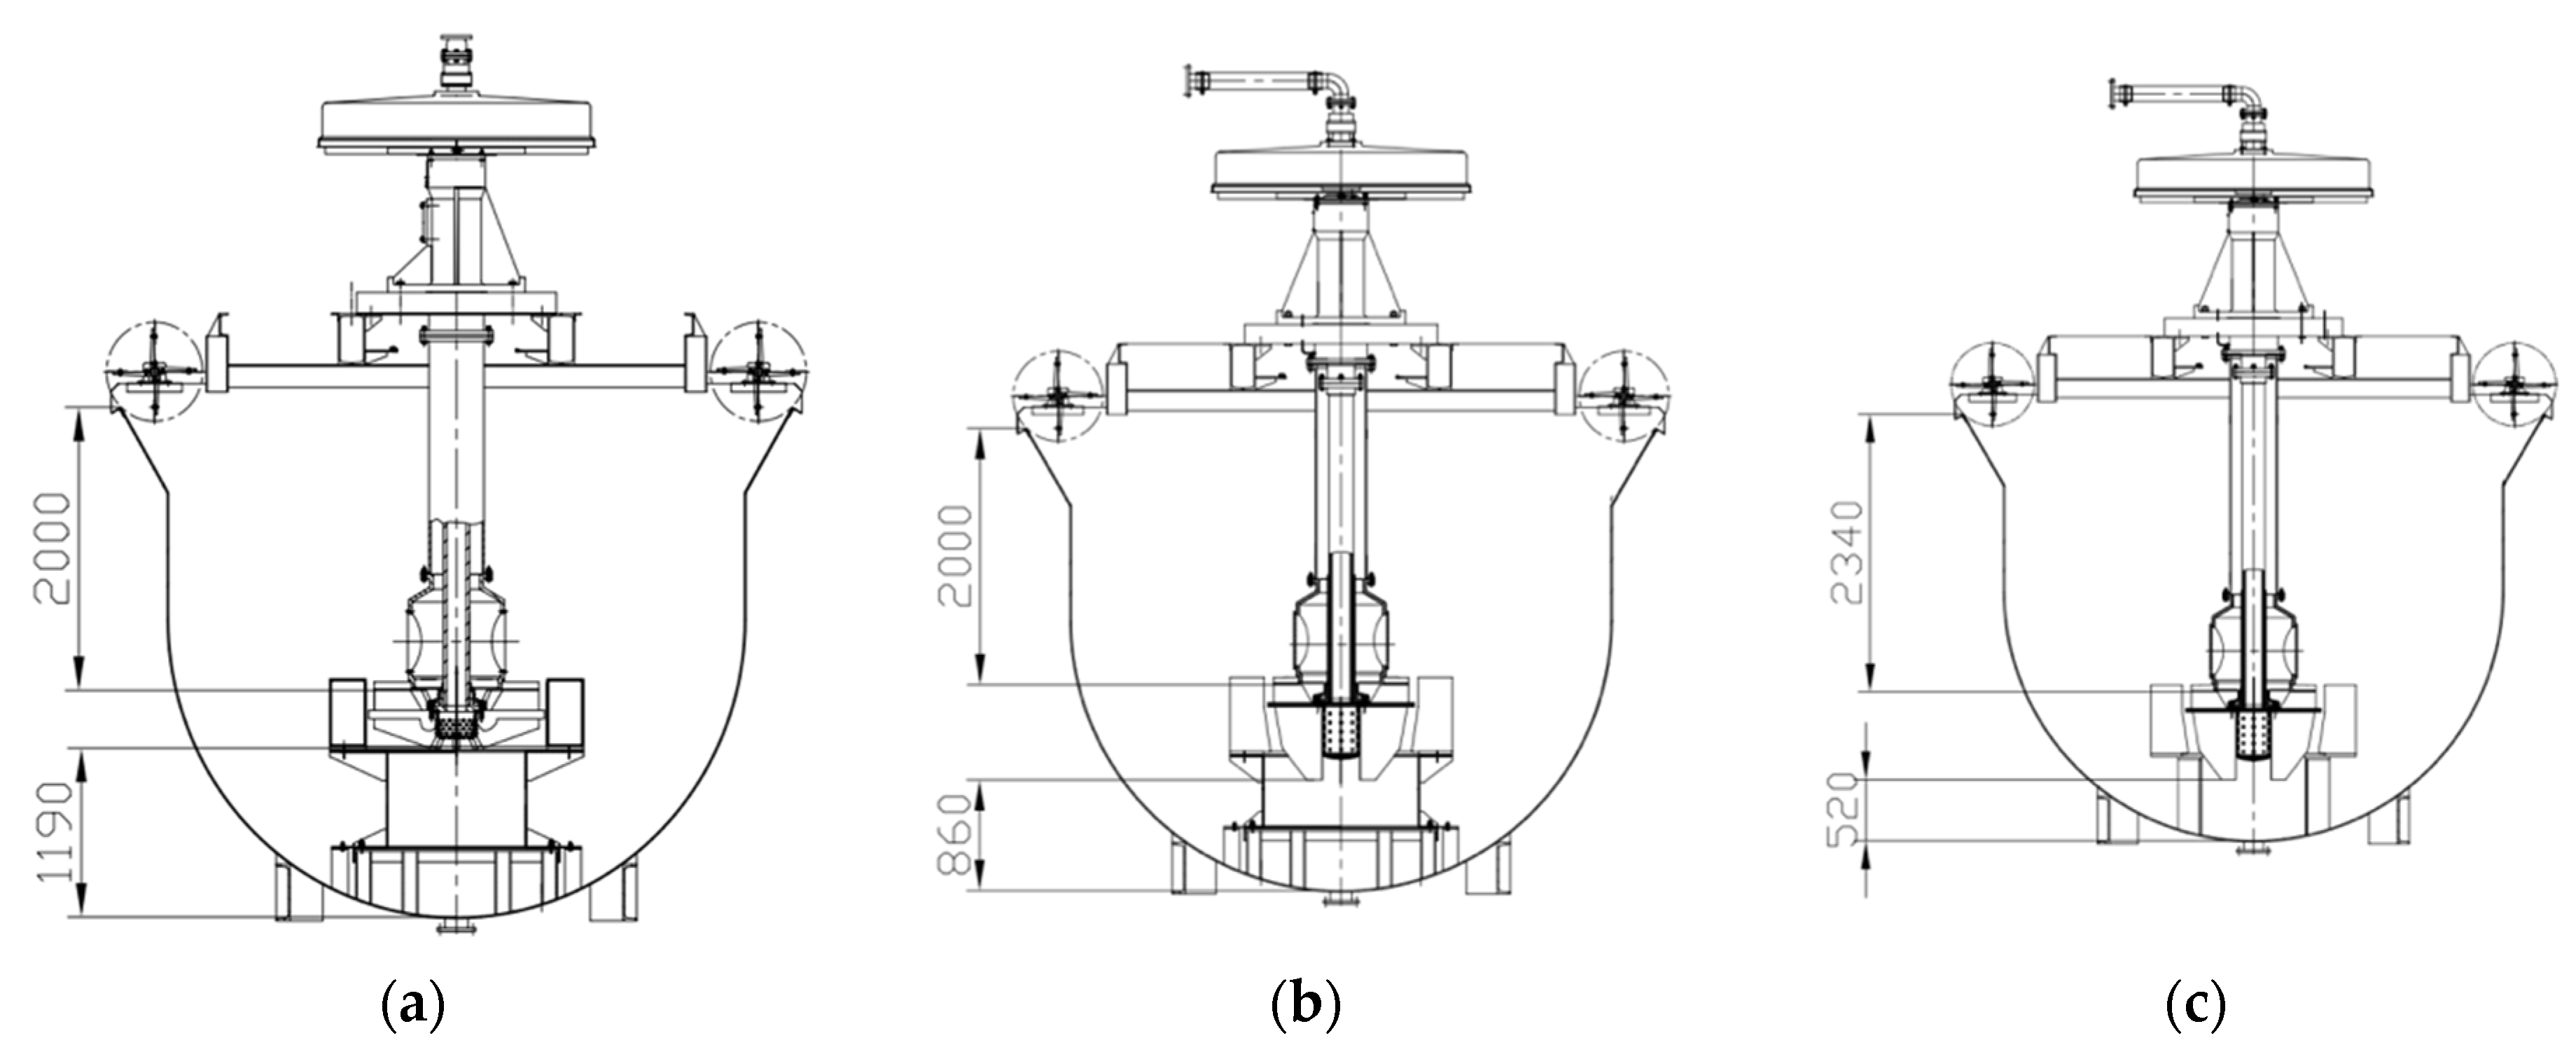
4.1. Large-Scale Design Program

Based on the previous analysis, conventional scale-up methodologies prove inadequate for large-scale forced-air self-aspirating flotation machines under traditional design frameworks. The limitations of the traditional design necessitate an alternative approach. Drawing from both the enlargement theory and practical experience with air-forced flotation machines, this study presents an innovative design for large-scale forced-air self-aspirating flotation machines. The key improvement is the placement of the impeller–stator system in the middle of the tank, as illustrated in Figure 7. Enlarging the flotation machine based on the traditional bottom position of the impeller–stator system, shown in Figure 1, would lead to a fast increase in the impeller submergence depth with scaling up. This makes it difficult to produce larger negative pressure, which is the driving force in pump feeding or middling when the impeller submergence depth is large. Therefore, to meet the suction requirements, the power consumption of the flotation machine would increase drastically with scaling up based on the original design. However, by positioning the impeller–stator system centrally, the issue of the impeller moving farther from the overflow weir during scale-up is eliminated and the pulp suction resistance does not increase drastically as the equipment size grows. Therefore, this new design offers a more efficient and scalable solution for large-scale flotation machines, addressing the core challenges of conventional scale-up methods, including the issue of increased energy consumption.
Another critical challenge in the enlargement of flotation machines is the rapid increase in overall power consumption. As the machine size increases, power demand grows at an accelerated rate, posing significant efficiency concerns. Since the impeller is the core component, it directly impacts the machine’s power consumption. In the conventional impeller design and scale-up process, the impeller is treated as a single unit, meaning that both the upper and lower blades are linked during enlargement. This linkage can lead to uncontrolled increases in mixing intensity and power consumption, making the scale-up process inefficient. To achieve more energy-efficient large-scale flotation machines, a revised approach to impeller design and scaling up is necessary.
In engineering practice, the pulp suction volume is dictated by the flotation circuits and does not increase proportionally with the size of the flotation machine. For instance, a 160 m3 flotation machine does not necessarily process two to three times more ore than a 50 m3 flotation machine in a flotation circuit. This discrepancy highlights the inefficiency of conventional impeller scaling methods, where both the upper and lower blades are enlarged together. Therefore, it is suggested that the upper blades should be designed specifically based on the required pulp suction capacity, rather than being scaled up arbitrarily. The lower blades are responsible for pulp circulation and mineral separation and should be matched to the flotation volume. Since conventional air-forced flotation machines have demonstrated excellent separation performance, their impeller blade design could be adopted for the lower blades of forced-air self-aspirating flotation machines. This study further presents an independent design for the upper blades optimized for pulp suction capacity and the lower blades optimized for pulp circulation and separation. By independently designing these components, the impeller can be better matched to pulp circulation capacity, pulp suction capacity, separation efficiency, and power consumption. This approach aims to resolve the higher power consumption and poor separation performance issues that currently hinder the scaling up of large forced-air self-aspirating flotation machines.

4.2. Verification of the Design Scheme

To verify the feasibility and correctness of the developed design scheme for a large forced-air self-aspirating flotation machine, an industrial experiment system was established based on the 50 m3 forced-air self-aspirating flotation machine. The industrial experiment system was designed to comparatively analyze three flotation machine designs, as illustrated in Figure 8. Scheme I adopted a middle-mounted impeller design with an impeller–stator system identical to that of the original 50 m3 forced-air self-aspirating flotation machine. Scheme II also employed a middle-mounted impeller design, but the lower impeller blades were designed according to the impeller dimensions of a conventional 50 m3 air-forced flotation machine. Scheme III utilized a bottom-mounted impeller design (the original configuration of the forced-air self-aspirating flotation machine) but incorporated a new impeller structure. The key design parameters of the three schemes are summarized in Table 4.
Figure 9 presents a comparison of the power consumption and pulp suction capacity among the three design schemes at different rotational speeds. For all impeller designs, both the pulp suction capacity and power consumption increase with increasing speed, showing consistent trends across the three configurations. Among them, the conventional impeller with a middle placement design exhibits the highest pulp suction capacity and power consumption at all tested speeds, followed by the new impeller with a middle placement design, while the new impeller with a bottom placement design shows the lowest values. These experimental results indicate that the conventional impeller design has significantly higher energy consumption.
Figure 10 further analyzes the differences in unit pulp suction power consumption among the three impeller design schemes. The conventional impeller with the middle placement design exhibits consistently higher unit power consumption than both new impeller designs. Moreover, its unit suction power consumption increases noticeably with rising rotational speed, indicating a significant decline in suction efficiency at higher speeds. In contrast, both the middle placement and bottom placement designs show relatively stable unit pulp suction power consumption in the new impeller across different speeds, maintaining values in the range of 0.5–0.8 kW/m3. While the overall pulp suction capacity of the new impeller with the middle placement design is comparable to that of the conventional design, it achieves this with lower energy consumption. Although the new impeller with the bottom placement design has the lowest unit power consumption, its total suction capacity is relatively limited. Therefore, from a comprehensive performance perspective, the new impeller with the middle placement design demonstrates the best overall performance.
Figure 11 presents the pulp suction capacity of the three impeller design schemes at the standard rotational speed of 137 rpm with variation in the air superficial velocity. Under varying aeration conditions, the conventional impeller with the middle placement design consistently exhibits the highest pulp suction capacity and power consumption, followed by the new impeller with the middle placement design, with the new impeller with the bottom placement design showing the lowest values for both pulp suction capacity and power consumption. This trend is consistent with the results under non-aerated conditions. The pulp suction capacity and power consumption of the new impeller with the bottom placement design decreases rapidly with increasing aeration, with its maximum capacity reaching only about half that of the other two impeller designs. Figure 12 presents the power consumption and pulp suction capacity of the three impeller design schemes at an air superficial velocity of 2.0 cm/s under varying rotational speeds. As the speed increases, both the pulp suction capacity and power consumption increase for all three designs. Under this relatively high air superficial velocity, the conventional impeller with the middle placement design maintains good pulp suction performance, with only a slight decrease. However, its power consumption remains significantly higher than that of the other two impeller designs. This indicates that the impeller with the bottom placement design is not conducive to improving pulp suction capacity. When the impeller immersion depth is relatively large, the suction resistance increases, making it difficult to enhance slurry suction performance.
The separation performance is the most important method for analyzing and evaluating flotation machines. Industrial flotation experiments were carried out using a titanium magnetite concentrator owned by the Baowu Group, where the 50 m3 forced-air self-aspirating flotation machine was applied as the roughing fast-flotation stage in the process. All three impeller design schemes were tested under identical conditions: a rotational speed of 137 rpm, an air superficial velocity of 0.67 cm/s, and a froth layer thickness of 250 mm. The flotation machine was fed with raw titanium magnetite ore. The concentrate froth flowed via gravity into the original cleaning stage of the plant’s flotation circuit, while the tailings entered the original roughing system.
Table 5 presents the average separation index for the three impeller design schemes. All three impeller designs achieved relatively good separation performance. Among them, the new impeller with the middle placement design achieved the highest recovery rate, outperforming the conventional impeller with the middle placement design by 5.67 percentage points. This improvement was mainly due to a 1.45 percentage point reduction in the tailings grade, while the concentrate grades remained nearly the same.
A comprehensive comparison indicates that the new impeller with the middle placement design demonstrates superior separation performance in terms of concentrate grade, tailings grade, and recovery. The design also shows the best hydrodynamic performance, with a favorable balance between pulp suction capacity and power consumption. The industrial trial results confirm that the developed new impeller with the middle placement design significantly reduces power consumption and enhances separation performance, making it a viable design solution for large-scale forced-air self-aspirating flotation machines.

4.3. Design and Scale-Up Method of the Forced-Air Self-Aspirating Flotation Machine

In the developed new impeller design scheme for large-scale forced-air self-aspirating flotation machines, regardless of how the impeller is optimized, the impeller speed remains constant since the upper and lower blades are connected to the same shaft. Therefore, establishing the relationship between impeller speed (N) and flotation volume (V) is a priority in the design process. Since the design of the impeller and the speed of conventional air-forced flotation machines have been extensively validated in engineering practice, the lower blades and speed of the new forced-air self-aspirating flotation machine can be adapted from the impeller design of conventional air-forced flotation machines. It has been found that the relationship between speed (N) and volume (V) in conventional air-forced flotation machines follows a power-law exponential relationship, as illustrated in Figure 13 [5]. The mathematical expression of this relationship for forced-air self-aspirating flotation machines serves as a foundation for determining the appropriate impeller speed during scaling up and is provided in Equation (1) as follows:
  N = 248 V 0.16
where N denotes the speed in r/min, and V denotes the volume in m3.
The key design parameters governing the upper-blade configuration encompass blade width, inlet diameter, outlet diameter, and speed for large-scale forced-air self-aspirating flotation machines. Drawing from centrifugal pump design principles, the diameter of the impeller is related to speed (N), flow rate (Q), head (H), and correction factors, expressed as in Equations (2)–(7) [48]. These relationships provide a theoretical basis for optimizing the upper-blade geometry to ensure efficient pulp suction and circulation while maintaining energy efficiency. Equations (2)–(7) are as follows:
D 0 = K 0 Q N 3
D 2 = κ D Q N 3
K D = 9.35 k κ D 2 n s 100 1 / 2
n s = 3.65 N Q H 3 / 4
b 2 = κ b Q N 3
K b = 0.64 k κ b 2 n s 100 5 / 6
where Q is the feed flow rate in m3/s; H is the pump range in m; ns is the specific speed; D0 is the inlet impeller diameter in m; D2 is the outlet impeller diameter in m; b2 is the impeller outlet width in mm; K0 is the inlet diameter correction factor, which mainly considers the efficiency (the value is generally 3.5–4.5); KD and KD2 are the outlet impeller diameter correction factors; and Kb and Kb2 are the impeller width correction factors.
By substituting Equation (1) into Equation (2), the relationship is further developed, leading to Equation (8), which defines the design method for the inlet diameter of blades in forced-air self-aspirating flotation machines.
D 0 = 0.16 K 0 Q 1 / 3 V 4 / 75
By substituting Equations (1), (4) and (5) into Equation (3), the relationship is further developed, resulting in Equation (9), which defines the design method for the outlet diameter of the blades in forced-air self-aspirating flotation machines.
D 2 = 0.49 K D 2 Q 1 / 12 V 2 / 15 H 3 / 8
By substituting Equations (1), (5) and (7) into Equation (6), Equation (10), for the design method for the blade width in forced-air self-aspirating flotation machines, can be derived.
b 2 = 0.64 K b 2 Q 3 / 4 V 2 / 25 H 15 / 24
The outlet diameter correction factor KD2 and the blade width correction factor Kb2 are mainly related to the specific speed, as shown in Table 6 [48].
This study focuses on a 160 m3 industrial-scale forced-air self-aspirating flotation machine designed for high-capacity mineral processing circuits. With a target feeding flow rate of 10–12 m3/min for the flotation circuit, the machine’s suction capacity was engineered to 24 m3/min under non-aerated water conditions, incorporating an engineering safety margin to accommodate operational variability and ore heterogeneity. Using the scale-up design method, the impeller design parameters are listed in Table 7, while the key structural parameters of the 160 m3 flotation machine are provided in Table 8.
In this study, a new design for large-scale forced-air self-aspirating flotation machines is developed, featuring an impeller–stator system positioned in the middle of the tank. The new design eliminates the issue of the impeller moving farther from the overflow weir and prevents increased pulp suction resistance during scale-up. An industrial experiment system based on a 50 m3 forced-air self-aspirating flotation machine was established to verify the new impeller, with the middle placement design achieving the most favorable overall performance. Then, a scale-up design method and scale-up equations for large-scale forced-air self-aspirating flotation machines and new impellers were developed.

5. The Hydrodynamic Performance of Large-Scale Forced-Air Self-Aspirating Flotation Machines

The developed scale-up methodology enables the engineering design of large-scale forced-air self-aspirating flotation machines. However, critical validation is required to confirm whether hydrodynamic flow characteristics and key parameters including pulp suction capacity, power consumption, and circulation capacity align with industrial requirements. It is necessary to evaluate the impeller’s ability to maintain proper pulp circulation and air dispersion. Verifying these parameters is essential to determine whether the enlargement and design methods are correct and reliable for the new large-scale forced-air self-aspirating flotation machine.

5.1. Models

The main parameters and operating conditions of the 160 m3 forced-air self-aspirating flotation machine are presented in Figure 7 and Table 8. In CFD simulations, conventional air-forced flotation machines are typically studied using a closed-system approach. However, due to the self-absorbing nature of forced-air self-aspirating flotation machines, the CFD simulation must adopt a dynamic pulp flow system. This requires including the feeding box and tailing box in the model to accurately represent the real operating conditions of the flotation machine.
The grid model is based on the split-grid method. The computational domain employs a partitioned mesh strategy comprising three subdomains: the impeller dynamic domain, feeding box and center cylinder static domain, and tank body static domain including a stator and tailing box. As illustrated in Figure 14, the multi-reference frame (MRF) method governs impeller rotation, with general grid interface (GGI) connections managing dynamic–static zone interaction. This simulation approach ensures a realistic representation of the flotation machine’s hydrodynamic behavior, enabling accurate analysis of pulp flow, air dispersion, and suction performance. The mesh configuration utilizes 9.88 million tetrahedral cells with localized refinement in critical regions, achieving a minimum mesh quality ≥0.3. A mesh independence validation is shown in Table 9 and Figure 15. The results showed that when the number of mesh elements reached 9.88 million, the mesh sensitivity dropped below 5% to approximately 3%, indicating a reasonable balance between computational cost and simulation accuracy.
Boundary conditions play a critical role in ensuring the accuracy and reliability of CFD simulation studies, particularly for forced-air self-aspirating flotation machines. The following boundary conditions are applied. The feeding box inlet is defined as a velocity inlet and ensures controlled flow into the system. The top of the feeding box is set as an opening boundary and allows only gas exchange (inlet and outlet). The free surface of the flotation machine is modeled as an opening boundary that permits gas entry only. The top of the center cylinder is also defined as an opening boundary, which allows both gas inflow and outflow. The tailing pipe outlet is designed based on the liquid level difference and the feeding flow rate is set as an outlet boundary to regulate the discharge flow. The water is set as the primary phase. The viscosity is 0.00089 Pa·s and the density is 997.0 kg/m3.
To enhance simulation convergence, an air layer region with a 300 mm thickness is established above the free-liquid level of the flotation machine. The air layer region with a thickness of 300 mm is based on a self-aerating flotation machine and engineering practice [12,49]. The initial water level for both the flotation machine and the feeding box is set at 4.8 m, where a hydrostatic pressure would be introduced below this level and there is the air above this level. The standard k-ε model is used for accurate turbulence representation. The Eulerian–Eulerian two-fluid model is adopted to simulate interactions between liquid and gas phases. The Schiller–Naumann trailing force model is mainly considered for the multiphase flow interphase force model. A high-precision steady-state algorithm is used for numerical calculations. Residual RMS curves are controlled at approximately 1 × 10⁻⁴ to ensure simulation stability and accuracy. Velocity and torque variations are monitored using customized parameters, serving as convergence criteria. Figure 16 presents the torque variation over timesteps. In the final 2000 simulation timesteps, the difference between the maximum and minimum torque values was less than 5%. The average torque was 12,974 Nm, with a standard deviation of only 127.7 Nm, resulting in a standard deviation-to-mean value ratio of approximately 1%. This simulation approach ensures accurate modeling of hydrodynamic behavior, optimizing predictions for pulp flow, air dispersion, and impeller performance.

5.2. Hydrodynamic Performance of the Forced-Air Self-Aspirating Flotation Machine

5.2.1. Suction Process of the Large-Scale Forced-Air Self-Aspirating Flotation Machine

After scaling up, the ability of the flotation machine to self-absorb sufficient pulp is critical for achieving a horizontal configuration in large-scale flotation circuits. Figure 17 presents the liquid-level distribution of the flotation machine under varying feeding conditions, illustrating the phase holdup distribution of the air–liquid flow. In Figure 17a, due to the absence of an external feeding inlet, the flotation machine pumps water from the feeding box, causing the liquid level to decrease, while the air layer in the feeding box expands significantly. Eventually, the feeding box is sucked empty, and the liquid level drops below the feeding pipe, allowing air to enter the flotation machine through the feeding pipe. This phenomenon aligns with engineering observations, where the air is sometimes directly drawn in through the feeding or middling pipe. In Figure 17b, at a feeding rate of 9.6 m3/min, the liquid level in the feeding box remains slightly higher than the feed pipe inlet, and the feeding pipe operates in the full-flow condition, with a flow velocity of 1.64 m/s and a cross-sectional flow rate of 10.3 m3/min. The error in the feeding flow rate is less than 10%, suggesting that the system has reached the equilibrium point for pulp self-absorption at this condition. Figure 17c shows that as the feeding rate continues to increase, the liquid level in the feeding box also rises. When the feeding volume reaches 25.7 m3/min, the liquid level in the feeding box almost reaches its highest point, and the flow rate in the feeding pipe increases to 4.2 m/s, with a suction capacity of 26.4 m3/min. Under this condition, the increased liquid level in the feeding box contributes to suction, driven by both the flotation machine’s self-absorption and the pressure difference created by the feeding box liquid level. Since the feeding box level is near its maximum, this condition represents the maximum suction capacity of the flotation machine, aligning well with the designed suction capacity of 24 m3/min. The simulation results confirm that the flotation machine achieves stable self-absorption under proper feeding conditions, matching practical engineering observations and validating the designed suction capacity, ensuring efficient pulp handling and process stability in large-scale flotation circuits.
Table 10 further presents the power consumption of the upper and lower blades of the impeller, the pulp suction capacity, and the circulation capacity of the impeller under different feeding rate conditions. It is observed that as the feeding rate increases, the pulp suction capacity due to the upper blades also increases, leading to a continuous rise in power consumption associated with pulp suction. Meanwhile, the pulp circulation capacity remains relatively stable. Under non-aerated conditions, the flotation machine achieves a pulp circulation capacity exceeding 221 m3/min, which is more than 1.3 times the effective volume of the flotation machine, indicating strong stirring and mixing performance. The power consumption ratio between the upper and total impeller ranges from 10% to 20%, which is lower than that of conventional forced-air self-aspirating flotation machines, where the power consumption for pulp suction by the upper blades accounts for 25% to 35%. Furthermore, at an air superficial velocity of 1.67 cm/s (typically required for conventional sulfide ore separation), the power consumption for pulp suction due to the upper blades remains stable and unaffected, while the lower blades’ ability to circulate the pulp is reduced by approximately 25%. This observation is consistent with the relative decrease in circulation capacity and power consumption observed in conventional air-forced flotation machines under aerated conditions.

5.2.2. Flow Pattern of the Large-Scale Forced-Air Self-Aspirating Flotation Machine

The self-absorbing pulp function was successfully achieved in the large forced-air self-aspirating flotation machine predicted via simulation. However, it is essential to further clarify whether the flow-field environment necessary for mineral separation was effectively established. Figure 18 and Figure 19 illustrate the flow pattern, represented by velocity streamlines and velocity cloud diagrams at the X-Y section, under non-aerated conditions with a feeding rate of 9.8 m3/min. The pulp enters from the right feeding box, is pumped through the feeding pipe into the center cylinder area, and is then dispersed into the tank through the upper blades. Within the center cross-section (X-Y section) of the flotation machine, a typical upward and downward circulation flow field is observed. The lower circulation flow area is notably enhanced as a result of the elevated position of the impeller–stator system in the middle of the tank. The lower blades exhibit a strong pulp circulation capability, drawing pulp from the bottom of the flotation machine into the lower-blade region, where it is then thrown outward into the tank. On the left side, at the tailing box, the pulp is eventually discharged through the tailing outlet, completing the circulation process. This study confirms that the flotation machine establishes a stable and efficient flow field, which is essential for mineral separation, further validating the effectiveness of the new design scheme.
The hydrostatic pressure distribution across the center section (X-Y section) of the flotation machine is observed in most areas, as shown in Figure 20. The presence of low or negative pressure zones in the impeller, center cylinder, and feeding pipe areas further confirms that the flotation machine possesses pulp-absorbing capability. Figure 21 presents the static pressure distribution on the impeller blades at a feeding rate of 9.8 m3/min under non-aerated conditions. As the impeller rotates clockwise, both the upper and lower blades generate a large negative pressure zone on the back surface of the blade near the shaft, with the maximum negative pressure reaching −20 kPa. These pressure distributions validate the self-pumping mechanism of the flotation machine and its ability to maintain a stable pulp circulation process, further supporting the effectiveness of the new design approach.
The multiphase flow characteristics of the flotation machine, particularly gas–liquid dispersion, are key factors influencing flotation separation performance. Figure 22 presents the air holdup distribution at a feeding rate of 9.8 m3/min and an air superficial velocity of 1.67 cm/s, showing that air is uniformly dispersed in the center section (X-Y section). It can be observed that minimal gas enters the lower part of the tank. This is attributed to the gas entering through the hollow shaft and then dispersing upward after being expelled by the impeller.
The static pressure distribution of the impeller and gas accumulation in the impeller area under aeration is illustrated in Figure 23. After aerating, the negative static pressure generated by the impeller decreases, leading to a reduction in pulp suction capacity. This finding aligns with the decline in impeller circulation capacity after aeration, as shown in Table 10. The yellow areas in Figure 23 indicate gas accumulation zones, which are primarily concentrated around the impeller and near the shaft.
From the analysis of the volume occupied by the accumulated gas, it is observed that after aeration, the circulation volume and power consumption decrease by approximately 25%. This confirms that the forced-air self-aspirating flotation machine effectively controls gas dispersion, demonstrating excellent gas–liquid dispersion performance while preventing liquid flooding within the flotation machine.
In summary, the new design scheme and scale-up method for the forced-air self-aspirating flotation machine successfully enables the pulp suction function in large-scale flotation machines while significantly reducing the power consumption ratio of pulp suction to the total power consumption of the machine. This optimization has resulted in a well-balanced system, achieving an efficient relationship between pulp circulation capacity, pulp suction capacity, and overall power consumption, ensuring improved performance and energy efficiency in large-scale flotation processes. CFD simulations also predicted the hydrodynamic performance of the 160 m3 forced-air self-aspirating flotation machine, including pulp suction volume, circulation volume, and gas–liquid dispersion characteristics. After optimization of the CFD simulation, the large-scale flotation machine could be used to conduct industrial tests.

6. Dynamic Performance Testing and Validation of the Scale-Up Method

The CFD simulation study predicted the pulp suction capacity, circulation capacity, and gas–liquid dispersion characteristics of a large-scale forced-air self-aspirating flotation machine. The results demonstrate that the scale-up method is effective from a numerical simulation perspective. However, engineering practice remains the most direct and reliable standard for validating the scale-up approach. To further verify the methodology, a fluid dynamics study and metallurgical performance tests were conducted. The first 160 m3 forced-air self-aspirating flotation machine was developed for a 10,000 t/d copper–sulfur mining project in Guangdong province, China, aiming to improve the sulfur metallurgy index; In addition, it is the largest one of forced-air self-aspirating flotation machines. The system, including the feeding box and tailing box, is shown in Figure 24.
It can be observed in Figure 25 that when the flotation machine starts up and begins operation, the liquid in the feeding box is absorbed into the flotation machine, causing the liquid level in the feeding box to drop below the feeding pipe, whereas the liquid level is at the overflow weir height in the stationary state. This result aligns well with the simulation predictions in Figure 17a, verifying the accuracy of the simulation model.
Figure 26 presents a comparison of the power consumption between the CFD simulation predictions and the experimental measurements using a frequency inverter at different impeller speeds under non-aerated conditions. The simulation results closely match the industrial test data, with the predicted power consumption being slightly lower than the measured values. The average deviation is only 4%. In engineering applications, a deviation of less than 10% between simulation results and experimental measurements is generally considered acceptable and meets the requirements for engineering. This discrepancy is likely due to inverter-based power measurements, which directly capture the total operating power consumption of the motor and inverter, introducing a small deviation. The flotation machine is equipped with a 10-pole variable-frequency motor (220 kW), which inherently includes efficiency losses and a relatively low power factor (cosφ) of only 0.78. These factors contribute to a higher measured power. Additionally, it is challenging to use more precise instruments such as torque transducers for direct power consumption measurement in an industrial test. In contrast, the CFD simulation predicts the shaft power, which does not account for motor or inverter losses. This is the primary source of deviation between the CFD simulation and experimental measurements. While some computational error is inevitable in simulations, the close agreement between the simulation and experimental data demonstrates that the deviation is within an acceptable range and further validates the reliability and accuracy of the simulation method.
The power consumption of the scale-up flotation machine, that ranged from 123 kW to 136 kW, is comparable to or slightly higher than that of a 160 m3 air-forced flotation machine, indicating that the developed scale-up method successfully addresses the issue of high power consumption in large-scale forced-air self-aspirating flotation machines.
The power consumption and air dispersion of the flotation machine at different air superficial velocities are presented in Figure 27, with a constant speed of 110 rpm. The results show that as the air superficial velocity increases, the power consumption decreases, while the air dispersion tends to improve. As a key indicator of gas–liquid dispersion efficiency, the air dispersion degree is observed to be approximately 2, indicating a homogeneous gas–liquid mixture. This finding aligns well with the CFD simulation study (Figure 22), which predicted a good air dispersion effect, further validating the simulation’s accuracy in modeling the flotation machine’s hydrodynamic performance.
The sulfur flotation circuit of the concentrator features nine 100 m3 large-scale conventional air-forced flotation machines. Among them, two cells are used for cleaning and three for roughing and two-stage scavenging, with two flotation machines used in each stage. As the plant’s ore processing capacity increased from 7000 t/d to 10,000 t/d, a decline in separation performance indicators was observed. To address this issue, a 160 m3 forced-air self-aspirating flotation machine was added. In practice, the 160 m3 forced-air self-aspirating machine has been operated under two working conditions: sulfur flotation and zinc removal from sulfur concentrate.
In the first process condition, the forced-air self-aspirating flotation machine processes froth from sulfur scavenging 1 and scavenging 2 in the flotation circuit, achieving an average sulfur grade of 34.2% in the feed and 42.2% in the concentrate, with an operating recovery rate of up to 82.9%, as shown in Table 11. The variance is 1.07% and the standard deviation is 10.32%. In the other process condition, the forced-air self-aspirating flotation machine processes froth from sulfur concentrate in the flotation circuit to remove the Zn. The flotation machine reduced the impurity content of Zn in the concentrate from an average of 0.53% to 0.09%, achieving an average recovery of 82.4%, as shown in Table 12. The Zn grade in the concentrate remained below 0.1%, meeting the requirements for sulfur concentrate sales. The variance is 0.38% and the standard deviation is 6.19%. These results demonstrate excellent metallurgical performances.
The industrial test of the designed and developed large-scale forced-air self-aspirating flotation machine verifies the scale-up method and demonstrates excellent air dispersion and metallurgical performance. The results confirm that the machine successfully meets the requirements for a horizontal configuration in a large-scale flotation circuit, thus achieving the intended design objectives.

7. Conclusions

In this study, the key factors restricting the enlargement of forced-air self-aspirating flotation machines were identified. A design method and scale-up method were introduced, and the dynamic performances of the large-scale forced-air self-aspirating flotation machine were verified through CFD simulations and industrial tests, effectively solving the engineering and technical challenges associated with scale-up. This study establishes a foundation for promoting the horizontal configuration of large-scale flotation circuits. The main conclusions are summarized as follows:
(1)
Speed, air superficial velocity, feeding box level, and impeller submergence depth are the key factors influencing pulp suction capacity and power consumption. As the impeller submergence depth increases, the pulp suction capacity decreases, while the power consumption rises, indicating a significant increase in pulp suction resistance. Since the submergence depth inevitably increases with the scale-up of flotation machines using conventional designs, this becomes a core challenge in scaling up forced-air self-aspirating flotation machines.
(2)
An innovative design scheme for a large-scale forced-air self-aspirating flotation machine was developed, featuring an impeller–stator system positioned in the middle of the tank. By placing the impeller–stator system centrally, the issue of the impeller moving farther from the overflow weir during scale-up is eliminated, preventing a dramatic increase in pulp suction resistance as the equipment size increases.
(3)
The new impeller with the middle placement design demonstrates superior separation performance and a favorable balance between pulp suction capacity and power consumption. The industrial trial results confirm that the developed new impeller with the middle placement design significantly reduces power consumption and enhances separation performance, making it a viable design solution for large-scale forced-air self-aspirating flotation machines.
(4)
The independent designs of the pulp suction capacity of the upper blades and the pulp circulation capacity of the lower blades were further developed. This approach addresses the challenges of high power consumption and poor metallurgical performances in large-scale forced-air self-aspirating flotation machines, ensuring a more efficient and effective flotation process.
(5)
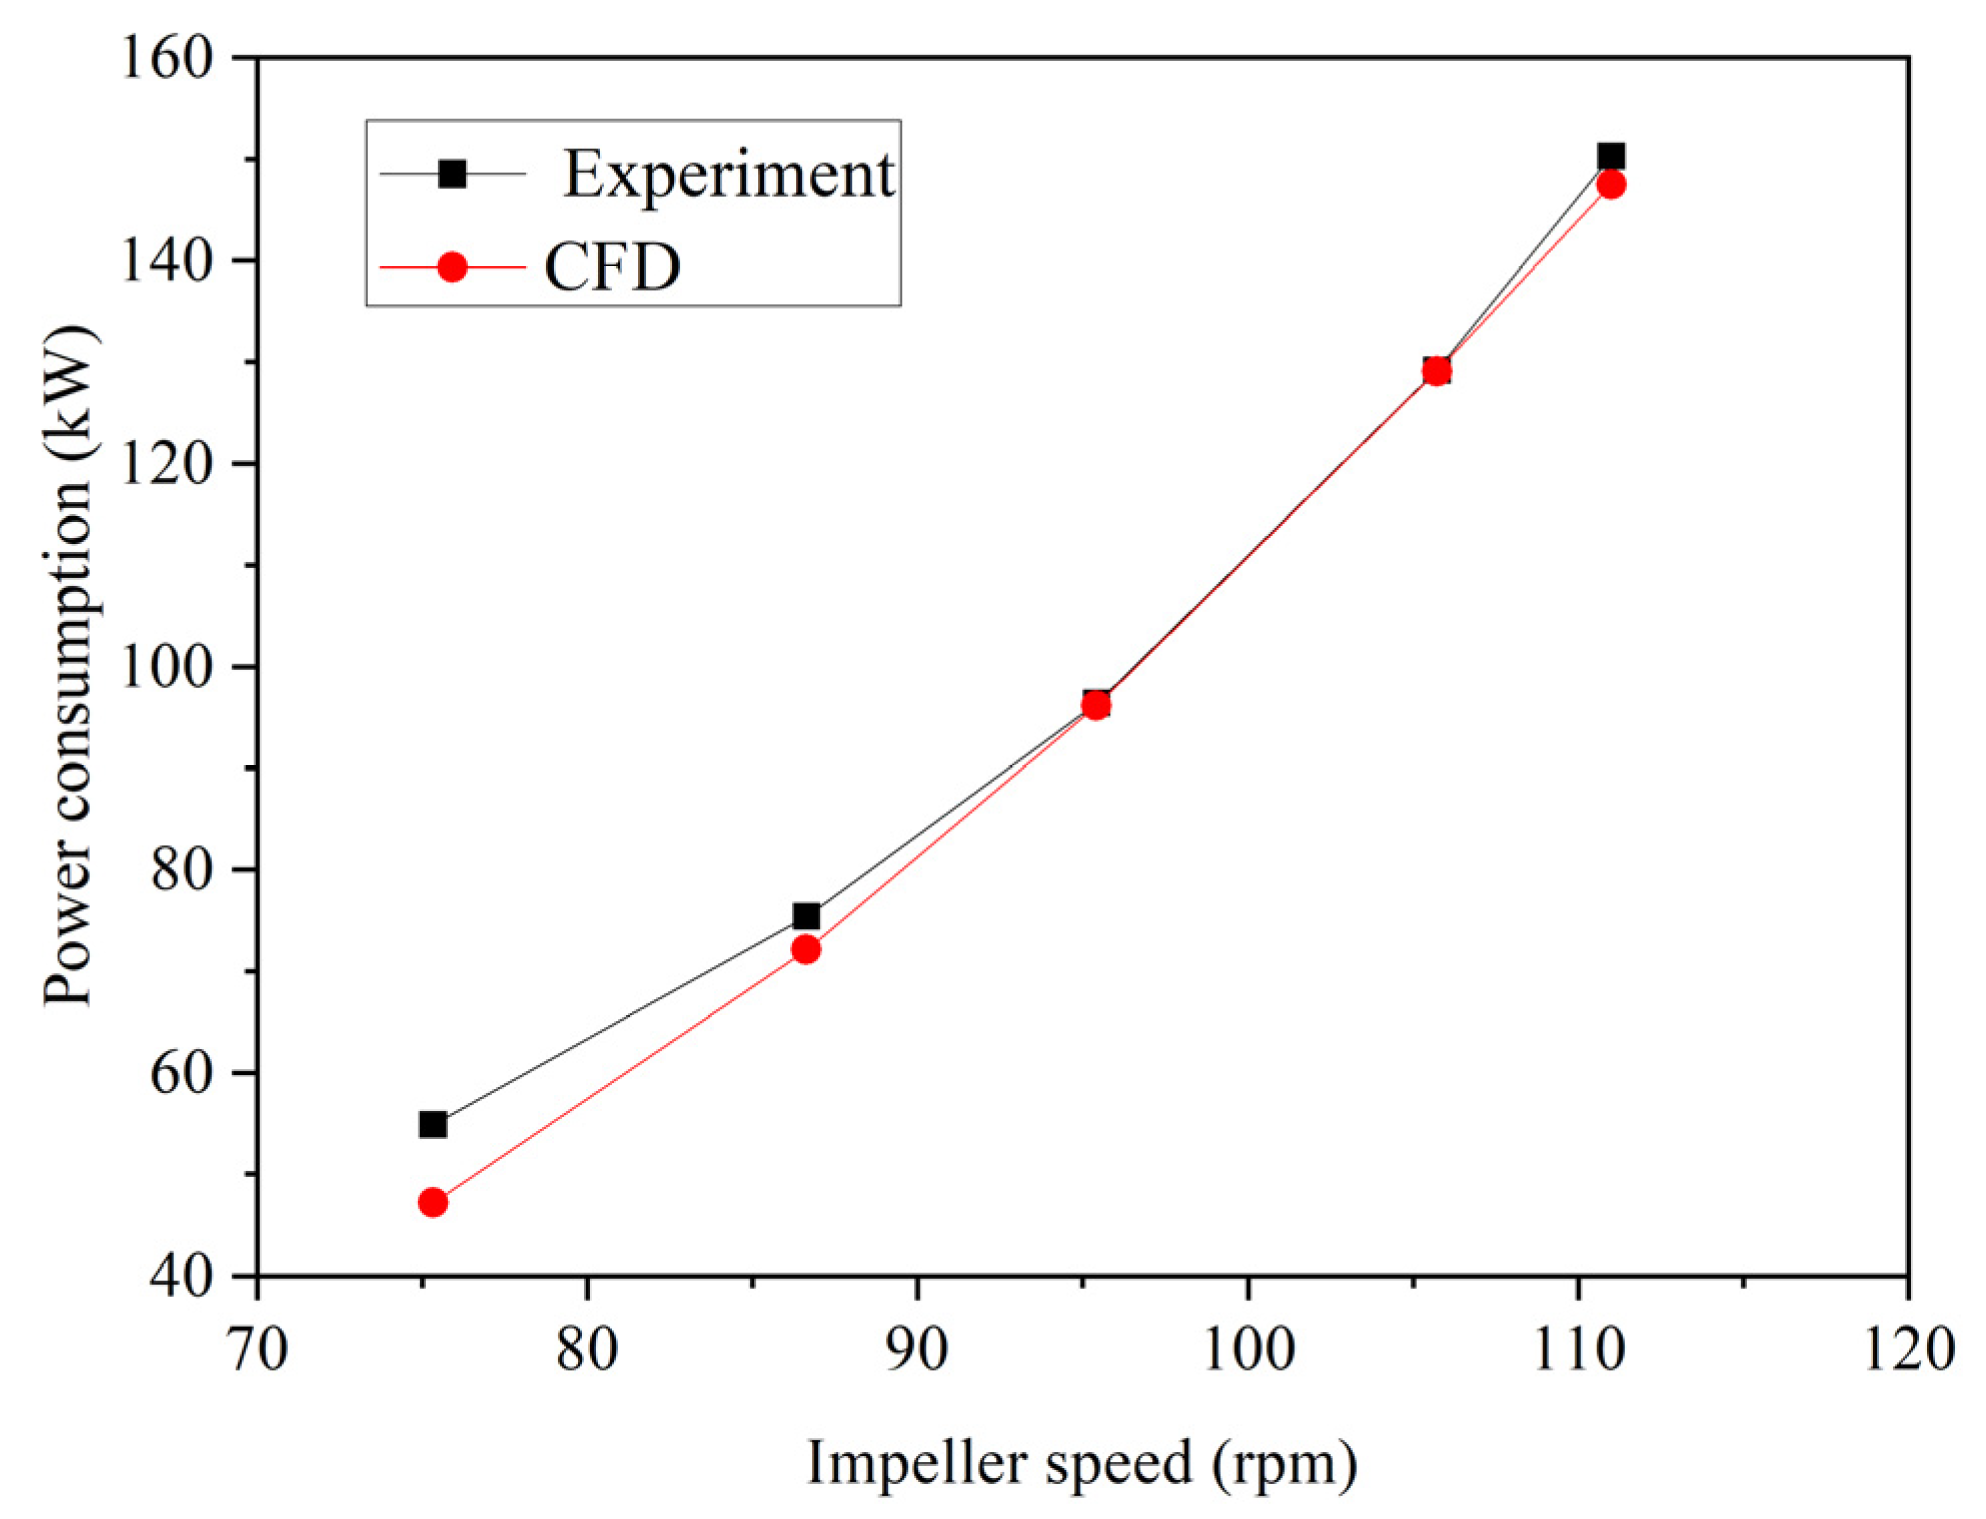
A design method and scale-up method for large-scale forced-air self-aspirating flotation machines were established. Core hydrodynamic performance parameters, including power consumption, pulp suction capacity, and circulation capacity, were predicted through CFD simulation, and the feasibility and accuracy of the scale-up method were successfully verified.
(6)
The largest forced-air self-pumping flotation machine, with a volume of 160 m3, was developed and successfully applied in engineering. An industrial test study confirmed that the flotation machine effectively achieved pulp suction while maintaining power consumption that is comparable to or only slightly higher than that of an air-forced flotation machine. Additionally, good metallurgical performance was verified through industrial testing. Therefore, this study demonstrates that the developed flotation machine successfully meets the requirements for a horizontal configuration in large-scale flotation circuits.

Author Contributions

Methodology, Y.Z.; investigation, M.Z.; writing—original draft, M.Z.; visualization, B.L.; supervision, Z.S. and F.M. All authors have read and agreed to the published version of the manuscript.

Funding

This work was supported by grants from the National Natural Science Foundation of China (Nos. 51474032 and 51674034).

Data Availability Statement

The original contributions presented in this study are included in the article. Further inquiries can be directed to the corresponding author.

Acknowledgments

This work was carried out at the National Supercomputer Center in Tianjin and the calculations were performed on TianHe-1 (A).

Conflicts of Interest

The authors declare no conflicts of interest.

References

  1. Chen, J.; Zhu, Y. Study of semi-constrained properties of metal ions on mineral surface of flotation system. J. China Univ. Min. Technol. 2021, 50, 1181–1188. [Google Scholar]
  2. Wang, Z.; Zhang, M.; Fan, X.; Chen, F.; Han, D. Research on fluid dynamics performance of air forced & pulp induced flotation cell using numerical simulation. Nonferrous Met. (Miner. Process. Sect.) 2017, 127–131. [Google Scholar]
  3. Shen, Z. Theory and Technologies of Flotation Cells; Metallurgical Industrial Press: Beijing, China, 2012. [Google Scholar]
  4. Yu, Y.; Han, D.; Liu, Z. Analysis and application of flat lauout of flotation cells. Min. Metall. 2017, 26, 63–66. [Google Scholar]
  5. Shen, Z. Principles and Technologies of Flotation Machines; Springer: Berlin/Heidelberg, Germany, 2021. [Google Scholar]
  6. Han, S. Development and application of XJZ series mechanical stirring flotation machine. Met. Mine 1991, 56–58. [Google Scholar]
  7. Zhang, H.; Xie, B.; Liu, G. SF and JJF flotation machine combined unit. Nonferrous Met. (Miner. Process. Sect.) 1987, 38–41. [Google Scholar]
  8. Dong, G.; Liu, G.; Liu, L. Application of BF-T flotation machine to upgrading iron concentrate. Min. Metall. 2005, 4, 20–22. [Google Scholar]
  9. Wan, L. Study on the application of XCF, KYF and GF flotation units in bauxite production. Copp. Eng. 2019, 70–75. [Google Scholar]
  10. Wang, G. Development trend and development trend of foreign flotation machine. World Eng. Ind. 1990, 2–9. [Google Scholar]
  11. Shen, Z. Development of the XCF II and the combined flotation unit of XCF II/KYF II pneumatic-mechanical cells and the production practice. Nonferrous Metall. Equip. 2007, 21, 4–7. [Google Scholar]
  12. Shen, Z.; Zhang, M.; Shi, S.; Zhang, Y.; Duan, L. The scale-up and dynamics performance research of the air forced self pumping flotation cell. J. China Univ. Min. Technol. 2022, 51, 434–444. [Google Scholar] [CrossRef]
  13. Mesa, D.; Brito-Parada, P.R. Scale-up in froth flotation: A state-of-the-art review. Sep. Purif. Technol. 2019, 210, 950–962. [Google Scholar] [CrossRef]
  14. Vinnett, L.; Yianatos, J.; Díaz, F.; Hassanzadeh, A. Estimating effective volumes in industrial forced-air flotation cells. Miner. Eng. 2024, 211, 108678. [Google Scholar] [CrossRef]
  15. Wang, Z.; Chen, B.; Du, J.; Sheng, K.; Yan, S. Impeller Structure Improvement of XCF Flotation Machine Based on Simulation. Nonferrous Met. (Miner. Process. Sect.) 2023, 109–117. [Google Scholar]
  16. Sun, C.; Shi, S.; Han, D.; Zhang, Y.; Zhang, M.; Zhang, F. Zoning model of flotation kinetics process in air-forced mechanical agitator flotation machine. J. China Univ. Min. Technol. 2022, 51, 411–418. [Google Scholar] [CrossRef]
  17. Yianatos, J.; Vallejos, P. Challenges in flotation scale-up: The impact of flotation kinetics and froth transport. Miner. Eng. 2024, 207, 108541. [Google Scholar] [CrossRef]
  18. Romero, J. First Tank Cells of 630 m3 in operation at Buena Vista. In Proceedings of the 1st Flotation Symposium, Outotec Chile Customer Seminar, Santa Cruz, Chile, 4–5 October 2018. [Google Scholar]
  19. Shen, Z.; Zhang, M.; Fan, X.; Shi, S.; Han, D. Hydrodynamic and Flotation Kinetic Analysis of a Large Scale Mechanical Agitated Flotation Cell with the Typical Impeller and the Arc Impeller. Minerals 2019, 9, 79. [Google Scholar] [CrossRef]
  20. Shen, Z.; Chen, D.; Zhang, M.; Dong, G. Hydrodynamics analysis of a 680 M3 mechanical agitated flotation cell based on numerical simulation. In Proceedings of the 28th International Mineral Processing Congress, IMPC 2016, Quebec City, QC, Canada, 11–15 September 2016; Canadian Institute of Mining, Metallurgy and Petroleum: Westmount, QC, Canada, 2016. [Google Scholar]
  21. Lelinski, D.; Stevens, D.; Walker, M.; Weber, A. Metallurgical Performance of the 660 m3 SuperCell™ equipped with the nextSTEP™ Rotor and Stator. In Proceedings of the Flotation’17, Cape Town, South Africa, 13–16 November 2017; MEI: Cape Town, South Africa, 2017. [Google Scholar]
  22. Li, S.; Schwarz, M.P.; Yang, W.; Feng, Y.; Witt, P.; Sun, C. Experimental observations of bubble–particle collisional interaction relevant to froth flotation, and calculation of the associated forces. Miner. Eng. 2020, 151, 106335. [Google Scholar] [CrossRef]
  23. Nelson, M.G.; Lelinski, D. Hydrodynamic design of self-aerating flotation machines. Miner. Eng. 2000, 13, 991–998. [Google Scholar] [CrossRef]
  24. Gorain, B.K. Design, Operating Principles, and Optimization of Mechanical Flotation Cells. In Proceedings of the Froth Flotation: A Century of Innovation, Cape Town, CA, USA, 2007; SME Inc.: Wilmington, NC, USA, 2007. [Google Scholar]
  25. Zhang, M.; Shen, Z.; Fan, X.; Shi, S.; Yang, Y. Scale-up theory and technology of BGRIMM flotation cell. Nonferrous Met. (Miner. Process. Sect.) 2020, 98–104. [Google Scholar]
  26. Shi, S. The Flotation Dynamic Characteristics of Coarse Particle Minerals and the Structural Parameters Optimization of Large Flotation Machines. Ph.D. Thesis, University of Science and Technology Beijing, Beijing, China, 2020. [Google Scholar]
  27. Kelebek, S.; Yoruk, S. Bubble contact angle variation of sulphide minerals in relation to their self-induced flotation. Colloids Surf. A Physicochem. Eng. Asp. 2002, 196, 111–119. [Google Scholar] [CrossRef]
  28. Verrelli, D.I.; Koh, P.T.; Nguyen, A.V. Particle–bubble interaction and attachment in flotation. Chem. Eng. Sci. 2011, 66, 5910–5921. [Google Scholar] [CrossRef]
  29. Koh, P.T.L.; Schwarz, M.P. CFD model of a self-aerating flotation cell. Int. J. Miner. Process. 2007, 85, 16–24. [Google Scholar] [CrossRef]
  30. Farrokhpay, S.; Filippova, I.; Filippov, L.; Picarra, A.; Rulyov, N.; Fornasiero, D. Flotation of fine particles in the presence of combined microbubbles and conventional bubbles. Miner. Eng. 2020, 155, 106439. [Google Scholar] [CrossRef]
  31. Li, S.; Schwarz, M.P.; Feng, Y.; Witt, P.; Sun, C. A CFD study of particle–bubble collision efficiency in froth flotation. Miner. Eng. 2019, 141, 105855. [Google Scholar] [CrossRef]
  32. Shi, S.; Yu, Y.; Yang, W.; Zhou, H. Flow Field test and analysis of KYF flotation cell by PIV. In Proceedings of the 2013 International Conference on Process Equipment, Mechatronics Engineering and Material Science, Wuhan, China, 15–16 June 2013; pp. 200–204. [Google Scholar]
  33. Shi, S.; Zhang, M.; Fan, X.; Chen, D. Experimental and computational analysis of the impeller angle in a flotation cell by PIV and CFD. Int. J. Miner. Process. 2015, 142, 2–9. [Google Scholar] [CrossRef]
  34. Basavarajappa, M.; Miskovic, S. CFD simulation of single-phase flow in flotation cells: Effect of impeller blade shape, clearance, and Reynolds number. Int. J. Min. Sci. Technol. 2019, 29, 657–669. [Google Scholar] [CrossRef]
  35. Dong, G.; Zhang, M.; Yang, L.; Wu, F. Analysis of Flow Field in the KYF Flotation Cell by CFD. In Proceedings of the 2013 International Conference on Process Equipment, Mechatronics Engineering and Material Science, Wuhan, China, 15–16 June 2013; pp. 161–165. [Google Scholar]
  36. Windows-Yule, C.; Herald, M.; Nicuşan, A.; Wiggins, C.; Pratx, G.; Manger, S.; Odo, A.; Leadbeater, T.; Pellico, J.; de Rosales, R.T. Recent advances in positron emission particle tracking: A comparative review. Rep. Prog. Phys. 2022, 85, 016101. [Google Scholar] [CrossRef]
  37. Schwarz, M.P.; Koh, P.T.L.; Yang, W.; Nguyen, B. Investigation of the gas-liquid-particle multi-phase hydrodynamics of Wemco flotation cells. Miner. Eng. 2022, 179, 107388. [Google Scholar] [CrossRef]
  38. Schwarz, M.P.; Koh, P.T.L.; Wu, J.; Nguyen, B.; Zhu, Y. Modelling and measurement of multi-phase hydrodynamics in the Outotec flotation cell. Miner. Eng. 2019, 144, 106033. [Google Scholar] [CrossRef]
  39. Alexander, D.J.; Runge, K.C.; Franzidis, J.P.; Manlapig, E.V. The application of multicomponent floatability models to full scale flotation circuits. In Proceedings of the 7th Mill Operators Conference, Kalgoorlie, WA, Australia, 12–14 October 2000. [Google Scholar]
  40. Arbiter, N. Development and scale-up of large flotation cells. Min. Eng. 2000, 52, 28–33. [Google Scholar]
  41. Vallejos, P.; Yianatos, J.; Grau, R.; Yañez, A. Evaluation of flotation circuits design using a novel approach. Miner. Eng. 2020, 158, 106591. [Google Scholar] [CrossRef]
  42. Yianatos, J.B.; Larenas, J.M.; Moys, M.H.; Diaz, F.J. Short time mixing response in a big flotation cell. Int. J. Miner. Process. 2008, 89, 1–8. [Google Scholar] [CrossRef]
  43. Yianatos, J.B.; Henríquez, F.D. Short-cut method for flotation rates modelling of industrial flotation banks. Miner. Eng. 2006, 19, 1336–1340. [Google Scholar] [CrossRef]
  44. Yianatos, J.; Vallejos, P.; Grau, R.; Yañez, A. New approach for flotation process modelling and simulation. Miner. Eng. 2020, 156, 106482. [Google Scholar] [CrossRef]
  45. Yianatos, J.; Vallejos, P.; Rodriguez, M.; Cortinez, J. A scale-up approach for industrial flotation cells based on particle size and liberation data. Miner. Eng. 2022, 184, 107635. [Google Scholar] [CrossRef]
  46. Yianatos, J.; Vallejos, P. Limiting conditions in large flotation cells: Froth recovery and bubble loading. Miner. Eng. 2022, 185, 107695. [Google Scholar] [CrossRef]
  47. Shen, Z.; Liu, G.; Lu, S.; Liu, Z. Characteristics and application of BGRIMM series flotation cell. Nonferrous Met. (Miner. Process. Sect.) 1999, 31–33. Available online: http://ysxk.ijournals.cn/ysjsxkbfen/ch/reader/view_abstract.aspx?file_no=19990667&flag=1 (accessed on 20 April 2025).
  48. Guan, X.F. Modern Pump Theory and Design; China Astronautical Press: Beijing, China, 2014. [Google Scholar]
  49. Fayed, H.; Ragab, S. Numerical Simulations of Two-Phase Flow in a Self-Aerated Flotation Machine and Kinetics Modeling. Minerals 2015, 5, 164–188. [Google Scholar] [CrossRef]
Figure 1. The conventional forced-air self-aspirating flotation machine.
Processes 13 01316 g001
Figure 2. The 200 L forced-air self-aspirating flotation machine experiment system. 1. Air compressor; 2. inlet water turbine electromagnetic flowmeter: 3″; 3. 3″ circulation pump inlet; 4. feeding pipe; 5. feeding box; 6. air regulating valve; 7. glass transfer flowmeter; 8. torque sensor; 9. shaft; 10. air inlet; 11. flotation machine system bracket; 12. connecting tube; 13. 200 L forced-air self-aspirating flotation machine; 14. center cylinder; 15. tailing box; 16. tailing mouth: 3″; 17. outlet turbine electromagnetic flowmeter: 3″; 18. tank; 19. tank outlet; 20. feeding water (circulation pump); 21. pipeline; and 22. converter.
Processes 13 01316 g002
Figure 3. The 200 L forced-air self-aspirating flotation machine. 1. Feeding box; 2. feeding pipe; 3. flotation cell; 4. receiver; 5. main shaft (hollow); 6. center cylinder; 7. tailing box; 8. cover; 9. stator; 10. impeller; 11. air distributor; 12. lower blade; 13. spacer; and 14. upper blade.
Processes 13 01316 g003
Figure 4. The industrial experiment system. (a) Main components of the experiment system. (b) Experimental principle for slurry suction capacity.
Processes 13 01316 g004
Figure 5. Variation in torque and pulp suction with air superficial velocity (330 rpm) at different liquid levels.
Processes 13 01316 g005
Figure 6. The relationship between torque and suction volume with impeller submergence depth at different air superficial velocities (330 rpm).
Processes 13 01316 g006
Figure 7. The new large-scale forced-air self-aspirating flotation machine.
Processes 13 01316 g007
Figure 8. The three impeller designs. (a) Conventional impeller with middle placement. (b) New impeller with middle placement. (c) New impeller with bottom placement.
Processes 13 01316 g008
Figure 9. The power consumption and suction volumes of the three design schemes with different speeds without aerating.
Processes 13 01316 g009
Figure 10. The unit suction power consumption of the three design schemes with different speeds without aerating.
Processes 13 01316 g010
Figure 11. The power consumption and suction volume of three design schemes with varying air superficial velocities (137 rpm).
Processes 13 01316 g011
Figure 12. The power consumption and suction volume of three design schemes with varying speeds (air superficial velocity: 2.0 cm/s).
Processes 13 01316 g012
Figure 13. The relationship between speed and volume for the conventional air-forced flotation machine.
Processes 13 01316 g013
Figure 14. The mesh domains for the flotation machine.
Processes 13 01316 g014
Figure 15. The mesh sensitivity analysis.
Processes 13 01316 g015
Figure 16. The custom-defined monitoring point torque variations with timesteps.
Processes 13 01316 g016
Figure 17. The suction capacity of the flotation machine at different feeding rates (air volume fraction and gas volume fraction). (a) No inlet from the feeding box. (b) Feeding rate of 9.6 m3/min at the feeding box. (c) Feeding rate of 25.7 m3/min at the feeding box.
Processes 13 01316 g017
Figure 18. The streamline of the flotation cell with a feeding rate of 9.8 m3/min at the X-Y section.
Processes 13 01316 g018
Figure 19. Velocity cloud picture at a feed rate of 9.8 m3/min at the X-Y section.
Processes 13 01316 g019
Figure 20. The pressure distribution of the flotation machine with a feeding rate of 9.8 m3/min at the X-Y section.
Processes 13 01316 g020
Figure 21. The pressure distribution of the impeller with a feeding rate of 9.8 m3/min.
Processes 13 01316 g021
Figure 22. The air holdup distribution with a feeding rate of 9.8 m3/min and air superficial velocity of 1.67 cm/s.
Processes 13 01316 g022
Figure 23. The pressure distribution and air accumulation of the impeller with a feeding rate of 9.8 m3/min and air superficial velocity of 1.67 cm/s.
Processes 13 01316 g023
Figure 24. The large-scale forced-air self-aspirating flotation machine system, including the feeding box and the tailing box.
Processes 13 01316 g024
Figure 25. The level in the feeding box after operation with a full water tank.
Processes 13 01316 g025
Figure 26. The power consumption at different impeller speeds without aeration.
Processes 13 01316 g026
Figure 27. The relationship between air superficial velocity and air dispersion (110 rpm, no suction).
Processes 13 01316 g027
Table 1. The 200 L forced-air self-aspirating flotation machine’s technical parameters.
ParameterValueParameterValue
Effective volume200 LMotor1.1 kW
Tank (L × W × H)640 × 640 × 650 mmImpellersΦ250 mm
Overflow weir height550 mmStatorΦ410 mm
Hollow shaftΦ52 mmCover plateΦ250 mm
Center cylinderΦ150 mmImpeller speedDesign speed: 330 rpm
Connecting tubeΦ140 mmLinear velocity0~4.6 m/s
Feeding pipeΦ95 mmRotor speed0~400 rpm
Table 2. The main instruments of the 200 L flotation machine experiment system.
ItemManufacturer ModelNote
Torque SensorElectro-Measurement, AVIC, Beijing, ChinaZH-10/0–100 Nm
ConverterS700, ABB, Beijing, China0.75 kW
FlowmeterZMB 3″, Wilo, Shanghai, China0–1000 L/min
PumpDSU-80D, MRT, Hangzhou, China0–833 L/min
Table 3. The critical parameters of the 50 m3 forced-air self-aspirating flotation machine.
No.ItemsNote
1Effective volume50 m3
2Tank (W × L)4200 × 4200 mm
3Overflow weir height3600 mm
4Motor132 kW
5ConverterSINAMICS G120X 160 kW
6FlowmeterEMF8301(300); 500~2500 m3/h
Table 4. The critical parameters of different designs.
Scheme I
Conventional Impeller
with Middle Placement
Scheme II
New Impeller
with Middle Placement
Scheme III
New Impeller
with Bottom Placement
Diameter of upper bladesΦ1200 mmΦ1050 mmΦ1050 mm
Diameter of bottom bladesΦ1200 mmΦ1050 mmΦ1050 mm
Bottom blade height207 mm570 mm570 mm
Impeller submergence depth2000 mm2000 mm2340 mm
Impeller-to-bottom distance1190 mm860 mm520 mm
Notes: The diameter of the 50 m3 forced-air self-aspirating flotation machine is Φ1200 mm. The diameter of the 50 m3 air-forced self-aspirating flotation machine is Φ1050 mm.
Table 5. The titanium magnetite index (TiO2) of three impeller design schemes.
ItemOre GradeConcentrate GradeTailing GradeYieldRecoveryVarianceStandard Deviation
Conventional impeller
with middle placement
18.48%40.81%10.05%27.90%60.72%0.48%6.92%
New impeller
with middle placement
18.21%41.82%8.60%28.91%66.41%0.47%6.89%
New impeller
with bottom placement
19.15%40.83%9.74%30.09%64.08%0.86%9.25%
Table 6. Diameter correction factors.
ns100110120130140150
KD210.9950.9940.9940.9950.997
ns100110120130140150
KD21.11.0671.0371.0110.9870.965
Table 7. The basic parameters of the 160 m3 forced-air self-aspirating flotation cell.
ParameterDesign Value
Volume (m3)160
Dimensions (overflow weir) (m)7 × 7 × 4.8
Impeller height from bottom (m)1.2
Speed (r/min)110
Installed power (kW)200~220
Table 8. The flotation circuit parameters and the impeller design parameters of the 160 m3 forced-air self-aspirating flotation machine.
Feed, Q
(m3/s)
FeedingHead for Upper Blades, H (m)Specific Speed, nsInlet Diameter, D0 (m)Outlet Diameter, D2 (m)Width, b2 (mm)
Ore Density (kg/m3)Concentration (%)Specific Gravity
of Pulp
0.44 × 103301.292.675124.70.691.31102
Note: The head H of the upper blade is the height from the top of the upper blade to the free-liquid surface; the specific speed ns is the medium specific speed; and the impeller width b2 (rounded) is 100 mm.
Table 9. The mesh sensitivity analysis.
No.Impeller Dynamic Domain (1 × 10⁴)Feeding Box and Center
Cylinder Static Domain
(1 × 10⁴)
Tank Body Static Domain (1 × 10⁴)Total Elements
(1 × 10⁴)
Power Consumption (kW)Power Consumption Ratio
14141207289171.411.14
26969376514172.431.15
3135143710988150.241
423735722592853154.601.03
Table 10. The power consumption, suction capacity, and circulation capacity of the upper blades and the lower blades of the impeller.
Different Working ConditionsUpper Blades (kW)Lower Blades (kW)Suction Volume (m3/min)Circulation Volume
(m3/min)
Upper/Total Power Consumption Ratio
Feeding Rate (m3/min)Air Superficial
Velocity (cm/s)
00814202275%
9.80161461023610%
25.70281542625115%
34.20311543125017%
9.81.67161211122112%
Table 11. The separating index with sulfur recovery.
No.Ore GradeConcentrate GradeTailing GradeYieldRecovery
141.3%45.4%24.2%80.4%88.5%
234.0%46.5%22.6%47.8%65.3%
336.7%44.1%17.8%71.8%86.3%
435.8%41.3%11.2%81.6%94.2%
527.2%38.1%15.0%52.6%73.8%
628.6%36.8%17.0%58.6%75.4%
734.1%42.6%15.0%69.2%86.4%
836.2%43.0%10.9%78.7%93.6%
Average34.2%42.2%16.7%67.6%82.9%
Variance1.07%
Standard deviation10.32%
Table 12. The separating index with zinc removal from sulfur concentrate.
No.Ore GradeConcentrate GradeTailing GradeYieldRecovery
10.37%0.09%0.35%8.3%77.7%
20.65%0.01%0.60%9.2%84.6%
30.58%0.10%0.47%10.5%84.6%
40.64%0.19%0.76%6.1%72.1%
50.56%0.07%0.82%6.0%88.3%
60.44%0.10%0.56%6.2%78.7%
70.58%0.07%0.19%28.5%91.4%
80.40%0.09%0.18%17.7%81.5%
Average0.53%0.09%0.49%11.6%82.4%
Variance0.38%
Standard deviation6.19%
Disclaimer/Publisher’s Note: The statements, opinions and data contained in all publications are solely those of the individual author(s) and contributor(s) and not of MDPI and/or the editor(s). MDPI and/or the editor(s) disclaim responsibility for any injury to people or property resulting from any ideas, methods, instructions or products referred to in the content.

