1. Introduction
As its mainstay of energy, coal secures a vital strategic place in the national economy. It is expected that by 2030, when carbon dioxide emissions peak, the proportion of coal in the energy consumption structure will still be higher than 43% [
1,
2]. However, as the coal mining depth increases, high ground temperature, high ground pressure, and other factors have posed greater risks and aggravated disasters. Mine gas prevention and control are facing new problems and challenges [
3,
4,
5]. Coal and gas outbursts, among the most severe dynamic disasters in coal mining, are often accompanied by instantaneous, massive gas emissions, resulting in a sharp increase in gas concentration in local areas, thereby creating explosion or asphyxiation risks [
6,
7,
8]. The gas–solid mixed flow of coal and gas can disrupt mine ventilation systems while destroying underground equipment and facilities. Furthermore, the reduction in oxygen levels not only threatens personnel safety but may also trigger mine fires and gas explosions. Additionally, such incidents can induce secondary disasters, leading to cascading catastrophic events [
9,
10].
In recent years, many researchers have thoroughly examined the impact of gas on mine ventilation systems, particularly in response to coal and gas outbursts. Wang et al. [
11,
12] utilized both experimental and numerical simulation methods to investigate how gas accumulation affects airflow oscillations in the inclined roadways of outburst-prone mines. They developed a quantitative model that links the angles of roadway inclinations to the intensity of airflow disturbances. Meanwhile, Zhang [
13] provided a comprehensive overview of the research landscape concerning outburst two-phase flow, highlighting five key aspects: the visualization of outburst dynamics, the structural complexity of roadways, multi-source data acquisition, a wide range of influencing factors, and diverse research methodologies. Yang [
14] designed a physical test system to simulate the outburst process and conducted experiments with it to explore the formation and propagation of outburst shock waves and the backflow of gas. The coal powder flow and methane–air mixture are intrinsically coupled in coal and gas outburst processes. Experimental and field investigations have demonstrated a characteristic gas-leading powder-lag phenomenon in post-outburst roadways, where high-pressure gas flow precedes pulverized coal migration during dynamic discharge phases [
15,
16,
17].
Driven by evolving coal mining practices and emerging safety demands in China’s new era, the prevention and dynamic early warning of coal and gas outburst disasters have entered a transformative stage. Academician Yuan Liang [
18,
19] pioneered a tri-parameter early warning index system based on the outburst hazard probability, energy release rate, and system stability rate. This system established China’s first cloud-based platform for coal mine dynamic disaster monitoring. Building upon quantitative outburst risk assessment and dynamic warning frameworks, Zhang et al. [
20] proposed an integrated risk evaluation method combining variable weight theory and uncertainty theory. To enhance the prediction accuracy of coal and gas outburst dynamics, Shao et al. [
21] developed a novel hybrid framework integrating a Markov chain Monte Carlo (MCMC) data imputation algorithm with an improved sparrow search algorithm (ISSA)–optimized support vector machine (SVM), achieving a breakthrough in multi-phase risk quantification. Zhang et al. [
22] proposed a coal and gas outburst risk assessment methodology based on an enhanced comprehensive weighting system and cloud theory. This approach effectively addresses issues of fuzziness and randomness in risk evaluation, deviations in indicator weighting, and inter-indicator correlations. Jiang et al. [
23] employed a multi-weight combination optimization model utilizing the Gram–Schmidt orthogonalization method to eliminate inter-factor correlations. This optimized weighted comprehensive evaluation model assessed outburst pressure risks in coal seams at the Liangjia Coal Mine.
Generally speaking, machine learning models are trained on static data and cannot provide highly real-time responses to coal and gas outburst accidents in coal mines. To address this limitation in risk assessment methods, some scholars have proposed solutions. For instance, Zhang et al. [
24] introduced a dynamic probabilistic risk assessment method based on a dynamic Bayesian network (DBN) for emergency response in smart coal mines. This approach was validated through practical case studies in gas overlimit scenarios, effectively enhancing risk prediction capabilities and enabling bidirectional risk analysis. Du et al. [
25] implemented rapid detection techniques and multi-source dynamic monitoring technologies specific to mining operations to classify risk zones of typical dynamic hazards. They concurrently developed an early warning software platform capable of automated evaluation and practical three-dimensional visualization in coal mining areas. Zhu et al. [
26] conducted a dynamic assessment and simulation of coal mine safety risk using ANP, fuzzy comprehensive evaluation, and a system dynamics model.
However, current research on risk assessment throughout the entire disaster process of coal and gas outbursts remains limited. This study employed the information entropy method to evaluate the hazard of gas concentration accumulation following outbursts. As a technical approach that integrates data analysis and system modeling, it provides a scientific basis for gas accident early warning, mine ventilation optimization, mine monitoring, and the implementation of disaster prevention and control measures.
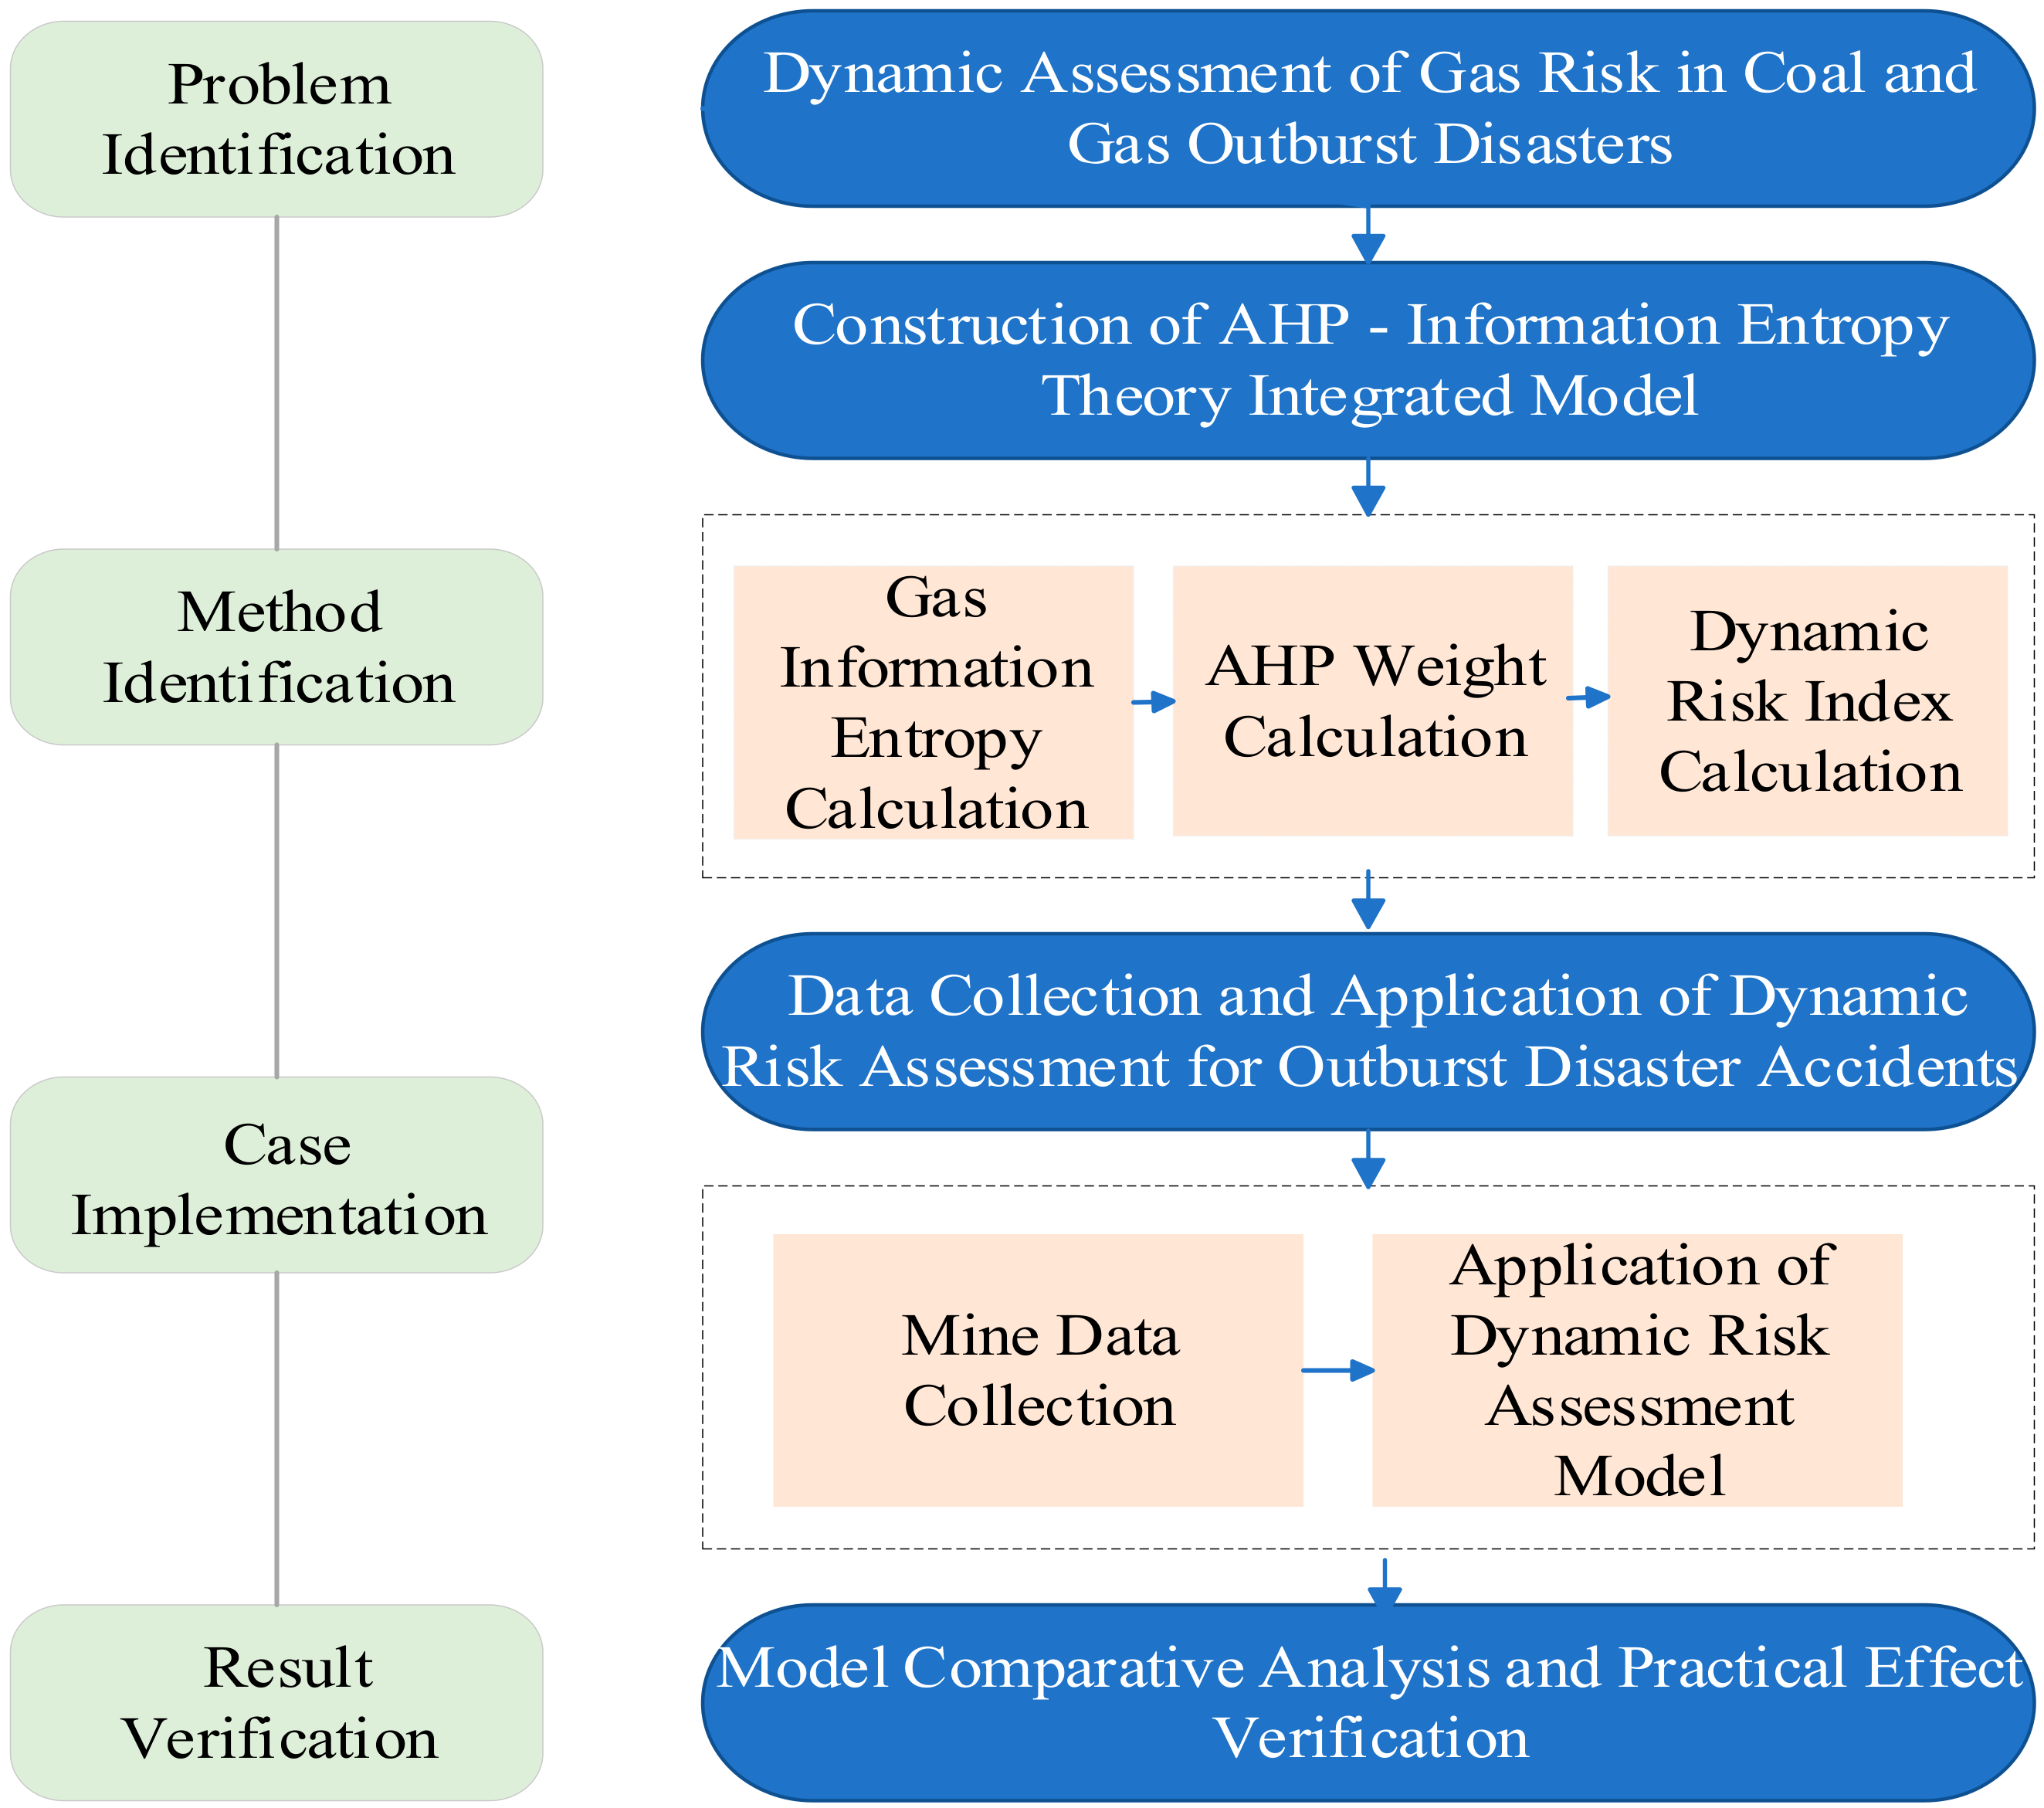
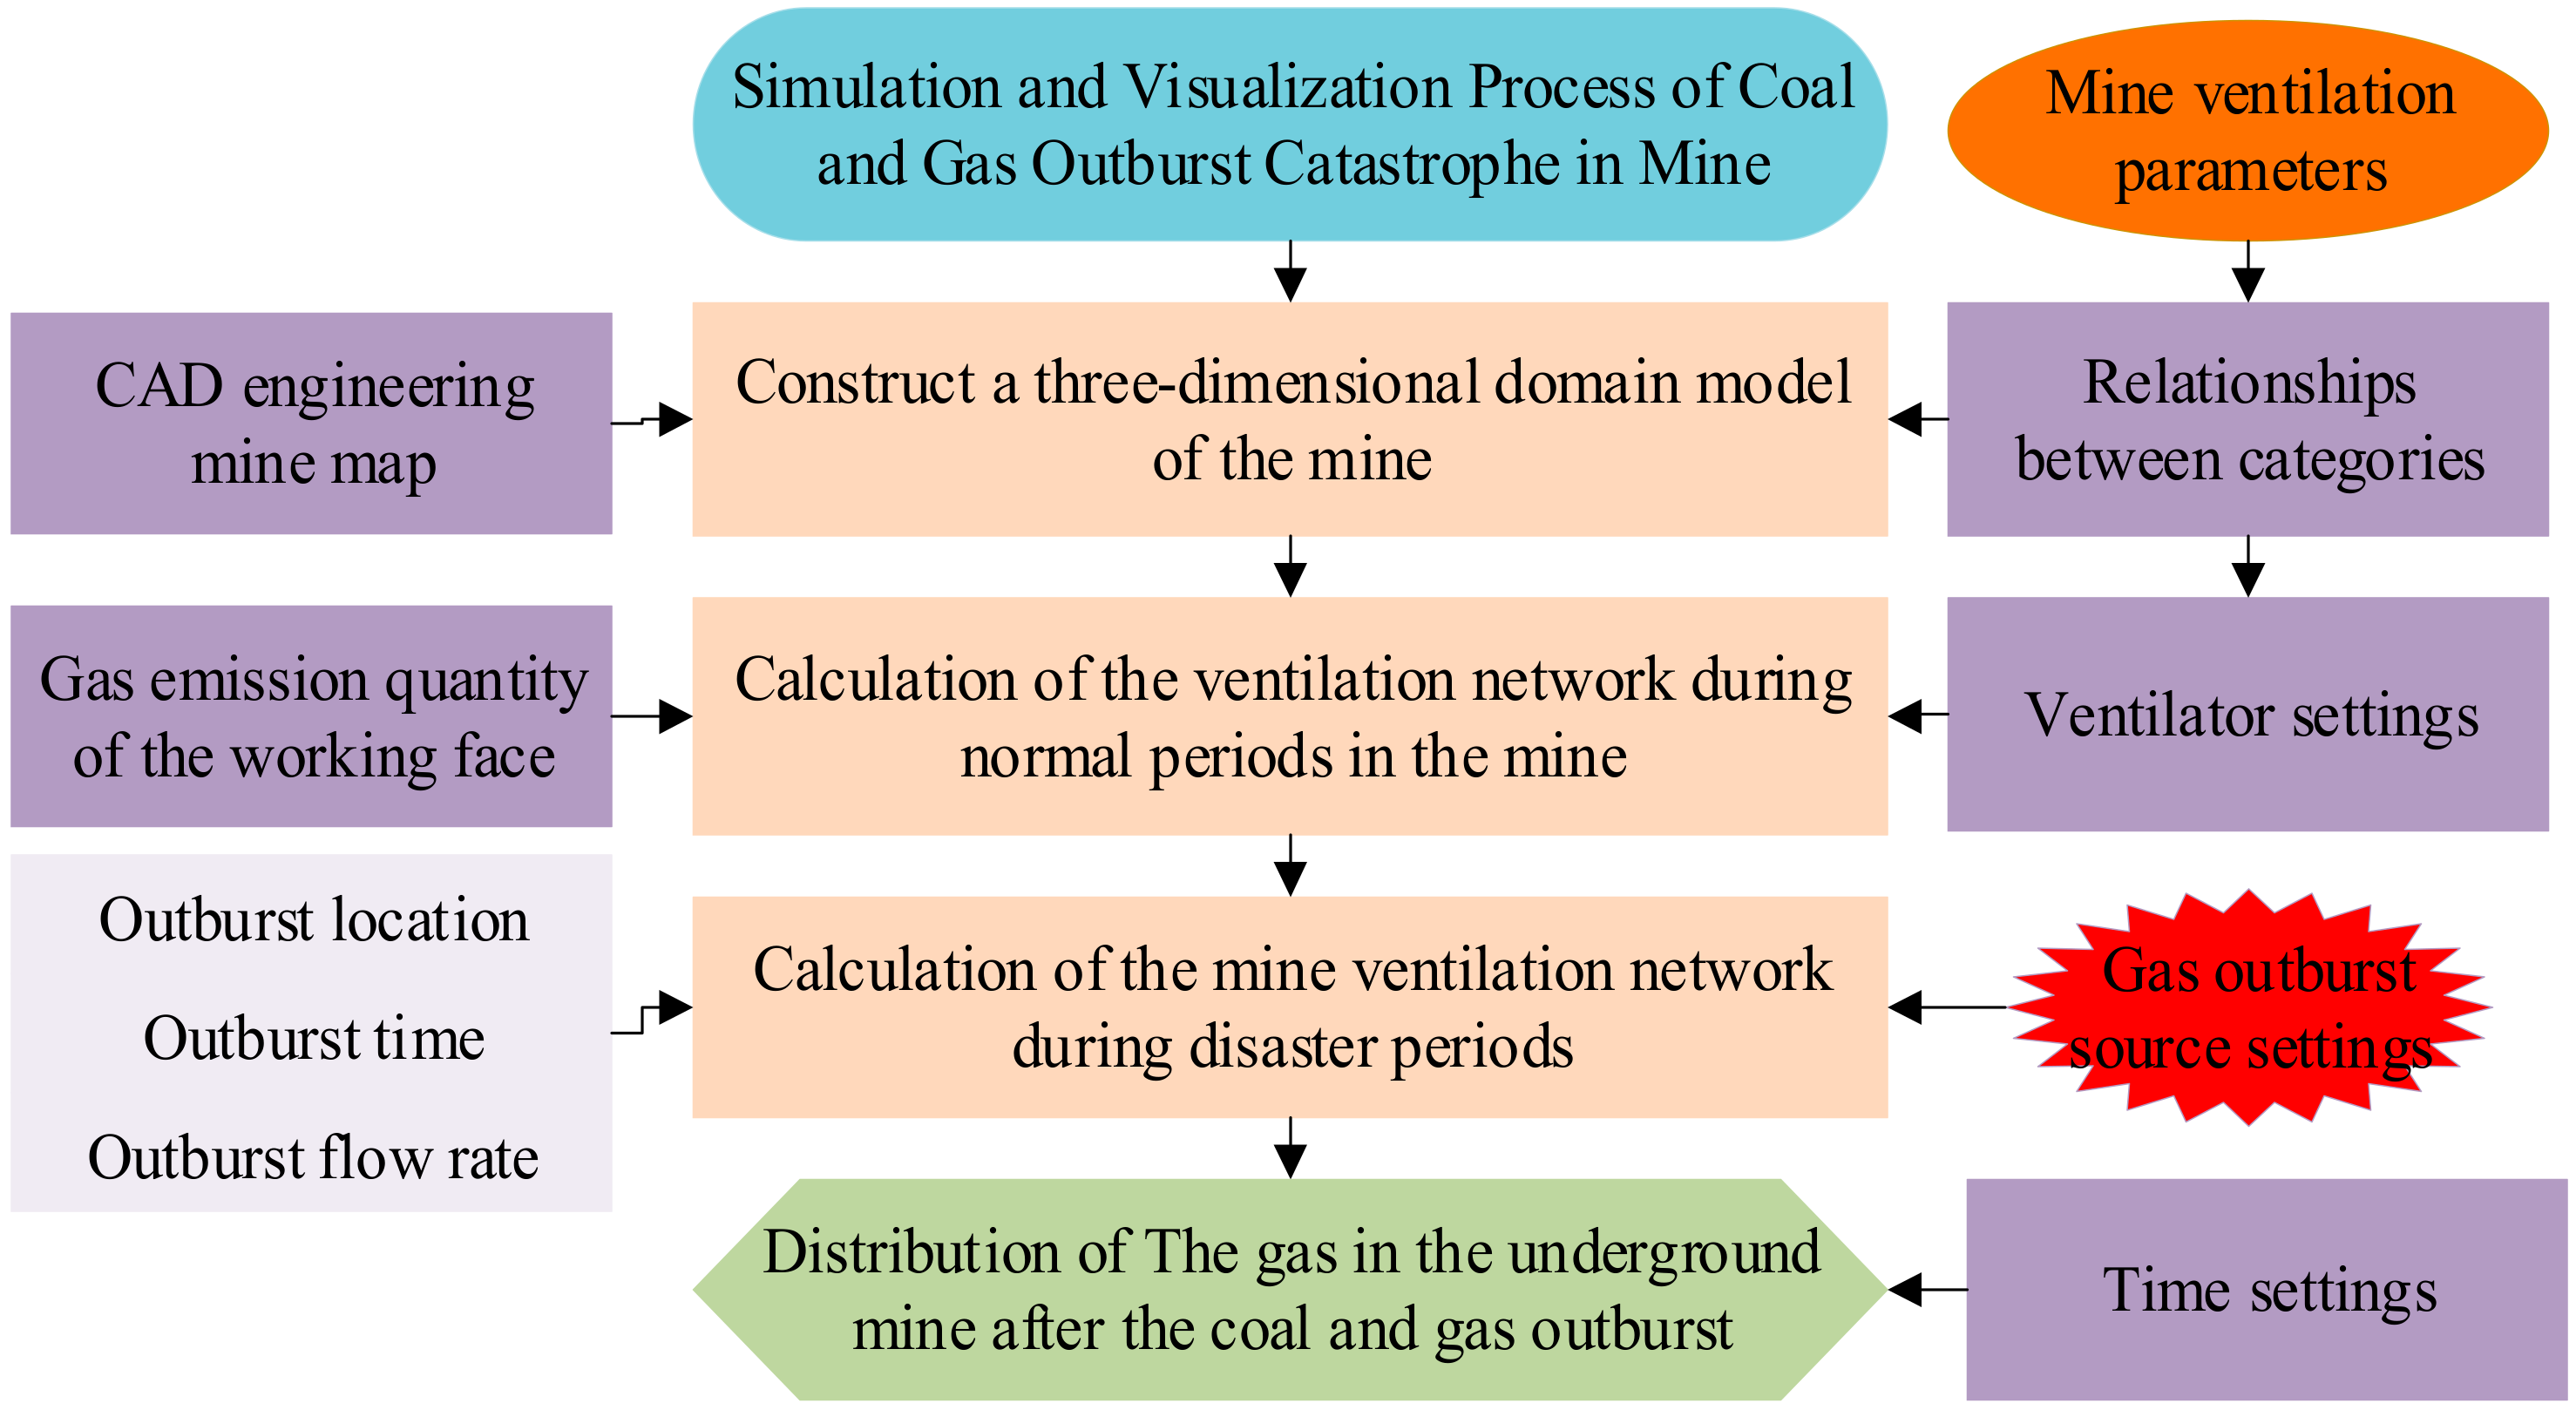
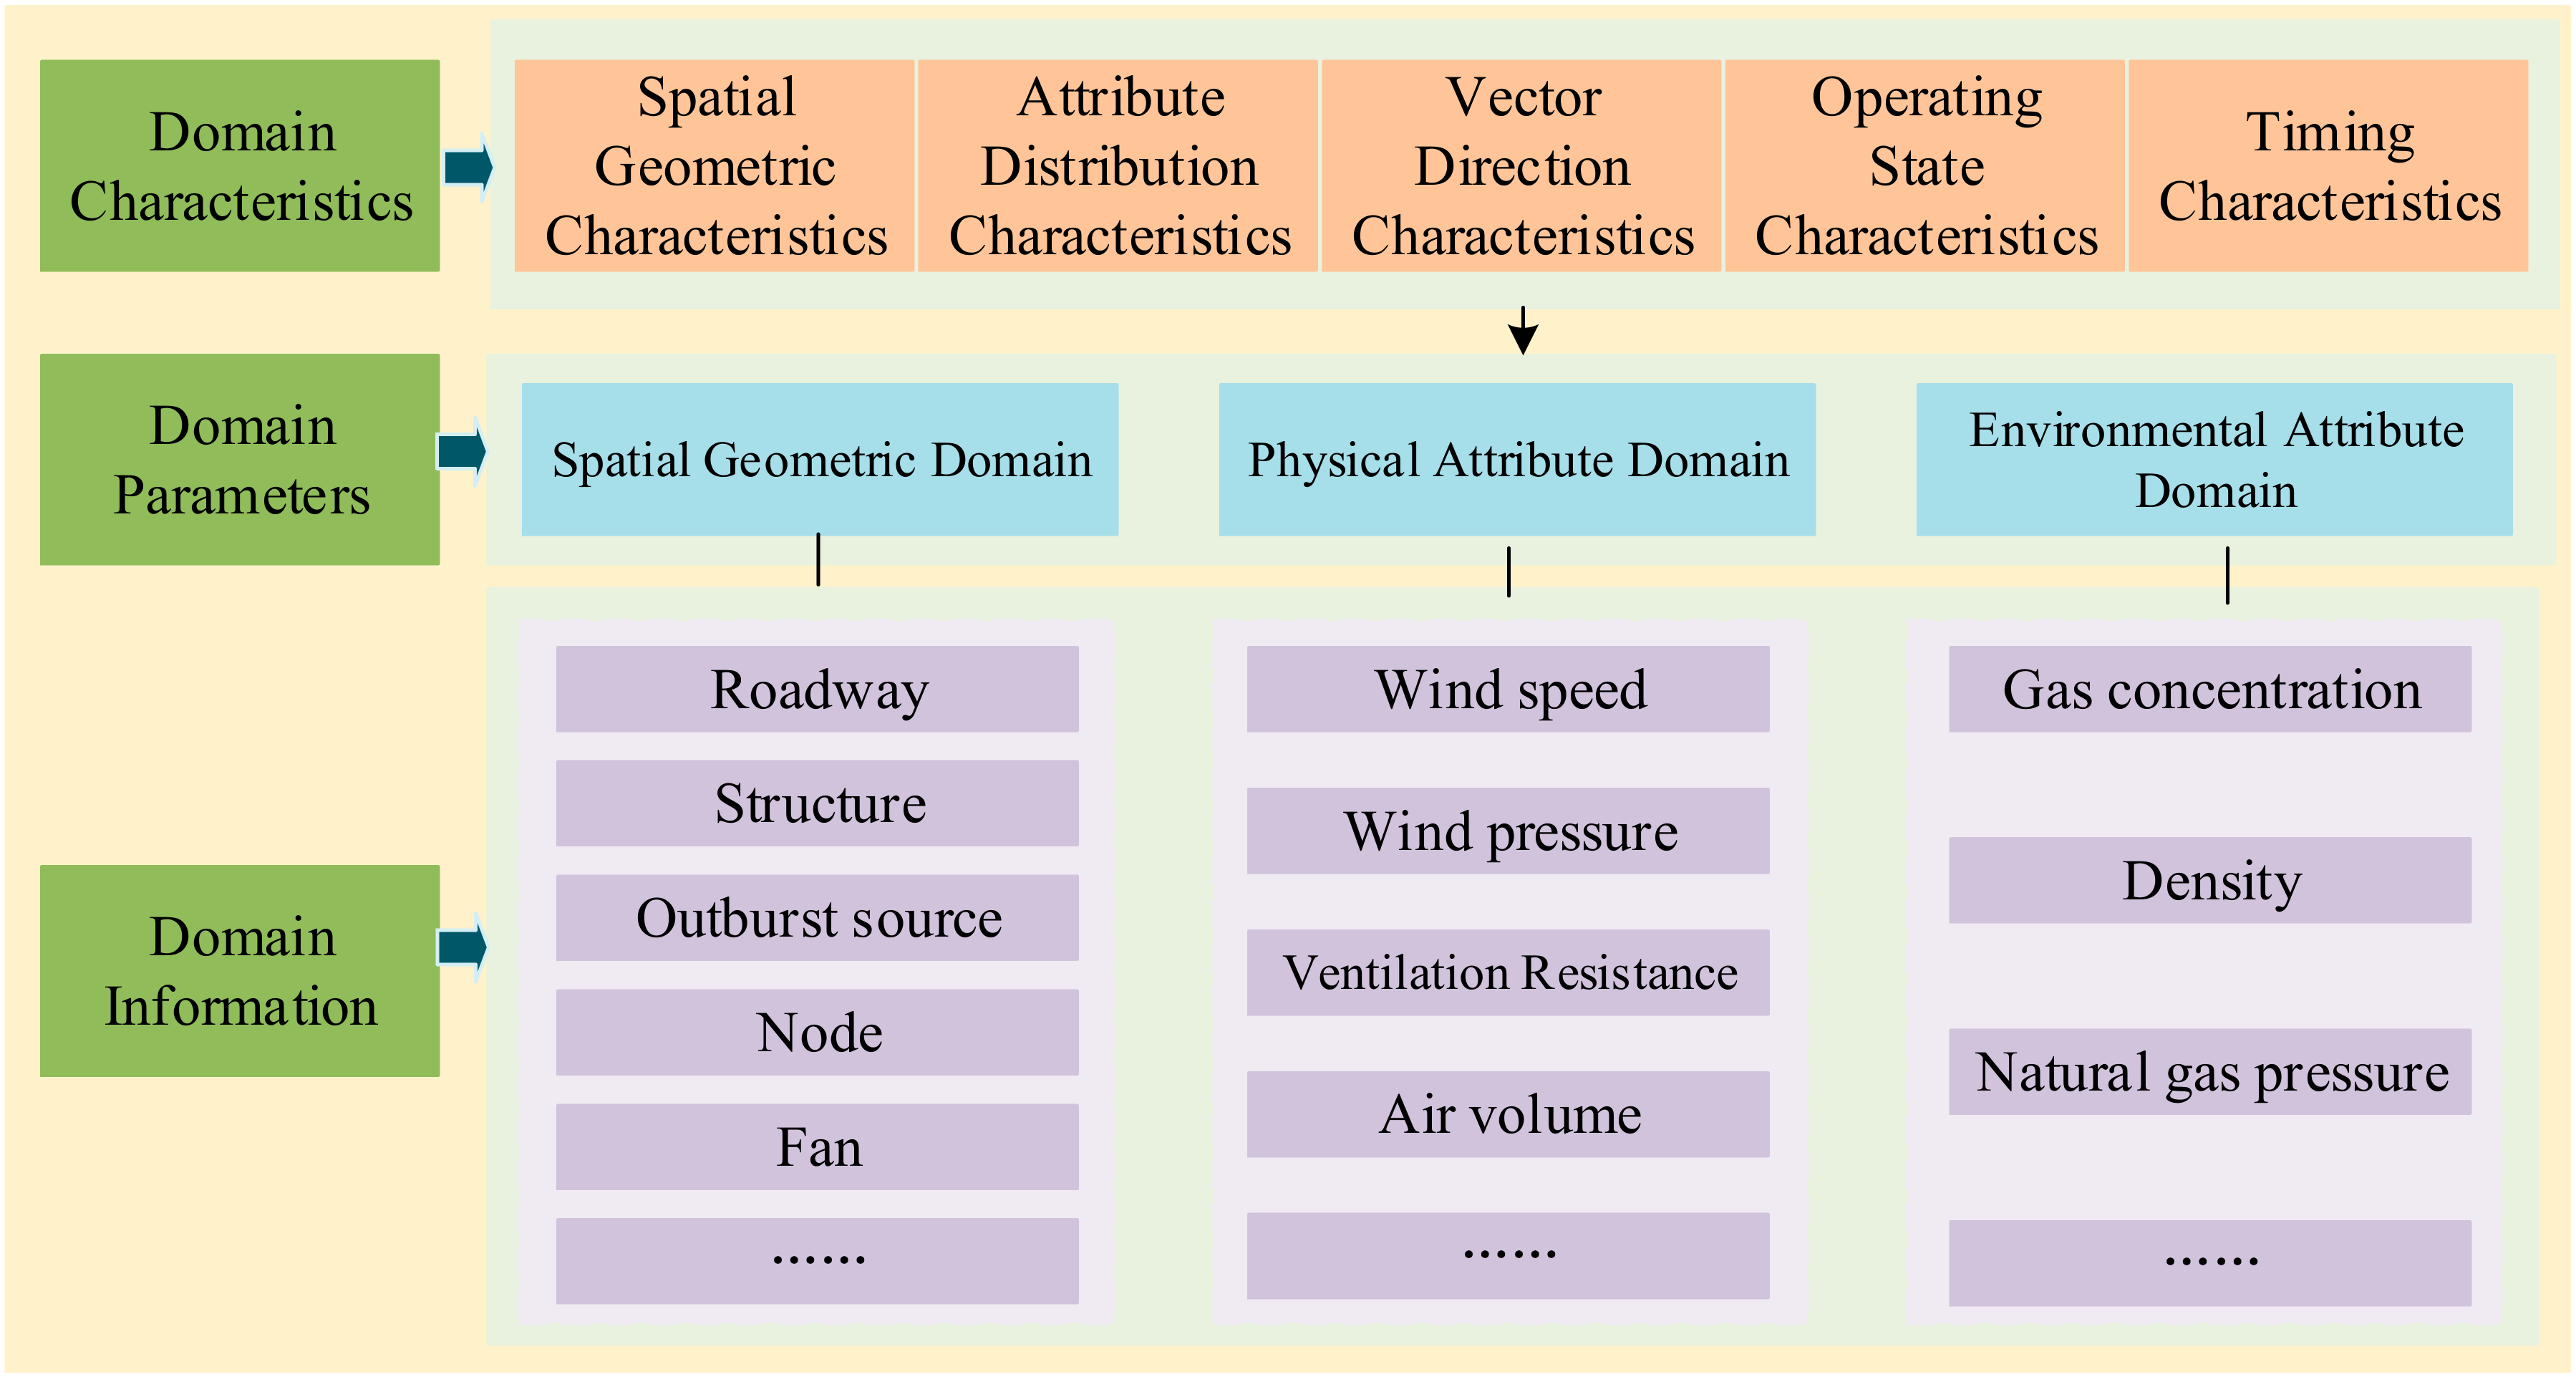
The accurate identification of spatiotemporal evolution patterns of coal–gas dynamic disasters (e.g., coal and gas outbursts) in underground mining environments constitutes a critical scientific foundation for precise gas hazard management and disaster risk mitigation. Recent advancements in computational geomechanics have established numerical simulation as a powerful methodology for predicting gas migration behavior and characterizing high-risk accumulation zones. This study developed a coupled multi-physics model integrating gas adsorption–desorption dynamics, fracture network evolution, and stress redistribution mechanisms to systematically investigate gas concentration field evolution during catastrophic outburst processes. The simulation results generated a high-resolution spatial–temporal dataset that quantitatively delineates hazardous gas distribution patterns, which serves as the scientific basis for establishing a dynamic risk assessment system that integrates monitoring and early warning mechanisms. A systematic workflow detailing the methodology framework is presented in the graphical abstract (
Figure 1), encompassing numerical modeling, risk factor extraction, and decision-support applications.
2. Materials and Methods
Based on the gas migration characteristics during the entire coal and gas outburst disaster process, the regularity of gas concentration variations in mine roadways during the disaster period and their influencing factors exhibit uncertainty characteristics. The information entropy method can, therefore, be employed to assess the hazard of gas accumulation in roadways during coal and gas outburst disasters [
27].
Information entropy (IE) measures uncertainty represented by a probability distribution function. The amount of information (attributes, features) directly correlates with its degree of uncertainty; more significant uncertainty corresponds to a more extensive information quantity. Depending on the logarithmic base (2, e, or 10), the units are expressed as bits, nats, or Hartleys, respectively.
The gas concentration is influenced by the gas emission/flow rate and roadway airflow for gas accumulation. These two factors are independent random variables in ventilated roadways. After the outburst process concludes, the migration and dispersion of gas within the roadway are predominantly governed by airflow, with relatively minor impacts from other uncertain factors [
28]. Therefore, this study focuses on the influence of roadway airflow during the disaster period on gas accumulation. Precisely, the airflow stability coefficient and the information entropy of gas concentration are calculated to quantify these effects.
2.1. Information Entropy of Gas Concentration
The information entropy H(
x) of a continuous random variable is as follows: For a one-dimensional continuous random variable
x, if its probability density function is
f(
x), then the information entropy of
x over the integration interval is given by Formula (1).
The information entropy of gas concentration H
gc(
i) can be expressed by Formula (2).
The dimensionless probability density function fi(x) describes the gas concentration distribution in the ii-th tunnel, while Hgc(i) quantifies its corresponding dimensionless information entropy.
The change in gas concentration in roadways has the characteristic of uncertainty. The more complex the mine is, the more complicated the gas concentration change in roadways across the network will be. Mathematical statistics methods can be used to analyze roadway branches’ gas concentration density function. Solving the distribution density function of a random variable from a given sample set is one of the fundamental problems in probability and statistics. The methods to solve this problem include parametric and non-parametric estimations. Kernel density estimation is a non-parametric estimation method. It was proposed by Rosenblatt (1955) and Emanuel Parzen (1962) and is also known as the Parzen window. Ruppert and Cline proposed a revised kernel density estimation method based on the clustering algorithm of the dataset density function [
29].
Kernel density estimation (KDE) employs smooth peak functions (“kernels”) to fit observed data points, thereby approximating the true probability distribution curve. Consider n independent and identically distributed (i.i.d.) samples drawn from a distribution F(x), where the probability density function (PDF) is denoted as f(x). To estimate the density value at X = x, a histogram-like approach can be adopted: select a small neighborhood around xx, count the number of samples falling within this interval, and divide by the total number of samples to obtain a robust estimate. Mathematically, by leveraging the definition of the derivative, the density function can be formulated as Equation (3):
To estimate the density function value at a point
x, let
h denote the bandwidth parameter. By defining a neighborhood [
x −
h,
x +
h] around x
x, the density value within this interval converges to the true density at x
x as
h approaches zero. Mathematically, this is expressed as Equation (4):
denotes the number of sample points within the neighborhood [
x −
h,
x +
h], where
n is the total number of samples in the dataset, and
f(
x) represents the estimated probability density function. By averaging the density values over this neighborhood, the density function value at x
x, denoted as
f(
x), is obtained. Rewriting the expression in Equation (4) yields Equation (5):
where
, and
K(•) is the kernel function. The integral of the density function is given by Equation (6):
This leads to the property described by Equation (7):
Therefore, as long as the integral of K(x) equals 1, the estimated density function f(x) is guaranteed to satisfy the normalization condition ∫f(x)dx = 1. Given a sample set, the problem of estimating the density function of a random variable is reduced to the selection of an appropriate kernel function K (·). The performance of the kernel density estimation—its accuracy and smoothness—depends critically on two factors: (1) the choice of the kernel function K (·), and (2) the optimal determination of the bandwidth parameter h.
For kernel density estimation (KDE) curves involving multiple data points, the final shape of the KDE curve is largely independent of the specific choice of the kernel function due to the superposition of adjacent waveform peaks. For computational convenience in waveform synthesis, the Gaussian curve (normal distribution curve) is commonly adopted as the kernel function in KDE. In this context, we apply the Gaussian kernel function to the kernel density estimation model, transforming Equation (6) into Equation (8):
The accuracy of the kernel density estimator is determined by two factors: the choice of the kernel function and the bandwidth parameter
h. When the bandwidth is fixed, different kernel functions exhibit comparable influence on the estimation results. However, once the kernel function is specified, the selection of
h critically governs the smoothness of the estimated density curve. To optimize the trade-off between bias and variance, the mean integrated squared error (MISE) criterion is employed to derive the optimal bandwidth
h. This is achieved by minimizing the following expression:
Let f(x) denote the true population density. The mean integrated squared error (MISE), defined as a function of the bandwidth h, is minimized to derive the optimal bandwidth estimate.
Under the Gaussian kernel assumption, if the unknown probability density function
f(
x) is also hypothesized to follow a Gaussian distribution, the bandwidth
h can be analytically determined.
Once the kernel function is selected, the kernel density estimation (KDE) model is fully defined. By substituting h into Equation (8), the estimation error of the model can be quantified.
For gas explosion risk assessment, the gas concentration is constrained to the interval [0.05, 0.15], corresponding to the gas explosion limits. Under the premise of a coal and gas outburst disaster, the probability of the gas concentration falling within the regulatory range [
Cmin,
Cmax] can be calculated using the KDE model. Specifically, the probability is given by
2.2. Roadway Air Volume Stability Coefficient
The mine ventilation system can be represented as a network structure G(
V,
E) [
30], where the node set of the system is
V = {
v1,
v2,…,
vm}, and the branch set is
E = {
e1, e
2,…, e
n}. Here,
m denotes the number of nodes, and
n represents the number of roadway branches. Changes in the network structure of the ventilation system, along with variations in roadway air resistance, collectively reflect unstable factors in the system. During a coal and gas outburst disaster, numerical simulations can obtain the airflow variations in all roadway branches within the ventilation system over the disaster duration. For the
i-th roadway, the airflow during the entire coal and gas outburst disaster is denoted as
qi = {
qi1,
qi2,
qik…,
qim}, where
m represents the simulation duration of the disaster. Consequently, the total airflow in the ventilation system is the collection of airflow from all roadways. The roadway airflow stability coefficient represents the airflow ratio before and after air resistance changes to represent the airflow deviation. Therefore, during a coal and gas outburst disaster, the airflow deviation of the
i-th roadway at time
k is given by Equation (12).
In the formula,
qik is the airflow in the i-th roadway at time k, in m3/s;
qi0 is the initial airflow in the i-th roadway (i.e., under normal ventilation conditions), in m3/s;
δik(q) is the dimensionless airflow deviation of the i-th roadway at time k.
Therefore, the airflow stability of each roadway is determined by its stability at any given moment. Numerical simulation analysis revealed that during a disaster, airflow variations in the branches of the ventilation system are highly complex. The airflow stability coefficients of each roadway across all time steps often fall outside the interval [0, 1]. To perform unified data analysis on the airflow of all roadways and derive the airflow stability coefficient for each roadway over the disaster period, the following approach is adopted: (1) Independent variable treatment: Roadway branches in the ventilation system are treated as independent variables. (2) Fuzzy clustering analysis: A fuzzy clustering analysis method is applied to process the dataset.
Dimensionless normalization: The data are normalized to eliminate dimensional differences.
Unified dimensional framework: The influence of roadway airflow on gas concentration accumulation is analyzed under consistent metrics.
For a ventilation system with n classified roadway branches, each branch feature δi (e.g., airflow deviation) comprises m raw data points: δi = {δi1, δi2, δik, …, δim}, where these data points are referred to as the elements of this feature.
To statistically characterize these data, compute the mean value of the dataset, as shown in Equation (13). The standard deviation of the dataset is calculated as shown in Equation (14).
Using Equation (15), compute the standardized value of the data:
Next, apply extremum normalization to the above result using Equation (16):
In the equations,
is the mean value of airflow deviation for the i-th roadway branch, dimensionless;
Si is the standard deviation of airflow deviation for the i-th roadway branch, dimensionless;
δik is the dimensionless standardized value of airflow deviation for the i-th roadway at time k, dimensionless;
δik′′ is the extremum-normalized value of airflow deviation for the i-th roadway at time k, dimensionless;
δi′min is the minimum value of airflow deviation for the i-th roadway, dimensionless;
δi′max is the maximum value of airflow deviation for the i-th roadway, dimensionless.
Therefore, during a coal and gas outburst disaster, the influence of airflow in the underground ventilation system on gas accumulation risk, i.e., the airflow stability coefficient
θi(
q), is expressed by Equation (17):
In the equation,
E(δi″) is the expected value (mean) of the extremum-normalized airflow deviation for the i-th roadway, dimensionless;
θi(q) is the airflow stability coefficient of the i-th roadway, dimensionless.
During a coal and gas outburst disaster, θi(q) serves as the impact factor reflecting how roadway airflow variations influence gas concentration. The larger the value of θi(q), the more turbulent the airflow changes in the roadway, indicating heightened instability and potential gas accumulation hazards.
2.3. Analysis of Gas Accumulation Risk in Roadways Based on Analytic Hierarchy Process
Although information entropy can characterize uncertainty, its independence assumption exhibits limitations in practical complex systems. It is necessary to integrate multi-factor weight allocation methods. This study employs the analytic hierarchy process (AHP) to construct a dynamic risk assessment model. The AHP has been widely applied in engineering risk evaluation fields as a multi-criteria decision-making tool. Establishing hierarchical structure models and conducting consistency checks effectively addresses multi-objective weight allocation issues [
31]. Meanwhile, information entropy theory demonstrates unique advantages in uncertainty quantification and data dispersion analysis, which can compensate for the limitations of subjective weighting.
Based on the disaster mechanism of coal and gas outbursts, the air volume stability coefficient and gas concentration information entropy are key factors leading to disasters.
By integrating AHP weights with information entropy methods and extracting indicator data from disaster simulation results at different time points, the dynamic risk index (DRI) formula is established as follows:
In the formula, α and β denote the weight coefficients of the airflow stability coefficient and gas concentration information entropy, respectively, which are defined as dimensionless parameters.
To facilitate further analysis, the risk levels are categorized based on DRI values, as shown in
Table 1 below.
The analytic hierarchy process (AHP) is employed to determine the weight coefficients, with the following specific steps:
Step 1: Construct the judgment matrix.
Based on expert judgment, pairwise comparisons are conducted to evaluate the relative importance between the airflow stability coefficient
θi(
q) and the gas concentration information entropy
Hgc(
i), thereby forming the following judgment matrix:
Step 2: Calculate the weight vector.
The weight vector is derived using the following geometric mean method:
(1) Compute the geometric mean of elements in each row:
(2) Normalize the geometric means to obtain subjective weights:
After calculation, the weight coefficients are determined as α = 0.6, β = 0.4.
(3) Calculate the consistency ratio (CR).
The order of the matrix is n = 2. According to the formula CI = , find the average random consistency index (RI). When n = 2, RI = 0.
According to the formula CR = , we obtain CR = . Since the denominator is 0, which is meaningless, in practical applications, when n = 2, the judgment matrix always has perfect consistency. In this case, since CR = 0 is less than 0.1, it indicates that the judgment matrix has satisfactory consistency. So, the consistency ratio (CR) calculated according to the given judgment matrix meets the consistency requirements.
We used the analytic hierarchy process (AHP) to determine the separation values of the weighting factors. Firstly, a team of experts with rich experience in this field was formed, consisting of five professors in mining safety and three chief field engineers. Subsequently, according to their professional knowledge and experience, pairwise comparisons of different factors were conducted, and scores were assigned using the 1–9 scale method. Then, we constructed the judgment matrix and determined the weights of each factor by calculating the eigenvectors and eigenvalues of the matrix. After the consistency check (the consistency ratio was CR = 0 < 0.1, indicating good consistency), the following separation values for the weighting factors were finally determined: the weight of the air volume stability coefficient was 0.6, and the weight of the gas concentration information entropy was 0.4. This division not only conforms to the coupled roles of the two in disaster dynamics (the former represents gas dilution efficiency, while the latter represents the degree of disaster escalation), but also verifies the predictive effectiveness of the weighting system using historical field data.
2.4. Case Study Overview
This study took the coal and gas outburst accident at the Qunli Coal Mine in Nayong County, Guizhou Province on 8 November 2007, as a case study [
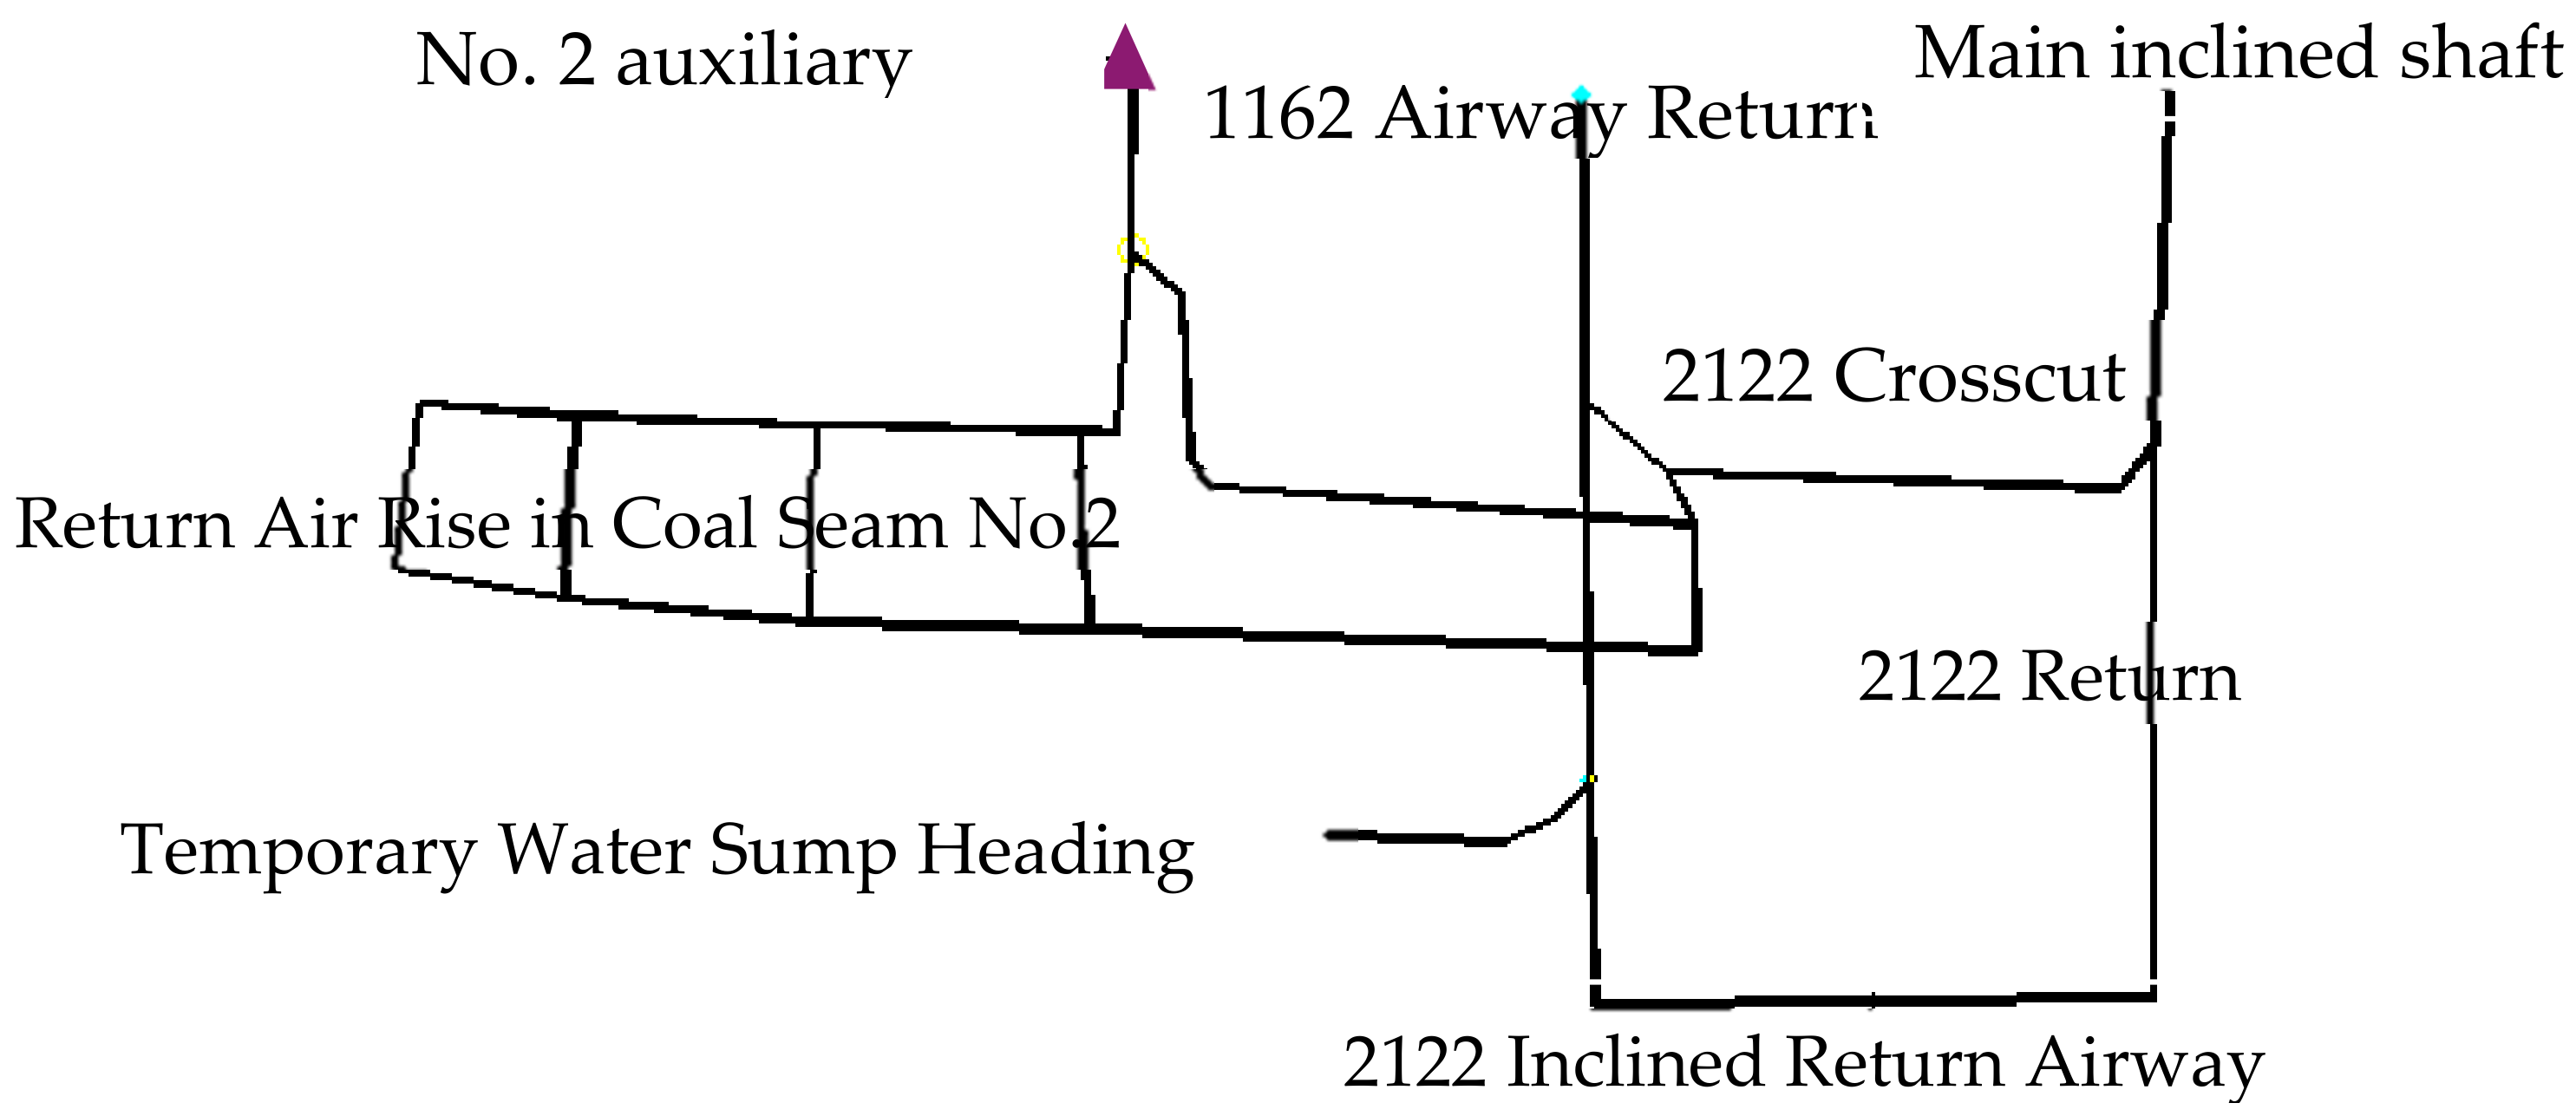
32]. In Xiongbi Town, Shizong County, Qujing City, Yunnan Province, the Qunli Coal Mine employed inclined shaft development with three mining levels and two mining districts (south and north wings) connected via the 1780-level haulage roadway. As shown in
Figure 2, the mine adopted a central boundary ventilation system, with air intake through the No. 2 Auxiliary Shaft and Main Inclined Shaft and return airflow via the South Wing Boundary Ventilation Shaft using exhaust ventilation. The BD-II-6-No18 fan, operated at 740 r/min, delivered a 19.48 m
3/s airflow with 2.18 m
3/s external leakage, generating 211.23 Pa ventilation pressure against a natural ventilation pressure of −32.63 Pa.
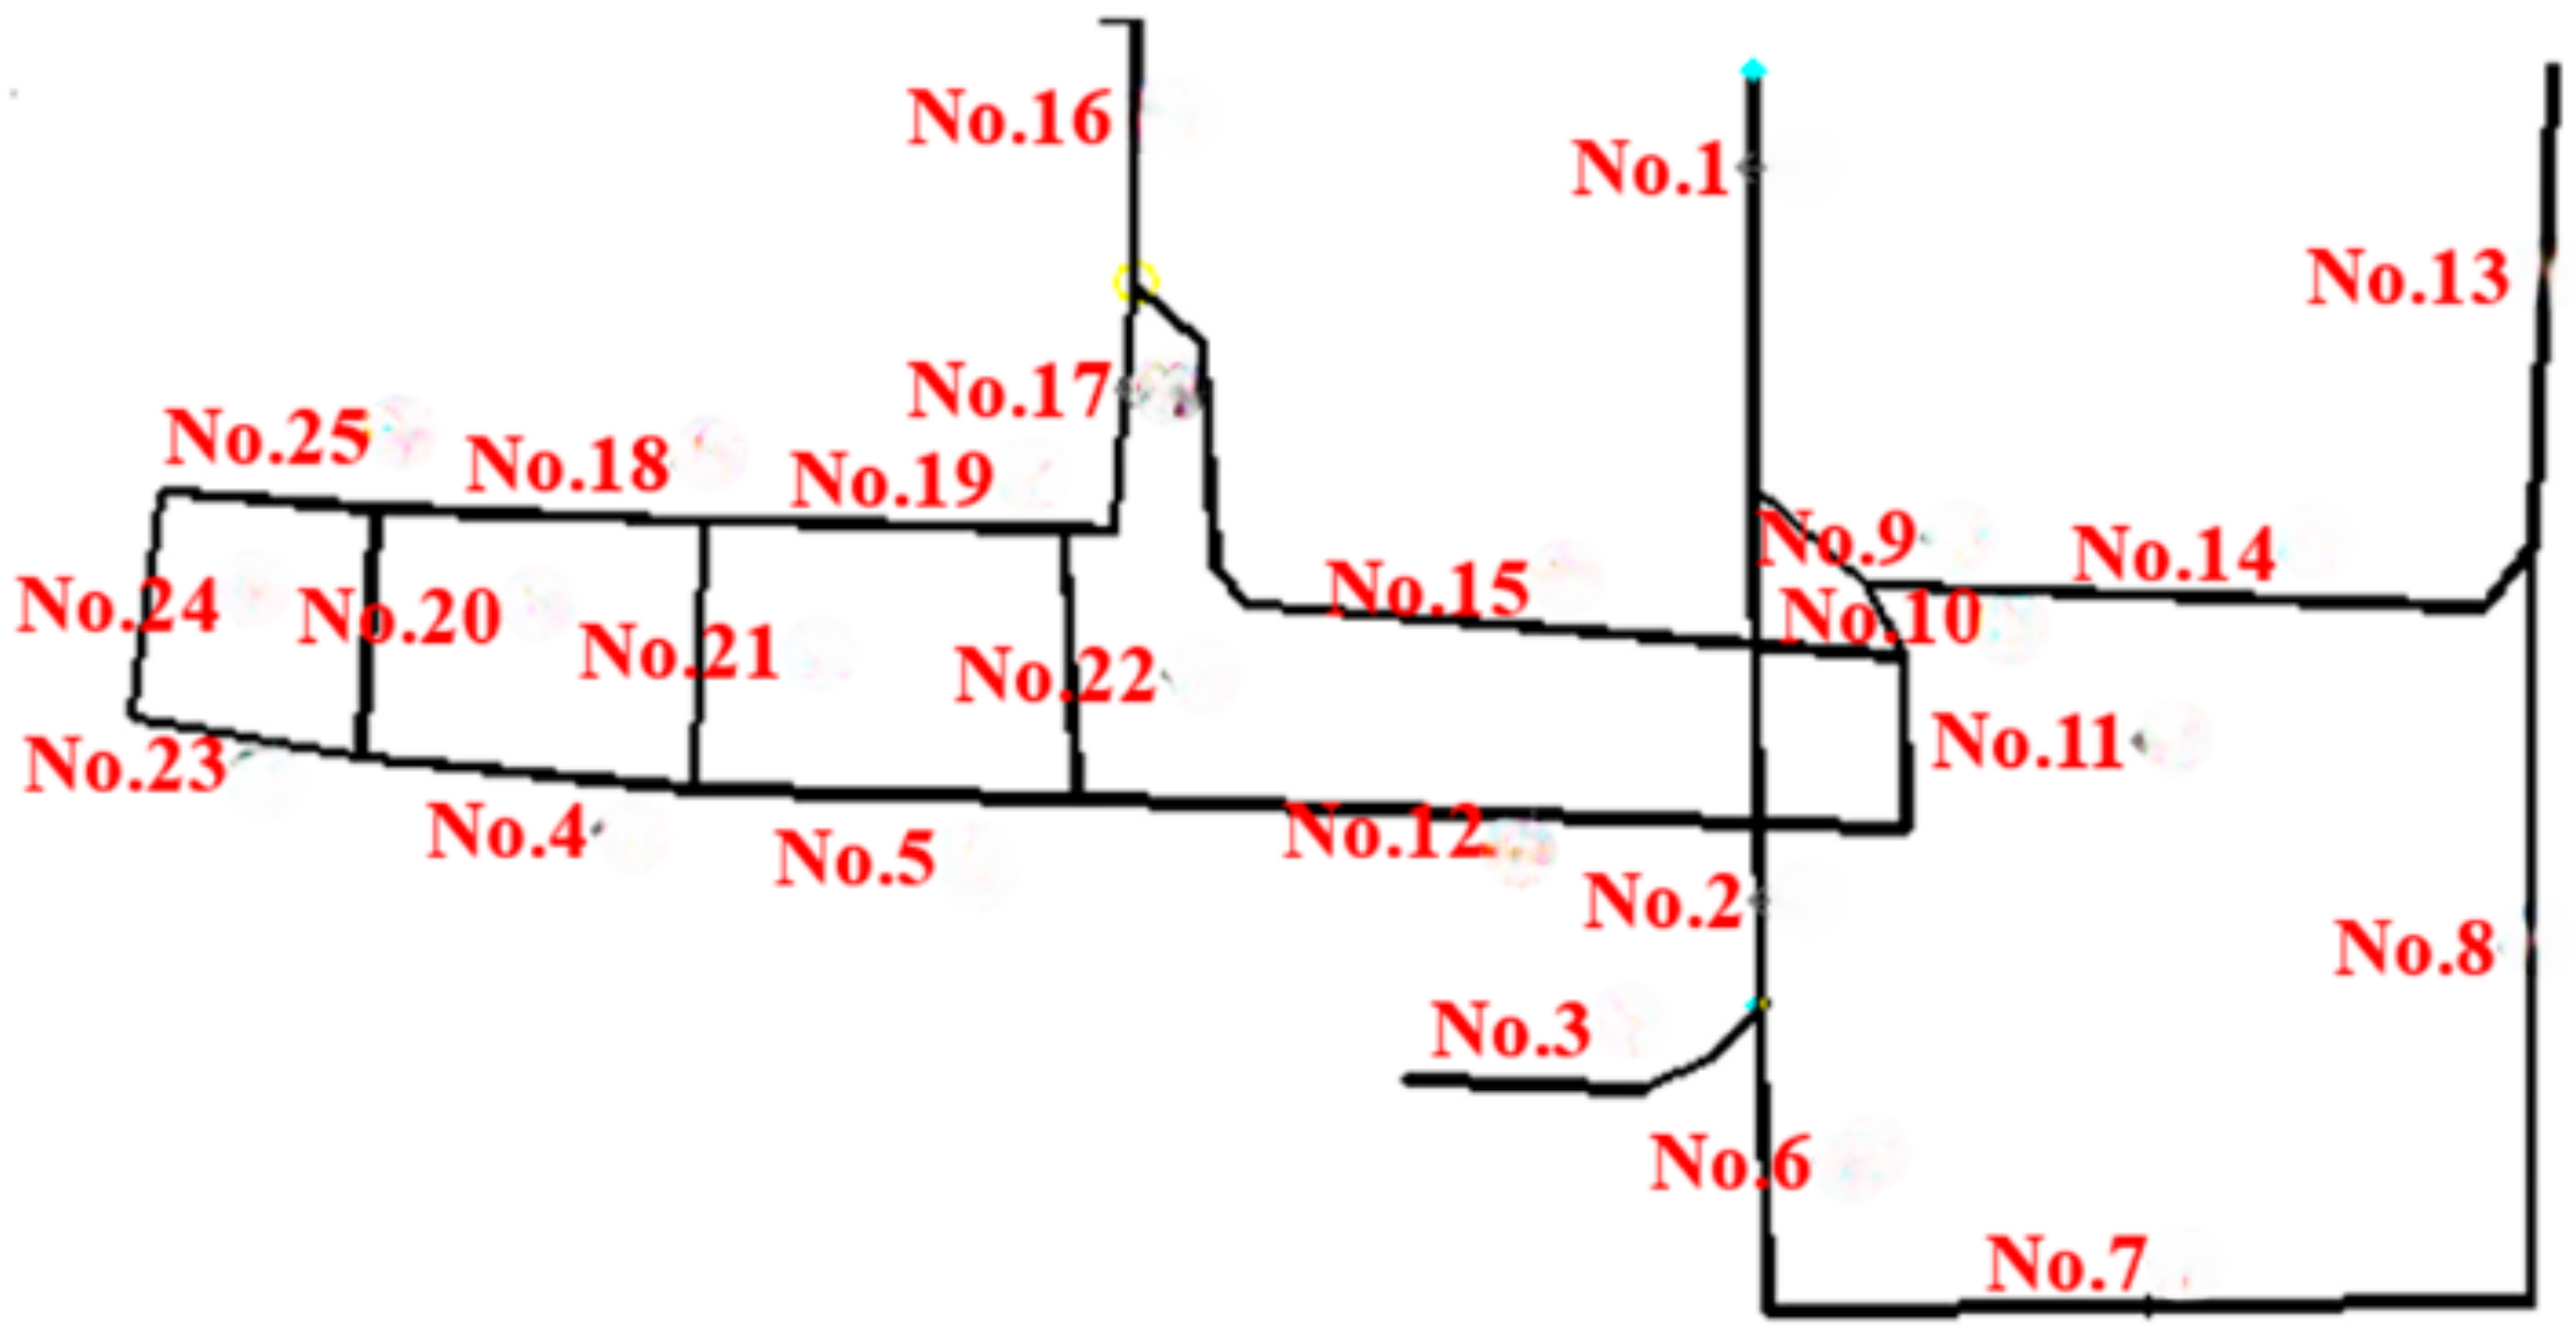
Figure 3 presents a simplified ventilation network diagram of the mine.
At 13:43 on 8 November 2007, a coal and gas outburst occurred at the temporary sump excavation face in the central section of the Second Mining District, ejecting approximately 500 tons of coal and 49,000 m3 of gas. The accident resulted in 35 fatalities and 7 injuries. This privately owned mine, designed with an annual production capacity of 300,000 tons, commenced construction in early 2001 and began operation in March 2005. Preliminary analysis indicated that the direct cause was outburst induction by blasting operations during the 7 m advancement of the temporary sump. The post-accident investigation revealed gas backflow phenomena extending approximately 600 m along the main adit. The backflow forced open two airlock doors in the 2122 crosscut and reached intake shaft openings. As the outburst intensity diminished and gas emission decreased due to gradual desorption from surrounding coal seams, the backflow velocity reduced from 14.98 m/s to 13 m/s.
The fundamental roadway dimensions and ventilation parameters (friction resistance coefficients) of the Qunli Coal Mine were systematically measured, as detailed in
Table 2. The table comprehensively documents critical parameters, including the roadway name, geometry type (cross-sectional shape), support structure, cross-sectional area (m
2), perimeter (m), length (m), and the Atkinson resistance coefficient (N·s
2/m
4).
Following the coal and gas outburst at the Qunli Coal Mine, which propagated throughout the entire mining system, a comprehensive statistical analysis of gas concentration dynamics across all operational zones was conducted, with the quantified results systematically presented in
Table 3.
4. Discussion
As a complex dynamic disaster, coal and gas outburst has seen, in recent years, data-driven approaches—especially machine learning methods—emerge as powerful tools for nonlinear systems [
38,
39]. Wu et al. [
40] designed a coal mine safety risk index analysis system based on big data. Through multisource data fusion, this system implements a safety situation awareness and analysis platform for coal mines and establishes a risk assessment indicator system and a two-level risk assessment model. Li Shuang et al. [
41] proposed a prediction model based on the improved grey wolf optimizer–support vector machine (IGWO-SVM), aiming to improve the accuracy of coal and gas outburst risk prediction. This study introduces a new dynamic risk assessment framework by integrating the analytic hierarchy process (AHP) and information entropy, addressing the limitations of static methods in coal and gas outburst accidents. The framework is elaborated in the three following aspects:
(1) Comparison with Actual Disaster Data
According to experimental records,
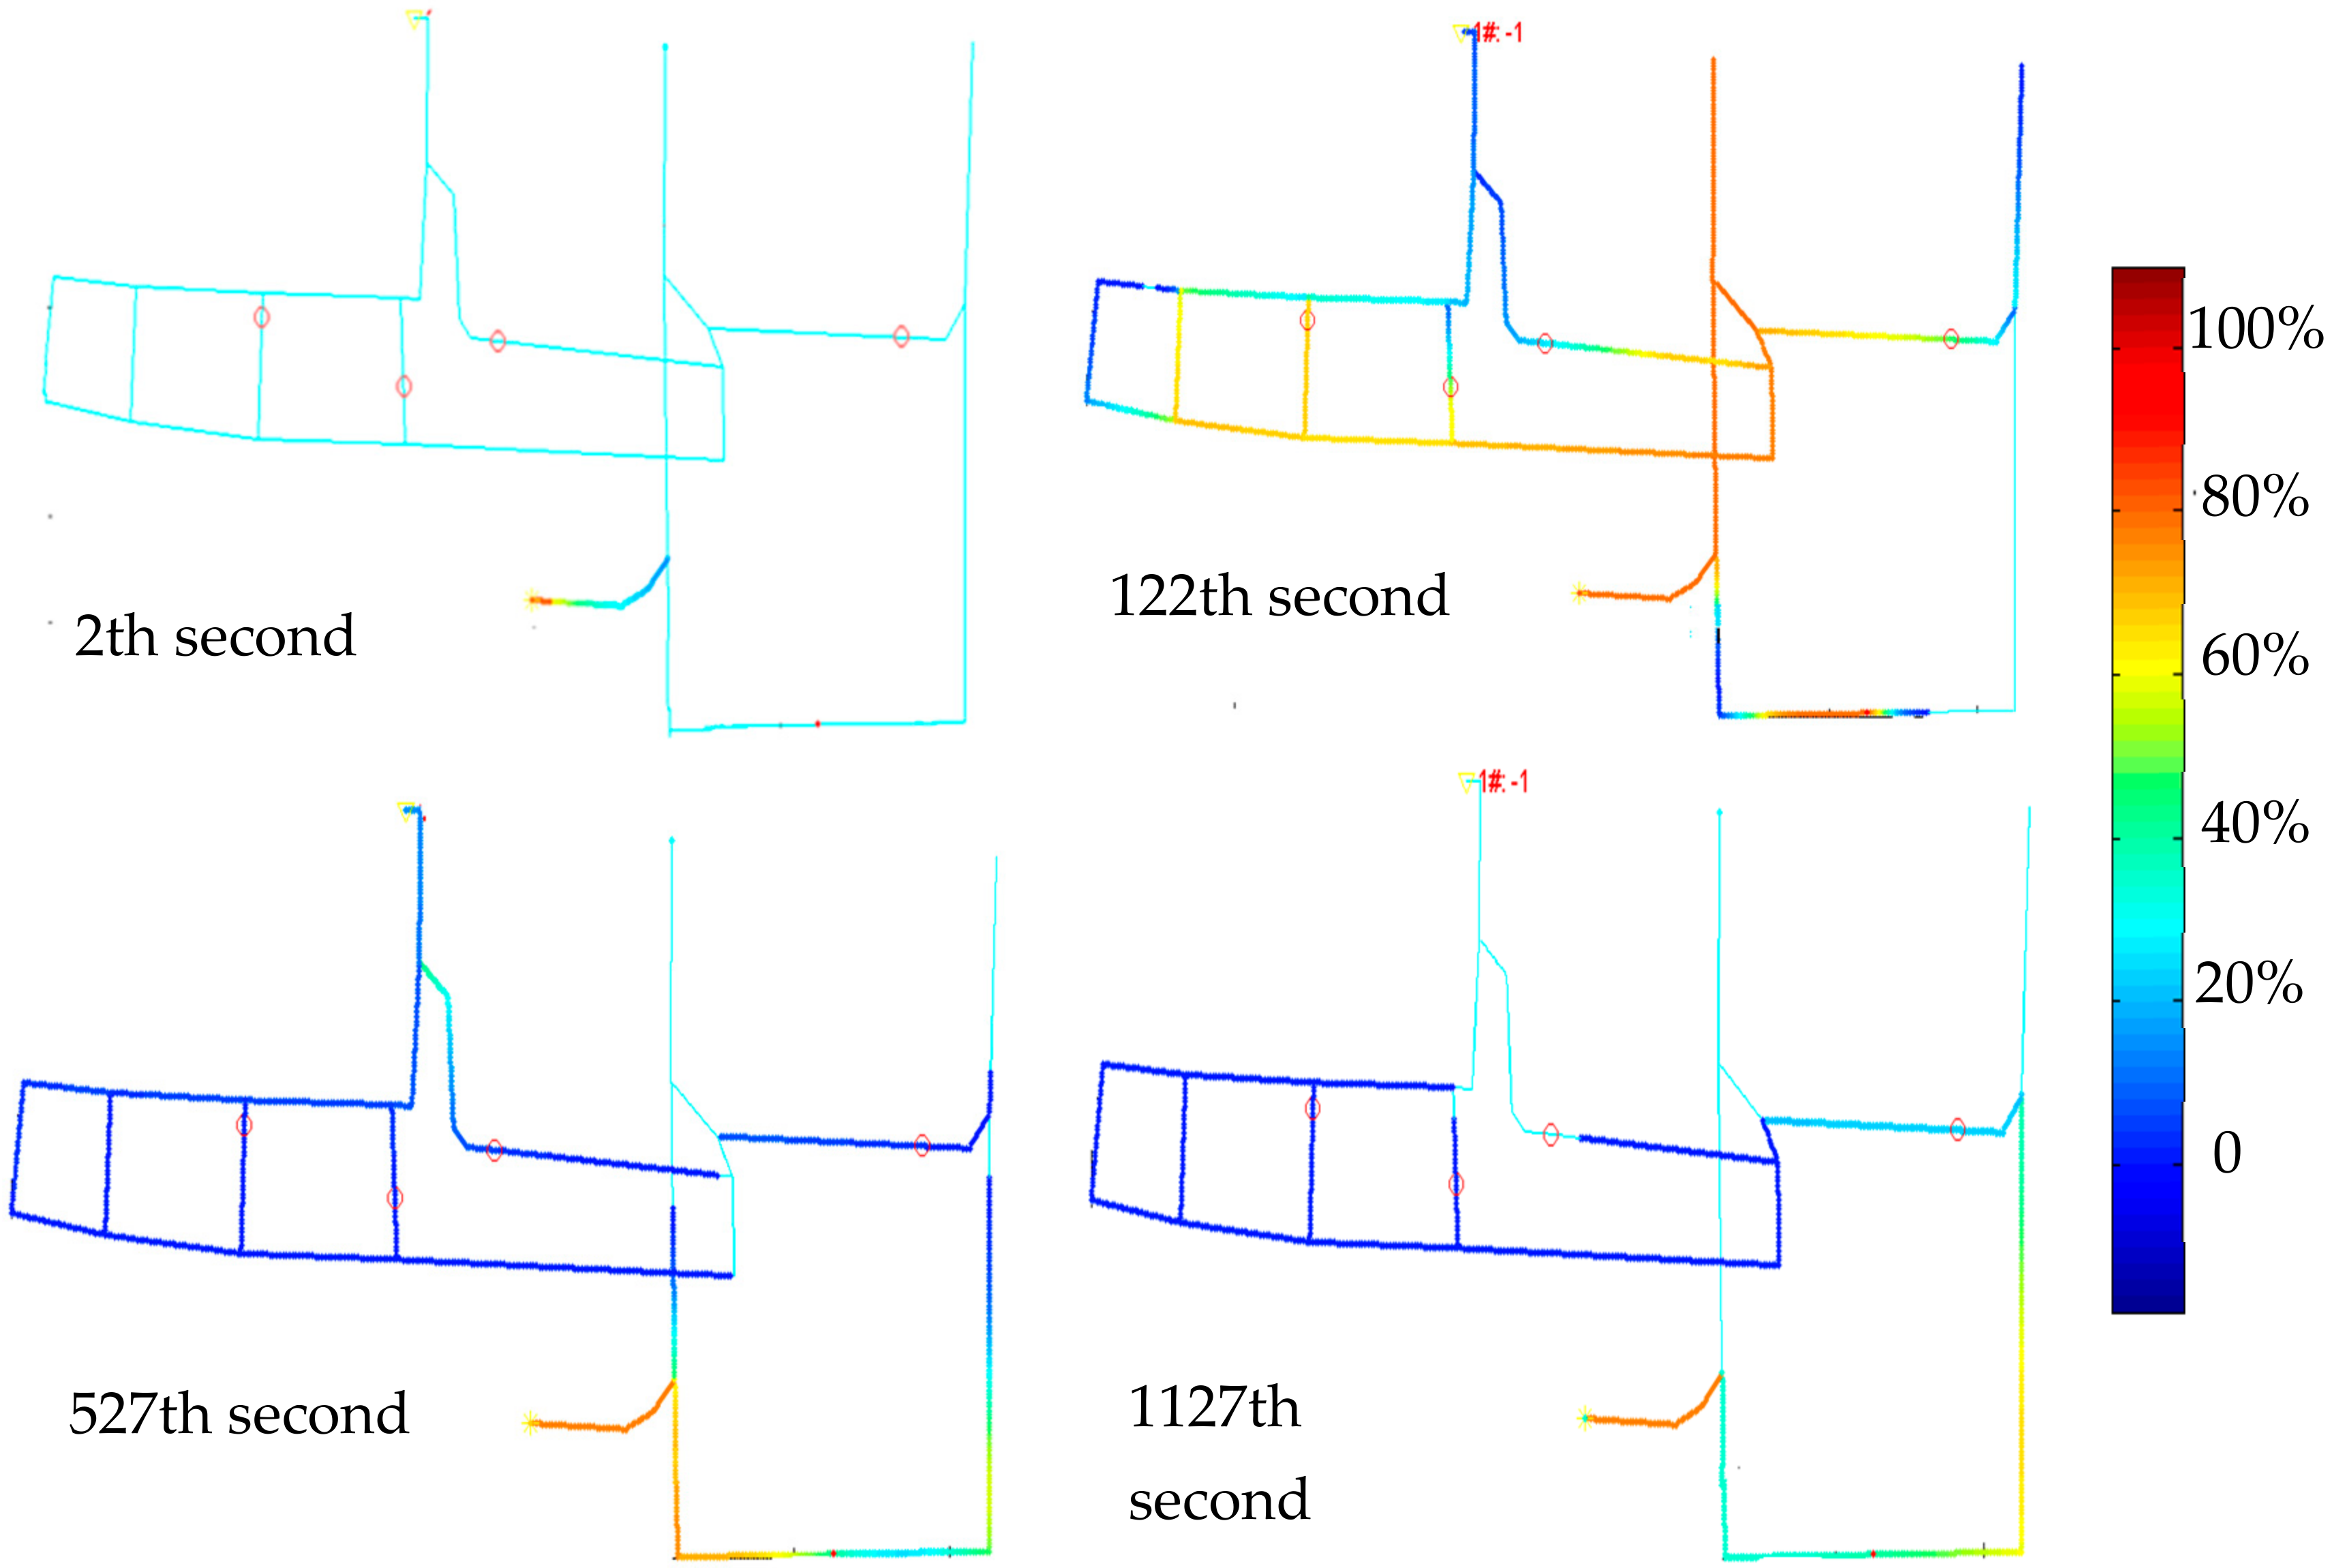
Table 3 lists gas concentration data from Qunli Coal Mine roadways after the accident. The accident involved gas reverse flow primarily in the main adit, with a reverse flow distance of approximately 600 m. As shown in the figure below, the roadway experienced negative wind speed at 2 s, which ceased after ventilation resumed at 44 s. The concentration variation curve indicates that during the simulation, gas diffused into the roadway, reaching a maximum concentration of 41.4729% at 1526 s. This demonstrates that the accident simulation accurately reproduced the actual accident scenario.
(2) Correlation Analysis of Air Volume Stability Coefficient and Gas Accumulation Information Entropy
To further analyze whether the air volume stability coefficient and gas accumulation information entropy independently affect the dynamic risk index during disaster periods, a correlation verification between the two factors was conducted. Pearson’s correlation coefficient was used to determine their linear relationship. Pearson’s correlation coefficient (Pearson’s
r) is a statistical measure quantifying the strength of linear correlation between two variables, ranging from −1 to 1. A value of 1 indicates perfect positive correlation, −1 indicates perfect negative correlation, and 0 indicates no linear correlation. The Pearson’s
r was calculated as follows:
The air volume stability coefficient and gas accumulation information entropy data from
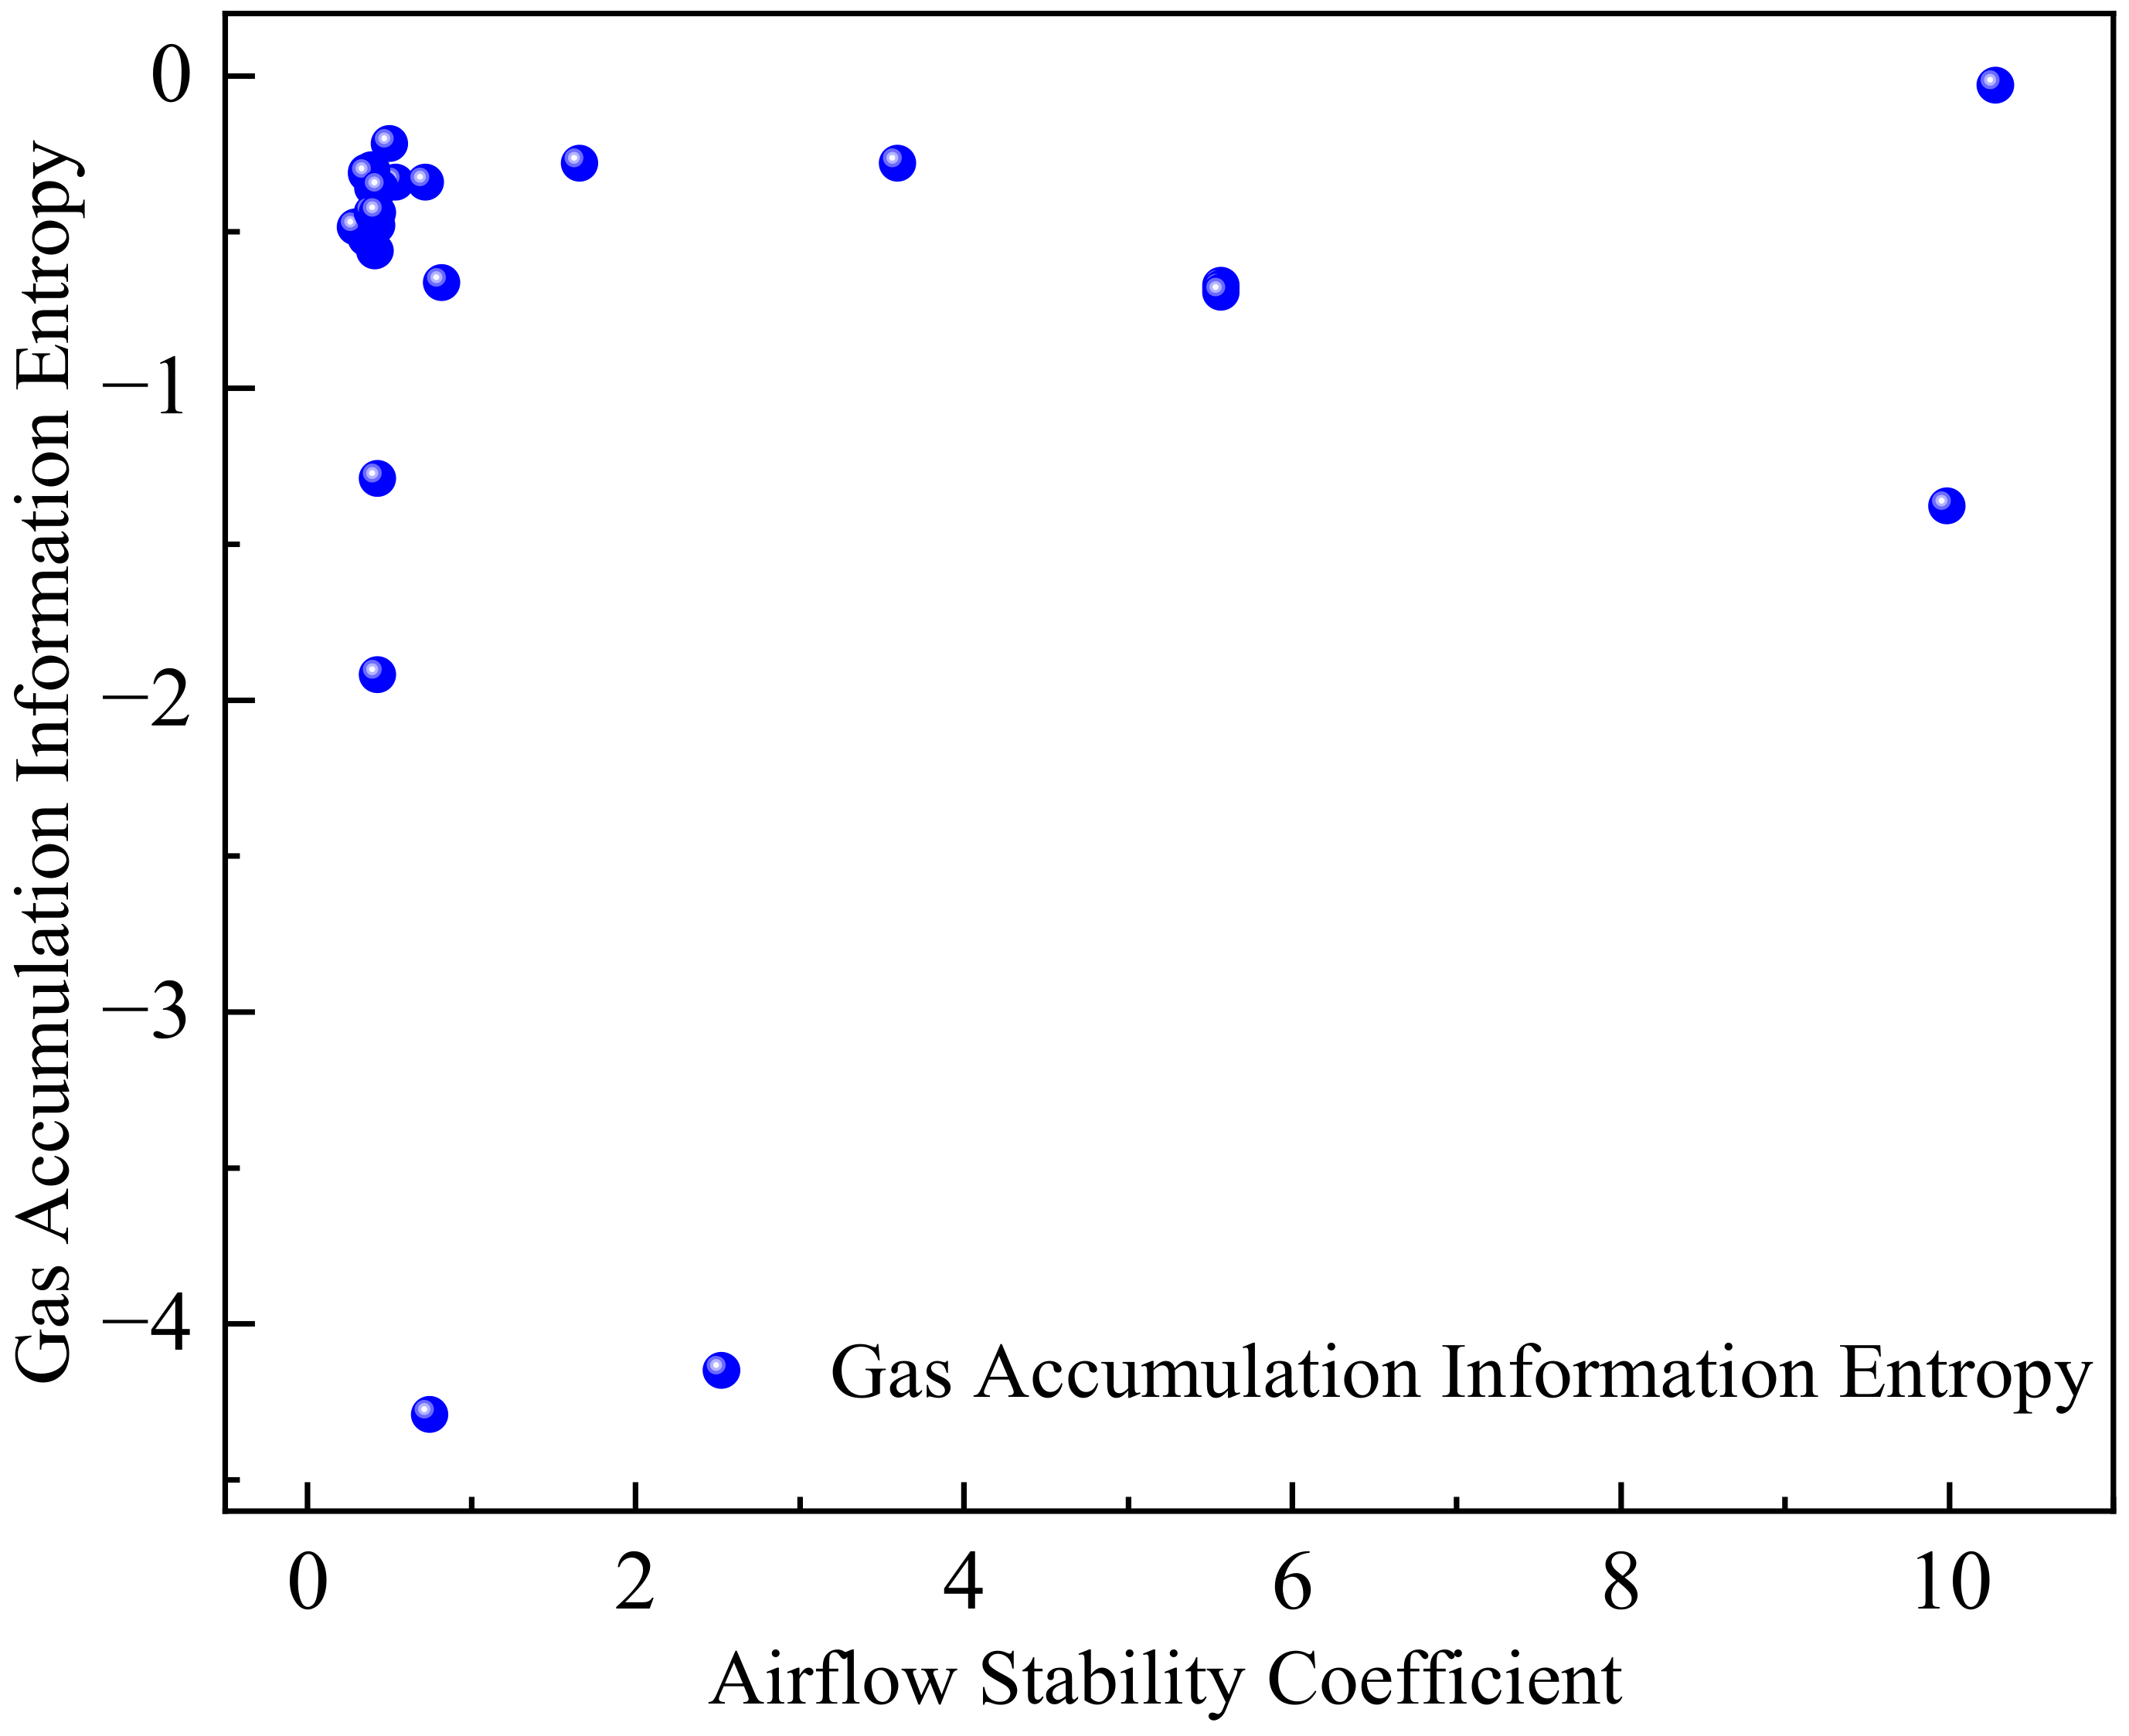
Table 5 were substituted into the formula, resulting in a Pearson’s correlation coefficient of 0.215. Given that Pearson’s r ≈ 0.215 (close to 0), the results indicate a very weak linear correlation between the two variables. With 23 degrees of freedom and a significance level of 0.05, the critical value from the table is approximately 0.396. Since |r| = 0.215 < 0.396, there is no significant correlation between the air volume stability coefficient and gas accumulation information entropy. Furthermore, a scatter plot (
Figure 8) was generated, with the horizontal axis representing the air volume stability coefficient and the vertical axis representing gas accumulation information entropy. The data points exhibit a random distribution, ruling out any nonlinear relationship.
(3) Application of Analytic Hierarchy Process-Information Entropy Method in Mine Monitoring
The analytic hierarchy process (AHP)–information entropy method can be applied to dynamically assess gas accumulation during disaster periods. Based on the dynamic risk index, preset thresholds for the ventilation system are established and integrated with mine monitoring systems to optimize early warning measures. Changes in information entropy can reflect real-time dynamic characteristics of gas concentration in mines, providing mine managers with real-time risk assessment data to facilitate timely prevention and control actions. Through data collection, accident simulation, information entropy calculation, and hazard assessment, mines can achieve real-time monitoring and accurate prediction of gas concentration variations, enabling timely early warnings and optimized prevention measures.


