Article

Fractal Characteristics and Influencing Factors of Pore Structure in Tight Sandstone: A Case Study from Chang 6 Member of the Southwestern Yishan Slope

1
State Key Laboratory of Continental Evolution and Early Life, Department of Geology, Northwest University, Xi’an 710069, China
2
Oil Production Plant No. 2, Petrochina Changqing Oilfield Company, Qingyang 745100, China
3
Oil Production Plant No. 9, Petrochina Changqing Oilfield Company, Yinchuan 750001, China
*
Author to whom correspondence should be addressed.
Processes 2025, 13(4), 988; https://doi.org/10.3390/pr13040988
Submission received: 4 March 2025 / Revised: 12 March 2025 / Accepted: 17 March 2025 / Published: 26 March 2025
(This article belongs to the Section Energy Systems)

Abstract

:
Fractal dimension analysis provides a quantitative approach to characterizing the heterogeneity of pore structures in reservoirs. In this study, casting thin sections, scanning electron microscopy (SEM), and high-pressure mercury intrusion porosimetry (MIP) were integrated with fractal theory to determine the fractal dimensions of different pore types and investigate the controlling factors of reservoir pore structure heterogeneity. This study identifies three primary pore types—residual intergranular, dissolution, and intergranular pores—and classifies the reservoir into three distinct types based on their mercury intrusion curves and pore-throat radius distributions. The fractal analysis of pore structures reveals three segments corresponding to macropores, mesopores, and transition pores, with average fractal dimensions of 2.28, 3.67, and 2.43, respectively. Furthermore, the overall fractal dimensions for Type I, II, and III reservoirs are 2.69, 2.72, and 2.92, indicating an increasing trend in heterogeneity from Type I to Type III. The fractal dimension shows a negative correlation with reservoir properties, median pore-throat radius, maximum mercury saturation, and the content of quartz and feldspar, while it is positively correlated with displacement pressure. No significant correlation is observed with clay mineral content. These findings offer valuable insights into the heterogeneity of reservoir pore structures and provide a basis for evaluating reservoir quality.

1. Introduction

As China’s exploration and development of oil and natural gas resources advance, identifying tight sandstone oil and gas has become a significant exploration direction [1]. The Ordos Basin, one of China’s largest sedimentary basins, is located on the western side of the North China Craton. It is an edge sag basin rich in oil and natural gas resources. The southwestern part of the Yishan Slope structural unit in the Ordos Basin contains relatively high-quality tight sandstone oil and gas resources [2,3]. However, the pore structure of tight sandstones is a key factor controlling fluid storage and migration in reservoirs. Its complexity and irregularity directly affect the physical properties of the reservoir and development outcomes.
In 1982, Mandelbrot systematically introduced the fundamental concepts of fractal geometry, providing a theoretical framework for describing the irregular and complex structures found in nature [4,5]. In the 1990s, fractal theory was progressively applied to the study of rock and porous media pore structures. Researchers began utilizing techniques such as the box-counting method to extract self-similar characteristics from experimental images and scanning data, leading to the establishment of power-law relationships for pore size distributions [6,7,8,9]. With the development of experimental techniques such as mercury injection, nuclear magnetic resonance (NMR), and CT scanning in the early 21st century, scholars started integrating fractal theory with empirical data [10,11,12,13]. Around 2010, studies by researchers like Cai et al. employed numerical simulations—including computational fluid dynamics (CFD) and the lattice Boltzmann method—to analyze fluid flow and capillary phenomena in pore structures [14,15]. Furthermore, the work by Yang Xiaoming combined electrical imaging well logging data with fractal dimension analysis to quantitatively differentiate between dissolution pores, intergranular pores, and fracture-type reservoirs in carbonate rocks [16,17,18].
Therefore, this study focuses on the tight sandstone of the Chang 6 Member in the southwestern part of the Yishan Slope in the Ordos Basin. By employing casting thin sections, scanning electron microscopy, high-pressure mercury injection, and other experiments, and integrating fractal theory, the study quantitatively characterizes the pore structure characteristics of the rock. It aims to identify the controlling factors of fractal dimensions, providing a theoretical basis for evaluating the storage and permeability of tight sandstone reservoirs.

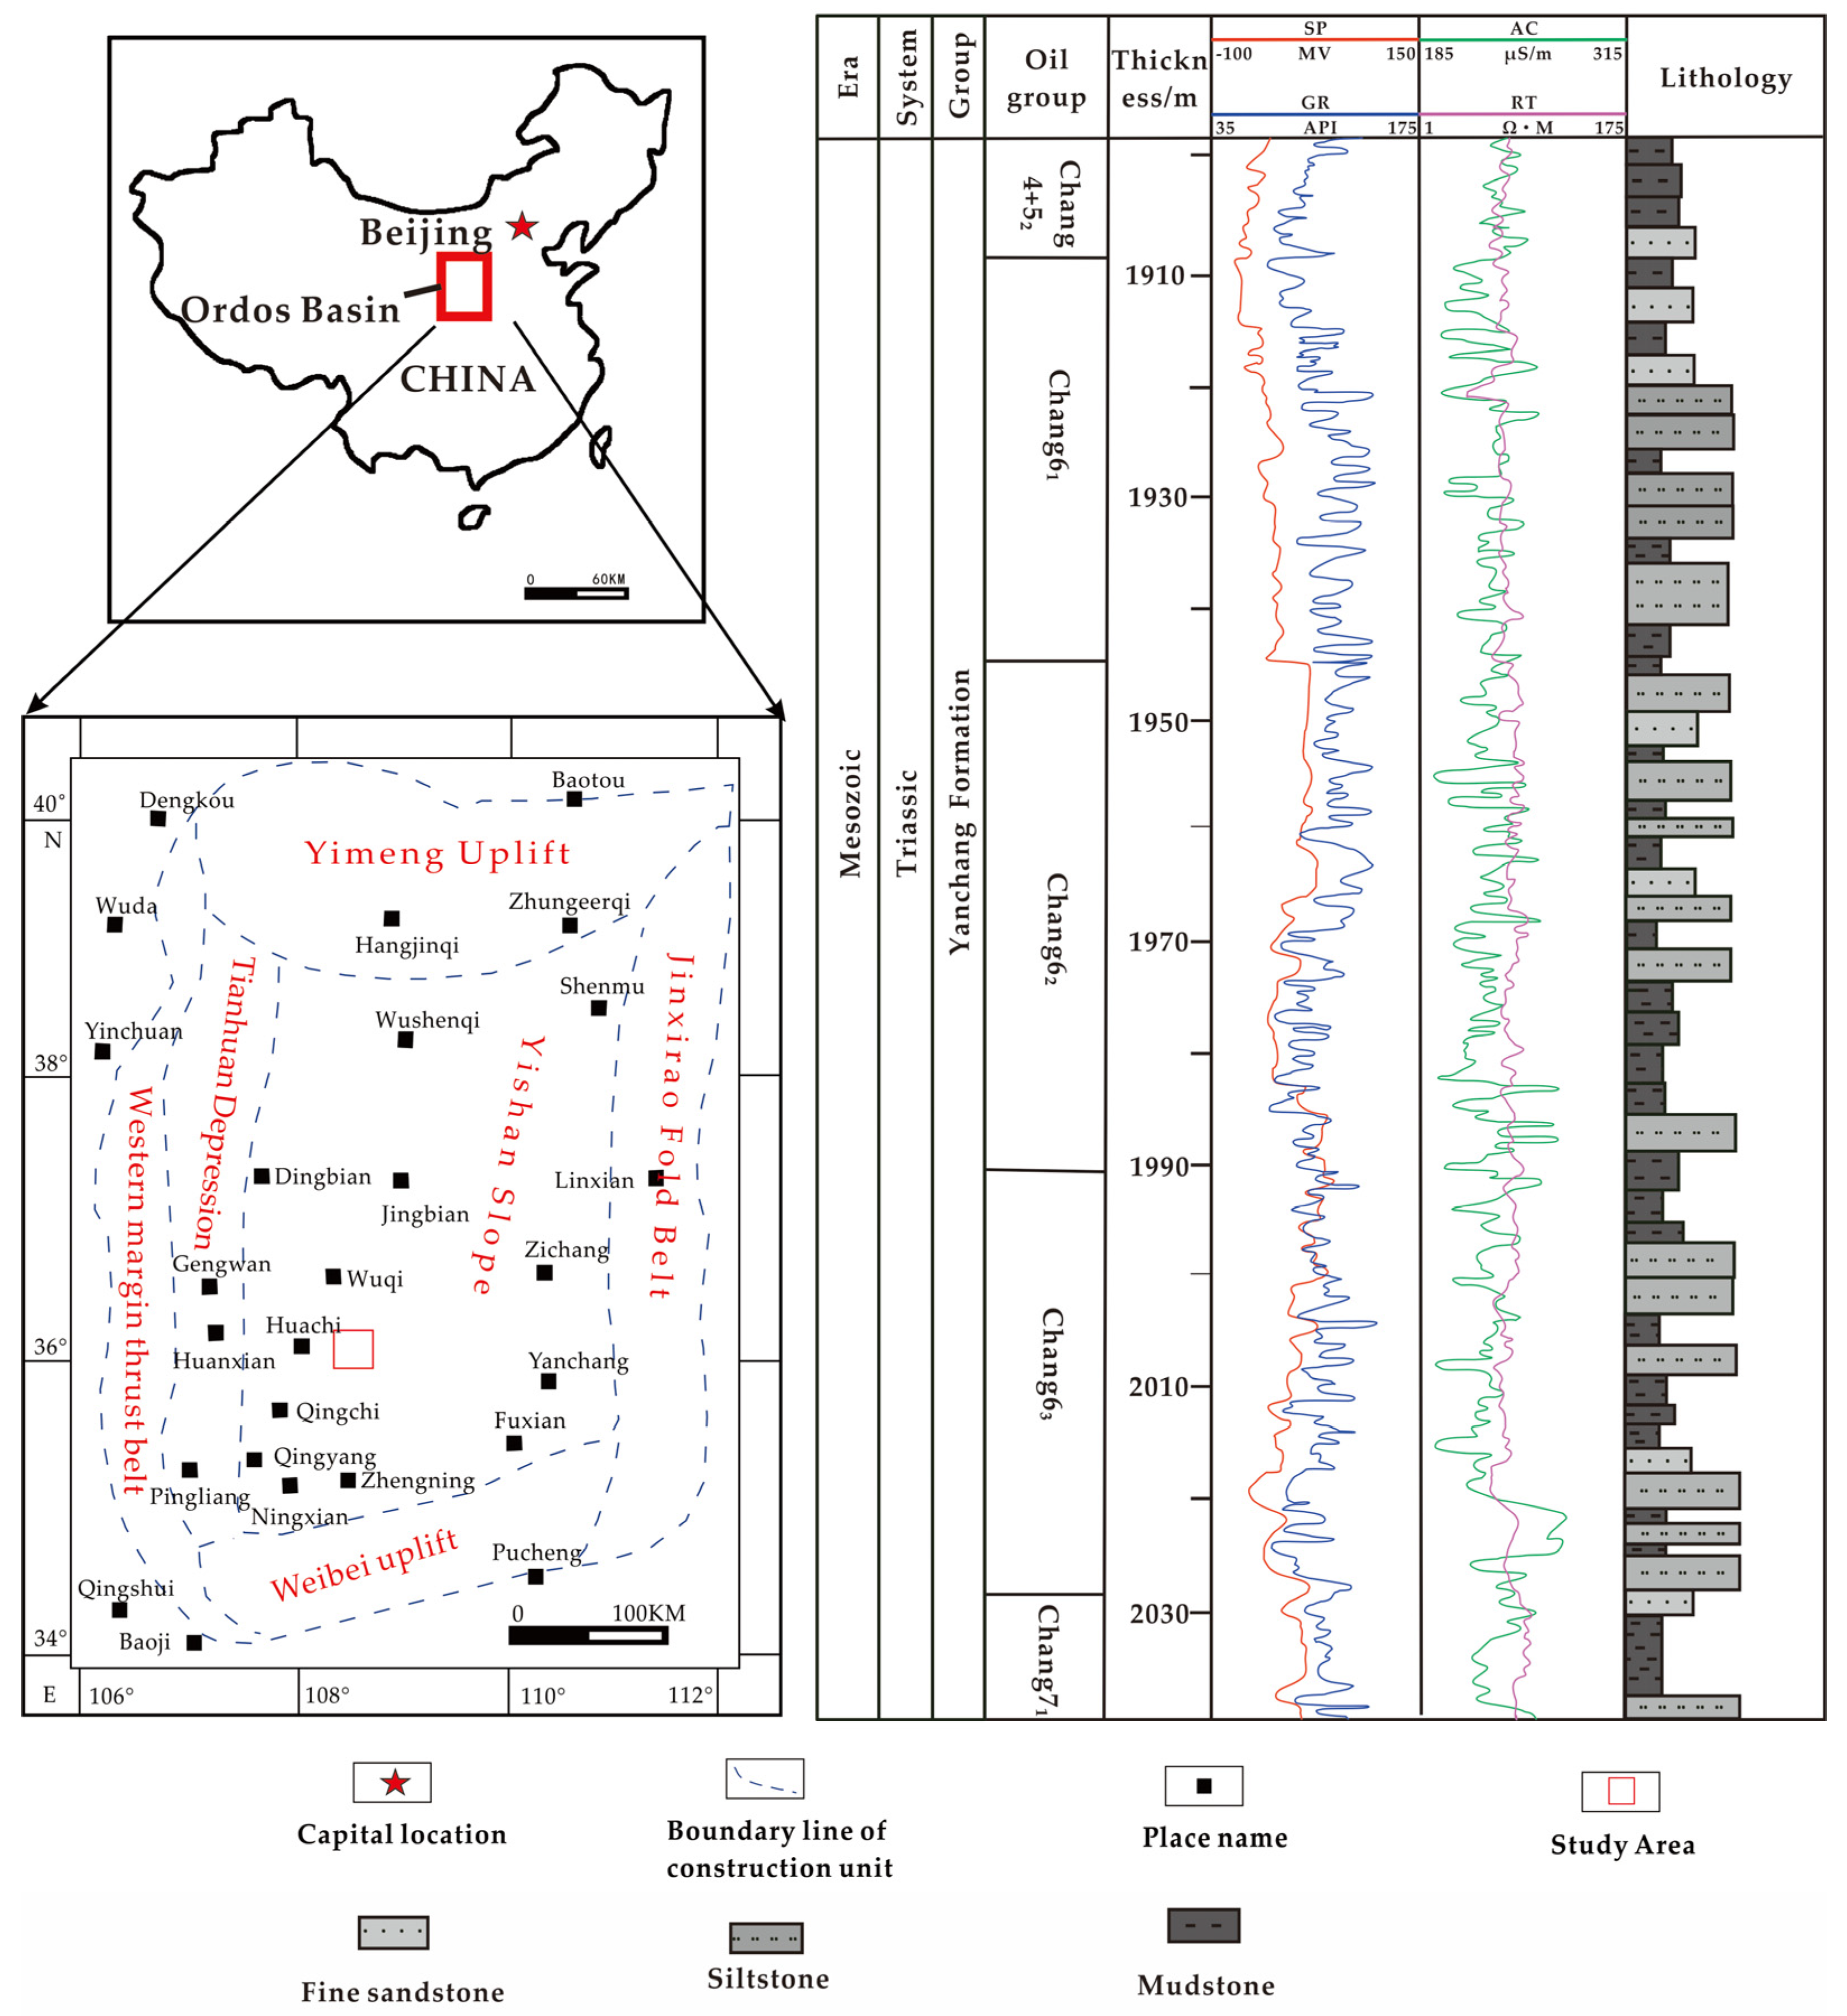
2. Geological Background

The Ordos Basin, one of China’s largest sedimentary basins, is situated on the western side of the North China Craton and plays a pivotal role in the exploration of tight oil and natural gas resources in China [19,20,21].
The basin comprises multiple geological structural units, with the study area located in the southwestern part of the Yishan Slope structural unit (Figure 1). This region lies at the junction of Shaanxi and Gansu provinces, characterized by gentle terrain and low stratigraphic dip angles, covering an area of approximately 186 square kilometers. The overall regional structure exhibits a gently westward-dipping monocline (Yishan Slope), with local development of low-amplitude anticlinal structures, faults, and microfracture zones. Tectonic activity is primarily characterized by stable subsidence, with relatively weak modifications to the basin’s cap rock during the Yanshanian and Himalayan tectonic movements. Oil and gas reservoirs are predominantly controlled by lithological-structural complexes, mainly in concealed traps.
The stratigraphy in the study area is well-developed, with the primary formations from top to bottom being the Triassic Yanchang Formation (T3y), Jurassic Yan’an Formation (J1y), and the Anding Formation (J2a). The Yanchang Formation represents a typical continental lacustrine-deltaic sedimentary system, developing multiple sets of sandstone reservoirs. This formation is the main exploration target for tight oil and shale oil in the basin, with controlled reserves reaching up to 200 million tons. The delta front sandstones in the study area serve as high-quality reservoirs, primarily composed of dark gray fine sandstones, gray-black siltstones, and black mudstones [22,23,24,25]. These reservoirs exhibit low porosity and permeability, significant heterogeneity, and higher development costs.
In summary, the Ordos Basin’s geological setting, particularly the Yishan Slope structural unit, provides a complex environment for tight oil and gas exploration. Understanding the stratigraphic and structural characteristics of formations like the Yanchang Formation is crucial for evaluating reservoir potential and guiding exploration and development strategies.

3. Methods

3.1. Experimental Method

This study employs casting thin sections, scanning electron microscopy (SEM), and high-pressure mercury injection experiments to directly measure the morphology, size, connectivity, and mineral composition of rock pores, thereby calculating the fractal dimension of pore structures.
High-Pressure Mercury Injection Experiment: This method is commonly used to study pore-throat structures. During the process, capillary forces act as resistance, hindering mercury from entering the rock’s pore-throats. Therefore, external pressure is applied to facilitate mercury intrusion. The lower the pressure required for mercury to enter the pore-throats, the larger the pore-throat radius; conversely, higher pressures indicate smaller pore-throat radii. By analyzing the capillary pressure curve and the relationship between mercury injection pressure and volume, the size and distribution of rock pore throats can be assessed [26]. In the high-pressure mercury injection experiment, an AutoPoreIV–9520 fully automatic mercury injection apparatus(McMurdik (Shanghai) Instrument Co., Ltd., Shanghai, China) was used. Samples were placed into a sealed dilatometer and evacuated for testing. The mercury intrusion process was performed by stepwise pressurization, and once a stable pressure was reached, the cumulative mercury intrusion saturation at that pressure was measured. The instrument operates under a pressure range of 0 to 206.7 MPa, with an ambient temperature of 19.6–20.8 °C during operation, and it is capable of measuring pore-throat radii as small as approximately 3.6 nm.
Casting Thin Sections: This technique is used to study the pores within rocks, focusing on their content, types, and distribution. Polarizing microscopes can magnify up to 1000 times. In the casting slice experiment, a vacuum impregnation method was used to inject a prepared stained methyl methacrylate monomer solution into the rock pores. Initially, the samples underwent an extraction and oil-washing procedure to ensure they were oil-free, with dimensions of 25 mm × 5 mm. Prior to vacuum treatment, a glass tube containing the sample was placed in an oven and heated at (100 ± 2)°C for 1 h. Subsequently, the sample was transferred to a vacuum system for evacuation. Once the vacuum level in the system reached 0.09 MPa, the evacuation was continued for an additional 1–2 h. Then, the organic glass monomer solution was injected so that the solution level exceeded the sample by 3–4 cm, and the vacuum was maintained for another 0.5–1 h. After solidification, the resin was ground into thin sections for observation and analysis [27,28].
Scanning Electron Microscopy (SEM): This is a high-resolution instrument that provides clear and direct visualization of rock pore structures and mineral compositions. It allows for detailed examination of pore morphology, size, distribution, and mineral characteristics, offering valuable insights into pore structure analysis [29]. In this scanning electron microscopy experiment, the instrument used was the −Quanta 400 FEG field emission environmental scanning electron microscope (FEI Corporation, Hillsboro, OR USA), which offers magnification up to one million times and a resolution of 2 nm. The experimental samples were selected based on their fresh surfaces, ensuring that the surface structure was well preserved without deformation or contamination, with approximate dimensions of 15 mm × 10 mm × 5 mm (thickness). The primary experimental procedures included sample drying and pre-milling, high-energy argon ion milling, deposition of a conductive film on the sample surface (carbon sputtering treatment), and electron microscopy observation.
By integrating these experimental methods with fractal theory, the study quantitatively characterizes the pore structure features of rocks, providing a theoretical basis for evaluating the storage and permeability of tight sandstone reservoirs.

3.2. Fractal Theory

The fractal dimension is a method that characterizes its fractal pattern by quantifying the heterogeneity of pore-throats into the detail and scale variation rate of the pore-throats [30].
The main fractal model of reservoir pore structure used in this study is the box-counting model [31,32]. In this model, there exists a power-law relationship between the number of objects and the measurement scale, the fractal dimension is determined by the Formula (1):
N r r D
where r is the pore radius, μm; N(r) is the number of virtual pores with pore radius r; and D is the fractal dimension.
From the capillary model, we have:
N r = V H g π r 2 l
where VHg is the volume of mercury at a specified pressure, cm3; and l is the length of the capillary, μm.
At a given pressure P, mercury at room temperature is forced into the capillaries of the sample. As the mercury enters the capillaries, the contact surface between the capillary walls and the mercury generates a force opposing the external pressure, thereby impeding the intrusion of mercury; this is referred to as capillary force. The capillary pressure is:
P C = 2 σ cos θ r
where PC is the capillary pressure, MPa; σ is the surface tension, dyne/cm; and θ is the contact angle, (°).
The formula for calculating mercury saturation is:
S H g = V H g V p
where SHg is the mercury saturation, %; and Vp is the pore volume, cm3.
Combining Equations (1)–(4), we obtained the relationship equation among mercury saturation, capillary pressure, and fractal dimension:
S H g = a P c 2 D
where a is a constant.
Taking the logarithm of both sides of Equation (5) yields:
l g S H g = D 2 l g P c + b
where b is a constant.
Therefore, the fractal dimension D can be obtained by the slope of the straight line fitted in the double logarithmic plot of SHg versus PC, that is:
D = K + 2
where K is the slope of the fitted straight line.

4. Result

4.1. Physical Properties

Quartz and rock fragments serve as the fundamental components of the rock framework, with their physical arrangement and cementation directly determining the initial pore structure. In contrast, the weathering transformation of feldspar and the filling effect of clay minerals often further modify the porosity and permeability during later stages of evolution. These factors interact during sedimentation, metamorphism, and subsequent diagenesis, collectively determining the final pore structure and reservoir characteristics.
Petrophysical tests indicate that the Chang 6 reservoir in the study area is a typical low-permeability and ultra-low-permeability reservoir. The minimum permeability is 0.044 × 10⁻³ μm2, the maximum is 0.847 × 10⁻³ μm2, and the average is 0.238 × 10⁻³ μm2. The minimum porosity is 9.94%, the maximum is 14.02%, and the average is 11.46%.

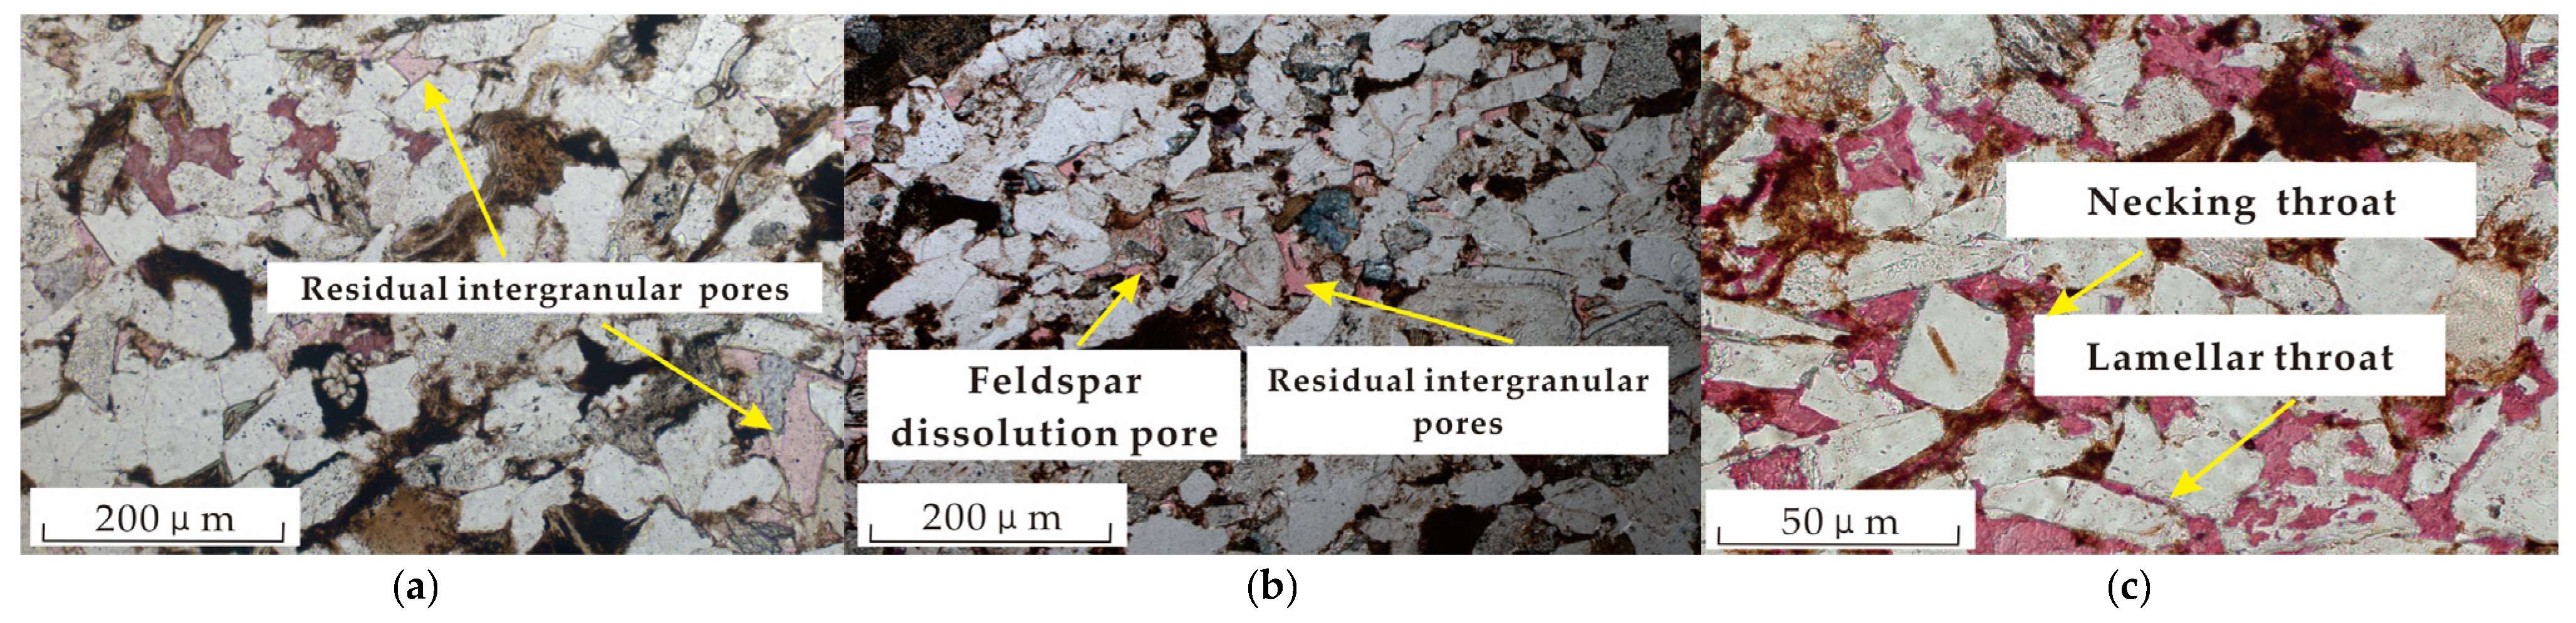
4.2. Mineral Composition and Pore-Throat Type

Through casting thin section analysis (Table 1), the study area exhibits a diverse range of reservoir mineral compositions: the average quartz content is 33.36%, feldspar 29.16%, and lithic fragments 22.82%. The average content of pore-filling materials is 14.67%, predominantly clay minerals, with chlorite being the most abundant (47.84%), followed by illite (44.40%) and illite/smectite mixed layers (5.21%), and kaolinite the least (2.56%).
Casting thin section and scanning electron microscope (SEM) analyses reveal that intergranular pores, dissolution pores, and intragranular pores are the primary pore types (Figure 2). Intergranular pores are the most widely distributed, typically appearing as straight lines with smooth edges, forming irregular polygons with pore diameters mostly greater than 20 μm. Dissolution pores are mainly formed by feldspar dissolution, often observed along cleavage directions, resulting in banded distributions. The rock also contains a small number of intragranular pores, which are narrow and serve as important channels connecting larger pores. The predominant throat types are sheet-like and bent sheet-like, with a small number of necked throats (Figure 2).
Recent studies have typified pore-throat sizes in tight sandstone reservoirs based on throat radius: macropores (≥1000 nm), mesopores (100–1000 nm), transition pores (10–100 nm), and micropores (<10 nm). In the study area, macropores, mesopores, and transition pores are predominantly developed, with micropores being almost absent.

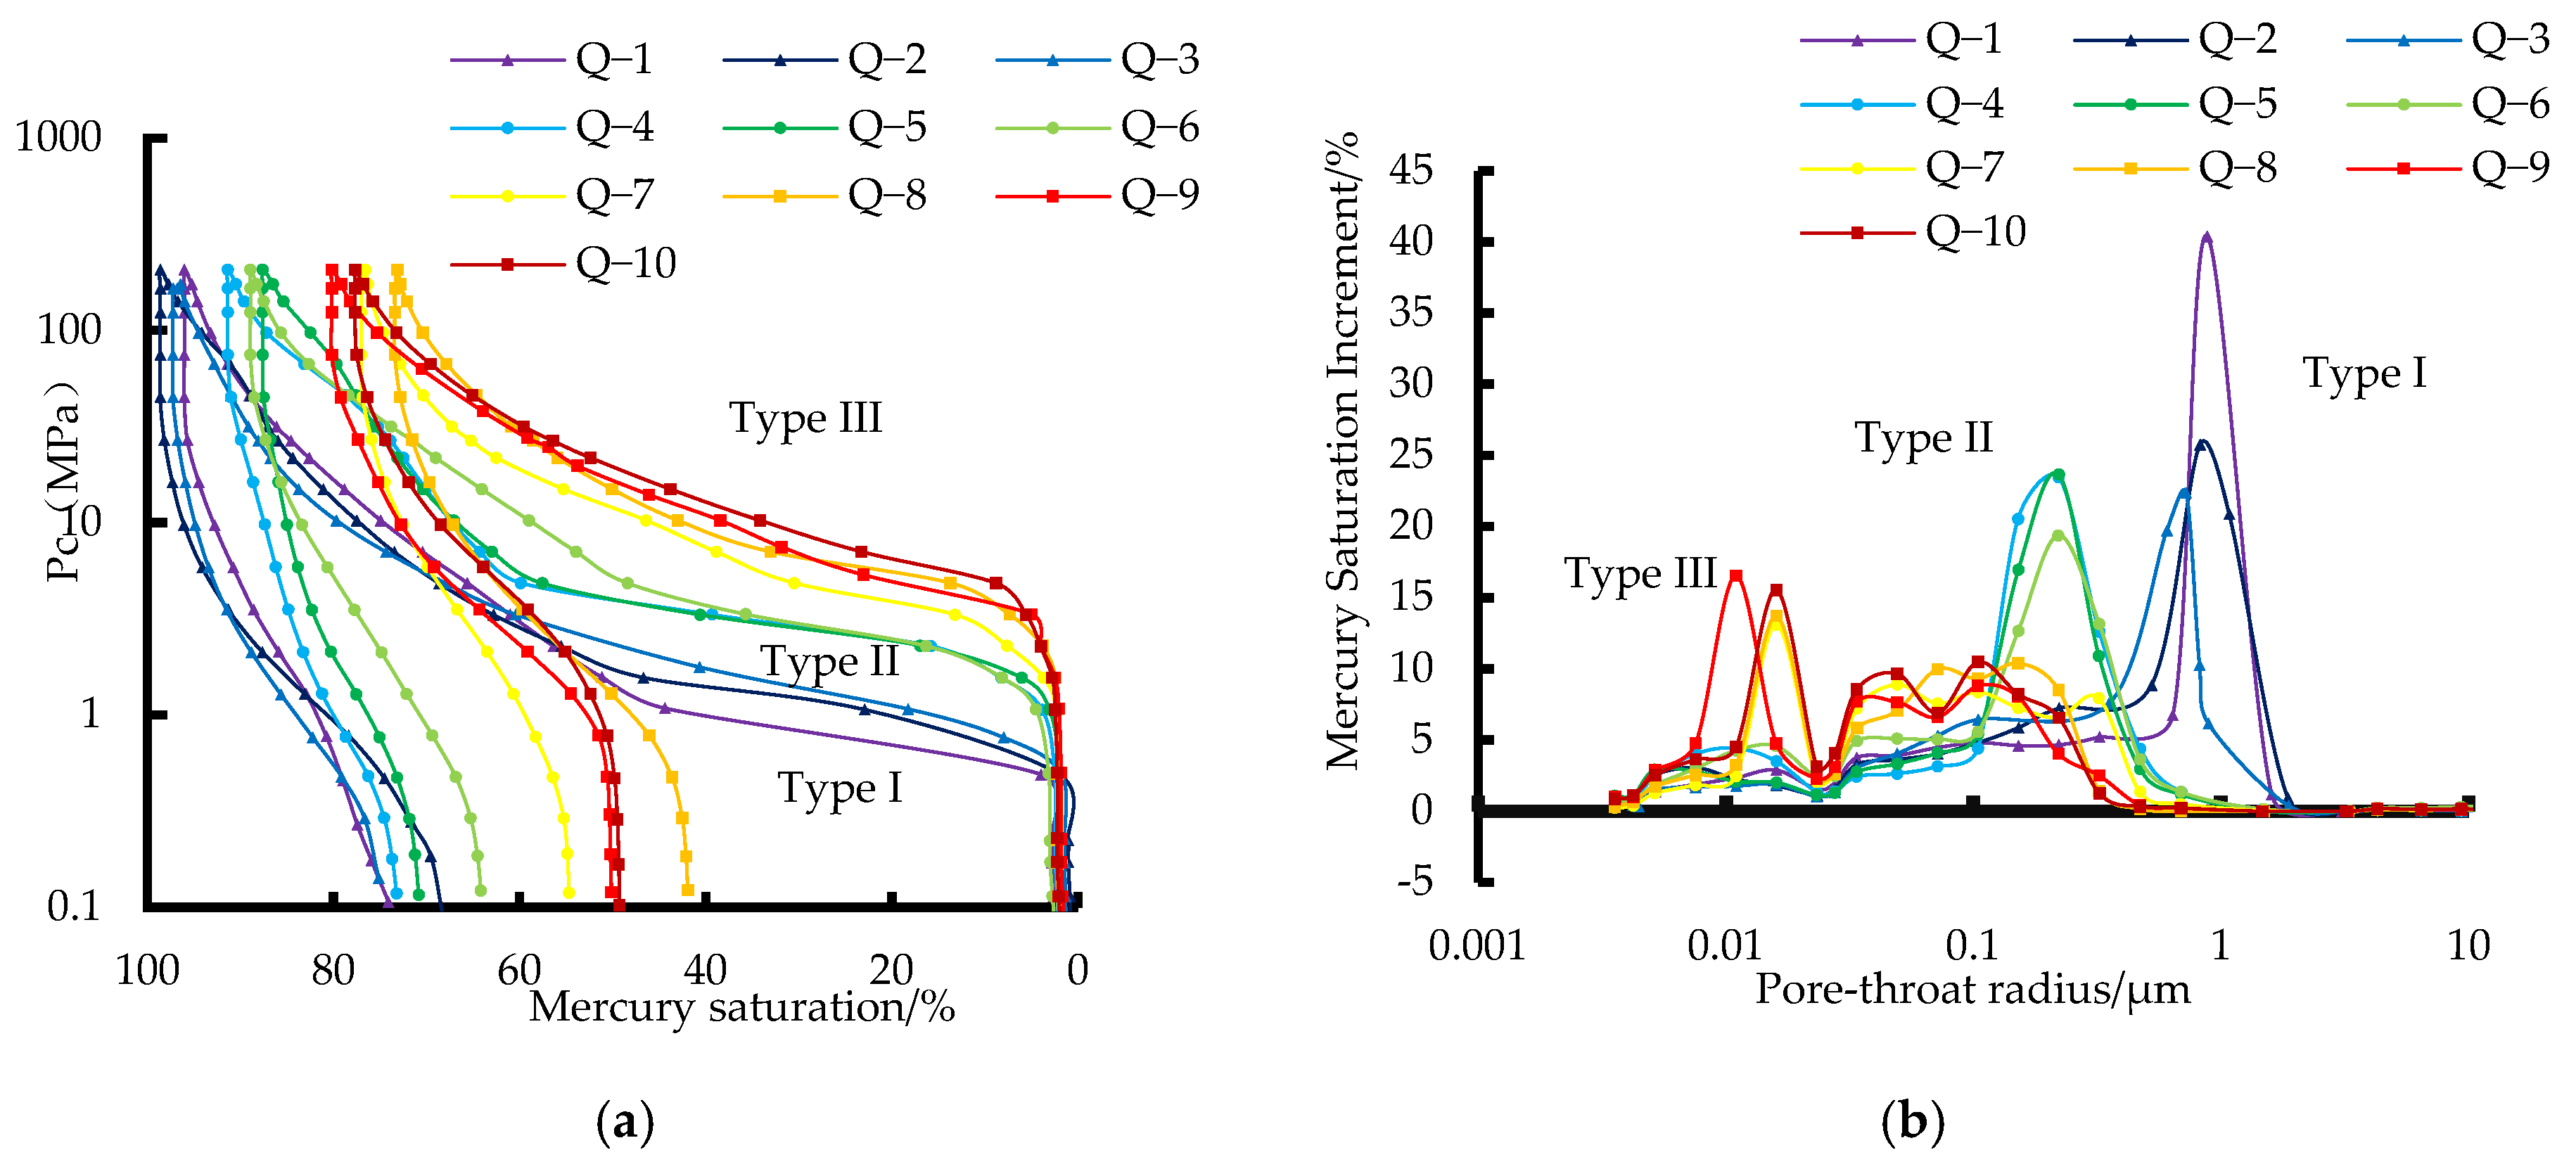
4.3. Mercury Pressure Curve

According to the morphology of the mercury pressure curve measured for the 10 samples and the corresponding distribution of the pore-throat radius, respectively, the 10 samples were divided into three categories.
Type I samples include Q-1, Q-2, and Q-3. The morphological characteristics of the mercury pressure curve (Figure 3a) are low mercury intake slope at the initial stage and rapid mercury intake. When the mercury saturation slope reaches about 50%, the slope becomes higher and the mercury intake is continuous, and the burr pressure range in the low slope section is less than 2 MPa. Type I samples have good properties and low displacement pressure (Table 2), averaging 0.53 MPa; maximum mercury intake saturation mean is 97.16%; median orifice radius is 0.393 μ m; average mercury removal efficiency is 25.43%; orifice radius distribution shows single peak (Figure 3b), and the peak is mainly distributed between 0.6 and 1.1 μm, with low sorting coefficient of 1.74, indicating that the samples have good properties, porous development and uniform distribution.
Type II samples include Q-4, Q-5, Q-6, and the shape characteristics of their mercury intrusion curves also show a low initial slope with rapid mercury intrusion at the beginning, and a steeper curve with continuous mercury intrusion in the middle and later stages. The capillary pressure range of the low slope section is 3–5 MPa. Compared to Type I samples, the physical properties of Type II samples deteriorate, with a larger displacement pressure averaging 1.45 MPa; the average maximum mercury intrusion saturation is 87.63%; the average median pore-throat radius is smaller compared to Type I samples, at 0.183 μm; the average mercury withdrawal efficiency is 22.28%; the pore-throat radius distribution mainly shows a unimodal shape, with the peak mainly distributed between 0.15 and 0.30 μm, and the sorting coefficient averages 2.42, indicating that the smaller pore-throats of this type of samples are developed and have poor sorting.
Type III samples include Q-7, Q-8, Q-9, Q-10, and the shape characteristics of their mercury intrusion curves show a slow rising trend without a distinct low-slope platform section. The physical properties of Type III samples are the worst, with the largest displacement pressure averaging 2.19 MPa; the lowest average maximum mercury intrusion saturation is 75.64%; the smallest average median pore-throat radius is 0.065 μm; the average mercury withdrawal efficiency is 36.32%; the pore-throat radius distribution mainly shows a multimodal shape, with the highest peak on the left mainly distributed between 0.011 and 0.016 μm, and some lower peaks on the right mainly distributed between 0.03 and 0.15 μm; the sorting coefficient averages 2.57, indicating that overall the pore size is smaller, the pore type is mainly micropores, and the pore structure is relatively complex, with poor pore connectivity and strong heterogeneity.

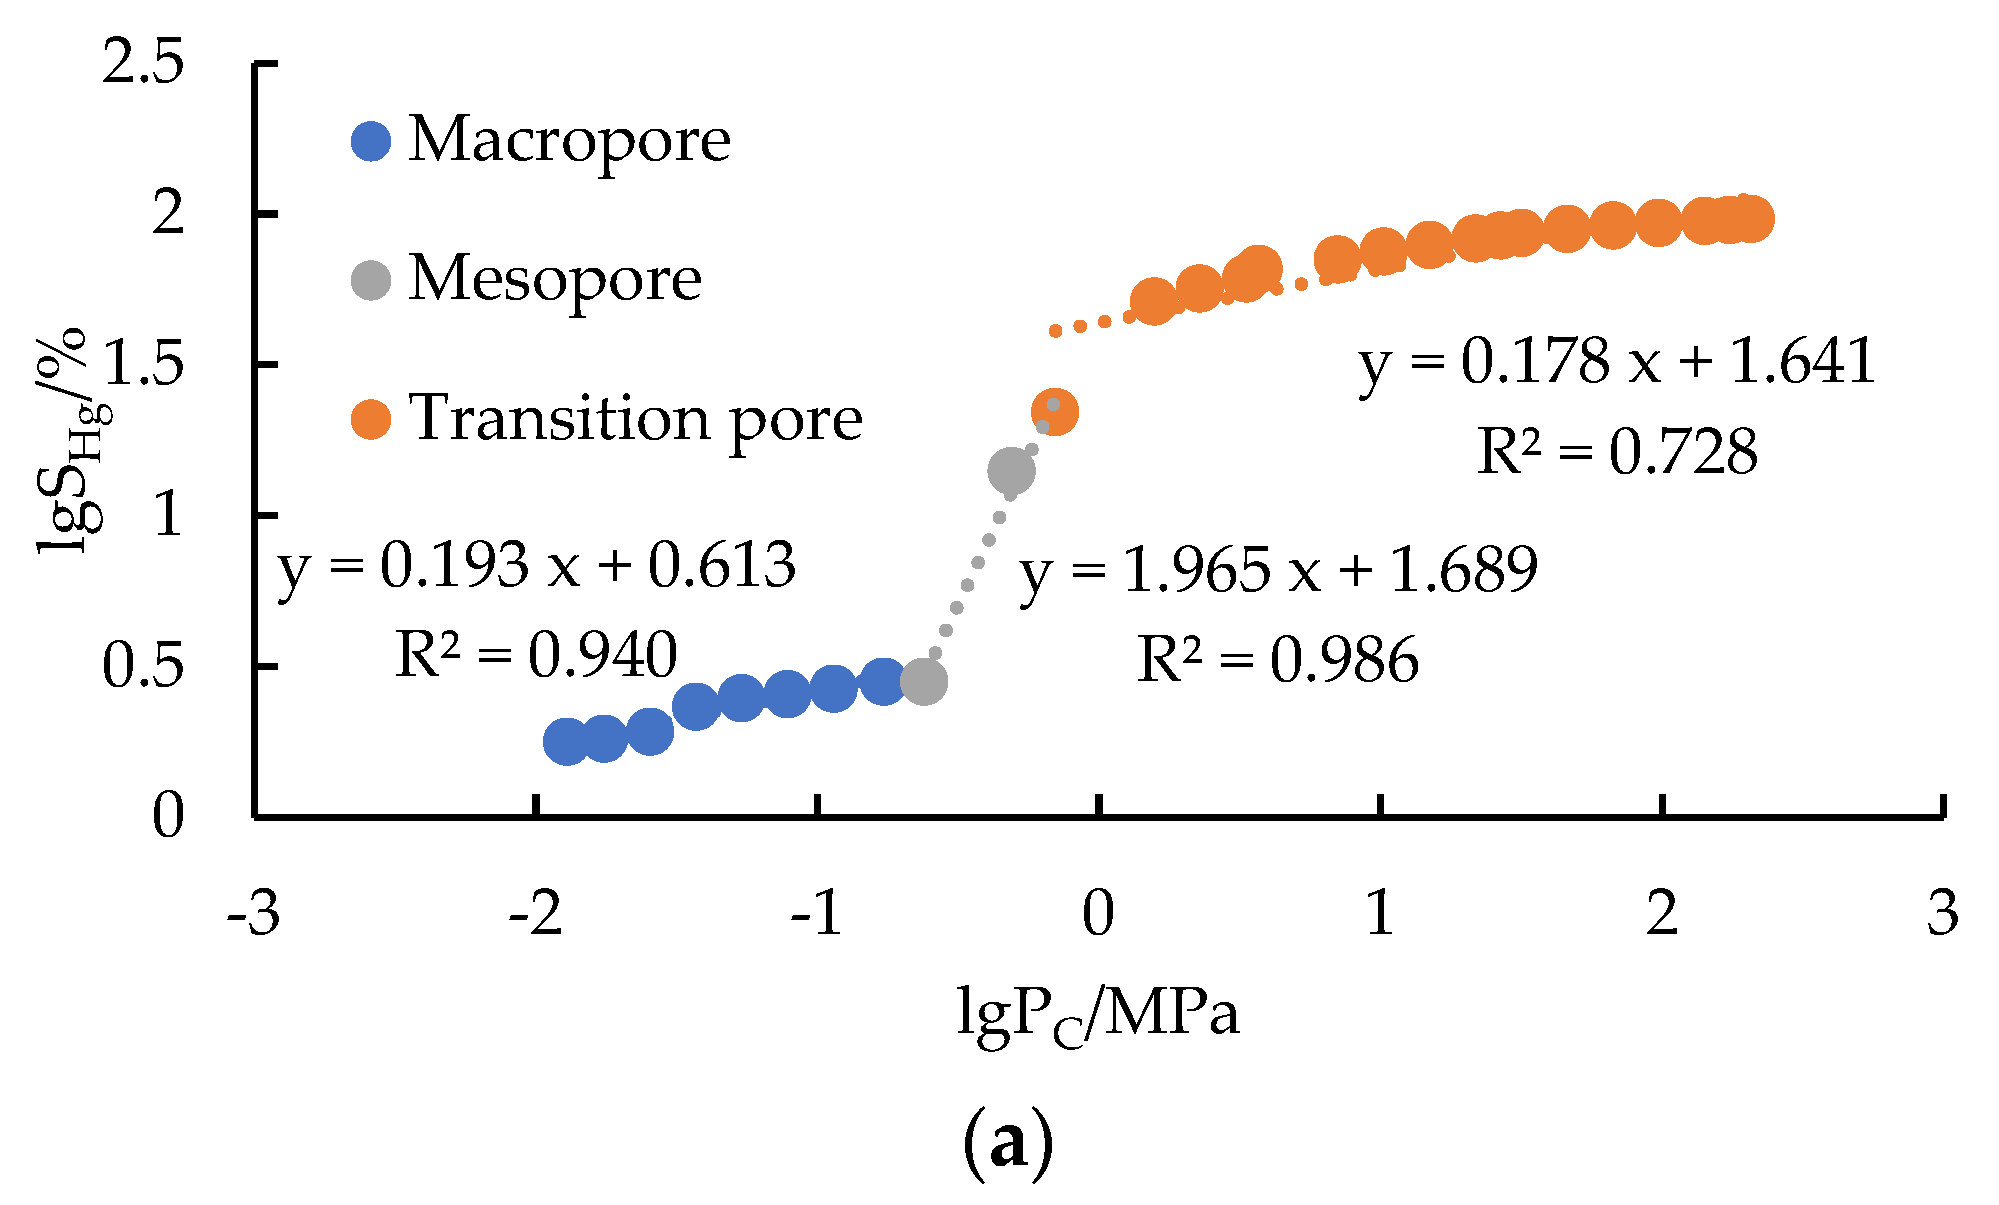
4.4. Fractal Results

In rock reservoirs, fractal dimensions typically range from 2.0 to 3.0. The fractal dimension reflects the quality of the reservoir. A high fractal dimension indicates a complex and highly heterogeneous pore structure, which may result in reduced connectivity between pores; consequently, even if the porosity is relatively high, the permeability could still be low. Conversely, a low fractal dimension signifies a relatively simple and homogeneous pore structure with better pore connectivity, which facilitates efficient fluid flow and thereby enhances the reservoir’s permeability and storage capacity.
Based on fractal theory and utilizing high-pressure mercury injection (MIP) test results, fractal dimensions were calculated, and fractal characteristic curves were plotted by graphing the logarithm of mercury saturation against the logarithm of capillary pressure. The study found that the reservoir’s fractal characteristic curve distinctly divides into three segments, corresponding to macropores, mesopores, and transition pores. The fractal dimensions for these segments, denoted as D1, D2, and D3, were determined from the slopes of the fitted lines for each segment (Figure 4). The correlation coefficients (R2) for the fitted curves ranged from 0.83 to 0.96, indicating that the reservoir’s pore-throat structure exhibits clear fractal characteristics.
The ideal fractal dimension for pore structures typically ranges between two and three. However, the D2 values were all greater than three, suggesting that mesopore structures are complex and exhibit strong heterogeneity, lacking clear fractal characteristics. In contrast, the fractal dimensions for macropores (D1) ranged from 2.09 to 2.41, with an average of 2.28, and for transition pores (D3) from 2.27 to 2.61, with an average of 2.43 (Table 3). Overall, the fractal dimension for transition pores was higher than that for macropores, indicating greater heterogeneity in transition pore structures.
The study also categorized reservoirs into three types based on fractal dimensions:
Type I Reservoirs: D1 = 2.15, D2 = 3.67, D3 = 2.26, with a total fractal dimension of 2.69.
Type II Reservoirs: D1 = 2.28, D2 = 3.50, D3 = 2.40, with a total fractal dimension of 2.72.
Type III Reservoirs: D1 = 2.37, D2 = 3.80, D3 = 2.59, with a total fractal dimension of 2.92.
Generally, Type I reservoirs exhibited the smallest fractal dimensions, followed by Type II, while Type III reservoirs had the largest. This suggests that Type I reservoirs have the weakest heterogeneity, Type II intermediate, and Type III the strongest. It also indicates that Type I reservoirs exhibit the highest quality, followed by Type II, while Type III reservoirs are of the poorest quality. Notably, the fractal dimension for mesopores (D2) exceeded three, indicating that mesopore structures do not exhibit clear fractal characteristics.

5. Discussion

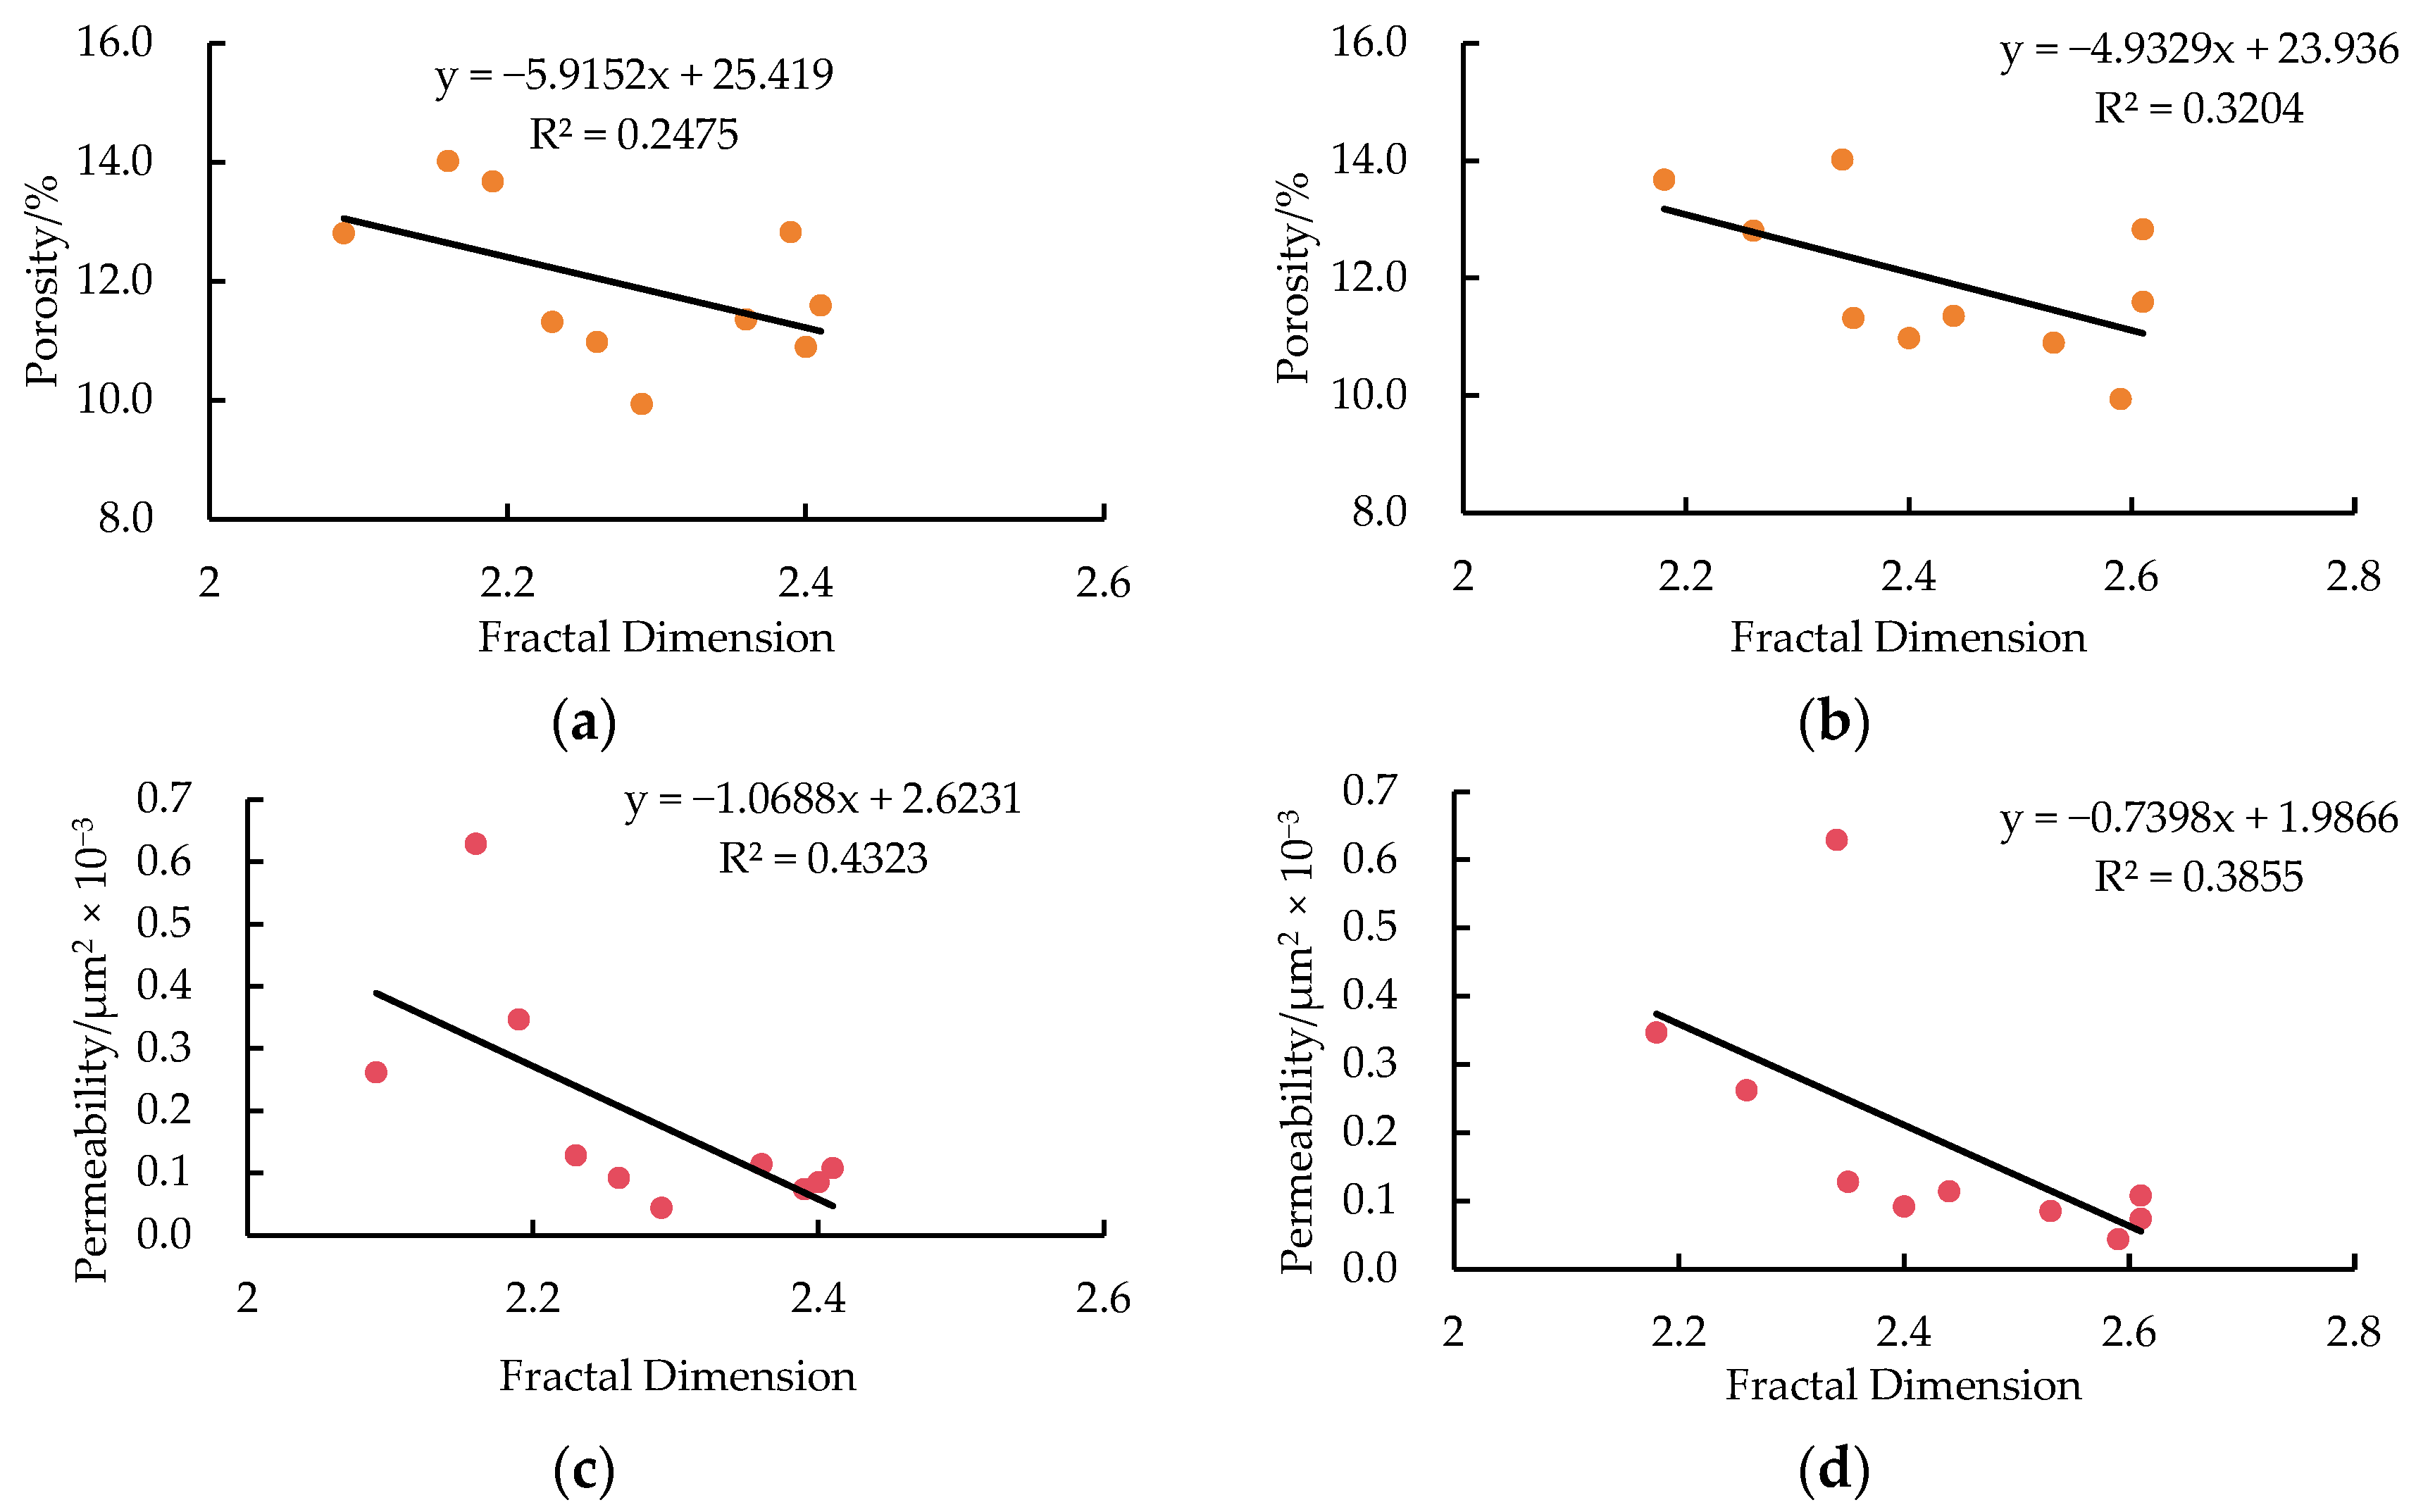
5.1. The Relationship Between Fractal Dimension and Porosity, Permeability

Reservoir petrophysical properties are crucial factors influencing pore-throat complexity. By analyzing the relationship between reservoir petrophysical properties and fractal dimensions, the intrinsic connection between pore-throat structural features and reservoir petrophysical parameters can be elucidated at the microscopic scale. The analysis reveals a negative correlation between fractal dimensions and both porosity and permeability (Figure 5a,c). This indicates that an increase in fractal dimension leads to significant changes in the micro-pore structure, with a higher proportion of small-scale throats, a finer pore size distribution, and enhanced pore-throat heterogeneity. Simultaneously, the pore surface morphology becomes more complex, throat connectivity decreases, resulting in diminished reservoir storage and flow capacities.
Moreover, the correlation between fractal dimension and permeability is stronger than that with porosity, suggesting that reservoir heterogeneity has a more substantial impact on flow capacity. Additionally, the relationships between fractal dimensions (D1 and D3) of macropores and transition pores with their corresponding porosity and permeability differ. Porosity correlates more strongly with D3, while permeability correlates more strongly with D1. This implies that the storage capacity of the study area is primarily influenced by the heterogeneity of transition pores, whereas the flow capacity is mainly affected by the heterogeneity of macropores.

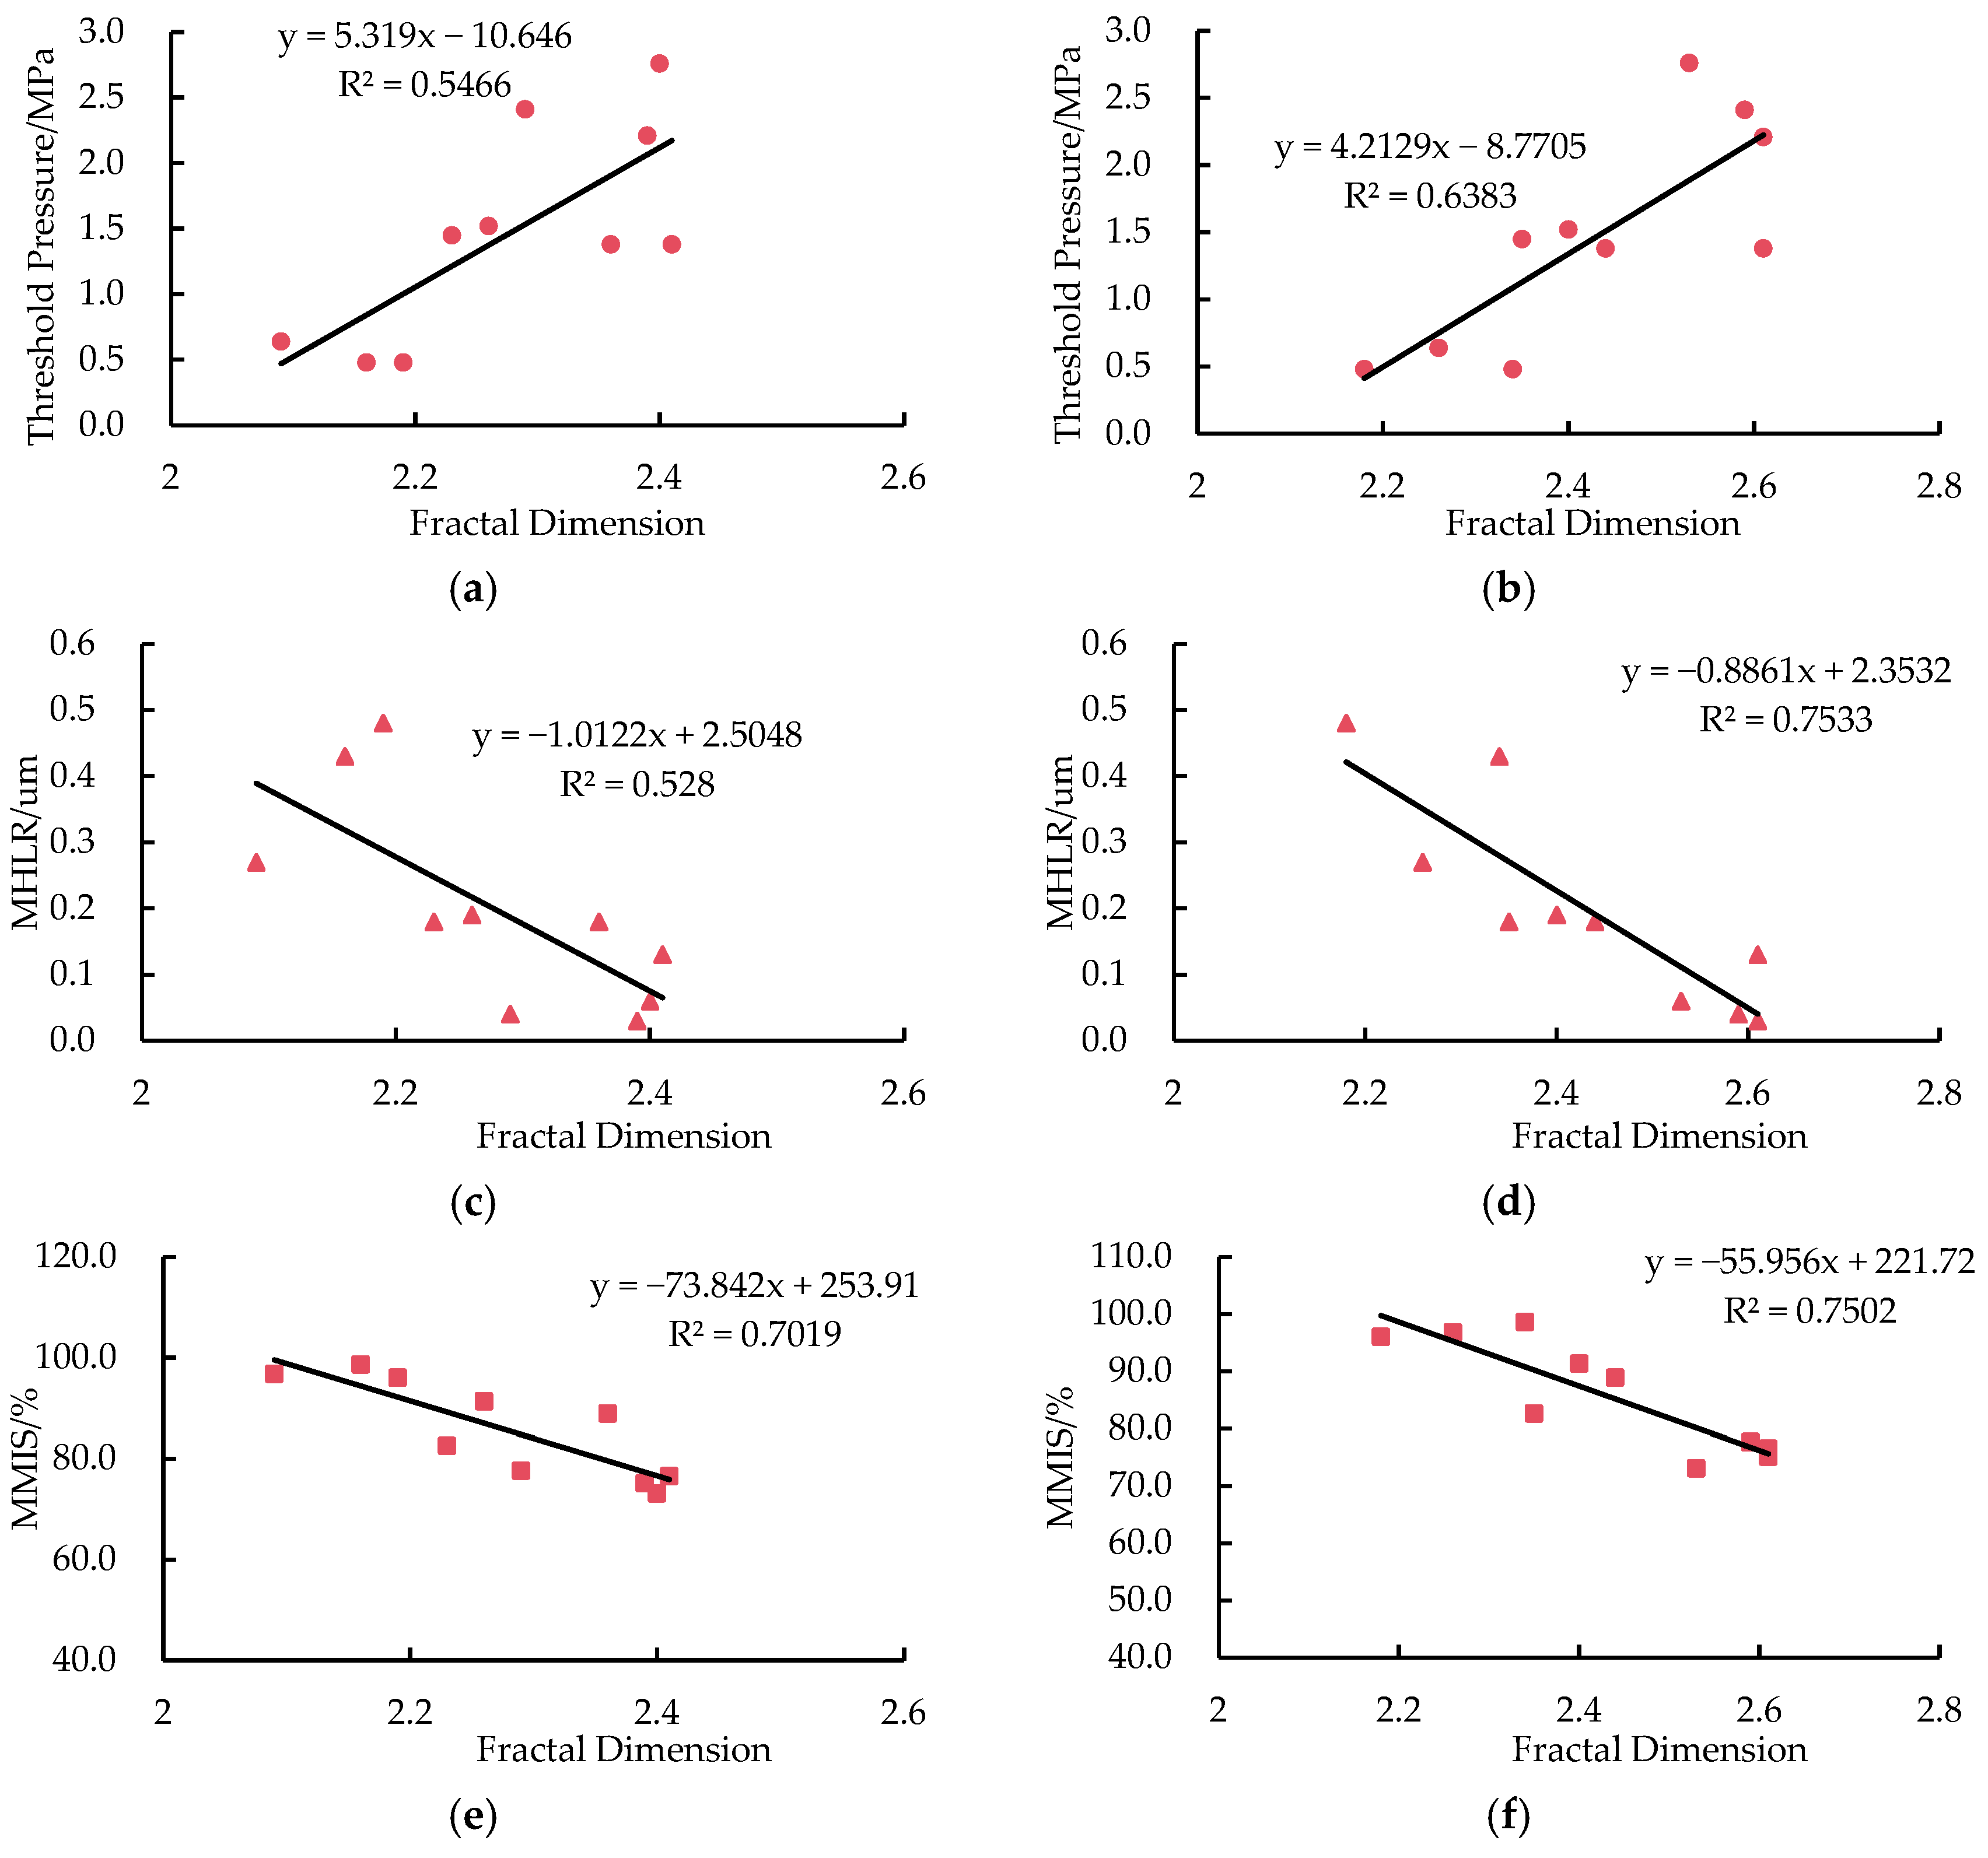
5.2. The Relationship Between Fractal Dimension and Structural Parameters of the Pore-Throat

Scatter plots of fractal dimensions against various pore-throat structural parameters were constructed. The results indicate that the displacement pressure of the reservoir in the study area is positively correlated with both fractal dimensions D1 and D3 (Figure 6a,b). As the fractal dimension increases, the displacement pressure also rises, suggesting that more complex pore-throat structures make it more difficult for the non-wetting phase to enter the pore space, thereby hindering oil and gas accumulation.
The median pore-throat radius reflects the central tendency of the pore-throat distribution. In the study area, the median pore-throat radius is negatively correlated with both fractal dimensions D1 and D3 (Figure 6c,d). This implies that larger fractal dimensions correspond to smaller median pore-throat radii, resulting in reduced storage space and less favorable conditions for oil and gas accumulation.
The maximum mercury injection saturation is another parameter reflecting the size of the pore-throat storage space and the connectivity between pores. In the study area, the maximum mercury injection saturation is negatively correlated with both fractal dimensions D1 and D3 (Figure 6e,f). This indicates that rougher pore-throat structures with higher heterogeneity lead to poorer connectivity between pores, reducing the amount of non-wetting phase entering the pore-throats. Therefore, reservoirs with smaller fractal dimensions are more conducive to oil and gas migration and accumulation, representing the sweet spots for tight sandstone exploitation.

5.3. The Relation Between the Fractal Dimension and the Mineral Composition

Through analyzing the relationships between various mineral contents and fractal dimensions, it is evident that the complexity of the micro-pore structure in tight sandstones is influenced by mineral composition and their respective contents. The contents of quartz and feldspar exhibit a negative correlation with the fractal dimensions of macropores and transitional pores (Figure 7a–d). Higher contents of quartz and feldspar correspond to lower fractal dimensions. This is because felsic minerals, serving as framework minerals, promote the development of intergranular pores in the reservoir. Their higher content reduces the likelihood of diagenetic processes such as compaction and cementation, leading to a more uniform distribution of pore-throat structures. Notably, the correlation between fractal dimensions and quartz content is stronger than that with feldspar, indicating that quartz content is a primary factor affecting the complexity of pore structures. In contrast, clay minerals show no significant correlation with fractal dimensions, this is because the heterogeneous distribution of fine clay minerals indeed increases the complexity of the pore system, thereby raising the fractal dimension and reflecting the system’s self-similarity and irregularity across different scales. Meanwhile, different types of clay minerals exhibit varying stability and behavior under dissolution; for instance, kaolinite is generally more stable, whereas montmorillonite is prone to dissolution in acidic environments. This dissolution process alters the pore size distribution and connectivity, ultimately affecting the overall physical properties of the reservoir. Consequently, the relationship between clay minerals and fractal dimension is not linearly correlated; rather, it may be more complex and nonlinear, regulated by multiple factors.

6. Conclusions

  • The Chang 6 tight reservoir primarily features residual intergranular, dissolution, and intercrystalline pores. Fractal analysis delineates three segments with average dimensions of 2.28 for macropores (D1), 3.67 for mesopores (D2), and 2.43 for transitional pores (D3), indicating that pore heterogeneity increases from macropores to mesopores, with transitional pores in between.
  • The study area reservoirs are classified into three types, each with unique mercury injection capillary pressure curves and pore-throat radius distributions. Type I reservoirs exhibit average fractal dimensions of 2.15 (D1), 3.67 (D2), and 2.26 (D3) (total = 2.69); Type II show 2.28, 3.50, and 2.40 (total = 2.72); and Type III display 2.37, 3.80, and 2.59 (total = 2.92). This indicates an increasing pore heterogeneity from Type I to III, while their storage capacity and permeability decrease accordingly.
  • Reservoir heterogeneity is chiefly controlled by a combination of factors, the fractal dimensions for macropores (D1) and transitional pores (D3) exhibit negative correlations with reservoir physical properties, median pore-throat radius, maximum mercury injection saturation, and quartz/feldspar content, while showing a positive correlation with displacement pressure; no significant correlation exists with clay mineral content.
  • Porosity correlates more strongly with D3 and permeability with D1, indicating that transitional pore heterogeneity primarily governs storage capacity, whereas macropore heterogeneity predominantly influences permeability.

Author Contributions

Conceptualization, L.Z.; methodology, L.Z.; project administration, X.H., F.F. and W.L.; supervision, M.W. and W.Z.; validation, J.L.; writing—original draft, L.Z.; writing—review and editing, Y.Z. All authors have read and agreed to the published version of the manuscript.

Funding

This research was funded by China’s National Major Special Sub Project: “Diagenetic Evolution and Fluid Flow Characteristics in the Structural Model of Clastic Rock Transport Layer”: 2017zx05008-004-004-001 and National Natural Science Foundation of China project: “Diagenetic Response to High Temperature and Overpressure Background and Influence of Fluid Activity on Reservoir Diagenesis Pore Evolution”: (41972129).

Data Availability Statement

The original contributions presented in this study are included in the article. Further inquiries can be directed to the corresponding author.

Acknowledgments

The authors would like to express their sincere thanks to the reviewers and editors for their valuable opinions and constructive suggestions.

Conflicts of Interest

Authors Junfeng Liu, Xiaojin He, Feng Feng, Wei Li, Meng Wang, Wenjian Zhu were employed by Petrochina Changqing Oilfield Company. The remaining authors declare that the research was conducted in the absence of any commercial or financial relationships that could be construed as a potential conflict of interest.

Abbreviations

The following abbreviations are used in this manuscript:
MHLRMedian hole larynx radius
MMISMaximum mercury intake saturation

References

  1. Yuan, H.Q.; Deng, X.Y.; Du, H.; Yu, Y.H.; Xu, F.M. Characterization Methods of Heterogeneity in Permian Shanxi Formation Outcrop Tight Sandstone Reservoirs. Pet. Geol. Exp. 2023, 44, 468–479. [Google Scholar]
  2. Fu, S.T.; Yao, J.L.; Li, S.X.; Zhou, X.P.; Li, M.R. Enrichment Characteristics and Resource Potential of Mesozoic Yanchang Formation Continental Shale Oil in Ordos Basin. Pet. Exp. Geol. 2020, 42, 698–710. [Google Scholar]
  3. Zheng, Q.H.; Liu, Q.; Liang, X.L.; Zhang, J.N.; Liu, T. Sedimentary Facies Distribution Characteristics of Chang 4 + 5 Oil Layers in Longdong Area, Ordos Basin. Lith. Oil Gas Res. 2019, 31, 26–35. [Google Scholar]
  4. Wang, H.; Shi, Y.M.; Xu, D.W.; Chen, X.; Li, L.M.C.D. Characterization Techniques and Progress of Pore Structure in Unconventional Reservoirs. Pet. Geol. Recov. 2019, 26, 21–30. [Google Scholar] [CrossRef]
  5. Zhang, Q.P.; Wu, W.R.; Liu, L.P.; Yang, H.M.; Wang, L.G.; Xie, Y.H.; Zhu, Y.S. Pore Structure and Fractal Characteristics of Ultra-Low Permeability Reservoirs in the Chang Formation of the Ordos Basin. Pet. Geol. Recov. 2020, 27, 20–31. [Google Scholar]
  6. Zhang, S.L.; Yang, Y.T.; Zhang, L.; Cao, Y.H. Formation Mechanism of Secondary Quartz in the Second Member of Xujiahe Formation in Western Sichuan Depression and Its Impact on Reservoir Physical Properties. Xinjiang Pet. Geol. 2023, 44, 25–32. [Google Scholar]
  7. Chen, F.; Zhou, Y.; Yang, D.; Wan, H. Study on Pore Structure of Tight Sandstone Reservoir Based on Fractal Theory: A Case Study of Chang 7 Member in Qingcheng Area, Ordos Basin. J. China Univ. Min. Technol. 2022, 51, 941–955. [Google Scholar]
  8. Liu, Y.; Pang, X.Q.; Ding, C.; Chen, D.; Li, M. Pore Structure and Fractal Characteristics of Tight Sandstone Reservoirs in the Yan 10 Member of Wuqi Area. Sci. Technol. Eng. 2023, 23, 12474–12483. [Google Scholar]
  9. Zhan, H.; Li, X.; Hu, Z.; Chen, L.; Shen, W.; Guo, W.; He, W.; Zhou, Y. Effect of Particle Size on Pore Structure and Fractal Characteristics of Deep Siliceous Shales in Southern Sichuan, China, Measured Using Small-Angle Neutron Scattering and Low-Pressure Nitrogen Adsorption. Fractal Fract. 2025, 9, 165. [Google Scholar] [CrossRef]
  10. Zhang, N.; Wang, S.; Wu, J.; Li, Z.; Wang, X. Full-Scale Pore Structure Characterization and Its Impact on Methane Adsorption Capacity and Seepage Capability: Differences between Shallow and Deep Coal from the Tiefa Basin in Northeastern China. Fractal Fract. 2024, 8, 48. [Google Scholar] [CrossRef]
  11. Wang, J.; Wang, X.; Dong, W. Calculating method of the fractal dimensions of the relative permeability by the capillary pressure curve of the tight sandstone. Pet. Geol. Oilfield Dev. Daqing 2017, 36, 164–168. [Google Scholar]
  12. Zhu, H.Q.; Jia, A.L.; Wer, Y.S.; Jia, C.Y.; Yuan, H. Microscopic porestructure and fractal characteristics of Wufeng—Longmaxi shale, south Sichuan. Sci. Technol. Eng. 2018, 18, 12–19. [Google Scholar]
  13. Han, C.; Li, G.; Dan, S.; Yang, Y.; He, X.; Qi, M.; Liu, G. Study of Fractal and Multifractal Features of Pore Structure in Tight Sandstone Reservoirs of the Permian Lucaogou Formation, Jimsar Sag, Junggar Basin, Northwest China. ACS Omega 2022, 7, 31352–31366. [Google Scholar] [CrossRef] [PubMed]
  14. Zang, Q.; Liu, C.; Awan, R.S.; Yang, X.; Li, G.; Wu, Y.; Lu, Z.; Feng, D. Occurrence Characteristics of the Movable Fluid in Heterogeneous Sandstone Reservoir Based on Fractal Analysis of NMR Data: A Case Study of the Chang 7 Member of Ansai Block, Ordos Basin, China. J. Pet. Sci. Eng. 2022, 214, 110497. [Google Scholar] [CrossRef]
  15. Wang, Y.; Zhang, X.; Sun, Y.; Am, X.Y. Sedimentary-Diagenetic and Reservoir Pore Characteristics of the Upper Paleozoic Shan_2–He_8 Members in the Northern Slope of Ordos Basin. J. Geomech. 2014, 20, 230–242. [Google Scholar]
  16. Dou, W.; Liu, L.; Jia, L.; Xu, Z.; Wang, M.; Du, C. Pore Structure, Fractal Characteristics and Permeability Prediction of Tight Sandstones: A Case Study from Yanchang Formation, Ordos Basin, China. Mar. Pet. Geol. 2020, 123, 104682. [Google Scholar] [CrossRef]
  17. Wang, W.; Chen, C.; Xu, S.; Li, Y.; Zhu, Y.; Huang, X. Fractal Characteristics and Controlling Factors of Pore-Throat in Tight Sandstones of Yanchang Formation, Ordos Basin. Pet. Exp. Geol. 2022, 44, 33–40. [Google Scholar]
  18. Wang, C.; Zhang, H.; Yao, Z.; Huo, J.H. Fractal Characteristics of Tight Sandstone Reservoirs Based on Mercury Injection Experiment. J. Chongqing Univ. Sci. Technol. 2023, 25, 7–12. [Google Scholar]
  19. Xu, X. Sedimentary Characteristics and Favorable Reservoir Controlling Factors of Gravity Flow in High-Frequency Sequence Framework of Chang 6 Oil Layer Group in Huaqing Area. Ph.D. Thesis, Northwest University, Xi’an, China, 2021. [Google Scholar]
  20. Lu, C.; Zhang, S.; Mao, X.; Zhao, D.F. Quantitative Characterization of Micro-Pore Heterogeneity and Its Reservoir Significance in Tight Sandstones: A Case Study of Shanxi Formation in X Area, Ordos Basin. Pet. Exp. Geol. 2017, 39, 556–561. [Google Scholar]
  21. Zhang, Q.P.; Wang, H.; Liu, M.R.; Zhou, C.F.; Xu, J.G.; Hu, K.L.; Zhu, Y.S. Full-Pore Diameter Distribution and Its Fractal Characteristics in Ultra-Low Permeability Reservoirs. J. China Univ. Min. Technol. 2020, 49, 1137–1149. [Google Scholar]
  22. Lu, Z.; Liu, C.; Zang, Q.; Wu, Y.P.; Yang, X.Y.; Yang, H.; Zeng, X.X.; Li, W.D. Analysis of Tight Sandstone Pore Structure Using High-Pressure Mercury Injection Combined with Fractal Theory: A Case Study of Heshui Area, Ordos Basin. Geol. Sci. Technol. Bull. 2023, 42, 264–273. [Google Scholar]
  23. Lai, J.; Wang, G.; Wang, Z.; Chen, J.; Pang, X.; Wang, S.; Zhou, Z.; He, Z.; Qin, Z.; Fan, X. A Review on Pore Structure Characterization in Tight Sandstones. Earth Sci. Rev. 2018, 177, 436–457. [Google Scholar] [CrossRef]
  24. Liu, J.P.; Liu, D.X.; Hu, H.Y.; Jiao, P.F.; Wang, T.; Xie, Z.; Liu, L.H. Pore Structure Characteristics of Marine-Continental Transitional Shale in the Eastern Margin of Ordos Basin. China Sci. Pap. 2022, 17, 21–30. [Google Scholar]
  25. Chai, B.; Zhao, F.; Ji, Y.; Wang, W.; Chen, L.; Cheng, Q.; Yan, X. Pore Structure and Fractal Characteristics of Longmaxi Shale in the Southeastern Sichuan Basin. Sci. Technol. Eng. 2023, 23, 4973–4983. [Google Scholar]
  26. Yang, J.; Li, Z.; Lai, F. Retention of Nano-Slippery Water in Tight Sandstones and Its Impact on Micro-Pore Structure. Sci. Technol. Eng. 2022, 22, 6942–6950. [Google Scholar]
  27. Wang, Y.; Han, D.; Lin, W.; Jia, Y.; Zhang, J.; Wang, C.; Ma, B. Factors Controlling Differences in Morphology and Fractal Characteristics of Organic Pores of Longmaxi Shale in Southern Sichuan Basin, China. Fractal Fract. 2024, 8, 555. [Google Scholar] [CrossRef]
  28. Cai, J.; Berg, S. Emerging Advances in Modeling for Water Imbibition in Porous Media: A Multiscale Perspective. Water 2021, 13, 1234. [Google Scholar]
  29. Liu, S.; Wang, F.; Yu, R.; Gao, J.X.; Shi, H.; Zhu, Y.S. Micro-Pore Throat Structure and Fractal Characteristics of Tight Sandstone Reservoirs. J. China Univ. Min. Technol. 2024, 54, 96–107. [Google Scholar]
  30. Li, P.; Zheng, M.; Bi, H.; Wu, S.; Wang, X. Pore Throat Structure and Fractal Characteristics of Tight Oil Sandstone: A Case Study in the Ordos Basin, China. J. Pet. Sci. Eng. 2017, 149, 665–674. [Google Scholar] [CrossRef]
  31. Zhu, Y. Characterization and Typeification Evaluation of Pore Structure in Tight Sandstone Reservoirs of Shahejie Formation in Dongying Sag. Master’s Thesis, Chengdu University of Technology, Chengdu, China, 2021. [Google Scholar]
  32. Guan, Y.; Ye, Q.; Zhang, C.; Chen, J.; Tang, X.Y. Pore Structure Characteristics and Typeification Evaluation of High-Pressure Low-Permeability Clastic Rock Reservoirs: A Case Study of the Huangliu Formation in Yinggehai Basin. J. Northeast Pet. Univ. 2024, 48, 75–89+137. [Google Scholar]
Figure 1. Geological structure unit and research area location map of Ordos Basin and stratigraphic histogram of the study area.
Processes 13 00988 g001
Figure 2. Microscopic characteristics of pore-throats in tight sandstone reservoirs of Chang 6 reservoir in the study area. (a) Residual intergranular pores Q-2, Cast thin section; (b) Residual intergranular pores, feld-spar-soluble pores Q-4, cast body sheet; (c) Cork, lamelate throat Q-5, cast body sheet; (d) Intergranular see quartz secondary increased Q-3, SEM; (e) Intergranular, granular surface chlo-rite development Q-7, SEM; (f) Intergranular illite development Q-8, SEM.
Processes 13 00988 g002aProcesses 13 00988 g002b
Figure 3. Characteristic curve of high-pressure mercury injection capillary pressure and pore-throat distribution of Chang 6 reservoir in the study area. (a) Capillary pressure curve; (b) Pore-throat distribution curve.
Processes 13 00988 g003
Figure 4. Fractal characteristic curves of samples with different pore types in the study area. (a) Type I pore: fractal characteristic curve of Q-1 sample; (b) Type II pore: fractal characteristic curve of Q-5 sample; (c) Type III pore: fractal characteristic curve of Q-10 sample.
Processes 13 00988 g004aProcesses 13 00988 g004b
Figure 5. The relationship between reservoir physical properties and fractal dimension. (a) The relationship between D1 and porosity; (b) The relationship between D3 and porosity; (c) The relationship between D1 and permeability; (d) The relationship between D3 and permeability.
Processes 13 00988 g005
Figure 6. The relationship between fractal dimension and pore-throat structure parameters. (a) The relationship between D1 and threshold pressure; (b) the relationship between D3 and threshold pressure; (c) the relationship between D1 and MHLR; (d) the relationship between D3 and MHLR; (e) the relationship between D1 and MMIS; (f) the relationship between D3 and MMIS.
Processes 13 00988 g006
Figure 7. The relationship between the fractal dimension and content of rock mineral components. (a) The relationship between D1 and quartz content; (b) The relationship between D3 and quartz content; (c) The relationship between D1 and feldspar content; (d) The relationship between D3 and feldspar content; (e) The relationship between D1 and clay mineral content; (f) The relationship between D3 and clay mineral content.
Processes 13 00988 g007
Table 1. Porosity, permeability and mineral content of rock samples in the study area.
Sample NumberPorosity/%Permeability/
10−3 μm2
Mineral Content/%Clay Mineral Content/%
QuartzFeldsparRock
Fragments
Clay
Mineral
Illite Emon Mixed LayerKaolinite Chlorite
Q-114.020.84739.035.011.015.028.538.389.4453.65
Q-211.860.62938.030.012.020.041.374.830.0053.80
Q-312.810.26234.027.030.09.045.403.900.0050.70
Q-48.980.09238.031.013.018.074.000.000.0026.00
Q-511.320.12838.334.111.716.047.334.282.3646.04
Q-610.360.11431.329.021.718.064.141.190.0034.67
Q-711.600.10831.025.028.016.020.954.3613.8060.89
Q-810.900.08529.021.538.511.037.4914.310.0048.20
Q-912.830.07429.027.031.312.757.801.890.0040.31
Q-109.940.04426.032.031.011.026.958.940.0064.11
Average
value
11.460.23833.3629.1622.8214.6744.405.212.5647.84
Table 2. Pore-throat structure parameters of Chang 6 reservoir in the study area.
Sample NumberThreshold Pressure/MPaMedian
Pressure/MPa
Maximum
Aperture Larynx Radius/μm
Median Hole
Larynx Radius/μm
Maximum Mercury
Intake Saturation (%)
Efficiency
of Mercury Withdrawal (%)
Separation Factor
Q-10.481.521.520.4896.0422.831.88
Q-20.481.721.510.4398.6230.731.39
Q-30.641.761.490.2796.8122.801.94
Q-41.523.790.480.1991.3719.852.40
Q-51.454.840.510.1882.6019.142.54
Q-61.384.850.530.1888.9227.842.32
Q-71.3810.280.510.1376.5728.582.02
Q-82.7614.970.270.0673.1442.672.02
Q-92.2119.770.330.0375.1937.473.32
Q-102.4121.760.310.0477.6936.542.93
Average value1.478.530.750.2085.7028.852.28
Table 3. Calculation results of fractal dimension for 10 samples in the study area.
TypeSample NumberMacroporeMesoporeTransition Pore
D1R2D2R2D3R2
Type IQ-12.190.943.820.992.180.728
Type IQ-22.160.953.730.932.340.97
Type IQ-32.090.963.450.922.260.96
Type IIQ-42.260.903.580.952.400.99
Type IIQ-52.230.923.530.892.350.94
Type IIQ-62.360.943.380.942.440.96
Type IIIQ-72.410.903.820.952.610.83
Type IIIQ-82.400.763.850.962.530.91
Type IIIQ-92.390.854.050.952.610.84
Type IIIQ-102.290.943.470.972.590.95
Disclaimer/Publisher’s Note: The statements, opinions and data contained in all publications are solely those of the individual author(s) and contributor(s) and not of MDPI and/or the editor(s). MDPI and/or the editor(s) disclaim responsibility for any injury to people or property resulting from any ideas, methods, instructions or products referred to in the content.

