Article

Scalability and Performance of Iron–Carbon Micro-Electrolysis with Hydrogen Peroxide for Textile Wastewater Treatment

1
Department of Biomedicine and Health, Shanghai Vocational College of Agriculture and Forestry, 658 Zhongshan 2nd Road, Songjiang District, Shanghai 201699, China
2
School of Environment and Architecture, University of Shanghai for Science and Technology, 516 Jungong Road, Shanghai 200093, China
*
Author to whom correspondence should be addressed.
Processes 2025, 13(4), 970; https://doi.org/10.3390/pr13040970
Submission received: 1 March 2025 / Revised: 19 March 2025 / Accepted: 21 March 2025 / Published: 25 March 2025
(This article belongs to the Special Issue Advanced Oxidation Processes for Waste Treatment)

Abstract

:
This study assesses iron–carbon micro-electrolysis coupled with hydrogen peroxide for removing organic pollutants from secondary sedimentation tank effluent. Gas chromatography–mass spectrometry (GC-MS) analysis identified 11 major pollutants, with thiophene and palmitic acid being predominant, contributing significantly to the chemical oxygen demand (COD) due to their stability and molecular sizes. Iron–carbon micro-electrolysis showed notable degradation of thiophene and indole, though it was less effective for other organics. The combined process enhanced the degradation efficiency, hydrolyzing >85% of esters into less toxic alcohols, yet palmitic acid remained largely undegraded. The combined treatment process (influent pH 3.5, H2O2 dose 170 mg/L) improved degradation, converting most esters to alcohols and reducing environmental impacts, yet palmitic acid remained largely undegraded. A 35-day pilot test under optimal conditions achieved an average COD removal rate of 57%. The study concludes that the combined process has potential for complex pollutant degradation but requires further optimization for better efficiency.

1. Introduction

Textile wastewater (TW) is the effluent resulting from textile industry processes that apply color and desired properties to fabrics [1]. These effluents exhibit high levels of chemical oxygen demand (COD), indicating the presence of a significant amount of organic pollutants [2], which are hazardous to aquatic ecosystems and human health [3].
Biochemical treatment is commonly employed for the processing of textile dyeing wastewater [4]. This method utilizes the metabolic activities of microorganisms to degrade organic pollutants within the wastewater, a technique that is widely adopted in the textile industry for its cost-effectiveness and environmental sustainability. While biochemical methods are notably effective in reducing the COD, their efficacy is limited when it comes to breaking down certain recalcitrant organic compounds, such as specific dyes and pigments [5].
The regulatory landscape for COD emissions in textile industry wastewater is witnessing a global tightening of standards. According to the Discharge standards of water pollutants for dyeing and finishing of textile industry (GB 4287-2012), the direct discharge of COD by existing textile manufacturers is to be curtailed to 80 mg/L in an effort to reduce the environmental impact [6]. In the United Kingdom, the Environment Agency enforces a comparatively lower typical COD discharge limit of 125 mg/L [7], reflecting the country’s stringent approach to pollution control. Similarly, in Australia, the Environmental Protection (Industrial Waste Resource) Regulations impose a still more rigorous requirement, with the COD discharge limit set at 100 mg/L for textile wastewater [8]. These progressively stringent international norms reflect a robust commitment to environmental governance, emphasizing the textile industry’s role in contributing to a more sustainable ecosystem. Therefore, in order to meet the increasingly stringent emission standards, further treatment of the biochemically processed dyeing and printing wastewater is necessary to enhance the overall treatment efficiency.
Several technologies could be employed for the advanced treatment of textile wastewater [9]. Adsorption is a cost-effective method for removing organic compounds and color from TW using activated carbon, resins, or other adsorbent materials [10]. Membrane separation technologies include reverse osmosis [11], nanofiltration [12], and ultrafiltration [13]. These technologies can effectively remove particles, dyes, and some soluble substances from TW [14]. Both of the aforementioned technologies entail significant costs and require the periodic regeneration or replacement of consumables. Advanced oxidation processes (AOPs) such as ozonation [15], the Fenton reaction [16], photocatalysis [17,18], and electrochemical oxidation can effectively mineralize refractory organics [19], converting them into CO2 and H2O.
Considering cost-effectiveness, iron–carbon micro-electrolysis is employed as an advanced oxidation process in water treatment [20]. This method involves the interaction of iron, often sourced from iron filings or scrap, with carbon to degrade pollutants in contaminated water. When these materials are introduced to water with a conductive electrolyte, micro-electrolytic cells form, with iron as the anode and carbon as the cathode. This arrangement triggers redox reactions where iron produces ferrous ions and hydroxide ions, which, in the presence of oxygen, yield ferric ions and hydrogen peroxide [21]. When ferric or ferrous ions exist, the hydrogen peroxide can react in a Fenton-like reaction to generate highly reactive hydroxyl radicals that can oxidize a wide spectrum of organic contaminants [22]. This process is esteemed for its economic and environmental advantages, leveraging low-cost materials and operational simplicity. The hydrogen peroxide produced by iron–carbon micro-electrolysis is limited. Thus, this study hypothesizes whether additional hydrogen peroxide can be added to continue the Fenton process, thereby degrading TW more effectively.
This research mainly focuses on the advanced treatment of TW by an iron–carbon micro-electrolysis process. Initially, a batch study was conducted in the laboratory to investigate the impacts of various factors on the process effectiveness and to explore the optimal conditions for this process. On this basis, the process was enhanced and applied in actual engineering projects. A comparative analysis of parent compounds in influent and degradation byproducts in effluent was conducted to delineate the pollutant transformation pathways and associated catalytic mechanisms. Subsequently, a pilot study was conducted at a wastewater treatment plant in an industrial park. Through this pilot study, the feasibility and effectiveness of this process after long-term operation were confirmed.

2. Experimental Section

2.1. Materials and Chemicals

The wastewater was obtained from the effluent of the secondary sedimentation tank of an industrial wastewater treatment plant.
Granular activated carbon (AC) (φ = 4.0 mm) and other chemicals were purchased from Sinopharm Co., Ltd., Shanghai, China. The iron scraps (IS) were obtained from a mechanical processing factory.
Since AC has a high adsorption capacity, it was soaked in TW (50 g AC/L TW) for 24 h before the micro-electrolysis reaction and this operation was repeated three times to guarantee that the AC achieved saturated adsorption. Iron scraps were immersed in 0.25 M H2SO4 for 10 min to remove oil and rust on their surfaces. After impurities were completely eliminated, the iron scraps were rinsed three times with distilled water (Watsons, Shanghai, China). The impregnated AC and cleaned iron scraps were dried in a drying oven (DHG-9036A, Jinghong Instrument, Shanghai, China) at 40 °C for 24 h before use.

2.2. Batch Experiments—Micro-Electrolysis Treatment

The impregnated AC and cleaned iron scraps were mixed in different ratios and dosed in 1 L of wastewater with dissolved oxygen via aeration (2 mg/L). After the reaction, the flocculant aluminum sulfate (250 mg/L) was added to the effluent and the pH value of effluent was adjusted to 9 with sodium hydroxide, before flocculation precipitation and the removal of Fe3+ and Fe2+ ions, and then various water quality indicators of the supernatant were determined. Based on the monitoring data of wastewater quality parameters, we systematically investigated the influence of three critical operational parameters-iron filing dosage, solution pH, and reaction duration-on organic pollutant removal efficiency. Through a controlled experimental design where individual variables were manipulated while maintaining other parameters constant, we performed comprehensive single-factor analysis. The experimental findings were subsequently validated using response surface methodology (RSM) to confirm the optimization potential of these interacting variables. The primary and secondary factors affecting the processing test and the optimal operating conditions were determined. The measurements shown are the means of three replicates, with the error bars representing standard errors of the means (SEMs).

2.3. Micro-Electrolysis Treatment in Continuous Flow Experiments

During the initial phase of the continuous flow system, the effluent from the secondary sedimentation tank was introduced at a flow rate of 40 L/h. An addition of 250 mg/L of the flocculant aluminum sulfate was made at each stage, and the coagulant aid calcium hydroxide was dosed to maintain a pH value of 9 in the effluent from the contact reaction tank. Aeration was carried out simultaneously to ensure that the carbon adsorption in the packing material reached saturation and that various metallic flocs maintained a stable rate of corrosion discharge. The dissolved oxygen content in the water was maintained within the range of 8–9 mg/L.

2.4. Iron–Carbon Micro-Electrolysis Coupled with a Hydrogen Peroxide Process for Textile Wastewater Treatment

In the iron–carbon micro-electrolysis reaction system, the raw TW is adjusted to pH 3.5, and the reaction produces large amounts of Fe2+ and Fe3+ ions, creating a favorable environment for the Fenton reaction. If H2O2 is combined with the iron–carbon reaction, it will enhance the overall process, achieving the effective coupling of iron–carbon micro-electrolysis and Fenton reactions. The combined process is based on the enhancement of the iron–carbon micro-electrolysis; therefore, the ratio of iron to carbon and the dose of iron remain unchanged. The processed iron filings and activated carbon particles were mixed in the previously determined ratio, placed in a 2 L container, and 1 L of pH-adjusted raw TW was added. Simultaneously, a certain amount of H2O2 was introduced, and the mixture was aerated at room temperature. After the reaction, the effluent was dosed with aluminum sulfate flocculant and the pH was adjusted to 9 using sodium hydroxide for flocculation and sedimentation to remove Fe3+ and Fe2+ ions. Subsequently, various water quality indices of the supernatant were measured. Based on the obtained effluent indices, the effects of different H2O2 doses, pH levels, and reaction times on water quality were studied to determine the optimal operational conditions.

2.5. Pilot Scale Test

A schematic diagram of the pilot plant system is shown in Figure S1. The experimental setup mainly includes four major components—a dosing device, a contact reaction tank, a chemical dosing mixing tank, and a coagulation sedimentation tank—as well as ancillary facilities, such as flow meters and chemical dosing equipment, and various types of gas, water, and chemical transport pipelines, including gas flushing pipelines. More details are described in Text S1.

2.6. Analytical Methods

The chemical oxygen demand (COD) was determined using the closed reflux potassium dichromate method according to standard procedures [23]. Measurements were performed with a DRB 200 digital reactor and a DR 6000 spectrophotometer (Hach, Loveland, CO, USA). The detailed analytical steps were as follows: homogenized water samples were filtered through 0.45 μm glass fiber filters to remove suspended solids, and a 2 mL aliquot of the pretreated sample was transferred into a pre-cleaned COD digestion vial (Hach, Loveland, CO, USA) containing potassium dichromate, concentrated sulfuric acid, and silver sulfate as a catalyst. The vial was tightly sealed and placed into the DRB200 reactor (Hach, Loveland, CO, USA). The digestion was conducted at 150 °C for 120 min to ensure complete oxidation of organic compounds. After digestion, the vial was cooled to room temperature (25 ± 2 °C) to stabilize the reaction products. The absorbance of the digested solution was measured at 600 nm using a DR 6000 spectrophotometer. COD concentrations were quantified based on a pre-established calibration curve (range: 0–1500 mg/L COD) generated from potassium hydrogen phthalate standards. A blank solution (deionized water) underwent identical procedures to account for background interference, and its absorbance value was subtracted from the sample measurements.
The biochemical oxygen demand (BOD5) test was conducted following the standard 5-day incubation method (APHA 5210B). Measurements were performed using a BOD Trak™ II apparatus (Hach, Loveland, CO, USA) equipped with pressure-sensor manometers and temperature-controlled incubation chambers. The analytical procedure included the following steps: Samples were adjusted to pH 6.5–7.5 using sulfuric acid or sodium hydroxide. For samples containing residual chlorine, sodium sulfite was added for dechlorination. Nutrient supplementation (phosphate buffer, magnesium sulfate, calcium chloride, and ferric chloride) and microbial seeding (using activated sludge filtrate) were applied to ensure optimal microbial activity. Samples were diluted with aerated dilution water (BOD nutrient buffer solution, Hach, Loveland, CO, USA) to maintain dissolved oxygen (DO) depletion between 2 and 7 mg/L after 5 days. Diluted samples were transferred into pre-calibrated BOD bottles, sealed to exclude air bubbles, and incubated at 20.0 ± 1.0 °C for 5 days in the BOD Trak™ II system. Initial and final DO concentrations were measured using a HQ40D multi-meter with LDO 101 luminescent dissolved oxygen probe (Hach, Loveland, CO, USA). The BOD5 value was calculated as follows:
B O D 5 ( m g / L ) = D 1 D 2 ( B 1 B 2 ) f
where D1 and D2 are DO values of the diluted sample before and after the incubation, B1 and B2 are the DO values of the blank, and f is the dilution factor. Glucose–glutamic acid standard solutions (150 mg/L BOD5) were analyzed in parallel to validate the method accuracy (recovery: 98–102%). All tests were performed in triplicate, and the results are reported as the means ± standard deviations.
The pH of water samples was measured using a PHB-4 pH meter (INESA, Shanghai, China).
The ammonia nitrogen (NH3-N) concentration was determined by the Nesslerization spectrophotometric method following standard guidelines (APHA 4500-NH3 B). Measurements were carried out using a DR6000 spectrophotometer (Hach, Loveland, CO, USA) and pre-prepared TNTplus™ ammonia reagent vials (Hach, Loveland, CO, USA). The analytical protocol is outlined below. Samples were filtered through 0.45 μm cellulose ester membranes to remove turbidity. For complex matrices (e.g., wastewater), preliminary distillation at pH 9.5 with borate buffer was performed to isolate free ammonia. A 10 mL aliquot of the filtered sample was transferred into a TNTplus™ vial prefilled with Nessler reagent (potassium tetraiodomercurate, K2HgI4) and sodium potassium tartrate (to suppress calcium/magnesium interference). The vial was inverted repeatedly to mix and allowed to stand for 10 min at 25 °C. A yellow-orange complex formed proportionally to the NH3-N concentration. Absorbance was measured at 425 nm using a DR6000 spectrophotometer (Hach, Loveland, CO, USA). Concentrations were calculated against a calibration curve (0–50 mg/L NH3-N) generated from ammonium chloride (NH4Cl) standards. A blank (deionized water) was processed identically, and its absorbance was subtracted from the sample readings.

2.7. Modeling by the Response Surface Method

The Box–Behnken design (BBD) of response surface methodology was adopted to optimize the reaction conditions for COD removal efficiency by Design-Expert software (Trial Version 8.0).
Initial single-factor tests identified optimal ranges for the pH (2–5), H2O2 dose (100–160 mg/L), and iron-to-carbon ratio (1:1–1:3). These ranges were selected based on the preliminary COD removal efficiency (>50%) and reaction kinetics. The experimental results were fitted and optimized by multiple stepwise regression technology with Design-Expert software (Table 1 and Table 2), and the optimal experiment results were tested via a verification experiment (Tables S2–S4).

2.8. Determination of the Reaction Intermediates

Gas chromatography–mass spectrometry (GC-MS) tests (2010PLUS, Shimadzu, Kyoto, Japan) were conducted on the effluent from the sedimentation tank, the iron–carbon micro-electrolysis process, and the combined process. The testing conditions were as follows: GC conditions—used a DB-5s high-efficiency capillary column (30 m × 250 μm × 0.25 μm); temperature program—initial temperature of 40 °C, held for 3 min, then ramped at 15 °C·min−1 to 280 °C, and held for 10 min; and MS conditions—electron ionization (EI) mode, electron energy of 70 eV, ion source temperature of 200 °C, and mass range of 29–500. The types and relative contents of organic substances in the effluents from various processes were identified by GC-MS, analyzing the degradation mechanisms of pollutants in water by each process. In the experiment, the chromatograms obtained from sample testing were analyzed using the chemical database of the National Institute of Standards and Technology (NIST), where peak areas of organic compounds were normalized. Peaks representing major organic components constituting more than 0.5% of the maximum component area were taken. By comparing with the database, the matched substances along with their molecular weights and concentration ratios (chromatographic peak integral areas) are listed.

3. Results and Discussion

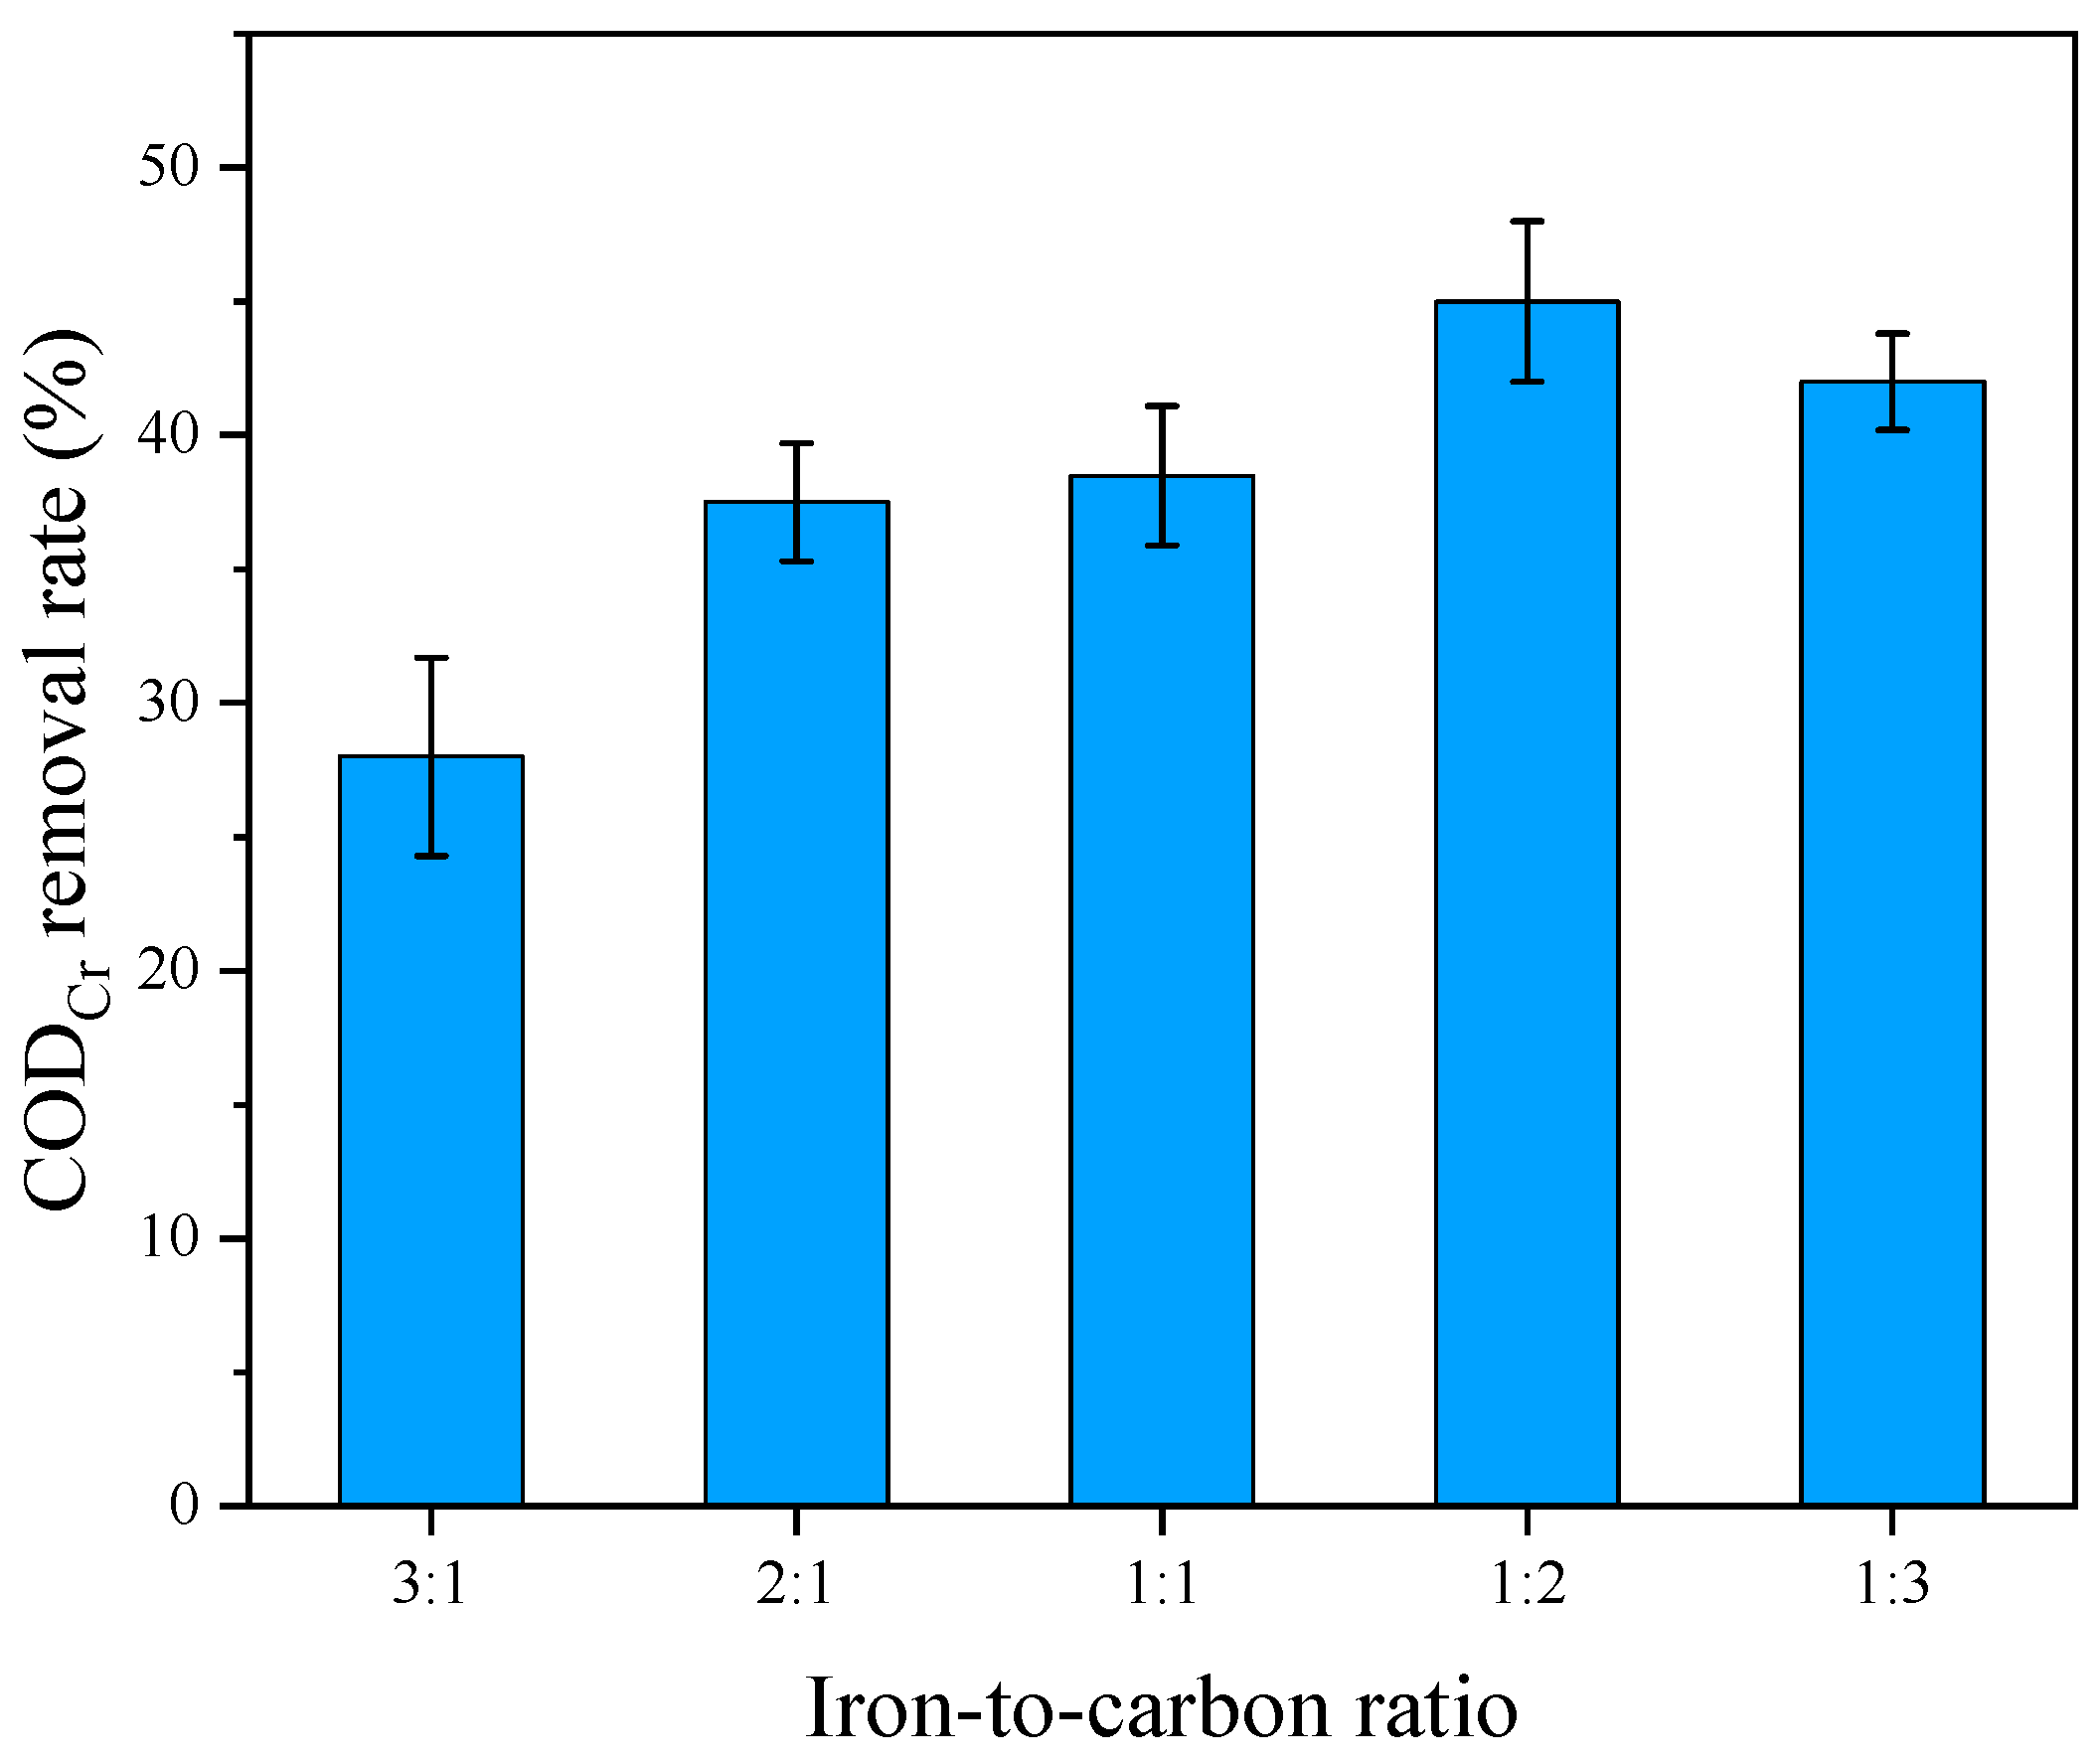
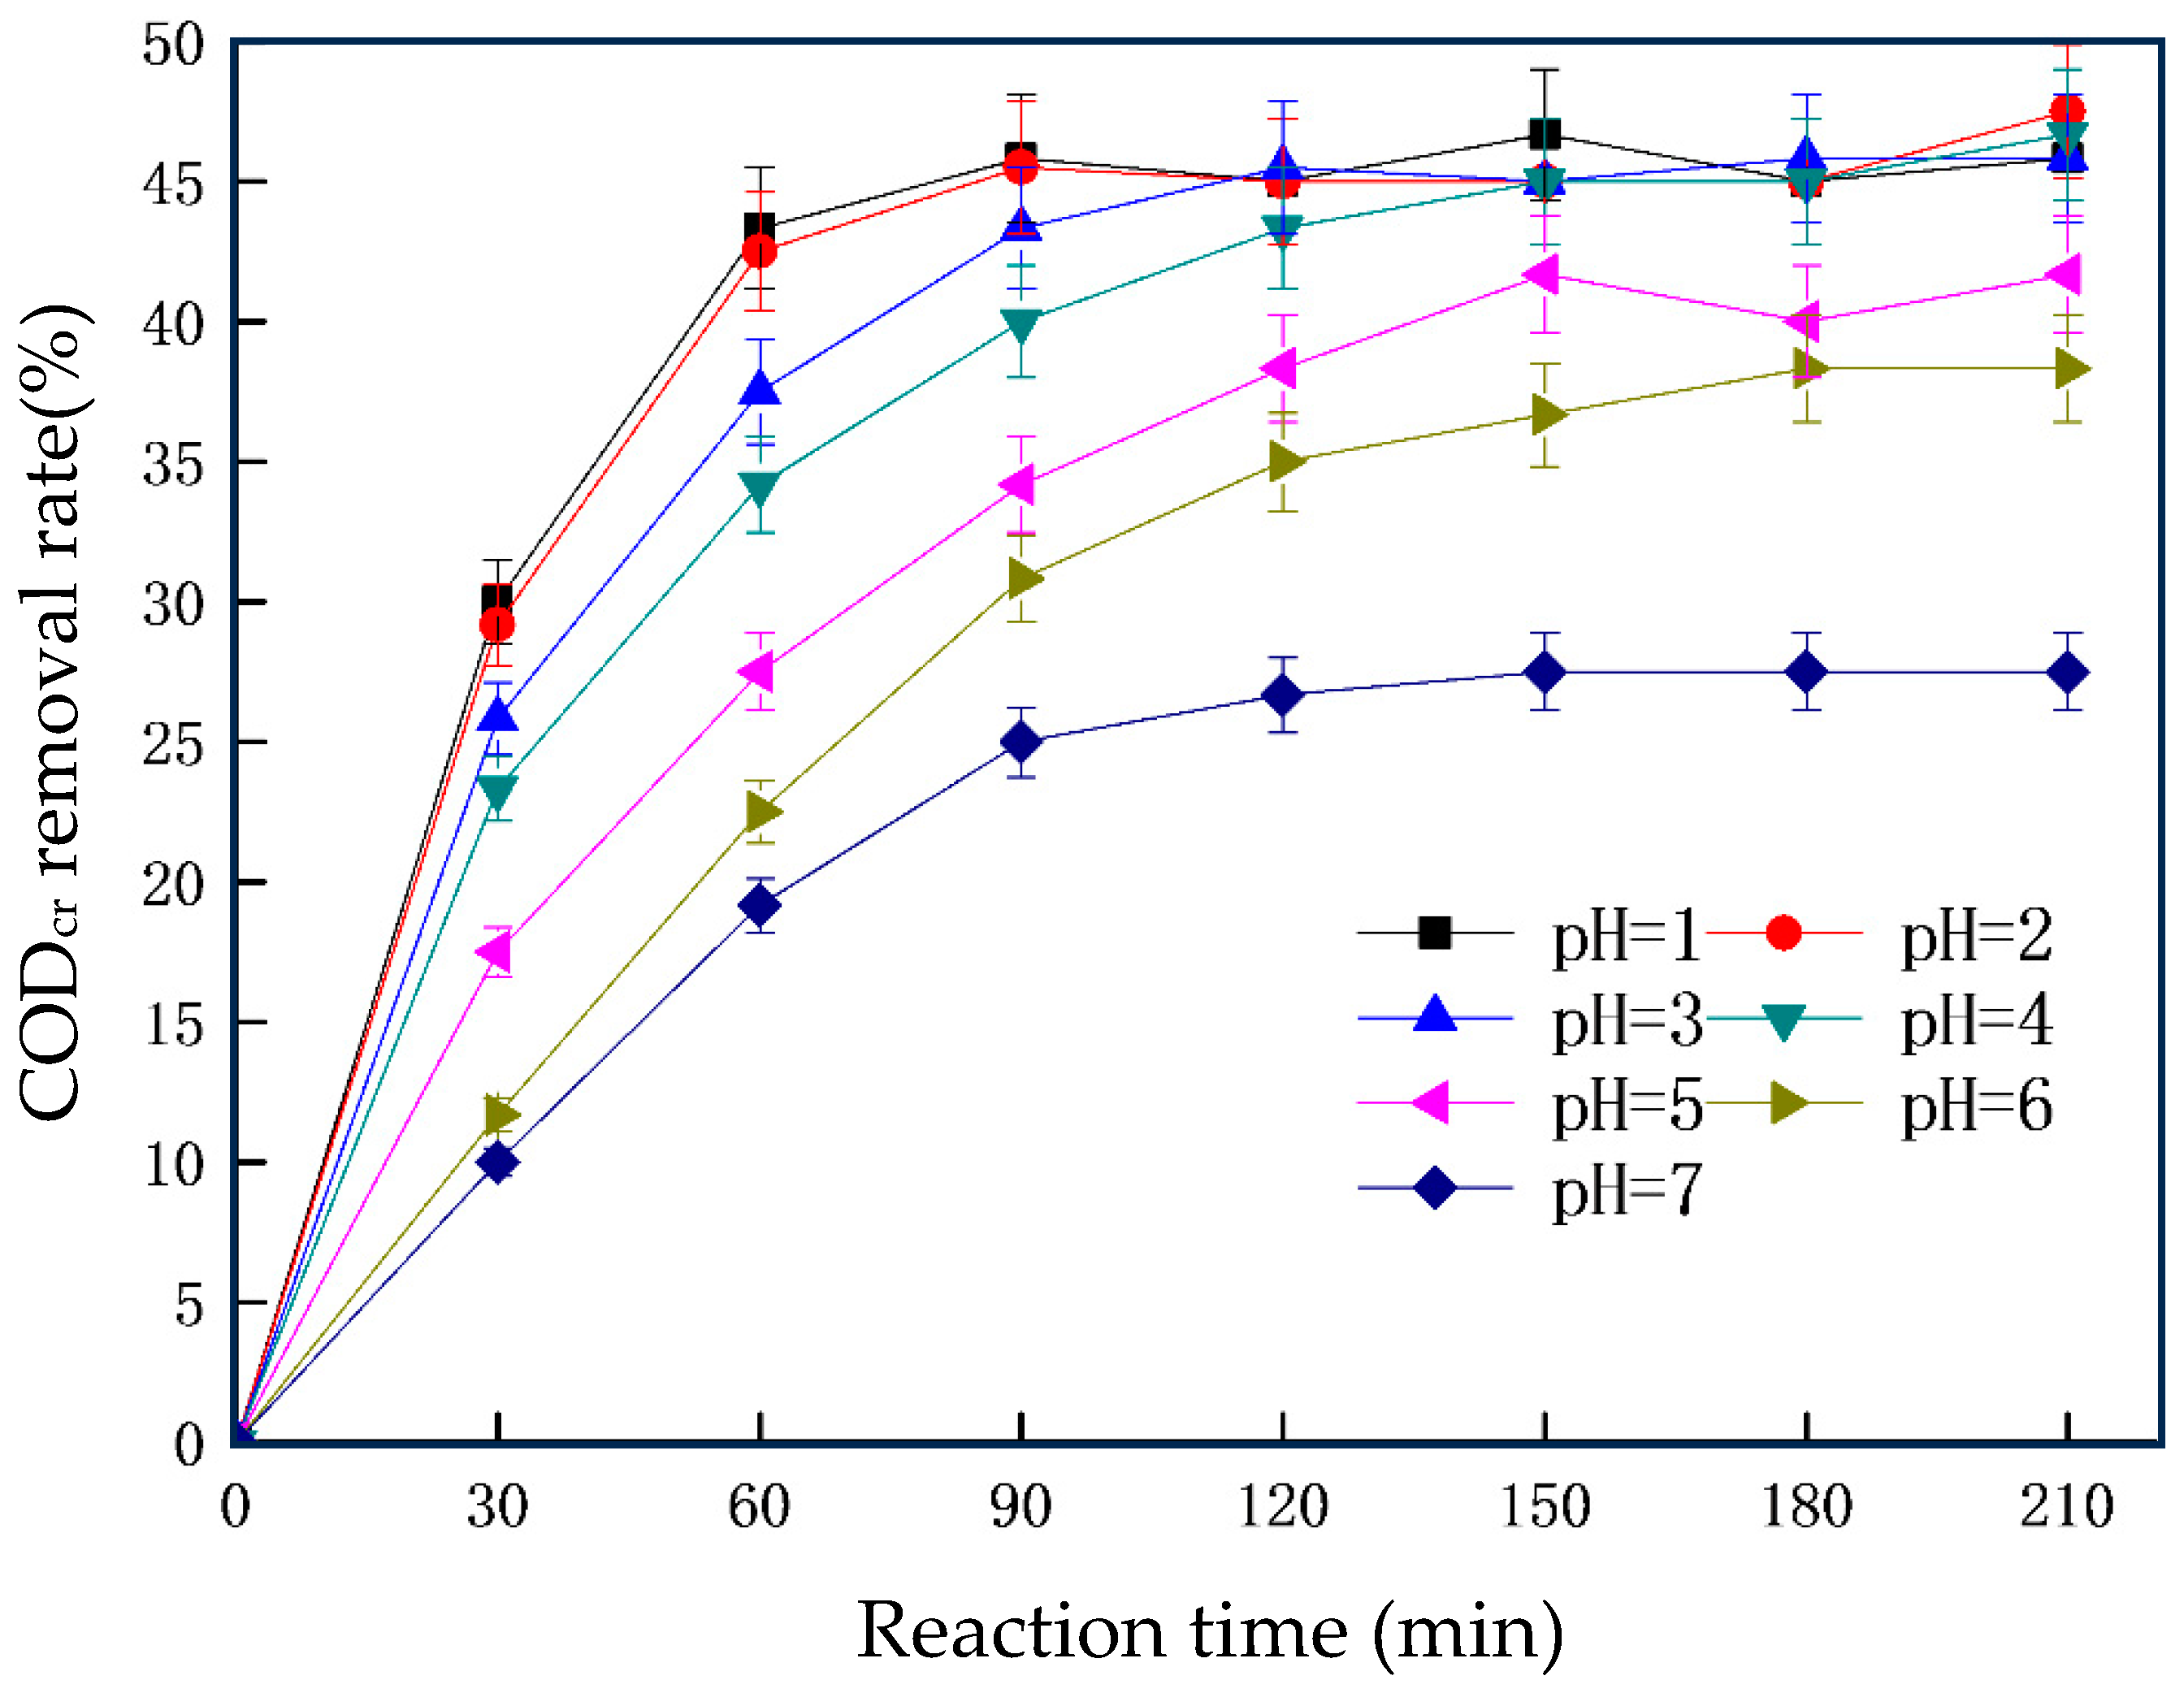
3.1. Single-Factor Experiment of the Iron–Carbon Micro-Electrolysis Reaction

The characteristics of wastewater in this study are shown in Table S1. The reaction time was controlled to 180 min, and the impact of different iron filing doses on the effluent CODCr was analyzed. The results are shown in Figure 1. As shown in Figure 1, it is evident that as the amount of iron filings increases, the CODCr of the effluent gradually decreases, and the treatment effect of the iron–carbon micro-electrolysis method increases with the increase in the iron filing dose. Between 10 and 25 g/L, the CODCr removal rate shows a significant increase with an increasing amount of iron filings. When the dose reaches above 25 g/L, the removal rate of CODCr tends to level off. With a lower amount of iron filings, the number of primary cells formed is fewer, and there is a clear shortage of electron donors, resulting in insufficient electrons involved in the oxidation reaction of organic matter in the raw water. When an excess amount of iron filings is added, although the number of primary cells and the supply of electron donors are ensured, the redox potential does not essentially change. The excess iron filings participate in the displacement reaction with H+, trapping a large amount of electrons, which then leave the system as H2, minimally affecting the degradation of organic materials. Furthermore, due to the excessive participation of elemental iron in the reaction, the subsequent use of reagents increases, leading to significant sludge production in the coagulation and sedimentation process, which elevates the cost of the process. Therefore, the optimal dose of iron filings is 25 g/L.
The pH of the raw water was adjusted to four and the iron dose was controlled at 25 g/L. The micro-electrolysis reaction was conducted using iron-to-carbon ratios of 3:1, 2:1, 1:1, 1:2, and 1:3, maintaining the reaction time at 180 min, and the effects of different iron-to-carbon ratios on the effluent CODCr were analyzed. As shown in Figure 2, the removal rate of CODCr in the effluent increases as the iron-to-carbon ratio decreases. The optimal treatment effect is achieved when the iron-to-carbon mass ratio is 1:2, with the effluent CODCr at 68 mg/L and a CODcr removal rate of 45%. However, a further reduction in the iron-to-carbon ratio begins to show a declining trend in removal effectiveness. As iron filings and activated carbon serve as the materials for the cathode and anode of the primary cells, decreasing their ratio increases the number of primary cells and their contact area, which is beneficial for the decomposition of organic substances in the water. If the iron-to-carbon ratio is too high, it prevents the wastewater’s organics from fully participating in the reaction, and excess iron directly partakes in the displacement reaction with H+, with a large amount of electrons leaving the system as H2. When the iron-to-carbon ratio is too low, the excess activated carbon does not significantly contribute to the decomposition of organics in the water, rendering its presence somewhat redundant and adding unnecessary costs. Therefore, the optimal mass ratio of iron to carbon for this process is 1:2.
The pH of the raw water was adjusted to values ranging from 1 to 8, the iron dose was controlled at 25 g/L, and micro-electrolysis was conducted with an iron-to-carbon ratio of 1:2. The reaction time was set at 210 min, with water samples taken every 30 min to analyze the effects of different pH levels and reaction times on the effluent CODCr. As indicated in the study, the pH significantly influences the treatment effectiveness of the iron–carbon micro-electrolysis method. As shown in Figure 3, the optimal treatment performance is achieved at a pH value below 4, with a CODCr removal rate of approximately 45%. Lower pH values enhance treatment effectiveness because reducing the influent pH can increase the system’s oxidation-reduction potential, allowing the iron–carbon primary cells to have a higher electromotive force. A low influent pH also effectively protects the electrodes, reducing electrode polarization and passivation [24].
Moreover, low-pH conditions promote the generation of iron and ferrous ions and enhance the activity of nascent hydrogen, which are beneficial for subsequent coagulation and sedimentation. However, an excessively low pH not only fails to further enhance the treatment capability but also requires substantial acid use for adjustment, accelerating the consumption of primary cell cathodes and subsequent costs of base addition for coagulation. Therefore, an optimal influent pH value of 4 is advisable. Meanwhile, as shown in the data, CODCr removal rates gradually increase with time. However, after 150 min, no significant change is observed. Further reaction is deemed unnecessary. In engineering terms, excessively long reaction times increase the volume of structures, adding to additional civil construction costs. Thus, an optimal reaction time of 150 min is recommended.

3.2. Response Surface Analysis of Iron–Carbon Micro-Electrolysis

Based on the variance analysis of the predictive model, the effects of the iron dose, inverse iron-to-carbon ratio, and pH value on the CODCr removal rate in the effluent were visualized using software (Design-Expert software (Trial Version 8.0))-generated contour and three-dimensional plots, as shown in Figure 4. The shape of the contour lines (circular or elliptical) indicates the extent of the interaction effects. If the contour is circular, the interaction effect is not significant; if it is elliptical, the interaction effect is significant.
Figure 4a indicates that the interaction effect between the iron dose and the inverse iron-to-carbon ratio is not significant when the pH value is at its central value. The three-dimensional surface plot displays the effects of the iron dose and the inverse iron-to-carbon ratio on the CODCr removal rate in the effluent at the central value of pH. The iron dose, which increased from 20 g/L to 27 g/L, enhances the removal rate from approximately 36% to about 46%. As the iron dose continues to increase beyond this level, the removal rate begins to decline. Therefore, the optimal value of the iron dose appears to be around 27 g/L. Since the interaction between the iron dose and the inverse iron-to-carbon ratio is not significant, the inverse iron-to-carbon ratio should ideally be maintained around 2.5.
Figure 4b shows the impacts of the iron dose and pH value on the CODCr removal rate in the effluent, with the inverse iron-to-carbon ratio at its central value. From the density of the contour lines, it is evident that there is a significant interaction between iron dose and pH value. When the pH value is less than 3.7, the removal rate increases with an increase in the iron dose, reaching a peak of about 46%. When the pH value exceeds 3.7, the removal rate also increases with higher iron doses but does not reach the maximum value predicted by the fitting function. When the iron dose is fixed and pH value continues to rise, the removal rate consistently decreases. Thus, lowering the pH value and appropriately increasing the iron dose can yield better treatment results.
Figure 4c shows the effects of pH and the inverse iron-to-carbon ratio on the adsorption rate when the dose of iron is at the central value. It can be observed from the graph that when the pH value is less than 4.5, the CODCr removal rate of the effluent increases with the increase in the 1/iron-to-carbon ratio. As the proportion of carbon in the packing increases, the number of fuel cells increases, and to achieve an ideal removal rate, it is appropriate to increase the value of the 1/iron-to-carbon ratio.
Through a software analysis, the following optimal theoretical reaction conditions and results were determined: the dose of iron is 26.7 g/L, the 1/iron-to-carbon ratio is 2.4, and the pH is 3.4. Under these conditions, the CODCr removal rate in the effluent is 46.7%. In the practical verification phase, setting the reaction with an iron dose of 27 g/L, a 1/iron-to-carbon ratio of 2.5, and a pH of 3.5, it is found that the actual CODCr removal rate is 46.0%, with a deviation of 1.5% from the theoretical value. Thus, the response surface is feasible for optimizing this process, and the optimized conditions obtained have practical application value.

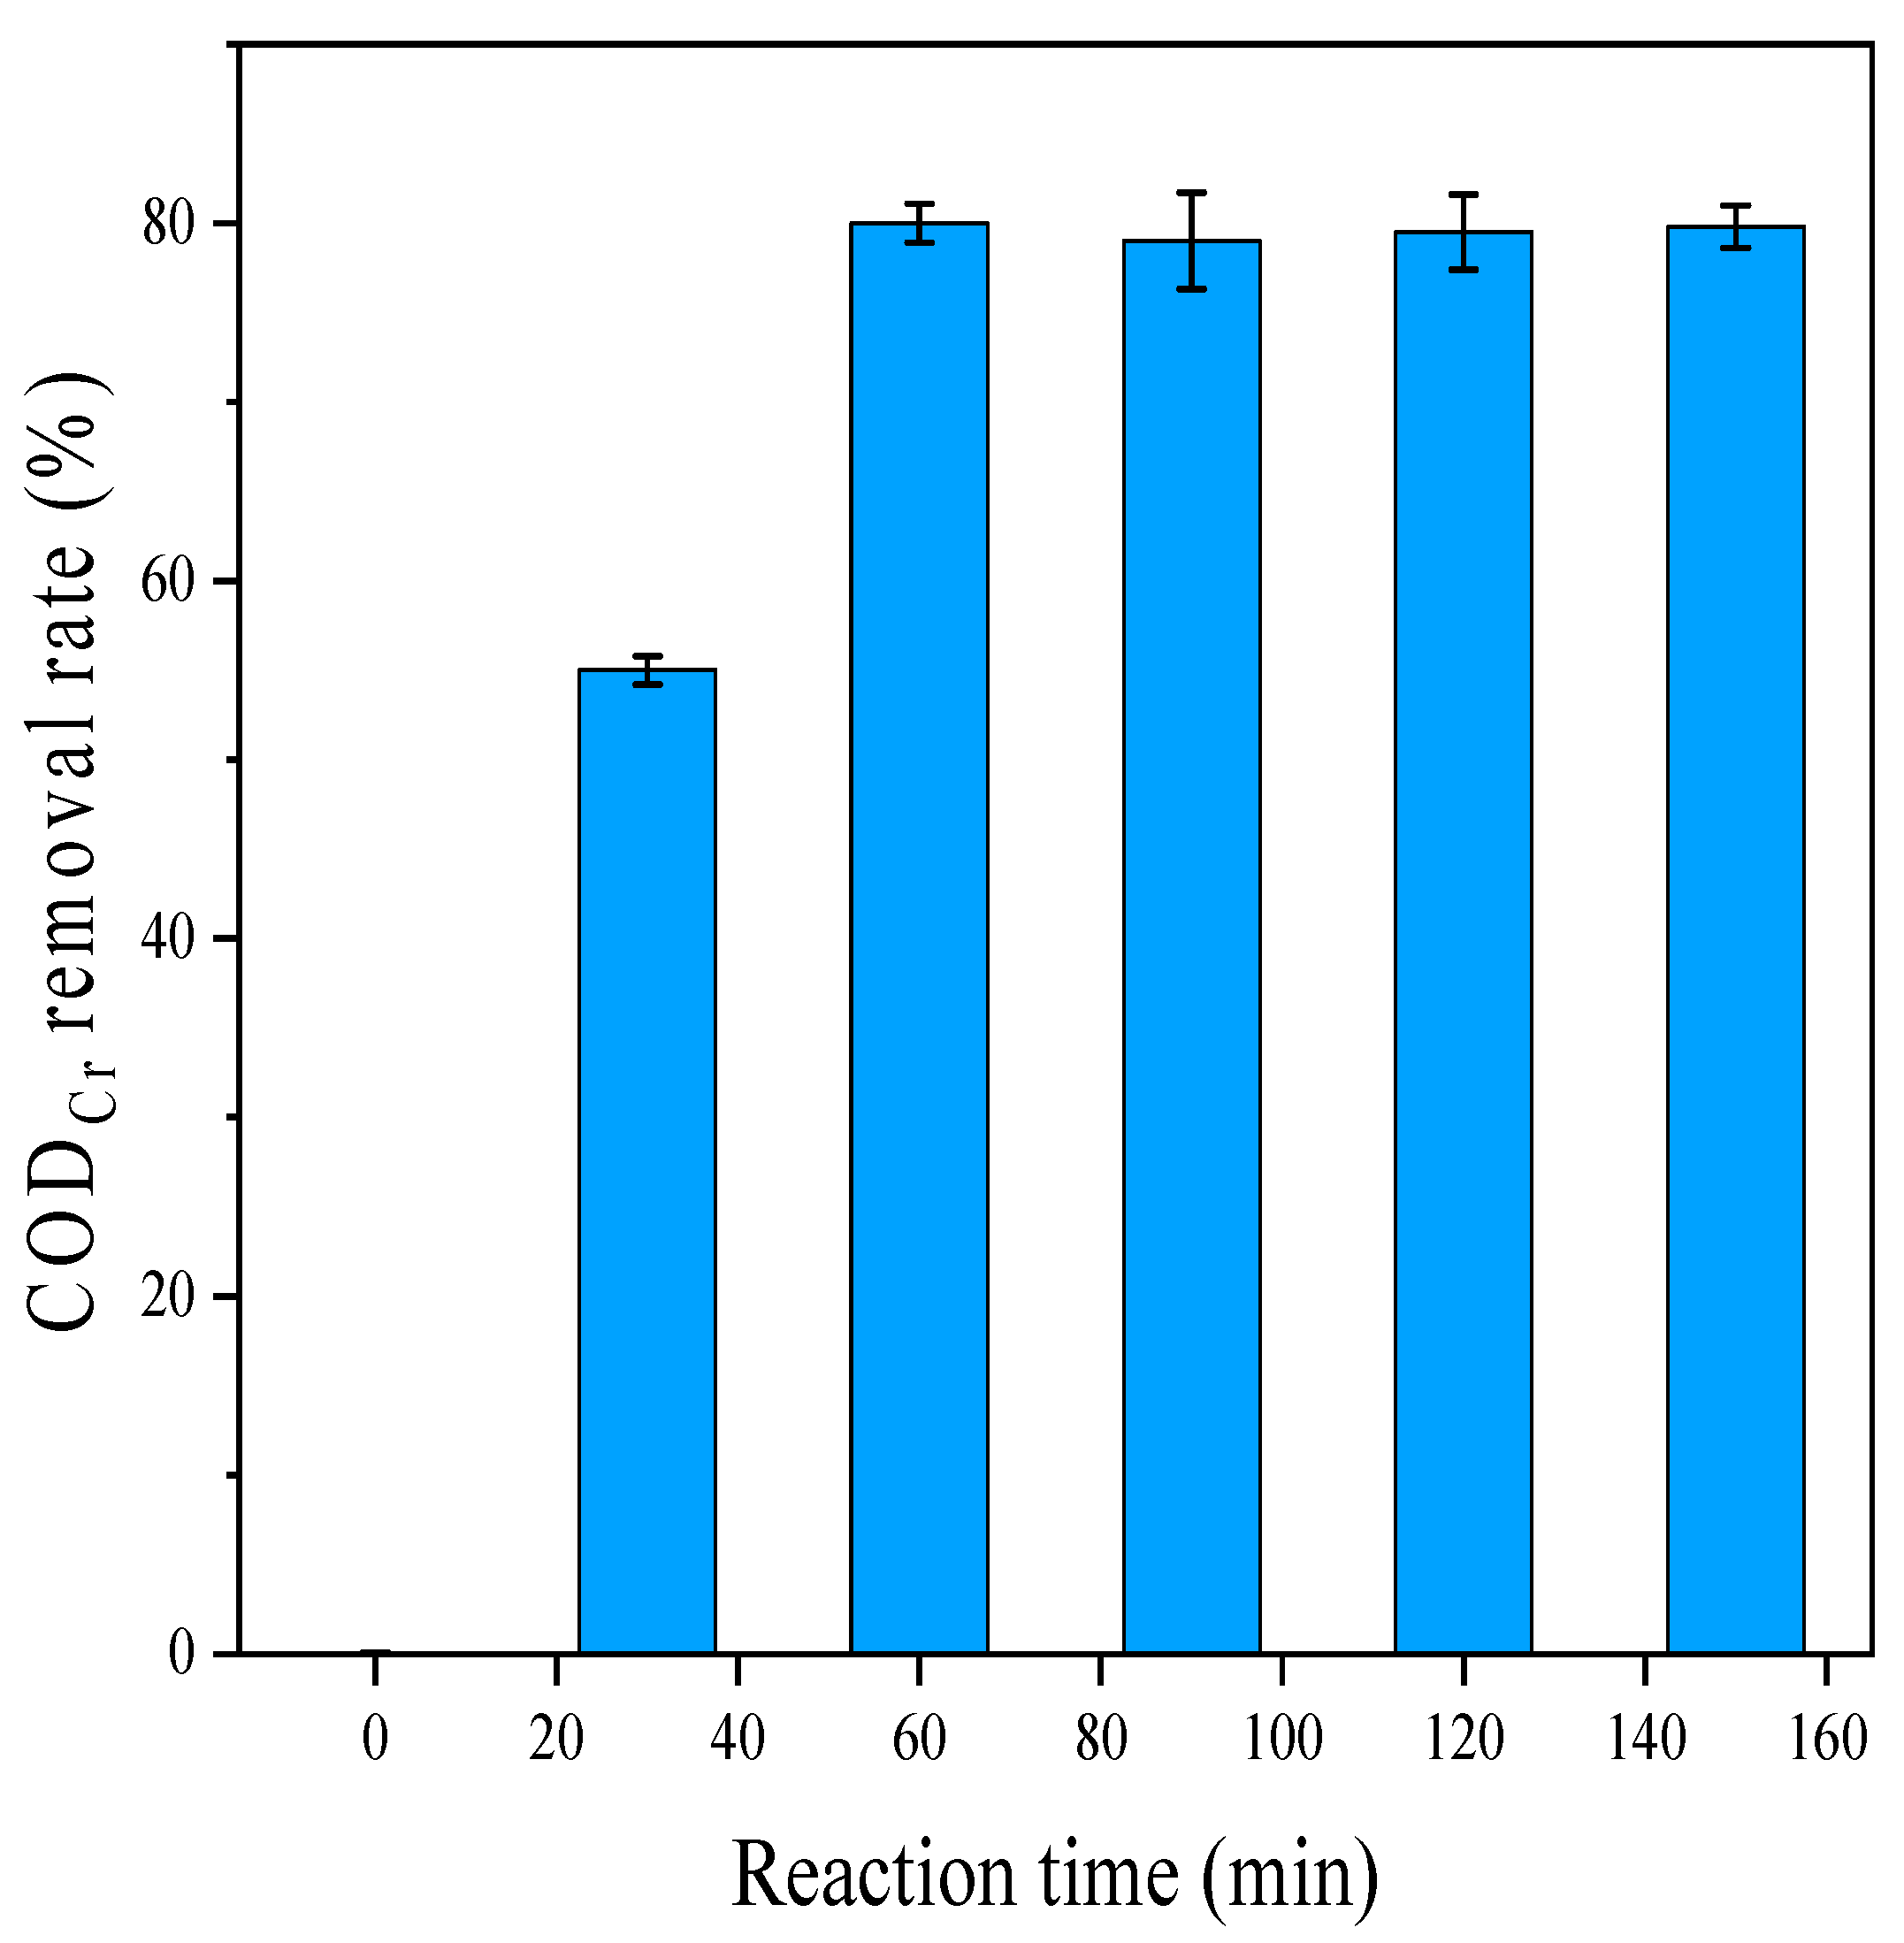
3.3. Single-Factor Experiment of Iron–Carbon Micro-Electrolysis Coupled with a Hydrogen Peroxide Reaction

The dose of H2O2 was controlled at 130 mg/L, and the combined process treatment was carried out at pH values of 1, 2, 3, 4, and 5, respectively, with the reaction time controlled at 120 min to analyze the impacts of different pH values on the effluent quality. As shown in Figure 5, as the pH value continuously decreases, the CODCr of the effluent gradually decreases. When the pH value reaches 3.0, the CODCr removal rate hits a maximum of 69%. As the pH value further decreases, the quality of the effluent starts to deteriorate. The main reason is that under the excessively low pH conditions, H2O2 rapidly decomposes to produce a large amount of hydroxyl radicals, leading to the quenching of many radicals. This results in the needless waste of the oxidant. Therefore, the optimal influent pH value should be controlled at around 3.
The influent pH was controlled at 3 and the dose of H2O2 was varied at 40, 70, 100, 130, and 160 mg/L to perform combined process treatments, with the reaction time set to 120 min to analyze the effects of different hydrogen peroxide doses on the effluent quality. As depicted in Figure 6, as the dose of H2O2 increases, the COD of the effluent gradually decreases. When the H2O2 dose reaches 130 mg/L, the CODCr removal rate peaks, indicating the best effluent quality. However, as the H2O2 dose is further increased beyond 130 mg/L, the effluent COD starts to rise. This rise is attributed to the excess H2O2 that remains after a prolonged reaction period. With further increases in the hydrogen peroxide dose, unreacted H2O2 begins to be detected in the effluent. Since hydrogen peroxide is a reducing agent relative to potassium dichromate, the residual hydrogen peroxide interferes with the COD measurement, resulting in a higher apparent COD. Therefore, the optimal dose of hydrogen peroxide should be 130 mg/L.
The influent pH was controlled at 3 and the H2O2 dose at 130 mg/L, and the combined process treatment was carried out under these conditions. Water samples were collected at reaction times of 0, 30, 60, 90, 120, and 150 min, followed by flocculation. The effect of the reaction time on the effluent quality was analyzed. According to Figure 7, the highest COD removal efficiency occurs between 0 and 60 min. As the reaction time further increases, the effluent quality begins to stabilize. By the time the system reaches 120 min, the effluent quality is essentially stable. Therefore, the optimal reaction time for this process is 120 min.

3.4. Response Surface Analysis of Iron–Carbon Micro-Electrolysis Coupled with a Hydrogen Peroxide Reaction

The analysis of Figure 8a indicates that the interaction between the pH value and H2O2 dose is very significant when the reaction time is set at the central value. The three-dimensional surface plot illustrates the effects of the pH value and H2O2 dose on the effluent’s CODCr removal rate under the condition of a central reaction time. At a fixed pH value of 3, when increasing the H2O2 dose from 100 mg/L to 130 mg/L, the removal rate rises from about 60% to approximately 79%. As the H2O2 dose continues to increase, the removal rate begins to decline, indicating an excess of unreacted H2O2. Thus, the optimal dose of H2O2 is around 130 mg/L.
Figure 8b shows the effects of the reaction time and pH value on the CODCr removal rate under the condition of the central value of the H2O2 dose. From the contour density, it can be clearly seen that the interaction between the H2O2 dose and pH value is significant. When the pH value is less than 3.5, the removal rate increases with the increase in the iron dose and ultimately reaches a maximum of about 79%; when the pH value is greater than 3.5, the removal rate increases with the increase in the iron dose but cannot reach the maximum value of the fitting function. When the H2O2 dose is fixed, as the pH value continues to rise, the removal rate shows a trend of first increasing and then decreasing. Figure 3 and Figure 4 shows the effects of the H2O2 dose and reaction time on the CODCr removal rate under the central pH value condition. It can be observed from the figure that the interaction between them is not obvious.
The software analysis (Figure 8c) has identified the theoretical optimal reaction conditions and results, a pH value of 2.75, an H2O2 dose of 131.43 mg/L, and a reaction time of 121.26 min, under which the corresponding CODCr removal rate is 79%. The theoretical optimal conditions (pH 2.75, H2O2 131.43 mg/L, and 121.26 min) predicted a 79% COD removal. Experimental validation under practical conditions (pH 3, H2O2 130 mg/L, and 120 min) achieved 78% removal, confirming the robustness of the RSM model (deviation: 1.3%). Therefore, the response surface methodology is feasible for optimizing this process, and the optimized conditions obtained are of practical value.

3.5. Potential Degradation Pathways

Eleven types of organic compounds were detected (Table 3). The main pollutants in the effluent from the secondary sedimentation tanks of the wastewater treatment plant are indole, thiophene, esters, palmitic acid, and substances containing saturated long-chain amides. Among these, thiophene and palmitic acid have the highest concentrations, accounting for over 67.2% of the total area of the detected organic compounds, and are major contributors to the COD. These organic compounds often contain saturated long chains or cyclic structures. These substances are chemically stable, have large molecular weights, and are difficult for microorganisms to decompose, requiring advanced treatment for degradation.
Table 4 shows the GC-MS analysis results of the effluent from the iron–carbon micro-electrolysis treatment, indicating a certain degree of degradation of organic substances. Compared to the effluent from the secondary sedimentation tank, thiophene, which had the highest relative content in the effluent from the iron–carbon micro-electrolysis, was well degraded. Indole and glycidyl ether were almost completely degraded, with their decomposition products not detected. This suggests that the process effectively disrupts the thiophene structure, as illustrated in Table 4, where two chemical bonds are broken. The broken parts recombine, transforming the original compound into ortho-tolyl isothiocyanate. However, this process does not effectively remove other organic substances from water, which is why the COD levels in the treated water remain high. The effluent from the iron–carbon process still contains ester substances, which are difficult for natural microorganisms to decompose. Discharging the treated effluent directly into natural water bodies can cause certain negative environmental impacts.
Table 5 presents the GC-MS analysis results of the effluent from the combined process, where many organic compounds were effectively degraded. Compared to the effluent from the secondary sedimentation tank, compounds such as indole, thiazole, and glycidyl ether were completely degraded, with no detection of these substances or their degradation products. Most ester substances were degraded, and some were transformed into alcohols (Scheme 1). The ester bonds in ester substances were broken down, hydrolyzing into alcohols. Amide substances also decomposed to various extents.
Scheme 1: Esters (RCOOR′) + H2O → Alcohols (R′OH) + Carboxylic Acids (RCOOH)
As shown in Table 5, lipid substances in the raw water were essentially degraded into alcohol substances. These substances, after being processed through the technology, were discharged into natural water bodies, making them easier to be biologically decomposed and metabolized, thereby having a minimal impact on the environment.
The effluent from the iron–carbon micro-electrolysis process still contained a certain amount of pollutants, with a large number of ester substances not being effectively removed, and thiazole not being completely degraded. In the effluent from the combined process, a certain amount of pollutants were well degraded, and lipids were almost all hydrolyzed into alcohols, which are more environmentally friendly. Amide substances were also somewhat degraded. However, neither process was very effective at degrading palmitic acid. A certain amount of palmitic acid still remained in the effluent. Palmitic acid, a saturated long-chain fatty acid, resisted degradation due to its hydrophobic structure and low reactivity with hydroxyl radicals. Its persistence aligns with prior studies on micro-electrolysis limitations for high-molecular-weight organics.

3.6. Pilot-Scale Test

3.6.1. Process Steps

The process steps are detailed in Section S1 in Supplementary Materials.

3.6.2. Process Operation Efficiency

Through continuous operation for 35 days (Table S3), it was found that the highest COD removal rate in the effluent was achieved when the influent pH value was 3.5 and the H2O2 dose was 170 mg/L, with an average of approximately 57%. Even though there were fluctuations in the influent COD values, the effluent COD consistently met the Level B standard of Chinese discharge standard of water pollutant for dyeing and finishing of textile industry (GB 4287-2012) [6], with an average value of 49 mg/L. Under other reaction conditions, the effluent did not achieve satisfactory results, or there were non-compliant cases. Therefore, the optimum conditions for the pilot test should be an influent pH value of 3.5 and an H2O2 dose of 170 mg/L. Looking at the removal rate of CODcr under the optimal operating conditions, the average effect of the pilot test was 57%, while that of the bench-scale test was 78%, indicating a significant difference. At the pilot scale, the H2O2 decomposition kinetics are dominated by interfacial mass transfer rather than intrinsic reaction rates. The primary reason for this discrepancy is that the iron–carbon used in the pilot test was of a hanging type filler, while in the bench-scale test, the iron–carbon was open, leading to insufficient contact between the iron–carbon and the wastewater in the pilot test and poor mass transfer effects. The influent in the pilot test was continuous flow, whereas it was batchwise in the bench-scale test, resulting in more complete reactions in the latter.

3.6.3. Economic Assessment

The operating cost of iron–carbon micro-electrolysis coupled with hydrogen peroxide process for TW treatment is listed in Table 6. The process consumed 170 mg/L H2O2 and 25 g/L iron scraps per cycle, with energy costs estimated at USD 0.12/m3. This is competitive with Fenton oxidation (USD 0.18/m3) but requires sludge disposal. Under the current pilot test conditions, the total operating cost of TW treatment was 1.27903 CNY/m3 (0.179 USD/m3) by adopting the iron–carbon micro-electrolysis coupled with hydrogen peroxide process.

4. Conclusions

This study evaluated the effectiveness of iron–carbon micro-electrolysis coupled with a hydrogen peroxide reaction for the removal of organic pollutants from secondary sedimentation tank effluent using response surface analysis. GC-MS analysis revealed the presence of 11 major organic pollutants in the secondary effluent, with thiophene and palmitic acid being the most abundant, accounting for over 67.2% of the total detected compounds. These substances are major contributors to the chemical oxygen demand (COD) due to their chemical stability and large molecular weights, making them difficult to degrade by microorganisms.
The GC-MS analysis of the effluent treated by iron–carbon micro-electrolysis showed significant degradation of thiophene and indole, with indole and glycidyl ether almost completely decomposed. However, the process was less effective at removing other organic substances, resulting in the presence of ester compounds in the treated effluent.
The combined treatment process further improved the degradation of organic compounds, as indicated by the GC-MS analysis of the combined process effluent. Most ester substances were hydrolyzed into alcohols, and lipid substances were almost completely degraded into alcohols, making them more biodegradable and reducing their environmental impacts. However, palmitic acid remained largely undegraded in the effluent, highlighting a limitation of both treatment processes. Future research should focus on optimizing the process conditions to improve the removal efficiency of hard-to-degrade substances like palmitic acid.
A 35-day continuous pilot-scale test identified optimal operating conditions of an influent pH of 3.5 and an H2O2 dose of 170 mg/L, achieving an average COD removal rate of 57%. Although the pilot-scale test showed a lower COD removal efficiency compared to the bench-scale test (78%), the effluent COD still met the Level B standard of the Chinese discharge standard for water pollutants in the dyeing and finishing textile industry (GB 4287-2012). The iron–carbon micro-electrolysis coupled with hydrogen peroxide process shows potential for the degradation of complex organic pollutants.

Supplementary Materials

The following supporting information can be downloaded at: https://www.mdpi.com/article/10.3390/pr13040970/s1, Figure S1: The equipment schematics; Table S1: Experimental designs and results of iron-carbon micro-electrolysis process for textile wastewater treatment; Table S2: Experimental designs and results of iron-carbon micro-electrolysis coupled with hydrogen peroxide process for textile wastewater treatment; Table S3: The data of effluent and influent in pilot-scale test; Table S4: Chinese discharge standard of water pollutant for dyeing and finishing of textile industry (GB4287-2012).

Author Contributions

Methodology, W.C.; formal analysis, M.W.; writing—original draft, H.L.; visualization, W.C.; supervision, H.Z.; funding acquisition, H.Z. All authors have read and agreed to the published version of the manuscript.

Funding

This study was financially supported by the National Natural Science Foundation of China (No. 42207310), S&T Program of Hebei (No. 21327309D), USST Sixue Scholar Program (No. 20079), and Guangdong Key Laboratory of Environmental Catalysis and Health Risk Control Grant (No. GKLECHRC-17).

Data Availability Statement

The original contributions presented in this study are included in the article/Supplementary Materials. Further inquiries can be directed to the corresponding author.

Conflicts of Interest

The authors declare no conflicts of interest.

References

  1. Leal, T.W.; Lourenco, L.A.; Scheibe, A.S.; de Souza, S.M.A.G.U.; de Souza, A.A.U. Textile wastewater treatment using low-cost adsorbent aiming the water reuse in dyeing process. J. Environ. Chem. Eng. 2018, 6, 2705–2712. [Google Scholar]
  2. Madan, S.; Madan, R.; Hussain, A. Performance evaluation study of effluent treatment plant of polyester textile dyeing industry: A case study of SIDCUL, Haridwar, Uttarakhand, India. Int. J. Environ. Waste Manag. 2024, 34, 105–118. [Google Scholar] [CrossRef]
  3. Periyasamy, A.P. Recent Advances in the Remediation of Textile-Dye-Containing Wastewater: Prioritizing Human Health and Sustainable Wastewater Treatment. Sustainability 2024, 16, 495. [Google Scholar] [CrossRef]
  4. Rahman, M.; Tabassum, Z. Biotechnological Approach to Treat Textile Dyeing Effluents: A Critical Review Analysing the Practical Applications. Text. Leather Rev. 2024, 7, 124–152. [Google Scholar]
  5. Liu, X.; Wang, J. Decolorization and degradation of various dyes and dye-containing wastewater treatment by electron beam radiation technology: An overview. Chemosphere 2024, 351, 141255. [Google Scholar]
  6. GB 4287-2012; Discharge Standards of Water Pollutants for Dyeing and Finishing of Textile Industry. Ministry of Ecological Environment, General Administration of Quality Supervision, Inspection and Quarantine of the People’s Republic of China: Beijing, China, 2012.
  7. Yaseen, D.A.; Scholz, M. Treatment of synthetic textile wastewater containing dye mixtures with microcosms. Environ. Sci. Pollut. Res. 2018, 25, 1980–1997. [Google Scholar] [CrossRef]
  8. Sultana, Z.; Ali, M.E.; Uddin, M.S.; Haque, M.M. Study on implementation of effluent treatment plants for safe environment from textile waste. J. Res. Environ. Sci. Toxicol. 2013, 2, 9–16. [Google Scholar]
  9. Guvenc, S.Y.; Can-Güven, E.; Çifçi, D.İ.; Varank, G. Biodegradability enhancement and sequential treatment of real chemical industry wastewater by chemical coagulation and Electro-Fenton processes. Chem. Eng. Process.-Process Intensif. 2023, 194, 109598. [Google Scholar]
  10. Sharma, A.; Syed, Z.; Brighu, U.; Gupta, A.B.; Ram, C. Adsorption of textile wastewater on alkali-activated sand. J. Clean. Prod. 2019, 220, 23–32. [Google Scholar]
  11. Wang, Y.-N.; Wang, R. Reverse osmosis membrane separation technology. In Membrane Separation Principles and Applications; Elsevier: Amsterdam, The Netherlands, 2019; pp. 1–45. [Google Scholar]
  12. Zhang, T.; Zheng, W.; Wang, Q.; Wu, Z.; Wang, Z. Designed strategies of nanofiltration technology for Mg2+/Li+ separation from salt-lake brine: A comprehensive review. Desalination 2023, 546, 116205. [Google Scholar]
  13. Qiu, Y.; Depuydt, S.; Ren, L.-F.; Zhong, C.; Wu, C.; Shao, J.; Xia, L.; Zhao, Y.; Van der Bruggen, B. Progress of ultrafiltration-based technology in ion removal and recovery: Enhanced membranes and integrated processes. ACS EST Water 2023, 3, 1702–1719. [Google Scholar]
  14. Ma, Z.; Chang, H.; Liang, Y.; Meng, Y.; Ren, L.; Liang, H. Research progress and trends on state-of-the-art membrane technologies in textile wastewater treatment. Sep. Purif. Technol. 2023, 333, 125853. [Google Scholar]
  15. da Silva, L.T.V.; Romero, F.B.; Amazonas, A.A.; Ribeiro, J.P.; Neto, E.F.A.; de Oliveira, A.G.; do Nascimento, R.F. Polishing of treated textile effluent using combined electrochemical oxidation and ozonation technique. Desalination Water Treat. 2023, 310, 50–58. [Google Scholar]
  16. Tuncer, N.; Sönmez, G. Removal of COD and color from textile wastewater by the Fenton and UV/H2O2 oxidation processes and optimization. Water Air Soil. Pollut. 2023, 234, 70. [Google Scholar]
  17. Bhapkar, A.R.; Bhame, S. A review on ZnO and its modifications for photocatalytic degradation of prominent textile effluents: Synthesis, mechanisms, and future directions. J. Environ. Chem. Eng. 2024, 12, 112553. [Google Scholar]
  18. Di, Ç. Decolorization of methylene blue and methyl orange with Ag doped TiO2 under UV-A and UV-Visible conditions: Process optimization by response surface method and toxicity evaluation. Glob. Nest J. 2016, 18, 371. [Google Scholar]
  19. Tao, N.C.; Le Luu, T. Different behaviours of biologically textile wastewater treatment using persulfate catalyzed electrochemical oxidation process on Ti/BDD and Ti/SnO2-Nb2O5 anodes. Environ. Eng. Res. 2023, 28, 220555. [Google Scholar]
  20. Wei, S.; Jia, L.; Tan, J.; Zhang, J.; Guo, Z.; Hu, Z.; Dai, P.; Wu, H. Iron-carbon micro-electrolysis simultaneously enhanced nutrient and heavy metal removal in constructed wetlands for purifying polluted groundwater with variable hydraulic loadings. Chem. Eng. J. 2023, 470, 144367. [Google Scholar]
  21. Bou-Abdallah, F. The iron redox and hydrolysis chemistry of the ferritins. Biochim. Biophys. Acta (BBA)-Gen. Subj. 2010, 1800, 719–731. [Google Scholar]
  22. Kremer, M. Mechanism of the Fenton reaction: Evidence for a new intermediate. Phys. Chem. Chem. Phys. 1999, 1, 3595–3605. [Google Scholar]
  23. APHA. Standard Methods for the Examination of Water and Wastewater; American Public Health Association (APHA): Washington, DC, USA, 2005. [Google Scholar]
  24. Zhou, W.; Rajic, L.; Chen, L.; Kou, K.; Ding, Y.; Meng, X.; Wang, Y.; Mulaw, B.; Gao, J.; Qin, Y. Activated carbon as effective cathode material in iron-free Electro-Fenton process: Integrated H2O2 electrogeneration, activation, and pollutants adsorption. Electrochim. Acta 2019, 296, 317–326. [Google Scholar] [PubMed]
Figure 1. The effect of the iron dose on the COD removal efficiency.
Processes 13 00970 g001
Figure 2. The effect of the ratio of iron to carbon on the COD removal efficiency.
Processes 13 00970 g002
Figure 3. The effect of the initial pH value on the COD removal efficiency.
Processes 13 00970 g003
Figure 4. Three-Dimensional Response Surface Characterization: Interactive Effects of Fe-C/H2O2 System Parameters ((a) IS dose and 1/Ratio of carbon to iron; (b) IS dose and pH; (c) 1/Ratio of carbon to iron and pH) on COD Removal Efficiency through RSM Modeling (The number represents the COD removal rate value, the color gradient in the heatmap demonstrates a positive correlation between chromatic intensity and numerical magnitude, where red hues encode maximum values while green indicates minimum values after normalization).
Processes 13 00970 g004
Figure 5. The effect of the initial pH value on the degradation.
Processes 13 00970 g005
Figure 6. The effect of the H2O2 dose on the degradation.
Processes 13 00970 g006
Figure 7. The effect of the reaction time on the degradation.
Processes 13 00970 g007
Figure 8. Three-Dimensional Response Surface Characterization: Interactive Effects of Fe-C/H2O2 System Parameters ((a) pH and H2O2 dose; (b) pH and reaction time; (c) H2O2 dose and reaction time) on COD Removal Efficiency through RSM Modeling (The number represents the COD removal rate value, the color gradient in the heatmap demonstrates a positive correlation between chromatic intensity and numerical magnitude, where red hues encode maximum values while green indicates minimum values after normalization).
Processes 13 00970 g008
Table 1. Factors and levels in the experimental design of the iron–carbon micro-electrolysis process for textile wastewater treatment.
LevelParameters
A—IS Dose (g/L)B—Mass Ratio of Carbon to IronC—pH
−12013
02524
13035
Y = −137.12500 + 11.37500A + 15.12500B + 7.75000C + 0.100000AB + 0.050000AC − 0.25000BC − 0.22000A2 − 3.50000B2 − 1.25000C2; Y—CODcr removal rate, A—iron scrap dose, B—1/ratio of iron to carbon, C—pH value.
Table 2. Factors and levels in the experimental design of iron–carbon micro-electrolysis coupled with a hydrogen peroxide process for textile wastewater treatment.
LevelParameters
A—pHB—H2O2 Dose (mg/L)C—Reaction Time (Min)
−1210090
03130120
14160150
Y = −370.84028 + 61.25417A + 4.04389B + 1.64847C + 0.22417AB + 0.048333AC − 0.000694BC − 6.85000A2 − 0.013361B2 − 0.0072222C2; Y—CODcr removal rate, A—pH value, B—H2O2 dose, C—reaction time.
Table 3. Compounds in the secondary effluent detected by GC-MS.
Serial NumberTime of Peak
(min)
Organic MatterMolecular WeightArea of Peak
(%)
113.1792, 4, 7, 9-tetramethyl-5-decynne 4, 7-diol2261.72
215.0661, 2, 3, 4-tetrahydrocyclopentadiene and [b] indole1578.43
316.5412-amino-4-methylbenzothiazole16445.37
417.054phthalate esters2780.92
517.356methyl palmitate2700.85
617.995palmitic acid25621.78
718.759methyl stearate2980.7
818.868/19.143cyclopentyl methyl methylphosphonic acid1782.91/9.82
919.429octadecylamide2832.07
1019.8051, 4-butanediol diglycidyl ether2020.74
1120.863oleate amide2814.69
Table 4. Compounds in iron–carbon micro-electrolysis effluent detected by GC-MS.
Serial NumberTime of Peak
(min)
Organic MatterMolecular WeightArea of Peak
(%)
111.538Ethyl 3-hydroxyhexanoate1604.82
213.156O-toluene isothiocyanate14911.09
315.0742-Phenylpyrimidine1568.82
417.049/17.776Diisobutyl phthalate; Dibutyl phthalate2786.46/1.61
517.983Palmitic acid25621.59
618.831/19.115Cyclopentyl methyl methyl phosphate1788.71/7.21
719.422Octadecylamide2836.75
820.842Oleate amide28117.54
Table 5. Compounds in the combined process effluent detected by GC-MS.
Serial NumberTime of Peak
(min)
Organic MatterMolecular WeightArea of Peak
(%)
110.8742-(2-hydroxypropoxy)-1-propanol1343.93
212.6331,1′[(1-methyl-1, 2-ethyl subunit) di (oxygen)] di-(2-propanol)1925.01
313.6472-methyl-2, 4-pentanediol1182.25
415.0861-[2-(2-methoxy-1-methylethoxy)-1-methylethoxy]-2-propanol2064.18
517.049diisobutyl phthalate2783.11
617.948palmitic acid25647.33
719.355octadecanoic acid2848.79
820.849oleate amide28121.89
Table 6. Operating costs of iron–carbon micro-electrolysis coupled with a hydrogen peroxide process for TW treatment.
ItemsDoses (ton/m3)/Equipment Quantity (Actual Work Quantity)Unit Price (CNY/Ton)Cost (CNY/m3)Cost (USD/m3)
H2SO4 (98%)1.55 × 10−55800.009000.001261
IS9 × 10−620000.018000.002526
H2O2 (30%)1.7 × 10−410000.170000.023834
NaOH1.43 × 10−821000.000030.000004
Al2(SO4)38.57 × 10−521000.180000.025236
Sewage Pump2 (1) 0.357500.050121
Air Pump2 (1) 0.487500.068347
Chemical Dosing Pump8 (4) 0.057000.007991
Total 1.279030.179320
Disclaimer/Publisher’s Note: The statements, opinions and data contained in all publications are solely those of the individual author(s) and contributor(s) and not of MDPI and/or the editor(s). MDPI and/or the editor(s) disclaim responsibility for any injury to people or property resulting from any ideas, methods, instructions or products referred to in the content.

