1. Introduction
Globally, one-third of all food produced is wasted annually, and for fruits and vegetables, 60% of the production is discarded [
1]. Due to the putrescible nature of this waste, improper disposal results in environmental and public health issues, such as greenhouse gas emissions, the infiltration of leachates into the soil, and the proliferation of pathogens and sanitary vectors [
2]. Nevertheless, anaerobic digestion (AD) constitutes a sustainable alternative to reduce the negative impacts of waste by promoting the circular economy of these materials. During this process, organic matter is metabolized, producing methane-rich biogas and a stabilized material known as digestate, which has a high nitrogen and phosphorus content. Methane can be used to cogenerate thermal or electrical energy, while digestate can be employed as a fertilizer for soils [
3].
The AD process is complex, as the degradation of organic matter occurs through four stages: hydrolysis, acidogenesis, acetogenesis, and methanogenesis, in which syntrophic relationships between the different species of microorganisms involved in each stage are evident [
4]. Therefore, when implementing anaerobic technologies, it is essential to establish operational conditions that ensure the products of one stage are consumed in subsequent stages without the accumulation of intermediates to prevent inhibiting phenomena and process instability, maximizing methane production and solids removal efficiencies [
5]. In this regard, the first step for the design and sizing of anaerobic reactors is the analysis of variables that determine the kinetics of the process, such as pH, temperature, and concentration, but primarily the characteristics of the substrate that determine its anaerobic biodegradability (AB) [
5,
6].
In the case of FVW, between 56% and 75% of the volatile solids (VSs) comprise sugars and hemicellulose, resulting in an anaerobic biodegradability (AB) greater than 72% [
7]. When sugars are soluble, they are rapidly fermented by acidogenic bacteria, producing volatile fatty acids (VFAs). Therefore, when the organic loading rate applied to continuous systems exceeds 3.5
, VFA can accumulate, lowering the pH and inhibiting the methanogenic microorganisms [
8]. However, for the readily biodegradable soluble compounds, the complex polymeric structure of FVW must be broken down. Some FVWs are characterized by up to 30% lignocellulosic fibers, which are resistant to biodegradation, thus slowing hydrolysis and limiting the overall process rate [
9,
10,
11].
A strategy to enhance the bioaccessibility of FVW is through particle size reduction. This increases the surface area available for contact between the substrate, microorganisms, and enzymes, thereby improving mass transfer and biodegradability [
12,
13,
14,
15]. This approach directly influences the methane yields. For instance, Mozhiarasi et al. [
16] reported a methane yield increase from 253.9 to 322.7
when reducing the particle size of fruit waste subjected to AD, while for FVW mixtures, the observed increase was from 132 to 237
[
17]. Similarly, Izumi et al. [
18] demonstrated that reducing the particle size of food waste containing FVW from 0.888 mm to 0.715 mm enhanced solubilization and methane yield by 49.8% and 28%, respectively. However, further reduction to 0.391 mm resulted in a decline in methane yield due to VFA overproduction and accumulation.
This highlights the intricate relationship between the complex physical structure and chemical composition of FVW. While particle size reduction can enhance the overall AD rate and methane production by accelerating hydrolysis through an increased surface area for enzymatic or microbial activity, it may also cause the rapid release of easily biodegradable monomers. These compounds are rapidly metabolized into VFA, whose accumulation can potentially inhibit methanogenic activity.
Therefore, to adequately characterize the AD of FVW without underestimating or overestimating the process rate and methane yields, it is necessary to consider the presence of fractions with different AB in these types of waste [
19,
20,
21,
22]. To this end, this work systematically analyzed the effect of particle size on the AB, process rate, and methane production during the discontinuous AD of FVW and digestates, aiming to elucidate the changes that occur in these variables during the process to provide valuable information for the design and optimization of AD systems. The process rate was analyzed in two ways: first, by measuring the kinetics of methane production through specific methanogenic activity (SMA), and second, by calculating and comparing the surface-based kinetic constant to determine the hydrolysis rate. The results show that particle size in the AD of FVW significantly influenced the AB and the process kinetic rate.
2. Materials and Methods
2.1. Substrates
The fresh FVW comprised two mixtures, FVW1 and FVW2, collected from a cocktail establishment in Ecatepec, State of Mexico. Digestates were sourced from a laboratory-scale up-flow anaerobic sludge blanket solid-state reactor, known as RAFAELL by its Spanish acronym (Reactor Anaerobio de Flujo Ascendente Empacado con Lecho de Lodos), designed for treating FVW to produce methane [
23]. Digestate samples were taken after 5, 10, and 15 days of digestion, labeled as D1, D2, and D3, respectively.
The mixtures of fresh FVW were characterized qualitatively by determining the wet weight fraction of each type of waste. For this purpose, the waste was separated by type and chopped to obtain an average particle size of 1
; the mass (
) of each waste type was divided by the total mass (
) of the mixture. For the physicochemical characterization of FVW and digestates, pH was determined according to Fernández [
24]. Moisture content, total solids (TS), fixed solids (FS), and volatile solids (VS) were estimated according to standard methods [
25]. Nitrogen content was determined using the Kjeldahl method according to NMX-AA-026-SCFI-2001 [
26].
The chemical oxygen demand (COD) and carbohydrates were quantified using colorimetric techniques reported by Eaton et al. [
25] and Goel et al. [
27], respectively. These analyses were applied to a 1
suspension of dried FVW. To prepare the suspension, the FVW was dried in an oven at 105 °C for 24 h; the wastes were mechanically ground and sieved to obtain particles < 500 μm in size. The particles were then resuspended in distilled water to reach a concentration of 1
. The C/N ratio was estimated by multiplying the COD/N ratio by 0.35 [
28].
2.2. Particle Size Reduction
Once the FVW and digestate samples were obtained, particle size reduction was performed to generate samples of each type of residue with four different particle sizes:
> 1000 μm, 500 μm <
< 1000 μm, 1.8 μm <
< 500 μm, and
< 1.8 μm. The ranges were established so that one (
) included the particle size of 391 μm, where methanogenic inhibition due to intermediate accumulation during the AD of food waste was observed [
18], along with two larger ranges (
and
) and one smaller (
). The smallest interval was selected to analyze the AD of particles at the threshold (0.45–2
) between suspended and dissolved solids [
25].
To achieve this, 200 of FVW or digestate was blended with 200 of distilled water for five minutes. The blended mixture was then passed through a sieve with a 1 opening to separate particles larger than 1000 (). Particles smaller than 1000 were further sieved through a 500 sieve, thus obtaining the second particle size fraction between 500 and 1000 ().
To ensure that each fraction contained only residues with specified particle sizes, the retained material after each sieving step was washed with distilled water until the COD concentration in the wash water was below 50 .
Particles passing through the 500 sieve were centrifuged at 3500 rpm for 15 min. The supernatant was then filtered through a glass microfiber filter (GF/A) to ensure the particle size was below 1.8 , obtaining the fourth particle size fraction (). The resulting sediment was washed with 270 mL of distilled water, yielding the third fraction of particles with sizes between 1.8 and 500 ().
2.3. Inoculum
The inoculum used was granular sludge obtained from the RAFAELL reactor. Its quality was assessed by determining its specific methanogenic activity (SMA). SMA determinations were conducted in 120 mL batch reactors, where granular sludge was inoculated into 80 mL of Revised Anaerobic Mineral Medium (RAMM) containing sodium acetate as the carbon source at a concentration of 4
. The inoculum concentration was set to 2.5
[
29]. The assays were conducted over 7 days, and methane production was quantified by measuring the displaced volume of a 1.5% KOH solution in a Mariotte-type tube. All assays were performed at a controlled temperature of 35 °C by placing the reactors in an incubator. SMA was calculated using Equation (1).
where
R is the slope of the cumulative methane curve over time (
),
CF is the conversion factor (
at 35 °C) [
30],
V is the reaction volume (
),
CVSS is the volatile suspended solids concentration (
), and
SMA is the specific methanogenic activity
.
The inoculum was activated by successive feedings of RAMM and sodium acetate as the carbon source until no change in SMA was detected between two consecutive feedings.
2.4. Anaerobic Assays for Determination of Biodegradability and Kinetic Parameters
The anaerobic biodegradability (AB) of FVW and digestates was determined following the methodology described by Field et al. [
29]. The experiment setup consisted of preparing reactors with an effective volume of 80
, each containing a specific type of waste (FVW1, FVW2, D1, D2, or D3) with a defined particle size (
or
). Each treatment, characterized by the type of substrate and particle size, was replicated three times, ensuring a final concentration of 4
. All reactors were inoculated with preactivated anaerobic sludge to reach a concentration of 2.5
. The effective volume was completed with RAMM without a carbon source. The pH of the reaction medium was adjusted to 7 with KOH, and 0.5
of
was added per gram of COD in each reactor to enhance the buffer capacity. The reactors were sealed, and the anaerobic process was carried out at 35 °C for 7 days. Methane production was quantified as described in the previous section. At the beginning and end of each assay, the concentrations of soluble COD [
25] and VFA [
31] were determined.
The anaerobic biodegradability percentage was calculated using Equation (2).
where
(Equation (3)) represents the percentage of COD transformed into
and VFA, and
(Equation (4)) is the percentage of COD utilized by microorganisms for growth.
where
is calculated as
, and
is
. Here,
represents the initial COD, and
corresponds to the COD of the respective compound (
or
) at the end of the assay.
To determine the mass of FVW and digestates required to be added to each assay to achieve a concentration of 4
, a relationship between total suspended solids (TSS) and COD was established for each sample (Equation (5)). First, the TSS content in 10
of wet FVW and digestates was determined. Subsequently, the COD associated with the TSS was measured by preparing a suspension with a concentration of 1
(as described in
Section 2.1).
where WS is the mass of wet solids of a specific particle size (
), TSS is the total suspended solids (
), COD is the chemical oxygen demand (
), and
is the volume of reaction used in the assay (
).
For all experiments, the methane yield () expressed in and after 7 days of digestion was calculated as the ratio of the accumulated methane during the process to the initial substrate mass (in and ).
For the global methane production rate analysis, the SMA was determined for all assays, following the method described in
Section 2.3. In these experiments, the carbon source was the organic matter in FVW and digestates.
2.5. Kinetic Analysis of the Hydrolysis of Substrates
Considering that the substrate surface is colonized and hydrolyzed by extracellular enzymes, the hydrolysis rate (
in
) can be expressed as follows:
where
is the particulate substrate concentration (
),
is the surface-based kinetic constant (
), and
is the specific surface area (
). Assuming spherical particles,
is calculated as
. Where
is the substrate density (
), and
is the particle radius [
32]. Thus, the model assumes that the particle surface is uniformly degraded, leading to a reduction in particle radius over time. The rate of this surface phenomenon is represented by the kinetic constant
, which indicates the amount of substrate hydrolyzed per unit area and time [
33]. Since
is a function of time (
) and the initial radius (
), it can be described as follows [
33]:
The constant
, which depends only on the substrate nature, was determined for anaerobic assays with
particles. To estimate
, the hydrolysis efficiency in fractional form (
) was calculated from experimental data using the following expression:
where
is the initial substrate mass (
), and
is the substrate mass (
) at time
(
). The expression
represents the total hydrolyzed substrate mass and is equivalent to the sum of accumulated methane (
) and VFA (
) in the reaction medium.
By substituting the mass of spherical particles (
) in Equation (8) and combining it with Equation (7), Equation (9) was obtained, where
is the only unknown parameter.
To determine the substrate density ( in ), a 2 tube was weighed () and then filled with substrate particles. The tube was tapped three times against a flat surface to ensure the sample occupied the entire volume. Subsequently, the tube with the packed sample was weighed (). The density was calculated as , where is the tube volume ().
The kinetic constant was estimated by solving Equation (9) using the Newton–Raphson method, implemented with the fsolve function in Matlab R2024a.
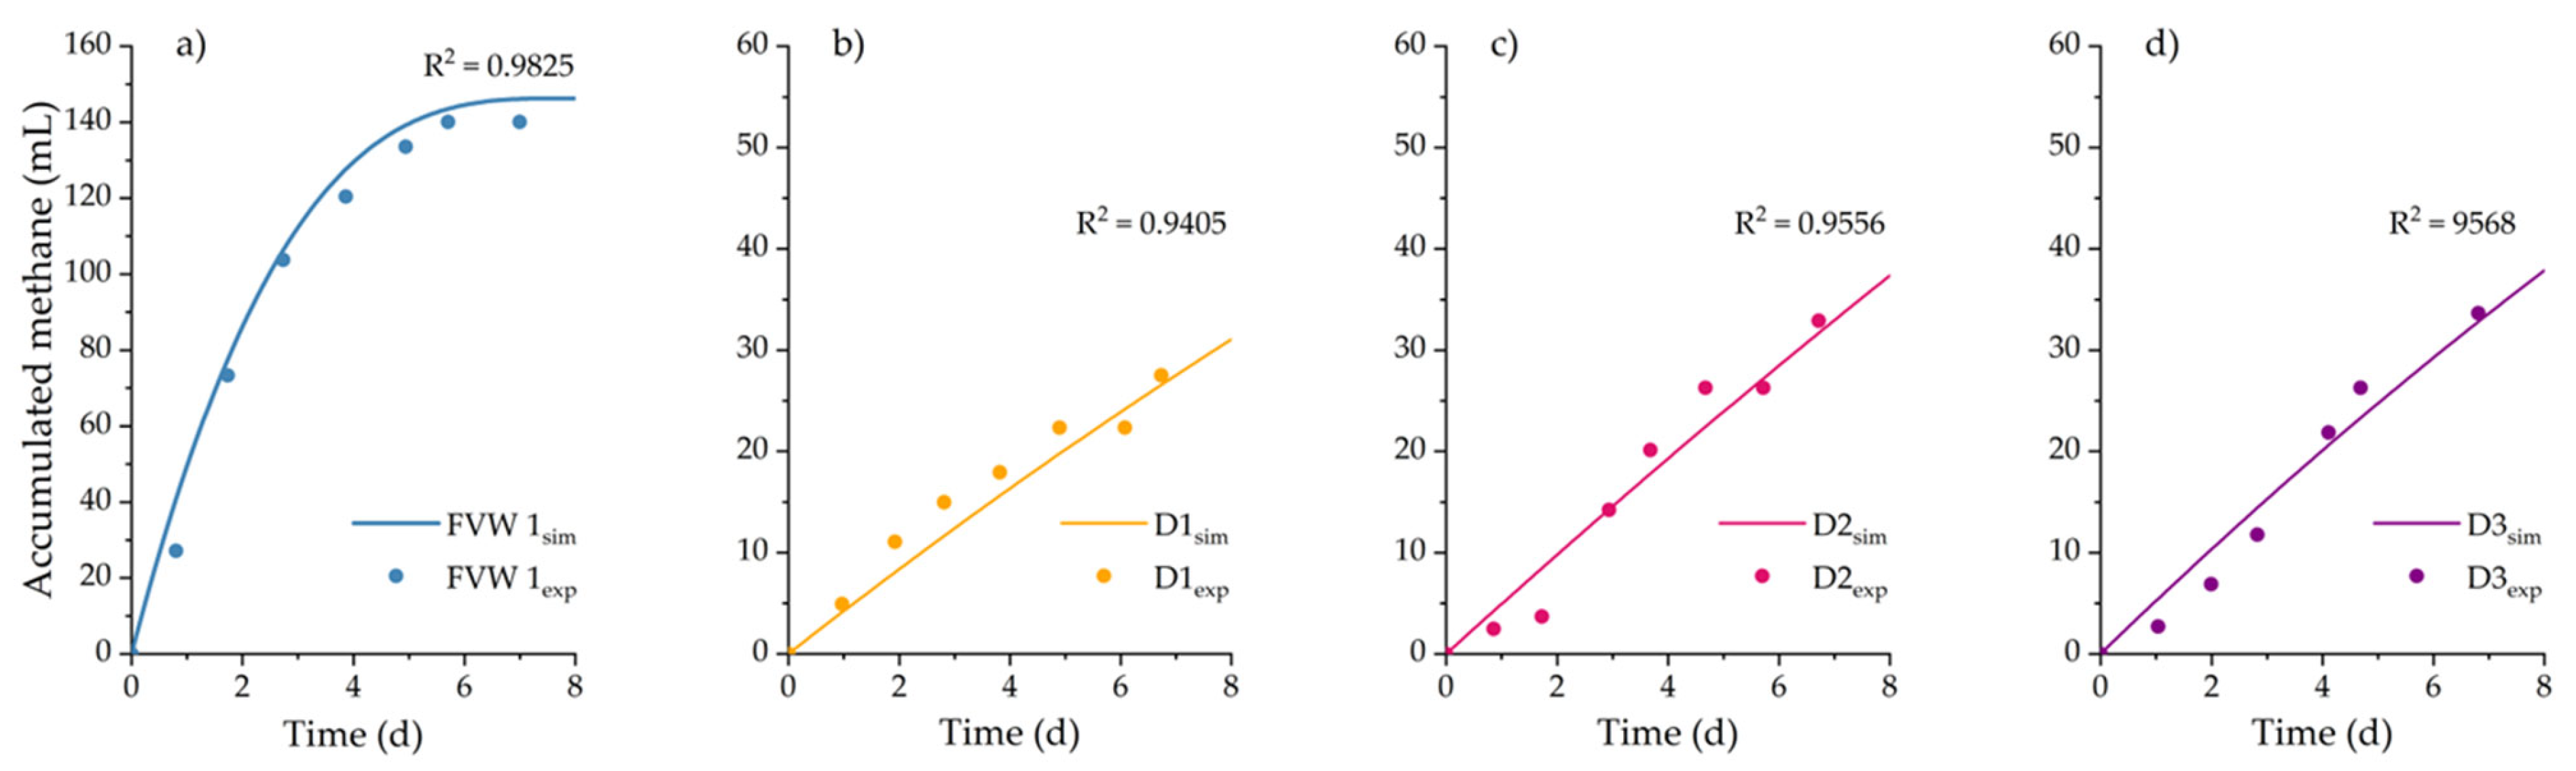
Equation (6) was coupled with Equation (10), which describes methane generation as proportional to substrate hydrolysis, to simulate methane production.
where
is the product/substrate yield coefficient (
) calculated as
. Here,
represents the experimental methane yield after 7 days of digestion. The division by
accounts for the fact that methane production in the experiments originated solely from the hydrolyzed substrate.
Finally, the system of Equations (6), (7), and (10) was integrated using the ODE45 function in Matlab R2024a software, which employs the fourth-order Runge–Kutta method. The coefficient of determination (
) was calculated to assess the model’s accuracy and reliability. A model is considered reliable when
is close to 1 [
34].
2.6. Statistical Analysis
An analysis of variance (ANOVA) was conducted to evaluate the presence of statistical differences among the values of the variables analyzed in this study (SMA, AB, and ). The factors were substrate type (FVW1, FVW2, D1, D2, and D3) and the particle size.
The statistical analysis was performed using Minitab software (version 21.1.0), with a significance level (
) set at 0.05. To identify differences among treatments, the
F-statistic was compared to the critical value
, where
denotes the degrees of freedom among groups or treatments (
), and
corresponds to the degrees of freedom for the error term, with
as the total number of observations. The
F-statistics tests the null hypothesis, which assumes no significant differences among treatment means. If
, the null hypothesis is rejected, indicating significant differences among treatment means. When such differences were detected, the Tukey pairwise comparison test was applied to identify statistically equivalent means [
35].
4. Conclusions
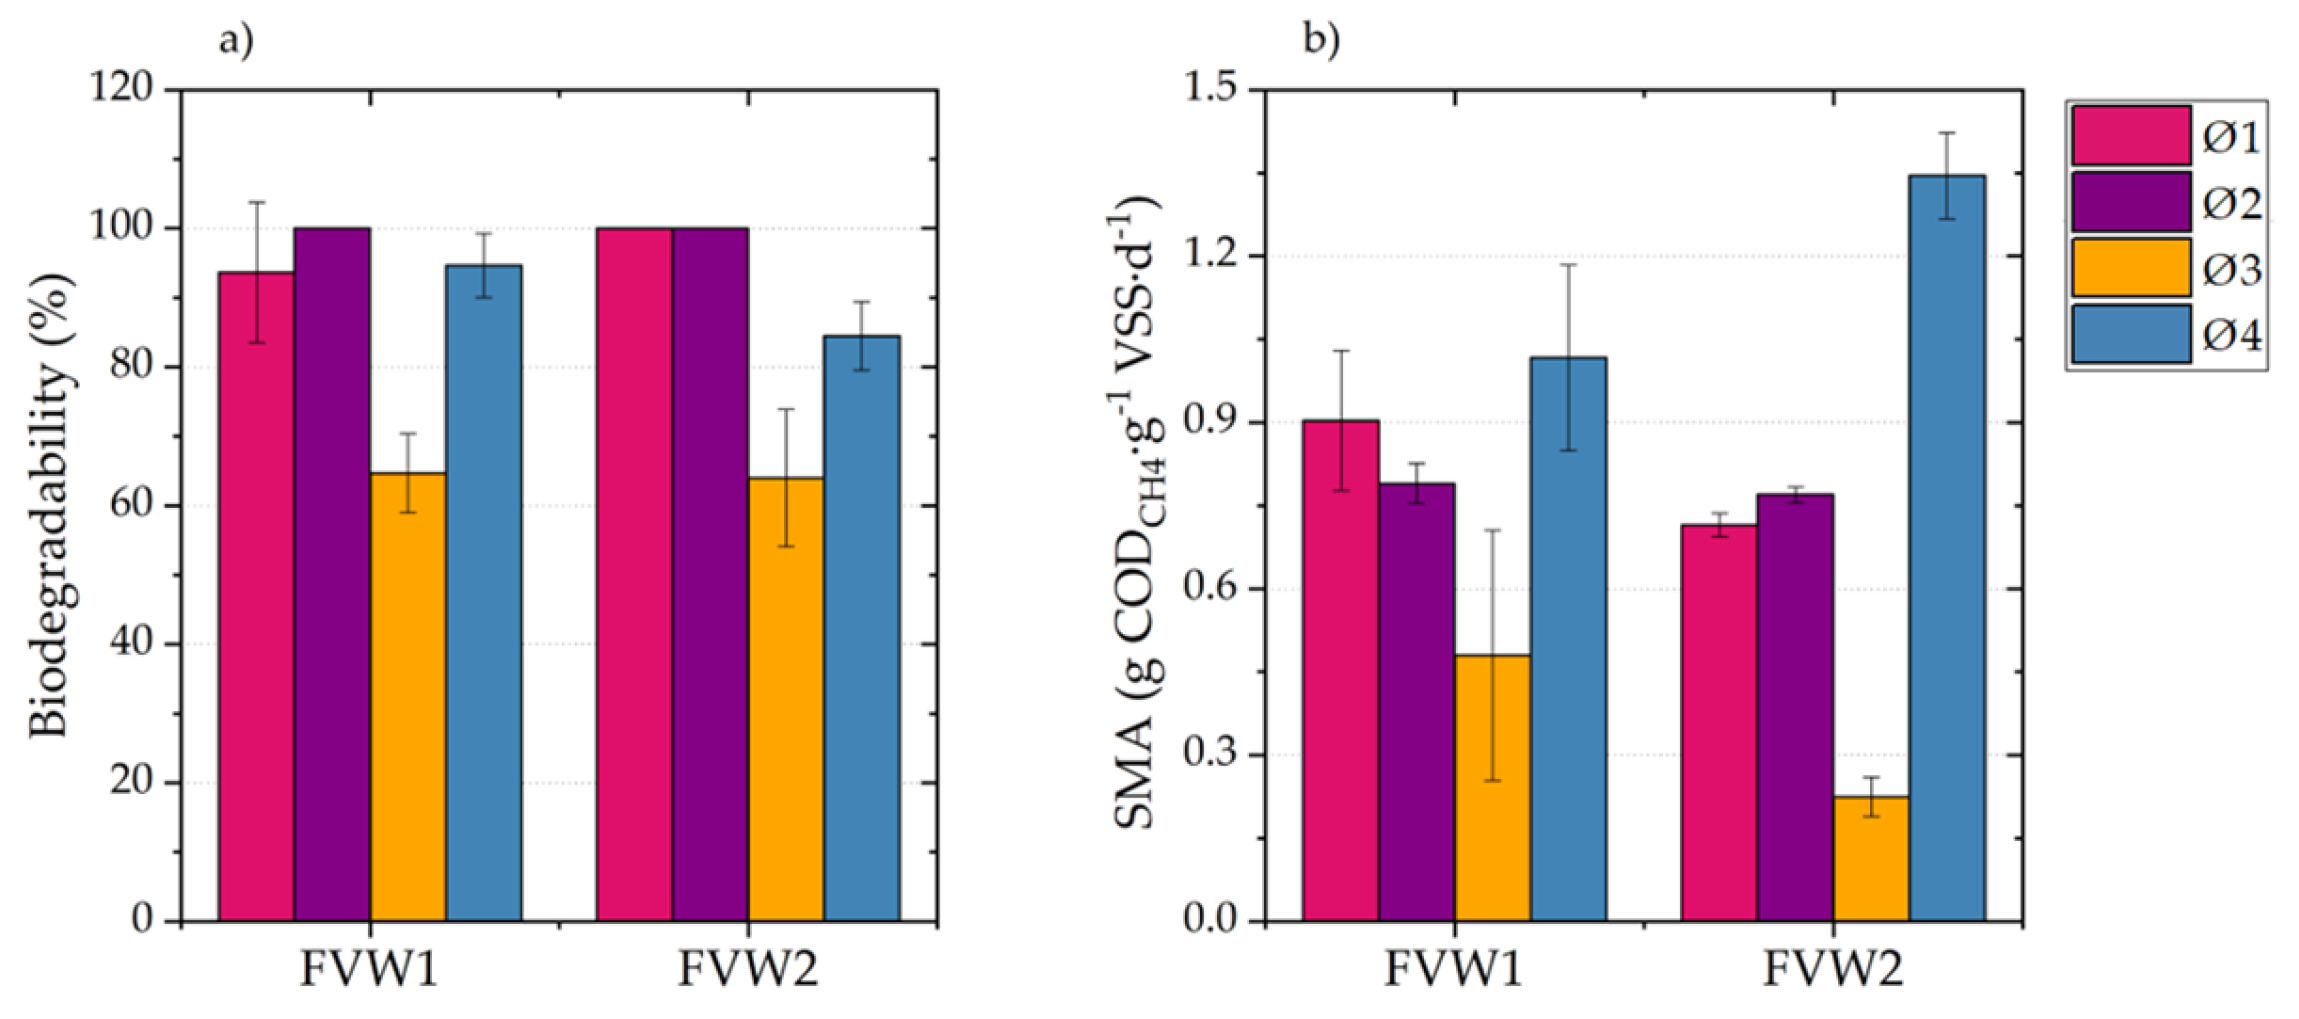
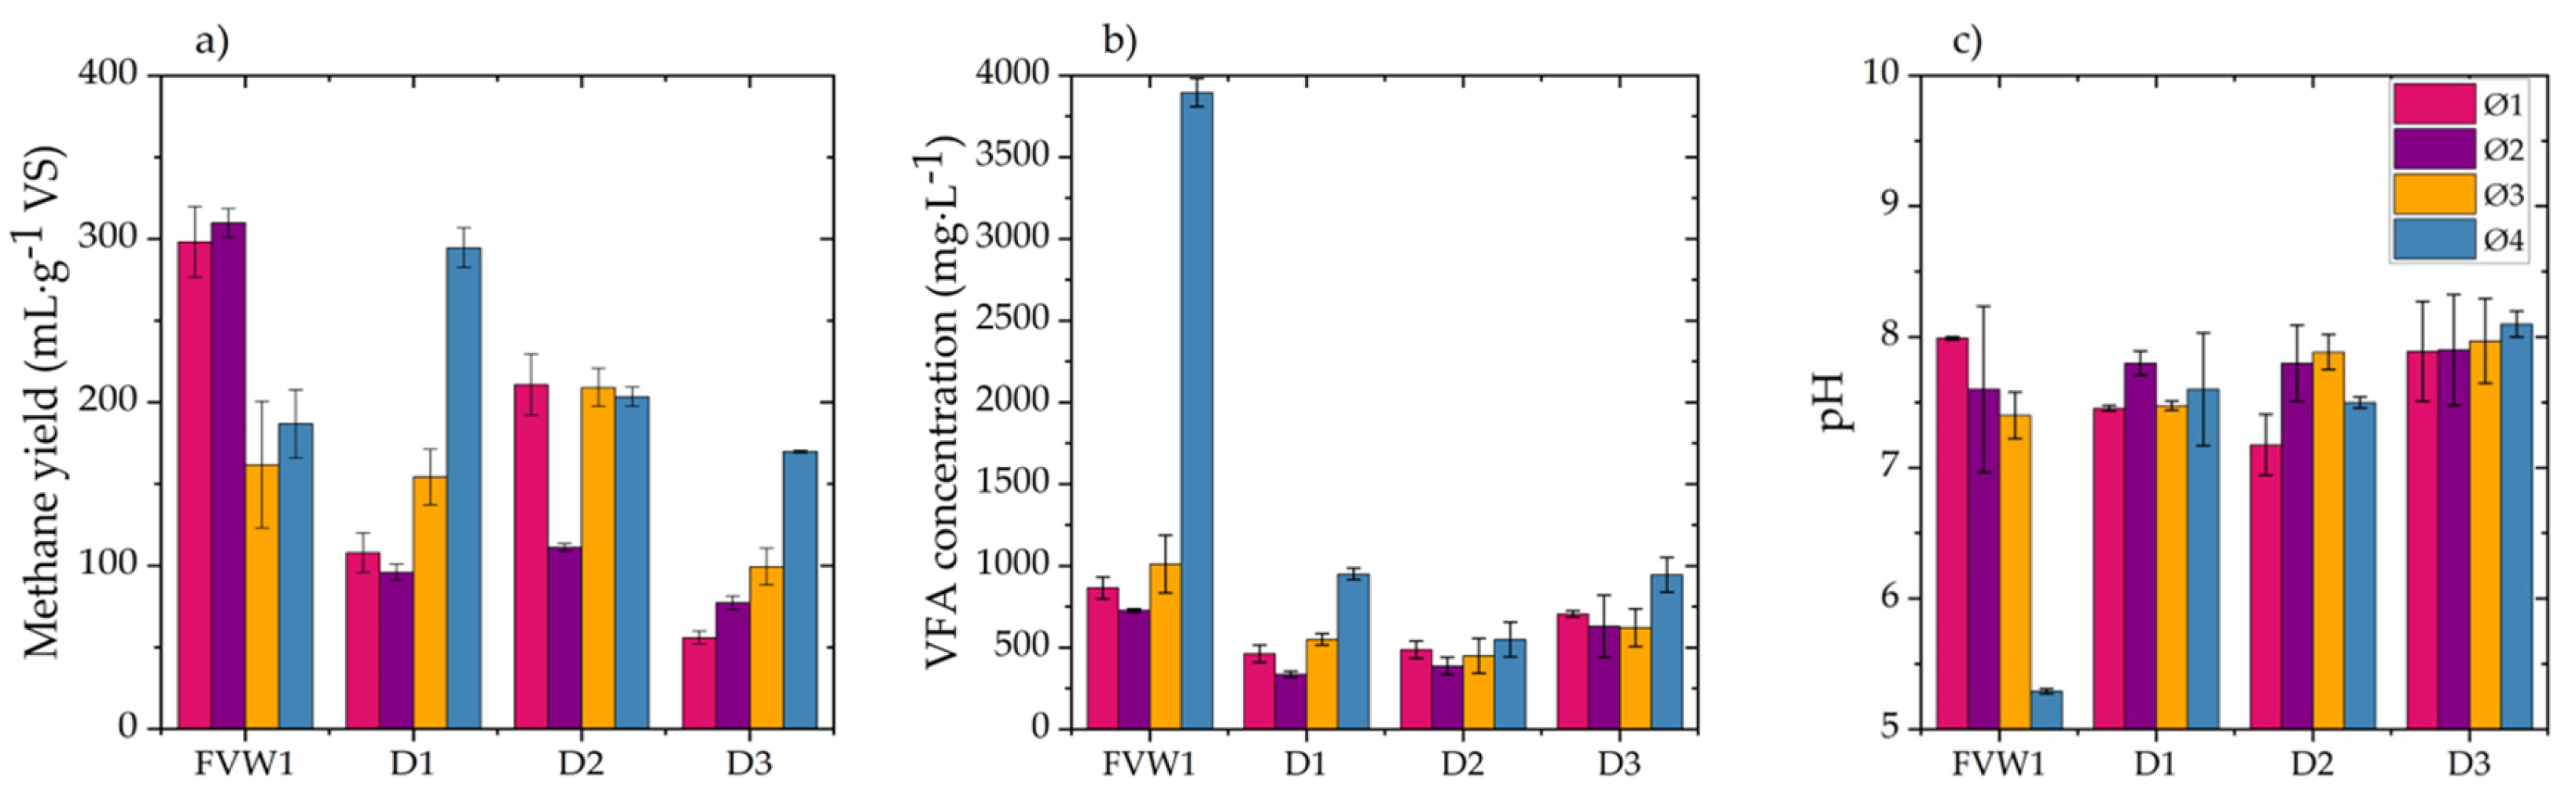
This paper analyzed the AB, SMA, and hydrolysis kinetics of fresh FVW and its digestates to determine and understand how these parameters change during the AD of FVW at different particle sizes. The results showed that FVW1 and FVW2 mixtures did not exhibit significant differences in AB and SMA, indicating that they may yield comparable results regardless of their composition. However, significant differences were observed in AB and SMA when FVW was digested at different particle sizes, with methane yields ranging from 161.8 to 309.8 . It is important to highlight that reducing the particle size below 500 led to the inhibition of AD.
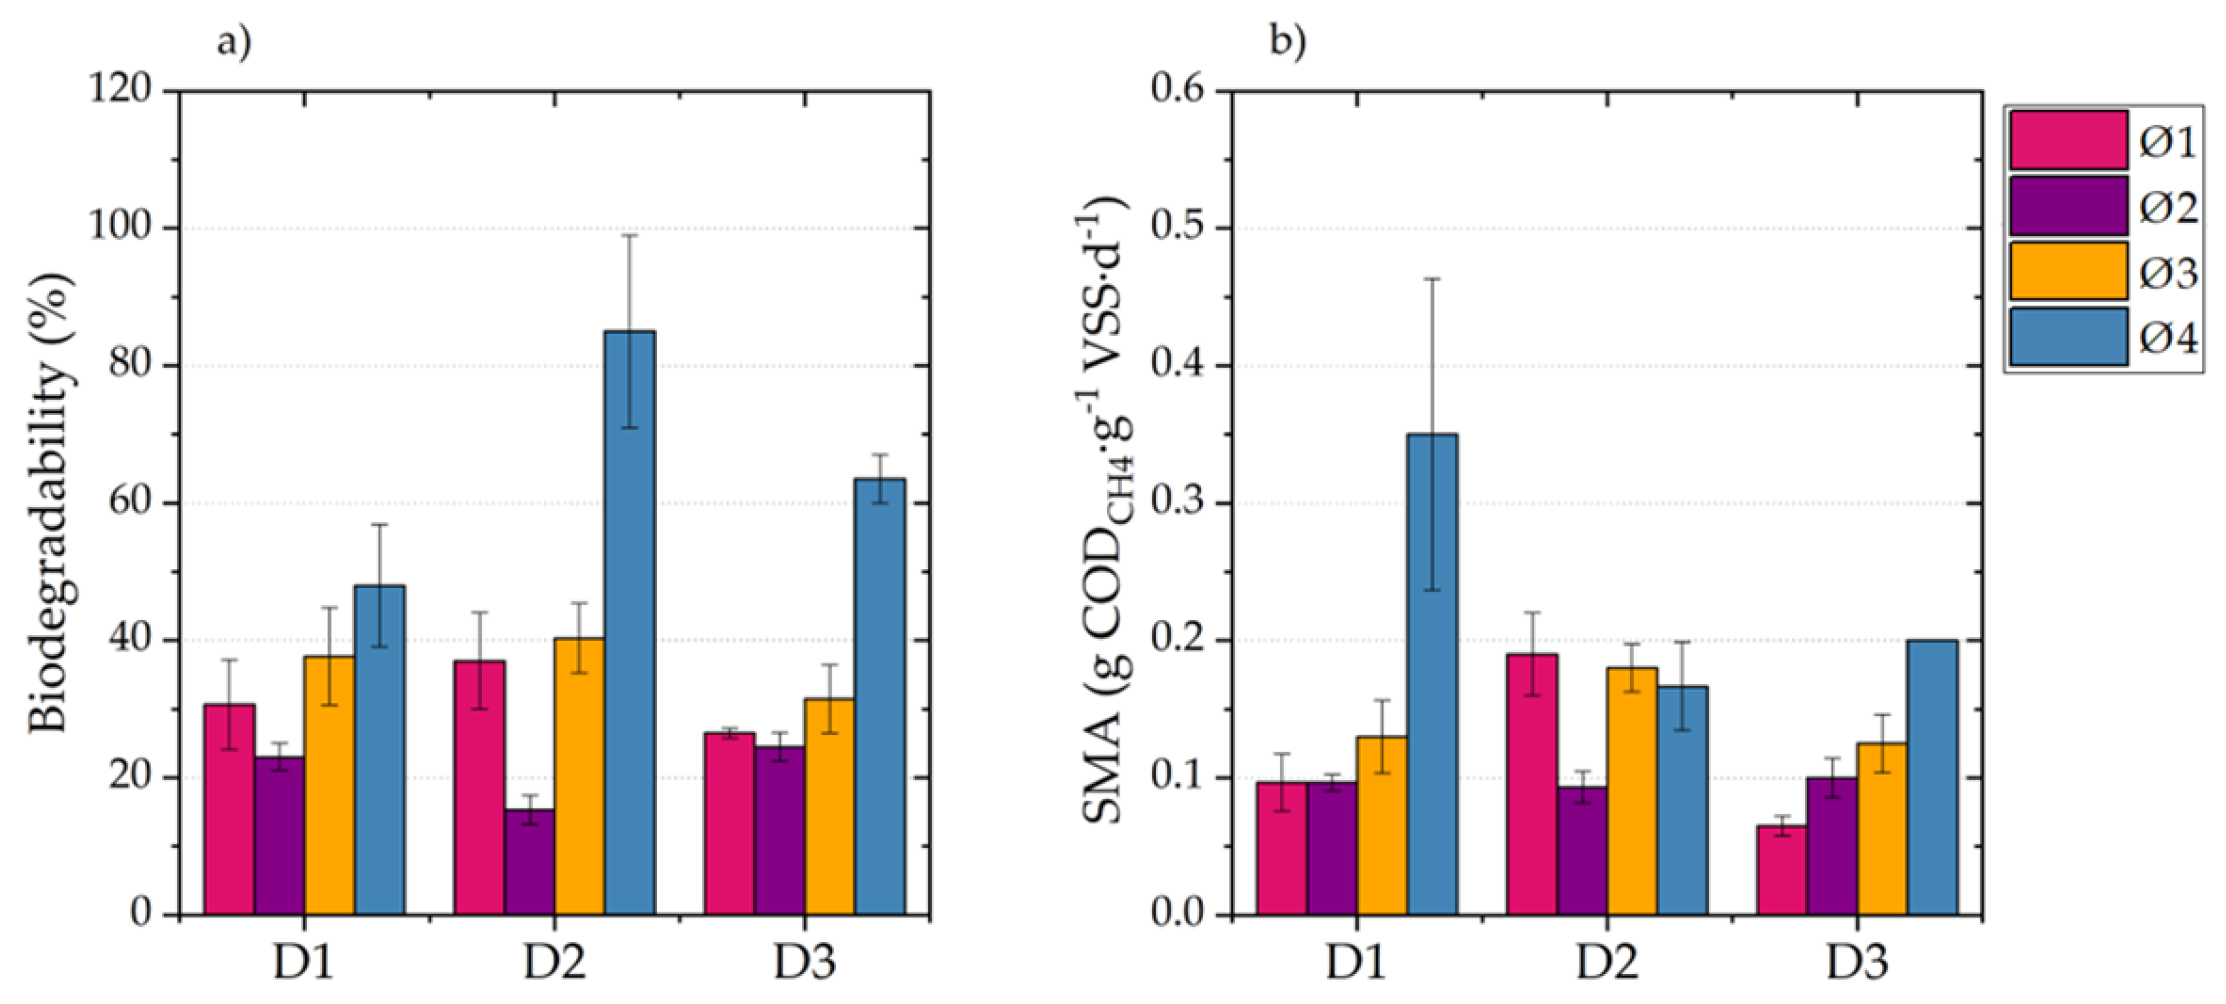
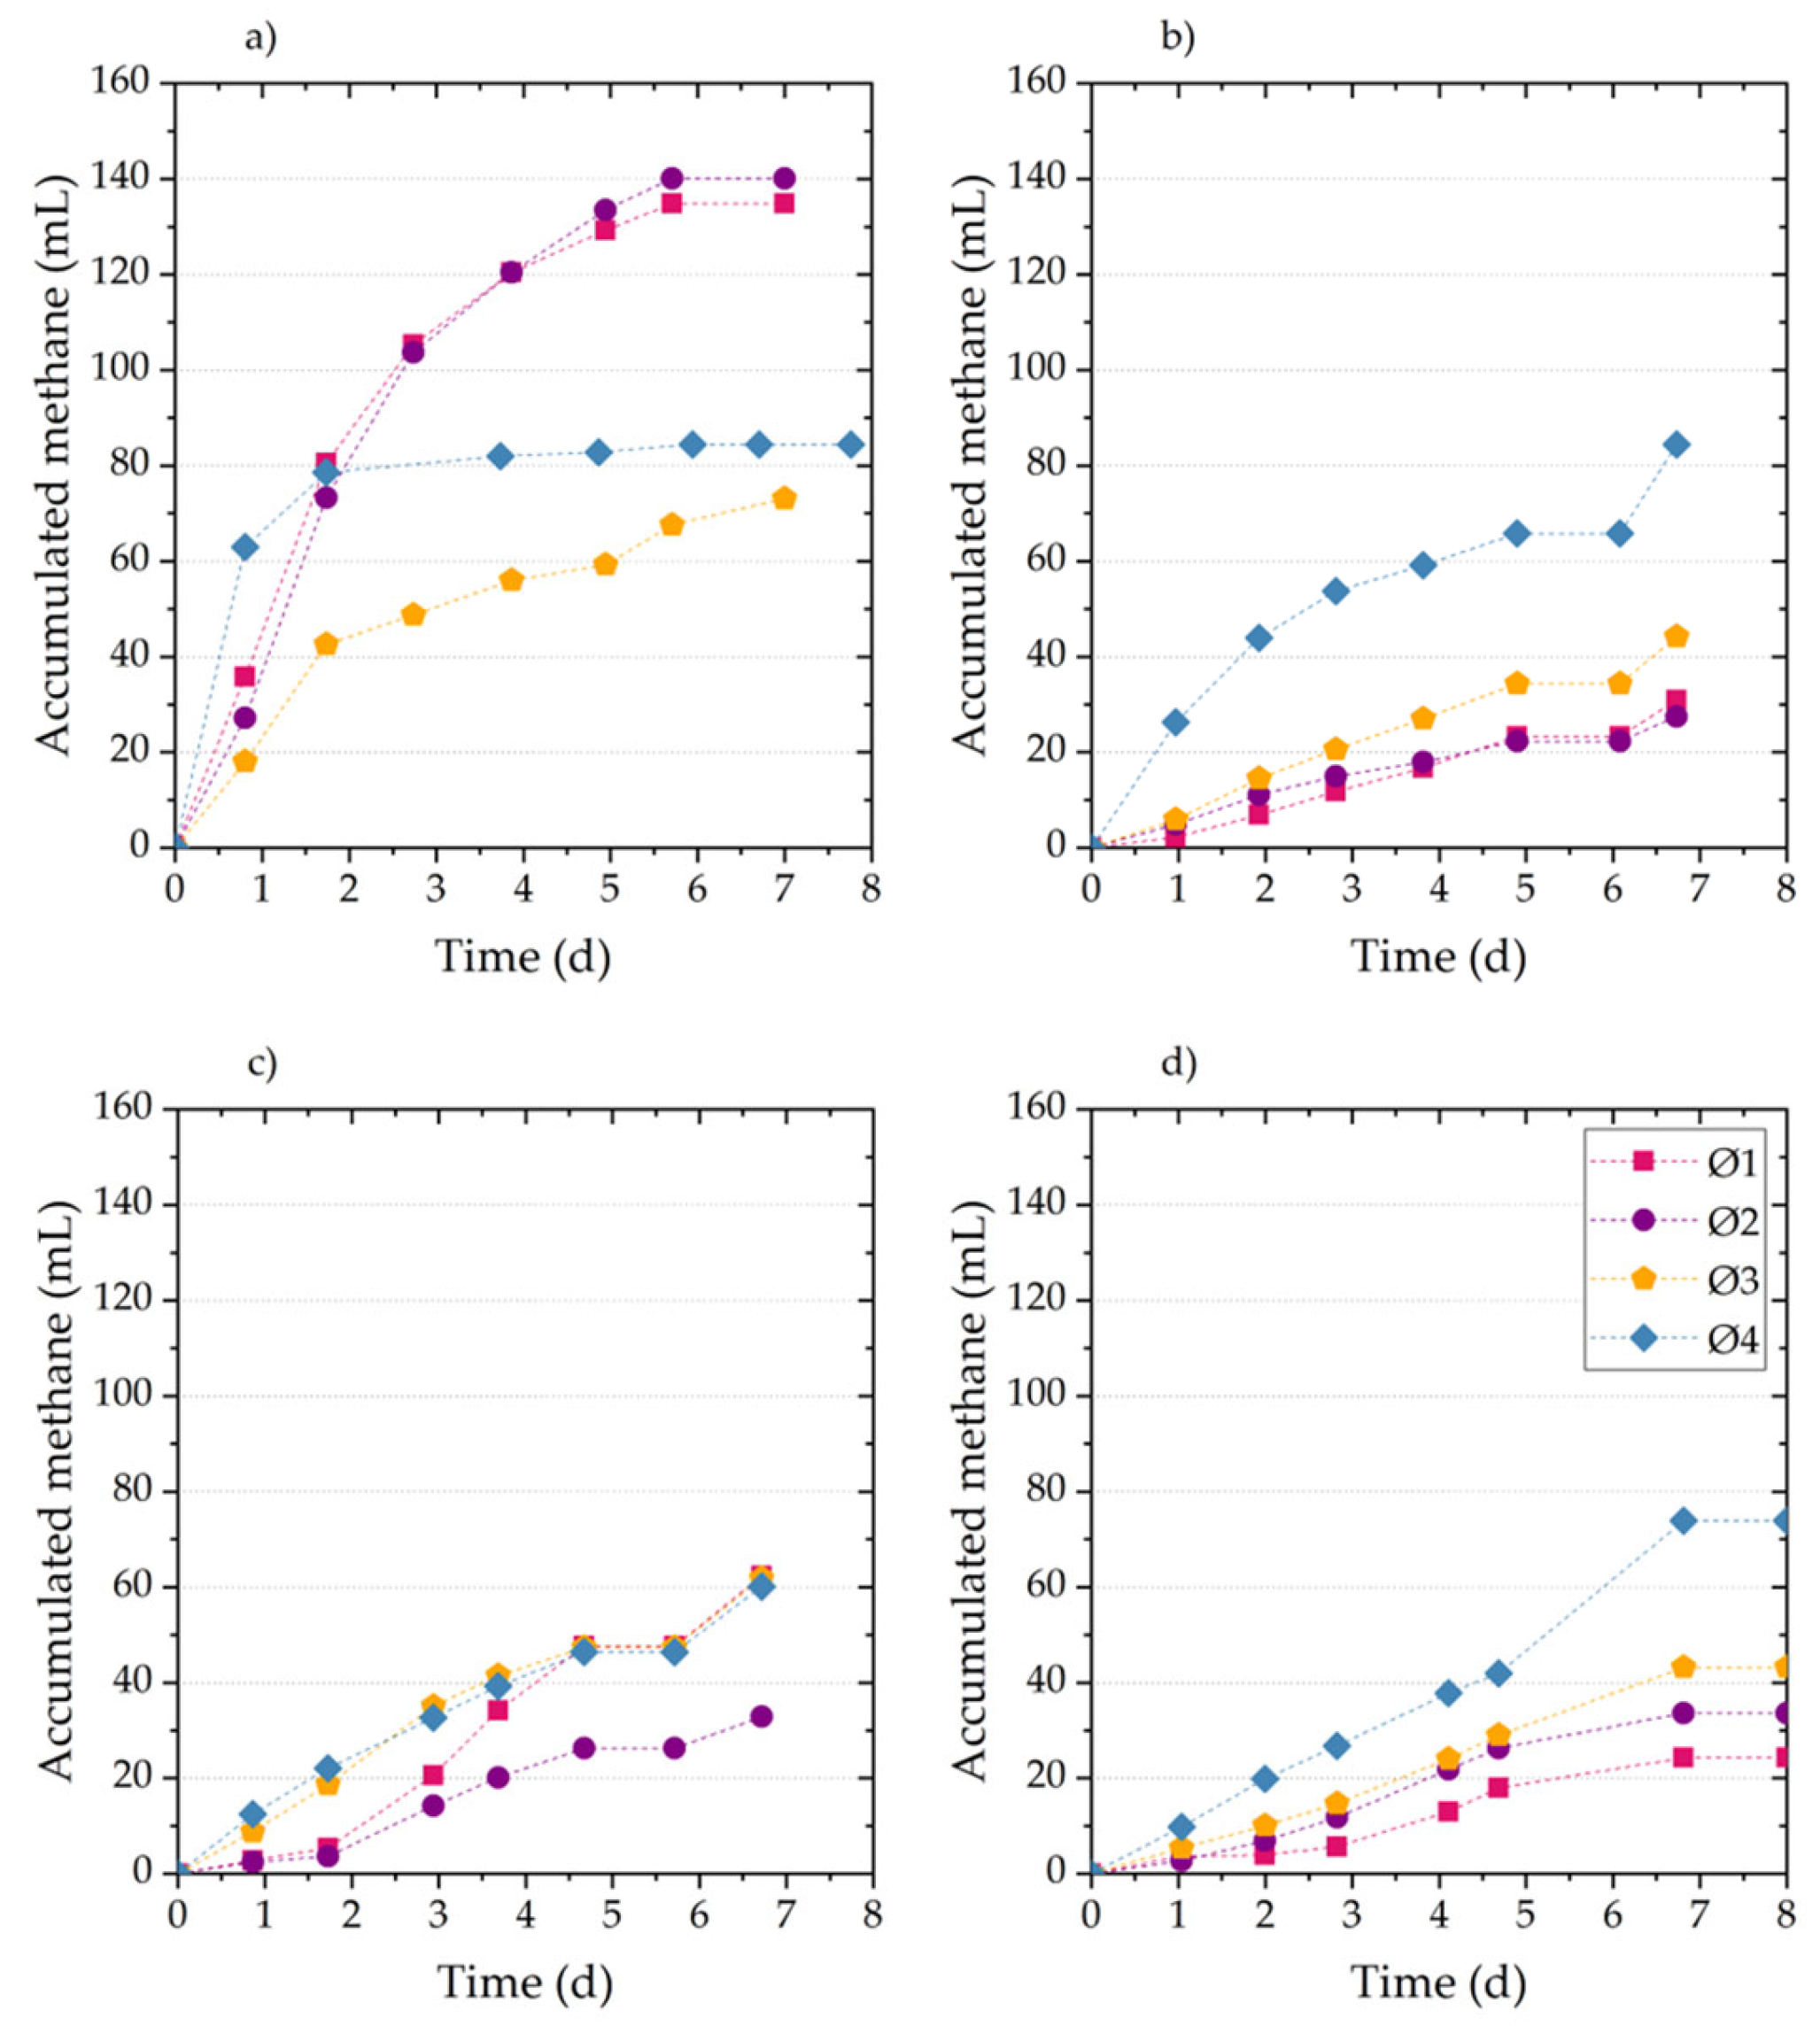
During AD, higher AD and SMA values were achieved for FVW, where easily biodegradable fractions were consumed within the first five days. AB for digestates obtained after 5, 10, and 15 days of digestion shows a 23% decrease compared to fresh FVW. The maximum SMA observed for digestates was only 26% of the maximum SMA of FVW. Furthermore, changes in substrate composition significantly reduced the hydrolysis rate, with the value for digestates decreasing by an order of magnitude compared to fresh FVW. These findings highlight the critical role of particle size and substrate composition in optimizing the AD of FVW and suggest that particle size reduction should be controlled to avoid inhibitory effects. However, it is also important to determine whether, in practical applications, the increase in methane production justifies the costs associated with particle size reduction. Therefore, future research could focus on conducting material and energy balances to assess the technical and economic feasibility of the process, as well as exploring and evaluating the effects of other pretreatment methods, such as ultrasound or enzymatic treatment, on particle size and methane production efficiency.


 ,
, 
