Abstract
In order to study the breaking mechanism of rock of high-speed PDC drill bits, improve the cutting efficiency of cutting teeth, and reduce the wear of cutting teeth, the rock-breaking process of PDC cutting teeth is simulated based on mechanical theory knowledge and experiments in this paper. And the influence of changes in PDC tooth rake angle, cutting depth, and diameter of the cutting tooth was studied by changing the different structural and cutting parameters of the cutting teeth, as well as the changes in cutting force, frictional resistance stress, and contact pressure on PDC teeth during the cutting process. The simulated results show that the total energy of the system increases, and the total energy of the system is the largest when cutting at 45°, which coincides with the maximum contact pressure on the teeth at this time. At the same time, it also shows that the impact resistance of PDC teeth is the strongest when chamfered at 45°. The contact area is also smaller, so the cutting is more conducive to the cutting tooth eating into the formation and prolonging the service life of the cutting tooth when the tooth rake angle is 20°. The experimental results showed that, in the actual design of PDC drill bits, an appropriate smaller side angle is not only beneficial for chip removal, but also helps to prevent lateral vibration and does not have a significant impact on cutting load. Finally, obtaining the relationship curve between structural parameters and rock properties is of great significance for guiding the design of PDC drill bits, understanding the intrinsic mechanism of rock fragmentation, and revealing the macroscopic nonlinear mechanical behavior of rocks.
1. Introduction
With the increase in global energy demand, it is necessary to continuously improve the acceleration technology in the process of extracting oil and gas resources, and improving the drilling and rock-breaking efficiency is a prerequisite for improving mechanical drilling speed [1,2,3]. Experts and scholars have conducted extensive research on the design and use of polycrystalline diamond composite (PDC) drill bits and obtained some improvement results. Yachao Ma et al. [4,5] combined uncertainty analysis theory to establish a mathematical expression method and model for the uncertain wear of PDC drill bits. Kuniyuki Miyazaki et al. [6,7] developed a high-performance geothermal well drill bit to shorten drilling cycles and reduce drilling costs. Huaigang Hu et al. [8,9] proposed a method to fully utilize the stress release effect, reduce the compressive stress value of bottom hole rock, and even convert it into local tensile stress using a mixed drill bit cutting method to improve rock-breaking efficiency. Yan Yang et al. [10,11] proposed a vertical wheel PDC drill bit to improve the mechanical drilling speed, short service life, and poor stability of polycrystalline diamond composite (PDC) drill bits in complex and difficult-to-drill formations. It is a new drill bit technology that combines gears with their rotating axes. Thomas Stoxreitera et al. [12,13,14] conducted a detailed study on the interaction between hydraulic and mechanical rock removal processes and drew further conclusions about rock failure processes. Fangyuan Shao et al. [15] modified the rock–tool interaction model by considering the influence of chamfers, which can be used to predict the cutting force and cutting efficiency of PDC tools for rock shear. Zhang D et al. [16,17,18] proposed a two-stage hybrid drill bit, where a polycrystalline diamond drill bit serves as the main cutting unit, and the presence of a central core gives the hybrid drill bit a larger lateral contact area with the bottom hole, which can reduce lateral forces and limit lateral vibration. Huang K et al. [19,20] conducted an experimental study on the root causes of failure in the eddy current generation process of drill bits by reducing various drilling vibrations. Zhang C L et al. [21,22,23,24] studied the numerical models, numerical rock-breaking processes, and visualization of simulations of drill bits and rocks, respectively, and studied the interaction between rocks. Zhang C et al. [25,26,27] investigated the cutting performance of worn PDC drill bits by using single-tooth cutting experiments and numerical simulations to analyze the stress state of worn teeth. Yang Y et al. [28,29] established a kinematic model of PDC drill bits under composite drilling by studying the mechanical behavior of drill strings in composite drilling. Gomar Mostafa et al. [30,31,32] improved the PDC structure and introduced a new algorithm in order to quickly and accurately predict real-time drilling rock-breaking speed and mechanical speed. By improving the PDC bit structure and algorithm, the results provided a more accurate, efficient, and cost-effective method for geological analysis. Farouk Said B. et al. [33,34,35] proposed an artificial intelligence algorithm to train the bit rotation, ROP, and torque models combined with in situ monitoring of the ROP and frictional load. An industrial PDC tool and deep-well rock specimens are used to simulate the rock-cutting process, and the relationship between ROP, friction, and rock morphology is analyzed. Jasem M. Kamel et al. [36,37,38] described the coupling relationship between nonlinear cutting and friction, drive system characteristics, and various movements at the interface between a PDC bit and a rock formation, and studied the influence of various operating parameters on dynamic behavior to achieve smooth and efficient drilling operations.
They analyzed the effects of transmission ratio, tool layout, and drill string geometry on the cutting trajectory formed by the tools. However, the above literature did not comprehensively simulate or experiment on bits with different diameters and different cutting angles, and for the actual bit in the cutting process, the cutting direction changes were complex. This paper changed the different structural parameters and cutting parameters of the cutter for the simulation and obtained some important reference laws for protecting the cutter and improving the efficiency of rock breaking. At the same time, the system test is carried out on the cutting loads in three directions, and the appropriate side angle is given to reduce the early wear of the tooth side of the bit, reduce the rapid wear of the diamond composite sheet or the probability of early crack failure, and improve the drilling efficiency.
Simulation research on the PDC tooth cutting process of rocks is conducted, and some reference conclusions are drawn in this paper, which not only has important theoretical significance for understanding the internal mechanism of rock fragmentation and revealing the macroscopic nonlinear mechanical behavior of rocks. Moreover, it has important guiding significance for the optimization design of PDC drill bit cutting teeth and also provides an important theoretical basis and analytical methods for the development of new drill bit products. In addition, the changes in these parameters were studied for their impact on the control measures of drill bits in practical engineering applications. At the same time, establishing a scientific PDC drill bit design and manufacturing system and improving the technical level and market competitiveness of PDC drill bits have important practical significance and obvious economic benefits.
2. Case Analysis of High-Speed PDC Drill Bits
Practice has proven that PDC composite drill bits have advantages, such as high mechanical drilling speed, more footage, long service life, stable operation, fewer downhole accidents, good wellbore quality, and low labor intensity for drilling operators. Compared with roller bits, the reasonable use of diamond bits can greatly shorten the drilling cycle, reduce the number of trips, lower drilling costs, and improve the drilling’s economic benefits. Through research on the geological data of the Xinchang block in Western Sichuan and the use of drill bits by various companies in the block, it was found that using high rotational speed significantly improves mechanical drilling speed, while using low rotational speed and high drilling pressure does not significantly improve mechanical drilling speed. This indicates that the current cutting depth of the composite piece into the formation is only 50% due to the cutting structure design of the drill bit, as shown in Figure 1. Due to shallow and high rotational speed, early wear of the drill bit composite piece is caused, resulting in a shorter pure drill bit and less footage.
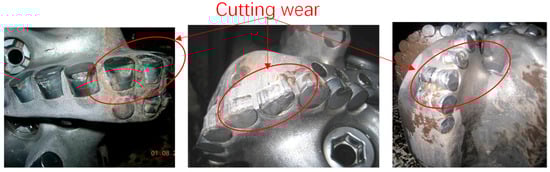
Figure 1.
Photo of composite wear failure.
At present, the existing research literature cannot clearly grasp the relevant relationships mentioned above, resulting in a high degree of followership and idealization in drill bit design. The purpose of this article is to establish experimental methods and evaluation standards for the cutting efficiency of PDC drill bits. The main research work comprises (1) research on testing methods and evaluation indicators for PDC drill bit cutting efficiency; (2) fixture improvement design; (3) study the effects of five chamfers, five side angles, and five back angles on cutting efficiency for three types of rocks under determined drilling pressure and rotational speed conditions; and (4) experimental data processing to obtain the relationship curve between the structural parameters and rock properties, guiding the design of PDC drill bits.
3. Calculation of Single-Tooth Cutting Force
In the actual drilling process of PDC bits, the interaction between diamond composite sheets and rocks is very complex. In order to establish a cutting force theoretical model that can reflect the essential characteristics of the PDC tooth under downhole working conditions, the calculation method of cutting force for single-edged teeth (i.e., cutting teeth with straight cutting edges) is first studied. The cutting working state of single-edged teeth is basically the same as the aforementioned single-edged orthogonal cutting and single-edged oblique cutting, with the only difference being that the rock being cut is subjected to a uniformly distributed wellbore fluid column pressure Pm, which is closely related to the shear strength of the rock. The presence of Pm changes the stress state of the rock in front of the cutting edge, so the calculation formula in metal cutting cannot be simply applied. In this section, it is assumed that the shear strength of the rock conforms to the Mohr–Coulomb criterion.
3.1. Cutting Force Under the Condition of Uniform Stress Distribution in the Shear Plane
(1) Cutting force during single-edge orthogonal cutting
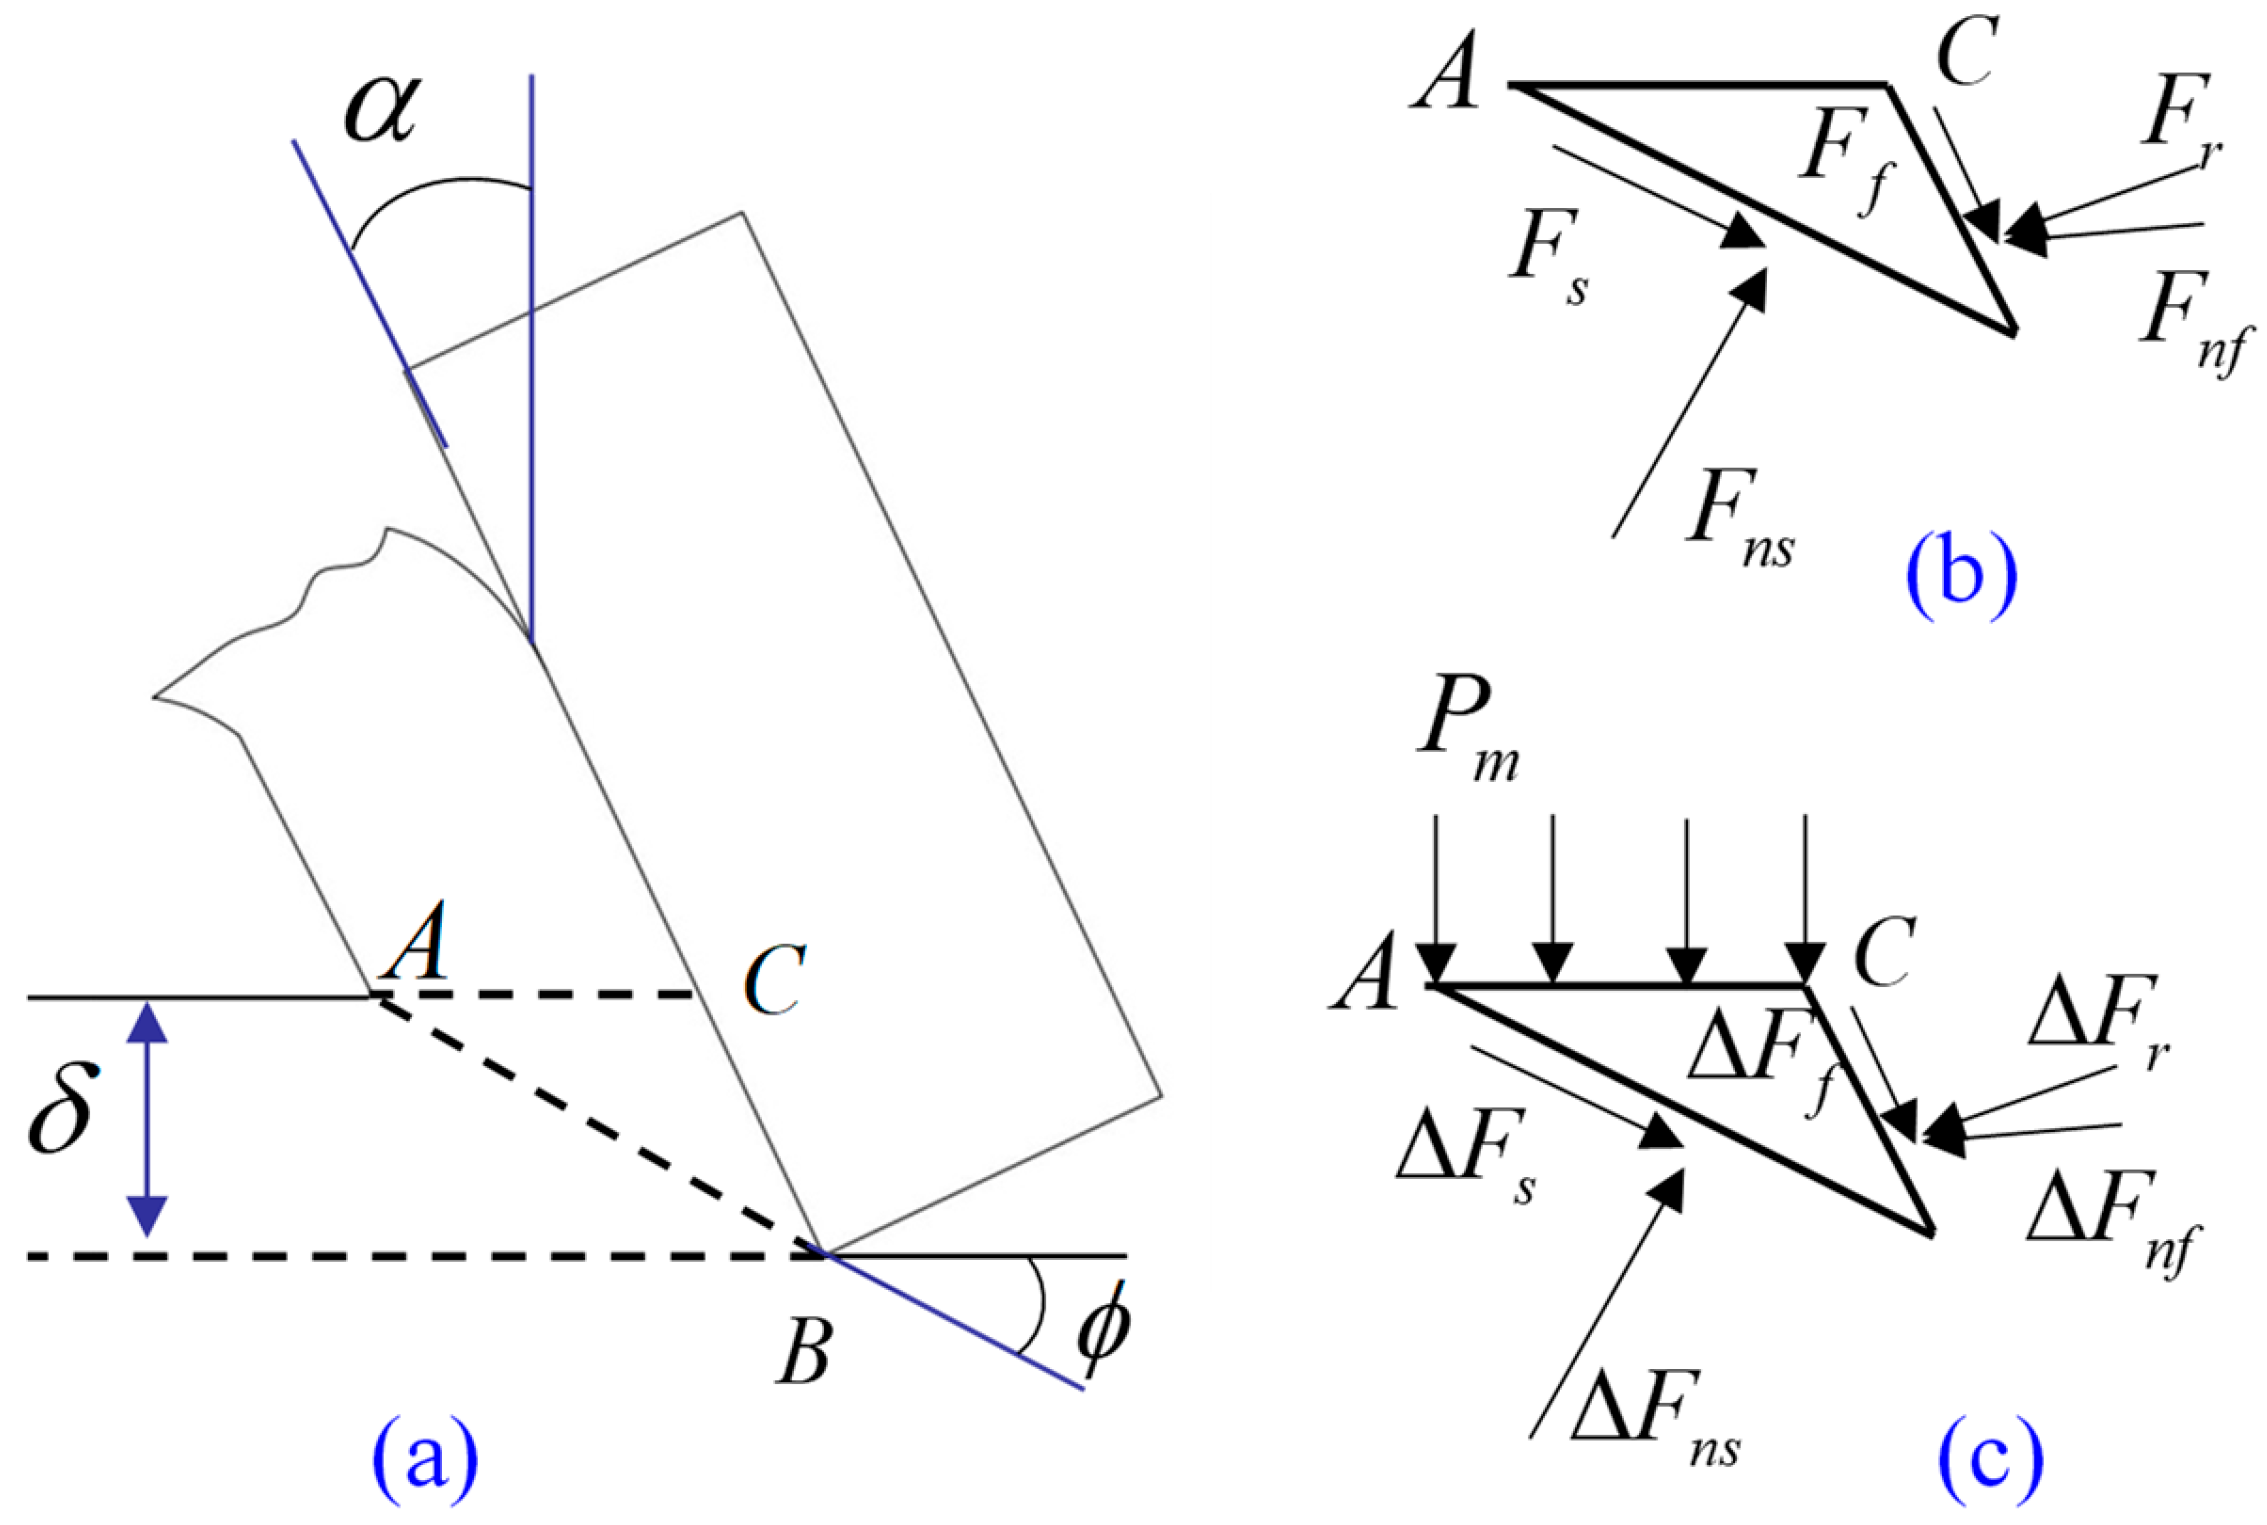
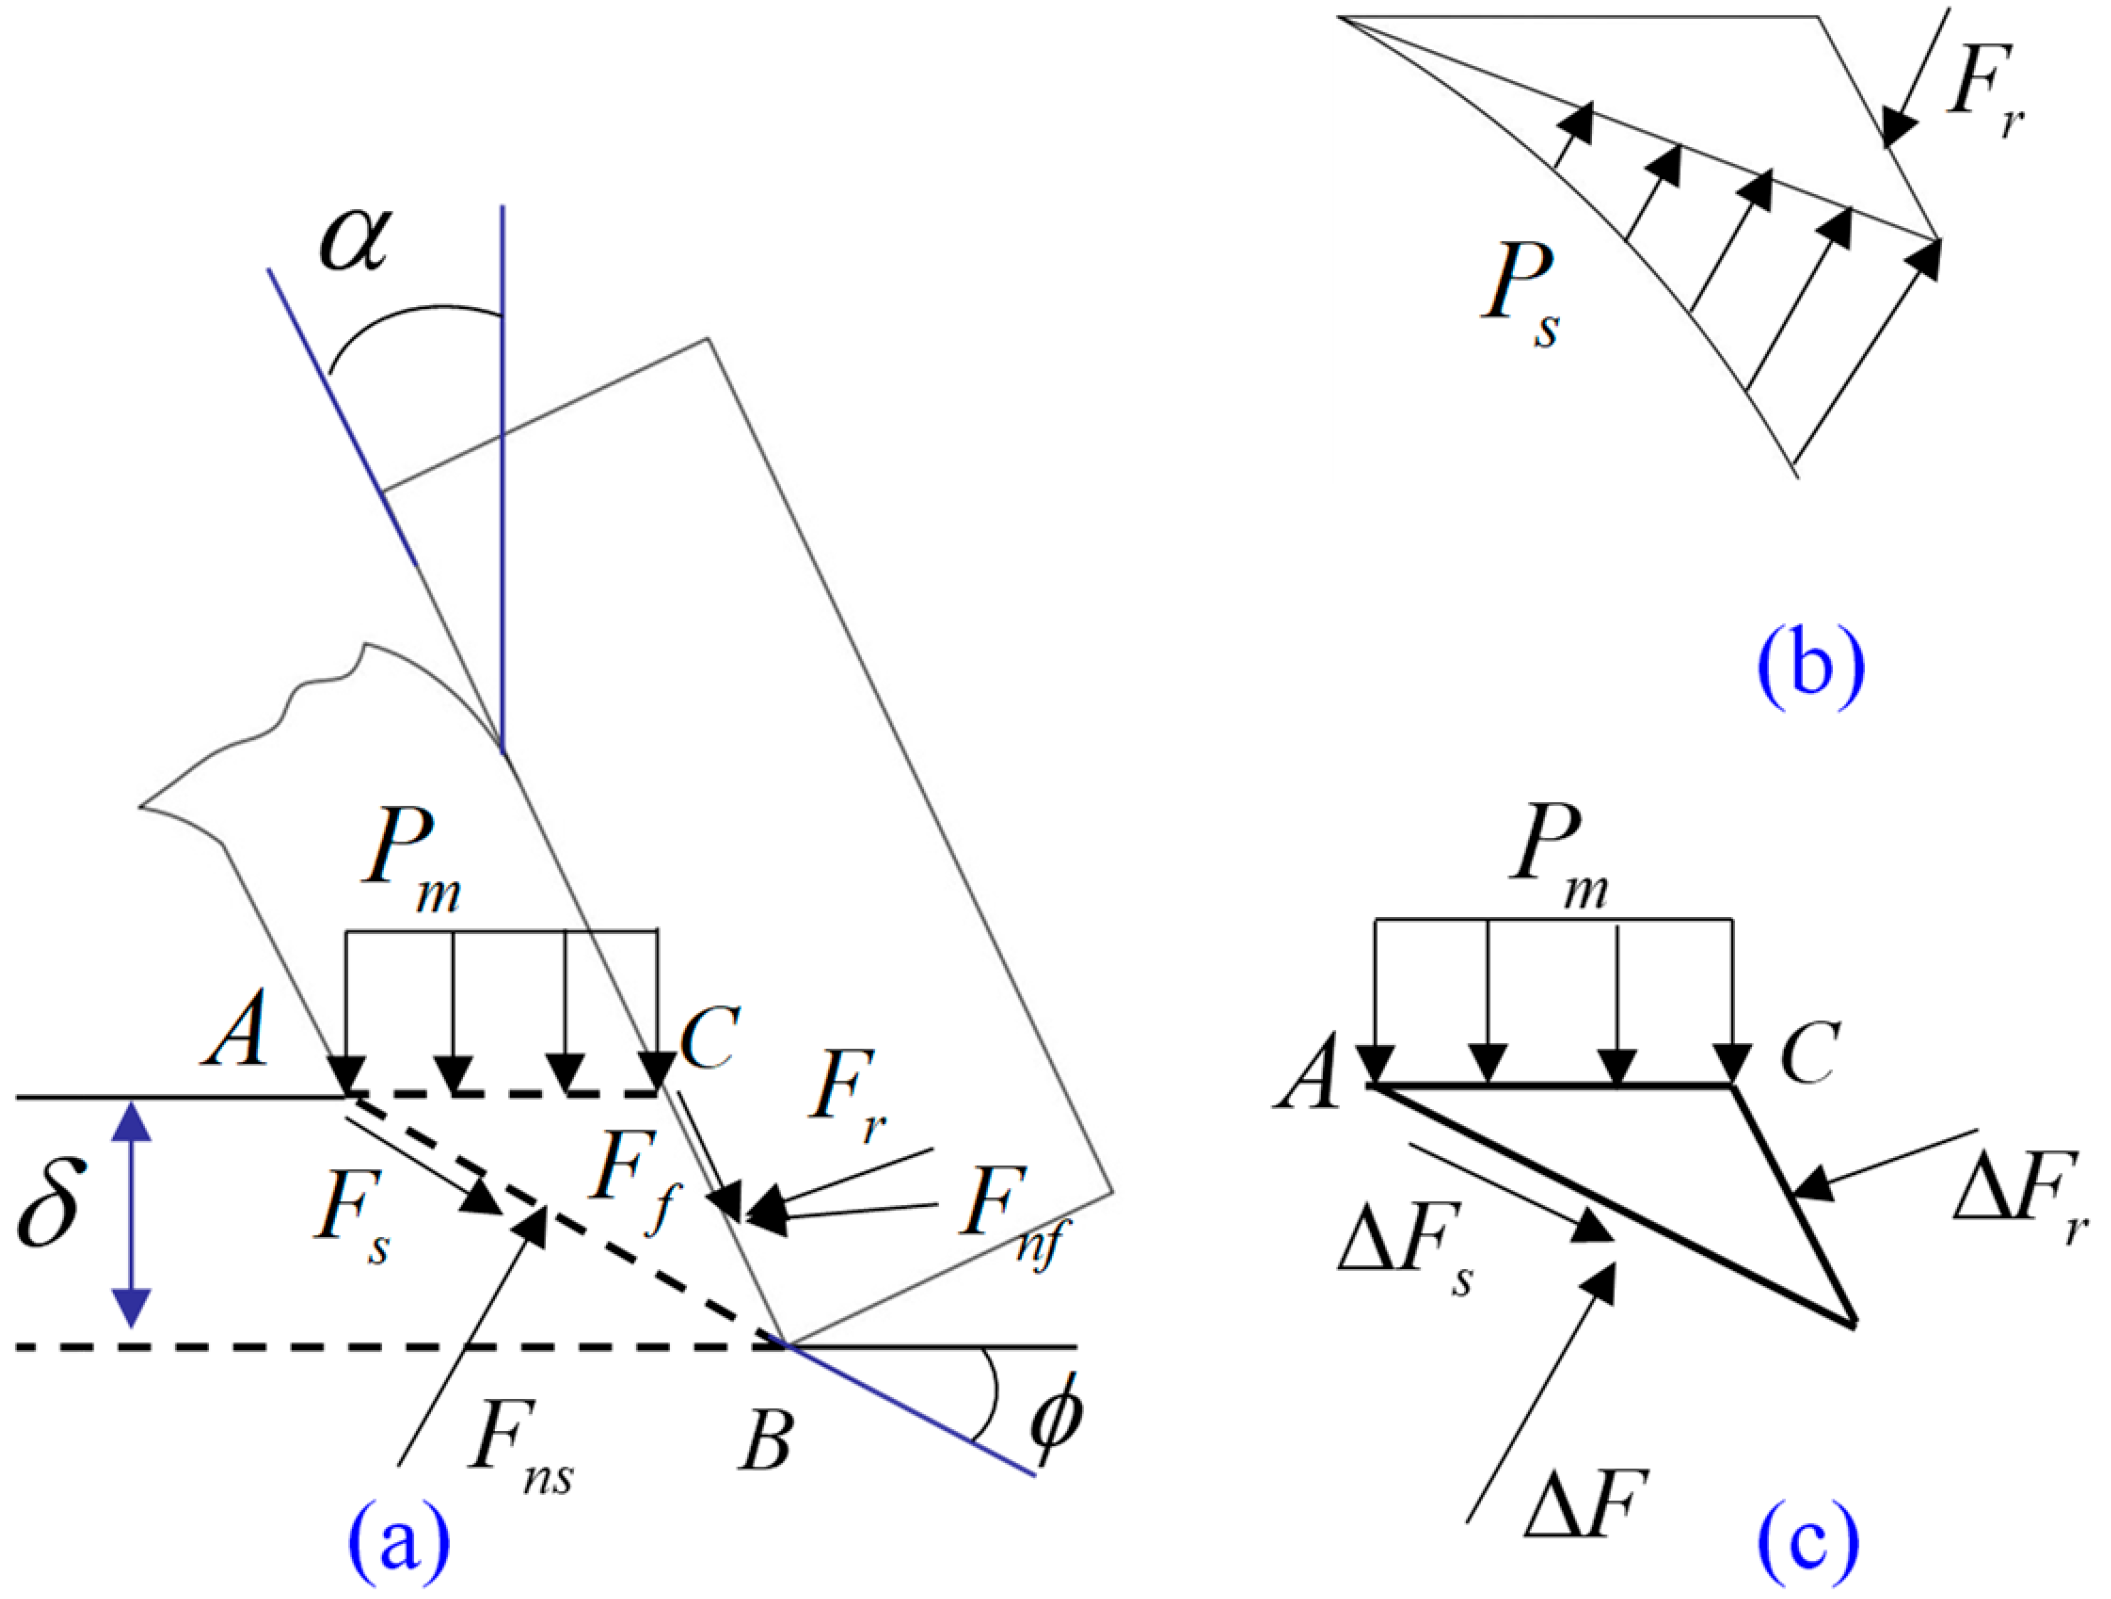
In the cutting model shown in Figure 2a, the ABC part above the shear plane of the rock is taken out for force analysis. The upper surface of the rock, AC, acts on a fluid column pressure Pm from the drilling fluid. The part of the rock in contact with the cutting edge, BC, is subjected to normal pressure Fnf and frictional force Ff. There are normal pressure Fns and shear force Fs on the shear plane AB.
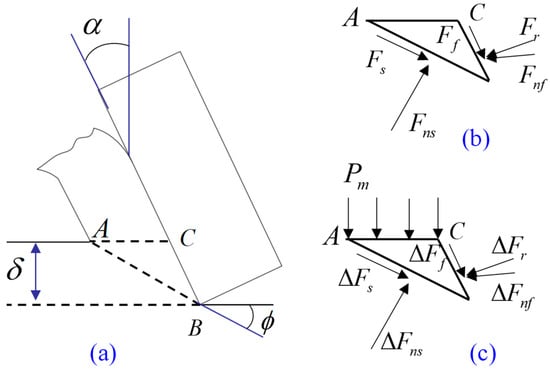
Figure 2.
Schematic diagram of force analysis of rock in shear zone. (a) shear plane of the rock; (b) Force model I; (c) Force model II.
According to the geometric relationship, the relationship between the surface area Sp of AC and the cutting cross-sectional area Sst is:
The relationship between the surface area Ss of AB and the cutting cross-sectional area Sst is:
For the convenience of solving, the calculation problem of cutting load under the pressure of the bottom hole fluid column is decomposed into two cases of superposition, namely the superposition of cutting load without Pm action and the increment of cutting load with Pm action.
① Force analysis when Pm = 0
When Pm is zero, the force situation of the model is shown in Figure 2b. From the static equilibrium conditions along the shear plane direction, it can be concluded that:
The static equilibrium condition in the normal direction of the shear plane can be obtained:
In the above equation, α is the front angle of the single-edged tooth (in the direction shown in Figure 2a); the shear fracture angle of rock under the action of a single-blade tooth; is the friction angle between the rock and the single tooth rake face; and .
According to the Mohr–Coulomb criterion, there are:
Among them, τ0 is the shear strength of the rock under normal pressure, and ζ is the internal friction angle of the rock.
Because shear stress is uniformly distributed on the shear plane, therefore:
Solve the system of equations composed of Equations (4) and (5), and obtain:
Furthermore, it can be calculated that:
According to the principle that the shear plane should occur in the direction where the energy consumption per unit of cutting volume is minimized, the shear angle can be obtained as ξ, , and α, and ζ is the relationship between them. If the unit cutting power is Pu, then there is:
Taking the extremum of the above equation, that is, taking the derivative of Pu over and making the expression of the derivative equal to zero, then there is:
So,
② Calculate the increment of Fr caused by Pm.
When the effect of Pm is increased, the force situation of the model is shown in Figure 2c. Because the rock is already in a shear slip state, there is:
The static equilibrium equation along the shear plane direction is:
The static equilibrium equation along the normal direction of the shear plane is:
Fp is the combined force of Pm on the surface, i.e., .
Solve the equation system composed of Equations (13) and (14), and obtain:
③ Analysis results after synthesis
The final result of Fr and Fns should be the sum of Equations (7) and (15) and Equations (8) and (16). Namely, it is:
If the equilibrium equations for all forces (including Fp) are directly listed without the use of superposition, the results obtained are exactly the same as those in Equations (17) and (18).
With the force Fr exerted on the rock by the teeth, the main cutting force Fd and the normal force Fn can be calculated:
Substitute and Equations (1) and (2) into the above two equations to obtain:
(2) Cutting force during single-edge oblique cutting
When the inclination angle of the blade is not zero, in addition to being subjected to the main cutting force and normal force, the blade will also be subjected to a lateral force perpendicular to the above two directions
By substituting Equations (1) and (2) into Equation (19), the frictional force Ff acting on the single-tooth rake face can be calculated:
Substitute into the above equations and calculate the frictional force ff per unit of cutting width:
This is the formula for calculating the unit blade width friction load of a single-edge orthogonal cutting model under the pressure of the wellbore fluid column.
3.2. Cutting Force Under the Condition of Power Function Distribution of Shear Plane Stress
Mechanical performance tests were conducted on the sealing washer and energy supply ring of the current single-metal seal at a certain company, including uniaxial tension, proportional biaxial tension, and planar tension, as shown in Figure 3.
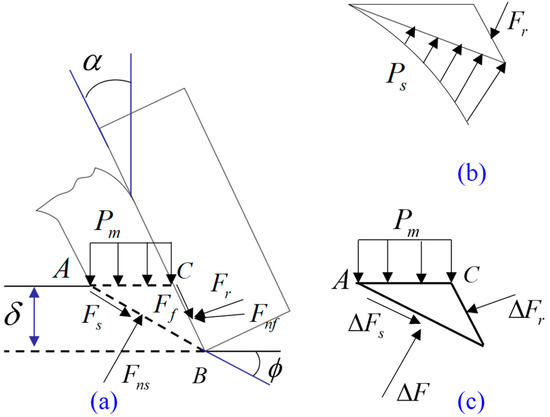
Figure 3.
Power function distribution load on shear plane. (a) shear force model of the rock; (b) Force model I; (c) Force model II.
For the solution to the non-uniform stress model on the shear plane, follow the previous method. That is, treat the cutting load as the force Fr of a single tooth on the rock without Pm action (Figure 3b) and the increment of force with the Pm action ΔFr with the superposition of Fr (Figure 3c).
(1) Force analysis when Pm = 0
To reflect the boundary conditions of maximum stress at the cutting edge and zero stress on the free surface on the shear plane, we assume that the load distribution on the shear plane is (see Figure 3):
In the formula, P0 is a constant determined by the force balance equation; Δ represents the distance from the blade tip to any point on the shear fracture line; and ρ is the stress distribution coefficient.
The combined force on the shear plane should be equal to the force Fr of the teeth on the rock, so there is:
Substitute into Equation (24) and set it to Δ = 0. The maximum load at the blade tip is:
Decompose it into normal stresses on the shear plane σ and shear stress τ and obtain:
According to the Mohr–Coulomb criterion, there is the following relationship:
Substitute Equations (26) and (27) into the above equation to obtain the solution:
Taking the extreme value of this equation yields the shear fracture angle , at which Fr is the extreme value:
4. Finite-Element Simulation Study on the Interaction Between Cutting Teeth and Rock
In order to more realistically reflect the stress and deformation of cutting teeth of a PDC bit on rocks, a three-dimensional finite-element simulation of the PDC tooth cutting process on rocks is conducted in this paper. The rock is processed according to an elastic–plastic model, and important reference conclusions and suggestions are obtained by changing the structure parameters and cutting parameters of the PDC tooth. This provides a certain theoretical basis and analysis method for the optimization design and engineering application of PDC cutting teeth.
4.1. Three-Dimensional Finite-Element Geometric Modeling
(1) Model geometry and material parameters
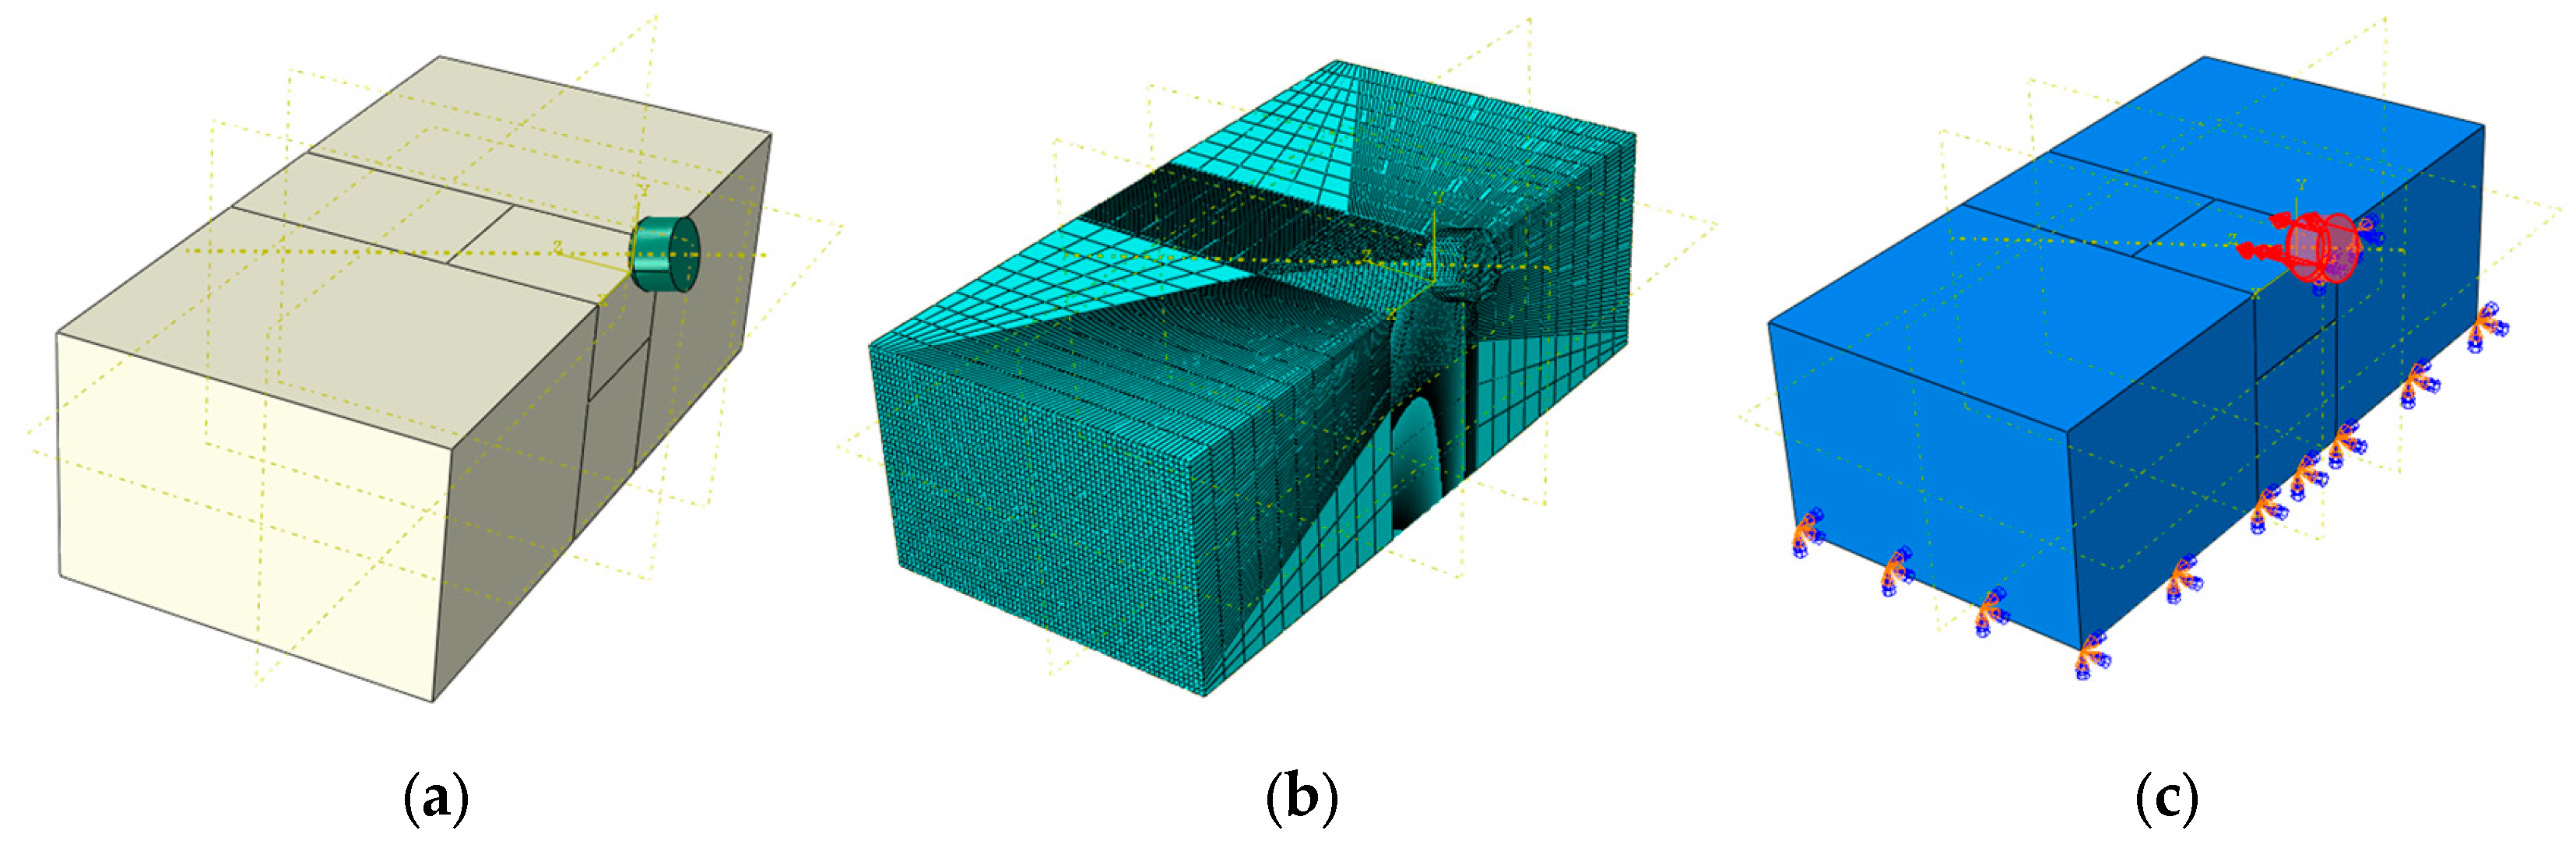
Considering the computing power of computer configuration and the principles of Saint Venant’s mechanics, the rock length was taken as 150 mm, the width as 75 mm, and the height as 50 mm during modeling. Three types of PDC cutting teeth were selected based on the actual situation, with diameters of 8 mm, 13.44 mm, and 19.05 mm and corresponding thicknesses of 8 mm, 8 mm, and 16 mm, respectively. In order to meet the needs of local mesh refinement, rocks were cut during modeling. At the same time, hexahedral elements were used for mesh division to improve calculation speed and accuracy. During the assembly process, a certain distance was made between the cutting teeth and the rock cutting surface (as shown in Figure 4). The density of PDC cutting teeth is 3485 kg/m3. The elastic modulus is 860.073 GPa, and the Poisson’s ratio is 0.0768. According to the experimental results in the previous chapter, the rock’s material parameters are taken as an elastic modulus of 2920 MPa, a Poisson’s ratio of 0.168, and a density value of 2540 kg/m3.

Figure 4.
Cutting assembly model and finite-element calculation model. (a) Cutting assembly diagram; (b) finite-element model; (c) boundary and loading model.
(2) Define analysis steps, boundaries, and contact relationships
During loading, a displacement load along the Z-axis is given to the cutting teeth, with a displacement load size of 20 mm. Smooth loading is performed along the time analysis step. According to the working parameter range of the PDC drill bit under sufficient cleaning and cooling, the speed ranges from 50 r/min to 400 r/min, the drilling pressure ranges from 2 kN to 14 kN, and the total cutting time is set to 0.01 s. The boundary conditions completely fix the bottom surface of the rock, and the cutting teeth only allow it to move along the Z-axis direction. For the friction between contact surfaces, the penalty friction formula for elastic sliding is adopted, with a tangential friction coefficient of 0.25 set. The normal contact relationship of the contact surface adopts the “hard contact” formula, which means that the normal direction of the contact surface does not transmit tension, and the nodes on the passive surface cannot invade the elements of the active surface.
(3) Cutting unit failure and separation criteria
First, a toughness fracture criterion considering stress was established, and the simulation results were compared with experimental results, proving its effectiveness. A failure-stress criterion was proposed [39], which can be expressed as:
In the formula, and are the normal stress and shear stress of the interface unit between the chip and the workpiece, respectively, and and represents the critical values of normal stress and shear stress, respectively. When and reach a certain value and Equation (30) holds, the previous node at the tool tip is released. That is, the chips are separated from the workpiece.
4.2. Three-Dimensional Finite-Element Simulation Results and Analysis
According to the actual working conditions of the PDC cutting teeth, in the process of simulating the rock cutting of the PDC teeth, different structural parameters and cutting parameters of the cutting teeth are changed for simulation, and some important reference values for protecting the cutting teeth and improving the rock-breaking efficiency are obtained.
4.2.1. Change the Size of the Rake Angle of the Cutting Teeth
In this paper, 13.44 mm teeth are selected for simulation analysis, and the cutting depth is 2 mm, and the rake angles of the teeth are 15°, 20°, and 25°, respectively. The PDC teeth are treated according to 45° chamfering, and the chamfering radius is 0.5 mm. The von Mises contour is shown in Figure 5. It shows that the von Mises stress increases first and then decreases with the increase of the rake angle of the PDC tooth, but the deformation area of force of the tooth gradually increases.
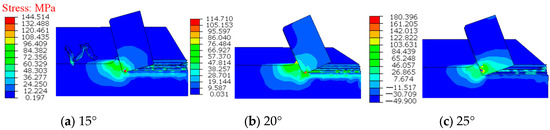
Figure 5.
Mises stress field under different rake angles.
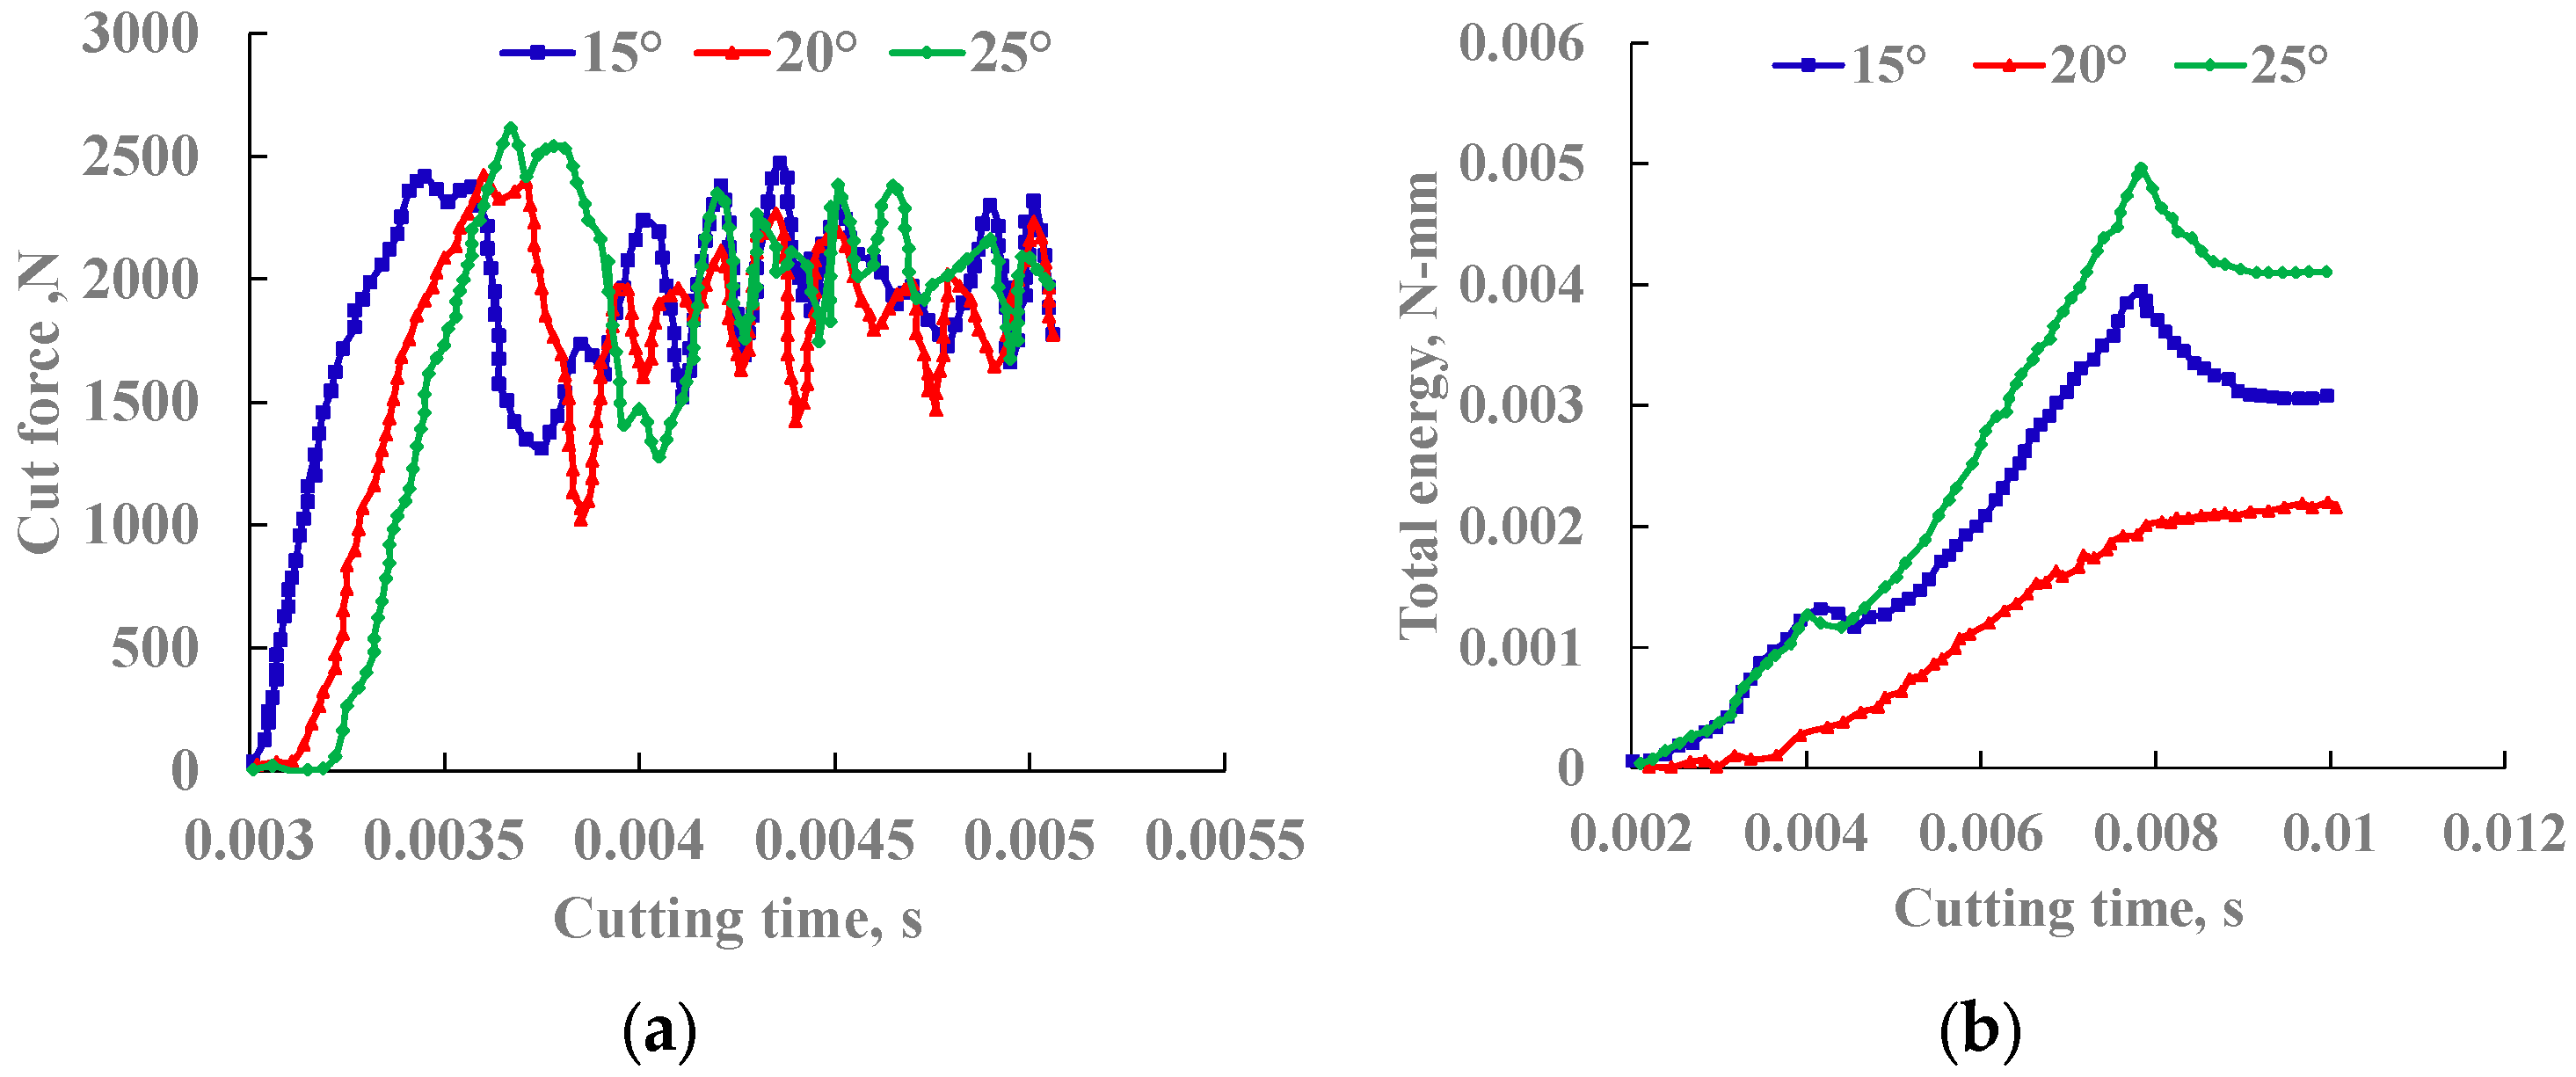
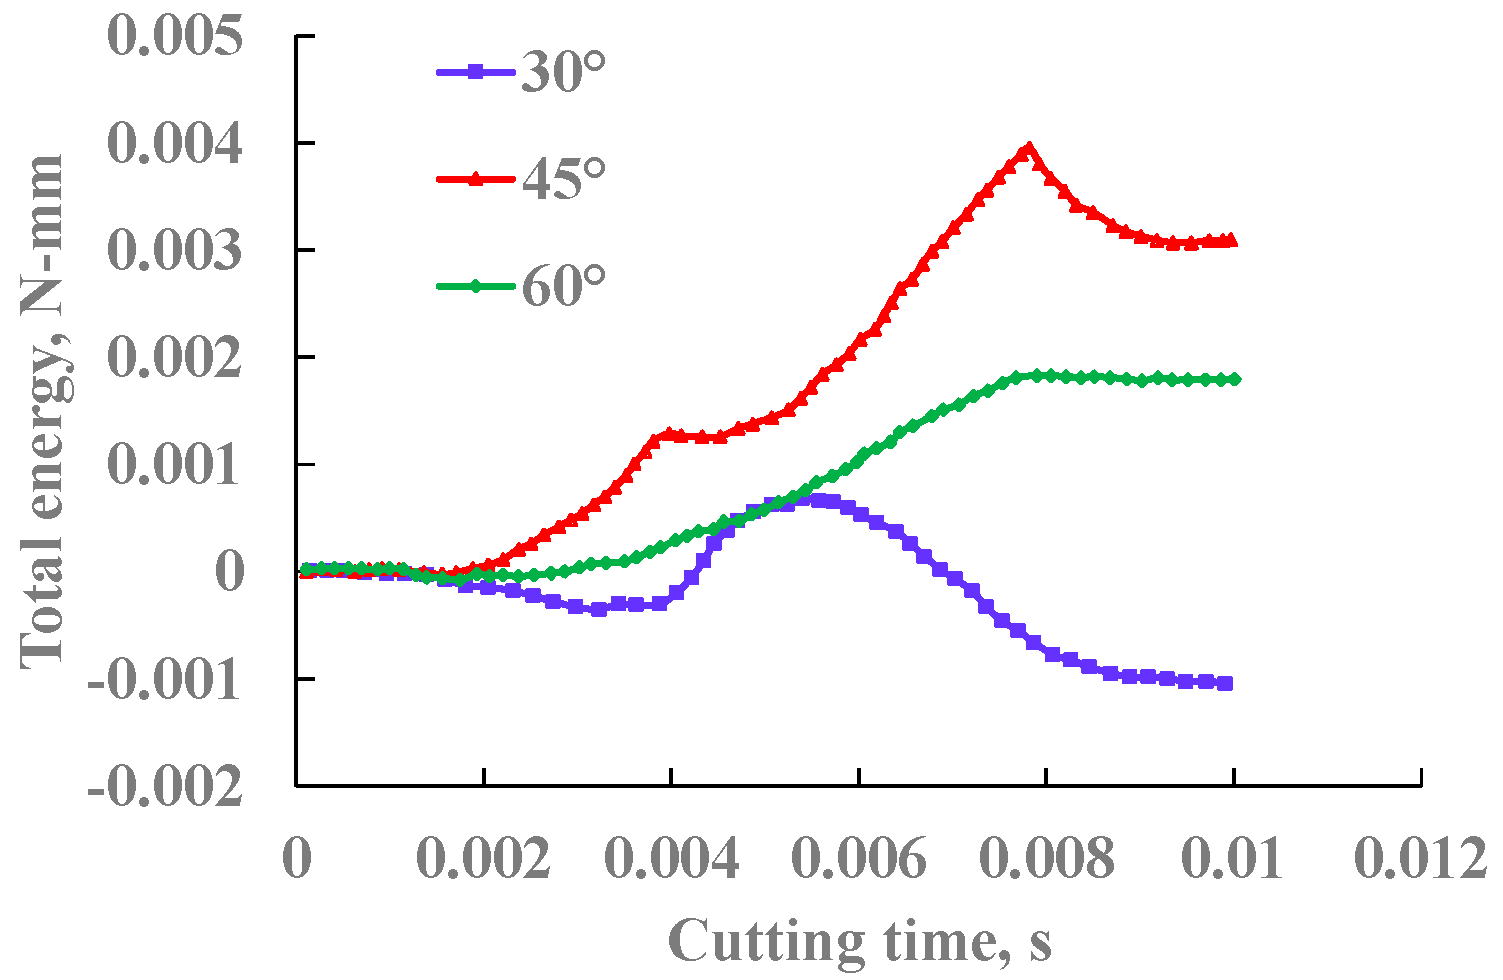
In addition, it shows that the cutting force required to start destroying the rock decreases first and then increases when the tooth rake angle becomes larger in Figure 6a, wherein the maximum cutting force corresponding to the rake angle of the tooth is 2430.85 N. The maximum cutting force corresponding to the tooth rake angle of 20° is 2408.09 N when the tooth rake angle is 15°, and the maximum cutting force corresponding to the tooth rake angle is 2610.51 N when the tooth rake angle is 25°. As shown in Figure 6b, the energy required by the system also decreases first and then increases when the rake angle of the tooth increases. The results show that the rake angle of the tooth should not be too large or too small. Too large or too small may make it more likely that the cutting teeth are subject to wear or damage. Therefore, it is not advisable to use a too large or too small tooth rake angle in the PDC drill bit design. In addition, it is obvious that the rake angle of 20° for the cutting tooth is the most conducive to the crushing of sandstone. Because the von Mises stress of the rock is the greatest, the system consumes the least amount of energy, and the teeth experience the least cutting forces.
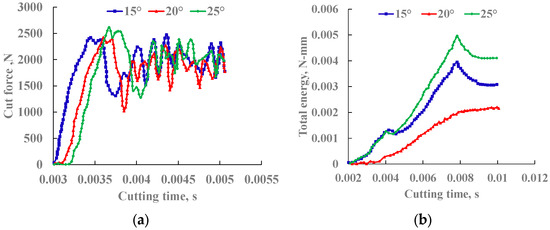
Figure 6.
Cutting force and total system energy when different tooth rake angles are cut. (a) Change in cutting force; (b) change in total energy of the system.
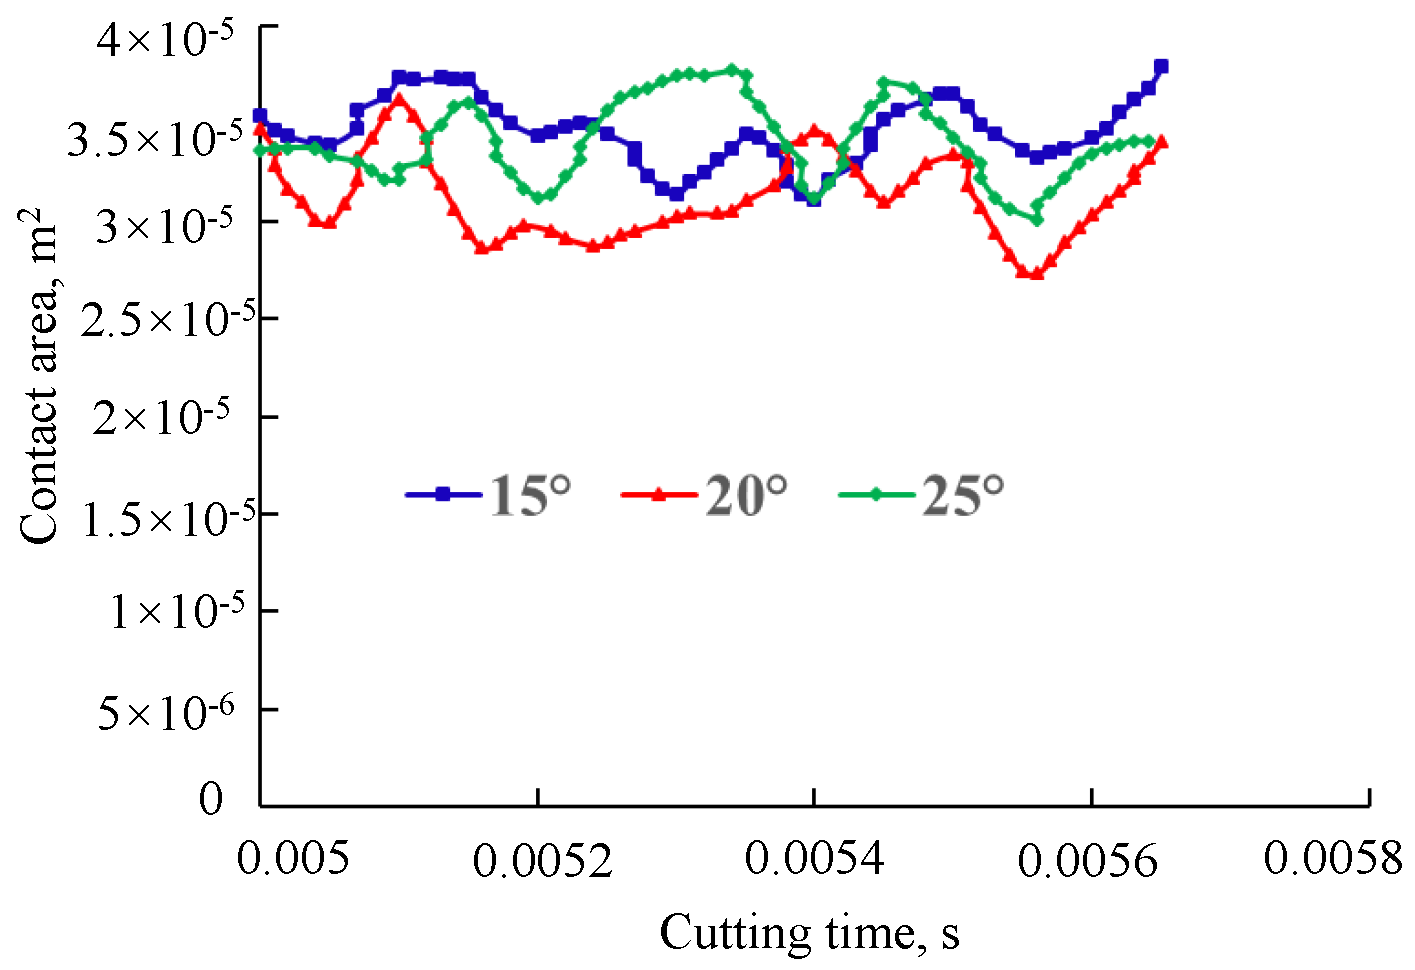
Figure 7 shows the contact area between the tooth and the rock during the cutting process at different tooth rake angles. It shows that the contact area between the PDC tooth and the rock is generally periodic, and the amplitude of the change is relatively small. In addition, the figure also shows that the change amplitude of the contact area is the smallest when the tooth rake angle is 20°, and the contact area is also smaller, so the cutting is more conducive to the cutting tooth eating into the formation and prolonging the service life of the cutting tooth when the tooth rake angle is 20°.

Figure 7.
Changes in the contact area of different rake angles of PDC teeth during cutting.
4.2.2. Change the Cutting Depth of the Cutting Teeth
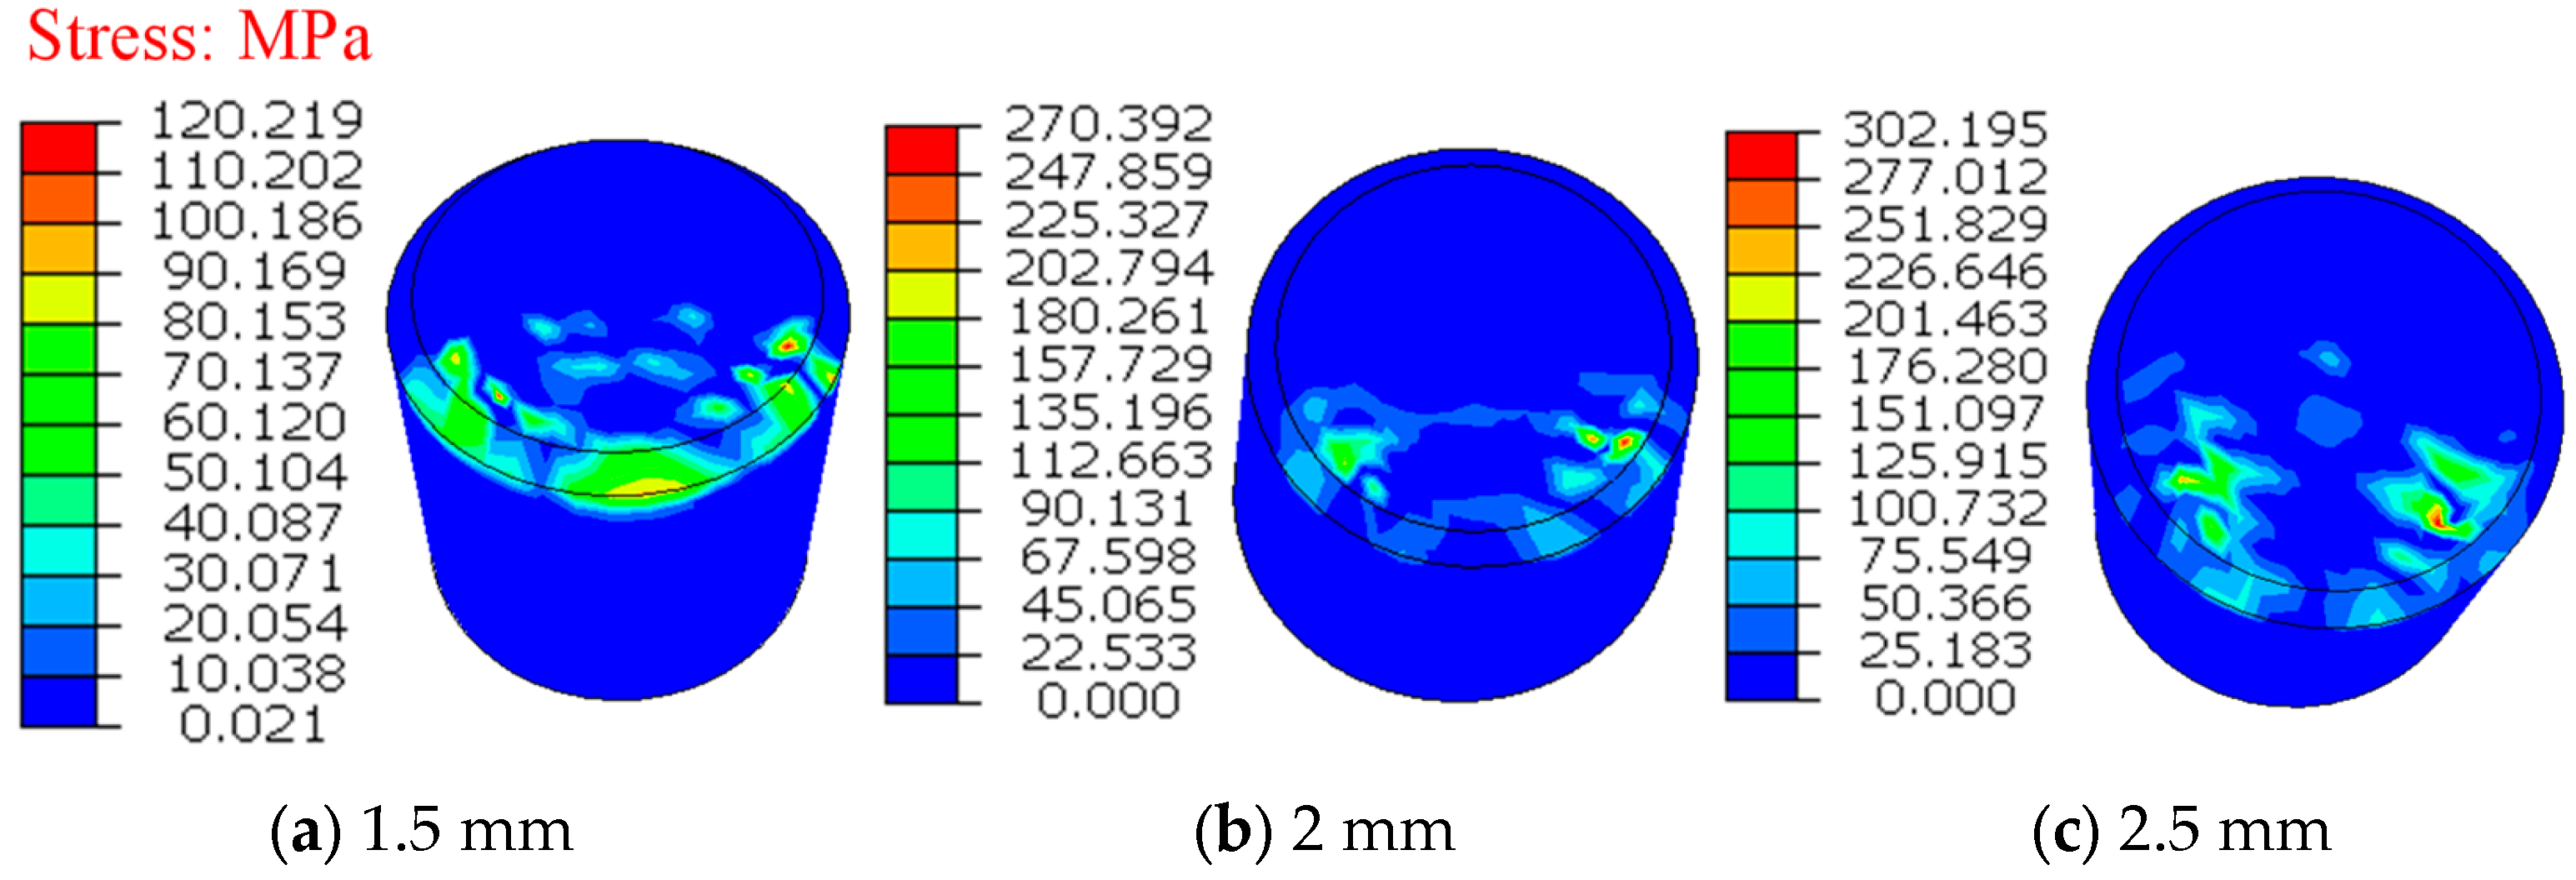
In this paper, Teeth with a diameter of 8 mm are selected for simulation analysis. The rake angle of the teeth is 20°. The teeth are chamfered at 45°, and the chamfer radius is 0.5 mm. In the simulation, the cutting depths are 1.5 mm, 2 mm, and 2.5 mm, respectively, in Figure 8.
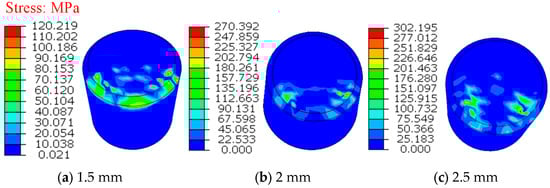
Figure 8.
Pressure distribution on the teeth at different depths of cut.
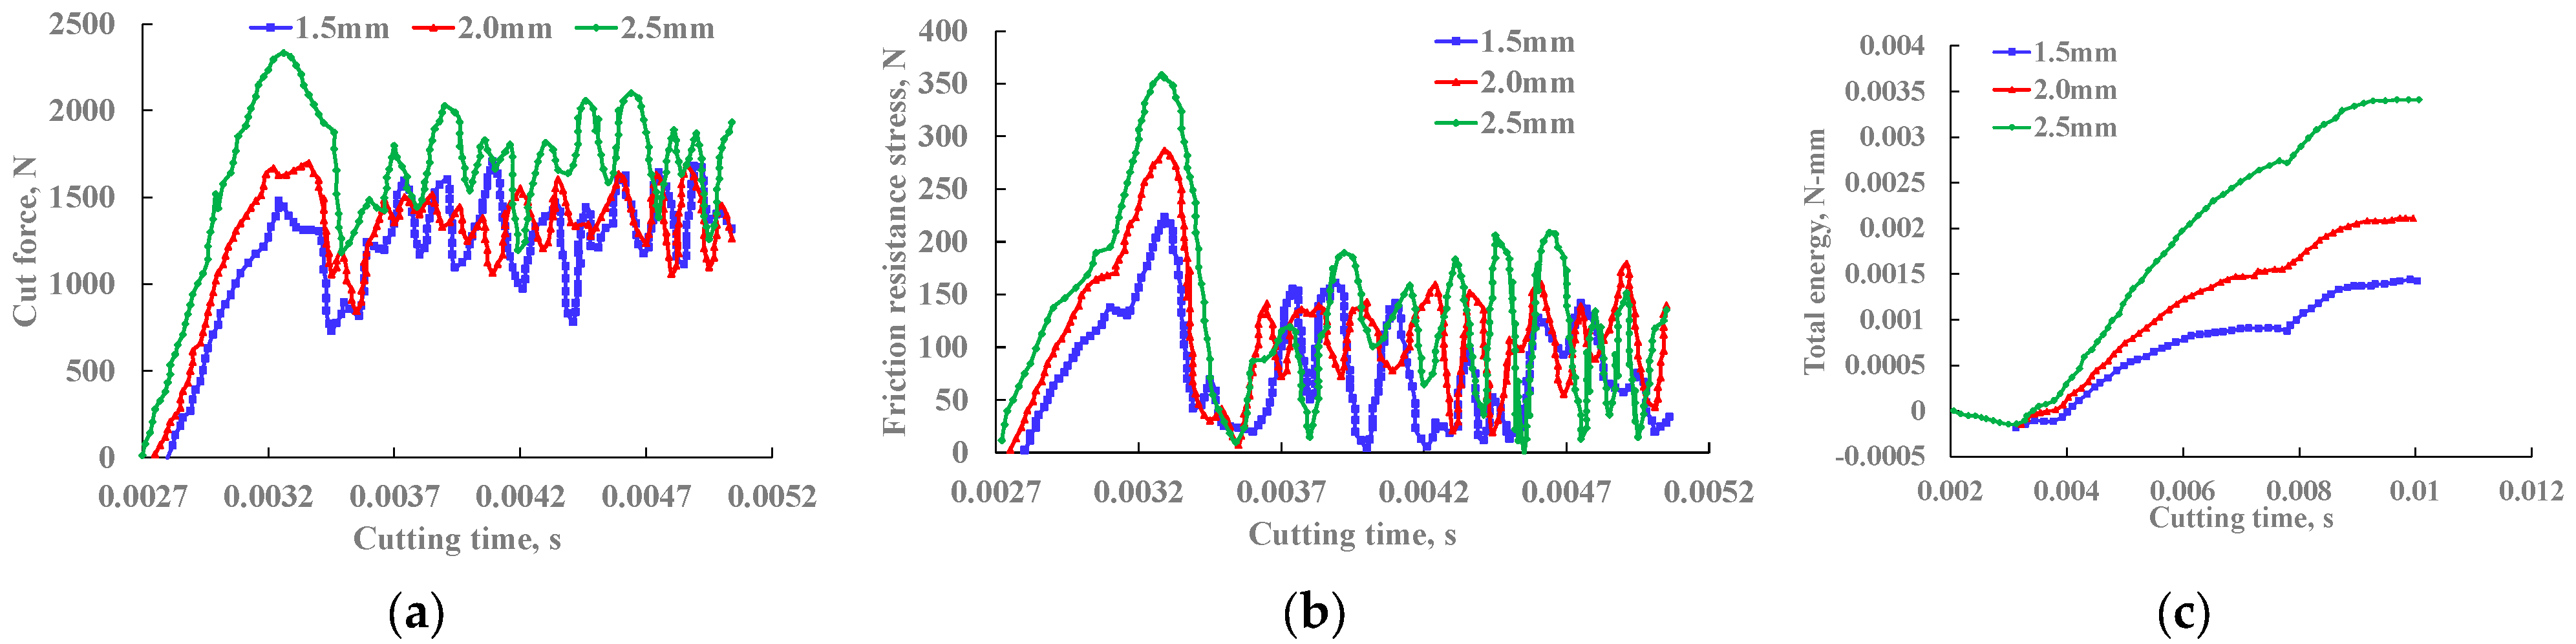
Figure 9 shows that the contact pressure gradually increases with the increase in cutting depth, and a large pressure is generated at the contact edge because the contact area between the cutting tooth and the rock increases. And the resistance of the rock to the cutting tooth also increases. At the same time, the cutting force increases with the increase in cutting depth. Frictional resistance stress and total energy of the system on the tooth also gradually increase (as shown in Figure 9). During the cutting process, the values of cutting force and frictional resistance stress fluctuate, which is in line with the basic characteristics of plastic–brittle materials. The main production is extrusion and crushing chips. When the cutting depth is small, the maximum value change of the cutting force is not too obvious, and the fluctuation trend is not very obvious. Most of the cutting process is to produce large particle block fracture chips when the cutting depth increases. At this time, the cutting force will have a large fluctuation with the generation and discharge of large particle chips. In addition, the non-uniformity of the rock material also makes the cutting process unstable.
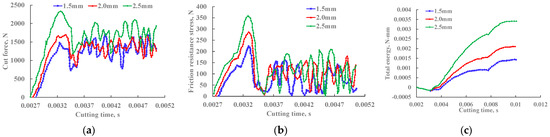
Figure 9.
Changes in cutting force, frictional resistance stress, and total energy of the system at different depths of cut. (a) Cutting force; (b) frictional resistance stress; (c) total energy.
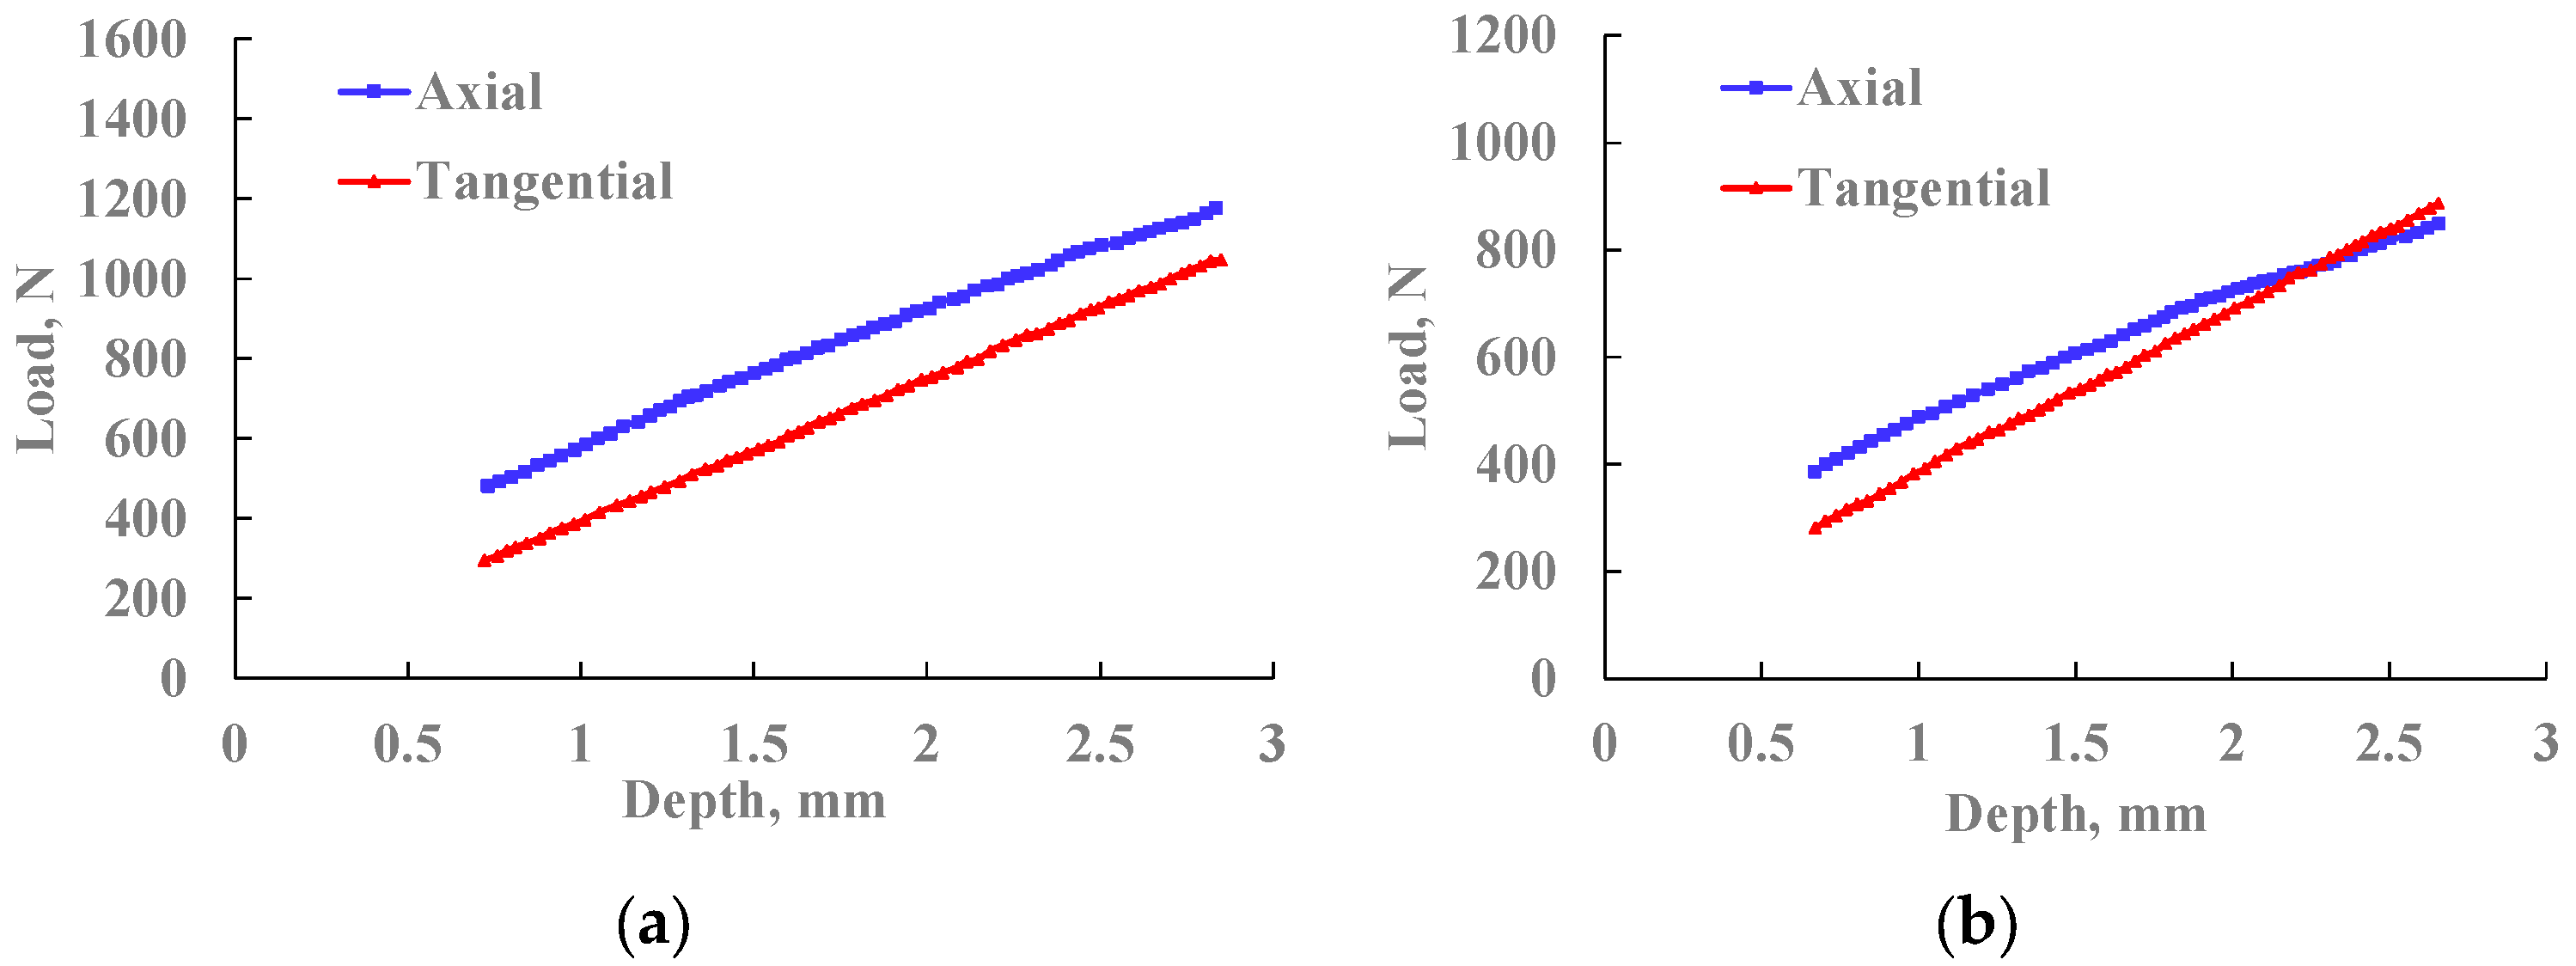
In Figure 10, the simulation results show that the variation in the average cutting load increases with the cutting depth when the cutting teeth with a tooth rake angle of 20° and a diameter of 19.05 mm are used to cut red sandstone and Xiangxi sandstone.
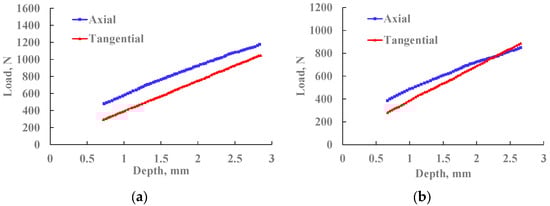
Figure 10.
The average cutting load of the two materials varies with the depth of cutting. (a) Red sandstone; (b) Xiangxi sandstone.
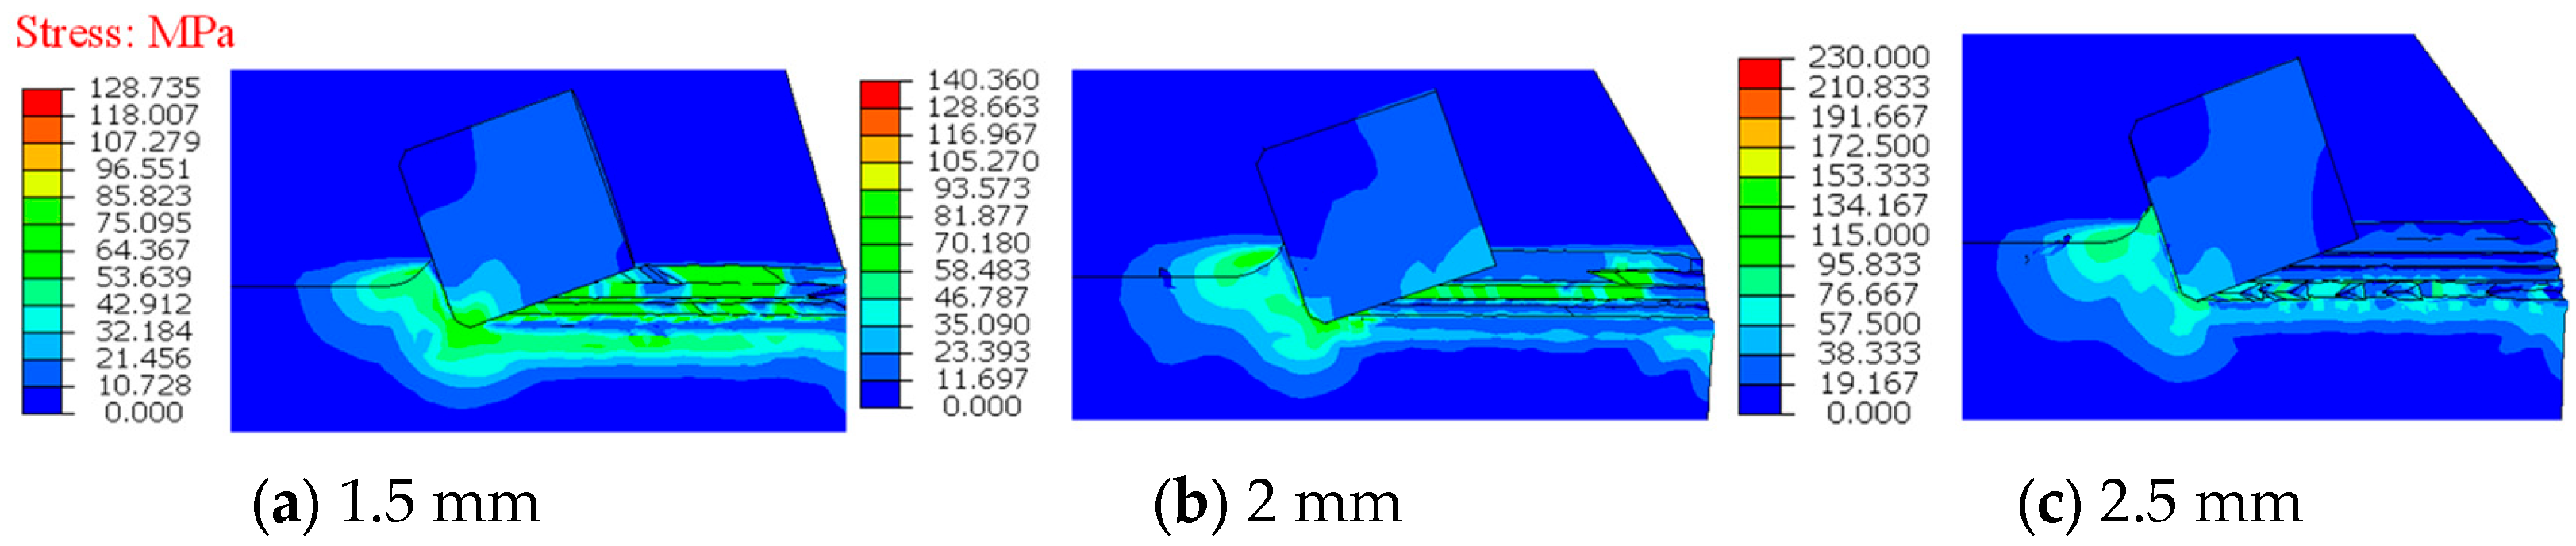
It shows that the von Mises stress in the rock increases with the increase in cutting depth in Figure 11, which indicates that a larger cutting depth is beneficial to improve the rock-breaking efficiency of PDC cutting teeth. However, if the cutting depth is too large in practical engineering applications, the PDC cutting teeth may be damaged due to excessive impact load. So, the necessary measures should be taken to control the cutting depth of the PDC cutting teeth in practical applications.
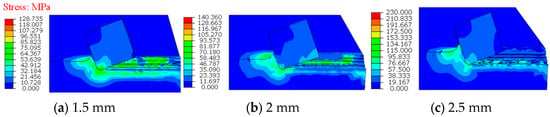
Figure 11.
Mises stress field at different depths of cut.
In the process of cutting rock, if the residual stress in the rock is as large as possible, it is more conducive to rock breakage, and for the protection of PDC cutting teeth, the contact pressure is as small as possible. But, there is often a contradiction between the two aspects, as follows. As one value becomes larger, the other value will also become larger. Based on this, from the perspective of optimization design, the author sets Ev as an evaluation function, and its mathematical expression is as follows:
In the above equation, X1 represents the maximum contact pressure on the tooth, and X2 represents the maximum stress on the rock. The smaller the value of Ev, the better. The values of X1, X2, and Ev at different depths of cut are shown in Table 1 below (the unit of force is MPa). Obviously, a depth of cut of 2.5 mm is most beneficial for improving the rock-breaking efficiency and protecting the PDC cutting teeth.

Table 1.
Calculation results for different depths of cut.
4.2.3. Change the Diameter of the Cutting Tooth
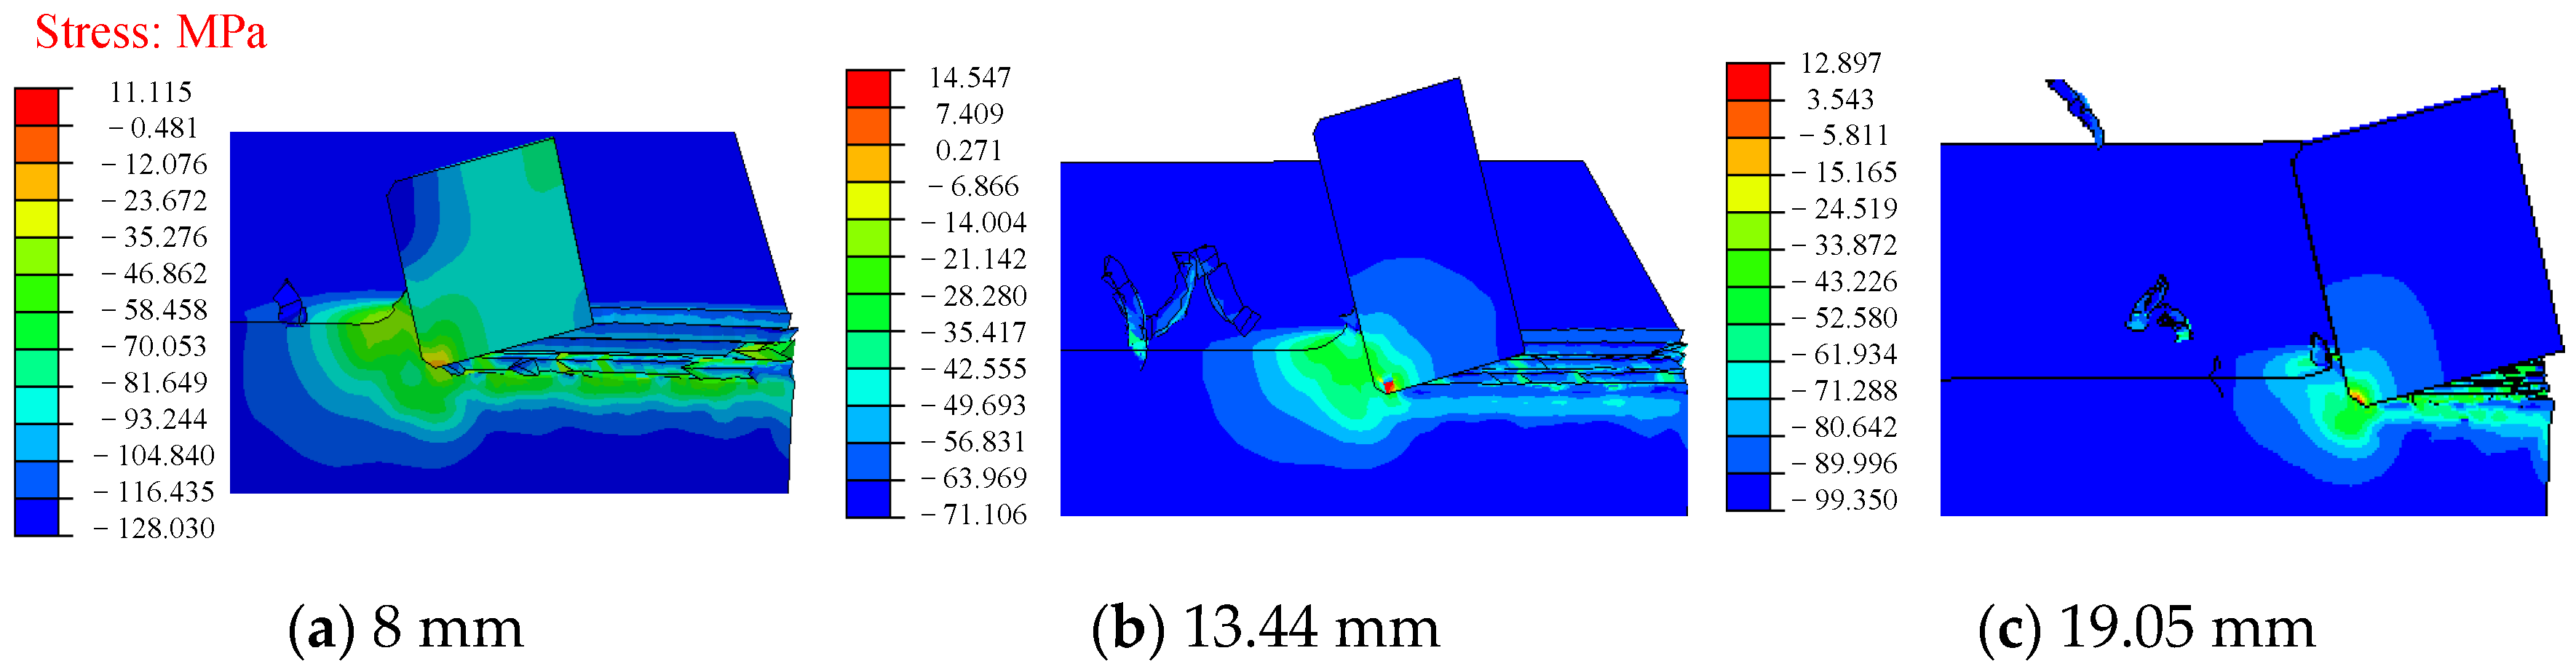
The rake angle of the tooth is 15°. The cutting depth is 2 mm, and the diameters of the cutting teeth are 8 mm, 13.44 mm, and 19.05 mm, respectively, all of which are chamfered at 45°. The chamfering radius is 0.5 mm, and the rock-cutting process is simulated. The Mises equivalent force field is shown in Figure 12. It shows the Mises stress first increases and then decreases with the increase in the diameter of the cutting tooth.

Figure 12.
Mises stress field at different radii.
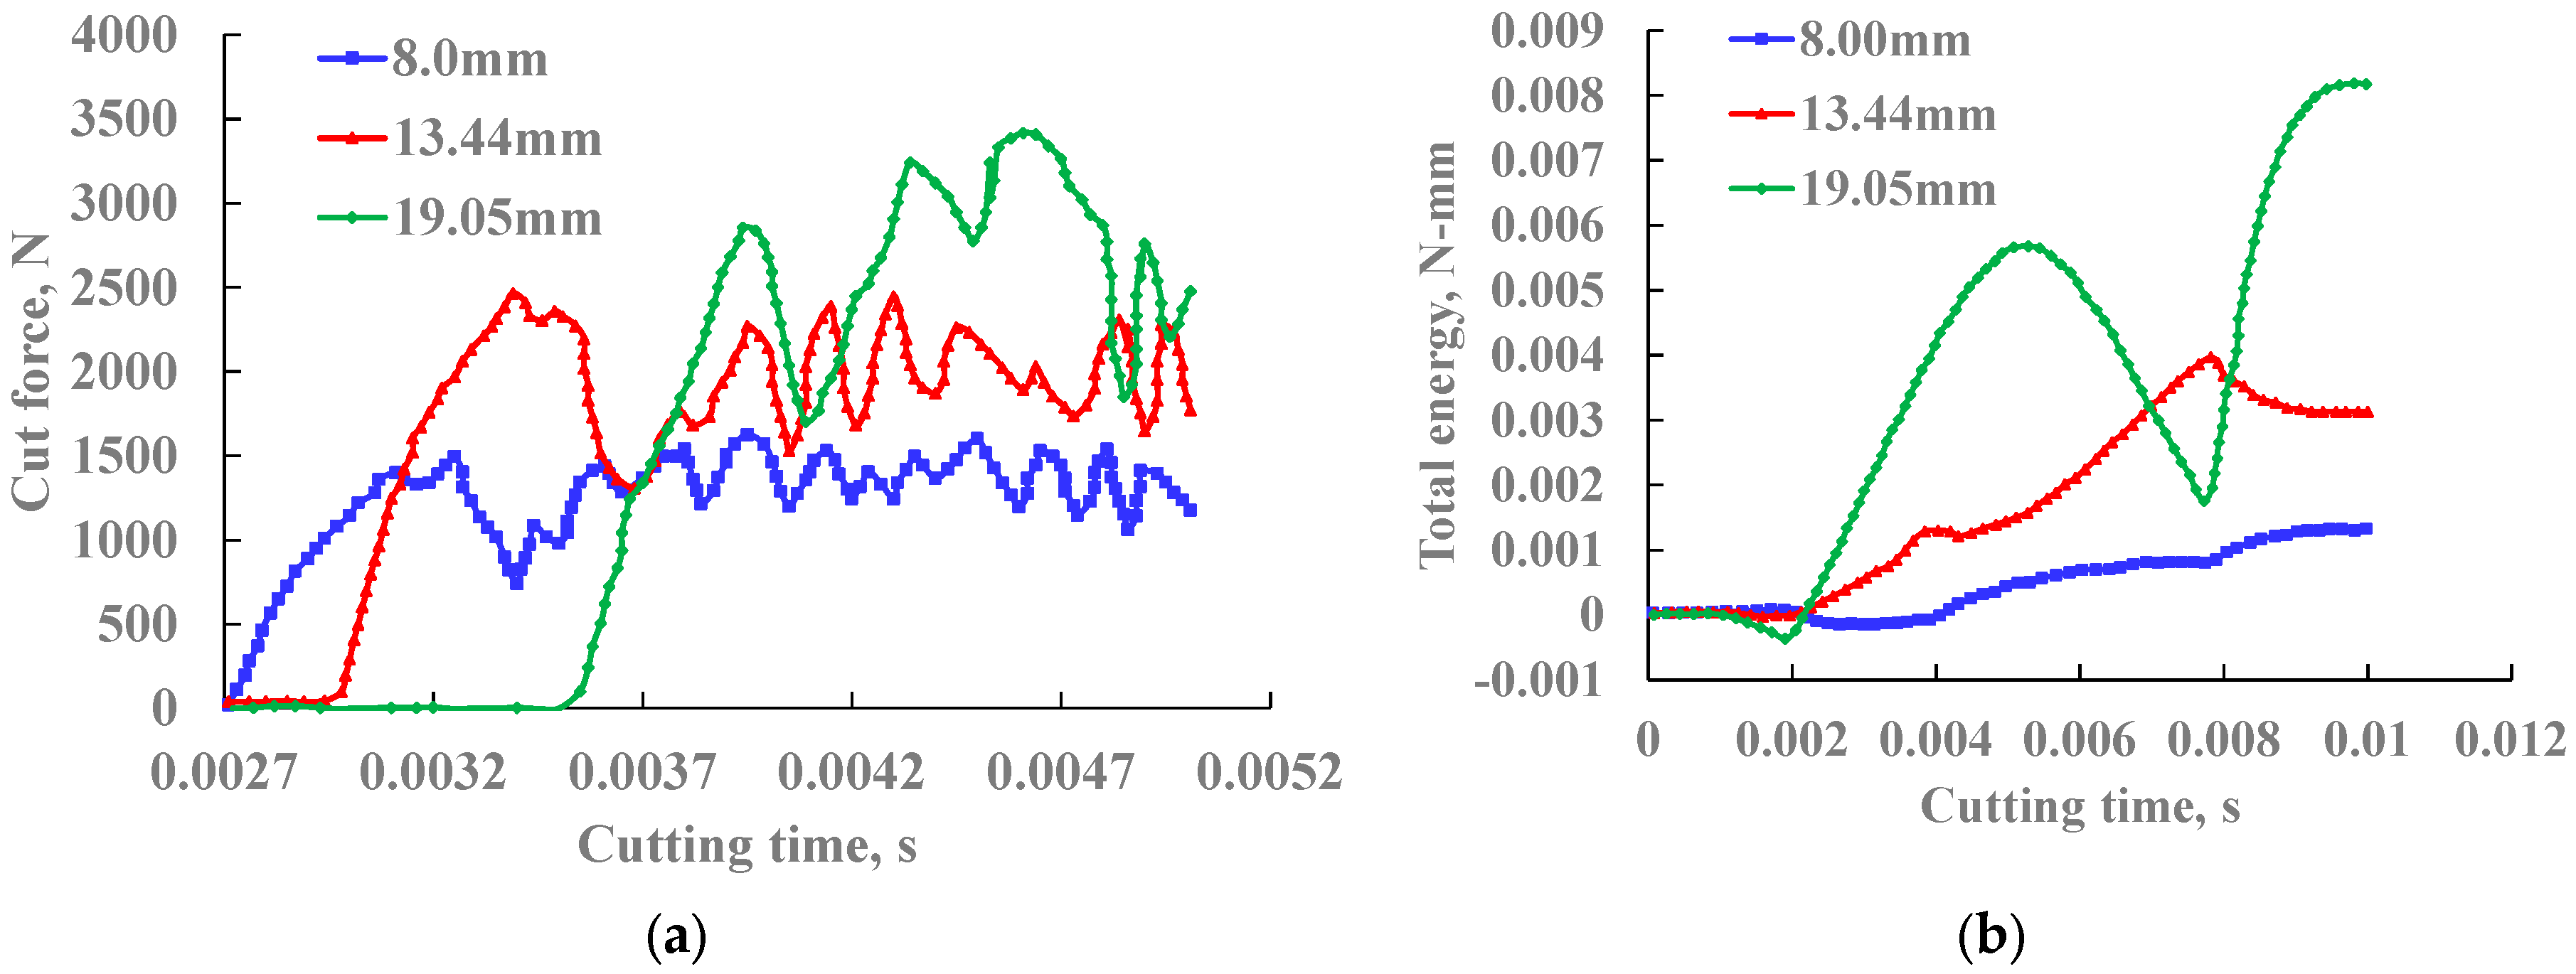
The change in cutting force during the cutting process is shown in Figure 13a, and the change in the total energy of the system is shown in Figure 13b. The small tooth can more easily cut into the rock than the large tooth with the same drilling pressure and torque. Because the small-diameter tooth has a higher cutting edge curvature than the large-diameter tooth and forms a higher contact stress in the contact area of the rock, it is easier to deform and damage the rock under the indentation action of the small-diameter tooth.
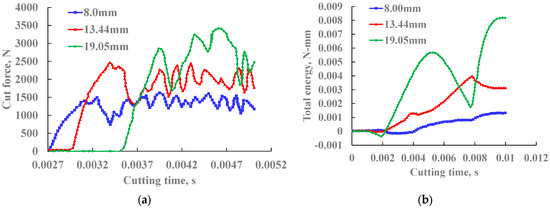
Figure 13.
Changes in cutting force and total system energy at different diameters. (a) Change in cutting force; (b) change in total energy of the system.
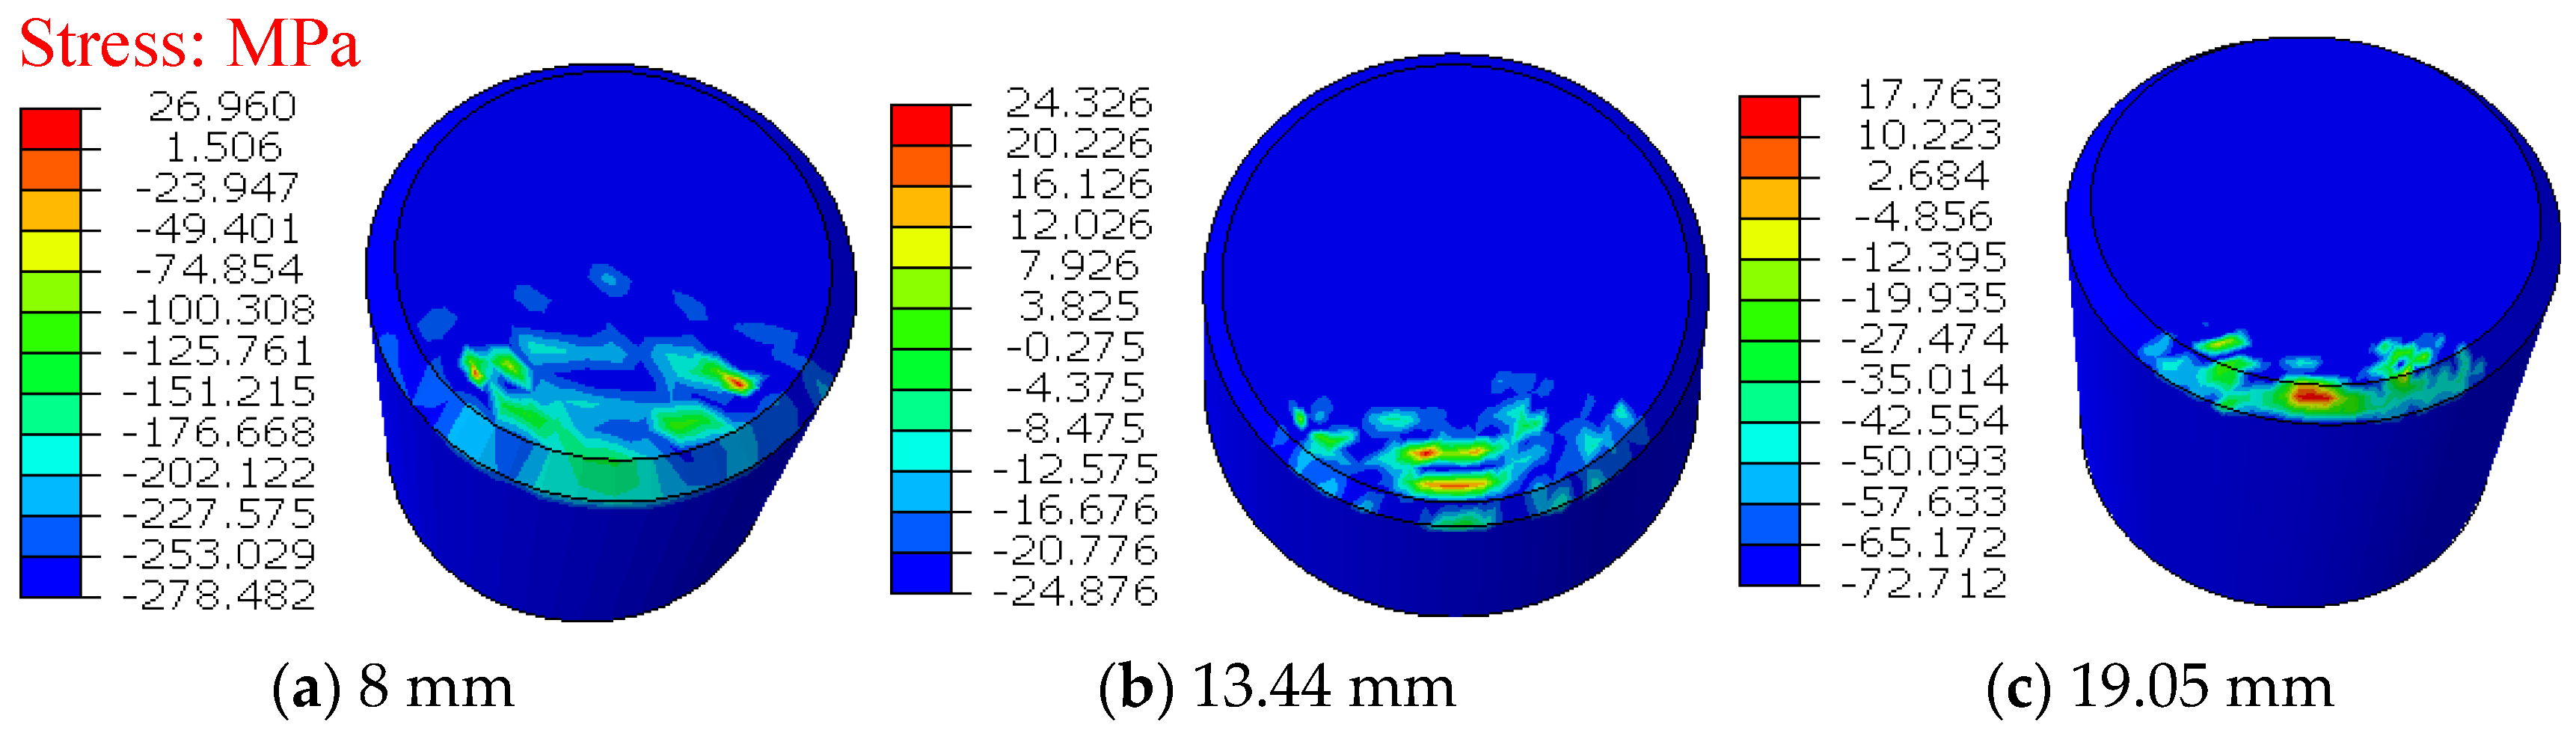
The contact pressure distribution on the cutting teeth of different diameters in the cutting process is shown in Figure 14, which shows that the contact pressure on the teeth decreases when the diameter is larger. A large amount of pressure is generated at the contact edge because the contact area between the teeth and the rock is also increasing with the increase of the diameter of the cutting teeth, and the stress state of the cutting teeth is improved.

Figure 14.
Pressure distribution on the teeth of different diameters.
4.2.4. Change the Chamfer Size of the Cutting Teeth
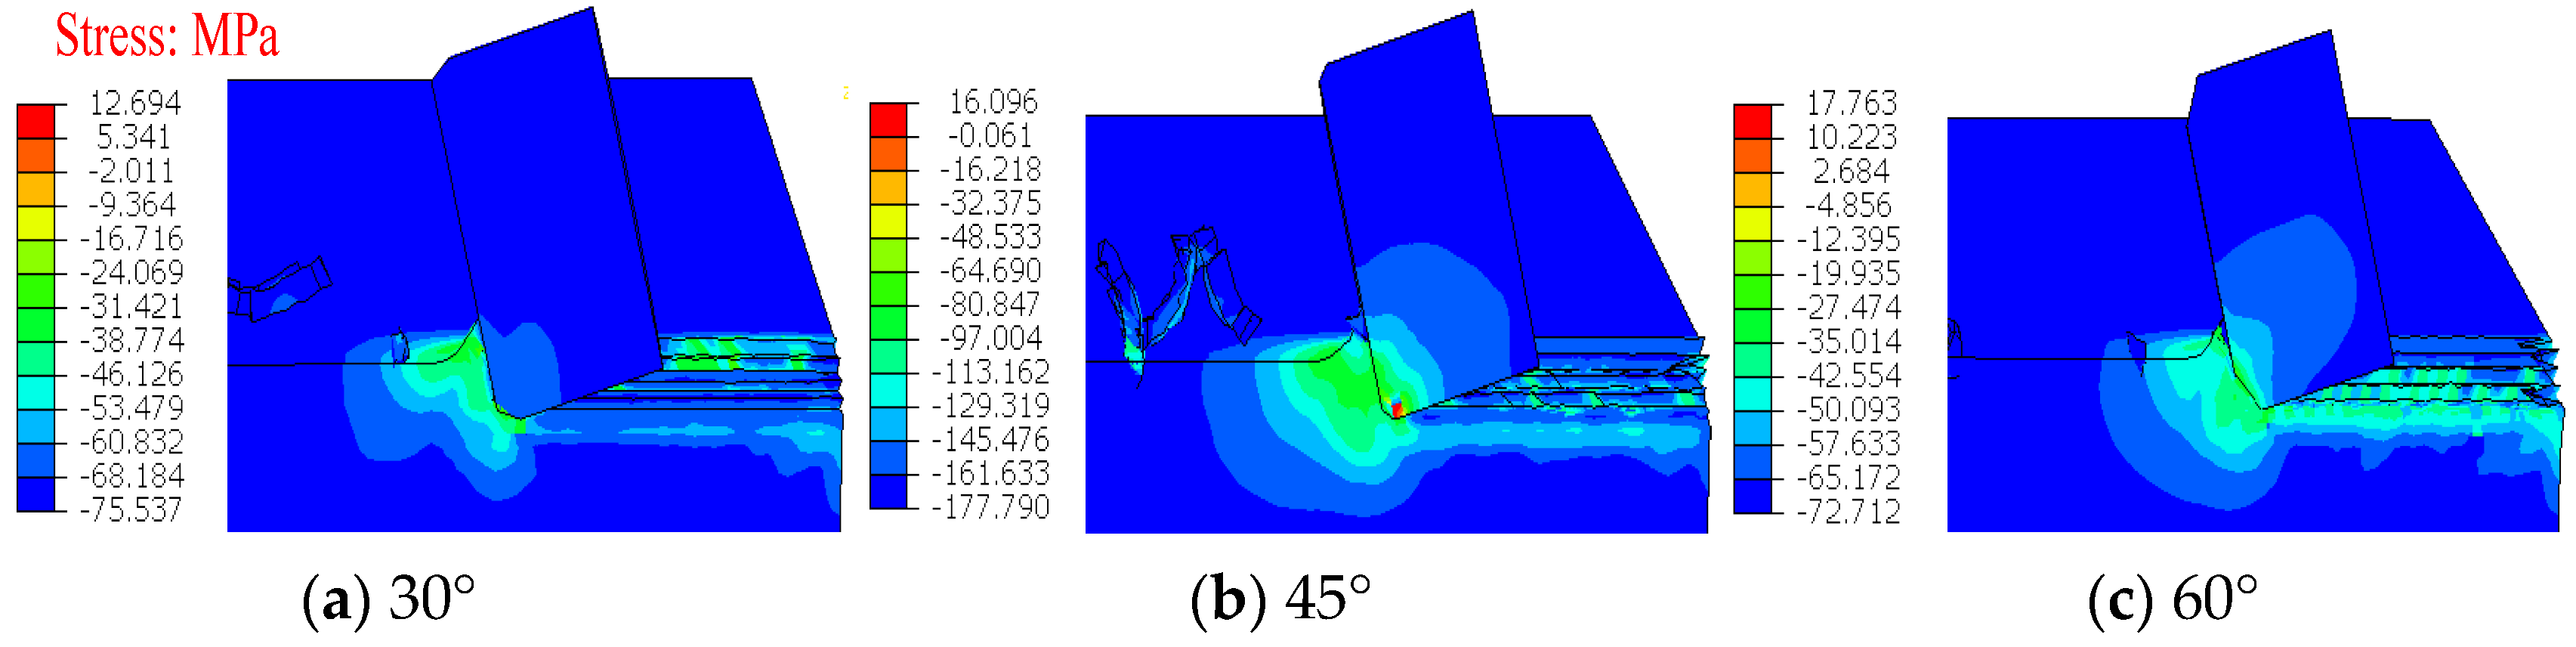
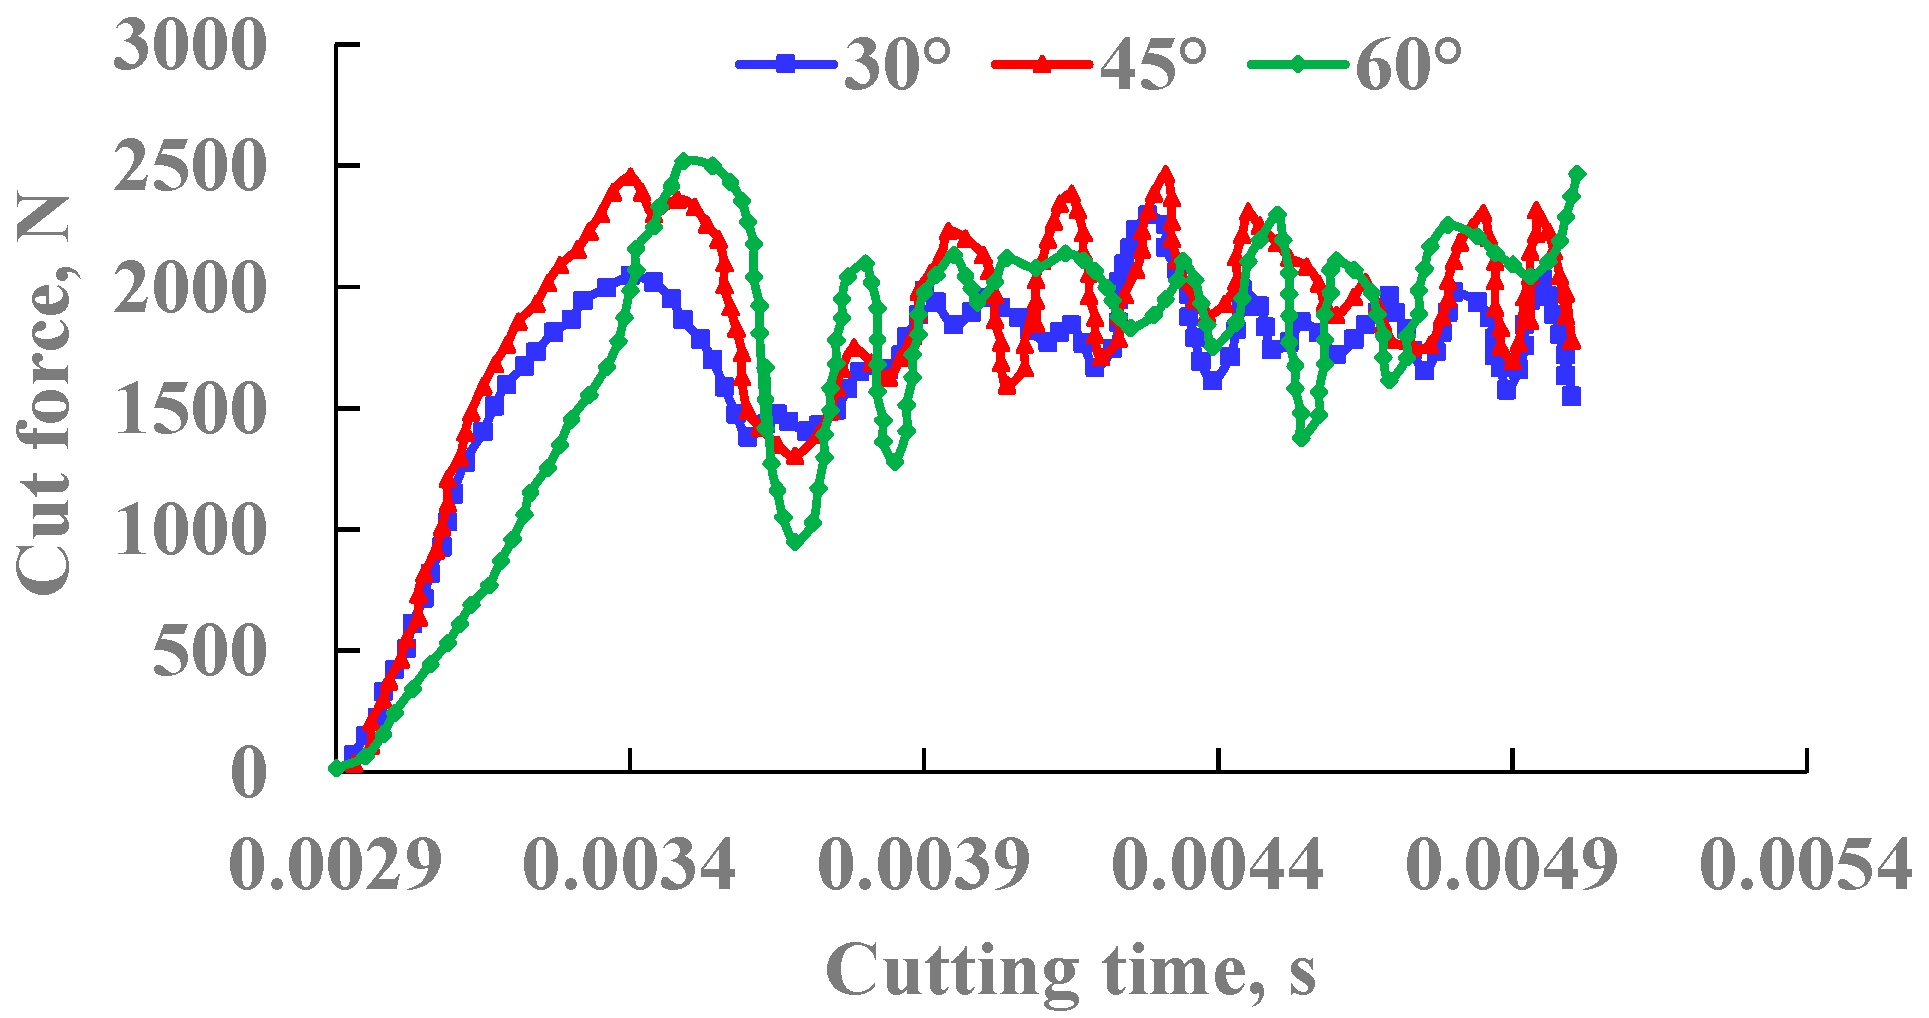
The diameter of the PDC cutting tooth is 13.44 mm. The rake angle of the tooth is 15°. The cutting depth is 2 mm. On the basis of the original 45° chamfer, the chamfer size is changed to 30°and 60°, respectively, and the length of the adjacent right-angle side of the chamfer is 1 mm. It shows that the Mises stress gradually increases with the increase in chamfering, and the deformation in the rock also increases in Figure 15. The cutting force increases when the chamfer angle of the PDC teeth increases with the increase in the diameter of the cutting teeth in Figure 16. It shows that the passivation of the cutting edge will inevitably directly lead to an increase in the cutting load. The greater the degree of chamfering, the more obvious this passivation effect will be, and the more obvious the increase in cutting load.
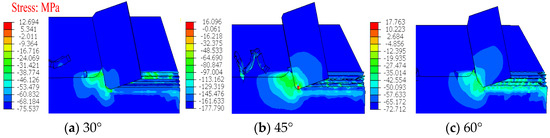
Figure 15.
Mises stress field under different chamfers.
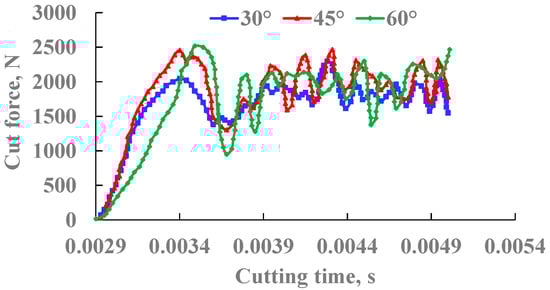
Figure 16.
Variation of cutting force at different chamfers.
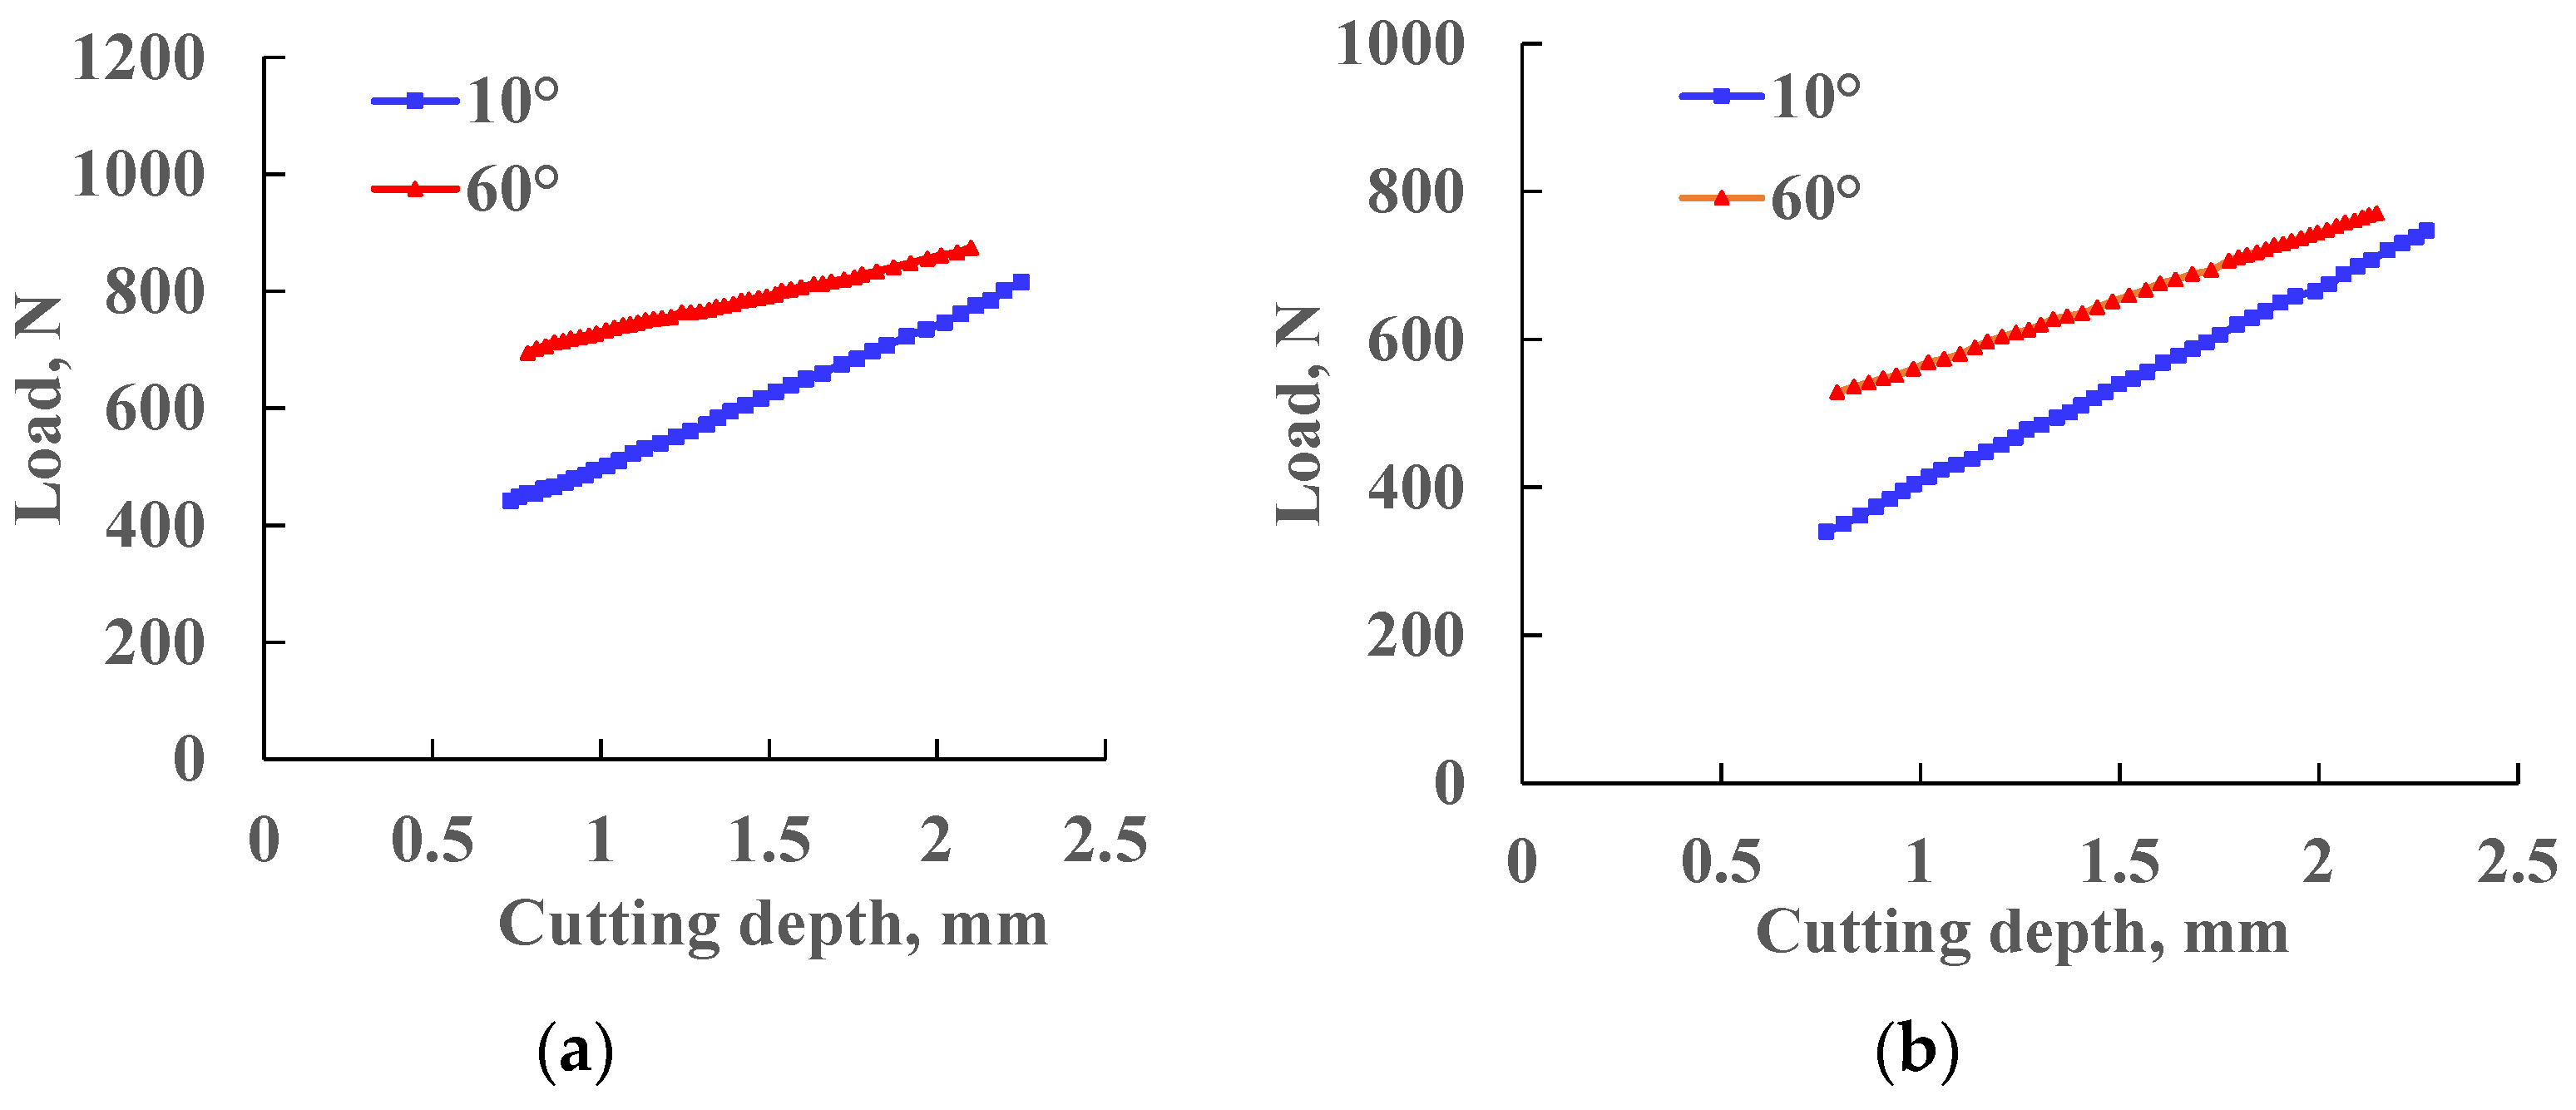
When cutting red sandstone with a rake angle of 20° and a diameter of 19.05 mm, the chamfer of the tooth increases the axial load, and the tangential load increases, as shown in Figure 17.

Figure 17.
Variation of axial load and tangential load with chamfered structure. (a) Axial load variation law; (b) tangential load variation law.
Figure 18 is the pressure distribution contour, and the change in the total energy of the system is shown in Figure 19. Obviously, the contact pressure on the teeth does not increase gradually when the chamfer increases, but it increases first and then decreases. The total energy of the system is increasing, and the total energy of the system is the largest when cutting at 45°, which coincides with the maximum contact pressure on the teeth at this time. At the same time, it also shows that the impact resistance of the PDC teeth is the strongest when chamfered at 45°.
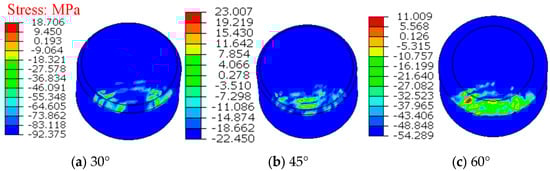
Figure 18.
Pressure distribution on the teeth under different chamfers.
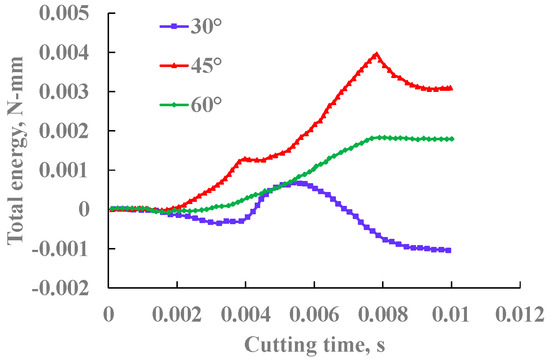
Figure 19.
Changes in the total energy of the system at different chamfers.
In addition, the simulation results of different chamfering angles are based on the optimization idea, as shown in Table 2, and it is obvious that the cutting of PDC teeth at a 45° chamfer is the most beneficial to improve the rock-breaking efficiency and protect the cutting teeth.
Table 2.
Calculation results for different chamfers.
5. Cutting Force Test and Analysis of PDC Tooth
In order to facilitate the analysis of the problem, the actual cutting process is simplified to a certain extent in the cutting load model, that is, the influence of formation rock-confining pressure, mud chip removal, and the influence of complex movement of the drill bit are not considered. The test experiment of the cutting load of cutting teeth is to study the actual load of the cutting teeth under different conditions, explore the variation law of cutting load with rock property parameters, drill parameters, structure parameters of the cutting tooth, etc., and establish the cutting mechanical model of the PDC bits on this basis.
5.1. Purpose and Content of the Experiment
The test and analysis of the cutting load of PDC teeth is the most important basis for the performance analysis and evaluation technology. The test was carried out on dozens of PDC teeth with different characteristics and three rocks with different properties. Finally, the experimental data were processed and analyzed, and the influence of various rock property parameters, cutting tooth parameters, and cutting tooth working parameters on the cutting load of PDC teeth was summarized.
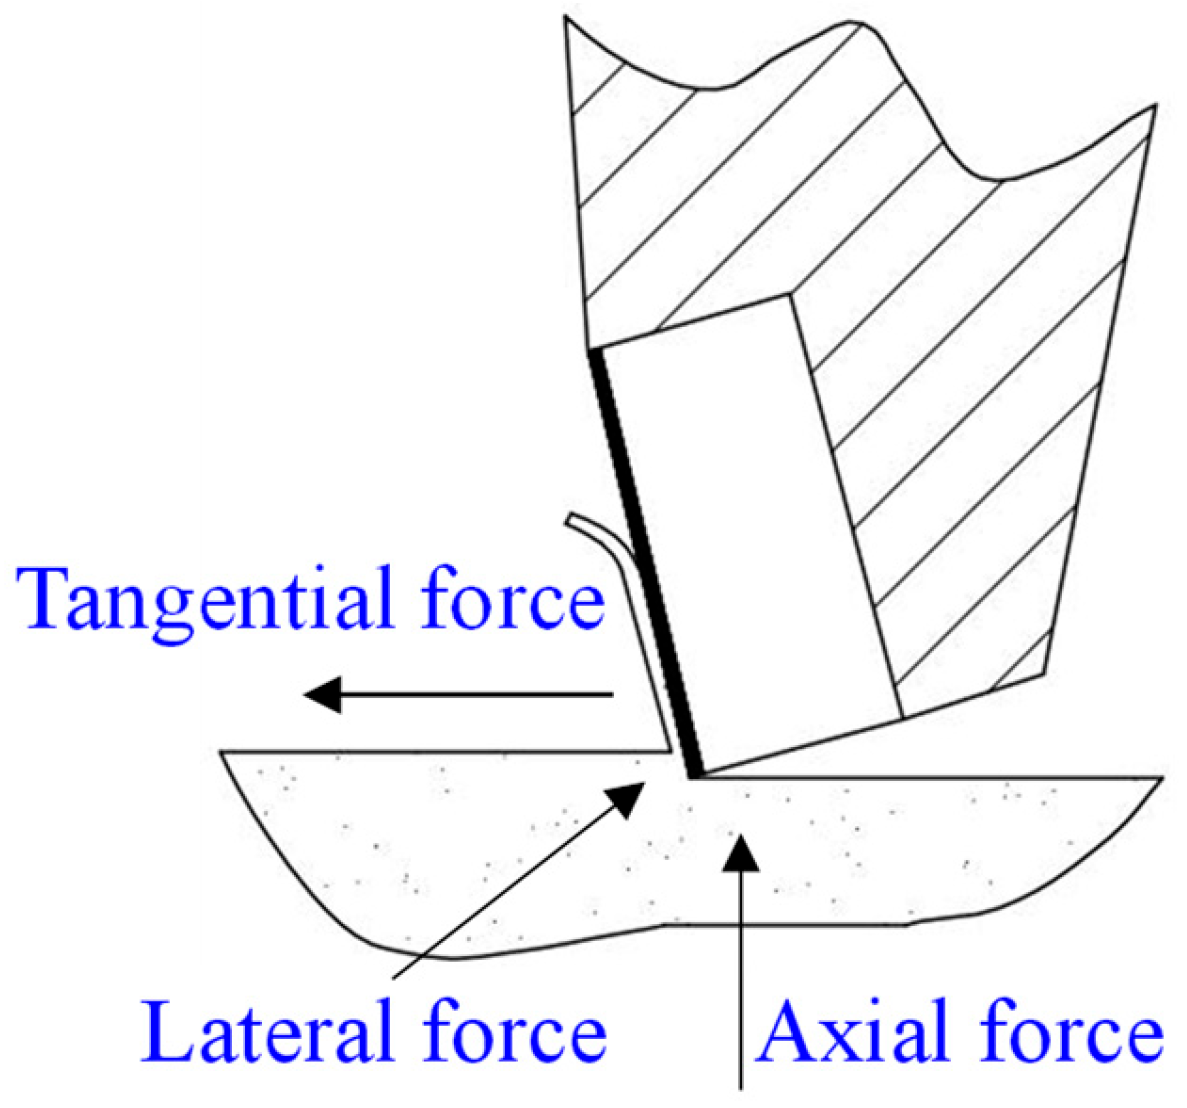
The load exerted on the PDC tooth during the rock-cutting process can be broken down into three components that are orthogonal to each other: axial, scraping, and lateral (as shown in Figure 20).
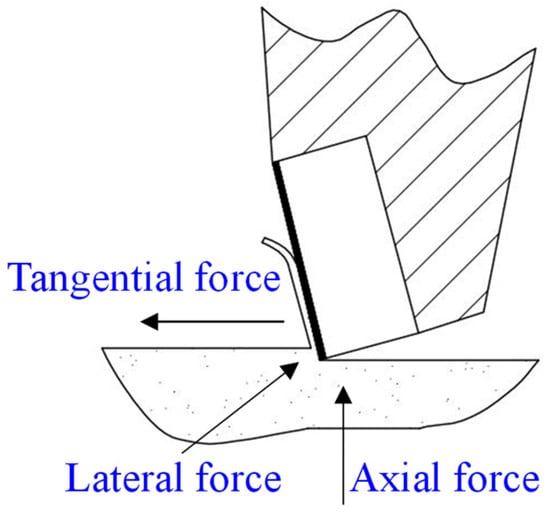
Figure 20.
Schematic diagram of PDC tooth stress.
5.2. Experimental Rock Samples and PDC Cutting Teeth
According to the requirements of the experimental content, PDC composite sheets of various specifications with four diameters, three chamfer structures, and two diamond surface states were selected as the cutting teeth for the experiment. In order to ensure the robustness and stability of the PDC teeth during the cutting experiment, the adapter is specially designed for welding the experimental teeth and facilitating the connection with the sensor. The adapter is equivalent to the body of the drill bit, and there are grooves on it for the socket groove for the inlay welding of the experimental teeth. Similar to the drill-manufacturing process, the experimental tooth is fixed in the groove of the adapter by lead welding. A test tooth and an adapter form a complete test tooth cutting unit.
According to the characteristics of the experimental tooth cutting unit, it can be classified as follows:
(1) The diameters of the experimental teeth are 8 mm, 13.44 mm, 15.875 mm, 19.05 mm;
(2) For the forward inclination angle of the experimental tooth, the experimental tooth is welded to the tooth holder according to different forward inclination angles. There are six levels of caster angle: 5°, 10°, 15°, 20°, 25°, and 30°;
(3) For the chamfering structure of the experimental tooth, the chamfering structure of the experimental tooth includes three types: a conventional chamfer structure, a 45° chamfer, and a 60° chamfer.
5.3. Cutting Load Test Experimental Process
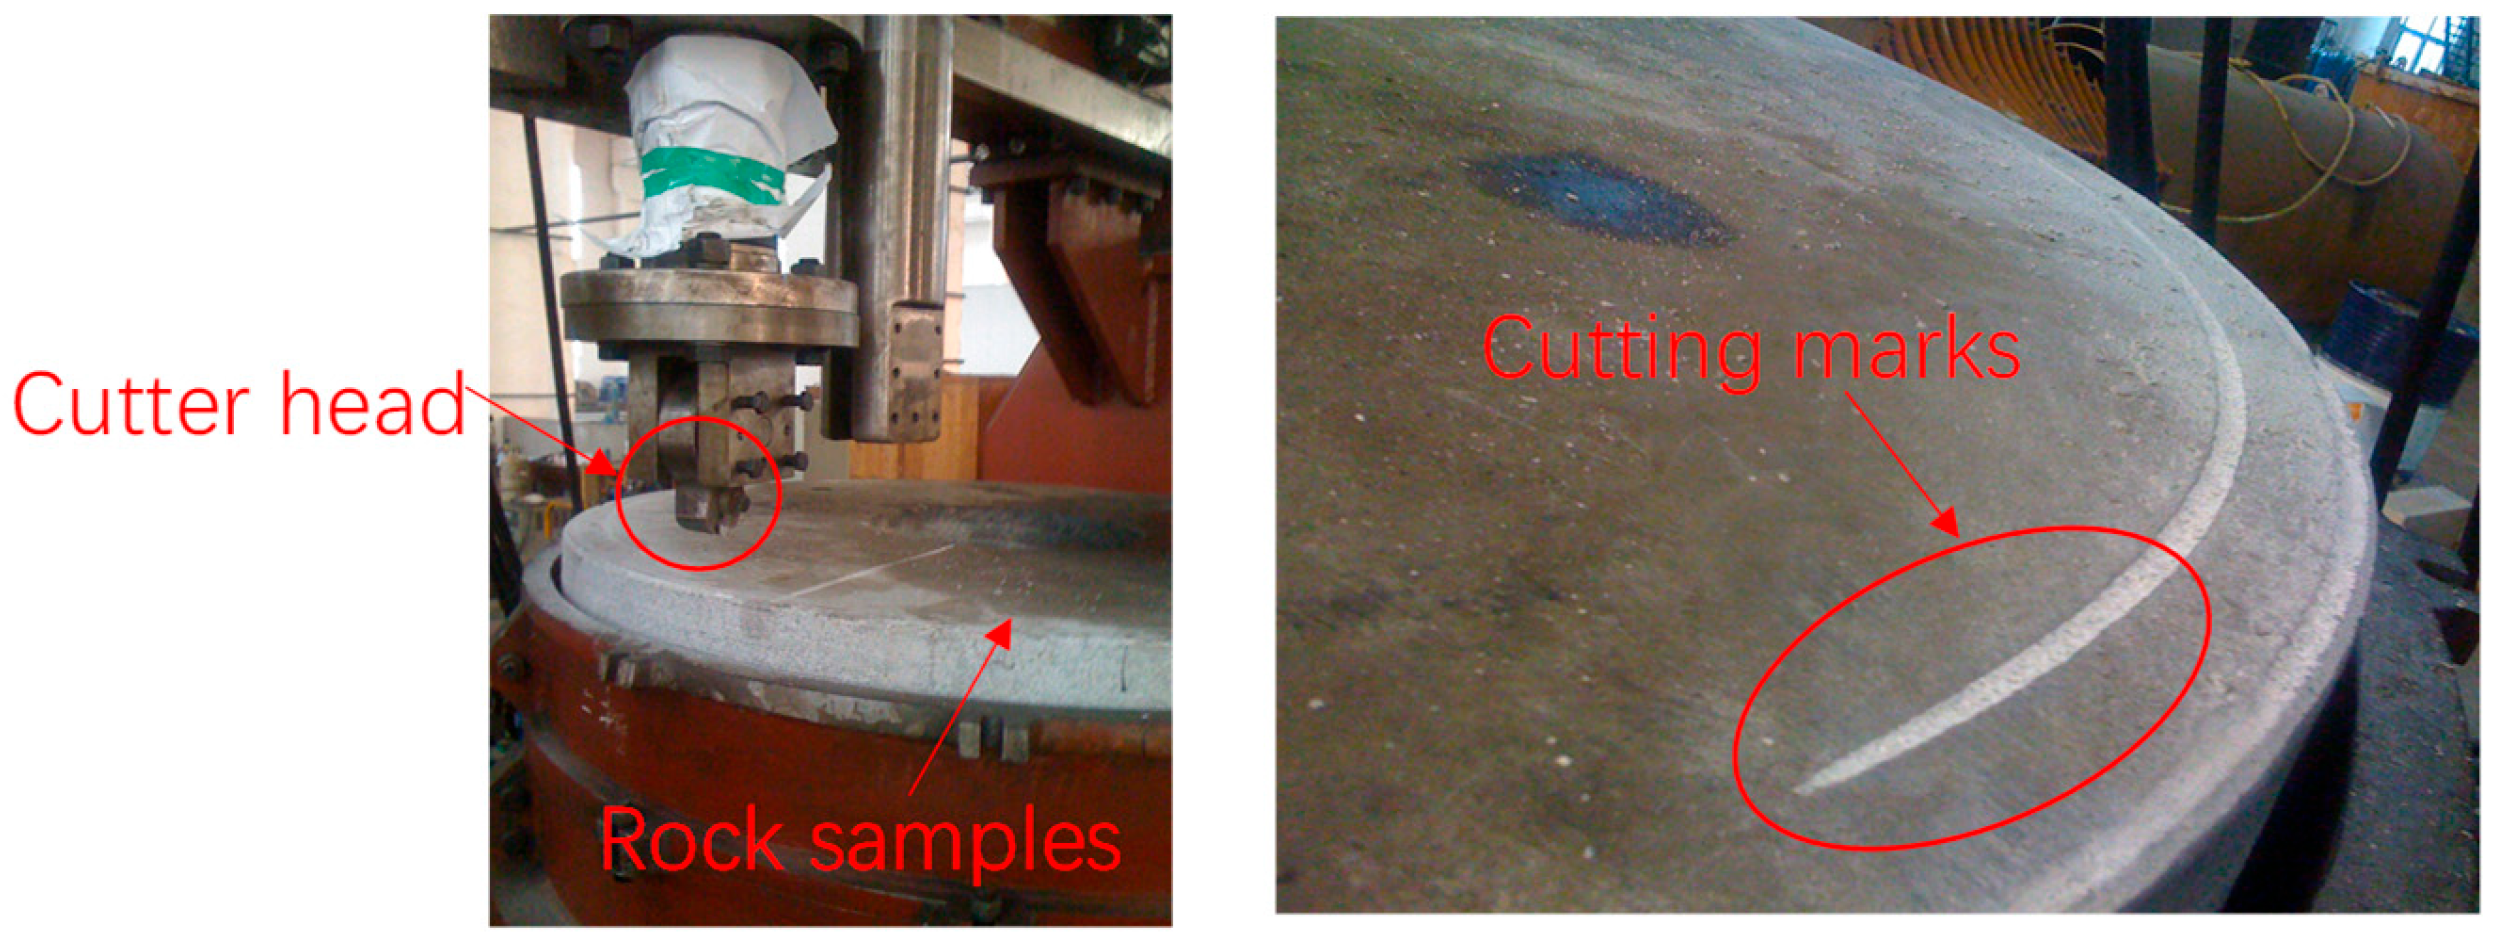
The cutting tooth load test experiment adopts a linear simulation test scheme, and the cutter head holder is equipped with a sensor of the cutting tooth, as shown in Figure 21, which is a PDC composite sheet heavy-duty cutting load test device.

Figure 21.
Experimental setup for PDC tooth cutting tooth load test.
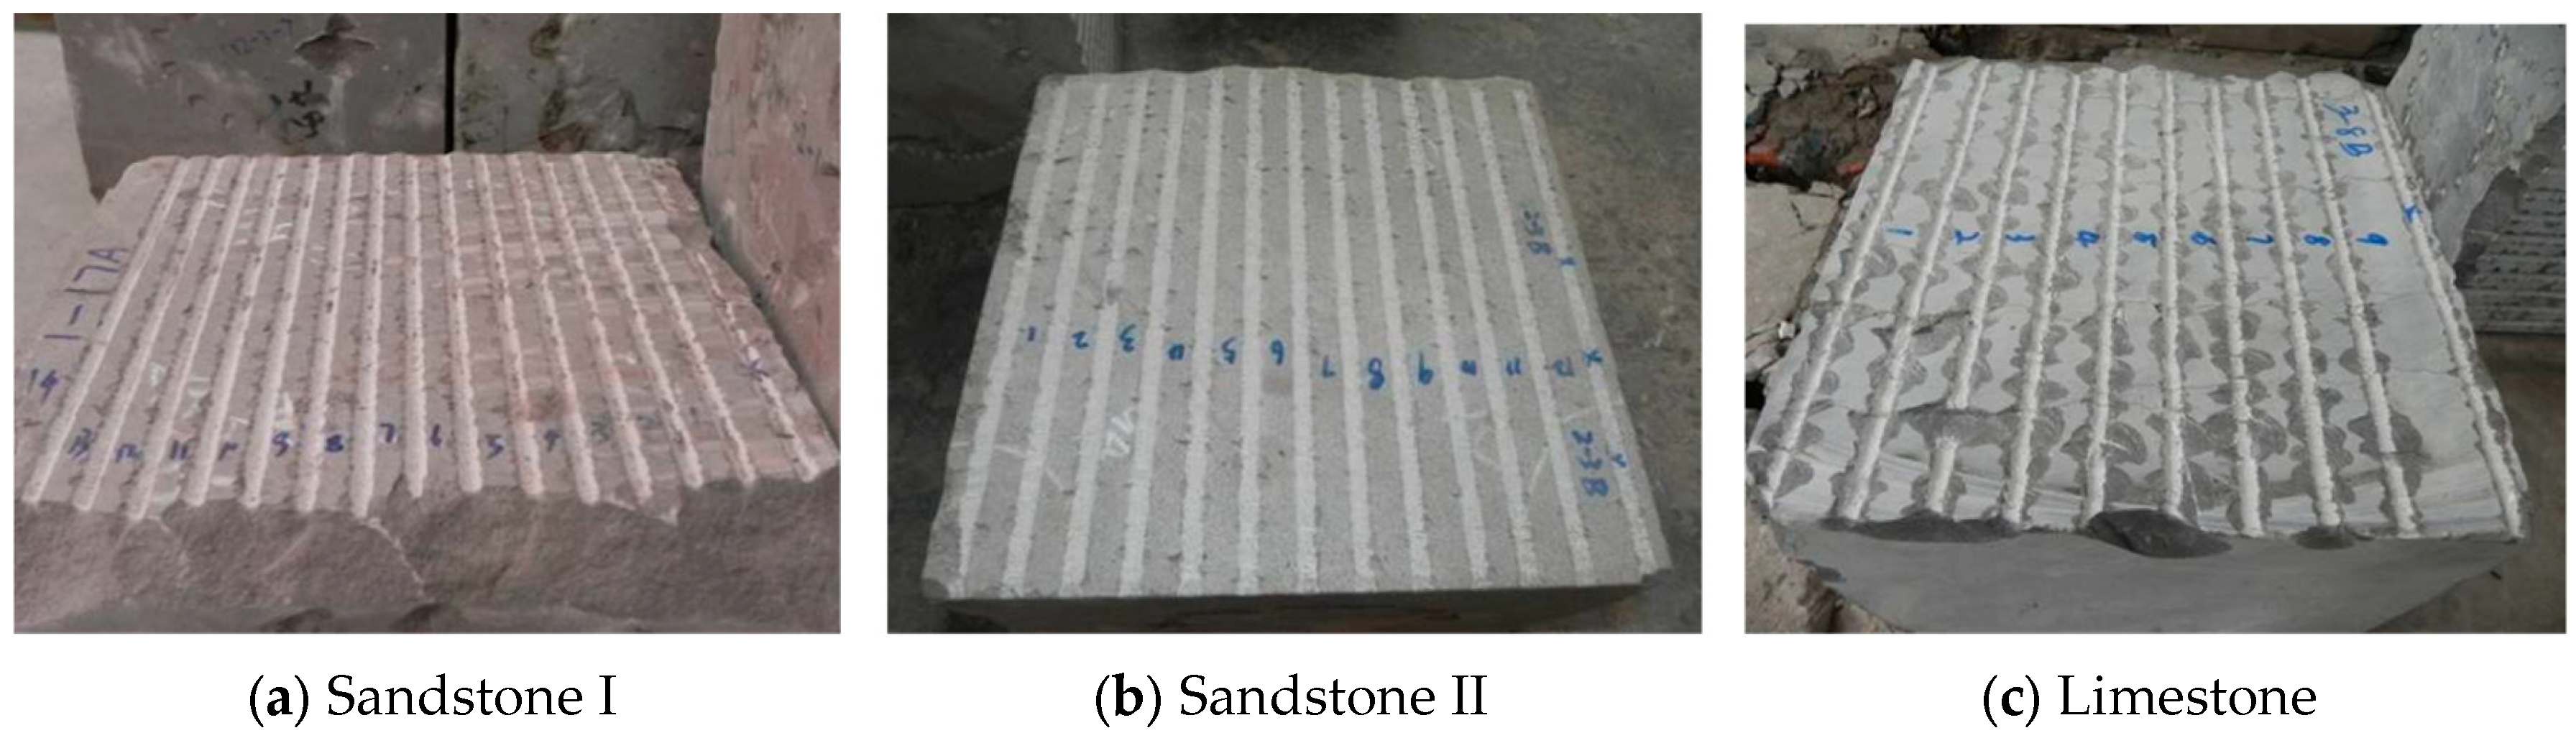
As shown in Figure 22, the pictures of the cutting experiment process and the scraping marks on the rock sample are, respectively, the pictures of the cutting test experiment of the PDC tooth cutting load test.
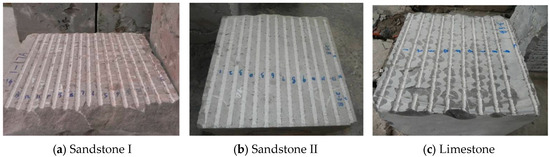
Figure 22.
Scratches on rock samples.
5.4. Experimental Data Processing and Analysis
During the experiment, the experiment was repeated five times under each experimental condition. The experimental data itself has certain statistical laws, and these statistical laws are calculated to further understand the change laws of the data and ensure the reliability of the data. The main statistics of experimental data include the sample mean, sample variance, maximum value, minimum value, etc.
The mean sample values were:
The sample variance is:
Table 3 shows a statistical analysis table of a set of raw data for a 16 mm tooth rake angle of 15°, a roll angle of 0°, a depth of cut of 4.05 mm, and cutting sandstone.
Table 3.
Analysis of some cutting load statistics.
The data from this experiment were carefully processed and analyzed, and useful rules and conclusions were drawn (see the next section). Figure 23 shows some of the curves of the experimental data processing.

Figure 23.
Data processing curve of cutting load of 19 mm tooth part.
5.5. Analysis of the Variation Law of Cutting Load with Cutting Parameters
Through the analysis of the experimental cutting load data, the following rules are obtained.
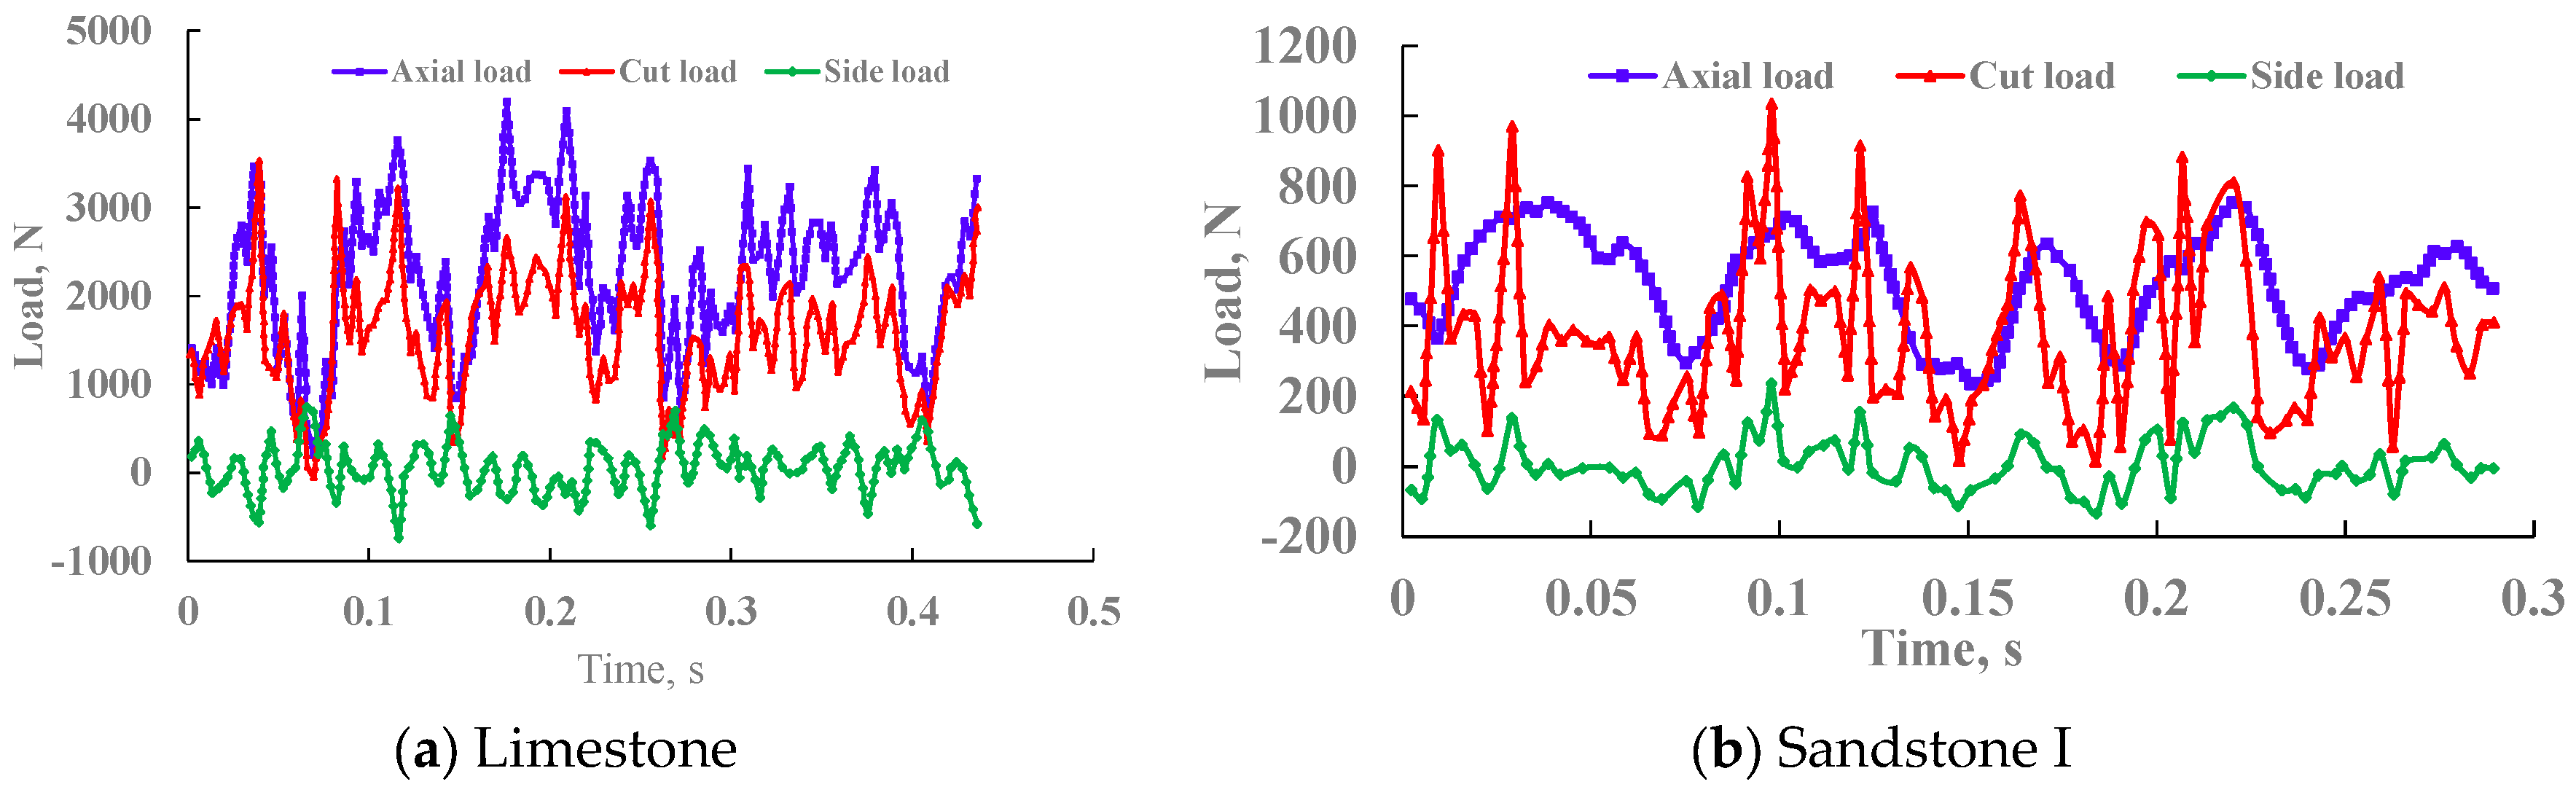
(1) The change of cutting load has a certain periodic type
As shown in Figure 24, the cutting load curves for limestone and sandstone I are shown respectively. It shows that the cutting load of the PDC tooth scrapes the rock to a certain extent. When the brittleness of the rock is different, the process of cutting load is also different. Relatively speaking, the plasticity of sandstone I is higher than that of limestone, and the brittleness of limestone is stronger. Comparing the load curves of Figure 24a,b, it shows that the cutting load increases continuously with the forward movement of the cutting teeth when cutting limestone with good brittleness, and the cutting rock breaks undergo a three-stage cyclical process: extrusion, small crushing, and rupture. However, the situation is different when cutting the more plastic sandstone I. During the cutting process, the cutting load gradually and smoothly rises to the maximum value (especially the axial load, Figure 24b), and the cutting load quickly decreases to the minimum value after the shear slip occurs. Then, the next cycle begins. Observing the curve of Figure 24b, it shows that there are still small fluctuations in the process of rising cutting load (such as tangential load) before reaching the maximum load when scraping sandstone I with relatively good plasticity, indicating that there is brittle volume fragmentation of small shear during the cutting process, which is caused by the degree of brittleness of the rock.

Figure 24.
Cutting load curves of limestone and sandstone.
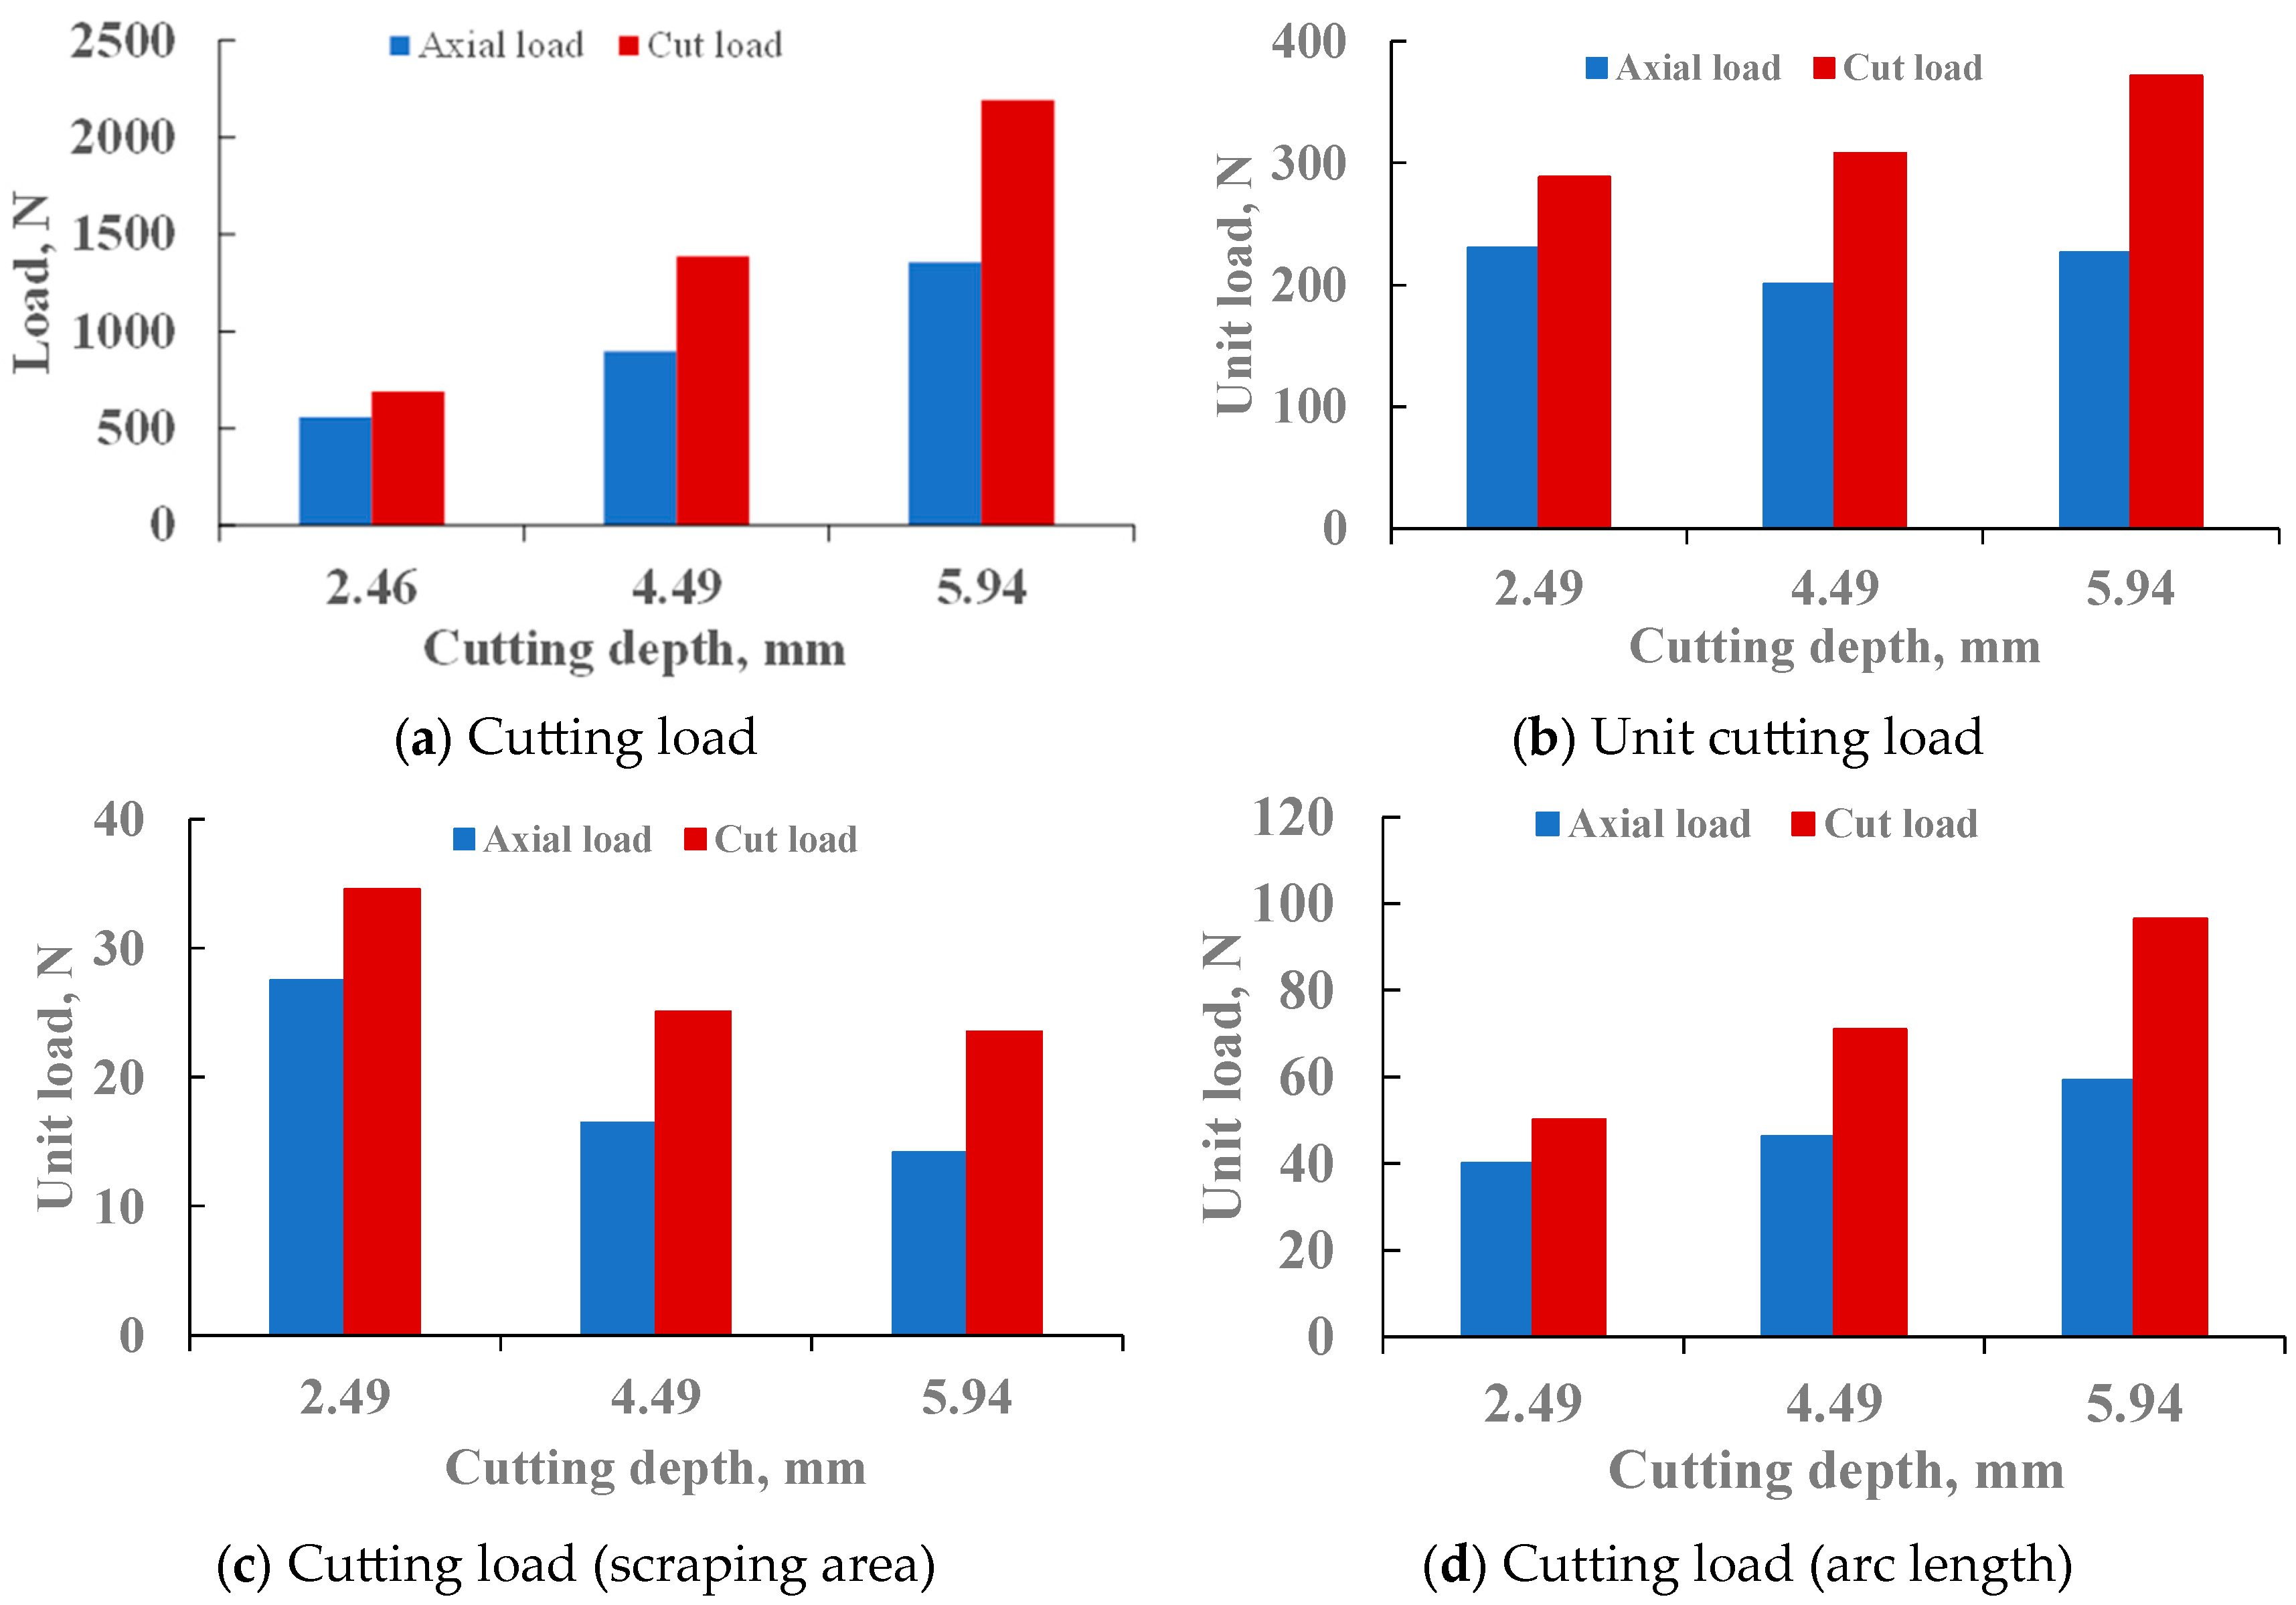
(2) The relationship between the cutting load and the scraping area
Figure 25 is the load change curve when the cutting load changes with the scraping area, and it is found that the cutting axial load and tangential load have a linear relationship with the scraping area. That is:
where F is the axial load or tangential load, as is the depth of cut, and the value of K1 is different when calculating the axial load and tangential load. K1 is a constant determined by parameters such as rock properties, cutting working angle, and bottom hole pressure.

Figure 25.
Curve of cutting load as a function of scraping area.
(3) The relationship between cutting load and cutting depth
Figure 26 is the load variation curve when the cutting load changes with the scraping depth. Through the analysis of the influence law of the cutting axial load and tangential load with the cutting depth when the cutting teeth of different structures cut sandstone I, sandstone and limestone, it is considered that, within the range of the cutting depth determined by the test, the cutting axial load and tangential load are related to the cutting depth as a power function. That is:
where F is the axial load or tangential load, dp is the depth of cut, K3 is the magnitude of the axial load or tangential load when the depth of cut is 1 mm, and the value of K3 is different when calculating the axial load and tangential load.
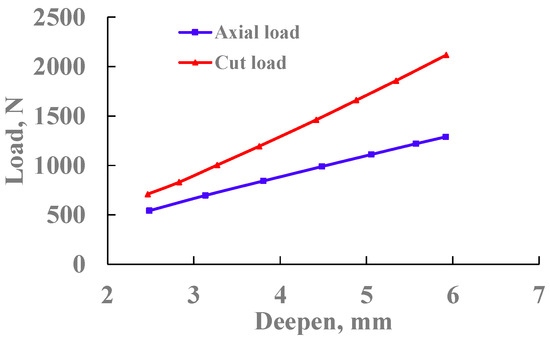
Figure 26.
Variation curve of cutting load with depth (19 mm teeth).
(4) The relationship between the cutting load and the tooth diameter
Shown in Figure 27a–c are the variation curves of cutting load per unit area when 8 mm, 13.44 mm, 16 mm, and 19 mm PDC teeth cut sandstone I, sandstone II, and limestone, respectively. The analysis of the curve shows that the relationship between the diameter of the PDC tooth and the specific load is very complex, and its law changes when the rock properties are different. For example, when cutting sandstone I, the cutting load (axial and tangential) of the 13.44 mm tooth is the smallest, while the cutting load (axial and tangential) of the 19 mm tooth is the largest (Figure 27a). However, when the rock is changed to sandstone and limestone, this phenomenon no longer exists, and the change in the specific load curve shows a very different pattern (Figure 27b,c).
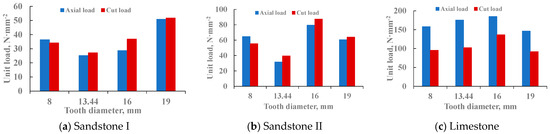
Figure 27.
Variation curve of cutting load with cutting tooth diameter.
(5) The relationship between the cutting load and the rake angle
The experimental data were analyzed, and the law was obtained. The axial load and tangential load had an exponential relationship with the forward inclination angle of the cutting teeth:
Among them, K5 is the cutting load when the rake angle α is zero, and K5 is a constant determined by the rock properties, cutting tooth parameters, bottom hole pressure, and other parameters.
(6) The relationship between cutting load and roll angle
Through the analysis of the cutting load during the cutting of sandstone I, sandstone, and limestone, when the cutting angle of different diameters of cutting teeth changes the roll angle, it is concluded that, in the experimental process, when the roll angle β is less than the critical roll angle β′, that is, when the β < β′, the axial and tangential loads are less affected by the roll angle. When the roll angle is large, the cutting load increases slightly, but the influence trend is small.
Table 4 shows the values of the critical roll angle β′ under different rake angles for α obtained through experimental observations.
Table 4.
Values of the critical roll angle β′ under different rake angles for α.
As shown in Figure 28, the variation curves of cutting load per unit area of 8 mm, 13.44 mm, and 16 mm teeth are, respectively, when the roll angle changes at different rake angles. Observing the curves in the figure, the variation trend of the cutting load with the roll angle reflects the above analysis conclusions.
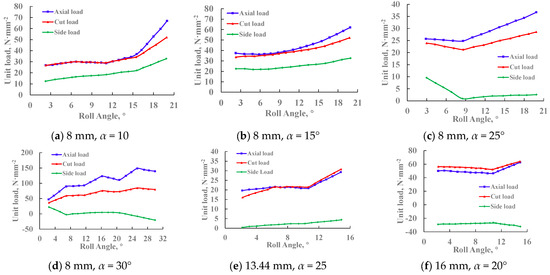
Figure 28.
Variation of cutting load with roll angle.
When the roll angle β does not exceed the critical roll angle β′, the flank of the cutting tooth is not in contact with the rock, the cutting load change affected by the tooth flank can be ignored, and the change in roll angle has little effect on the cutting load. When the roll angle β exceeds the critical roll angle β′. The axial load increases sharply when the cutting tooth flank is in contact with the rock because the drilling pressure is concentrated on the flank of the tooth, and the tangential load and radial load also increase due to the friction between the flank of the tooth and the rock. It shows that the appropriate small roll angle is not only conducive to chip removal in the actual design process of a PDC drill bit but is also conducive to preventing lateral vibration and will not have too much impact on the cutting load. However, the roll angle should not be too large. Otherwise, it will not only cause early wear of the tooth flank but also make the diamond composite wear too fast or have early fracture failure, as well as also increase the drilling pressure and torque and reduce the drilling efficiency.
6. Discussion and Conclusions
6.1. Discussion
Throughout the entire article, the scheduled research work has been completed, and many new issues have been discovered during the research process, which require further in-depth research in the future. These mainly include the following:
(1) The force of a single cutter is only simulated and analyzed in this paper, so the next step is to consider the cutting process analysis of multiple teeth or even the whole PDC bit. At the same time, the influence of mud, temperature, friction, and other factors on the force of the cutter can also be analyzed;
(2) In the simulation analysis process, this article did not consider the residual stress caused by different materials between the PDC and the WC bottom layer, but instead considered them as a whole. In addition, during the actual cutting process of each tooth on the PDC drill bit, the cutting cross-section is not a regular, approximate, and semi-circular plane but a polygonal cross-section usually composed of curves;
(3) The experimental study of rock properties is carried out under normal pressure, so the constitutive relationship of rock obtained from the experiment does not consider the influence of the confining pressure at the bottom of the hole. The next step is to carry out the experimental study of rock under different confining pressures;
(4) In the simulation process, the cutting section is not made into a polygon but is instead replaced by an approximate semicircular plane, which has a certain error in the actual cutting process.
6.2. Conclusions
The simulation process changes the different structural and mechanical parameters of the cutting teeth and completes the cutting tooth load test. The following main understandings and conclusions are obtained:
(1) As the rake angle of the PDC teeth increases, the stress during the cutting process first increases and then decreases. The cutting force and total energy required for rock failure first decrease and then increase, which is consistent with the basic characteristics of plastic–brittle materials and the experimental phenomena;
(2) As the chamfer of the PDC cutting teeth increases, the cutting force, Mises stress, and total system energy gradually increase, while the contact pressure on the teeth first increases and then decreases. The maximum cutting force corresponding to the rake angle of the tooth is 2430.85 N when the tooth rake angle is 15°. The maximum cutting force corresponding to the tooth with the rake angle of 20° is 2408.09 N;
(3) It shows that the change amplitude of the contact area is the smallest when the tooth rake angle is 20°, and the contact area is also smaller. So, the cutting is more conducive to the cutting tooth eating into the formation and prolonging the service life of the cutting tooth when the tooth rake angle is 20°;
(4) Because small-diameter teeth have a higher cutting edge curvature than large-diameter teeth, they can form higher contact stresses in the contact area of rocks. Therefore, the pressure of small diameter teeth is more likely to cause deformation and failure in rocks. Furthermore, based on optimization considerations, cutting sandstone I with 19.05 mm teeth is most advantageous for improving the rock-breaking efficiency and protecting PDC cutting teeth;
(5) The contact pressure on the teeth does not increase gradually when the chamfer increases, but increases first and then decreases. The total energy of the system is increasing, and the total energy of the system is the largest when cutting at 45°, which coincides with the maximum contact pressure on the teeth at this time. At the same time, it also shows that the impact resistance of PDC teeth is the strongest when chamfered at 45°;
(6) When the roll angle is β and does not exceed the critical roll angle β′, the change in inclination angle has little effect on the cutting load. The axial load increases sharply due to the concentration of drilling pressure on the tooth side when the roll angle β does not exceed the critical roll angle β′, and the cutting tooth side comes into contact with the rock. At the same time, due to the friction between the tooth side and the rock, the tangential and radial loads also increase accordingly.
Author Contributions
Conceptualization, Z.W. and C.W.; methodology, C.W.; software, Z.W.; validation, Z.W., C.W. and S.F.; formal analysis, Z.W.; investigation, Z.Z. and N.L.; resources, N.L. and S.F.; data curation, Z.Z. and C.W.; writing—original draft preparation, Z.W.; writing—review and editing, Y.F., Z.Z. and Z.W.; visualization, C.W.; supervision, S.F.; project administration, Z.Z. and Y.F.; funding acquisition, Z.W. All authors have read and agreed to the published version of the manuscript.
Funding
This research was funded by the Tianchi Talent Project of PetroChina Tarim Oilfield Company, grant number TC2023102.
Data Availability Statement
The original contributions presented in this study are included in the article. Further inquiries can be directed to the corresponding author.
Conflicts of Interest
The authors Zhe Wang, Chunsheng Wang, Shaobo Feng, Ning Li, Zhi Zhang and Yuguang Fan are employed by PetroChina Tarim Oilfield Company, R&D Center for Ultra Deep Complex Reservior Exploration and Development, CNPC and Engineering Research Center for Ultra-deep Complex Reservoir Exploration and Development, the authors declare no conflicts of interest.
References
- Huang, X.; Xu, T.; Liu, Y. Experimental and thermal-structure coupling analysis for oil and water-swellable packer. Energy Sci. Eng. 2023, 11, 3055–3069. [Google Scholar] [CrossRef]
- Liu, W.; Deng, H.; Zhu, X.; Deng, K. The PDC cutter-rock interaction behavior in rock cutting: A review. Geoenergy Sci. Eng. 2023, 229, 212168. [Google Scholar] [CrossRef]
- Liu, Y.; Lian, Z.; Zou, J.; Deng, C.; He, Y. Fracture failure analysis and research on thread joint of drive shaft shell of positive displacement motor. Eng. Fail. Anal. 2020, 118, 104805. [Google Scholar] [CrossRef]
- Ma, Y.; Tao, L.; Rong, Z.; Tang, K.; Huang, Z.; Ke, C.; Wang, G. Research on expression method of PDC bit wear uncertainty and influence of lateral force. Geoenergy Sci. Eng. 2023, 225, 211700. [Google Scholar] [CrossRef]
- Huang, Z.; Li, Q.; Zhou, Y.; Jing, S.; Ma, Y.; Hu, W.; Fan, Y. Experimental research on the surface strengthening technology of roller cone bit bearing based on the failure analysis. Int. J. Rock Mech. Min. Sci. 2018, 105, 11–21. [Google Scholar] [CrossRef]
- Miyazaki, K.; Ohno, T.; Karasawa, H.; Imaizumi, H. Performance of polycrystalline diamond compact bit based on laboratory tests assuming geothermal well drilling. Geothermics 2019, 80, 185–194. [Google Scholar] [CrossRef]
- Dumoulin, S.; Kane, A.; Coudert, T.; Morin, N.; Gerbaud, L.; Velmurugan, N.; Jahangir, E.; Sellami, H.; Latham, J.-P.; Naderi, S.; et al. Three-dimensional numerical study of DTH bit-rock interaction with HPWJ downhole slotting: Influence of bit design and bottom hole geometric conditions on rock breaking efficiency in percussive drilling. Rock Mech. Bull. 2025, 4, 100169. [Google Scholar] [CrossRef]
- Hu, H.; Guan, Z.; Zhang, B.; Xu, Y.; Liu, Y.; Wang, B. Structure design of weight-on-bit self-adjusting PDC bit based on stress field analysis and experiment evaluation. J. Pet. Sci. Eng. 2021, 196, 107692. [Google Scholar] [CrossRef]
- Zhang, Z.; Zhao, D.; Zhao, Y.; Zhou, Y.; Tang, Q.; Han, J. Simulation and experimental study on temperature and stress field of full-sized PDC bits in rock breaking process. J. Pet. Sci. Eng. 2020, 186, 106679. [Google Scholar] [CrossRef]
- Yang, Y.; Yang, Y.-X.; Ren, H.-T.; Qi, Q.-L.; Huang, Z.-Q.; Zhou, C.-X. Experimental study on motion and mechanical characteristics of the vertical wheel in the rock-breaking process. Pet. Sci. 2023, 20, 495–506. [Google Scholar] [CrossRef]
- Cirimello, P.; Otegui, J.; Sanchez, J.M.; Carfi, G. Oil well drill bit failure during pull out: Redesign to reduce its consequences. Eng. Fail. Anal. 2018, 83, 75–87. [Google Scholar] [CrossRef]
- Stoxreiter, T.; Portwood, G.; Gerbaud, L.; Seibel, O.; Essl, S.; Plank, J.; Hofstätter, H. Full-scale experimental investigation of the performance of a jet-assisted rotary drilling system in crystalline rock. Int. J. Rock Mech. Min. Sci. 2019, 115, 87–98. [Google Scholar] [CrossRef]
- He, W.; Zhang, R.; Liu, L.; Chen, Z.; Shi, H.; Huang, Z.; Xiong, C.; Li, X.; Sun, J.; Hu, C. Numerical simulation of rock-breaking mechanisms by triple-ridged PDC cutter in hard rocks. Geoenergy Sci. Eng. 2023, 229, 212148. [Google Scholar] [CrossRef]
- Al-Sudani, J.A. Real-time monitoring of mechanical specific energy and bit wear using control engineering systems. J. Pet. Sci. Eng. 2017, 149, 171–182. [Google Scholar] [CrossRef]
- Shao, F.; Liu, W.; Gao, D. Effects of the chamfer and materials on performance of PDC cutters. J. Pet. Sci. Eng. 2021, 205, 108887. [Google Scholar] [CrossRef]
- Zhang, D.; Yang, Y.; Ren, H.; Niu, S. Failure resistance research of the dual-stage hybrid bit. Eng. Fail. Anal. 2023, 145, 107009. [Google Scholar] [CrossRef]
- Lin, W.; Chávez, J.P.; Liu, Y.; Yang, Y.; Kuang, Y. Stick-slip suppression and speed tuning for a drill-string system via proportional-derivative control. Appl. Math. Model. 2020, 82, 487–502. [Google Scholar] [CrossRef]
- Niu, S.; Li, Y.; Xie, B.; Yang, Y.; Li, G.; Huang, K. Unit experimental and numerical simulation study on rock breaking mechanism of disc-like hybrid bit. Geoenergy Sci. Eng. 2023, 228, 212006. [Google Scholar] [CrossRef]
- Huang, K.; Yang, Y.; Liu, Y.; Niu, Q. Vibration failure and anti-vibration analysis of an annular-grooved PDC bit. Eng. Fail. Anal. 2020, 115, 104658. [Google Scholar] [CrossRef]
- Barnett, L.; Al Dushaishi, M.F.; Khan, M.F.M.H. Experimental investigation of drillstring torsional vibration effect on rate of penetration with PDC bits in hard rock. Geothermics 2022, 103, 102410. [Google Scholar] [CrossRef]
- Zhang, C.L.; Yang, Y.X.; Qi, Q.L.; Ren, H.T.; Wang, J.C. Research on numerical drilling technology of mesh-like cutting PDC bit. Energy Rep. 2021, 7, 2068–2080. [Google Scholar] [CrossRef]
- Li, Y.; Chen, Z.; Ye, Y.; Yang, Y. Combined finite-discrete element method for modeling the interaction between single PDC cutter and brittle rock. J. Pet. Sci. Eng. 2021, 207, 109133. [Google Scholar] [CrossRef]
- Panayirci, H.M. An experimental study on steering response of PDC drill bits. J. Pet. Sci. Eng. 2022, 208, 109440. [Google Scholar] [CrossRef]
- de Moura, J.; Xiao, Y.; Yang, J.; Butt, S.D. An empirical model for the drilling performance prediction for roll-er-cone drill bits. J. Pet. Sci. Eng. 2021, 204, 108791. [Google Scholar] [CrossRef]
- Zhang, C.; Wang, J.; Ke, X.; Yang, Y.; Ren, H.; Niu, S.; Cai, C. Rock-breaking performance analysis of worn polycrystalline diamond compact bit. Geoenergy Sci. Eng. 2023, 221, 211352. [Google Scholar] [CrossRef]
- Song, D.; Ren, Z.; Yang, Y.; Ren, H. Research on cutter surface shapes and rock breaking efficiency under high well temperature. Geoenergy Sci. Eng. 2023, 222, 211422. [Google Scholar] [CrossRef]
- Cai, C.; Kang, Y.; Yang, Y.; Wang, X.; Li, Y.; Huang, M.; Wu, J. The effect of shale bedding on supercritical CO2 jet fracturing: A experimental study. J. Pet. Sci. Eng. 2020, 195, 107798. [Google Scholar] [CrossRef]
- Yang, Y.; Yang, Y.; Ren, H.; Qi, Q.; Chen, X. Research on the working mechanism of the PDC drill bit in compound drilling. J. Pet. Sci. Eng. 2020, 185, 106647. [Google Scholar] [CrossRef]
- Yang, Y.; Yang, Y.; Liu, X.; Huang, K.; Ren, H. Optimized design and application of a directional reaming-while-drilling polycrystalline diamond compact bit. Eng. Fail. Anal. 2019, 105, 699–707. [Google Scholar] [CrossRef]
- Mostafa, G.; Behzad, E. Real time prediction and detection of drilling bit issues during drilling with the focus on bit status evaluation using along string measurement (ASM). Geoenergy Sci. Eng. 2023, 224, 211612. [Google Scholar]
- Moazzeni, A.R.; Khamehchi, E. Rain optimization algorithm (ROA): A new metaheuristic method for drilling opti-mization solutions. J. Pet. Sci. Eng. 2020, 195, 107512. [Google Scholar] [CrossRef]
- Elkatatny, S. Real-time prediction of rate of penetration while drilling complex lithologies using artificial intelligence techniques. Ain Shams Eng. J. 2021, 12, 917–926. [Google Scholar] [CrossRef]
- Boukredera, F.S.; Youcefi, M.R.; Hadjadj, A.; Ezenkwu, C.P.; Vaziri, V.; Aphale, S.S. Enhancing the drilling efficiency through the appli-cation of machine learning and optimization algorithm. Eng. Appl. Artif. Intell. 2023, 126, 107035. [Google Scholar] [CrossRef]
- Afebu, K.O.; Liu, Y.; Papatheou, E. Feature-based intelligent models for optimisation of percussive drilling. Neural Netw. 2022, 148, 266–284. [Google Scholar] [CrossRef]
- Dougherty, P.S.; Mpagazehe, J.; Shelton, J.; Iii, C.F.H. Elucidating PDC rock cutting behavior in dry and aqueous conditions using tribometry. J. Pet. Sci. Eng. 2015, 133, 529–542. [Google Scholar] [CrossRef]
- Kamel, J.M.; Yigit, A.S. Modeling and analysis of stick-slip and bit bounce in oil well drillstrings equipped with drag bits. J. Sound Vib. 2014, 333, 6885–6899. [Google Scholar] [CrossRef]
- Khoshouei, M.; Bagherpour, R. Measurement, prediction, and modeling of the drilling specific energy by soft rock properties during the drilling operation. Measurement 2023, 222, 113679. [Google Scholar] [CrossRef]
- Mazen, A.Z.; Mujtaba, I.M.; Hassanpour, A.; Rahmanian, N. Mathematical modelling of performance and wear prediction of PDC drill bits: Impact of bit profile, bit hydraulic, and rock strength. J. Pet. Sci. Eng. 2020, 188, 106849. [Google Scholar] [CrossRef]
- Iwata, K.; Osakada, K.; Terasaka, T. Process Modeling of Orthogonal Cutting by the Rigid-plastic Finite Element Method. Tran. ASME J. Eng. Mater. Technol. 1984, 106, 132–138. [Google Scholar] [CrossRef]


Disclaimer/Publisher’s Note: The statements, opinions and data contained in all publications are solely those of the individual author(s) and contributor(s) and not of MDPI and/or the editor(s). MDPI and/or the editor(s) disclaim responsibility for any injury to people or property resulting from any ideas, methods, instructions or products referred to in the content. |
© 2025 by the authors. Licensee MDPI, Basel, Switzerland. This article is an open access article distributed under the terms and conditions of the Creative Commons Attribution (CC BY) license (https://creativecommons.org/licenses/by/4.0/).