
The Discovery of Fracture Tip-Driven Stress Concentration: A Key Contributor to Casing Deformation in Horizontal Wells


Abstract
1. Introduction
2. Analytical and Numerical Model
2.1. Characteristics of Casing Deformation
2.1.1. Casing Deformation in Deep Shale Gas Horizontal Wells
2.1.2. Differential Characteristics of Casing Deformation
2.2. Finite Element Analysis Model
2.2.1. Stress Calculation Model
- (1)
- Fluid dynamics equations
- (2)
- Stress field of natural fracture
- (3)
- Casing stress
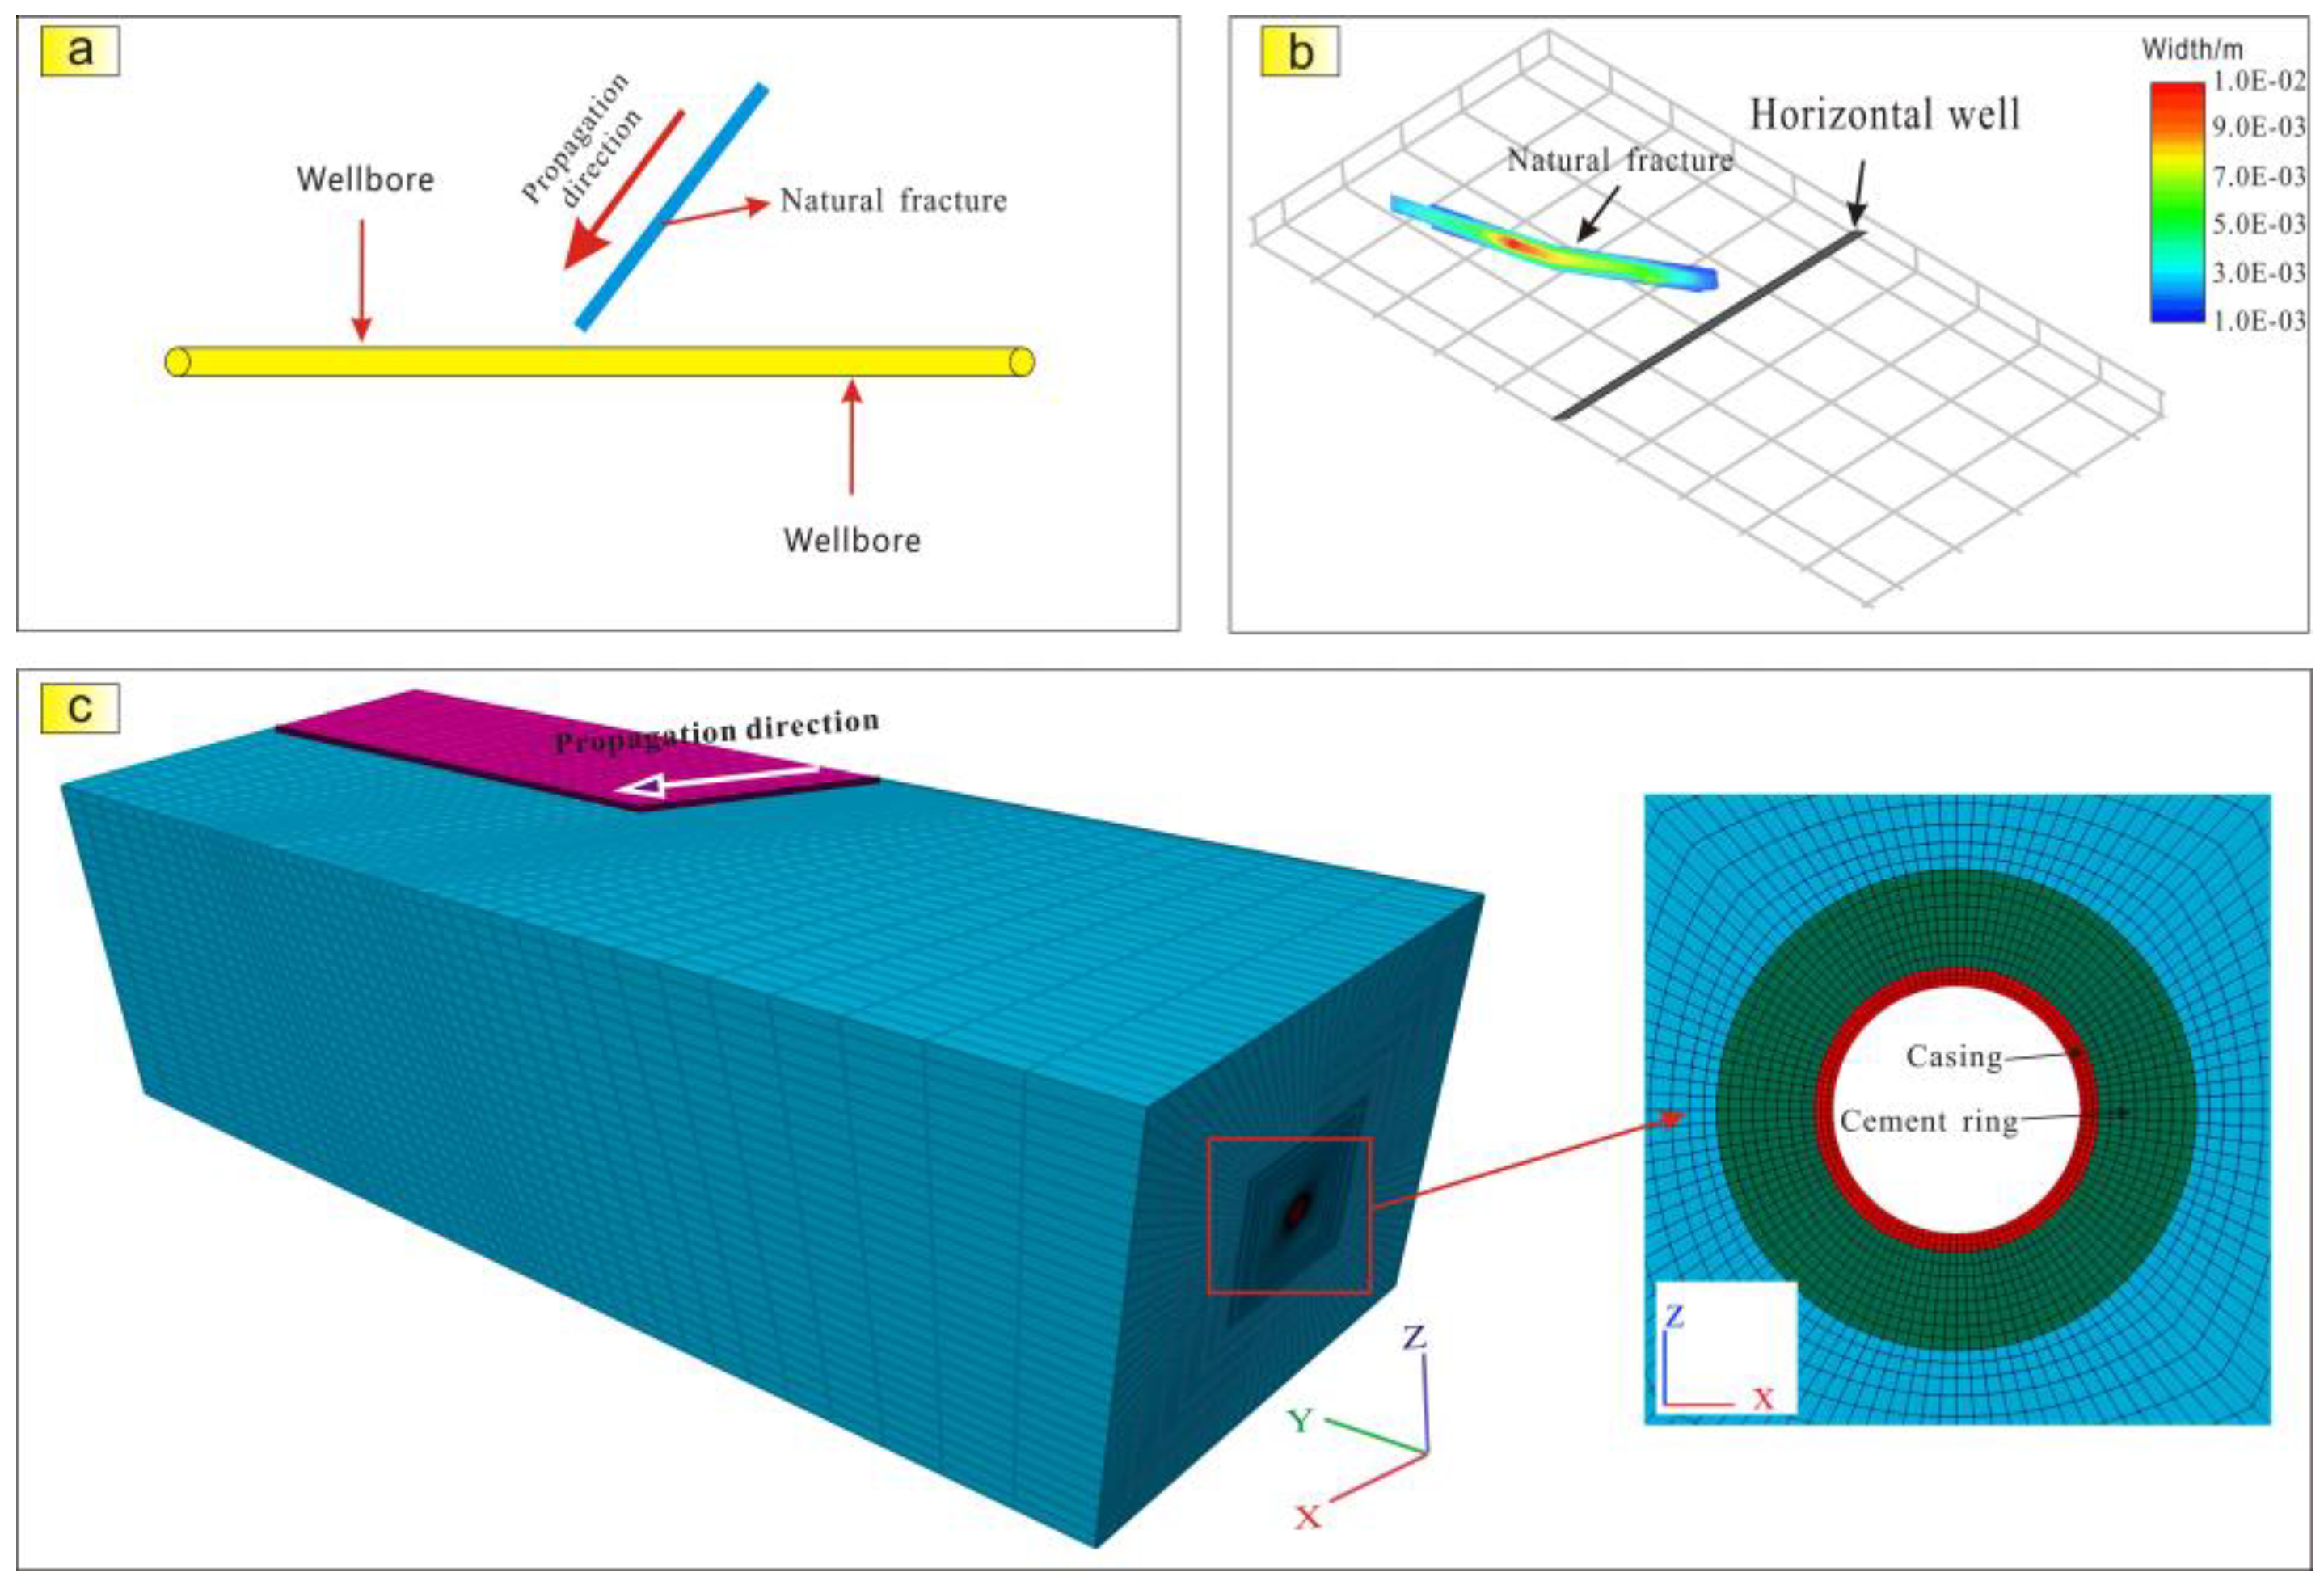
2.2.2. The CD Model of Strata-Fracture-Casing
- (1)
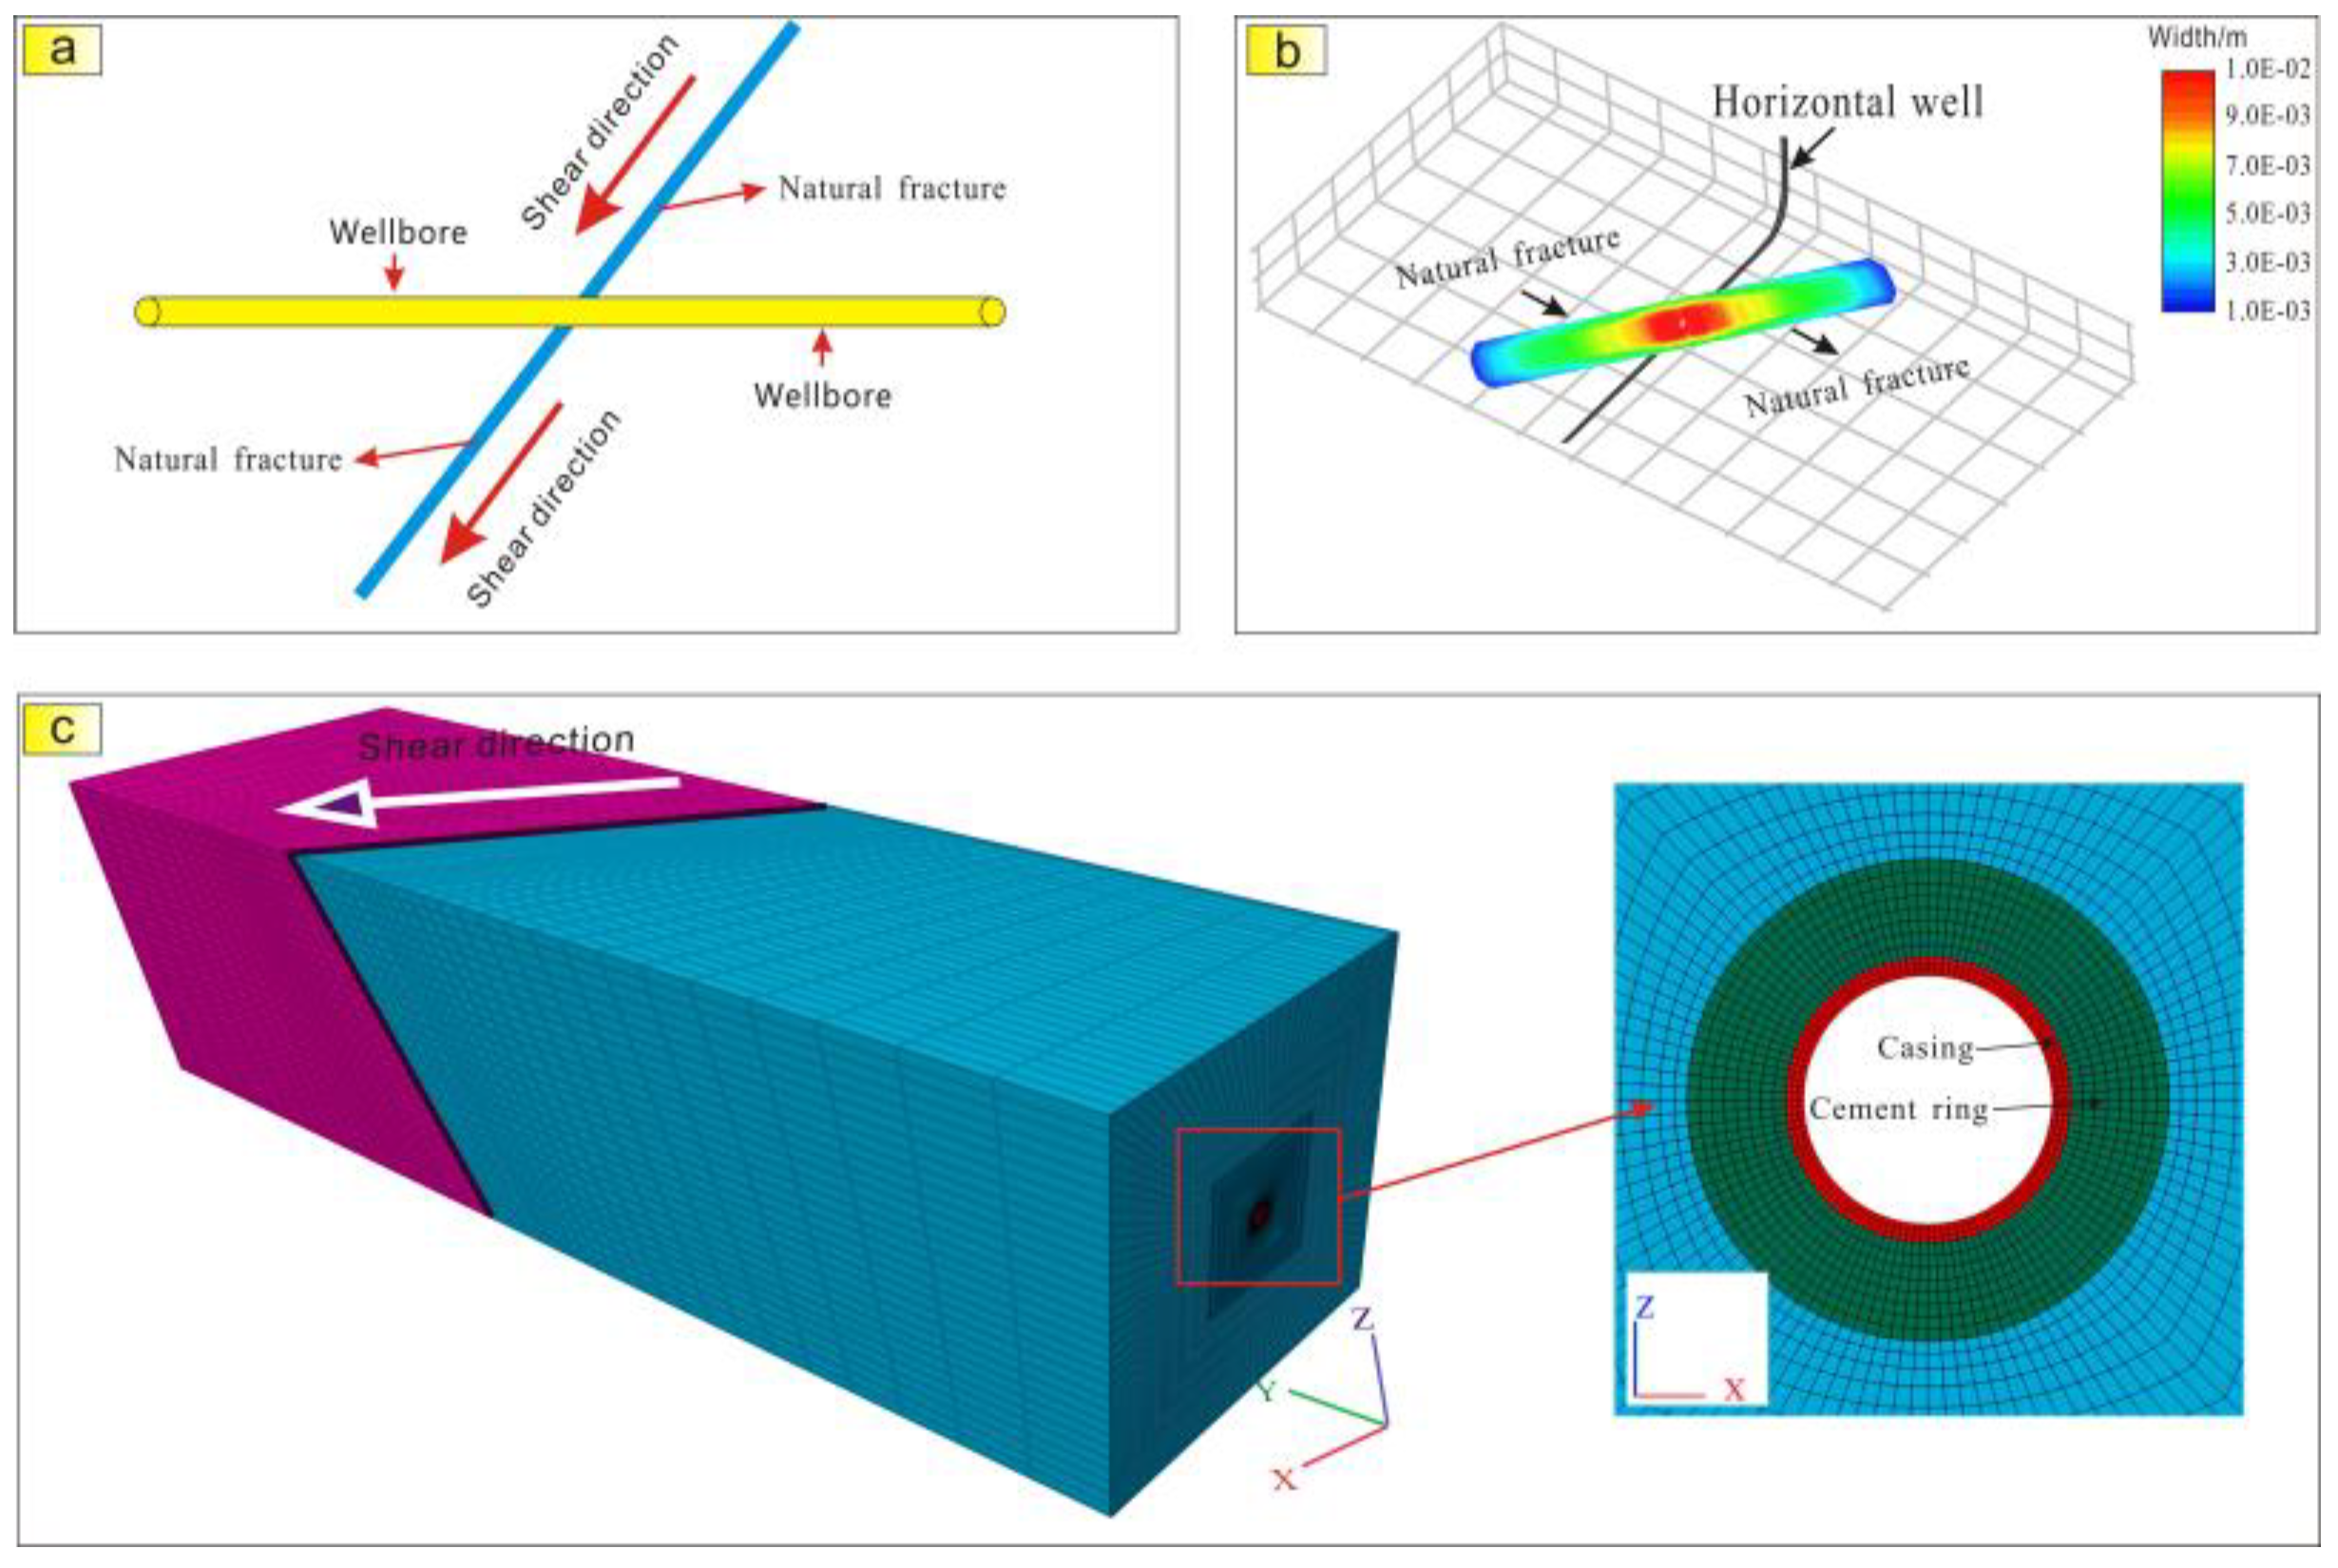
- Model structure and boundary conditions
- (2)
- Material constitutive
- (3)
- Model construction
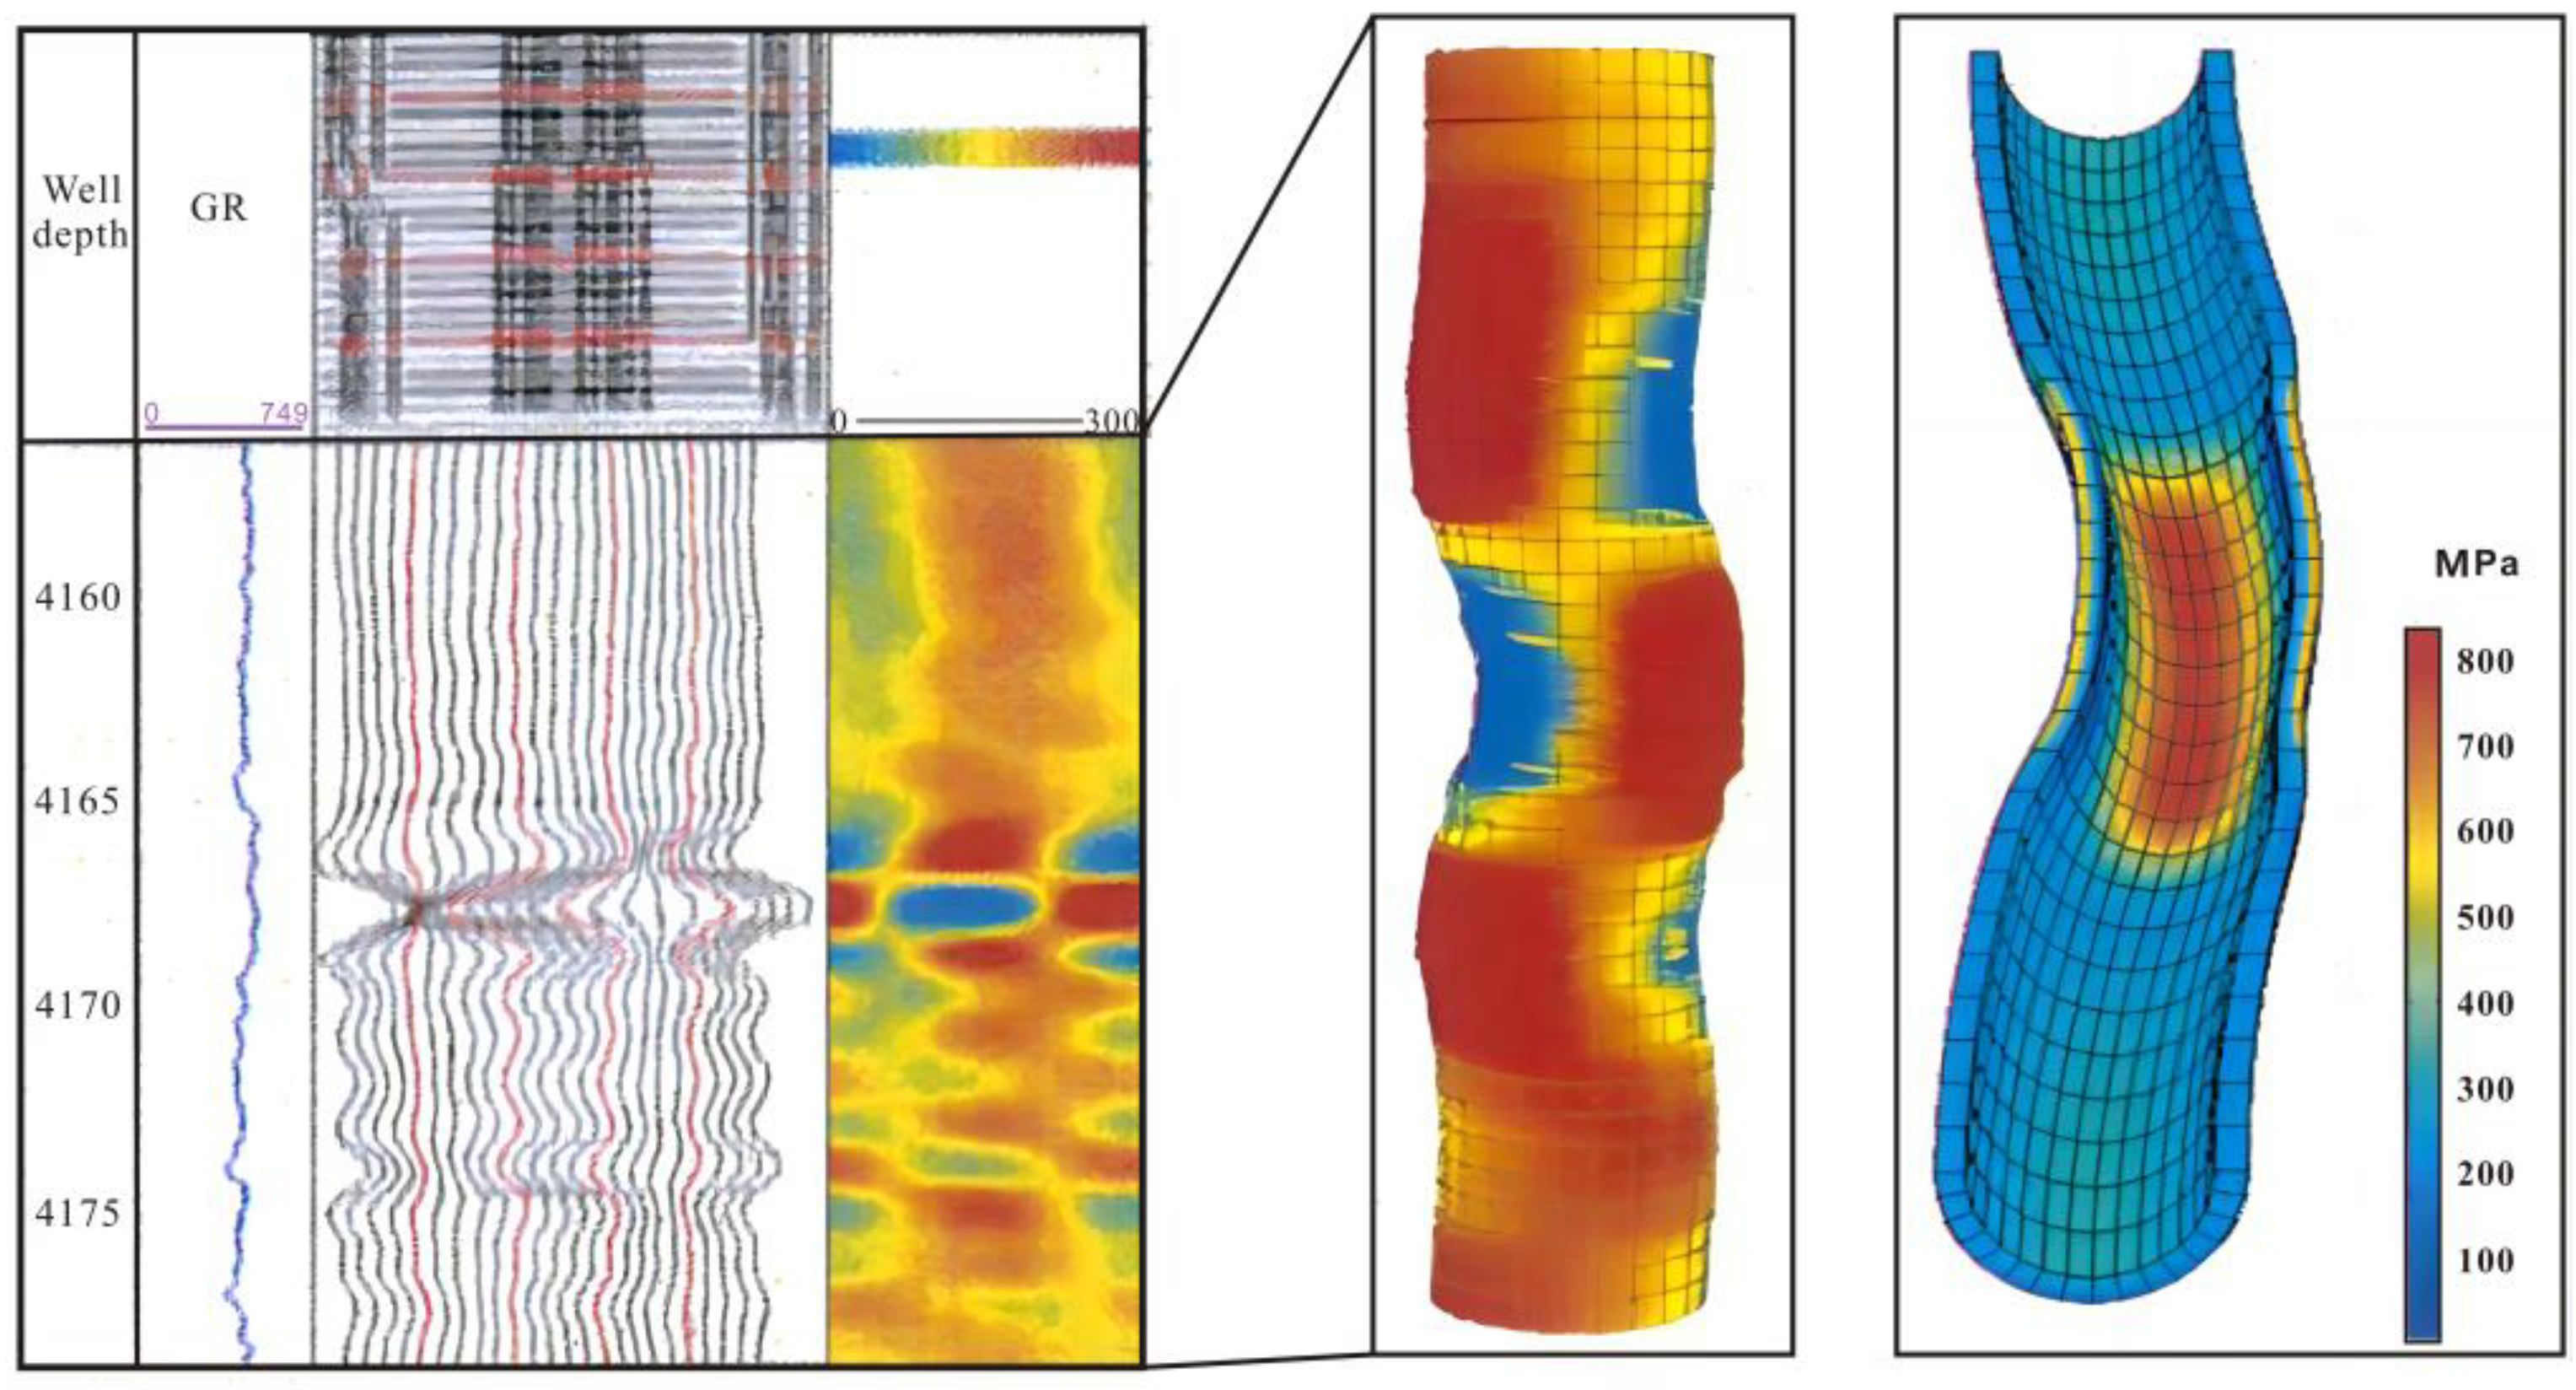
2.2.3. Model Validation
3. Simulation Results and Analysis
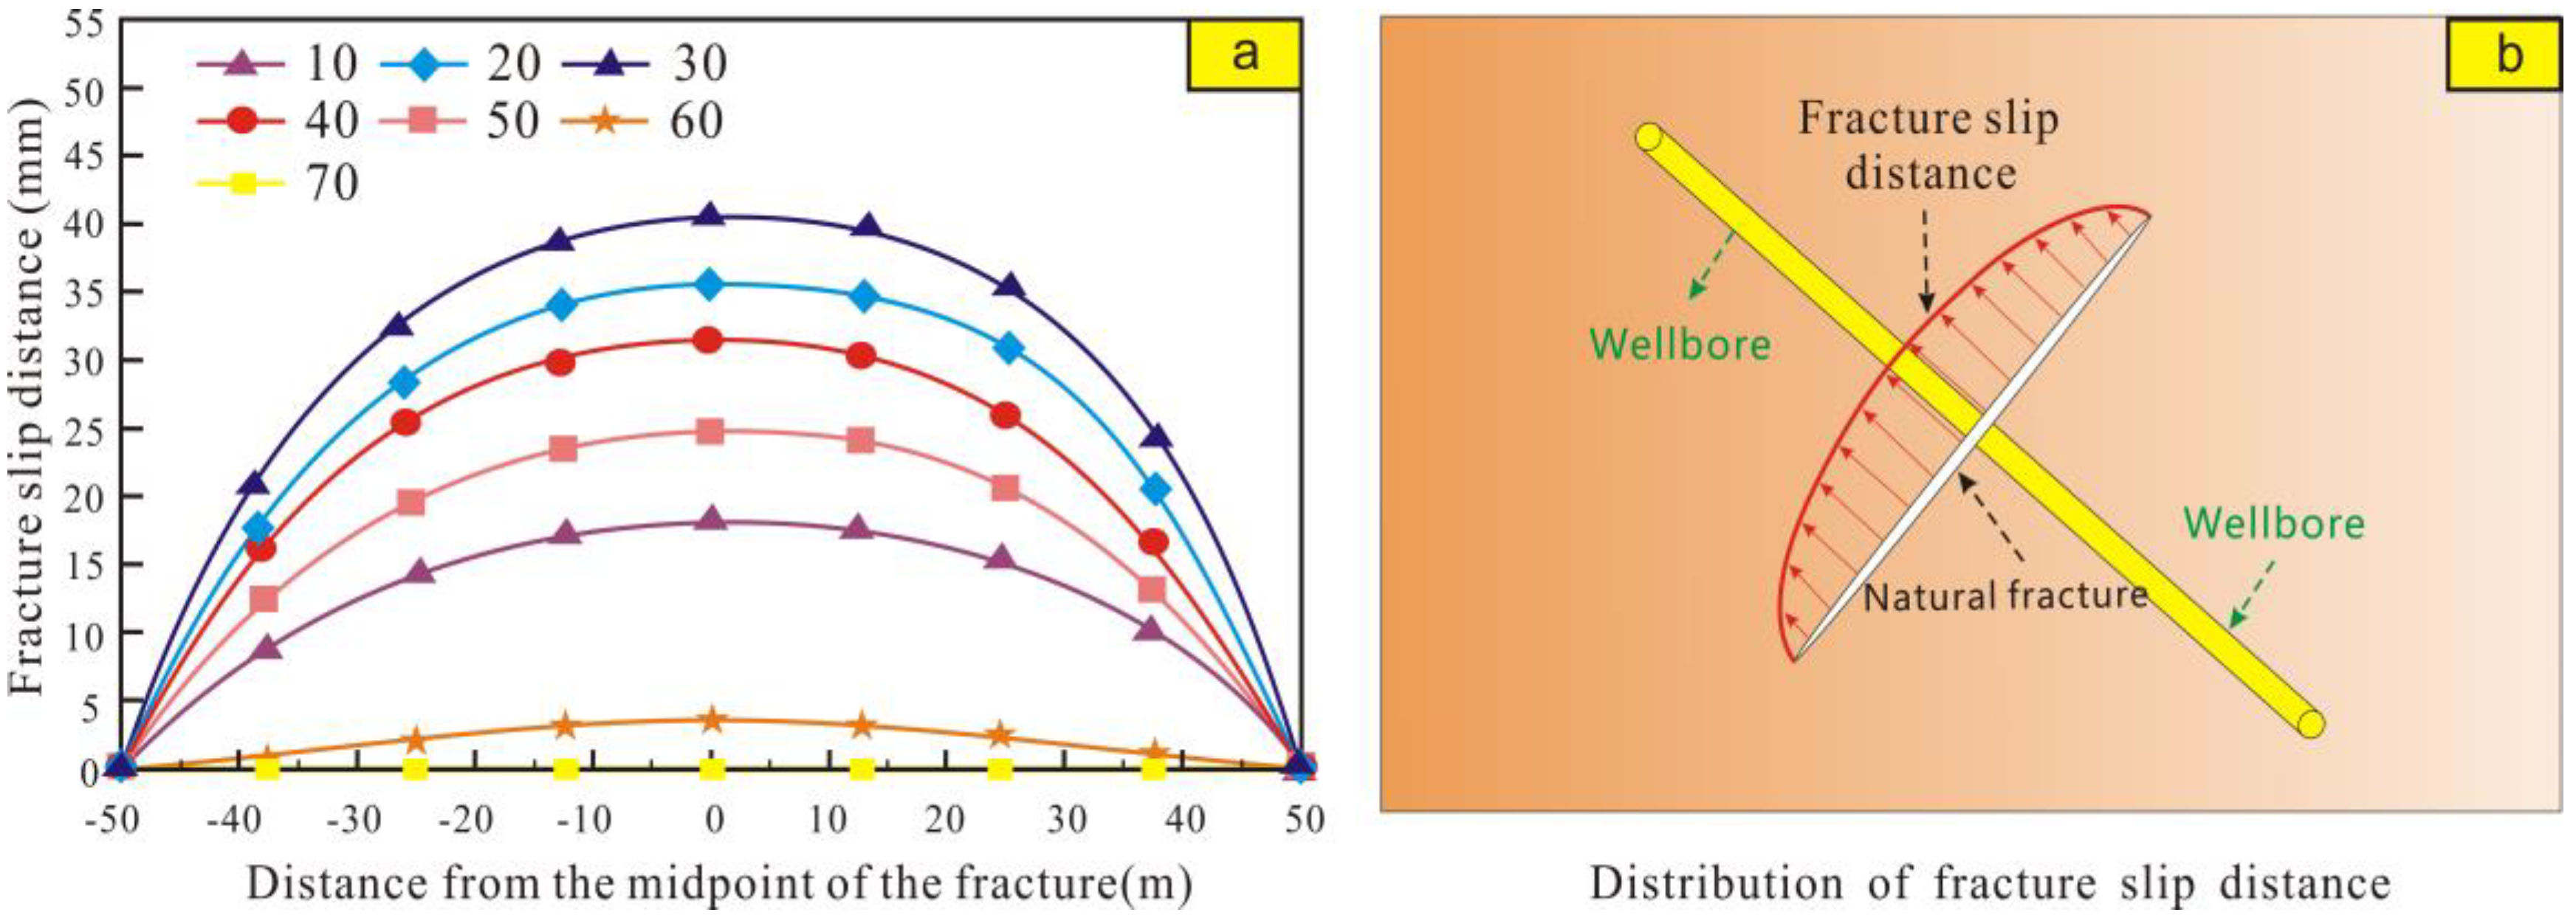
3.1. Penetrating Fracture Shear Deformation
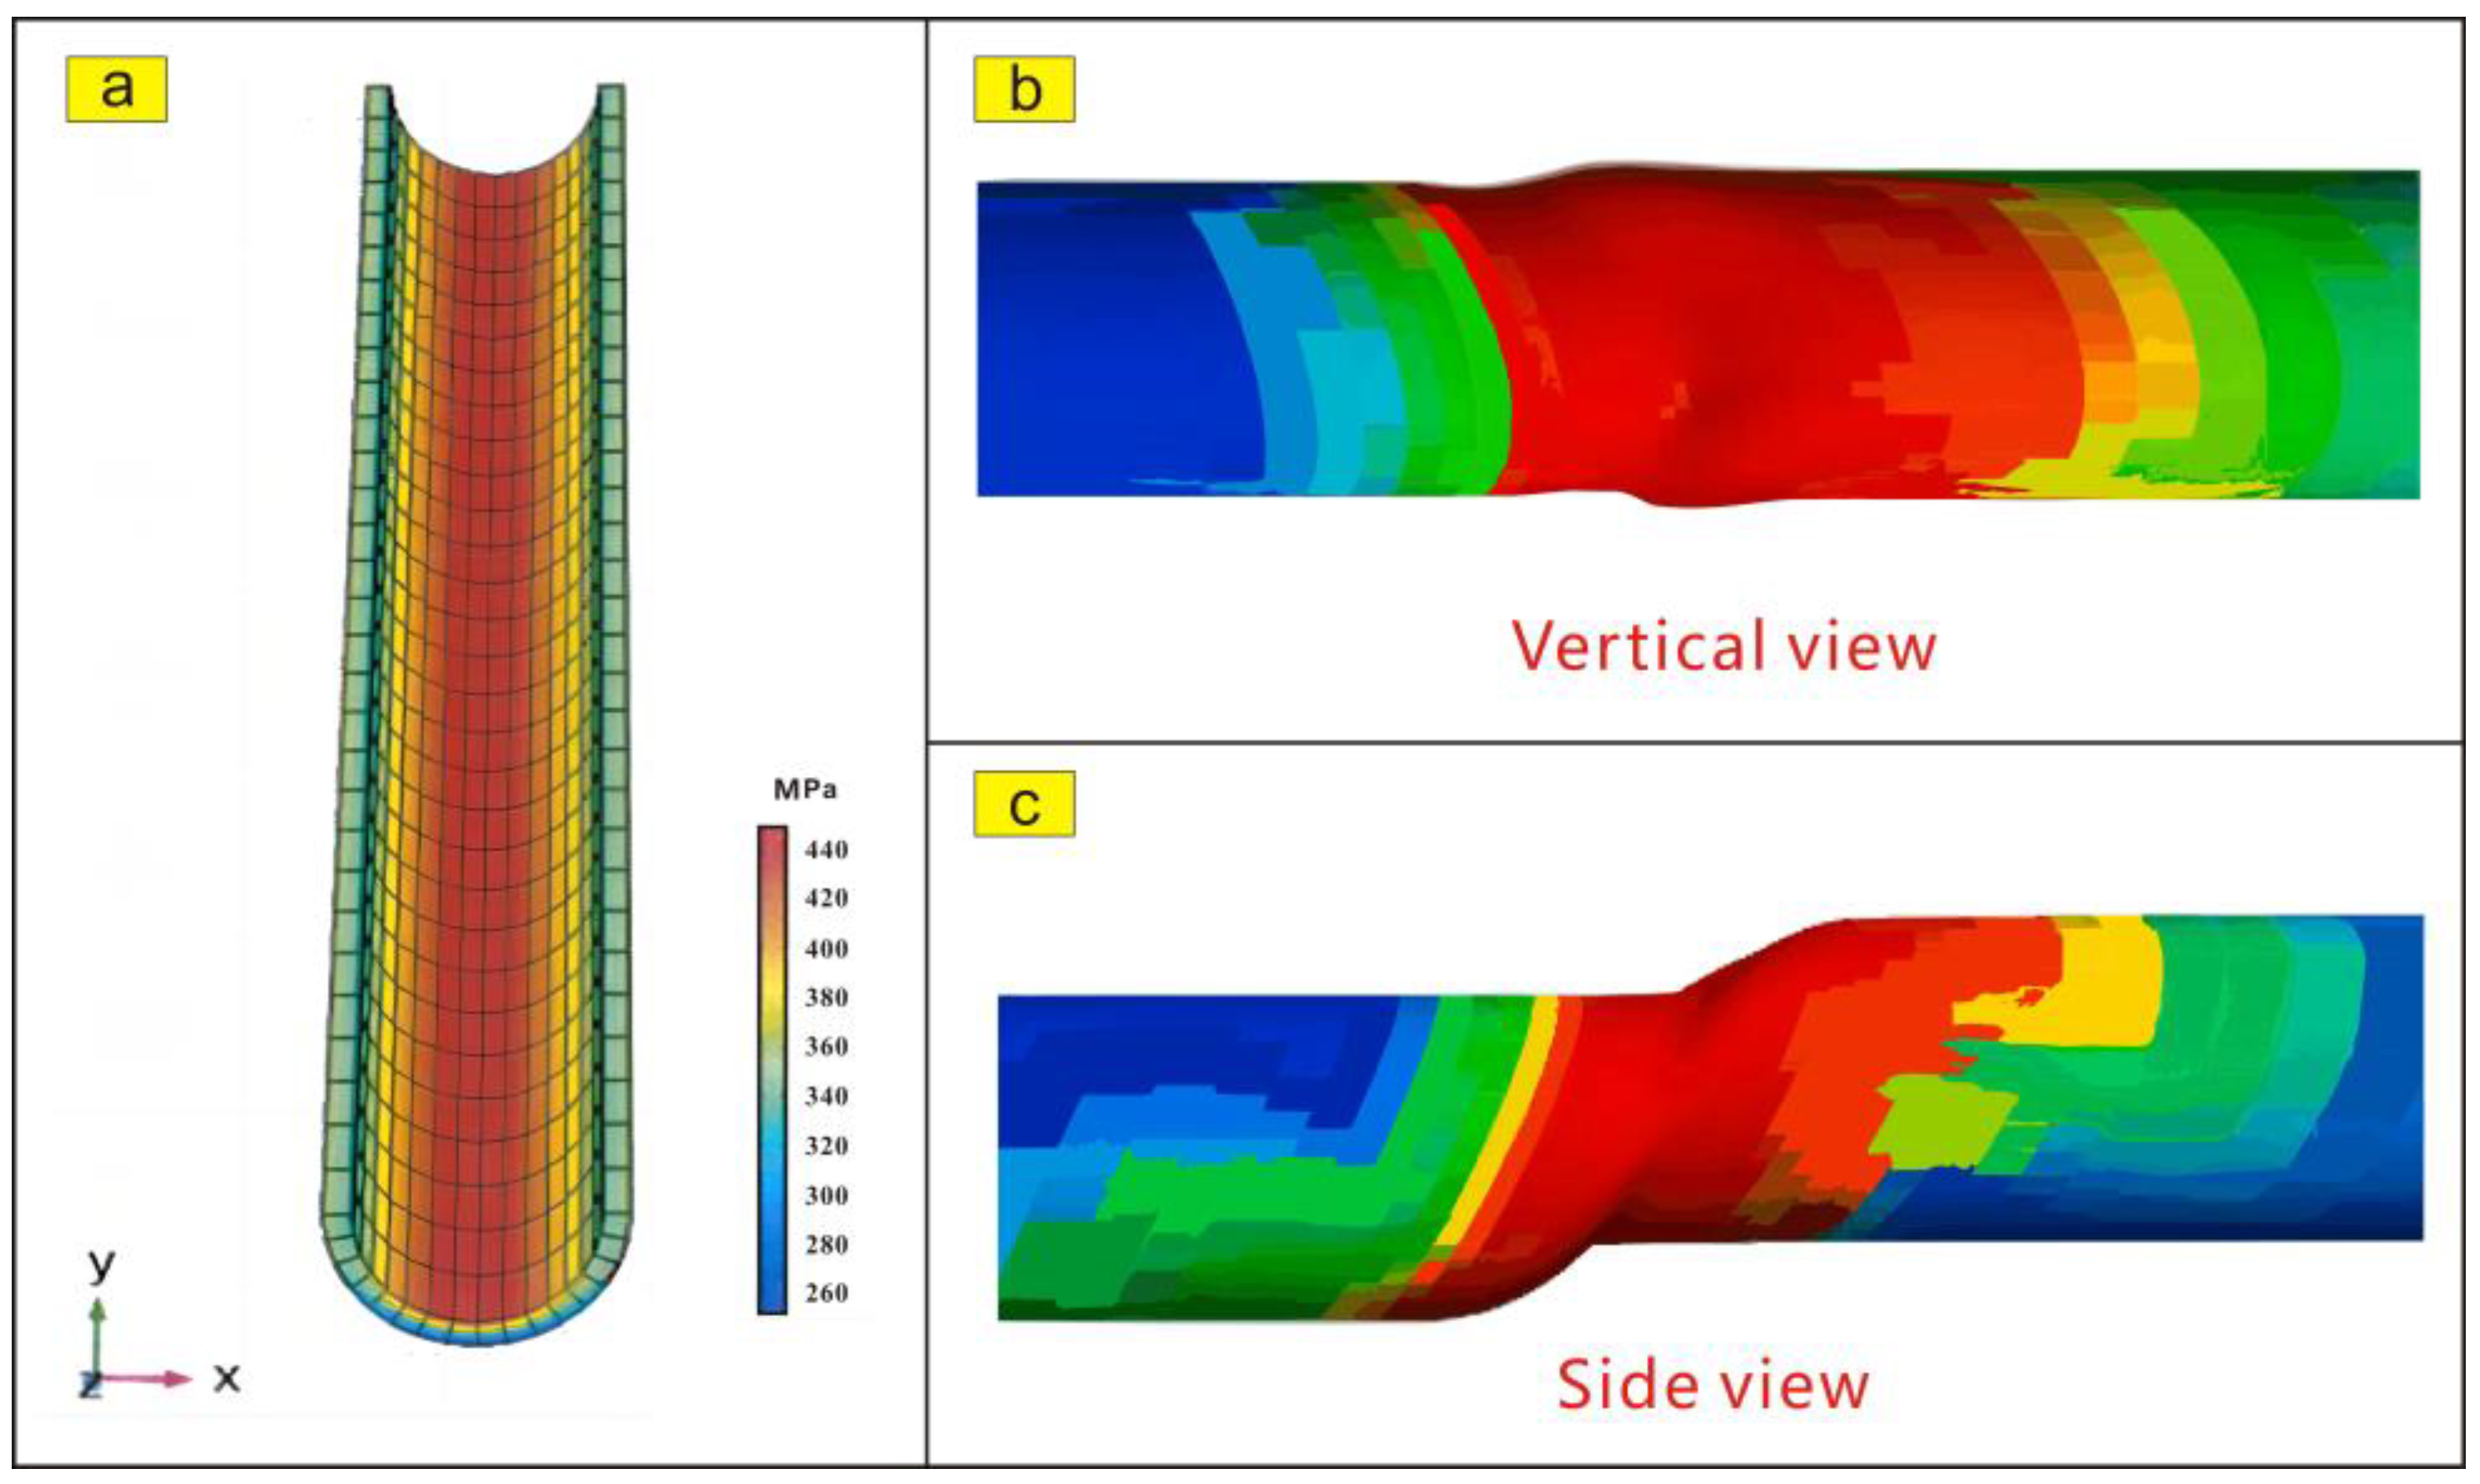
3.2. Fracture Tip Compression Deformation
3.3. Comparison of Shear Deformation and Compression Deformation
4. Discussion
4.1. The Key Contributor to Casing Deformation in Horizontal Wells
4.2. CD Risk Assessment and Prevention Measures
5. Conclusions
- (1)
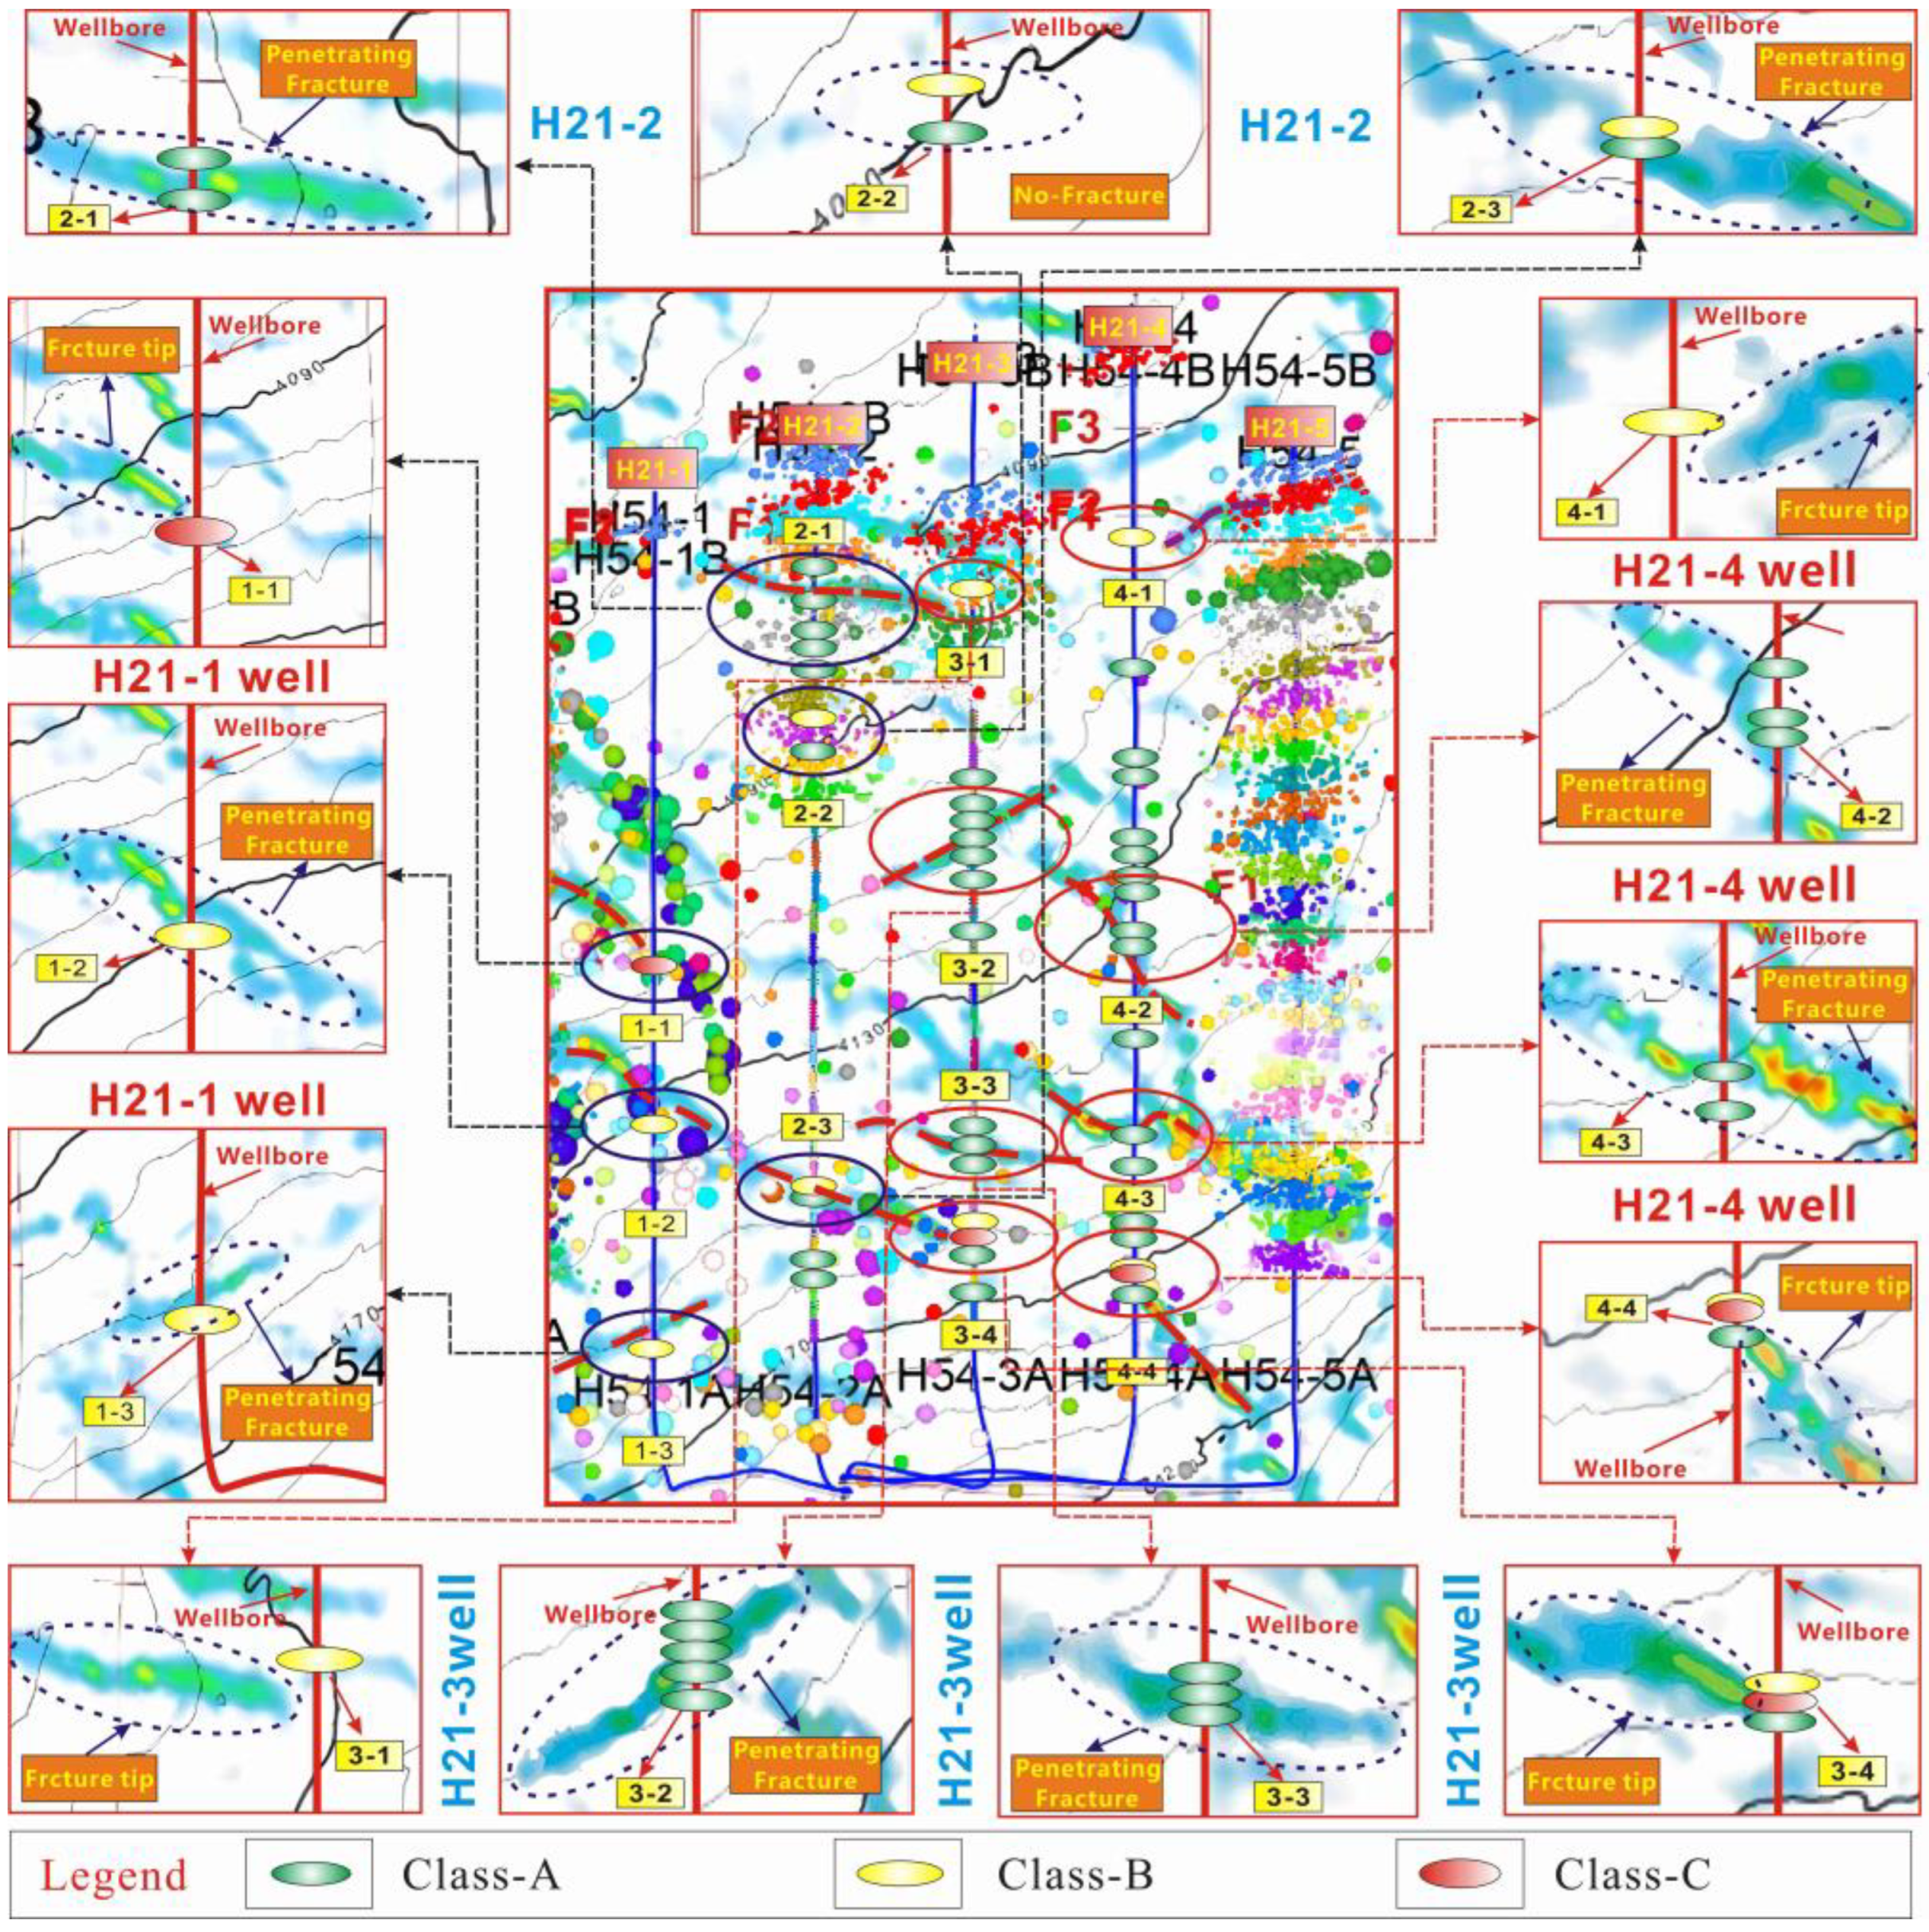
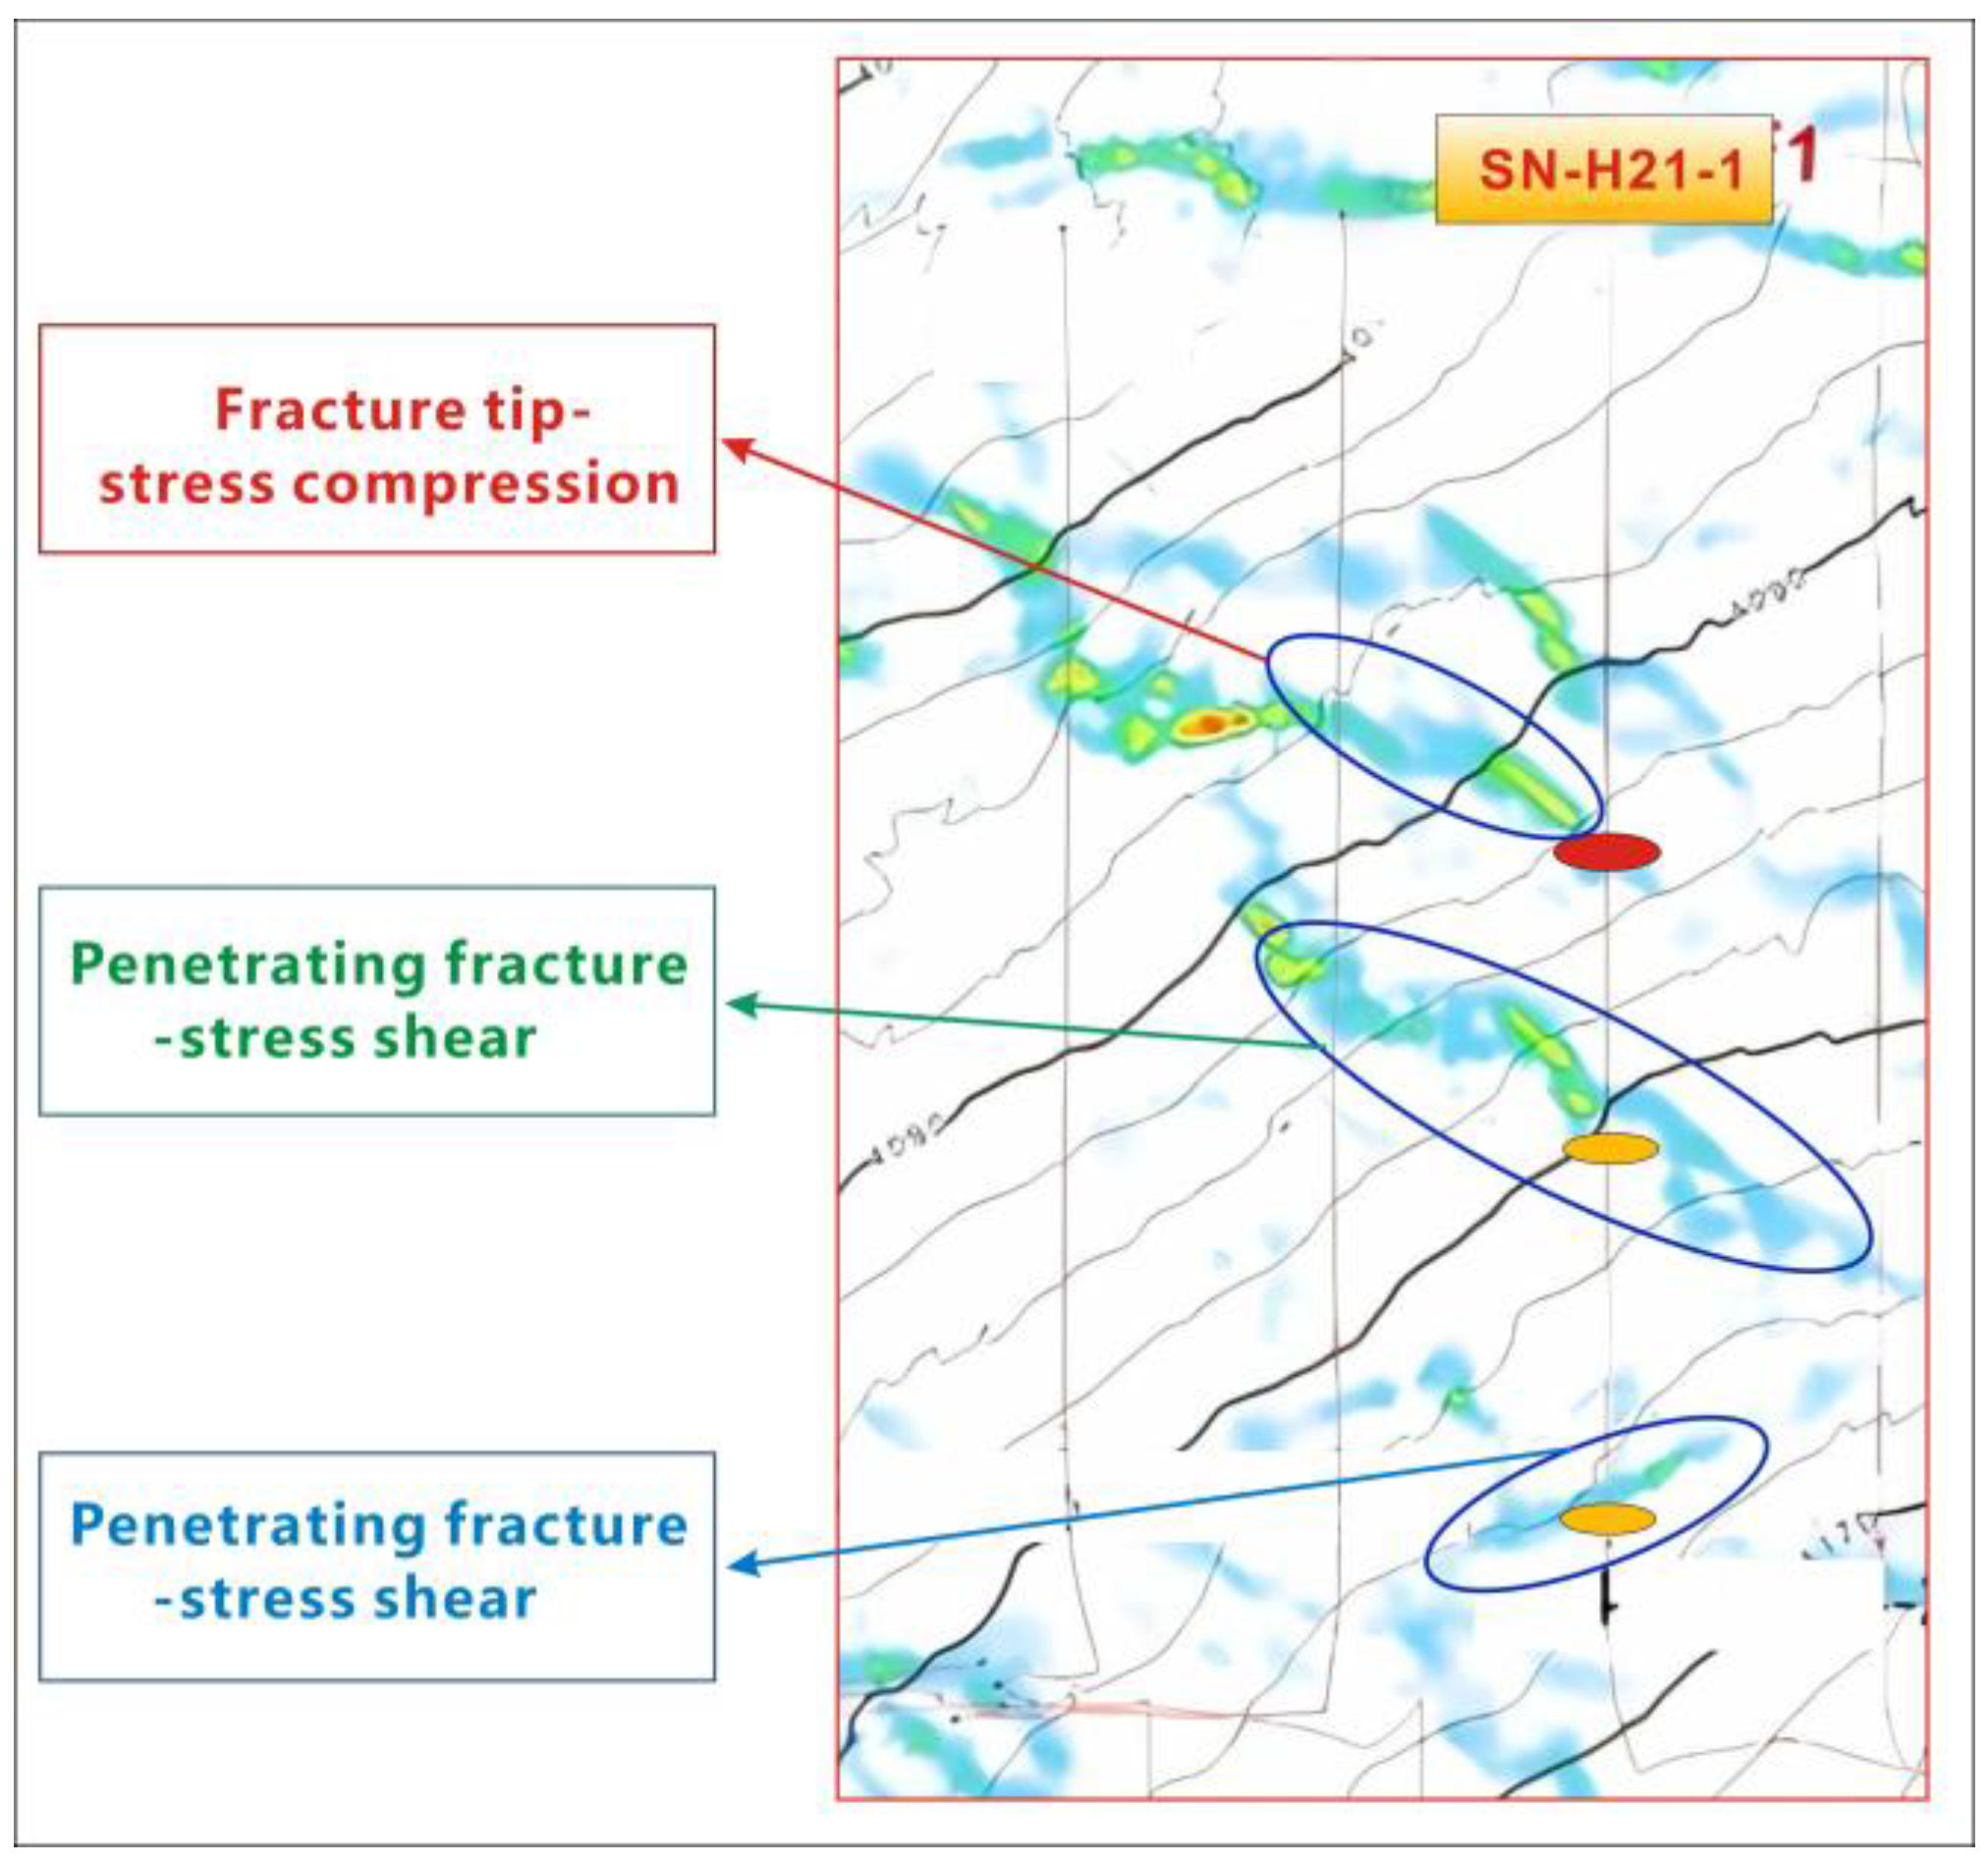
- Penetrating fracture shear deformation and fracture tip compression deformation are two key mechanisms leading to CD in deep shale gas wells of the study area. There are significant differences between the two in terms of their formation mechanisms and morphology. Research shows that the severe CDs in the research area are primarily attributed to the mechanism of fracture tip stress compression or the combination of fracture tip stress compression and penetrating fracture stress shear. Thus, proposing the deformation mechanism of fracture tip stress compression is of great significance for implementing targeted on-site prevention and control measures in the research area.
- (2)
- The slip distance of natural fractures is related to the approach angle and propagation path. Under the mechanism of penetrating fracture shear deformation, natural fractures with medium-to-low approach angles and intersection points with the wellbore near the center of the fracture are prone to form a higher risk of CD. These fractures can be categorized as high risk for casing deformation. Conversely, fractures with higher approach angles or intersections near both ends of the fracture pose a lower risk of CD and can be classified as low risk for CD.
- (3)
- Compared with the symmetrical deformation formed by casing shearing induced by fracture sliding, the CD subjected to compressive stress exhibits an asymmetrical distribution pattern, which increases the risk and level of induced casing deformation. The simulation results show that stress concentration formed at the fracture tip is highly sensitive to the injection rate. The greater the injection rate, the higher the deformation of the casing. Therefore, for formations with the fracture development, strict adherence to the first principle of “avoiding stress concentration” should be followed during hydraulic fracturing operations.
- (4)
- The proposed fracture propagation stress compression casing deformation (FP-SCCD) mechanism provides an improved understanding of casing deformation mechanisms. Based on this mechanism, a comprehensive casing deformation (CD) detection methodology and prevention strategy were developed. When strong pressure fluctuation coincides with high-magnitude microseismic events near fracture tips, an immediate reduction in injection rates or temporary operation suspension is recommended. This responsive measure effectively alleviates fluid pressure buildup and mitigates stress concentration, thereby preventing potential CD incidents.
Author Contributions
Funding
Data Availability Statement
Conflicts of Interest
References
- Chen, Z.; Liao, X.; Zhao, X.; Dou, X.; Zhu, L. Performance of horizontal wells with fracture networks in shale gas formation. J. Petrol. Sci. Eng. 2015, 133, 646–664. [Google Scholar] [CrossRef]
- Zhou, D.; Zheng, P.; He, P.; Jiao, P. Hydraulic fracture propagation direction during volume fracturing in unconventional reservoirs. J. Petrol. Sci. Eng. 2016, 141, 82–89. [Google Scholar] [CrossRef]
- Maxwell, S.C.; Waltman, C.; Warpinski, N.R.; Mayerhofer, M.J.; Boroumand, N. Imaging seismic deformation induced by hydraulic fracture complexity. SPE Res. Eval. Eng. 2009, 12, 48–52. [Google Scholar] [CrossRef]
- Yang, F.; Ning, Z.F.; Liu, H.Q. Fractal characteristics of shales from a shale gas reservoir in the Sichuan Basin, China. Fuel 2014, 15, 378–384. [Google Scholar] [CrossRef]
- Jin, Y.; Zhao, Q.; Mou, Y.; Weri, Y.; Cui, Y.; Hu, Y.; Wang, M.; Dong, T. Discussion on formation mechanism of casing deformation in horizontal wells in deep shale gas of Luzhou area. Nat. Gas Ind. 2024, 44, 99–110. [Google Scholar]
- Xi, Y.; Li, J.; Liu, G.H.; Fu, Y.Q. Numerical investigation for different casing deformation reasons in weiyuan-Changning shale gas field during multistage hydraulic fracturing. J. Petrol. Sci. Eng. 2018, 163, 691–702. [Google Scholar] [CrossRef]
- Sobhaniaragh, B.; Mansur, W.J.; Peters, F.C. The role of stress interference in hydraulic fracturing of horizontal wells. Int. J. Rock Mech. Min. Sci. 2018, 106, 153–164. [Google Scholar] [CrossRef]
- Wang, Y.P.; Guo, T.K.; Chen, M. Numerical study on simultaneous propagation of multiple fractures: A method to design nonuniform perforation and in-stage diversion. SPE J. 2023, 28, 2514–2533. [Google Scholar]
- Meng, H.; Ge, H.; Yao, Y.; Wang, J.; Bai, J.; Zhang, Z. A new insight into casing shear failure induced by natural fracture and artificial fracture slip. Eng. Fail. Anal. 2022, 137, 106287. [Google Scholar] [CrossRef]
- Guo, J.; Lu, Q.; Zhu, H.; Wang, Y.; Ma, L. Perforating cluster space optimization method of horizontal well multi-stage fracturing in extremely thick unconventional gas reservoir. J. Nat. Gas Sci. Eng. 2015, 26, 1648–1662. [Google Scholar] [CrossRef]
- Lu, Y.; Li, H.T.; Lu, C.; Wu, K.L.; Chen, Z.X. The effect of completion strategy on fracture propagation from multiple cluster perforations in fossil hydrogen energy development. Int. J. Hydrogen Energy 2019, 44, 7168–7180. [Google Scholar] [CrossRef]
- Han, L.L.; Li, X.Z.; Liu, Z.Y. Influencing factors and prevention measures of casing deformation in deep shale gas wells in Luzhou block, southern Sichuan Basin, SW China. Petr. Exp. Devel. 2023, 50, 853–861. [Google Scholar] [CrossRef]
- Li, Q.; Li, Q.; Wu, J.; Li, X.; Li, H.; Cheng, Y. Wellhead Stability During Development Process of Hydrate Reservoir in the Northern South China Sea: Evolution and Mechanism. Processes 2025, 13, 40. [Google Scholar] [CrossRef]
- Zhang, X.; Li, J.; Zhang, H.; Zhao, C. Analysis of casing deformation failure mechanism based on fault slip. Eng. Fail. Anal. 2021, 127, 105430. [Google Scholar] [CrossRef]
- Zhao, C.J.; Li, J.; Liu, G.H. Analysis of well stress with the effect of natural fracture nearby wellbore during hydraulic fracturing in shale gas wells. J. Petrol. Sci. Eng. 2020, 188, 106885. [Google Scholar] [CrossRef]
- Xi, Y.; Li, J.; Liu, G.H.; Zha, C.; Zeng, X.; Zhong, W. A new numerical method for evaluating the variation of casing inner diameter after strike-slip fault sliding during multistage fracturing in shale gas wells. Energy Sci. Eng. 2019, 7, 2046–2058. [Google Scholar] [CrossRef]
- Yin, F.; Xiao, Y.; Han, L.H. Quantifying the induced fracture slip and casing deformation in hydraulically fracturing shale gas wells. J. Nat. Gas. Sci. Eng. 2018, 60, 103–111. [Google Scholar] [CrossRef]
- Zhang, F.; Yin, Z.; Chen, Z.; Maxwell, S.; Zhang, L.; Wu, Y. Fault reactivation and induced seismicity during multistage hydraulic fracturing: Microseismic analysis and geomechanical modeling. SPE J. 2020, 25, 692–711. [Google Scholar] [CrossRef]
- Meyer, J.J.; Gallop, J.; Chen, A.; Reynolds, S.; Mildren, S. Can seismic inversion be used for geomechanics—A casing deformation example. In Proceedings of the Unconventional Resources Technology Conference, Houston, TX, USA, 23–25 July 2018; pp. 23–25. [Google Scholar]
- Wang, B.; Zhang, G.; Zhang, L.; Liu, J.; Zhou, F. Promoting the uniform propagation of multifracture through adjusting the injection rate and perforation parameter: A numerical study. Phys. Fluids 2023, 35, 143–158. [Google Scholar] [CrossRef]
- Settgast, R.; Izad, G.; Hurt, R. Optimized cluster design in hydraulic fracture stimulation. In Proceedings of the SPE/AAPG/SEG Unconventional Resources Technology Conference, San Antonio, TX, USA, 20–22 July 2015; p. URTEC-2015-2172691. [Google Scholar]
- Xi, Y.; Li, J.; Zha, C.Q.; Guo, B.; Liu, G. A new investigation on casing shear deformation during multistage fracturing in shale gas wells based on microseism data and calliper surveys. J. Petrol. Sci. Eng. 2019, 180, 1034–1045. [Google Scholar]
- Chen, S.B.; Zhu, Y.M.; Wang, H.Y.; Liu, H.; Wei, W.; Fang, J. A typical case in the southern Sichuan Basin of China. Energy 2011, 36, 6609–6616. [Google Scholar] [CrossRef]
- Lu, Q.L.; Liu, Z.; Guo, J.C.; He, L.; Li, Y.C.; Zeng, J.; Ren, S. Hydraulic fracturing induced casing shear deformation and a prediction model of casing deformation. Pet. Explor. Dev. 2021, 48, 394–401. [Google Scholar] [CrossRef]
- Rutqvist, J.; Rinaldi, A.P.; Cappa, F. Modeling of fault activation and seismicity by injection directly into a fault zone associated with hydraulic fracturing of shale-gas reservoirs. J. Petrol. Sci. Eng. 2015, 127, 367–386. [Google Scholar] [CrossRef]
- Zhao, J.Z.; Chen, X.Y.; Li, Y.M.; Fu, B.; Xu, W. Numerical simulation of multistage fracturing and optimization of perforation in a horizontal well. Pet. Explor. Dev. 2017, 44, 119–126. [Google Scholar] [CrossRef]
- Muzammil, H.R.; Abeeb, A.A. Stochastic optimization of hydraulic fracture and horizontal well parameters in shale gas reservoirs. J. Nat. Gas. Sci. Eng. 2016, 36, 71–78. [Google Scholar]
- Liu, K.; Gao, D.L.; Yang, J. Effect of expandable cement on increasing sealing ability of cement sheath in shale gas wells. J. Petrol. Sci. Eng. 2019, 176, 850–861. [Google Scholar] [CrossRef]
- Zhou, T.; Zhang, S.C.; Chen, M. Competitive propagation of multi-fractures and their control on multiclustered fracturing of horizontal wells. Sci. Sin. Tech. 2019, 49, 469–478. [Google Scholar] [CrossRef]
- Meng, H.; Ge, H.; Fu, D.; Wang, X.; Wang, J. Numerical investigation of casing shear deformation due to fracture/fault slip during hydraulic fracturing. Energy. Sci. Eng. 2020, 8, 3588–3601. [Google Scholar] [CrossRef]
- Liu, Z.Y.; Pan, Z.J.; Li, S.B.; Zhang, L.; Wang, F.; Han, L.; Zhang, J.; Ma, Y.; Li, H.; Li, W. Study on the effect of cemented natural fractures on hydraulic fracture propagation in volcanic reservoirs. Energy 2022, 24, 122845. [Google Scholar] [CrossRef]
- Wang, L.C.; Duan, K.; Zhang, Q.Y.; Li, X.; Jiang, R.; Zheng, Y. Stress interference and interaction between two fractures during their propagation: Insights from SCDA test and XFEM simulation. Int. J. Rock Mech. Min. Sci. 2023, 169, 105431. [Google Scholar] [CrossRef]
- Zou, J.; Chen, W.; Yuan, J.; Yang, D.; Yang, J. 3-D numerical simulation of hydraulic fracturing in a CBM reservoir. J. Nat. Gas Sci. Eng. 2017, 37, 386–396. [Google Scholar] [CrossRef]
- Liu, Y.; Tang, D.; Xu, H.; Li, S.; Tao, S. The impact of coal macrolithotype on hydraulic fracture initiation and propagation in coal seams. J. Nat. Gas Sci. Eng. 2018, 56, 299–314. [Google Scholar] [CrossRef]
- Rahim, Z.; Holditch, S.A. Extended finite element simulation of hydraulic fracture based on ABAQUS platform. J. Petrol. Sci. Eng. 1993, 13, 15–27. [Google Scholar] [CrossRef]
- Yan, J.P.; Lai, S.Y.; Guo, W.L.; Song, L.; Lv, S.; Zhang, T. Research progress on casing deformation types and influencing factors in geological engineering of shale gas wells. Litho. Reser. 2024, 36, 1–14. [Google Scholar]
- Li, Y.; Liu, W.; Yan, W.J.; Deng, J.; Li, H. Mechanism of casing failure during hydraulic fracturing: Lessons earned from a tight-oil reservoir in China. Eng. Fail. Anal. 2019, 98, 58–71. [Google Scholar] [CrossRef]
- Wu, K.; Olson, J.; Balhoff, M.T.; Yu, W. Numerical analysis for promoting uniform development of simultaneous multiple-fracture propagation in horizontal wells. SPE Prod. Oper. 2016, 32, 41–50. [Google Scholar]
- Cheng, W.; Jiang, G.S.; Tian, H.; Zhu, Q. Numerical investigations of the fracture geometry and fluid distribution of multistage consecutive and alternative fracturing in a horizontal well. Comput. Geotech. 2017, 92, 41–56. [Google Scholar] [CrossRef]
- Wu, K. Numerical Modeling of Complex Hydraulic Fracture Development in Unconventional Reservoirs; The University of Texas at Austin: Austin, TX, USA, 2014. [Google Scholar]
- Schlichting, H.; Shapiro, A.H. Boundary-layer theory, sixth edition. J. Appl. Mech. 1968, 35, 846. [Google Scholar] [CrossRef]
- Chen, C.; Shi, L.; Xiang, D. Mechanism of casing deformation in the Changning-Weiyuan national shale gas project demonstration area and countermeasures. Nat. Gas Ind. 2016, 36, 70–75. [Google Scholar]
- Li, L.; Wang, G.; Lian, Z. Deformation mechanism of horizontal shale gas well production casing and its engineering solution: A case study on the Huangjinba block of the Zhaotong national shale gas demonstration zone. Nat. Gas Ind. 2017, 37, 91–99. [Google Scholar] [CrossRef]
- Dong, K.; Liu, N.; Cheng, Z.; Huang, R.; Niu, G. Geomechanical analysis on casing deformation in Longmaxi shale formation. J. Pet. Sci. Eng. 2019, 177, 724–733. [Google Scholar] [CrossRef]


| Category | Parameters | Values |
|---|---|---|
| Mechanical parameters | Rock density, D | 2400 kg/m3 |
| Tensile strength, TO | 2.3 MPa | |
| Cohesion, c | 0.06 MPa | |
| Friction angle, φ | 40° | |
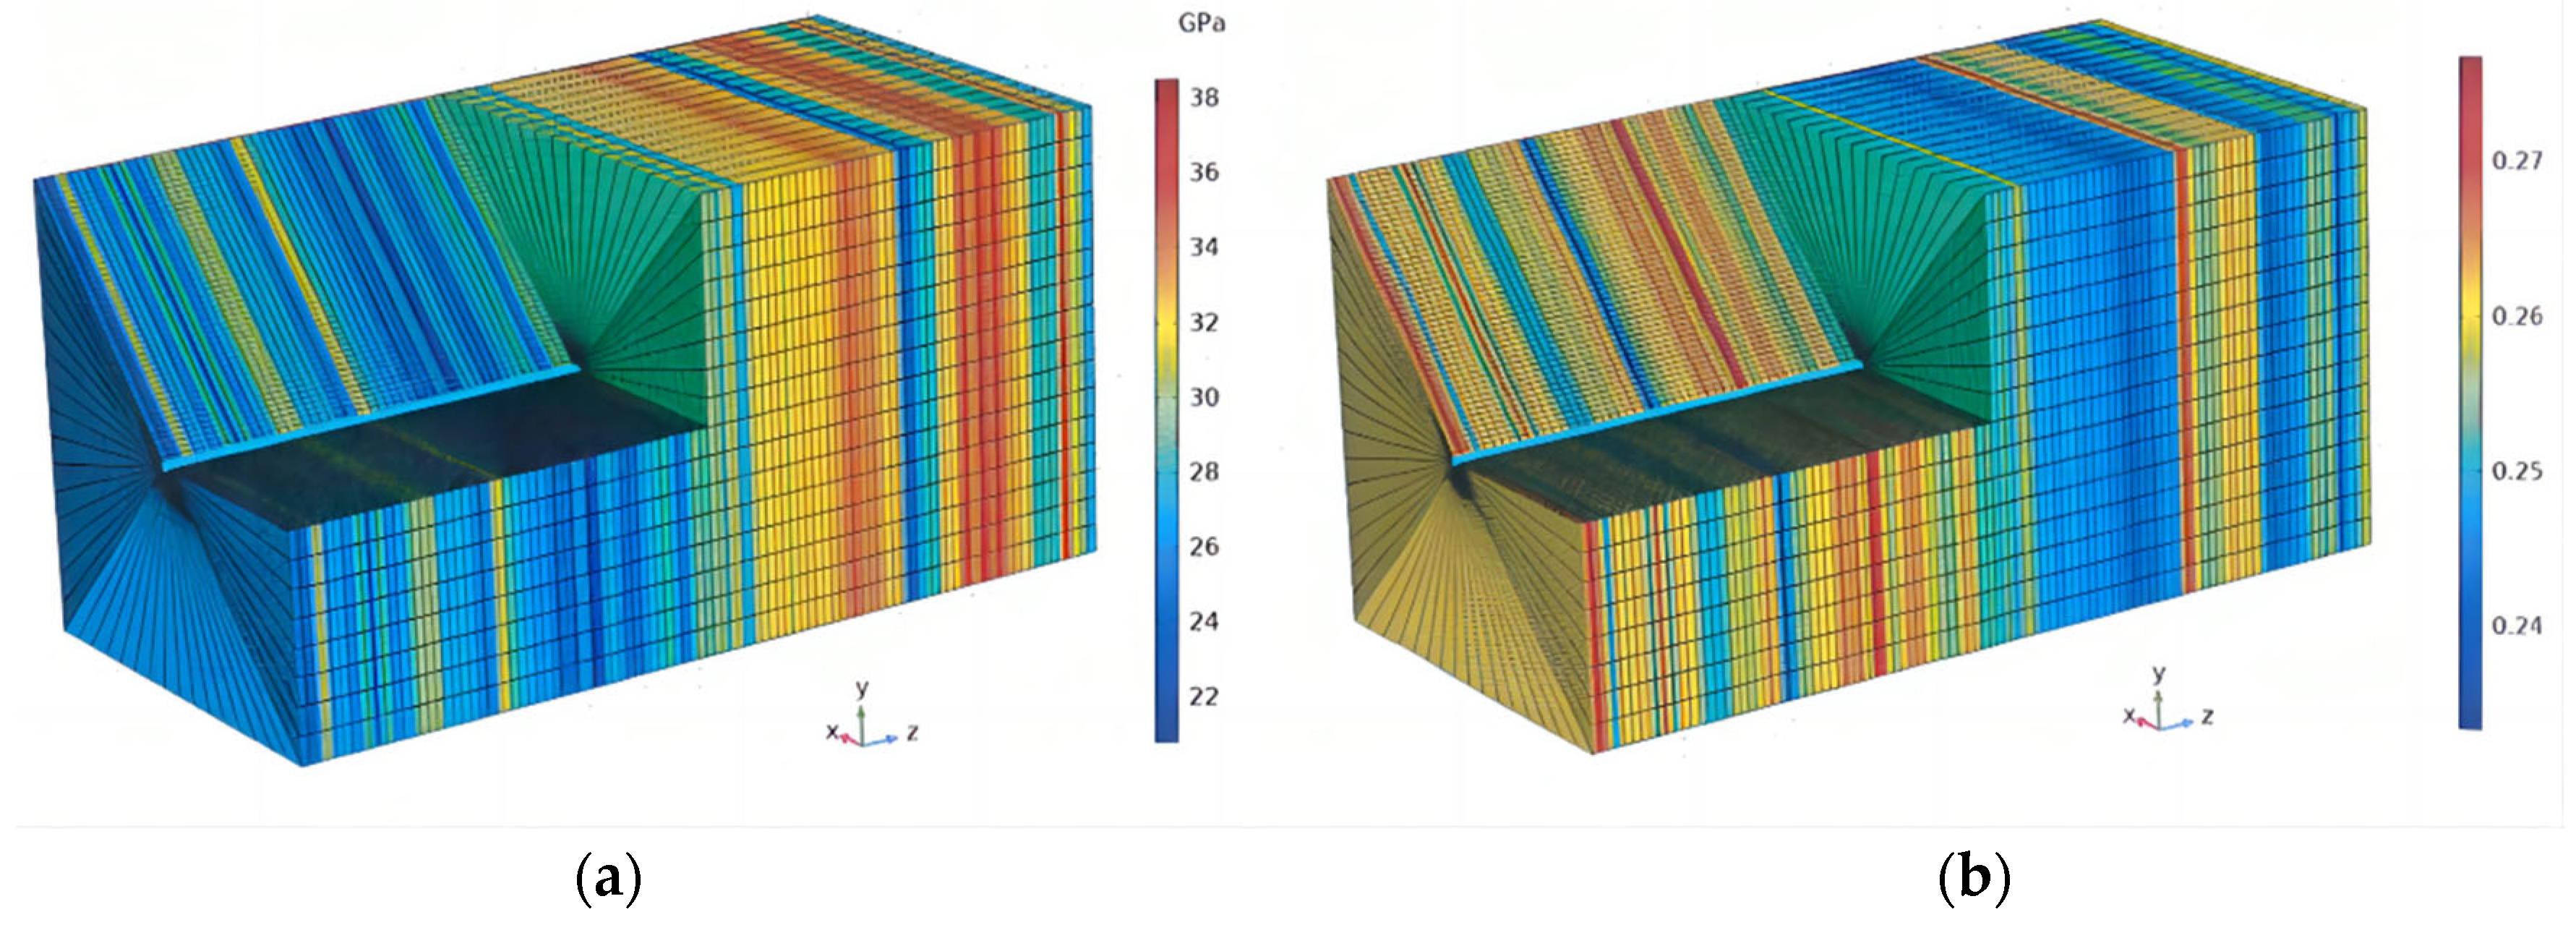
| Young’s modulus, E | 30.0 GPa | |
| Friction coefficient, μ | 0.5 | |
| Poisson’s ratio | 0.21 | |
| In situ stress | Max horizontal principal stress, SH | 85 MPa |
| Min horizontal principal stress, Sh | 79 MPa | |
| Vertical principal stress | 86 MPa |
Disclaimer/Publisher’s Note: The statements, opinions and data contained in all publications are solely those of the individual author(s) and contributor(s) and not of MDPI and/or the editor(s). MDPI and/or the editor(s) disclaim responsibility for any injury to people or property resulting from any ideas, methods, instructions or products referred to in the content. |
© 2025 by the authors. Licensee MDPI, Basel, Switzerland. This article is an open access article distributed under the terms and conditions of the Creative Commons Attribution (CC BY) license (https://creativecommons.org/licenses/by/4.0/).
Share and Cite
Li, H.; Wu, H.; Wen, G.; Zhao, W.; Zou, H.; Liu, Y.; Li, Q.; Wang, W.; Liu, Y. The Discovery of Fracture Tip-Driven Stress Concentration: A Key Contributor to Casing Deformation in Horizontal Wells. Processes 2025, 13, 1121. https://doi.org/10.3390/pr13041121
Li H, Wu H, Wen G, Zhao W, Zou H, Liu Y, Li Q, Wang W, Liu Y. The Discovery of Fracture Tip-Driven Stress Concentration: A Key Contributor to Casing Deformation in Horizontal Wells. Processes. 2025; 13(4):1121. https://doi.org/10.3390/pr13041121
Chicago/Turabian StyleLi, Hai, Hongbo Wu, Guo Wen, Wentao Zhao, Hongjiang Zou, Yanchi Liu, Qixin Li, Weiyi Wang, and Yulong Liu. 2025. "The Discovery of Fracture Tip-Driven Stress Concentration: A Key Contributor to Casing Deformation in Horizontal Wells" Processes 13, no. 4: 1121. https://doi.org/10.3390/pr13041121
APA StyleLi, H., Wu, H., Wen, G., Zhao, W., Zou, H., Liu, Y., Li, Q., Wang, W., & Liu, Y. (2025). The Discovery of Fracture Tip-Driven Stress Concentration: A Key Contributor to Casing Deformation in Horizontal Wells. Processes, 13(4), 1121. https://doi.org/10.3390/pr13041121