1. Introduction
Transmission towers are critical infrastructures in power grids, supporting high-voltage lines over long distances. The structural integrity of these towers is inherently dependent on the reliability of their bolted connections, which constitute critical load-bearing components in lattice-type steel structures [
1]. However, bolts are susceptible to progressive loosening under operational stressors such as cyclic wind loads, mechanical vibrations, and thermal expansion–contraction cycles [
2]. This degradation mechanism can precipitate catastrophic structural failures, exemplified by the cascade collapse of multiple towers in eastern China’s power grid during a downburst event [
3]. Forensic analysis highlighted structural instability exacerbated by cyclic wind loads, with bolt loosening identified as a critical contributing factor. Such incidents underscore the imperative for robust bolt integrity monitoring systems to ensure grid resilience against escalating climate extremes and increasing energy transmission demands [
4].
Traditional methods for inspecting power transmission towers remain entrenched in labor-intensive practices, primarily involving manual climbing for visual inspections and percussion-based assessments using rubber hammers [
5]. These approaches incur prohibitive costs and inefficiencies due to three interrelated factors: (1) lack of repeatability of a unified force application and subjectivity in acoustic interpretation, (2) time-consuming workflows for large-scale infrastructure (e.g., inspecting hundreds of bolts per tower), and (3) limited scalability in remote or hazardous environments [
6]. For instance, manual inspections of a single 36 m tower require 8–12 h of labor, with costs escalating exponentially for grid-scale deployments. Recent advancements in sensor networks and edge computing have exposed these methods as increasingly inadequate for modern smart grid requirements, particularly given the growing prevalence of ultra-high-voltage transmission systems spanning remote terrains [
7].
In recent years, the scientific community has pursued two distinct diagnostic paradigms for bolt loosening detection: physics-based mechanistic approaches and data-driven intelligent systems [
8]. Physics-based methodologies exploit fundamental structural dynamics, including acoustoelastic analysis [
9,
10,
11], vibration signature detection [
12,
13,
14], and guided wave propagation [
15,
16,
17]. For instance, Zhou et al. [
12] validated laser ultrasonics for dynamic bolt looseness monitoring under structural loads, and Jiang et al. [
17] experimentally simulated transverse cyclic load-induced loosening in transmission tower bolts. Furthermore, recent structural analyses reveal that even minor bolt slippage significantly amplifies the seismic fragility of tower-line systems [
18], while nonlinear damage progression in critical tower regions exposes compounding risks from undetected loosening [
19]. Despite these advancements, physics-based approaches face critical limitations in field applications, including poor environmental robustness against temperature fluctuations and noise [
16] challenges in adapting to multi-bolt systems, and sensitivity to axial force control uncertainties [
20]. These constraints underscore the need for methodologies that balance mechanistic insights with practical implementation in complex environments.
In contrast, data-driven methods have emerged as a promising alternative, leveraging advancements in machine learning and sensor technology to address complex scenarios. Early innovations integrated neural networks with vibration signal analysis for multi-bolt assessment and computer vision for geometric loosening quantification [
20]. Recent advances demonstrate marked improvements: Yang et al. [
21] achieved weather-robust loosening detection in wind turbine towers via deep learning, while Lu et al. [
22] optimized fault detection using hybrid GA-BP neural networks. Emerging techniques further address unique challenges—Liu et al. [
23] developed attention-augmented wide residual networks for defect identification, and Zhao et al. [
7] correlated bolt tightening forces with tower modal parameters to derive vibration-based looseness indices. Despite progress, critical gaps remain: percussion-based acoustic methods degrade under noise interference, existing solutions lack scalability to full-range tower systems, and real-world variability in hammering forces and structural dynamics remains unaddressed. Notably, staggered two-bolt connections [
24] and experimental analyses of adjustable foundation bolts [
25] highlight the inadequacy of current frameworks to model complex multi-bolt interactions, further emphasizing the need for system-level solutions.
The current research gap lies in the lack of a robust and scalable framework for detecting bolt loosening in large-scale transmission towers under real-world conditions. Existing methods often fail to account for the variability in hammering forces, environmental noise, and the complex structural dynamics of transmission towers. To address these challenges, this paper proposes a novel machine learning-based framework that integrates multi-channel acoustic data and advanced feature extraction techniques. The main contributions of the paper can be summarized as follows:
Robust multi-channel acoustic framework: A comprehensive framework leveraging multi-channel acoustic data is developed to accurately detect bolt loosening across varying heights and environmental conditions;
Advanced feature extraction and adversarial training: Mel-Frequency Cepstral Coefficients (MFCCs) and adversarial training are integrated to mitigate real-world variability, including hammering force inconsistencies and noise interference;
Superior SVM performance with loosening detection: The SVM model achieves 89.93% accuracy and superior height localization (e.g., 96% at 15–20 m), outperforming existing machine learning and physics-based methods in both detection precision and practical applicability.
The remainder of this paper is organized as follows:
Section 2 presents the theoretical background of bolt loosening modeling and acoustic signature analysis.
Section 3 details the proposed machine learning-based framework for bolt loosening detection.
Section 4 describes the experimental setup and data collection process.
Section 5 discusses the results and performance evaluation of the proposed framework. Finally,
Section 6 concludes the paper and outlines future research directions.
3. Machine Learning-Based Framework for Bolt Loosening Detection
This section presents the design of a machine learning-based framework for bolt loosening detection. The framework’s scalability stems from its modular architecture: (1) standardized MFCC features decouple analysis from tower-specific geometries; and (2) adversarial training ensures robustness to variable hammering forces and environmental noise. The details are as follows.
3.1. Feature Extraction and Selection
Since accurate feature extraction is particularly important, this section provides a detailed explanation of the feature extraction method used in this study. This paper adopts Mel-Frequency Cepstral Coefficients (MFCCs), a widely recognized feature representation method for acoustic signals, for the purpose of feature extraction. The MFCC was selected for its auditory-aligned frequency resolution and noise robustness. Pre-emphasis amplifies high-frequency vibration harmonics, while the Mel-scale emphasizes perceptually critical bands. Logarithmic compression and DCT further suppress environmental interference, yielding compact features optimized for discriminative classification. The MFCC framework inherently incorporates feature selection via Mel-scale band prioritization and DCT-based dimensionality reduction, obviating the need for additional selection steps. The extraction process encompasses the following steps:
(1) Pre-Emphasis
The raw acoustic signal is subjected to pre-emphasis to amplify the energy in its high-frequency components. This is typically accomplished using a first-order high-pass filter, defined by the following equation:
where
denotes the original acoustic signal,
is the sample index, and
is the pre-emphasis coefficient, commonly set to 0.97.
(2) Framing and Windowing
The pre-emphasized signal is segmented into short-time frames, and a window function, such as the Hamming window, is applied to each frame. Direct segmentation of a continuous signal may introduce truncation effects and spectral leakage, which windowing mitigates. The Hamming window is expressed as follows:
where
represents the frame length. The windowed signal is then calculated as follows:
(3) Fast Fourier Transform (FFT)
Each windowed frame undergoes a fast Fourier transform (FFT) to convert the time-domain signal into the frequency domain. The resulting acoustic features are complex-valued matrices, but typically, only the magnitude spectrum is retained, as phase information has a limited impact on subsequent processing.
(4) Mel Filter Bank Processing
The frequency-domain magnitude spectrum is processed through a set of Mel filters to emulate the human ear’s nonlinear perception of frequencies. The relationship between Mel frequency and actual frequency is given by the following:
(5) Logarithmic Operation
A logarithmic transformation is applied to the energy spectrum output from the Mel filter bank, enhancing the distinguishability of low-energy components. This step mirrors the human auditory system’s logarithmic sensitivity to sound intensity.
(6) Discrete Cosine Transform (DCT)
The logarithmic Mel spectrum of each frame is subjected to a discrete cosine transform (DCT) to derive the MFCCs. The DCT decorrelates the coefficients and maps high-dimensional features into a lower-dimensional space. As the most significant information is generally concentrated in the first 12 coefficients, practical applications often retain the first 12 to 20 coefficients; in this study, the first 13 coefficients are selected as the final MFCC features. The DCT is formulated as follows:
where
is the output energy of the m-th filter, and
is the k-th MFCC coefficient.
3.2. Machine Learning Model Design
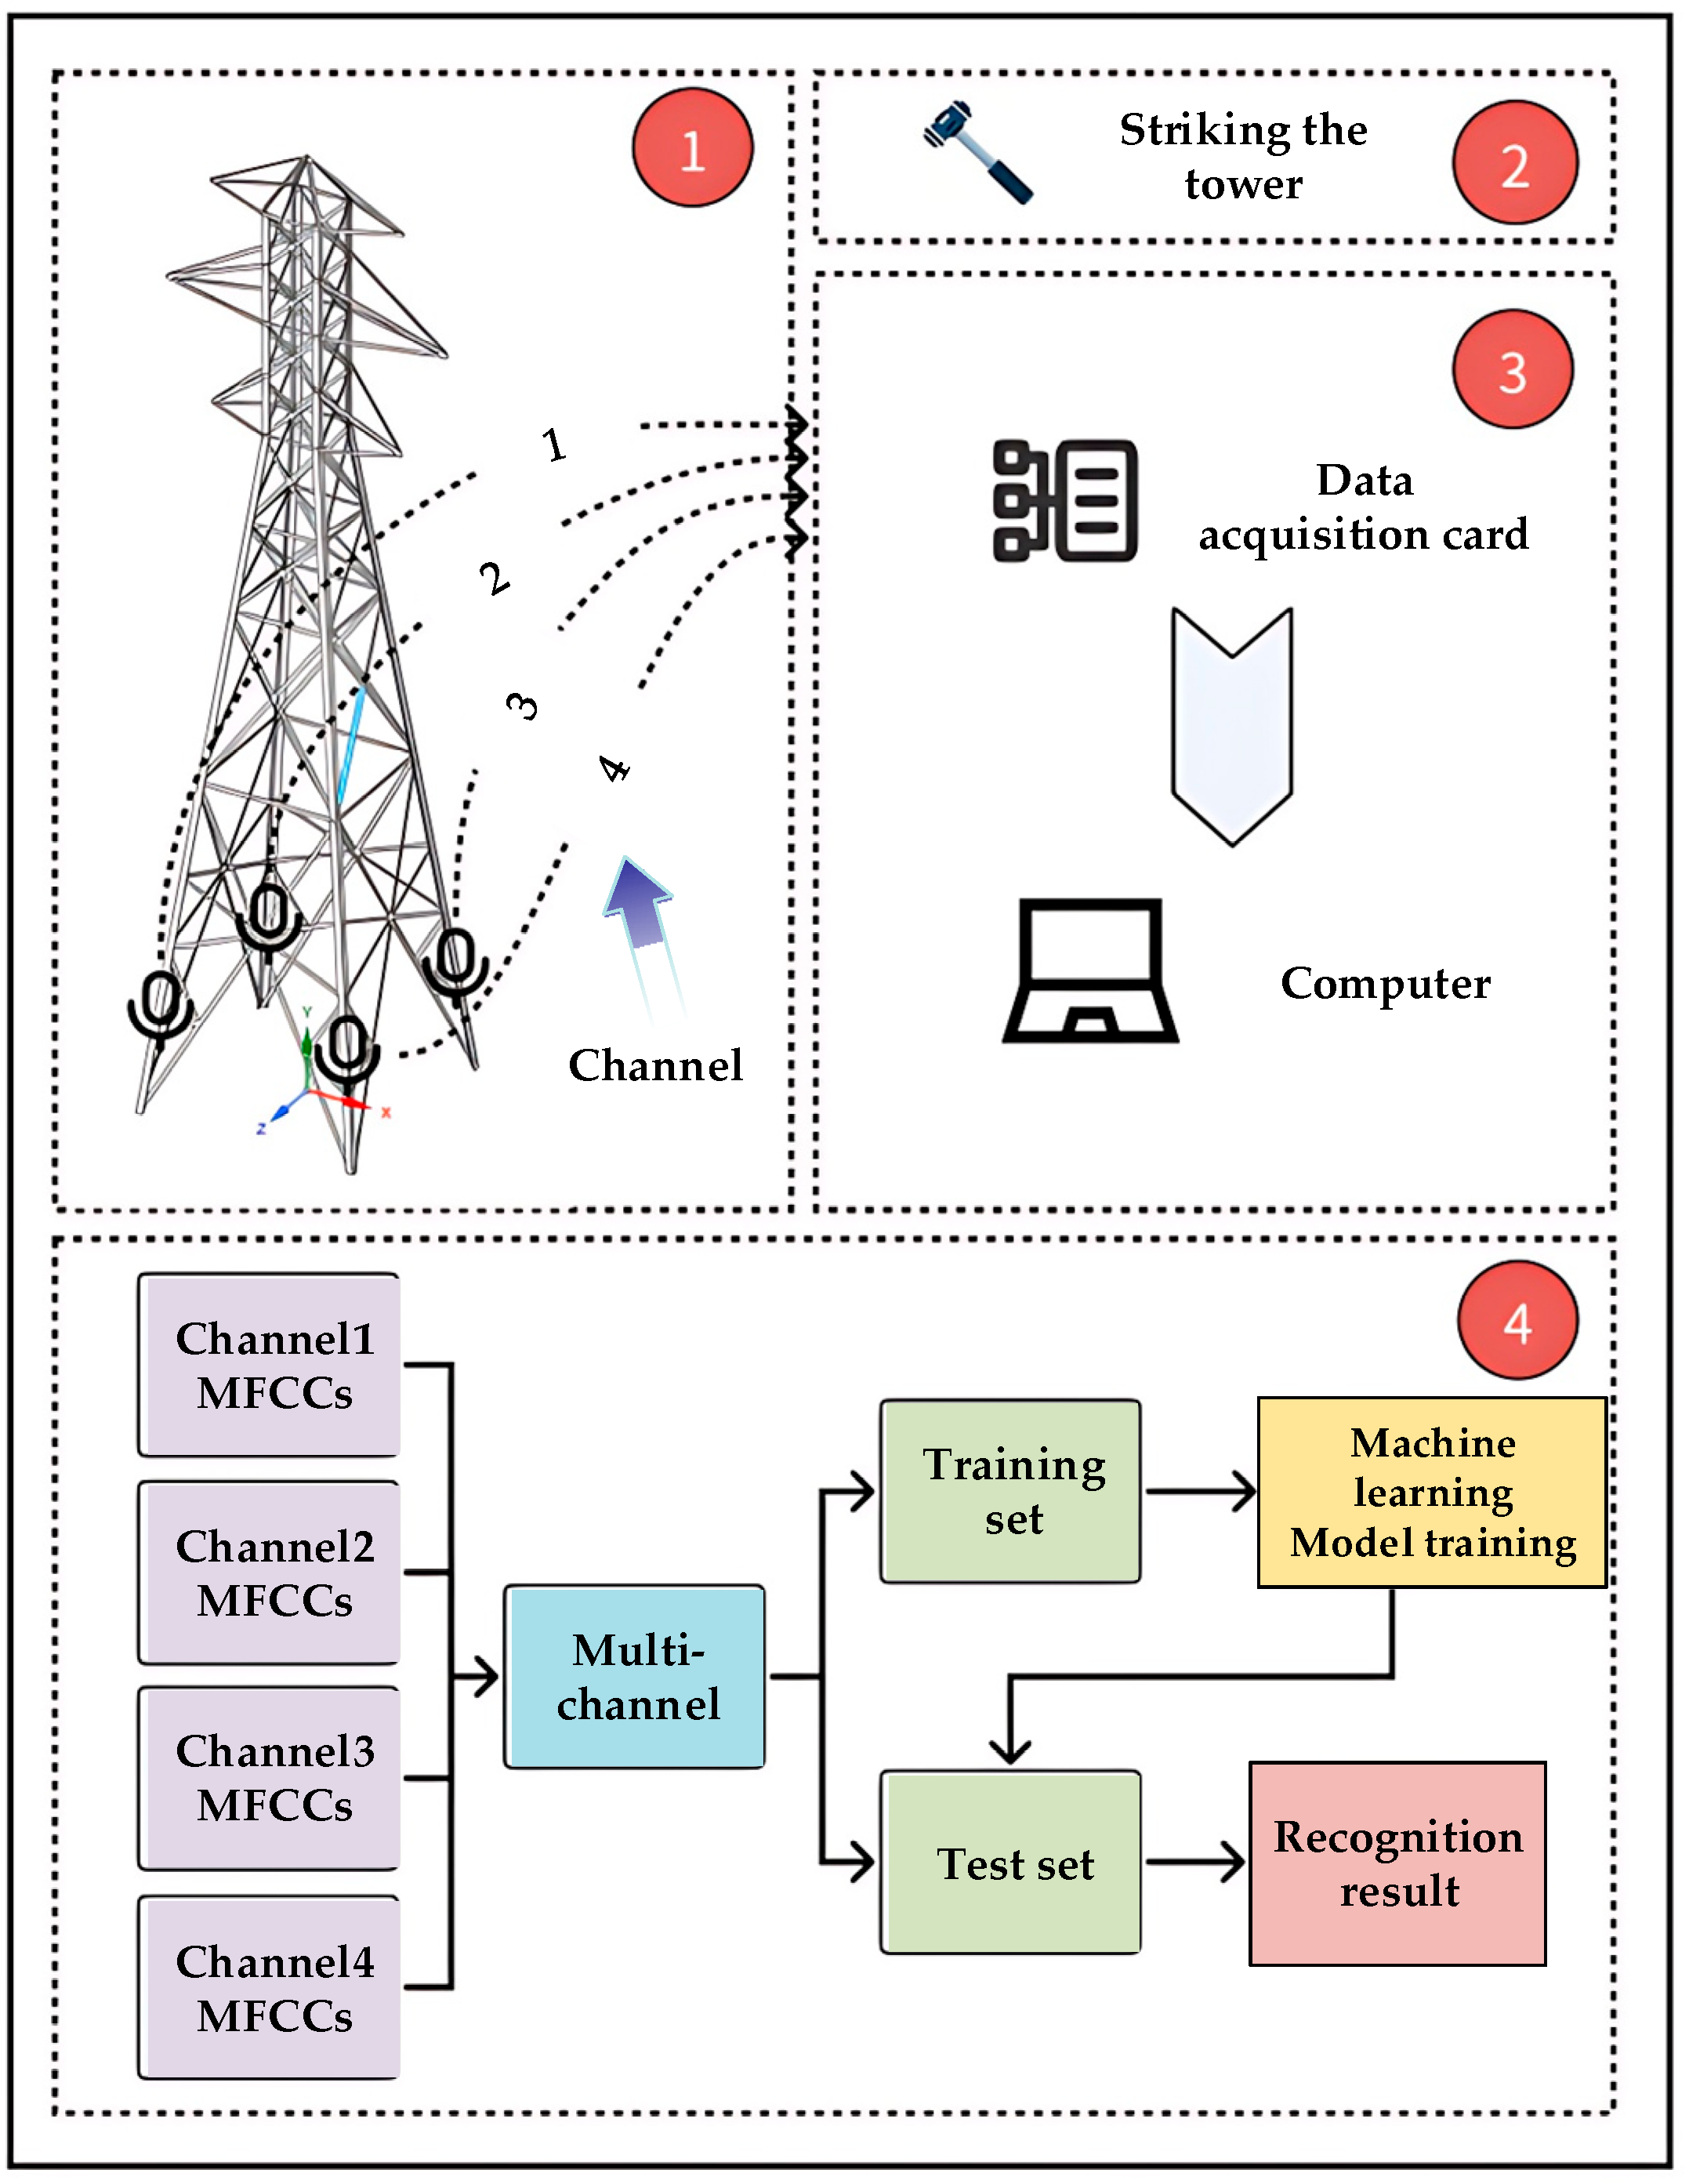
This section introduces the design of the machine learning models employed for detecting bolt loosening in transmission towers, with the core workflow illustrated in
Figure 4. The process begins with the input of tower acoustic data and progresses through a series of steps to deliver recognition results for bolt loosening, comprehensively addressing data preprocessing, feature extraction, model training, and evaluation. A detailed description of this approach follows.
The workflow commences with tower acoustic data, which are audio signals collected from the tower or its surrounding environment, embedding acoustic information indicative of bolt tightening conditions. To ensure data quality, preprocessing involves extracting a 1 s segment immediately following a tapping event, accurately capturing the tower’s instantaneous acoustic response. This carefully chosen time window establishes a solid foundation for subsequent analysis.
During the feature extraction phase, two complementary techniques are utilized to derive key characteristics from the acoustic data segments. First, 1/3 octave band analysis decomposes the audio signal into distinct frequency bands, extracting energy distribution features that reflect the frequency-domain properties of the tower’s vibration. Second, Mel-Frequency Cepstral Coefficients (MFCCs) are computed, leveraging human auditory perception to capture subtle variations in the time–frequency domain. These methods work synergistically—the former emphasizes frequency-domain details, while the latter highlights time–frequency nuances—together forming a robust and comprehensive feature set to support model training.
The extracted features are subsequently split into a training set and a test set. The extracted features are split into training and test sets in an 80:20 ratio, with stratified sampling preserving class distribution integrity. The training set drives model learning, while the test set assesses generalization to unseen data. The framework prioritizes classical machine learning algorithms for their interpretability, computational efficiency, and suitability for real-time edge deployment in resource-limited field environments, while maintaining robust performance on moderate-scale acoustic datasets. To determine the most effective algorithm for bolt loosening recognition, a range of machine learning techniques are explored, including the following: Support Vector Machine (SVM); Decision Tree (DT); K-Nearest Neighbors (KNN); Random Forest (RF); XGBoost. Spanning basic to advanced methodologies, these algorithms enable a thorough investigation of performance in the acoustic recognition task.
Upon completion of training, the models are evaluated on the test set using a standardized setup (Dell (Round Rock, TX, USA): Intel Core i7 CPU, 32 GB RAM, NVIDIA RTX 3060 GPU), with performance metrics such as classification accuracy guiding the selection of the best-performing model. This optimal model is then deployed on real-world data to validate its capability to identify bolt loosening states in practical settings. The entire process—from preprocessing to application—is seamlessly interconnected, ensuring both accuracy and reliability through the integration of feature extraction and multi-model assessment.
In summary, the workflow depicted in
Figure 4 integrates acoustic feature analysis with machine learning techniques to provide an efficient and dependable solution for detecting bolt loosening in transmission towers. From the precise extraction of post-tapping data, through the synergistic application of 1/3 octave bands and MFCCs, to the comprehensive evaluation of diverse algorithms, this approach achieves accurate analysis of acoustic data, offering valuable support for condition monitoring in engineering practice.
4. Experimental Setup and Data Collection
This section provides an in-depth description of the field experimental platform designed to validate the effectiveness of the proposed method. The platform is engineered to systematically and comprehensively collect experimental data, ensuring a thorough assessment of the method’s performance under controlled conditions.
4.1. Field Experiments
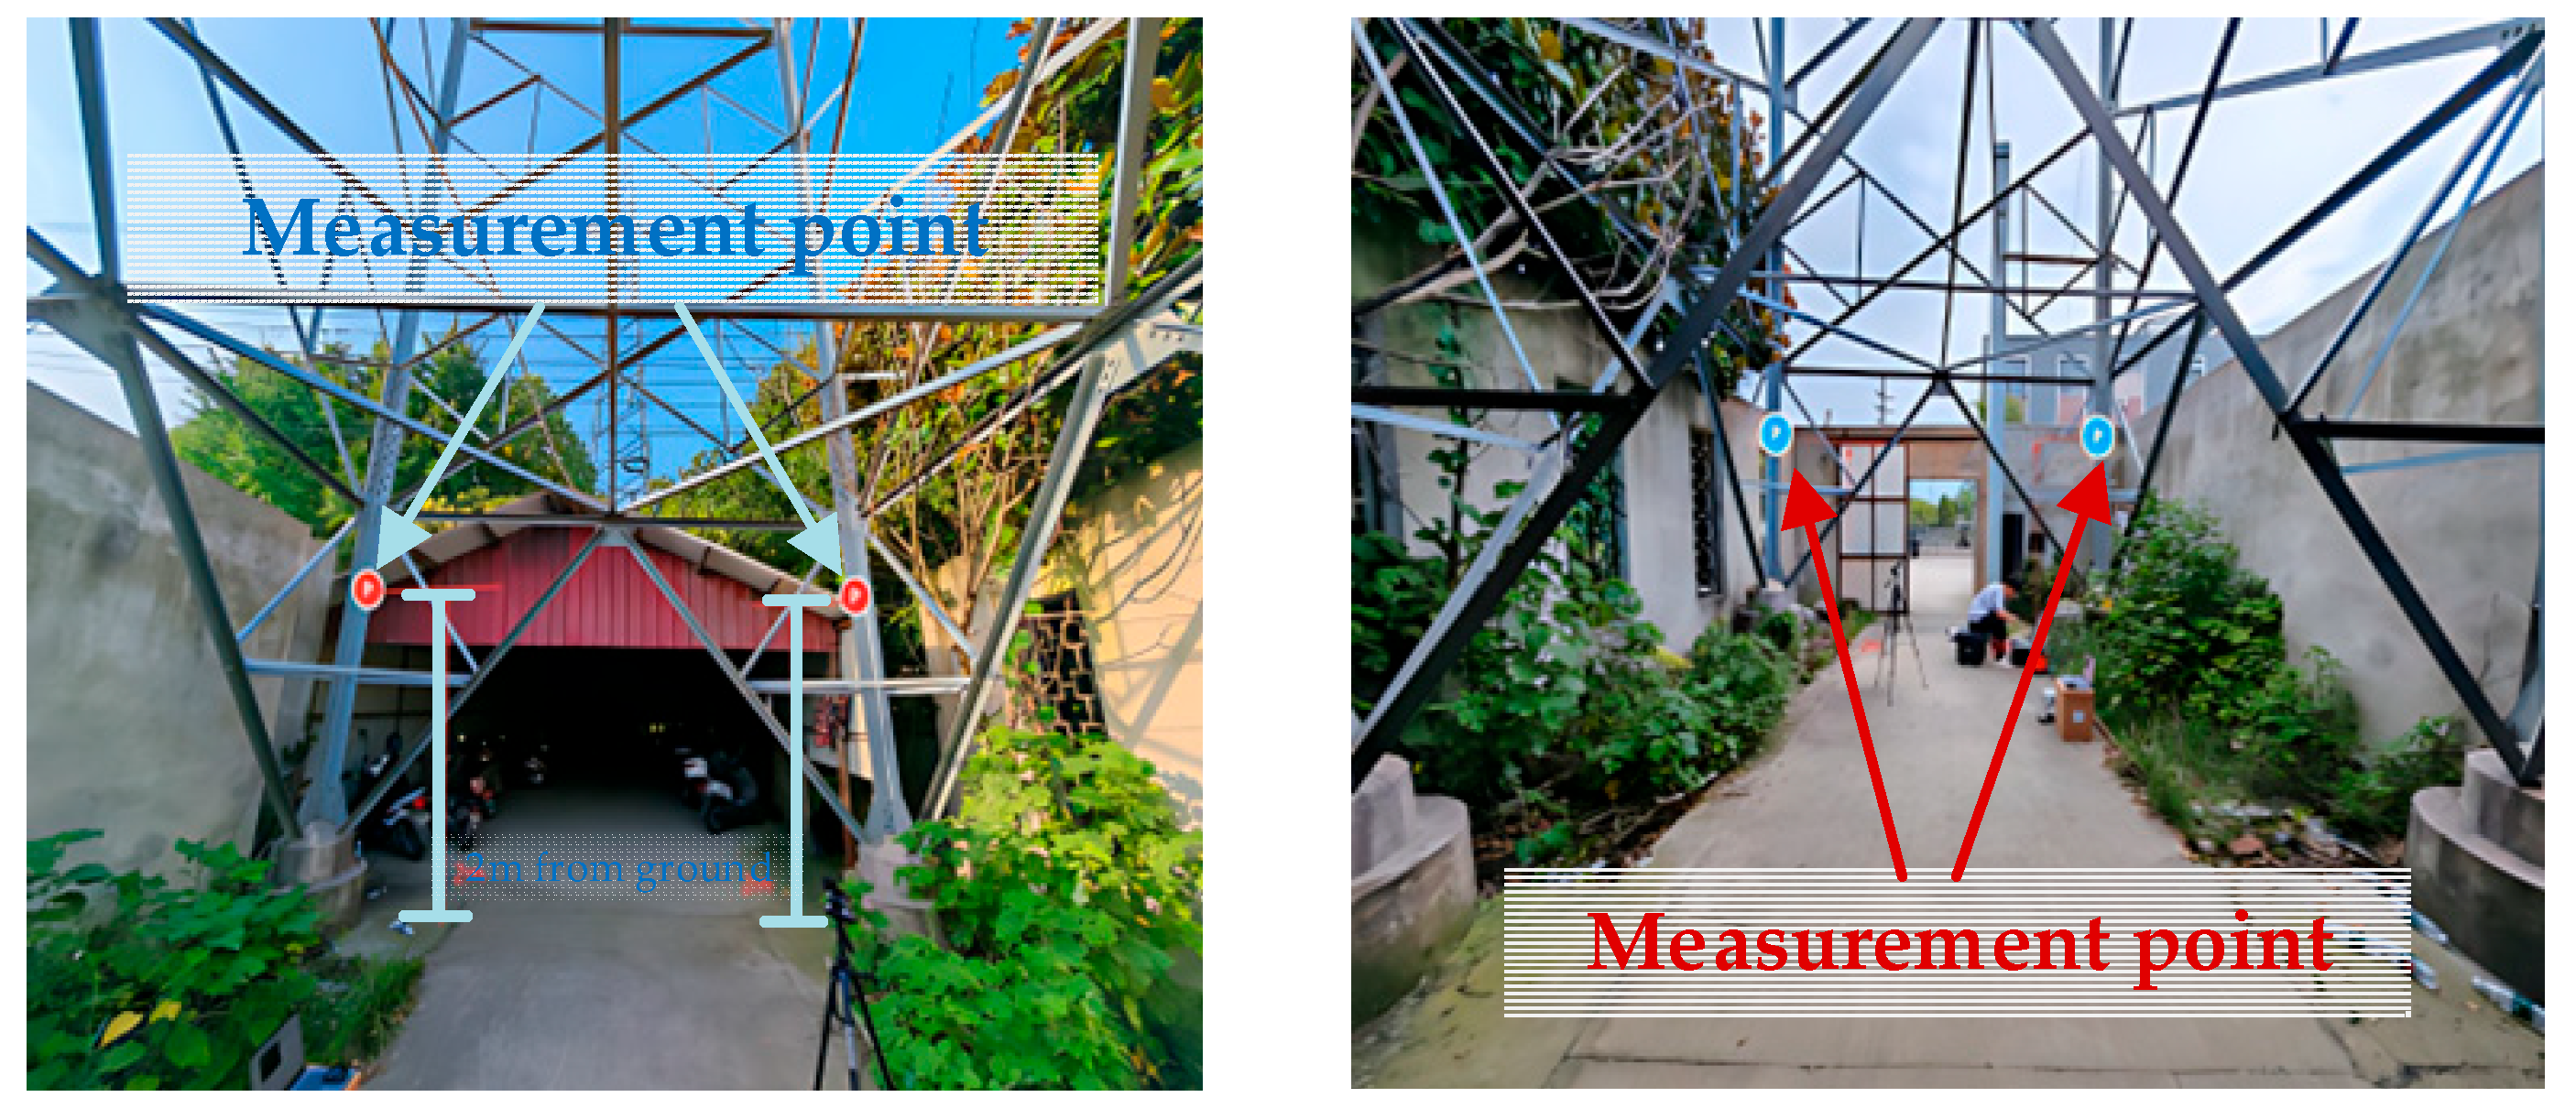
Multiple 110 kV and 220 kV transmission towers on operational power lines were selected to conduct acoustic testing experiments for detecting loose bolts. The 110 kV transmission tower has a height of 30 m and is evenly divided into four sections, encompassing the tower leg, tower body section 1, tower body section 2, and tower body section 3. Similarly, the 220 kV transmission tower, with a height of 36 m, is also divided into four sections, including the tower leg, tower body section 1, tower body section 2, and tower body section 3. Taking the first body section as an example, the measurement points are illustrated in
Figure 3, where points 1 and 2 are positioned on the main vertical members of the tower, while points 3 and 4 are located on the bracing members.
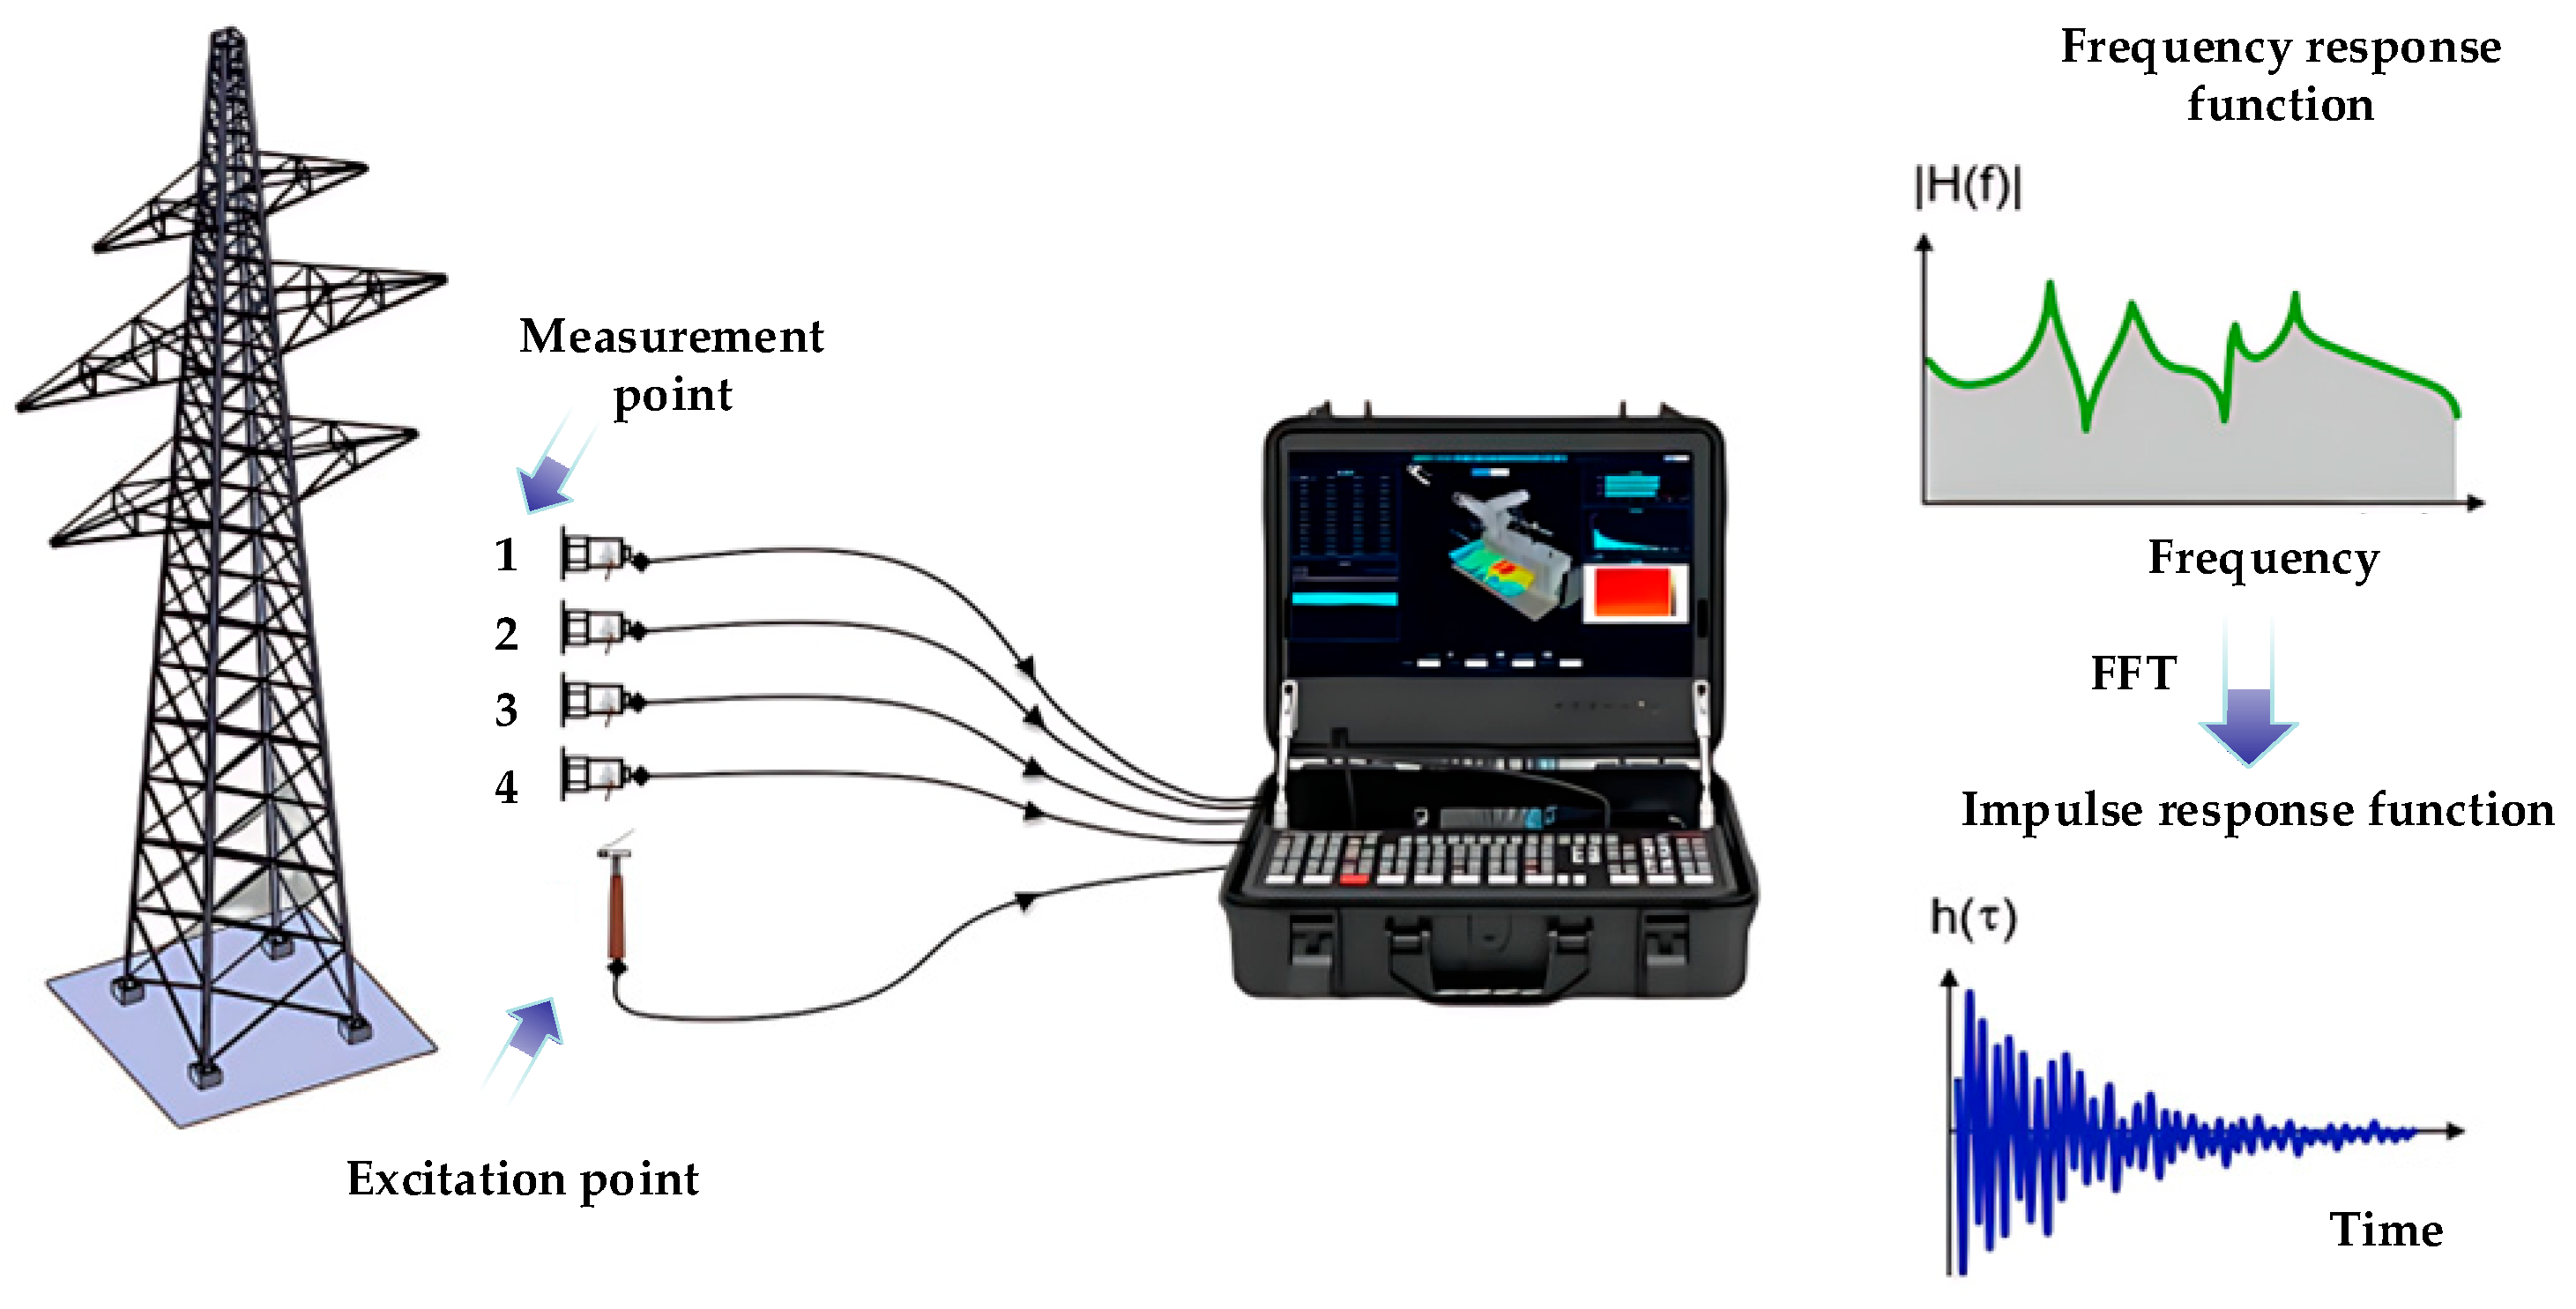
The testing apparatus includes acoustic sensors with a sensitivity of 50 mV/Pa and a measurement range of 30 dB to 130 dB, along with a host device operating at a sampling frequency of 60 kHz, among other components. The experimental configuration, as illustrated in
Figure 5, comprises a systematic arrangement of high-precision acoustic sensors mounted on critical structural components of the transmission tower. A calibrated pulse force hammer, equipped with an integrated force sensor, is utilized to deliver controlled excitation by sequentially striking predefined points on both the bracing and vertical members. Upon impact, the generated acoustic waves propagate through the tower structure and are captured by the sensors as time-domain signals. These signals are then transmitted via a fiber-optic network to a centralized host device operating at a sampling frequency of 60 kHz, ensuring minimal signal attenuation and electromagnetic interference.
Due to significant environmental interference, such as wind noise and other factors affecting the acoustic sensors, this study does not consider height localization and focuses solely on distinguishing between two states: loose or normal bolts on the transmission tower. In general, data were collected from both tower types with bolts loosened at single or multiple heights of 5 m, 10 m, 15 m, and 20 m under various weather conditions. The experimental data were segmented into 2 s intervals corresponding to each strike and split into training and testing sets in an 8:2 ratio. The AT-MLP model was trained with a batch size of 64 and a learning rate of 0.001.
As depicted in
Figure 6, the construction of the experimental platform and the implementation of the experiment are illustrated, detailing the entire process from the input of acoustic response data obtained by tapping the tower to the output of final recognition results. This process consists of four primary steps:
Step 1: Deployment of acoustic sensors. High-precision acoustic sensors are strategically positioned on the transmission tower to capture vibration-induced sound waves.
Step 2: Tapping the tower. A controlled tapping action is performed using a pulse force hammer to generate acoustic responses.
Step 3: Acoustic signal collection. Multi-channel acoustic signals are recorded from the sensors during the tapping events.
Step 4: Bolt loosening identification. The collected signals are processed to detect bolt loosening states.
For the acquired four-channel acoustic signals, 1 s data slices following each tap are extracted to focus on the immediate acoustic response. From these data slices, Mel-Frequency Cepstral Coefficients (MFCCs) are computed as the primary features. These MFCCs are subsequently combined to form multi-channel MFCC feature vectors, creating a robust representation of the acoustic data. The resulting feature vector dataset is then partitioned into two subsets: a training set and a testing set.
Figure 6.
Identification of loose transmission tower bolts.
Figure 6.
Identification of loose transmission tower bolts.
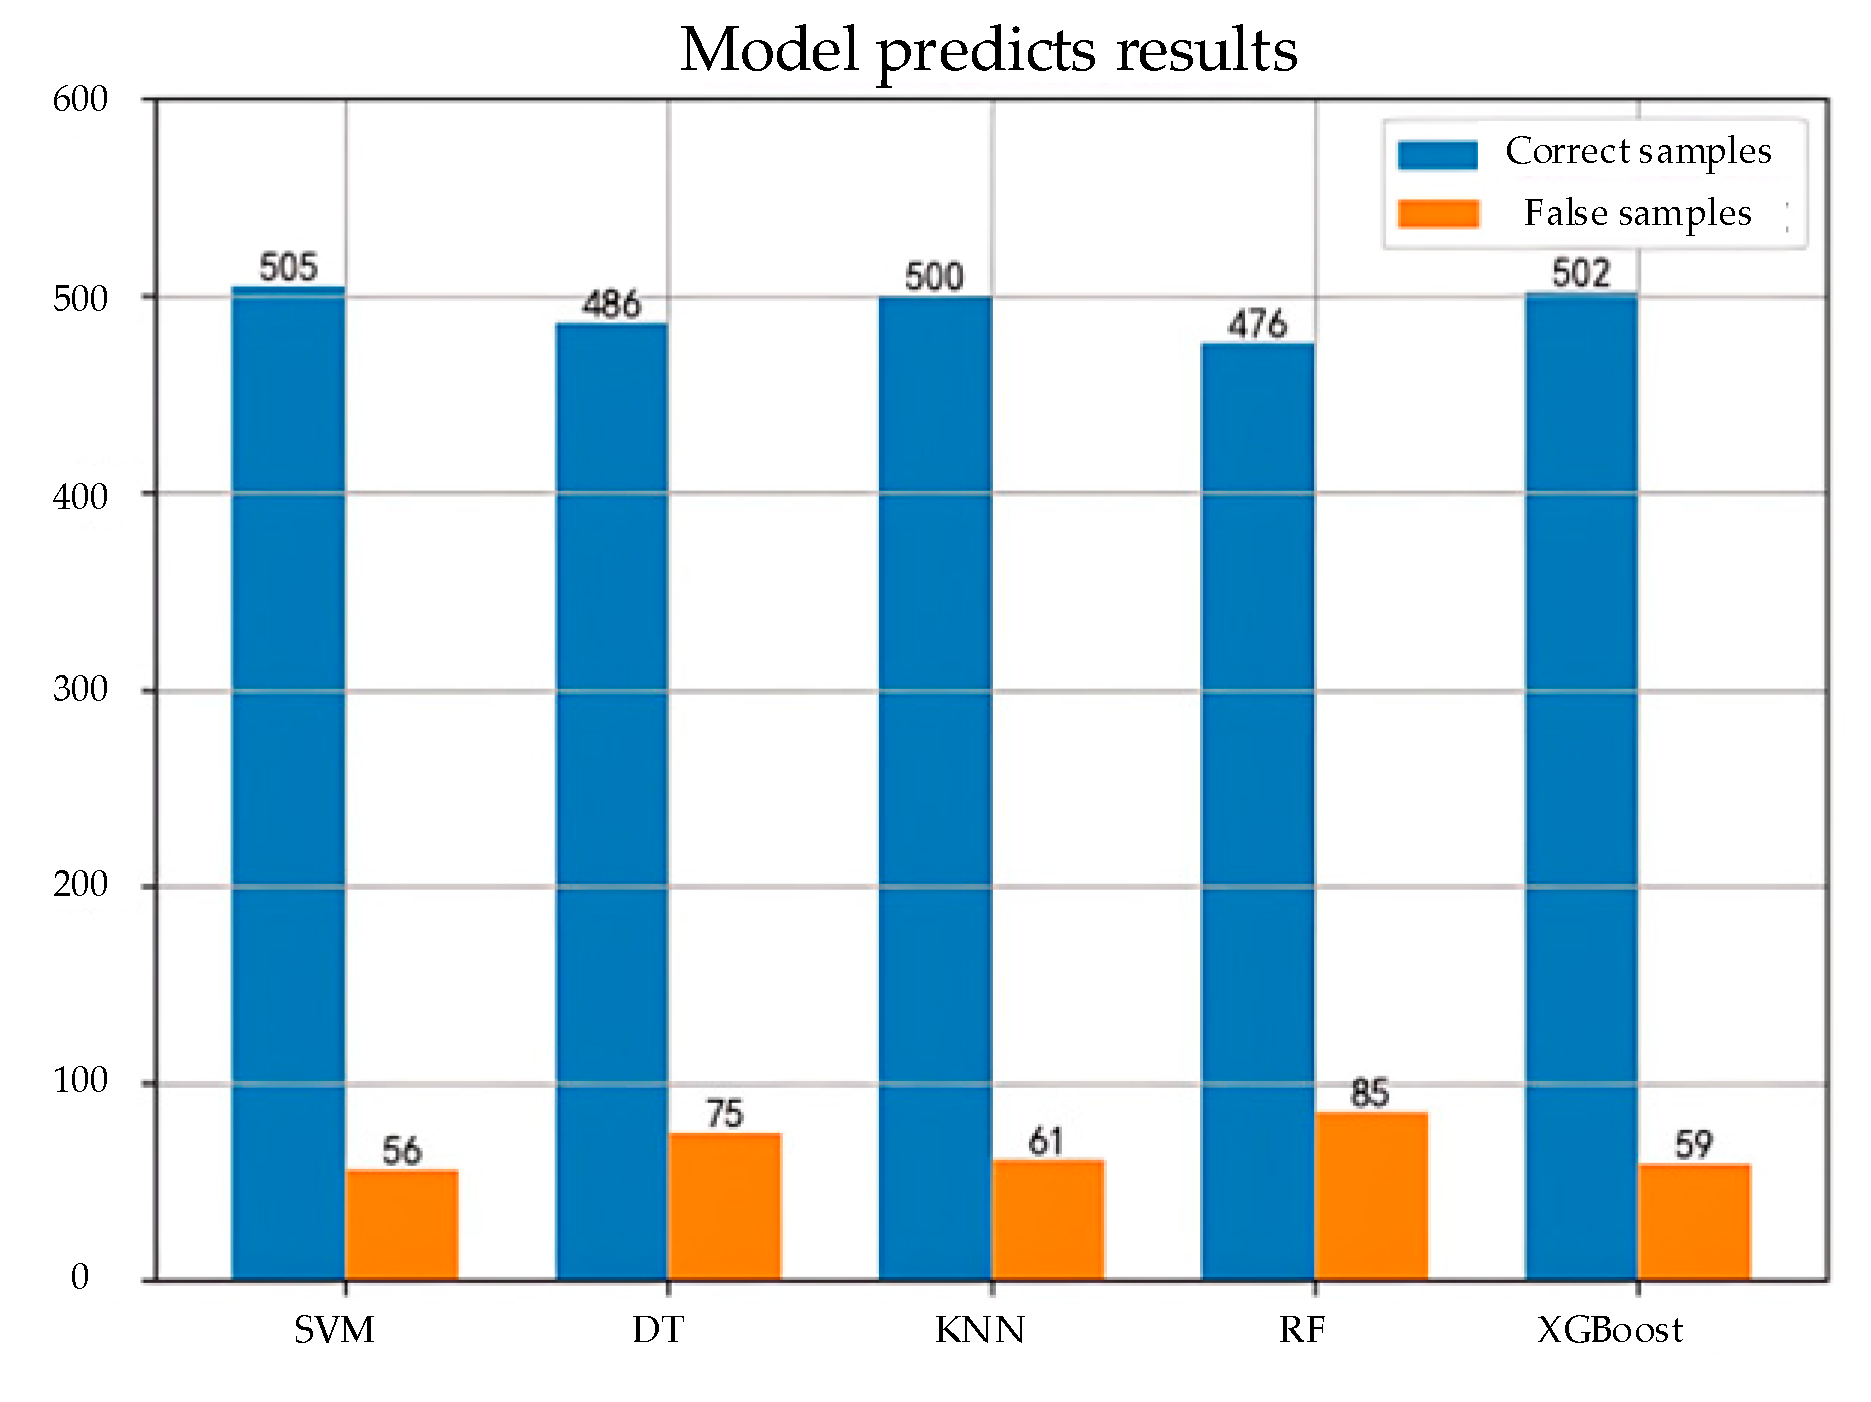
The training set is employed to develop several machine learning models, including the following: SVM, DT, KNN, RF, and XGBoost. These algorithms were selected based on their interpretability, robustness to noise in acoustic signals, and computational efficiency for real-time edge deployment [
21]. Deep learning models (e.g., CNN, RNN) were excluded due to dataset size limitations and the prioritization of lightweight frameworks for field applications. The testing set is utilized to evaluate the performance of these models. By comparing their effectiveness on the testing set—assessed through metrics such as accuracy, precision, recall, and F1 score—the optimal model is selected. The chosen model’s capability to accurately identify bolt loosening is then validated, ensuring its practical applicability.
This structured approach, from sensor deployment to model evaluation, provides a comprehensive framework for detecting bolt loosening in transmission towers using acoustic signal analysis and machine learning techniques.
4.2. Data Collection
Given the unique structural characteristics and height of transmission towers, ensuring operational safety and convenience during measurements is of utmost importance. After careful consideration, the base of the tower was identified as the optimal location for both excitation and data collection. In the actual detection process, a pulse force hammer was selected to apply pulse excitation to the transmission tower, ensuring stability and reliability of the excitation. This hammer is equipped with a force sensor featuring a range of 30 kN and a sensitivity of 0.167 mV/N, effectively meeting the vibration excitation requirements for localized regions of the tower. To precisely capture the acoustic response, high-precision acoustic sensors were employed, with a frequency range of 20–20,000 Hz and a sensitivity of 50 mV/Pa. The on-site measurement layout, as depicted in
Figure 7, features four acoustic sensors symmetrically mounted on the four angle steels of the transmission tower at standardized height intervals. To ensure stability and reproducibility, the sensors were secured to the steel surfaces using magnetic mounts, which provided firm adhesion while allowing rapid repositioning. During installation, a laser leveling system ensured horizontal alignment across all sensors, with positional deviations maintained below 1 mm. This approach minimized movement-induced data errors during wind or mechanical vibrations.
To comprehensively obtain data reflecting bolt loosening at various heights, the bolts were artificially loosened and tightened at different elevations on the tower. A force hammer was then used to perform regular tapping at the tower base. Throughout this procedure, experiments involving the loosening and tightening of bolts were repeated, and the resulting data were collected and labeled accordingly. Data collection faced practical limitations, including height restrictions (0–20 m) due to safety protocols and sparse samples for multi-height loosening categories (e.g., 5–10 m and 10–15 m). While adversarial training improved robustness to ambient noise, extreme weather conditions (e.g., ice loads) remain unaddressed and warrant future study. For a 36 m-high transmission tower, the actual testing environment covered heights up to 20 m, with the 0–20 m interval evenly divided into four segments: 0–5 m (tower leg), 5–10 m (tower body section 1), 10–15 m (tower body section 2), and 15–20 m (tower body section 3). This systematic data collection and labeling approach provides reliable support for subsequent machine learning-based bolt loosening detection.
This study employs a dataset encompassing various scenarios of bolt loosening at different heights for experimental analysis. The dataset comprises acoustic recordings from field experiments on 110 kV and 220 kV transmission towers. Each strike generated 25 s signals (60 kHz sampling), segmented into 2 s clips for analysis. The data span 16 categories (normal + 15 loosening combinations) across four height intervals.
Figure 8 illustrates a representative 25 s waveform from a tightened bolt, emphasizing the transient response characteristics used for feature extraction. Then, the dataset is categorized into four detection intervals based on tower height: 0–5 m, 5–10 m, 10–15 m, and 15–20 m. A total of 16 classification categories are defined, including normal conditions, bolt loosening at a single height, and bolt loosening across multiple heights.
Figure 8 provides a representative example of acoustic signals captured during experiments. The plot displays a 25 s waveform from a strike on a tightened bolt, highlighting the transient response amplitude decay and harmonic frequency components. All data are randomly split into training and testing sets in an 8:2 ratio. The detailed data have been presented earlier and will not be repeated here.

