1. Introductory
Drilling and completion condition identification is a key link in petroleum engineering operations, and its goal is to analyze the data collected by multiple sensors during the drilling and completion process to determine the current condition status and provide a basis for operation optimization and safety assurance [
1]. Accurate condition identification can not only improve the operational efficiency and reduce non-productive time but also effectively reduce the safety risks and operational costs. However, drilling and completion condition identification faces multiple challenges, such as multi-sensor data complexity, high noise interference, and dynamic condition switching, and traditional rule-based or statistical methods can hardly meet the demands of modern industrial operations [
2].
In the traditional identification of drilling and completion conditions, methods based on empirical rules and signal analysis dominate. For example, Yin et al. (2017) used formation pressure migration algorithms and fuzzy mathematical theory to predict drilling risks [
3], and Li et al. (2023) combined quantitative trends and rule bases to identify working conditions [
4]. However, such methods are poorly adapted to complex dynamic data, have poor real-time performance, rely on a priori knowledge, and are unable to deal with the nonlinear characteristics of multi-dimensional sensor data. With the rise of data-driven methods, traditional machine learning algorithms such as SVM, RF, and KNN are used for drilling data classification [
5], which improve the performance by designing artificial features (e.g., mean, variance). For example, Sun et al. (2019) used SVM to identify drilling conditions in real time. However, SVM’s performance is limited when dealing with complex large-scale and nonlinear data, which hinders its development [
6].
Moreover, there are obvious gaps in the traditional methods. On the one hand, the feature extraction process relies on manual design, which requires considerable expertise and is unable to comprehensively capture complex and variable working conditions. On the other hand, traditional machine learning models perform poorly when dealing with high-dimensional, nonlinear data and have limited generalization capabilities. In recent years, deep learning has provided new solutions for work condition recognition, and its automatic feature learning capability is suitable for processing multi-dimensional sensor data and time series signals. Some studies have used convolutional neural networks for drilling data analysis to extract the spatial features of multi-sensor data. For example, Hu et al. (2022) designed a multilayer convolutional structure based on CNNs to identify the safety risks of gas drilling wells and improve the prediction accuracy [
7]; Xia et al. (2023) optimized the CNN structure by combining it with an RBF network to improve the classification accuracy of the transition phase of gas drilling [
8]. Long short-term memory networks have significant advantages in time series modeling, and Ji et al. (2022) used advanced LSTM methods to predict drilling footage and improve the prediction accuracy [
9,
10]. Graph neural networks are used to deal with multi-sensor data correlation due to the advantage of modeling complex relationships among nodes. An example is the graph convolutional network proposed by Kipf and Welling (2016) for multi-sensor data fusion and correlation modeling [
11]. However, it is difficult for a single model to fully capture the complexity of drilling data, and some studies focus on model combination strategies. For example, Sahu et al. (2024) proposed a hybrid CNN-LSTM model for rolling bearing fault diagnosis to identify complex spatiotemporal patterns [
12]; Bai et al. combined LSTM and CBT networks to predict drilling footage and optimize the prediction capacity, which shows potential in complex drilling environments [
13].
In the field of data trend prediction, the CNN-LSTM model shows good performance. However, in the area of classification tasks, there is still room for improvement. In the existing related research, the classification scenarios handled by the CNN-LSTM model are limited. However, this study involves the more complicated classification of working conditions, in which case the model underperforms.
After analyzing the experimental results, we speculate that the CNN layer used to extract data features is deficient in deeply mining the connections between various data. Taking the actual drilling operation as an example, there are complex interactions among parameters such as the bit depth, drilling pressure, and torque, and the CNN-LSTM model is unable to effectively capture this information, resulting in an incomplete understanding of the working conditions, which ultimately directly affects the recognition accuracy.
In view of this, we consider introducing a method that is capable of handling complex and strongly correlated data in the model. Graph neural networks (GNN) have a unique advantage in handling non-Euclidean spatial data. They construct a sensor correlation graph by considering individual sensors as the nodes of a graph and interactions between sensor data as edges. With the help of graph convolution operations, a GNN is able to aggregate the features of nodes and their neighbors and deeply explore the nonlinear dependencies between sensors, such as the dynamic coupling between the drilling pressure and bit depth. This not only provides richer and more representative features for the model and significantly enhances the feature expression ability of the model, but also enables the model to better capture the synergistic changes in sensor data under complex working conditions.
Compared with LSTM or Transformer models that only consider the time-dependent relationship, the CNN-GNN-LSTM model incorporating a GNN can understand the interaction patterns between different sensors in an in-depth way, so as to distinguish different working conditions more accurately and reduce the occurrence of misjudgment. This greatly improves the recognition accuracy and robustness of the model under complex working conditions and enables it to better adapt to the complex and changing working conditions in the drilling and completion process.
2. Data Description
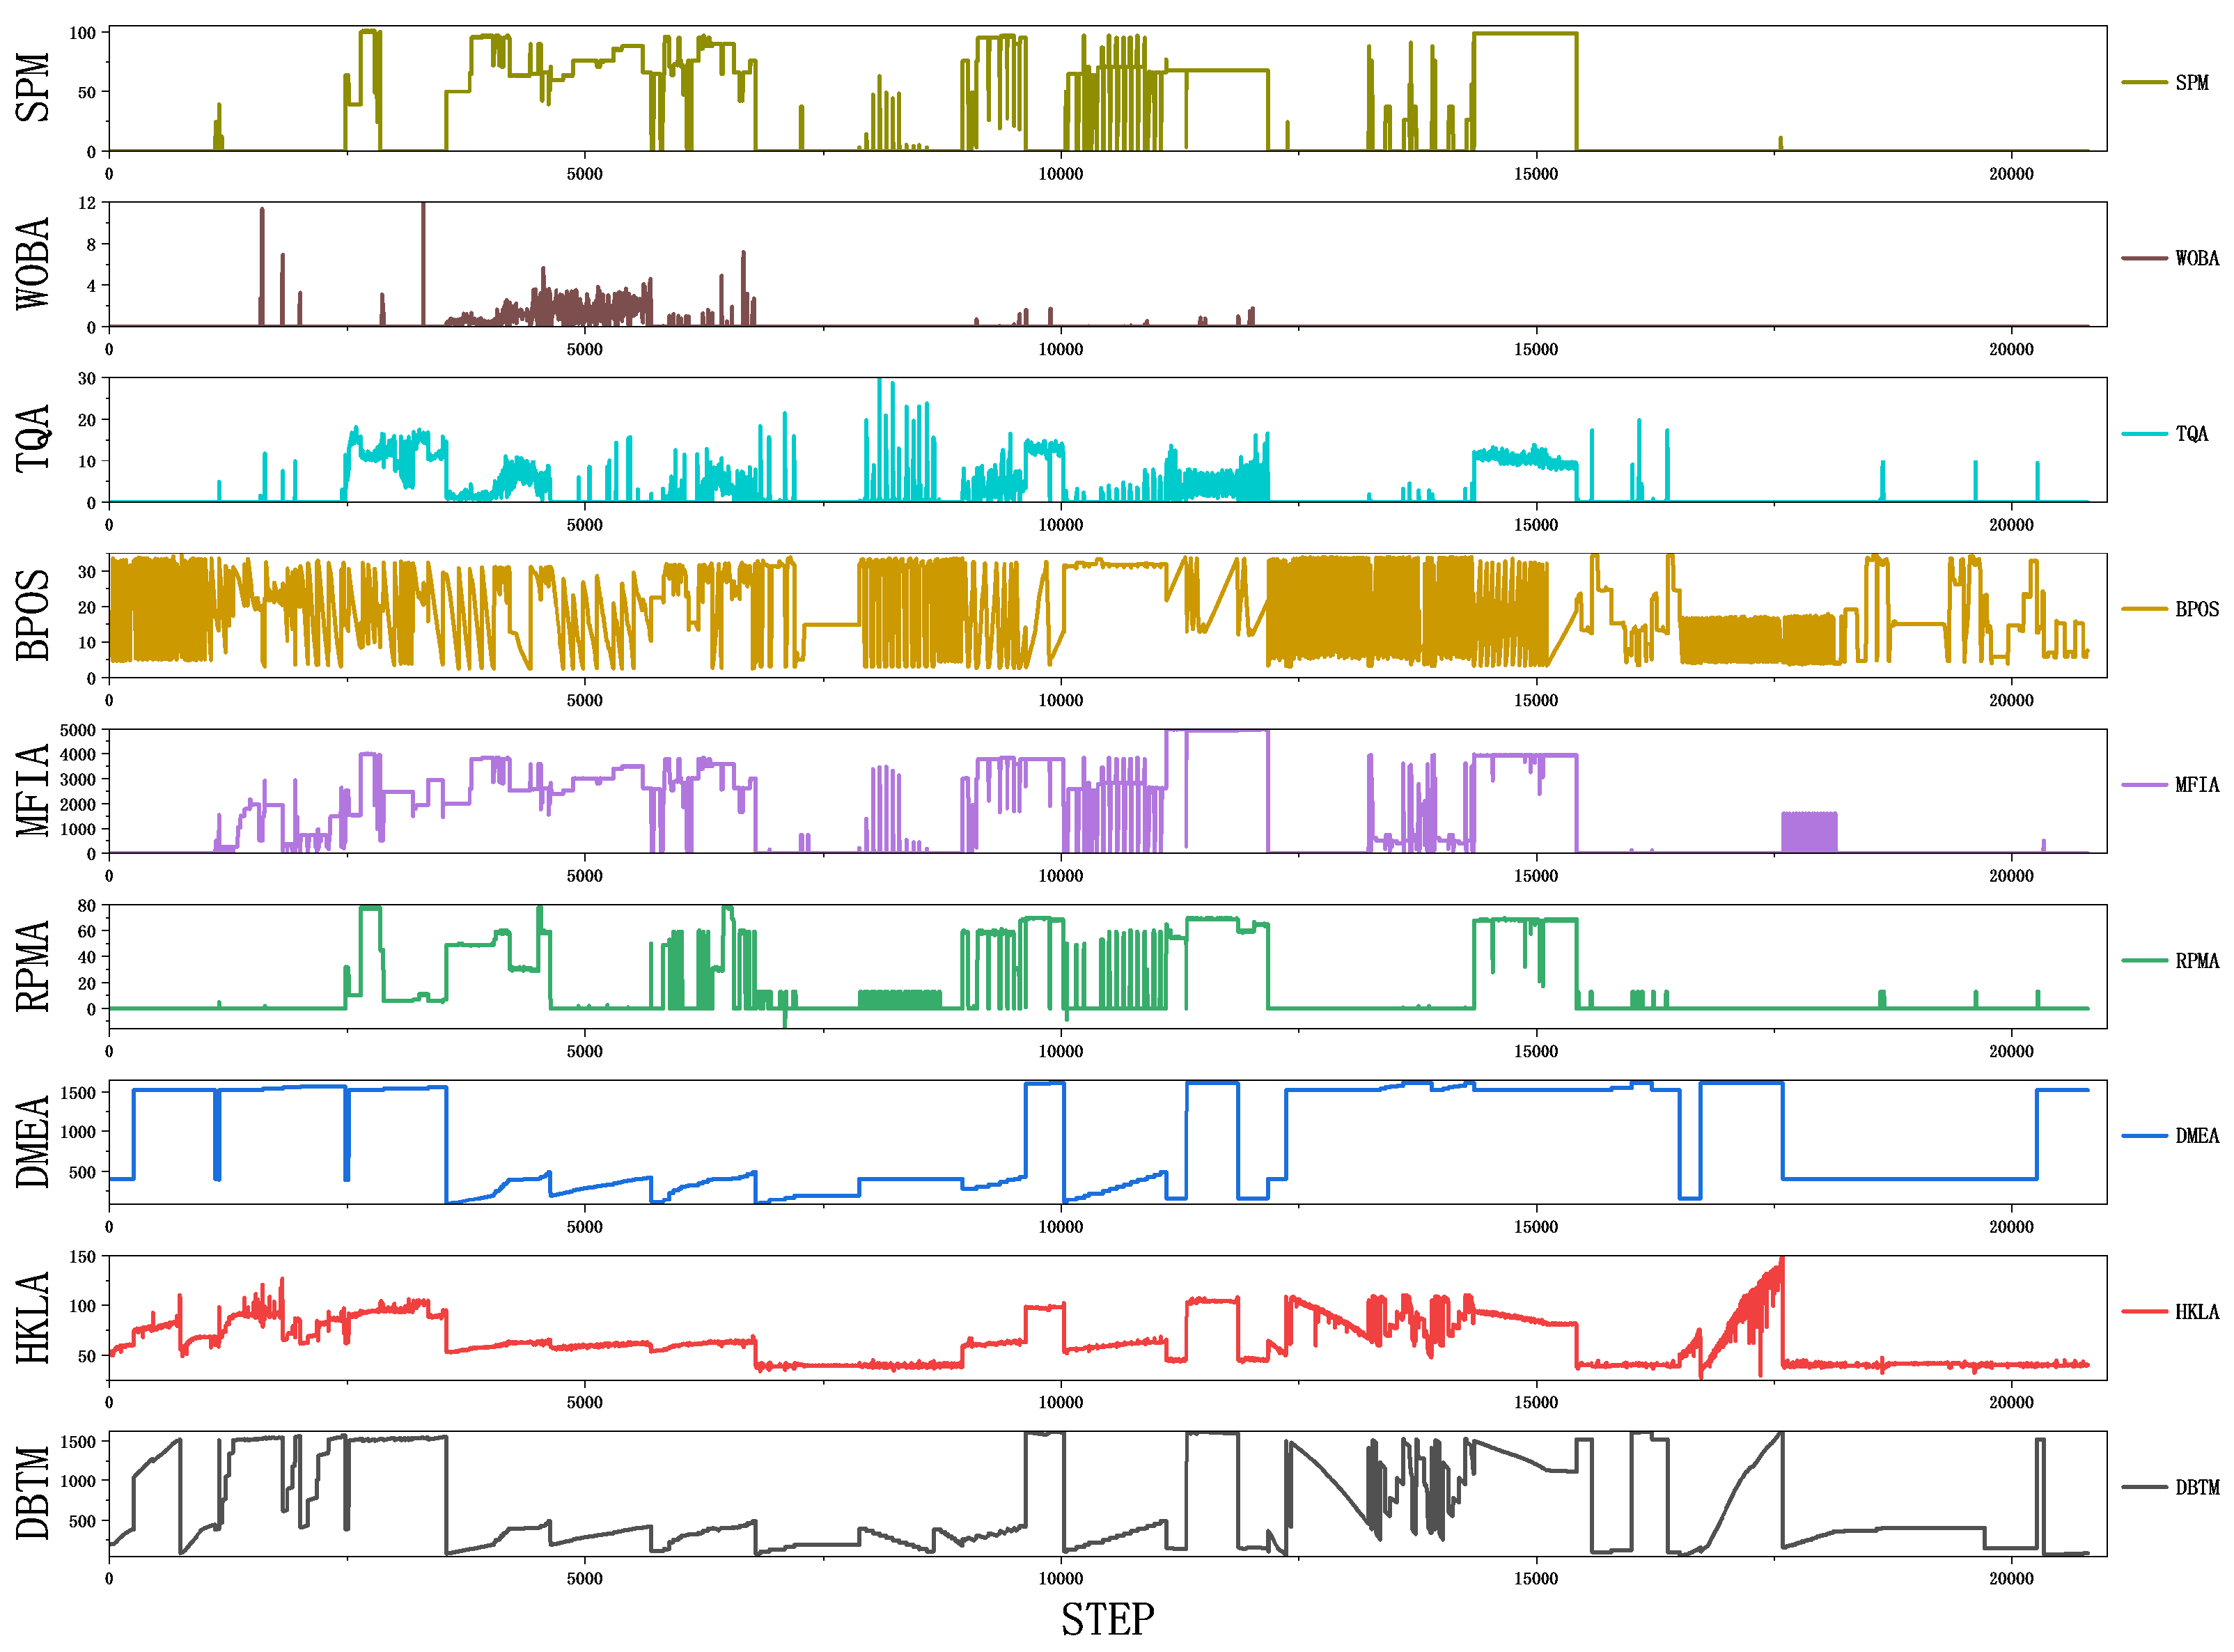
The data set of this study is derived from real-time information collected by various types of sensors at the operation site. It comprehensively covers all kinds of dynamic change information in the operation process and has proprietary attributes. Specifically, the data used in this study come from real-time monitoring data collected by multi-sensor equipment during drilling and completion operations. The total number of data samples is about 20,000, and, in order to ensure the comprehensiveness of the study and a balance in model training, the data of each working condition are controlled within 1000–1100, and we try to maintain a balanced distribution. Each data sample consists of 9 sensor features and 1 condition label. Sensor features record key operational parameters, including but not limited to the bit depth, torque, drilling pressure, etc. Condition labels represent the specific status of the corresponding operation, which are carefully categorized into 19 categories based on the operational characteristics and actual situation.
In analyzing the relationship between the data features, we found that there are different degrees of correlation between the data features of each sensor during the drilling process. There is a strong positive correlation between the depth of the drill bit (DBTM) and the depth of the measured well (DMEA), indicating that, as the drilling depth increases, the measured well depth also changes synchronously, reflecting the consistency of the drilling progress. A strong positive correlation is also shown between the rotary speed (RPMA) and big hook height (BPOS), indicating that a change in rotary speed is closely related to the big hook height, which may reflect the interplay between the rig loading and operational status. The torque (TQA) and drilling pressure (WOBA) also show a strong positive correlation, and this relationship indicates that an increase in drilling pressure is usually accompanied by an increase in torque, reflecting the connection between the nature of the formation and the drilling resistance.
In order to avoid overfitting, all types of working condition data are balanced in the selection process, so as to avoid the dominance of a certain type of feature data and to enable the model to comprehensively learn the features of different working conditions. In the data preprocessing stage, taking into account the differences in the measurement units and scales of different sensors, in order to eliminate the influence of feature scales, the feature matrix
is standardized [
14]. Thus, we map the data to the same scale, avoiding the dominance of certain features due to their large values in the training of the model and ensuring that each feature plays a reasonable role in the model, improving the stability of model training. Thus, we ensure that each feature can play a reasonable role in the model and improve the stability and accuracy of model training (
Table 1).
Due to the obvious time correlation of drilling and completion conditions, in order to capture the short-term dynamic features, the sliding window technique is used to segment the time series data. This not only extracts local features but also increases the diversity of the data, effectively reduces the risk of overfitting, and improves the adaptability of the model. When choosing the window size and sliding step, it is necessary to consider various factors. In this study, the selection of the window size is based on the analysis of the frequency and characteristics of the data changes during the drilling and completion process. After careful consideration, the selected window size not only ensures that the length of the collected data is sufficient to capture the change rule of the data, avoiding the data being too short and unable to effectively reflect the data characteristics, but also prevents the window from being too long, thus avoiding the problem of reducing the quality of the data due to the inclusion of too much redundant information, ensuring that the subsequent model can accurately learn the data’s short-term dynamic patterns. We traverse the original data to generate multiple time windows, using each window as a training sample (
Figure 1).
3. Work Condition Recognition Method Based on CNN-GNN-LSTM Model
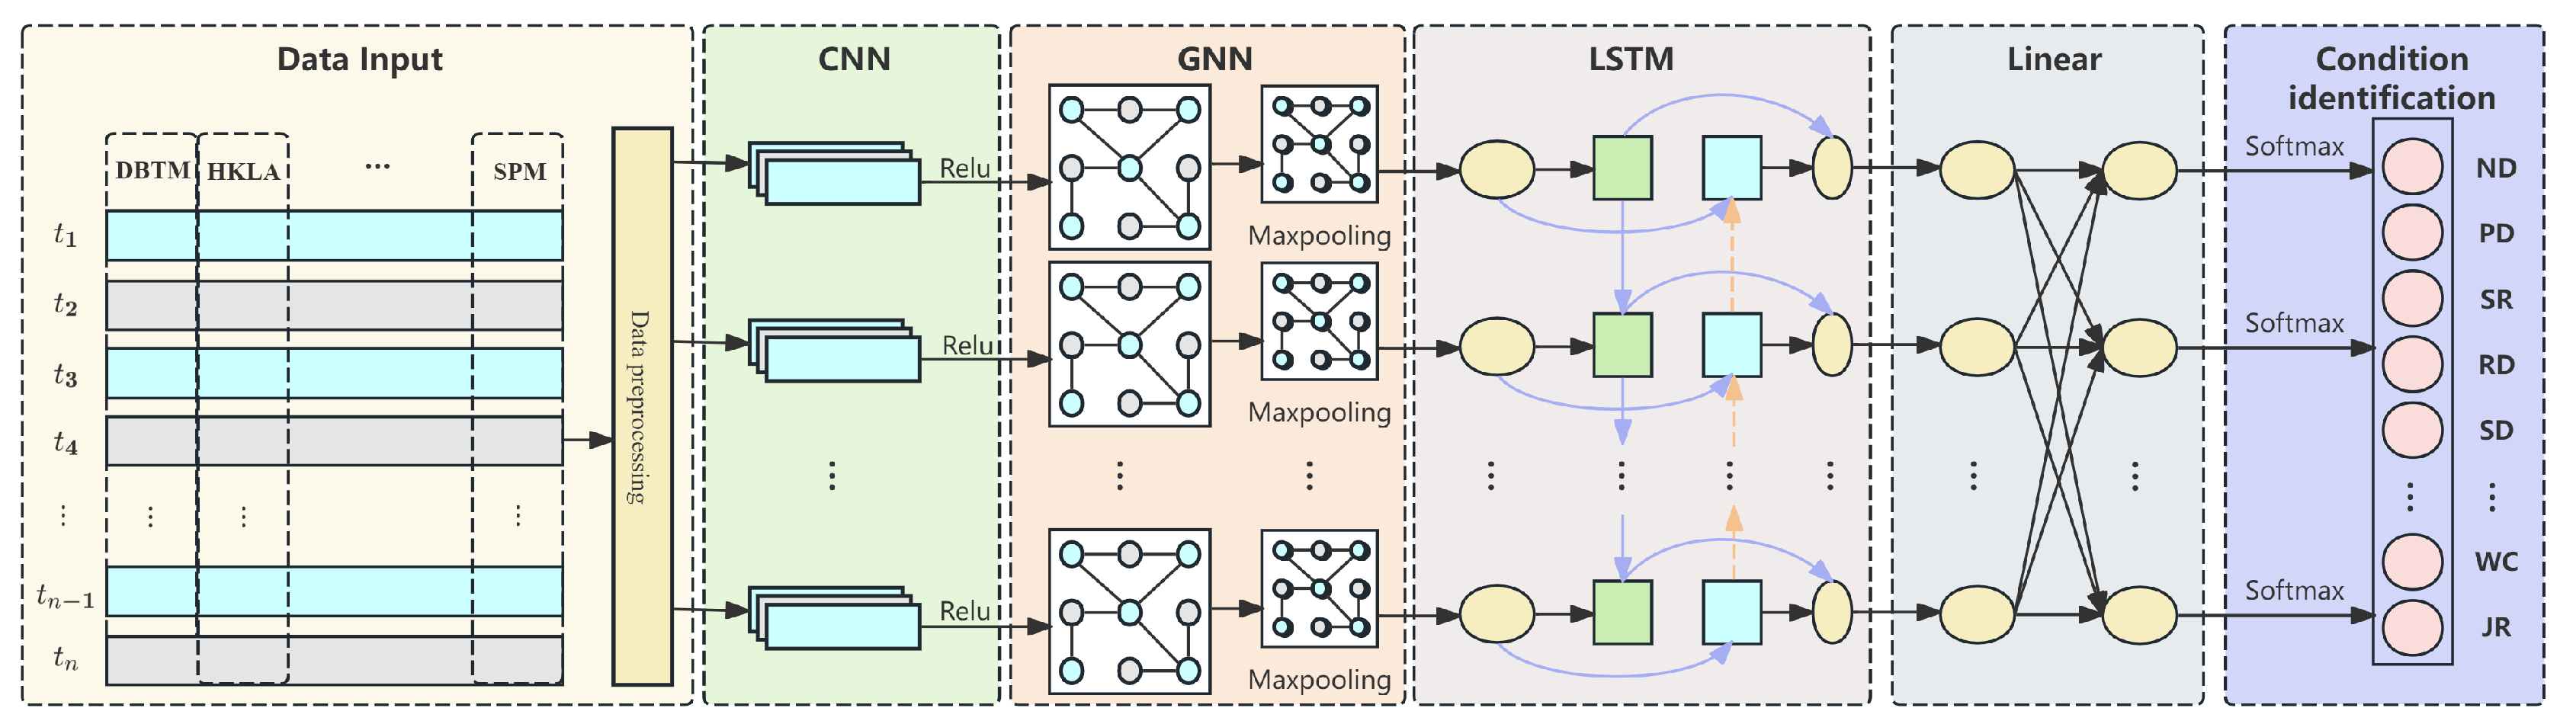
The drilling completion condition identification task involves timing data from multiple sensors, each of whose readings collectively determine the condition state of the equipment. These data can be represented as a multi-sensor time series matrix , where T is the number of samples, W is the time step, and M is the number of sensors. Our goal is to utilize these data for the classification and prediction of the working conditions. Based on the analysis of the data characteristics, the use of the CNN-GNN-LSTM model is chosen as the solution in order to better capture the local features, global relationships, and time order dependencies.
The model can fully adapt to the multi-source and multi-dimensional characteristics of the working condition data: the CNN module extracts local spatial features, effectively handles the high-dimensional and complex data of sensors, and reduces noise interference; the GNN module constructs the correlation map of sensors, accurately models the nonlinear dependence between sensors, and strengthens the robustness of the model via the normalized adjacency matrix, and it can capture the dynamic coupling relationship between the drilling pressure and the depth of the drilling bit, etc; and the LSTM module mines the time-dependent patterns of the data to smooth out the short-term anomalies. It is highly sensitive to dynamic changes in the working conditions. The three modules work together to meet the modeling needs in terms of local, global, and temporal characteristics for working condition recognition. In addition, the model supports sliding window input, and, combined with hardware acceleration technology, it can realize low-latency and high-efficiency inference to meet the demands of real-time working condition recognition (
Figure 2).
Traditional neural networks use matrix multiplication to establish input–output relationships, which is prone to the problem of excessive computation. In convolutional neural networks, the convolutional kernel elements act on specific locations of the local inputs, and the parameter sharing characteristic significantly reduces the number of parameters to be optimized and improves the training speed. The CNN has excellent performance in feature extraction and is able to extract the features that maximize the distinctions between variables. It is used for classification, recognition, prediction, or decision-making.
The input data are
, and the feature map
is generated after multilayer convolution and pooling operations;
is the dimension of the features after convolution.
where
K is the convolution kernel. By continuously adjusting the parameters of the convolutional kernel, the CNN can extract different features from the input data. The convolutional kernel design integrates the correlation between the time dimension and the sensor dimension to fully capture the multi-sensor interaction features.
The CNN effectively captures the hidden patterns of Euclidean data, while the graph neural network has a unique advantage in terms of non-Euclidean spatial data and complex features. When identifying drilling and completion conditions, we can consider each sensor as a node of the graph, and the data provided by the sensors may have various interactions with each other. We can also consider such correlations as edges connecting the nodes to each other. The GNN is able to generate a node representation by aggregating the node’s own features
and the neighbor’s features
, and it represents the sensor data as a graph structure
. Here,
V denotes the set of nodes corresponding to each sensor;
E denotes the set of edges corresponding to the relationships between the sensors; and the adjacency matrix,
, denotes the weights of the connections between the nodes, with the initial feature being the last dimension of
. The input features
are processed using a graph convolution layer to generate a new feature representation of the node
:
where
and
are the weights and biases of the graph convolution layers, and
is the activation function (e.g., ReLU). This process can stack multiple layers of graph convolution to extract higher-order correlation features.
The time series data extracted from the drilling and completion process contain hidden temporal correlations. Classical RNN networks have certain problems in mining temporal information. LSTM was developed from the RNN and aims to solve the long-term dependency problem of the conventional RNN. It can efficiently deliver long time series information, prevent the omission of key information, and also effectively deal with the problem of gradient disappearance or explosion. Thus, it improves the stability and accuracy of neural networks in processing time series data and performs better in complex time series analysis scenarios (
Figure 3).
The output
of the GNN module is input to the LSTM module to capture the time series features. LSTM generates the final time series feature representation
by memorizing the long- and short-term dependencies:
The outputs of the LSTM module, the temporal features
, are passed to the fully connected layer and the softmax layer for the multi-classification task, which predicts the probability distribution of the samples belonging to each working condition:
where
is the predicted category probability distribution, and
and
are the weights and biases of the output layer.
4. Experimental Verification
The data contain 19 categories of common working conditions, which are normal down-drilling, pump down-drilling, scratch eye down-drilling, rotary drilling, sliding drilling, pure drilling with movable drilling tools, connecting columns, removing columns, movable drilling tools after drilling, operation preparation, circulation, normal drilling starts, pump-on drilling starts, inverted scratch eye drilling starts, removing a single root, purely casing, connecting casing, waiting for coagulation, and connecting a single root. Manual labeling was used to mark the 19 types of work conditions (
Table 2).
4.1. Model Configuration and Adjustment
The input of the CNN module is the time series data of
. The convolutional part contains two convolutional layers, with the number of input and output channels of each layer being 1 and 6, respectively, and the activation function is ReLU [
15], while the size of the convolutional kernel is 3 × 3. On the one hand, the smaller kernel can focus on the details of the data with a smaller sensory field when extracting features from the local area; on the other hand, compared with a large kernel, the number of parameters of the 3 × 3 kernel is smaller, which can reduce the computational efficiency and the risk of overfitting and effectively capture local features. The convolution is followed by maximum pooling downsampling with 2 × 2 windows, and the training introduces a discard rate of 0.1. The pooled features are fed into a fully connected layer with 2700 nodes and the classification results are output [
16].
The LSTM module processes the multi-dimensional time series data of . The hidden layer is 1 layer, the number of hidden nodes is 64, and the dropout is 0.1. The embedded features of the processed time series are flattened into the regression layer, and the class probability distributions are generated by the normalization of the softmax function.
The CNN-LSTM model combines the capabilities of both models, and the feature map generated by CNN convolution is flattened and adapted to the LSTM input. A 1-layer LSTM hidden layer with 126 hidden nodes outputs the hidden states, and the embedded features are passed to the fully connected classification layer with a dropout rate of 0.1. These are mapped to 19 classification categories, and the output is the probability distribution of the predicted working conditions.
The CNN-GNN-LSTM is based on the CNN-LSTM model, and a graph neural network module is added to model the association information between sensors. The GNN module operates through the adjacency matrix constructed based on the features of nine sensors, where the number of sensors is nine, corresponding to the nine nodes in the graph, and the edge relationships are generated by the combination of the sensors. The GNN module consists of two graph convolution layers, each with a node embedding dimension of 128 [
17]. The first layer of graph convolution is followed by the use of the ReLU activation function to increase the nonlinear expressiveness and reduce the risk of overfitting by dropout (dropout rate of 0.1). The second layer of graph convolution further extracts global correlation features [
18]. The output of graph convolution is subjected to 3D max pooling to compress the spatial dimensions of the feature map, and the generated features are subsequently spread and fed into the LSTM module. The LSTM module receives the input features generated by graph convolution and captures the dynamic dependencies of the time series through a long short-term memory network. The hidden layer of the LSTM consists of 1 layer, with a total of 128 hidden nodes, and outputs a final hidden state as a temporal embedding representation, which is further processed by the dropout layer and input to the fully connected classification layer.
In terms of model construction, when building the model, the principle of simplifying the structure and reducing the parameters while guaranteeing the performance is upheld, so as to avoid the model learning noise. An appropriate learning rate is carefully selected, so as to prevent the model from falling into the local optimum or overfitting due to the excessively long training time. Moreover, in the model system constructed in this paper, ReLU is chosen as the activation function for each module, and the stochastic inactivation rate is uniformly set to 0.1. The calculation process of the ReLU function is simple, and it can effectively accelerate the training process of the model, solve the problem of gradient disappearance, and guarantee the high efficiency of the backpropagation of the neural network, so that the model can rapidly and accurately learn the characteristics of the complex drilling and completion data. In view of the complexity of the data features in this condition identification task, the nonlinear characteristic introduced by the ReLU function greatly enhances the model’s expressive ability, helps the model to learn more complex functional relationships, and realizes the accurate classification and prediction of the working conditions. The stochastic deactivation rate is set to 0.1 in order to strike the best balance between avoiding overfitting and maintaining the model’s learning ability. The stochastic deactivation mechanism randomly discards neurons with a set probability during the training period to prevent the formation of overly complex co-adaptive relationships among the neurons. If the deactivation rate is too high, the information that can be learned by the model will be drastically reduced, compromising the accuracy; meanwhile, a low deactivation rate will not be able to effectively suppress overfitting. After repeated verification, it is found that a deactivation rate of 0.1 can ensure that the model can fully learn the data features and prevent overfitting, which significantly enhances the generalization ability of the model.
In order to determine the above model parameters, we use a network search and repeated experiments to select the best model. In the experimental phase, the kernel size and other hyperparameters are systematically tested for different neural network modules. The convergence and stability of the models are judged by evaluating the classification accuracy, recall, and F1 score on the validation set and the loss of the model on the training and validation sets. Ultimately, a combination of hyperparameters with better performance and stability in various indices is selected to provide a strong guarantee for the accurate identification of drilling and completion conditions.
4.2. Model Performance Evaluation Metrics
In order to comprehensively evaluate the performance of the model, the following key metrics are used in the experiments: the accuracy, precision, recall, and F1-score. These can effectively measure the classification effectiveness and robustness of the model in the task of drilling and completion condition identification [
19].
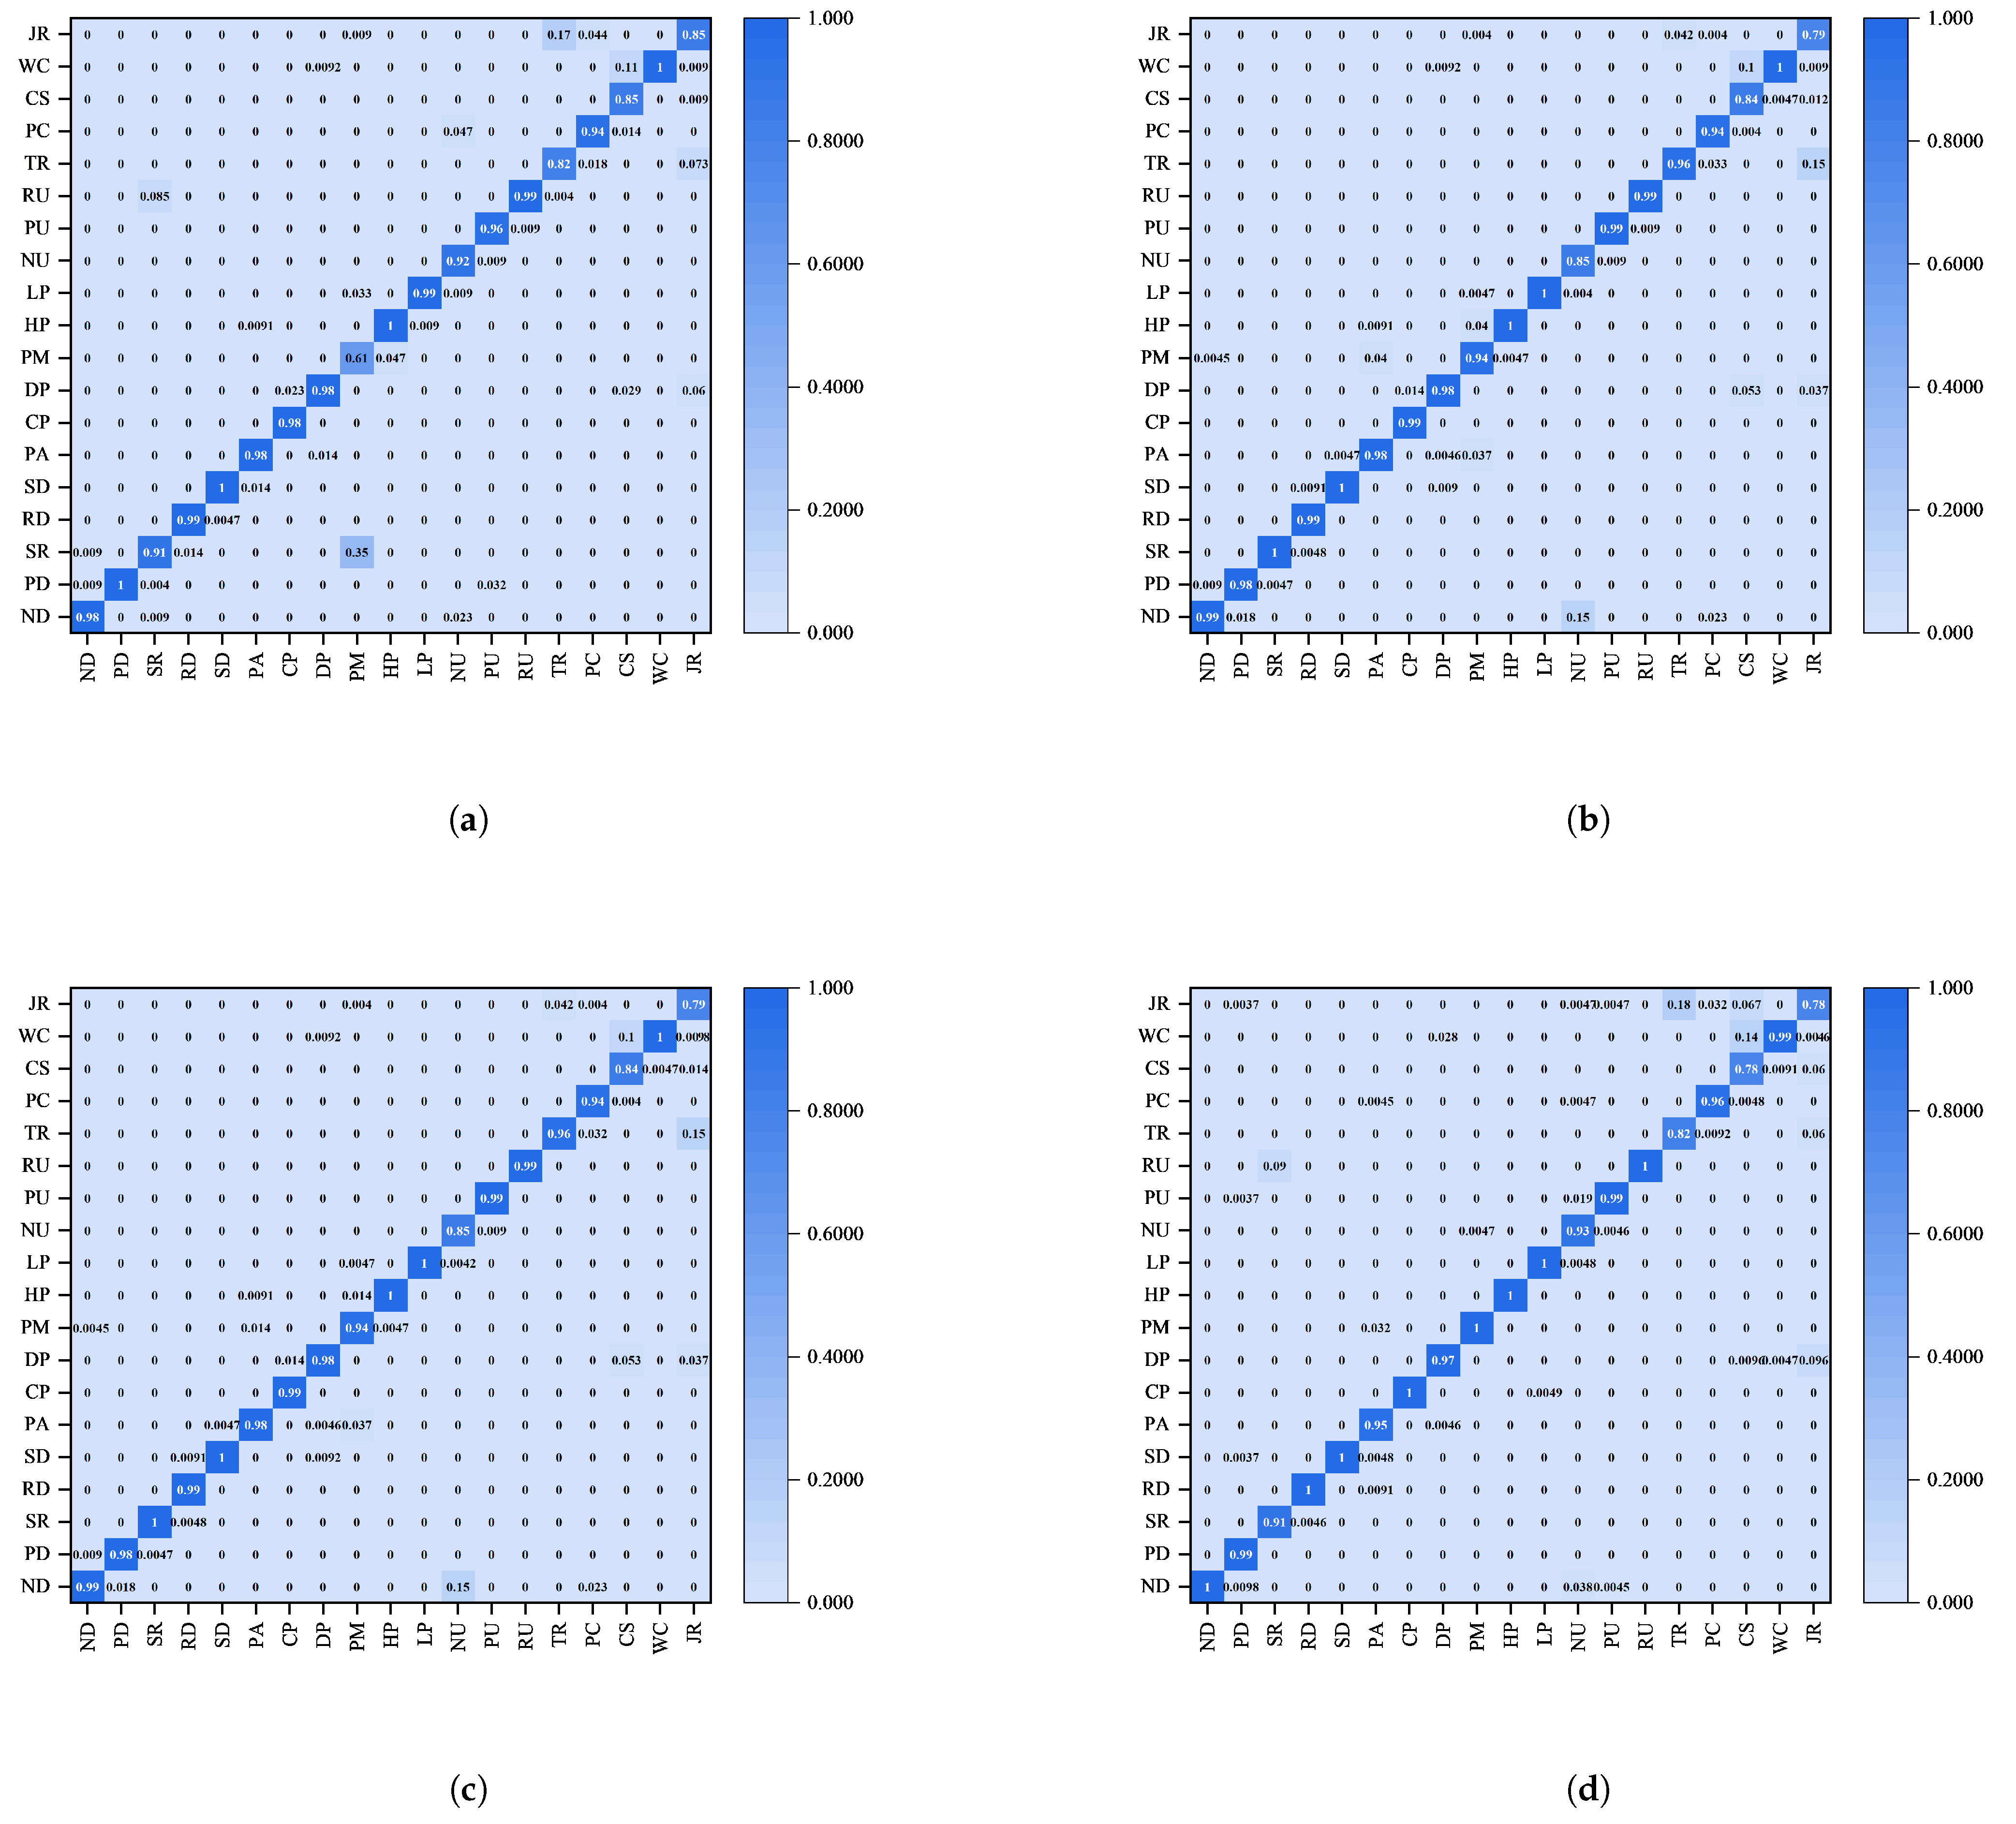
A confusion matrix (CM) is used to show in detail the classification results of the model regarding different working condition categories. It helps to analyze the model’s classification errors and their distribution by showing a comparison between true and predicted labels. The confusion matrix can effectively identify which categories are easily confused and provide directions for targeted improvement.
5. Results and Analysis
The key data such as the accuracy, loss value, precision, recall, and F1-score obtained from the CNN-GNN-LSTM model’s operations are analyzed in depth to fully quantify the model’s performance.
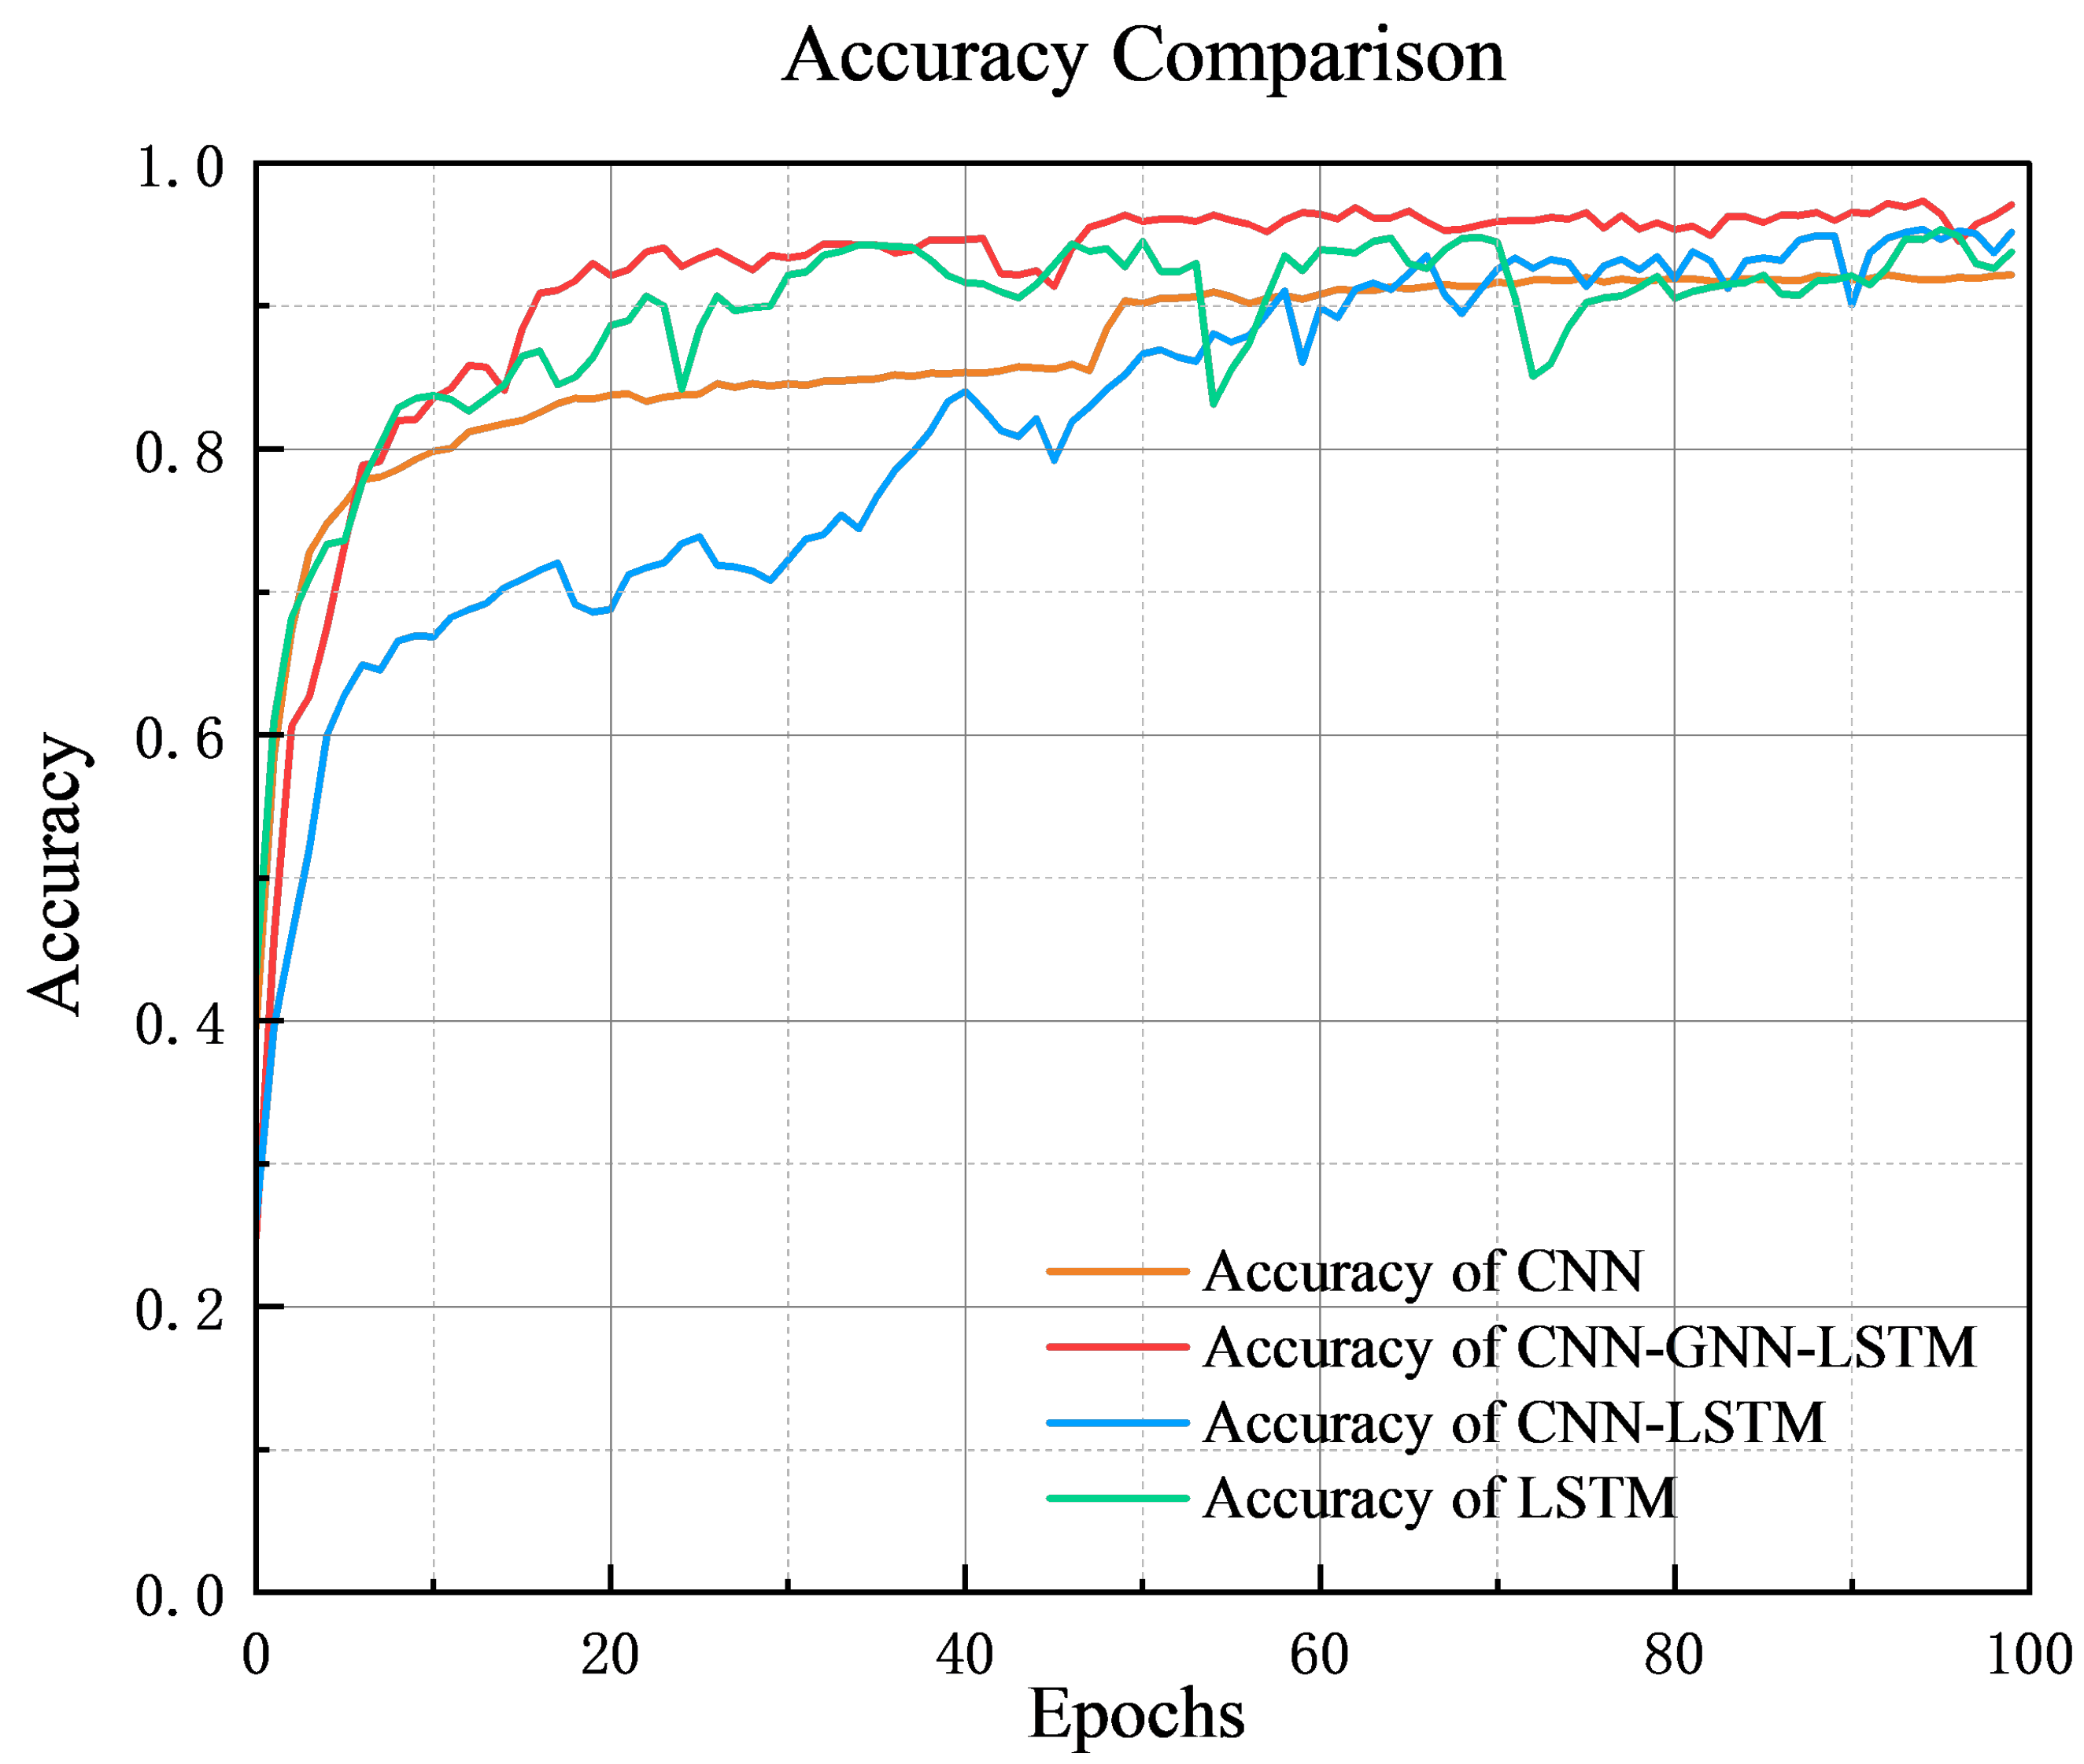
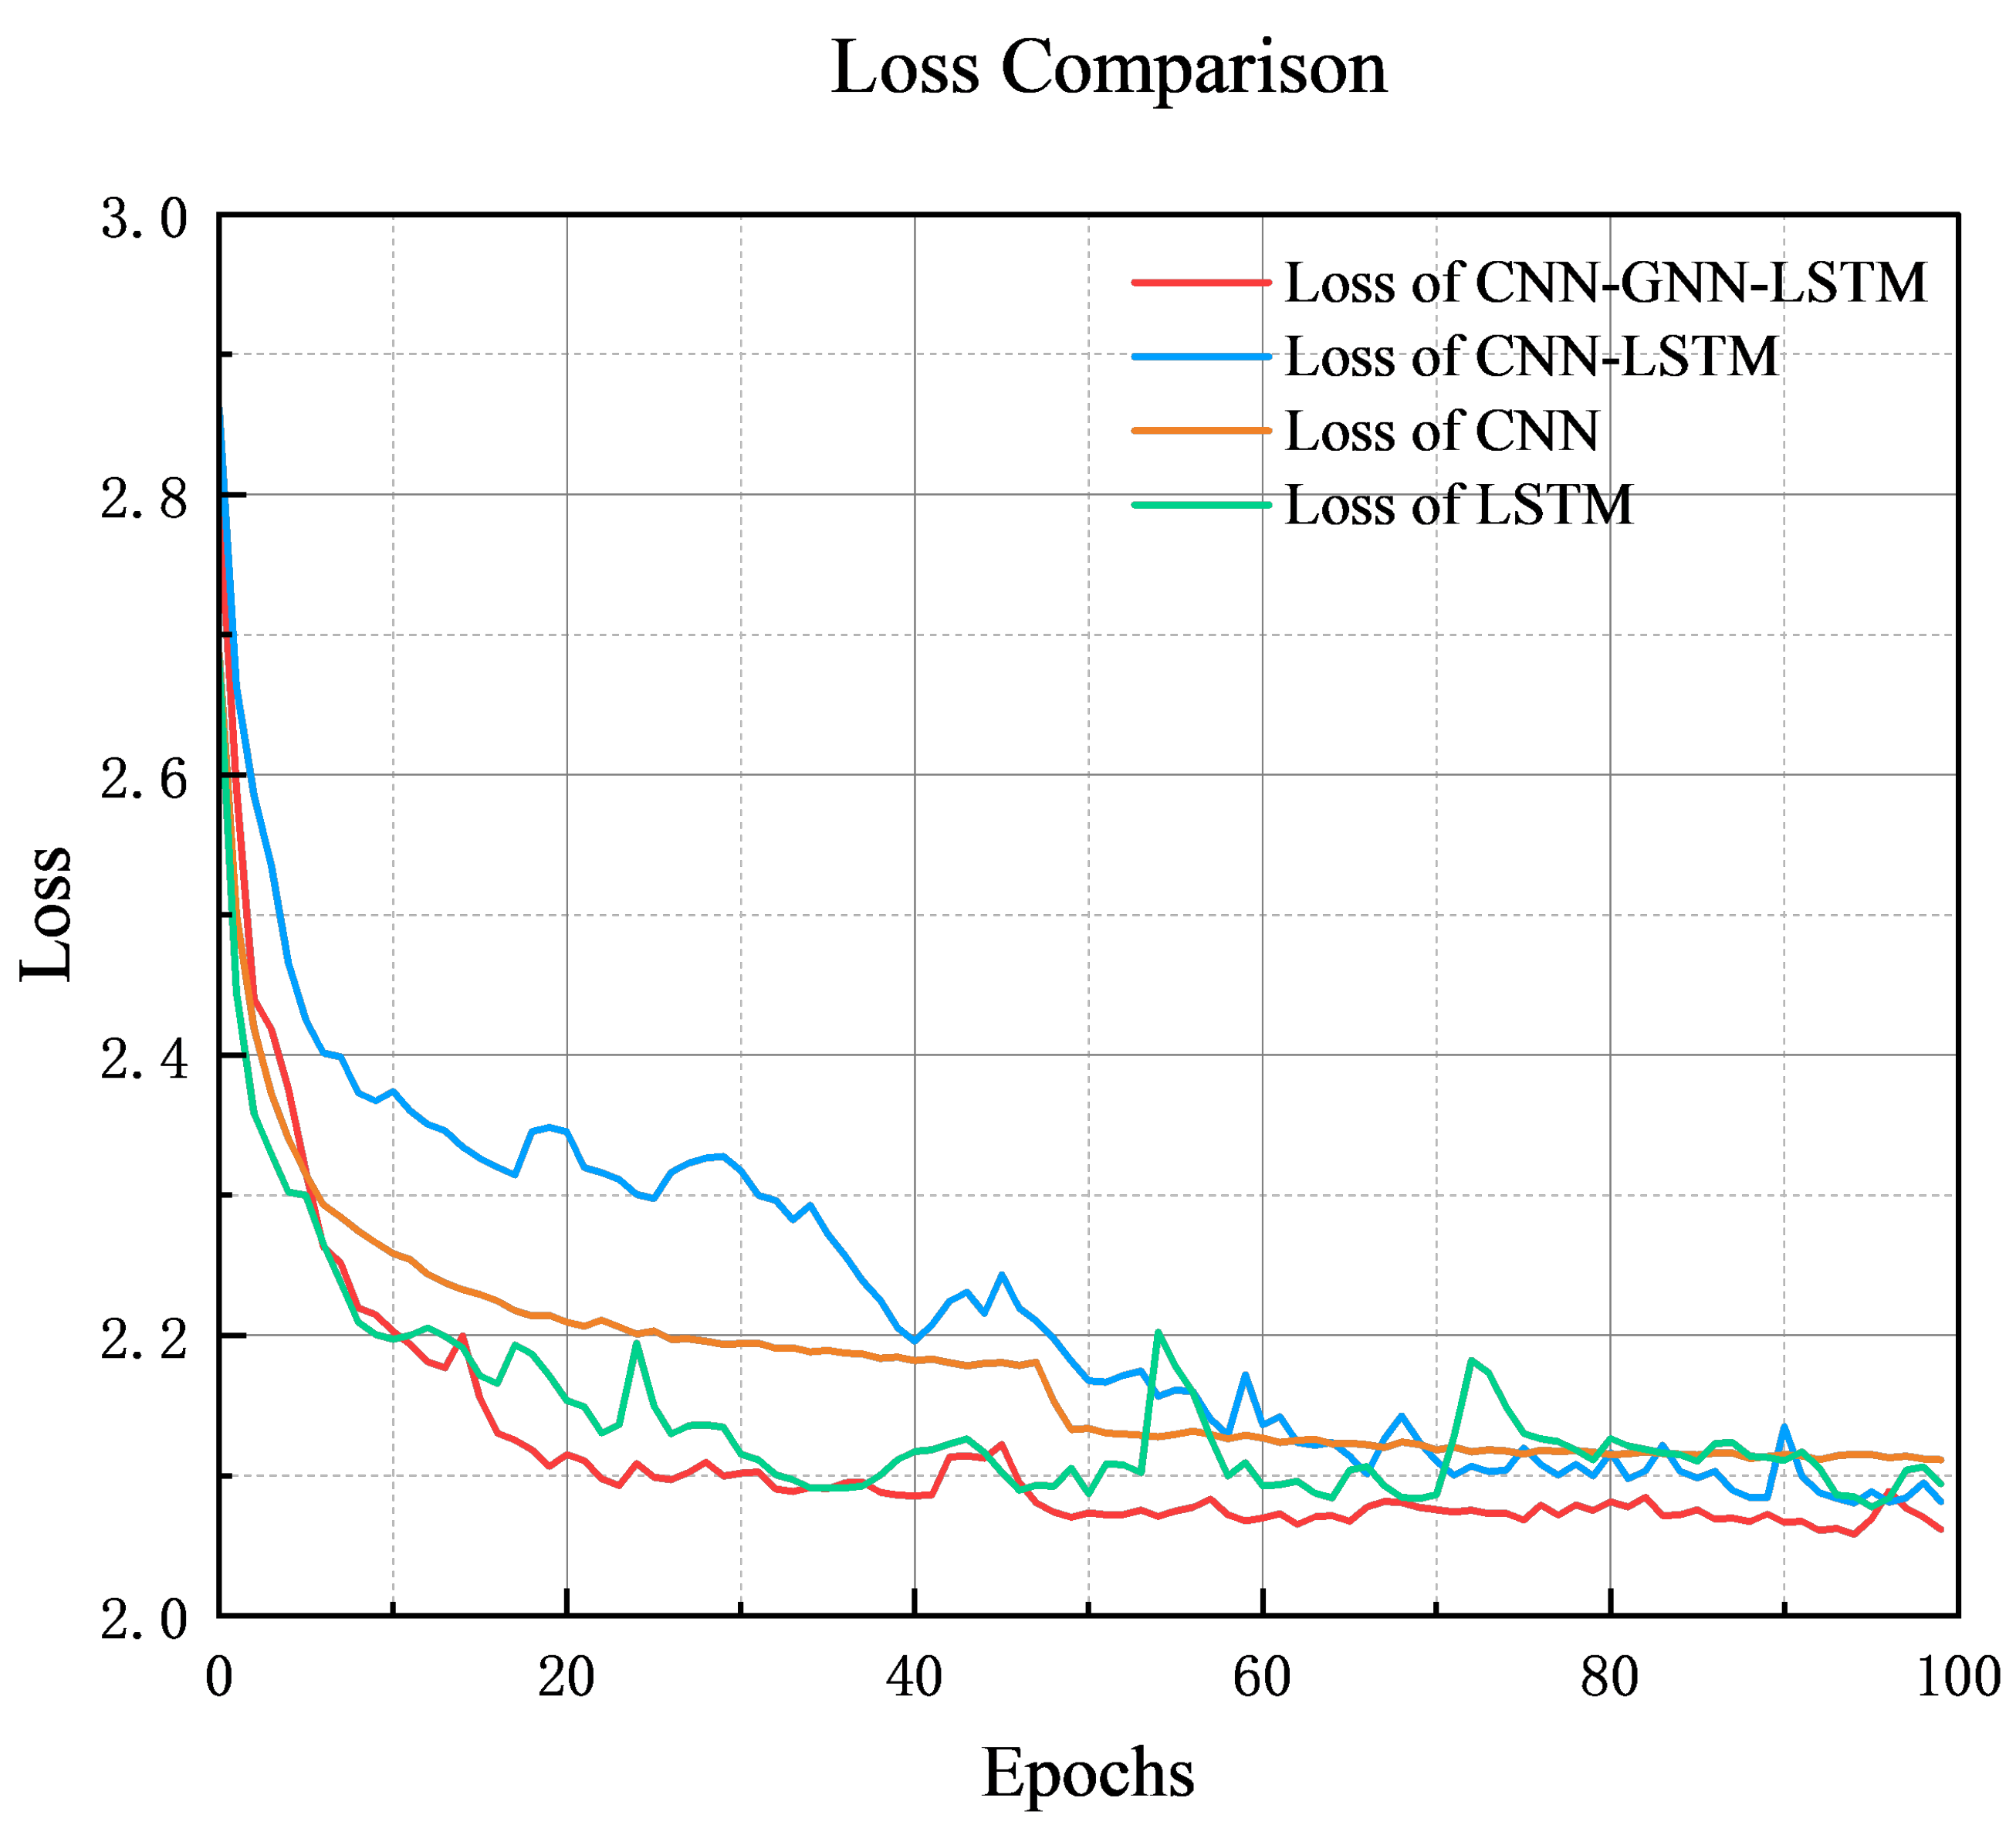
In order to compare the performance of the models during training more intuitively, we integrate the accuracy and training loss of each of the four models in the same graph. From this graph, it can be clearly observed that the different models show significant differences in their rates of accuracy improvement and loss convergence.
From the accuracy curve, the CNN-GNN-LSTM model has the fastest increase in accuracy and the highest and most stable final accuracy, and it is capable of modeling complex working conditions. The CNN-LSTM model has a slow increase in the early stage and is stable in the late stage, with the second-highest final accuracy, and has good overall performance. The LSTM model has a large increasing trend, but the curve fluctuates greatly in the late stage, and it is not stable. The CNN model has stable performance in training, but has limitations in modeling dynamic working conditions. Its final accuracy is not high, and there are limitations in modeling dynamic working conditions.
The CNN-GNN-LSTM model has the best performance in terms of loss reduction, with a fast reduction speed and the lowest loss value throughout the whole process, and it has excellent optimization performance and convergence abilities. The CNN-LSTM model has a slow loss reduction in the early stage and gradually stabilizes with the advancement of the training process. Its final loss value is lower than that of the CNN and LSTM and is only second to that of the CNN-GNN-LSTM. The LSTM model has good performance at the initial stage of loss reduction but fluctuates greatly in the later stage, and it is not stable enough. The CNN model has a smooth loss curve and a high final loss value, and it has limitations in dealing with complex dynamic data.
In order to assess the performance differences between the CNN, LSTM, CNN-LSTM, and CNN-GNN-LSTM models, and to verify that the improvement in the CNN-GNN-LSTM model is statistically significant, the accuracy data of each model in 100 epochs are analyzed using the Wilcoxon signed-rank test, and the test statistic Z-value of each comparison group is calculated, as well as the asymptotic significance (two-tailed), as shown in the table below.
During the training process with 100 epochs, the comparison is found to be significant according to the Wilcoxon signed-rank test. CNN_GNN_LSTM has higher accuracy in 94 epochs compared to CNN_GNN_LSTM (Z = −7.190, p < 0.001); LSTM has superior accuracy in 83 epochs compared to CNN_GNN_LSTM (Z = −6.605, p < 0.001); CNN_LSTM has superior accuracy in 83 epochs compared to CNN_GNN_LSTM (Z = −6.605, p < 0.001); LSTM LSTM has superior accuracy in 83 epochs (Z = −6.605, p < 0.001); and CNN_LSTM has higher accuracy than CNN_LSTM in 98 epochs (Z = −8.661, p < 0.001). This indicates that the CNN, LSTM, and CNN_LSTM models are all significantly poorer than the CNN_GNN_LSTM model in terms of accuracy.
The experimental results show that the CNN-GNN-LSTM model performs the best in terms of classification accuracy, with the final accuracy stabilized above 0.95, significantly better than the other models. The CNN-LSTM model has the second-highest classification accuracy, which is stabilized above the 0.92 level after convergence. The LSTM model has slightly lower classification accuracy, which eventually reaches close to 0.91, while the CNN model has the lowest accuracy, which only converges to around 0.85. This indicates that a CNN or LSTM alone is significantly inadequate in the classification task of complex working conditions, while the CNN-GNN-LSTM model achieves a significant performance improvement by fusing multiple feature modeling methods.
From
Figure 4 and
Figure 5 and
Table 3, it can be seen that the CNN and LSTM models have their own advantages and disadvantages. The CNN extracts spatial features by convolution, which performs well in static or local modes, but it is limited in dynamic working condition recognition due to the neglect of time series features. LSTM can capture time series features, making it better than the CNN in terms of classification accuracy and loss optimization, and it is more capable of modeling time-dynamic features [
15]. The CNN-GNN-LSTM model combines the advantages of both and has a significant improvement in performance due to combining multiple feature modeling methods. The CNN-LSTM model combines the advantages of both models and has a significant performance improvement in classification tasks. However, its pre-training accuracy and loss change slowly in the early stage, and the convergence speed is poor; nevertheless, the performance is optimized in the later stage, and the final effect is only second to that of the CNN-GNN-LSTM model, which compensates for the shortcomings of any single model.
The CNN-GNN-LSTM model introduces the GNN module on the basis of CNN-LSTM, which enhances the feature expression ability [
20,
21]. The GNN constructs a sensor topology feature map, captures the correlation information, and adapts to the classification of complex working conditions. The experiments show that the model outperforms other models in terms of classification accuracy and loss optimization, and the combination of multimodal information is effective and shows great potential (
Figure 6).
Combining the four confusion matrices, it is noticeable that the worst condition identification occurs in the casing condition, which is easily recognized as the waiting condensation condition. This may be due to the fact that there can be feature similarities between the casing condition and the waiting condensation condition during operation. For example, the key parameters, such as the drilling pressure and rotary speed, of the two conditions change smoothly, which makes it difficult for the model to distinguish between them, leading to misclassification. Moreover, the dynamic features of the casing connection condition are relatively small, so, if the feature extraction capability of the model is insufficient, it may not be able to effectively capture these subtle differences.
To address this phenomenon, we can try to introduce the derived parameters, such as the direction of drill pipe movement, the relationship between the drill bit and the well depth, and the axial movement speed of the drill pipe, to assist the identification considering the significant differences in different working conditions. We can also optimize the structure of the GNN model, such as increasing the number of layers, adjusting the connection method, or incorporating an attention mechanism, to enhance the ability to extract the fine features, thus increasing the condition identification accuracy.
Although the performance of the model is generally good, computational efficiency is also crucial for real-time drilling condition monitoring. Therefore, we compare the training and inference times of the CNN-GNN-LSTM and other models.
From the results, in terms of the training time, the CNN-GNN-LSTM model takes the longest time, which is mainly attributed to the fact that the structure of the CNN-GNN-LSTM model is more complex, as it needs to deal with more parameters and data interactions during the training process, resulting in a significant increase in training time. In terms of memory consumption, the CNN-GNN-LSTM model occupies the largest amount of both resident memory and virtual memory, and the higher memory consumption may place more pressure on edge computing devices with relatively limited memory resources. This may adversely affect the efficiency of the model on such devices (
Figure 7 and
Table 4,
Table 5 and
Table 6).
6. Conclusions and Outlook
The CNN-GNN-LSTM model shows great potential in drilling and completion condition identification tasks, especially when dealing with complex, multi-dimensional, and dynamic condition data. By combining the advantages of the CNN, GNN, and LSTM, the model is able to realize the all-round modeling of working condition signals, and the ability of the GNN module to model the correlations between sensors significantly improves the robustness of feature expression. This provides a basic guarantee in coping with diversified working conditions.
Despite the excellent performance of the CNN-GNN-LSTM, the model structure is complex and requires large amounts of computational resources, especially in the training phase, which may require high-performance hardware support. This poses difficulties for deployment on resource-constrained edge devices. Future research can be carried out in several directions, such as attempting the lightweight optimization of the models, e.g., using pruning, quantization, or knowledge distillation techniques, to reduce the computational overhead and adapt them to resource-limited deployment scenarios. To address the dynamic change problem of sensor networks, dynamic graph neural networks or adaptive topology learning techniques can be investigated to enhance the flexibility of the model.
Overall, the CNN-GNN-LSTM model provides a powerful solution for drilling and completion condition identification by fusing multiple feature extraction and time series modeling techniques. Despite the current challenges in large-scale industrial applications, the model is expected to overcome technical bottlenecks and play an important role in industrial intelligence through targeted research and optimization. In the future, the model will not only improve the safety and efficiency of the drilling and completion process but may also provide new ideas and methods for complex pattern recognition tasks in other industrial scenarios.


 and
and 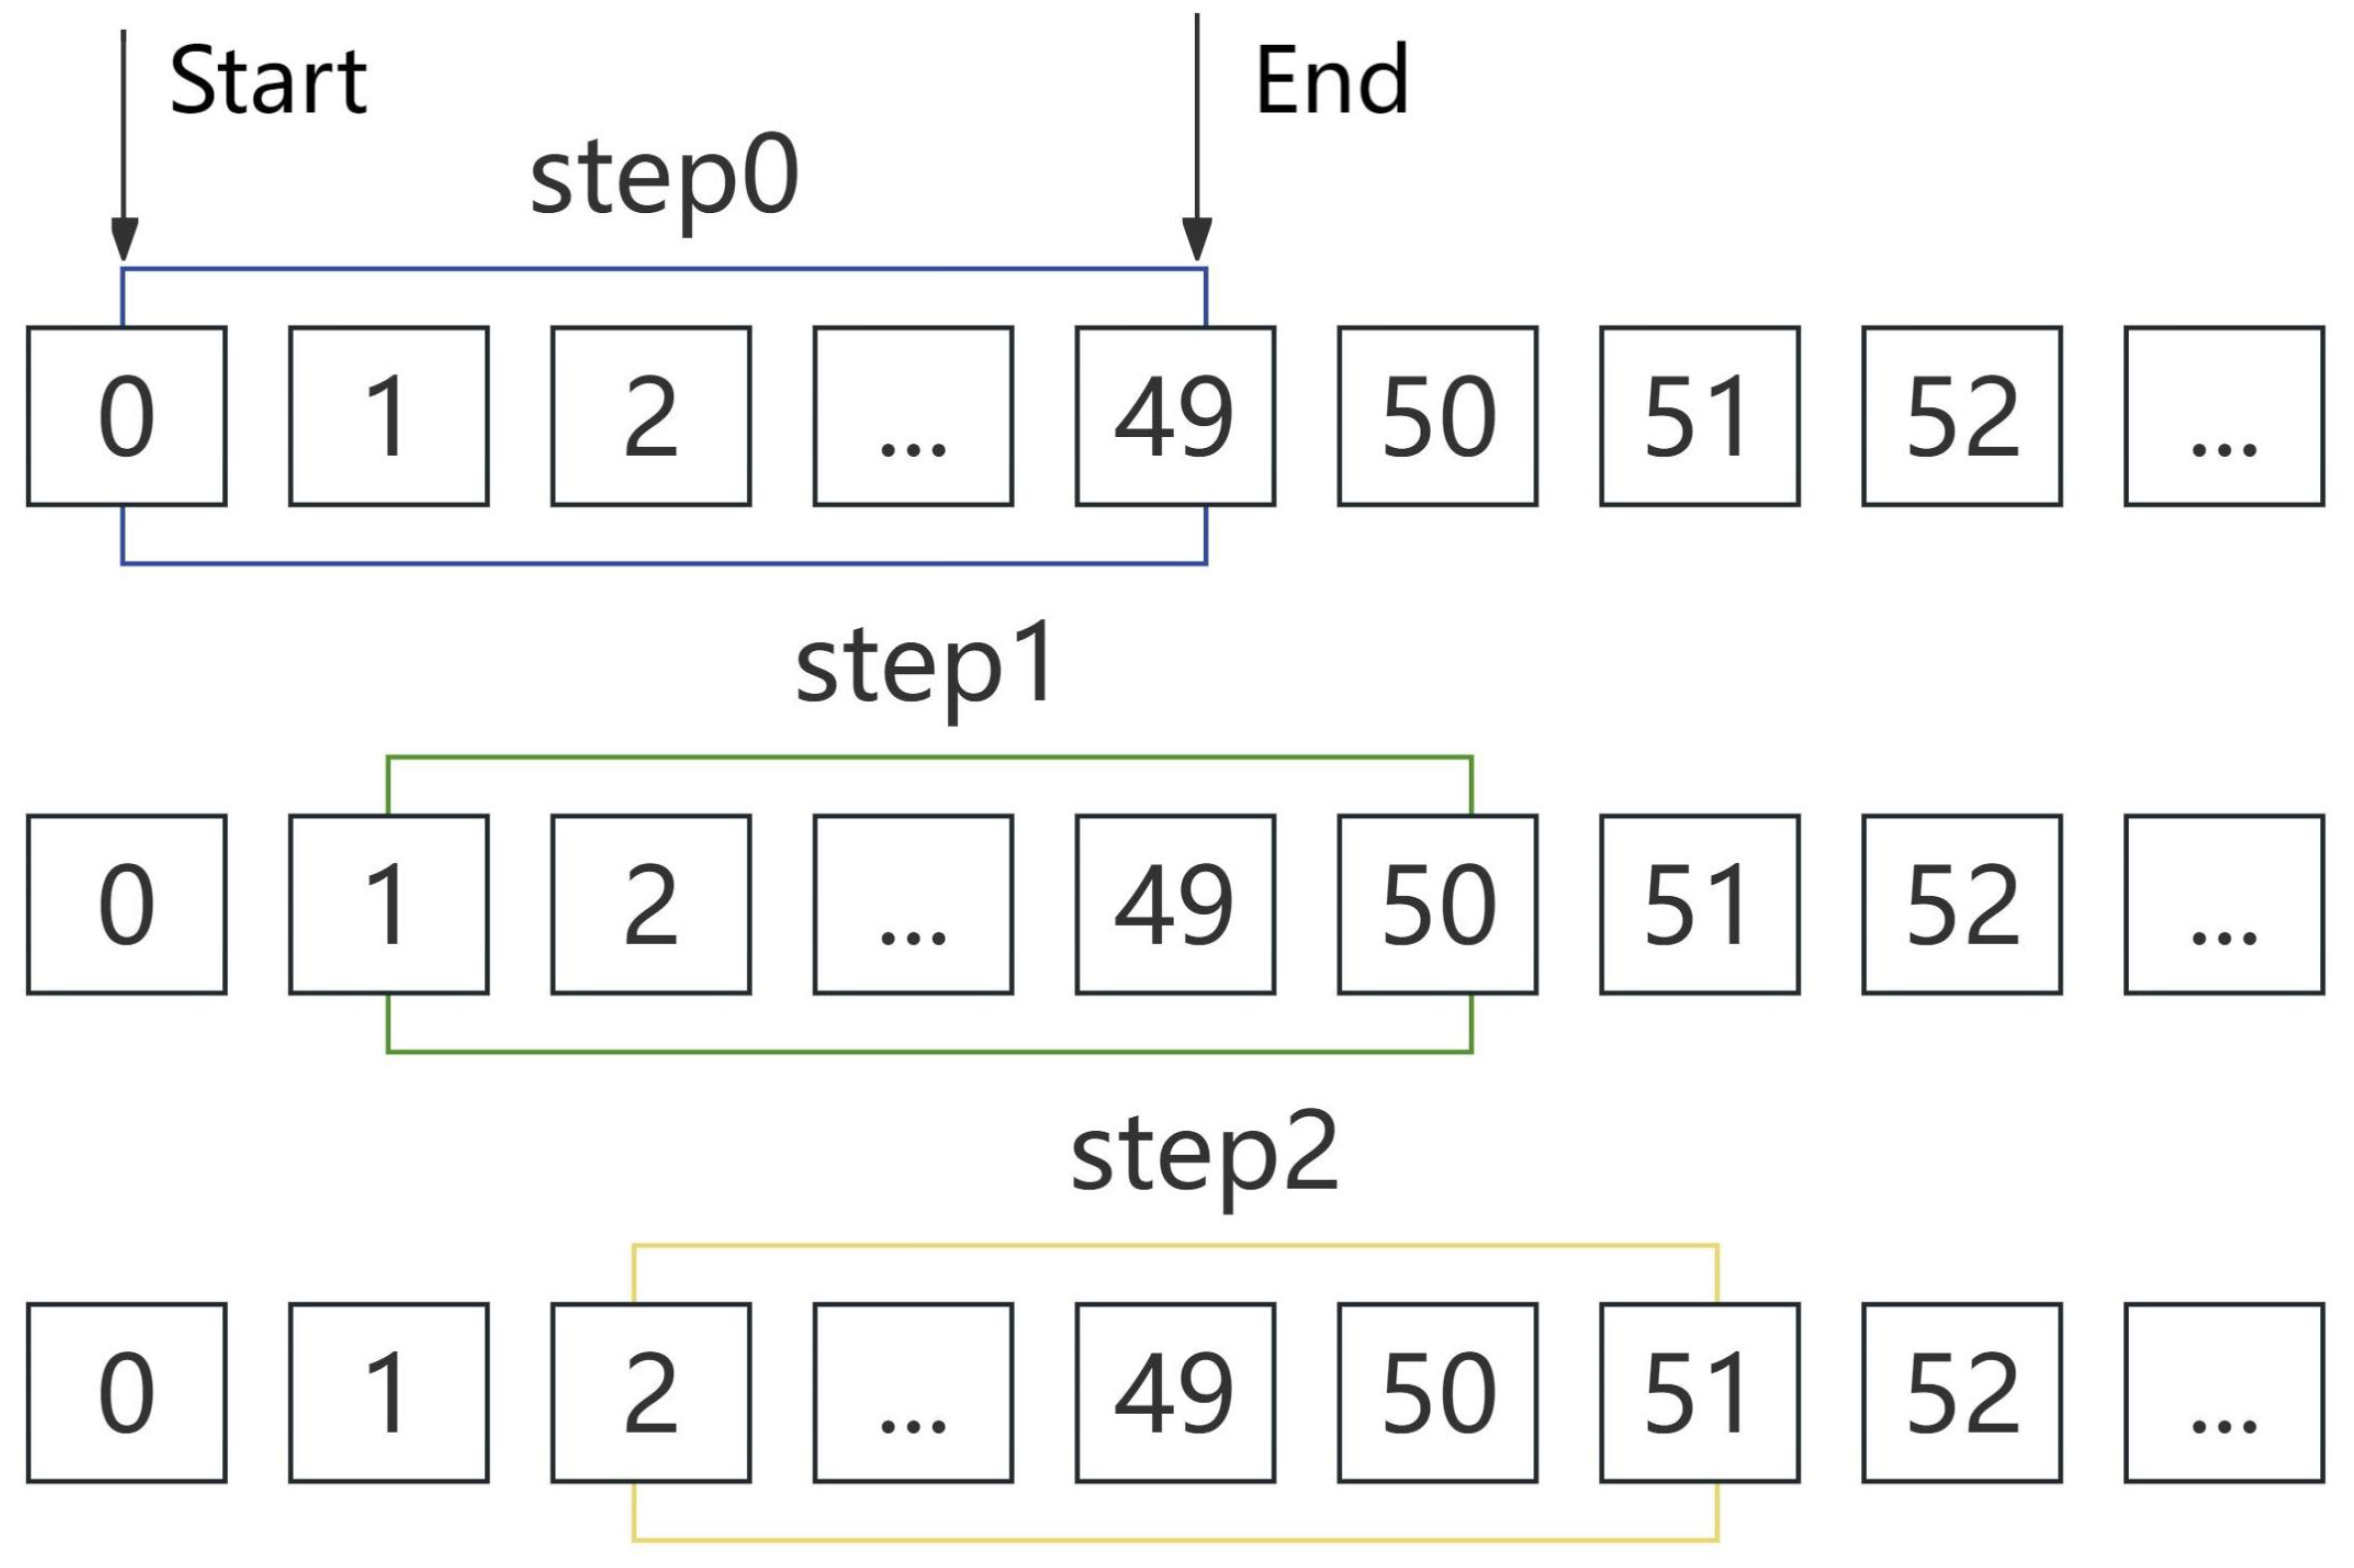
