Impact of Burner Yaw and Tilt Angles on the NO Emissions and Slagging in a 330 MW Tangentially Fired Boiler Utilizing Zhundong Coal: A Numerical Study

Abstract
1. Introduction
2. Boiler Descriptions
3. Numerical Method
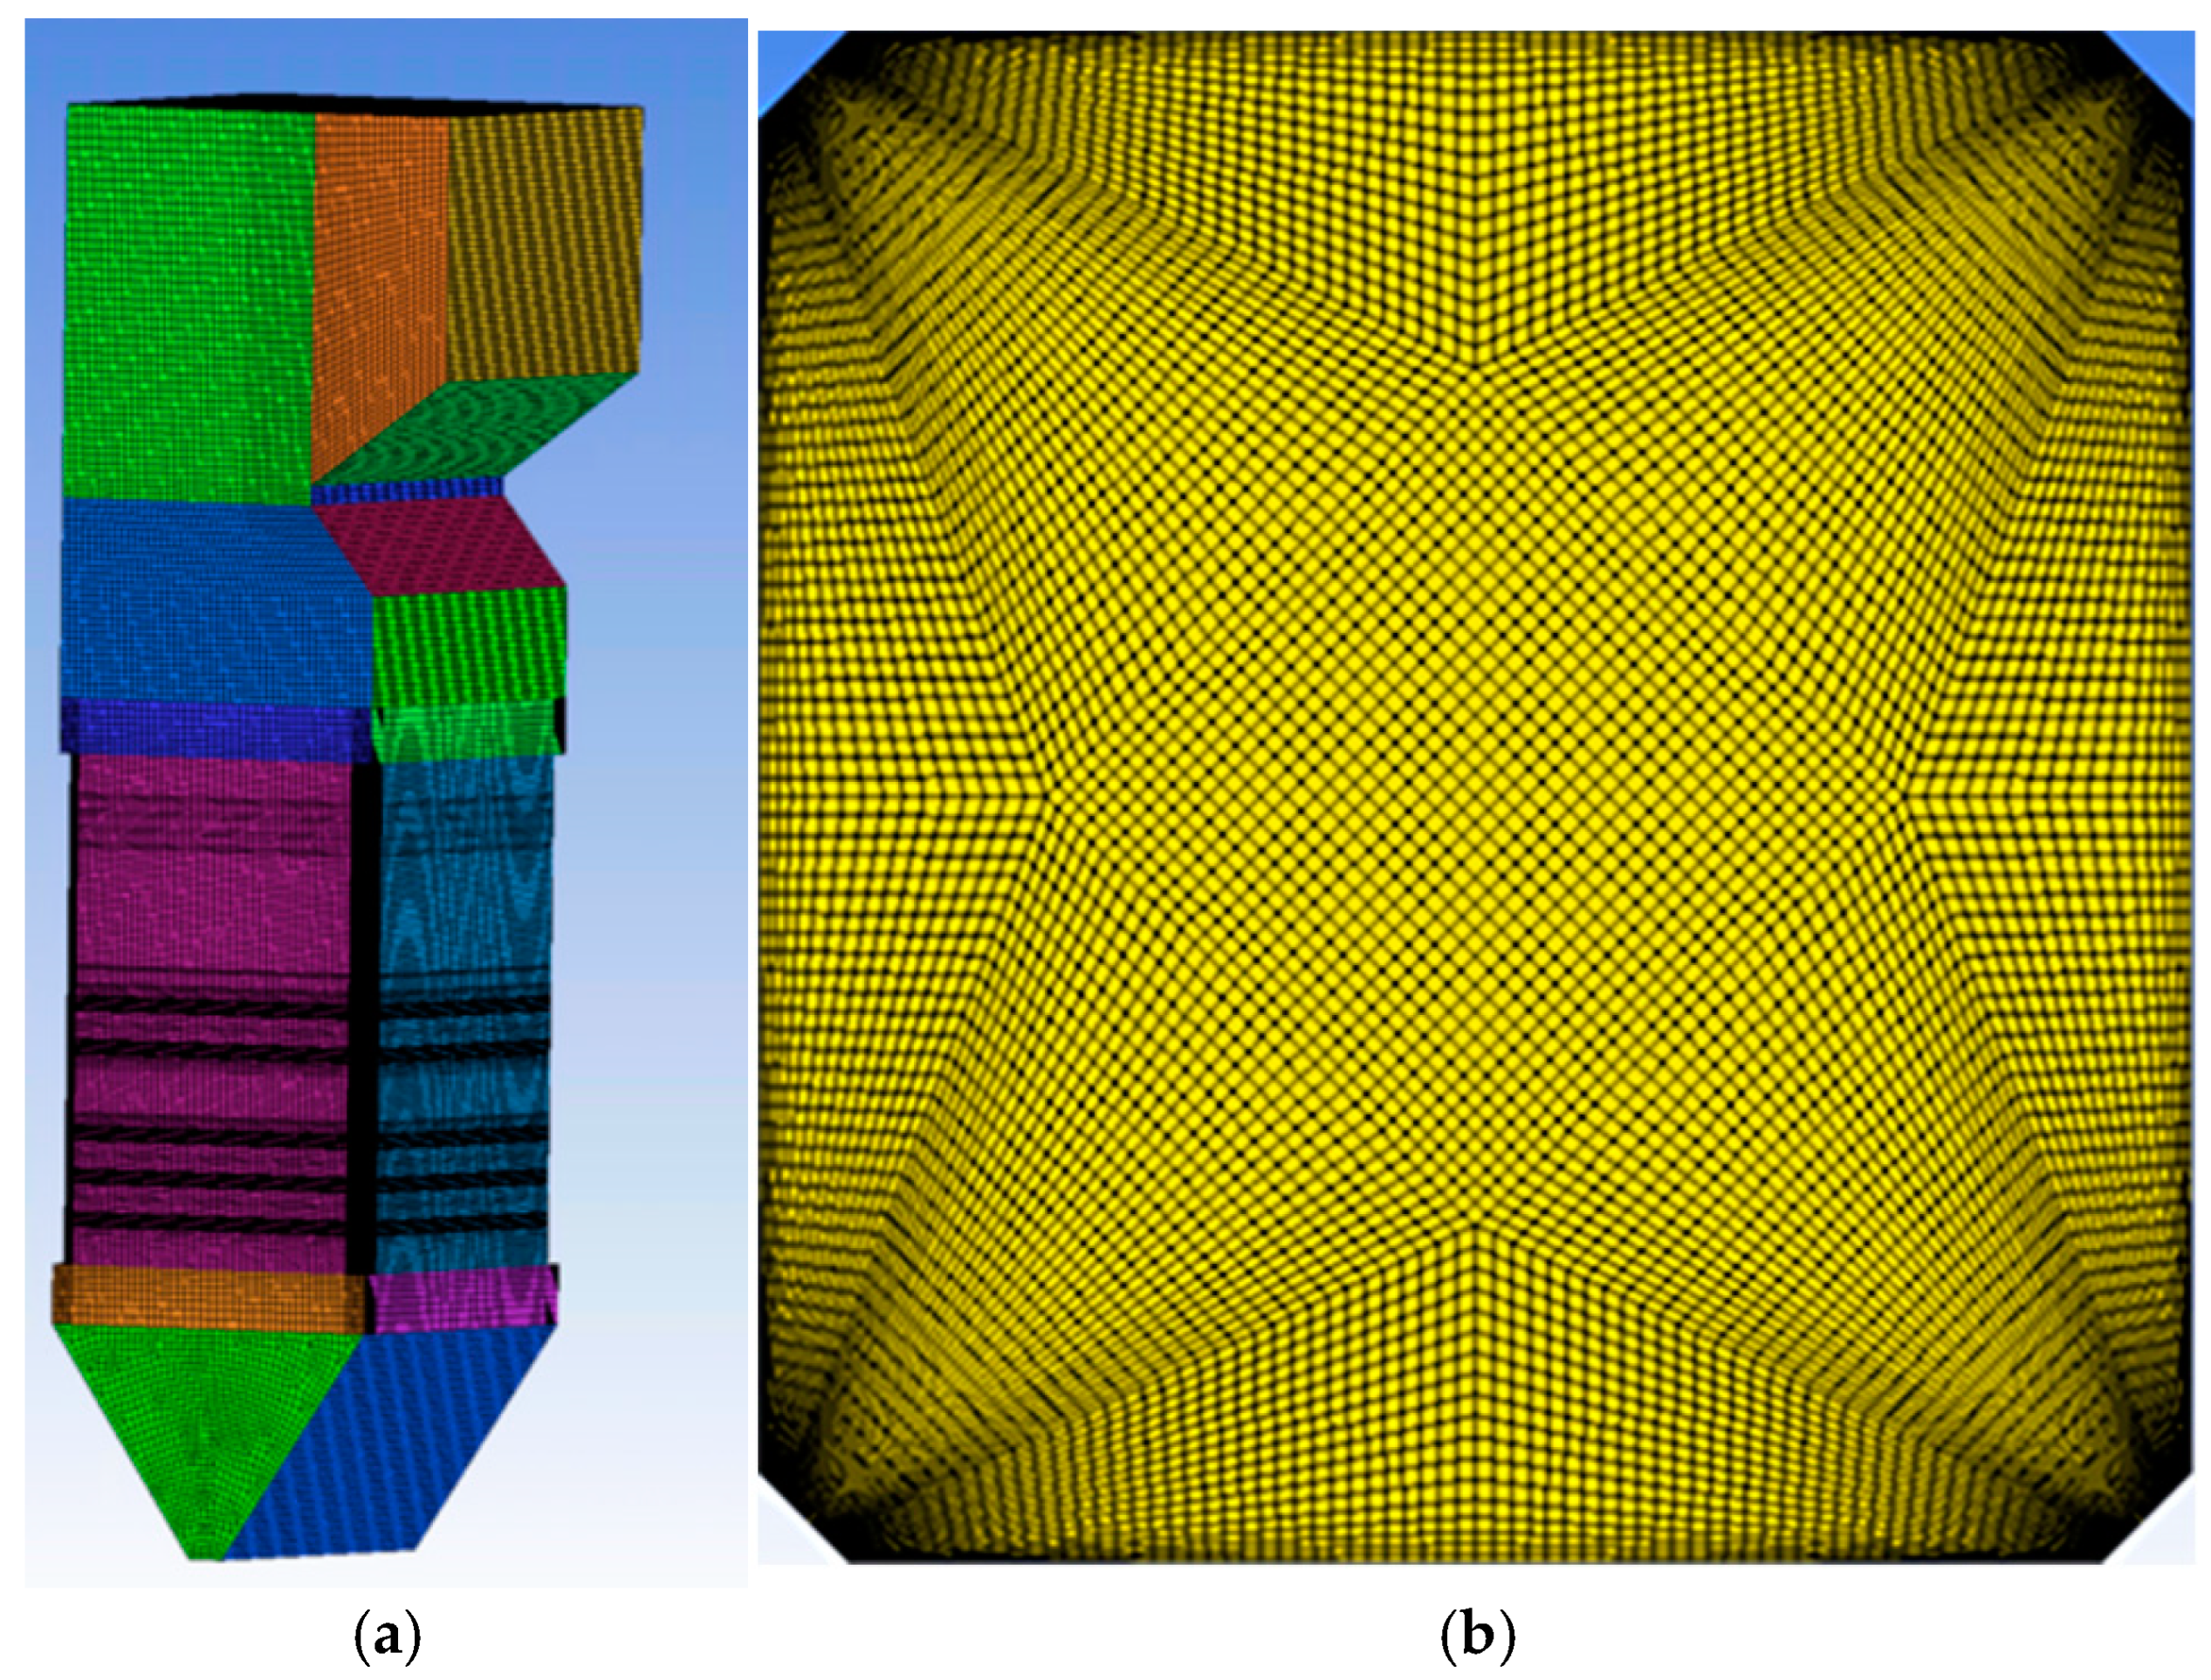
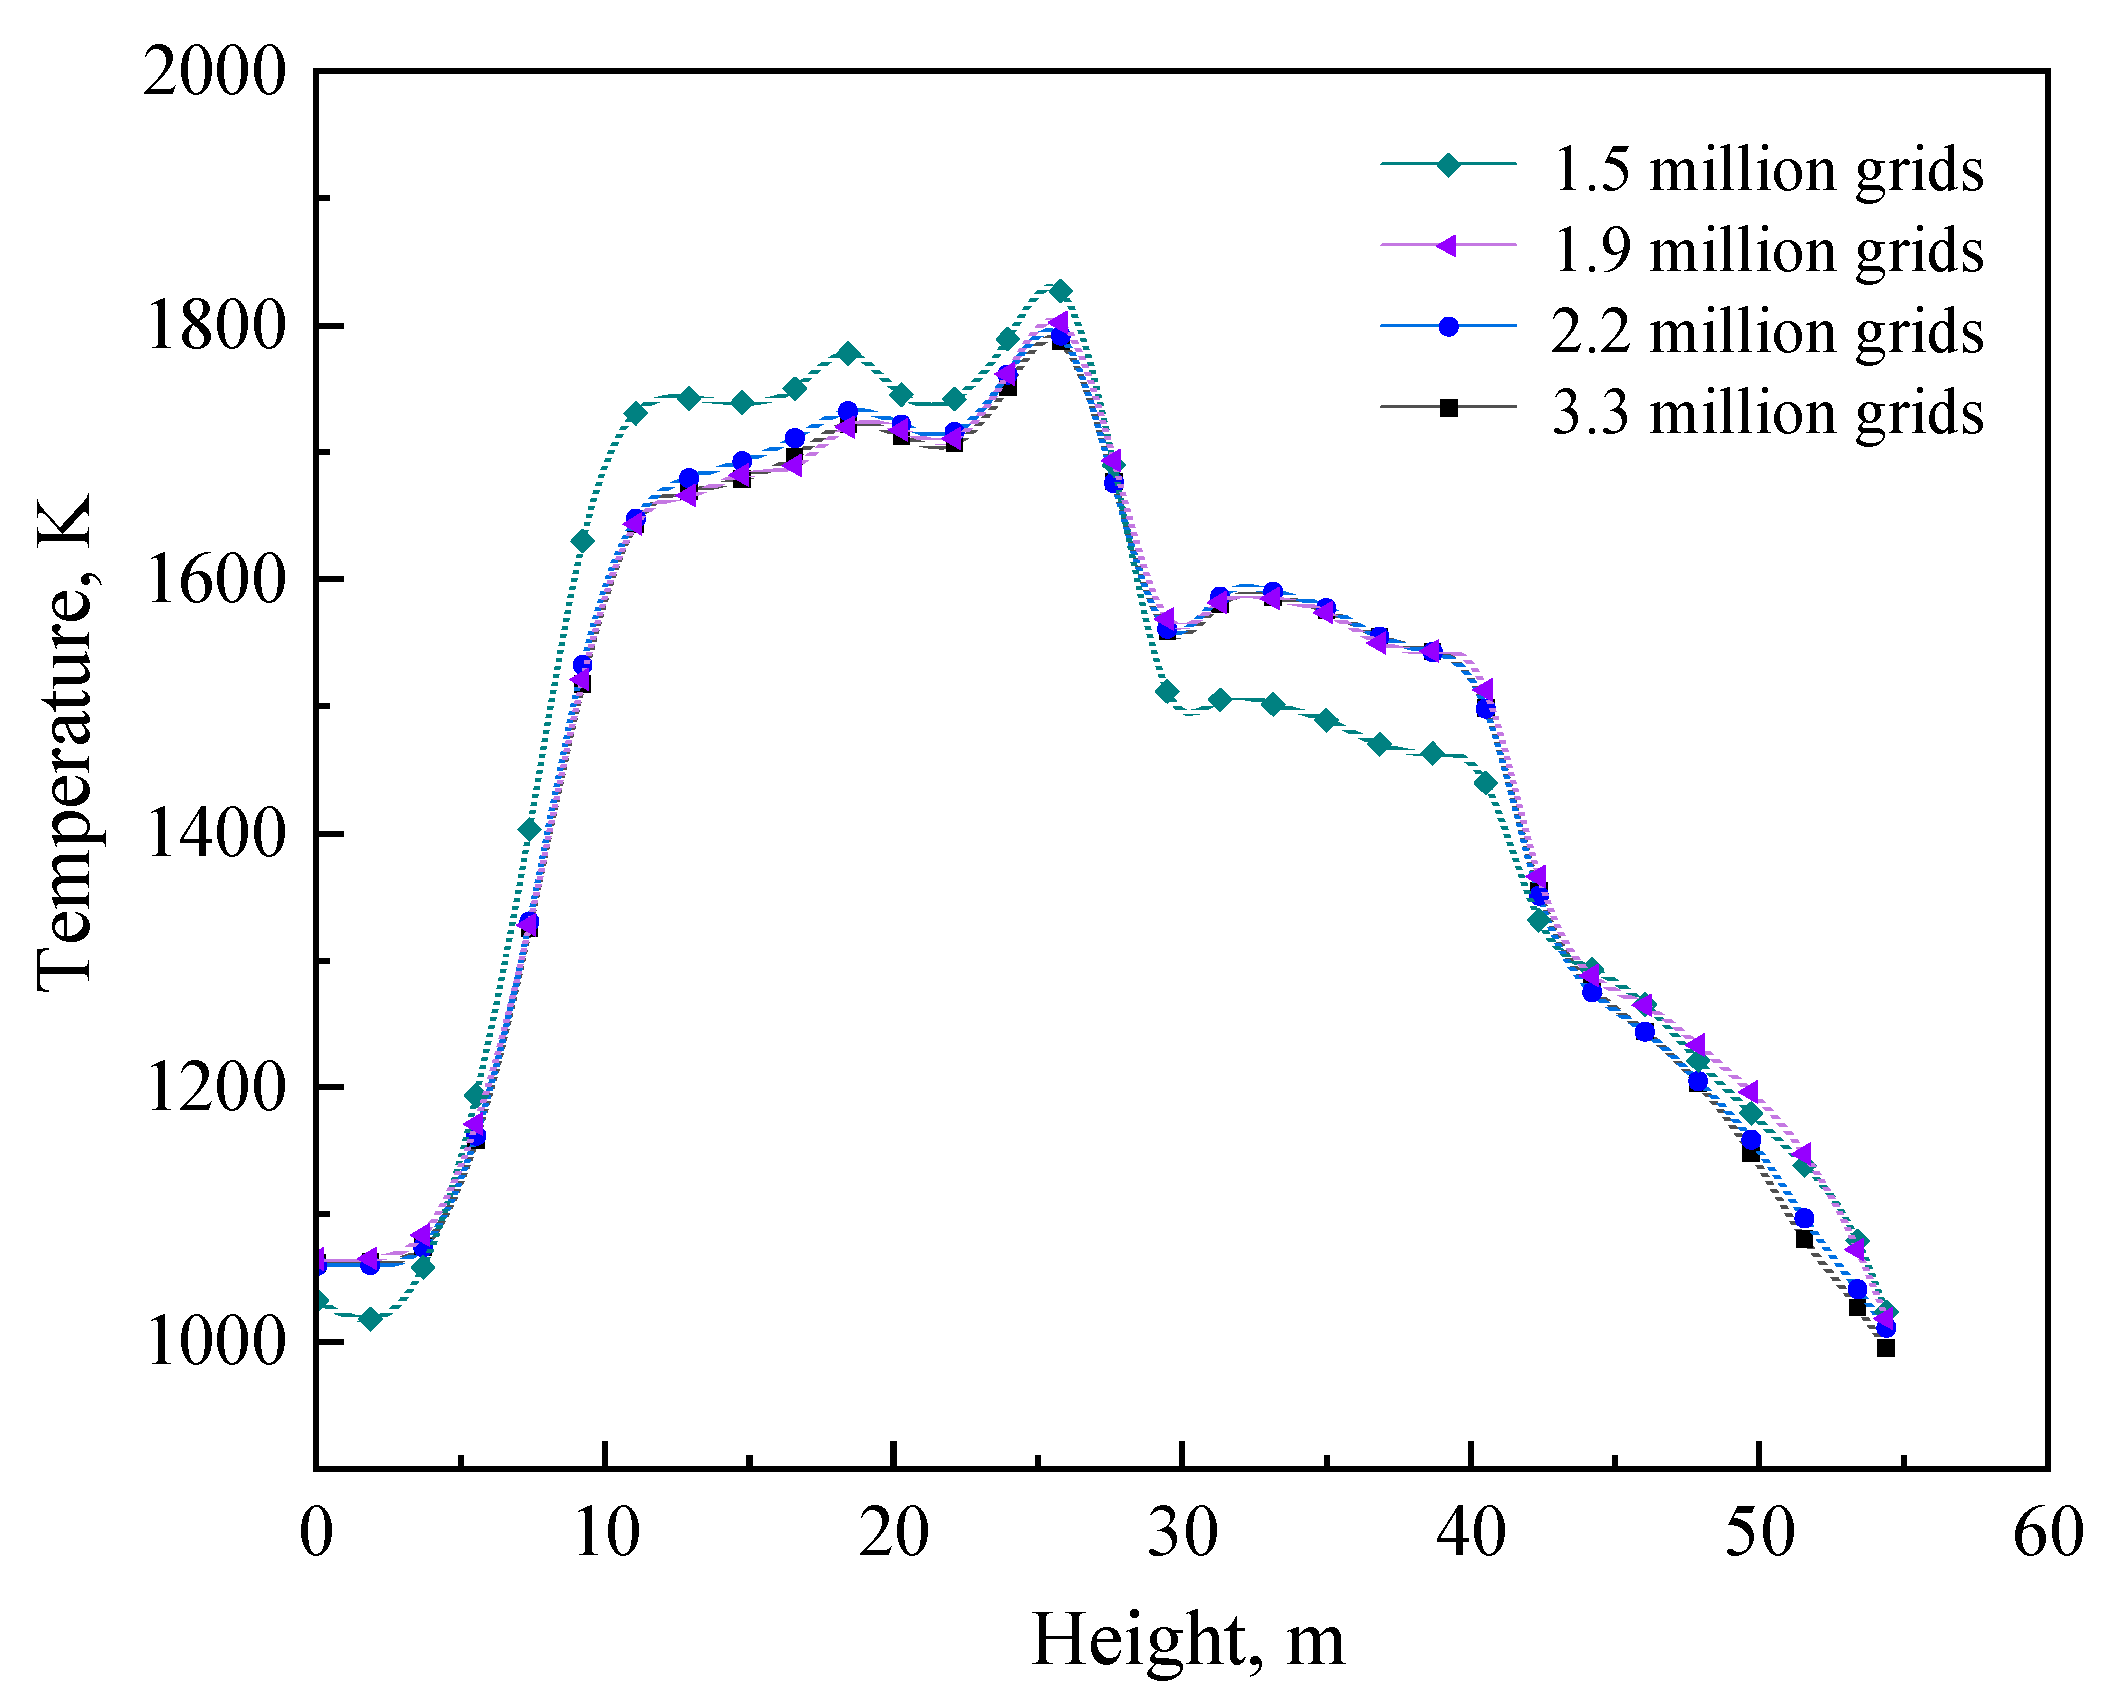
3.1. Mesh
3.2. Models for Pulverized Coal Combustion
3.3. NO Formation Model
3.4. Slagging Model
3.5. Operating Conditions of Simulated Cases
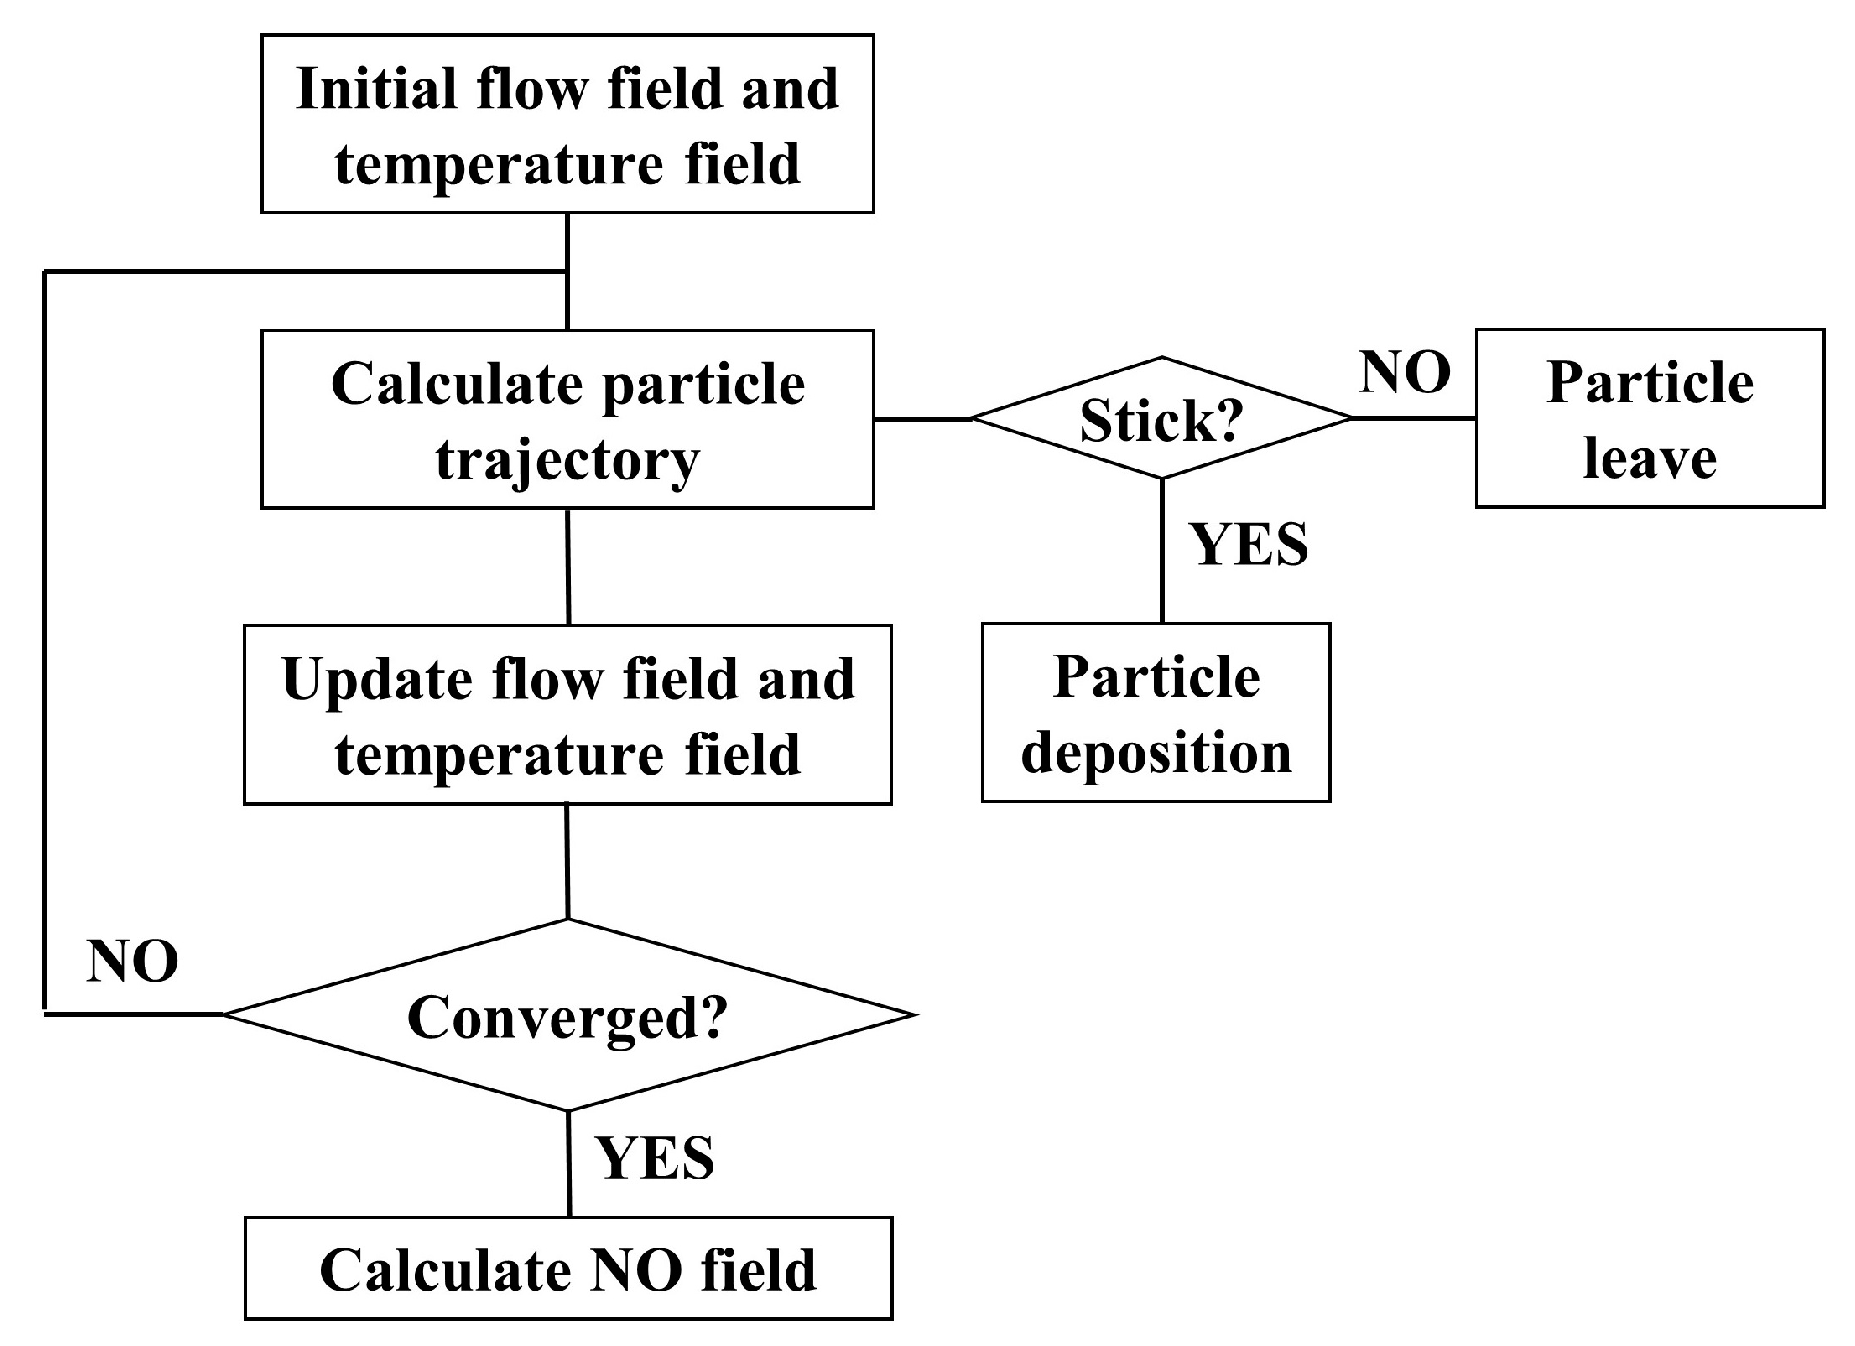
3.6. Solution Procedure
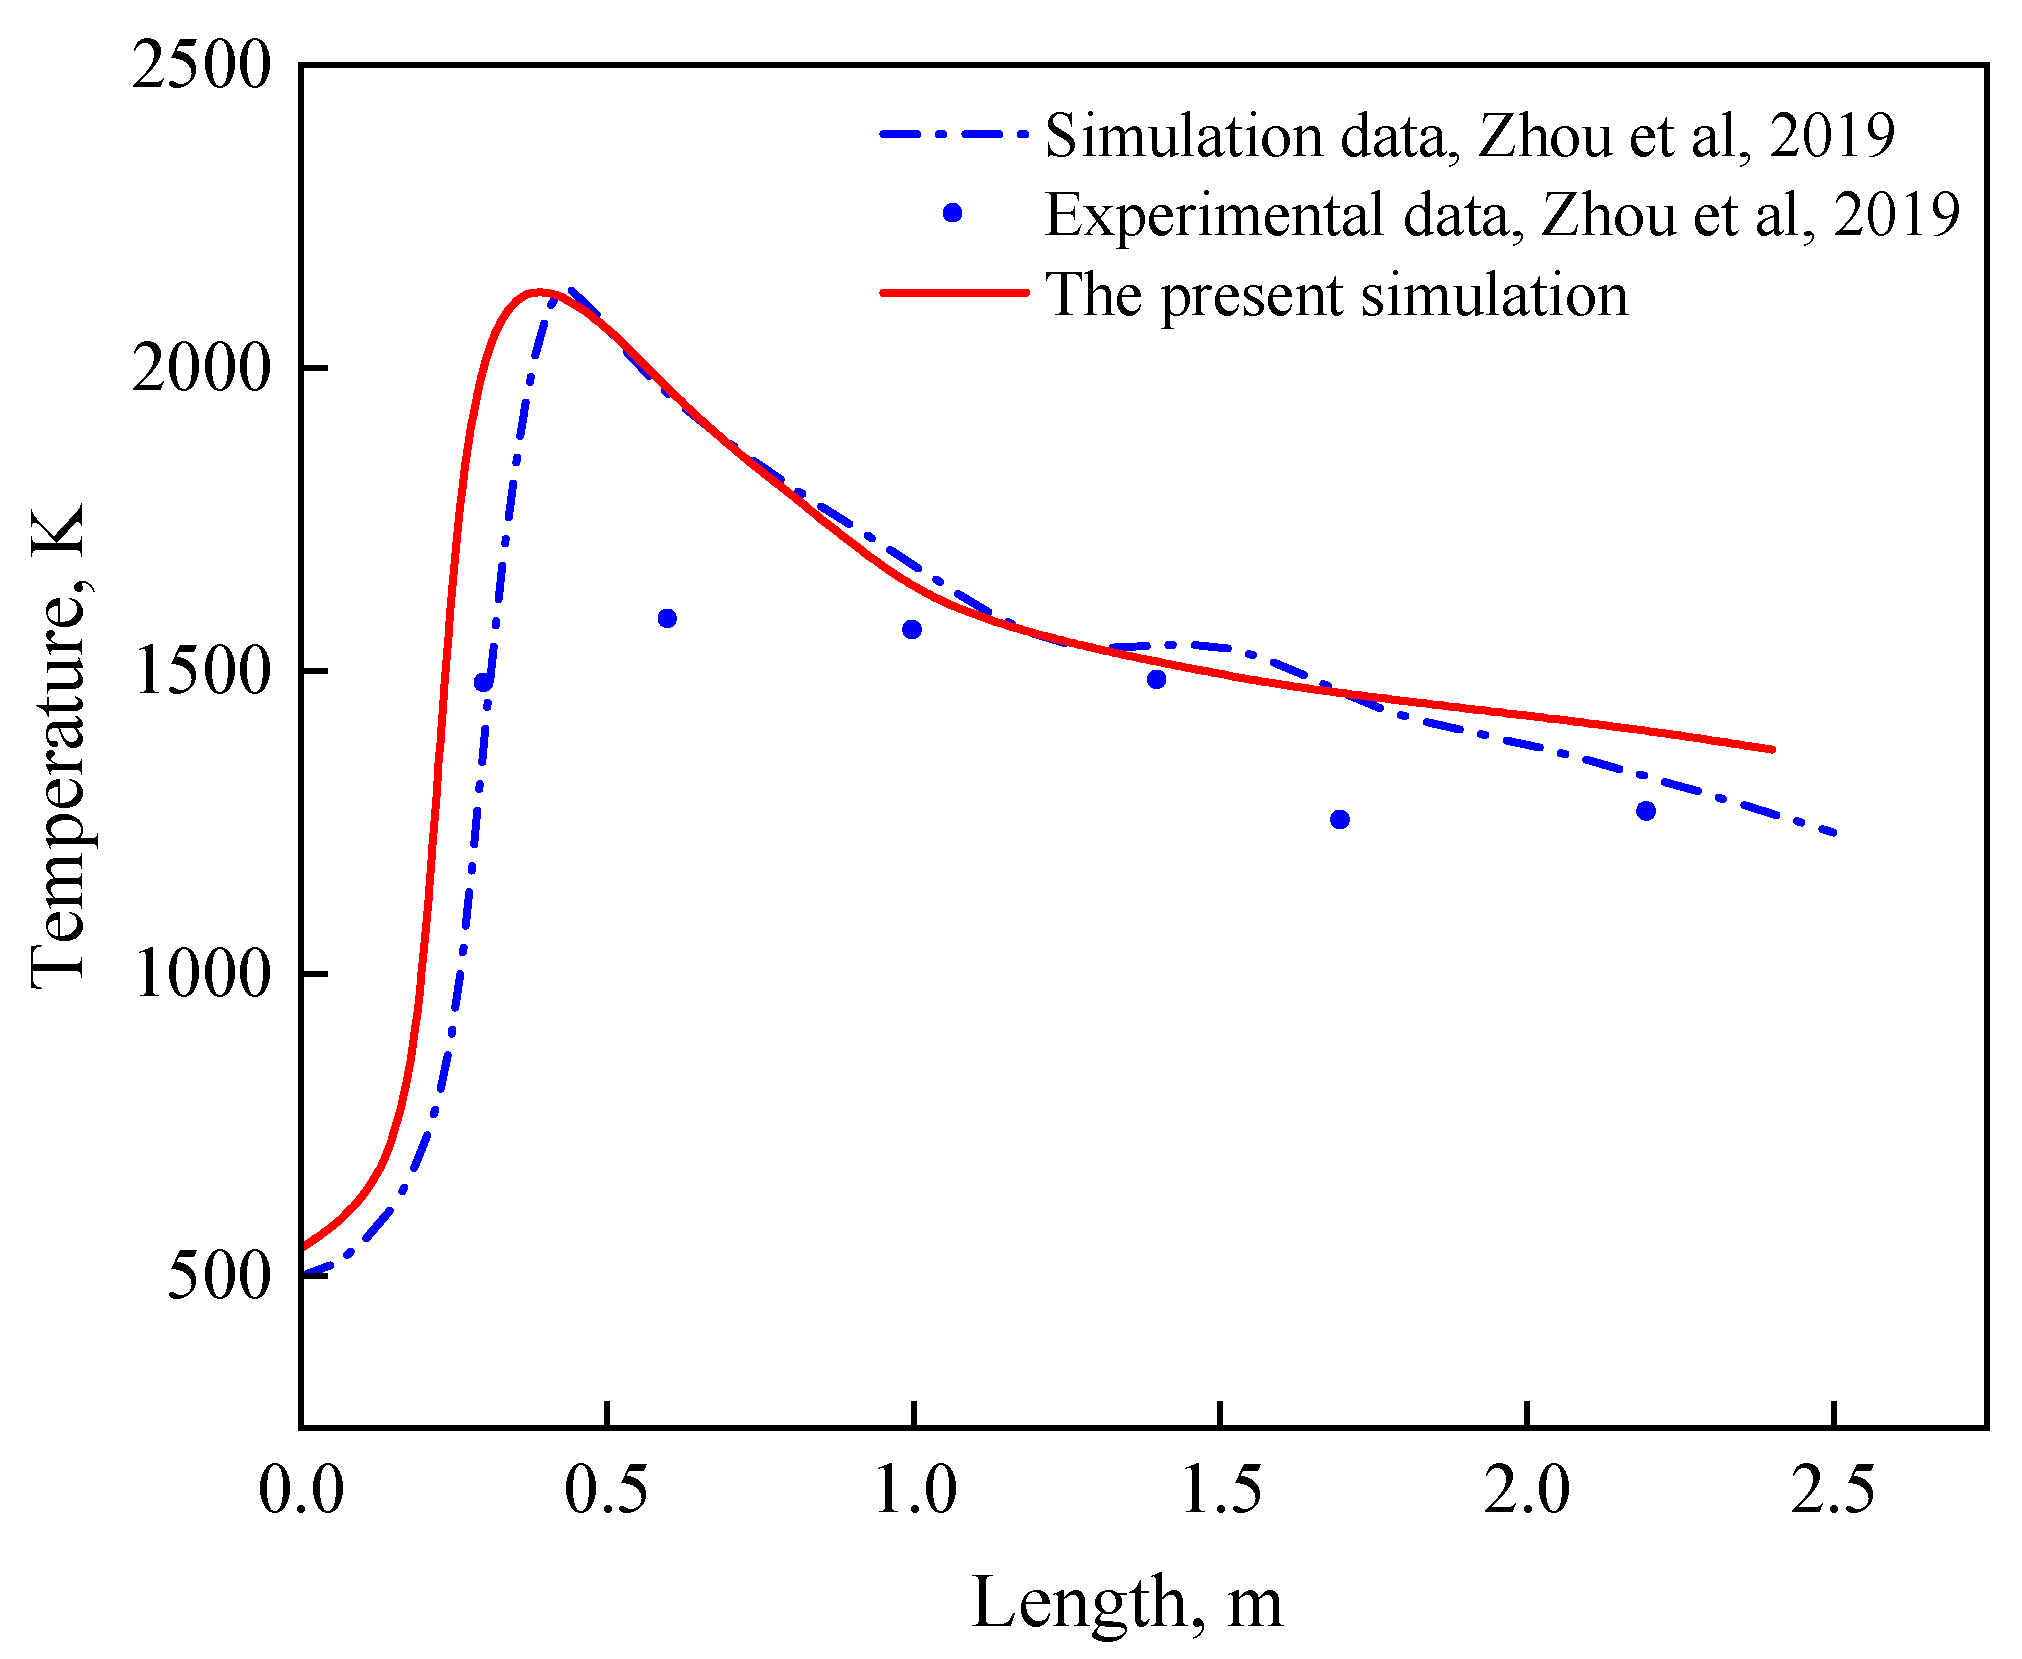
3.7. Model Validation
4. Results and Discussions
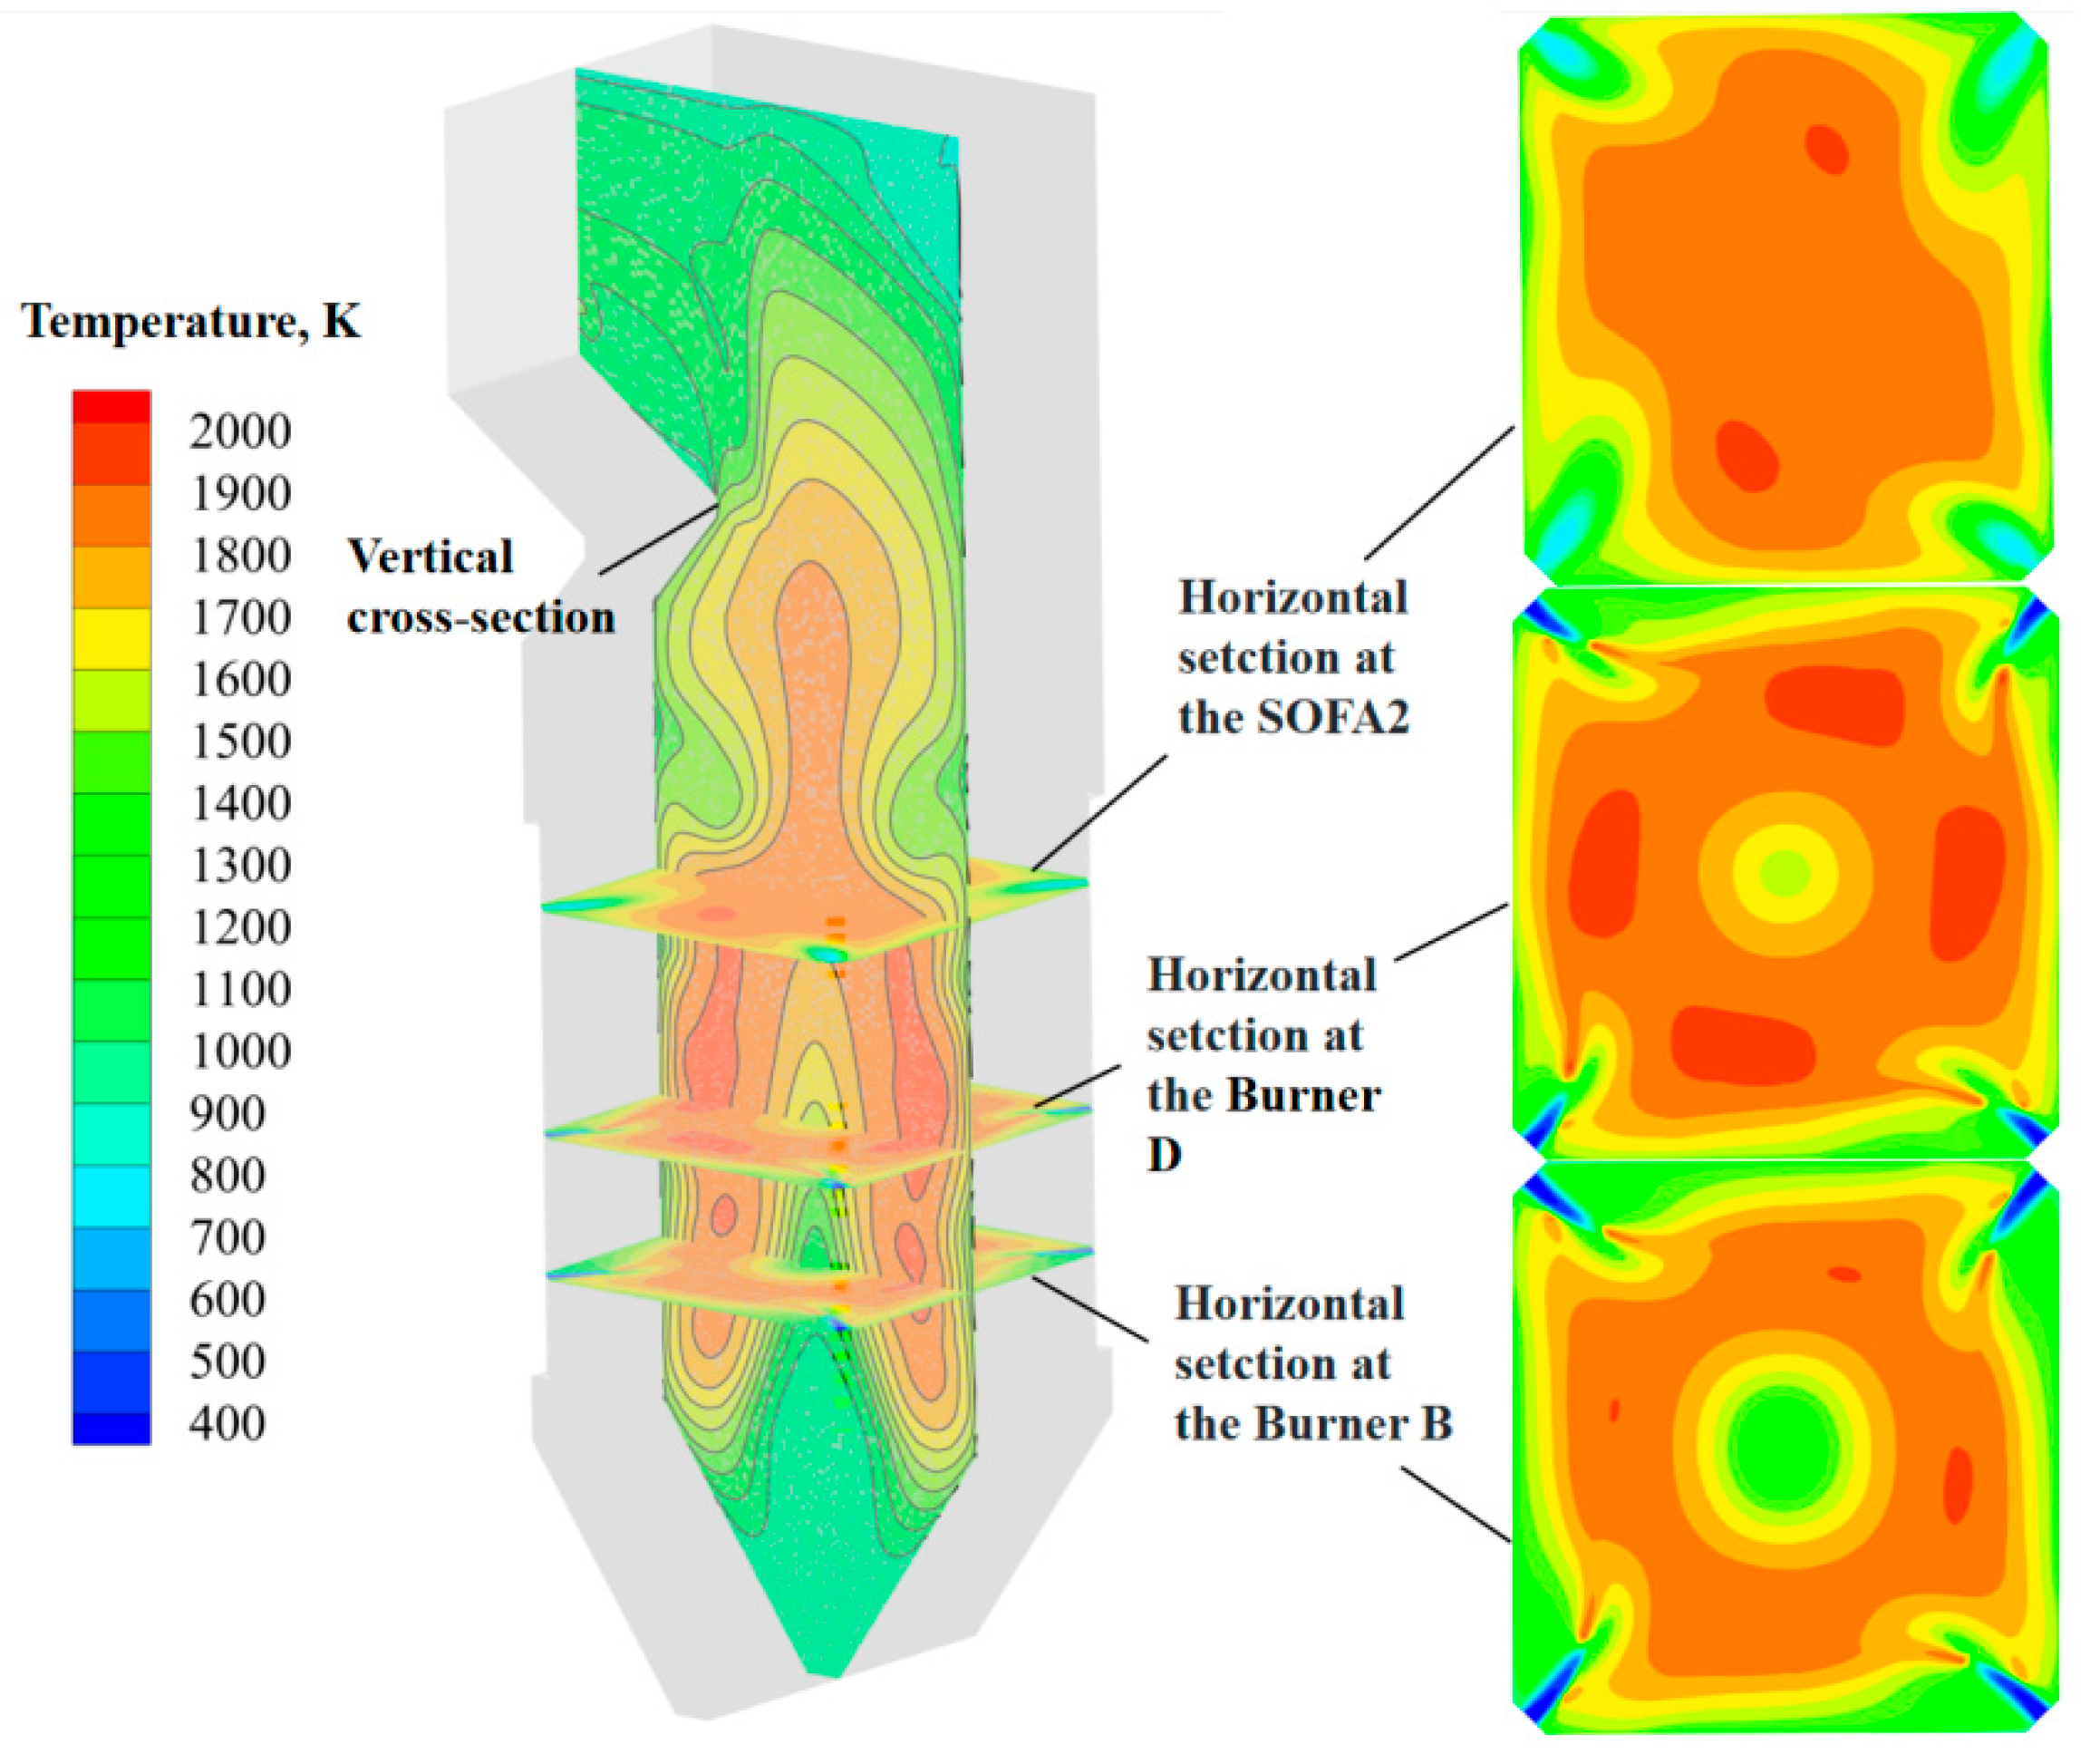
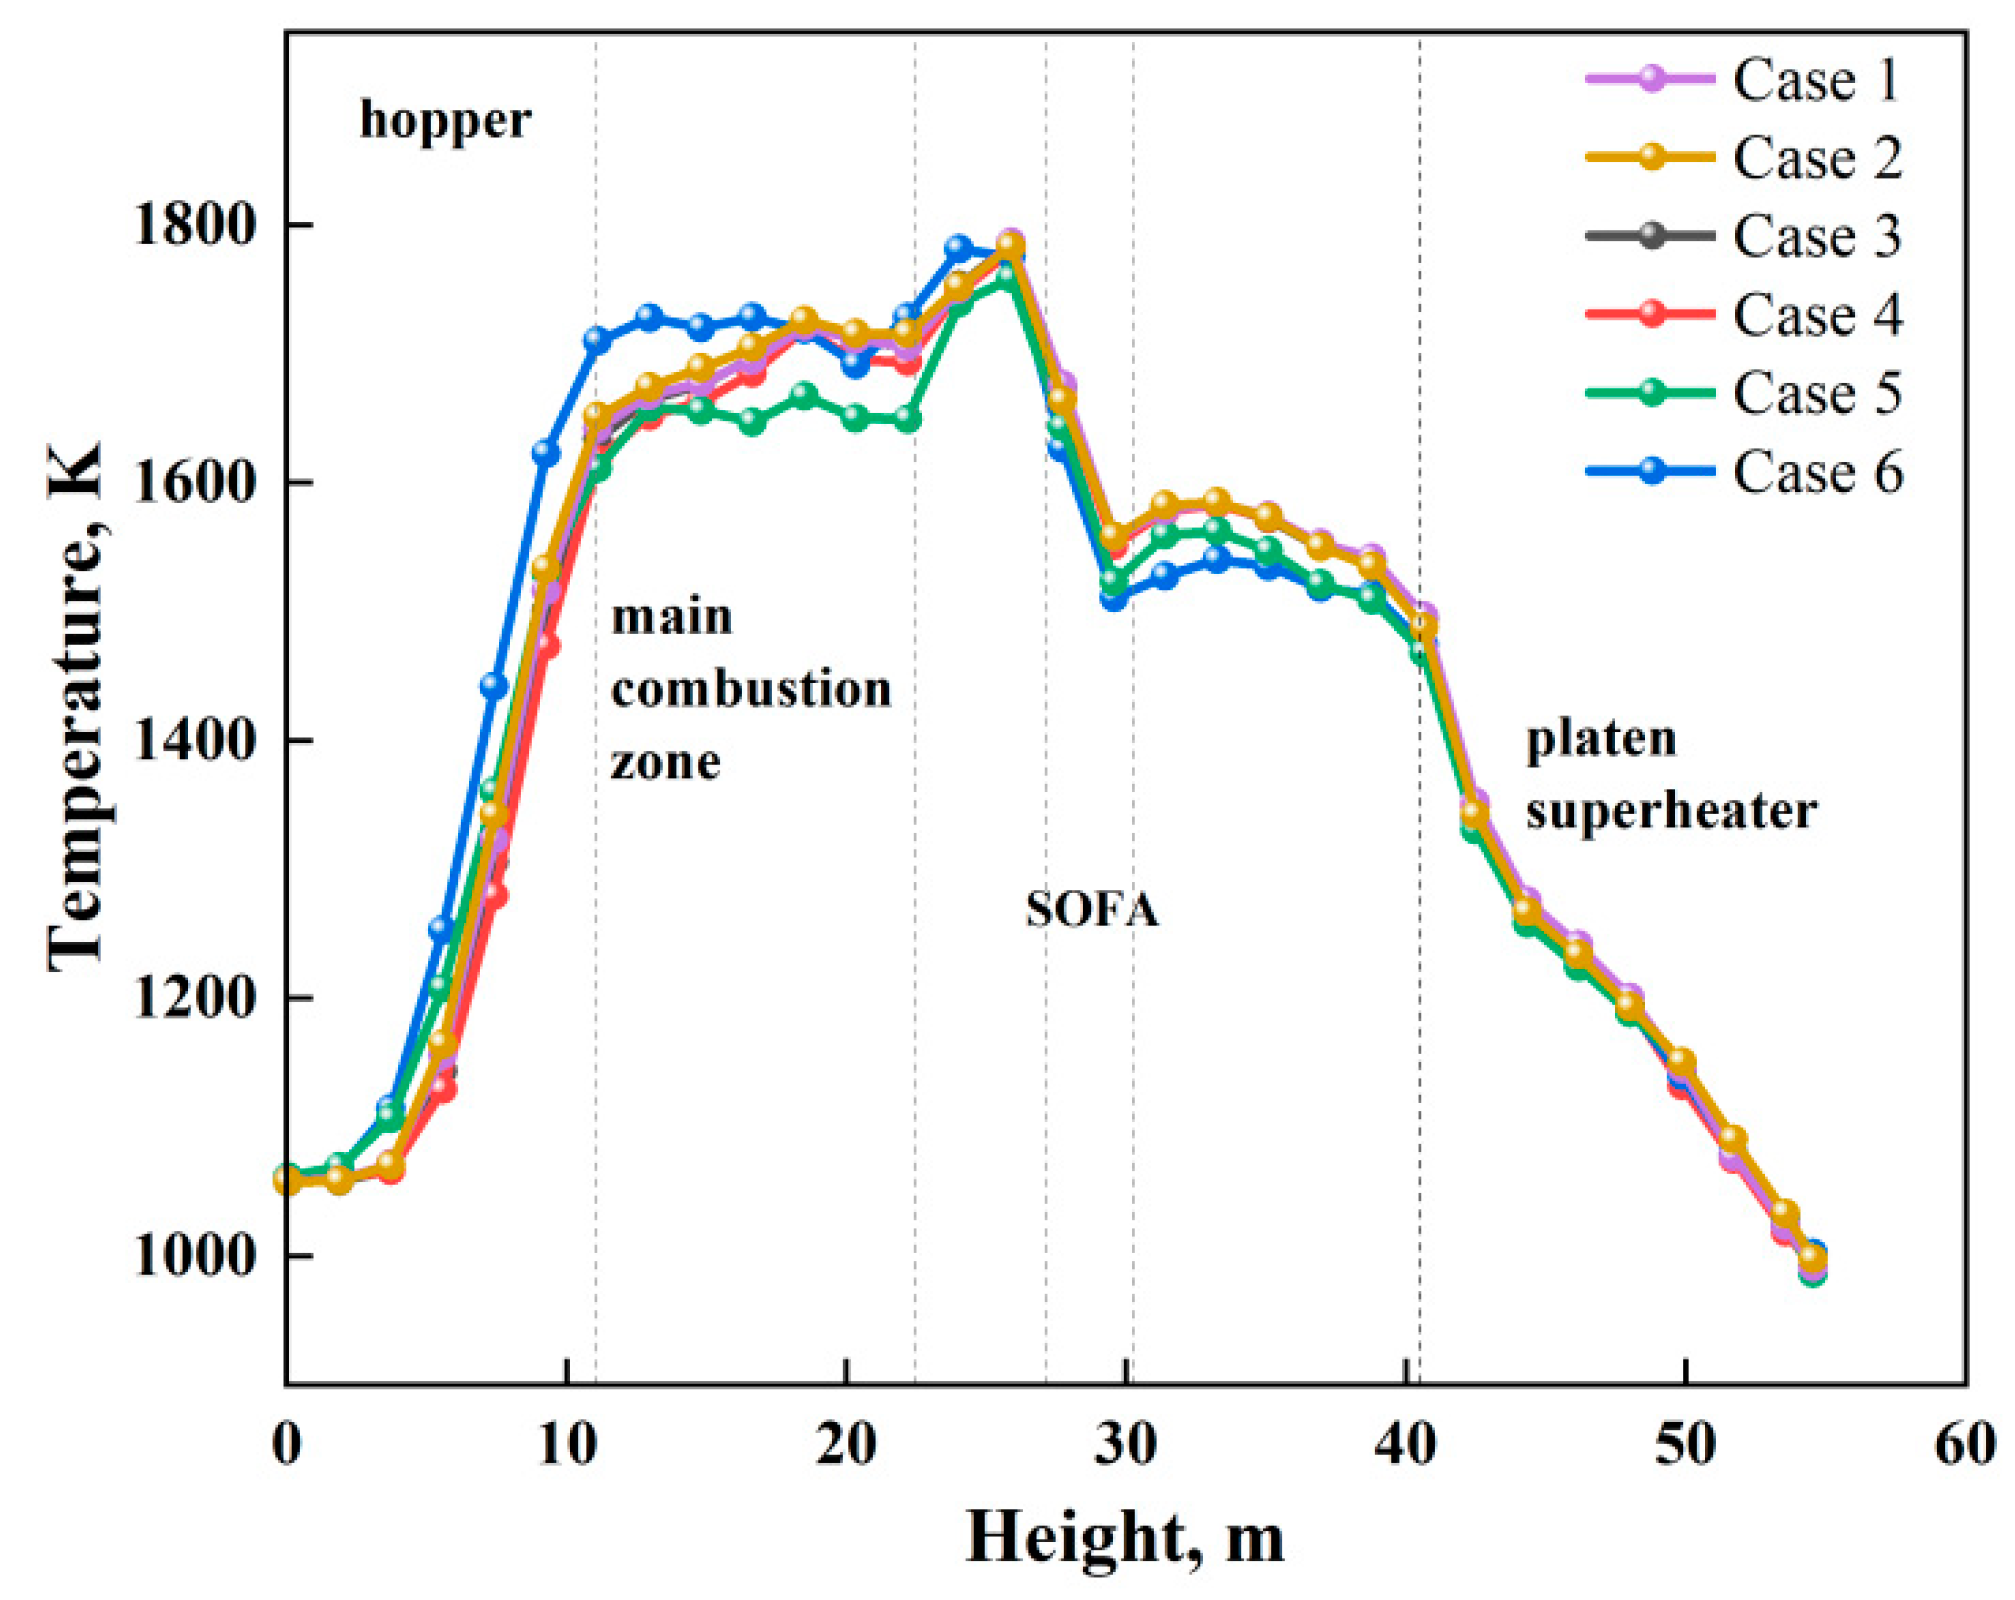
4.1. Temperature Field
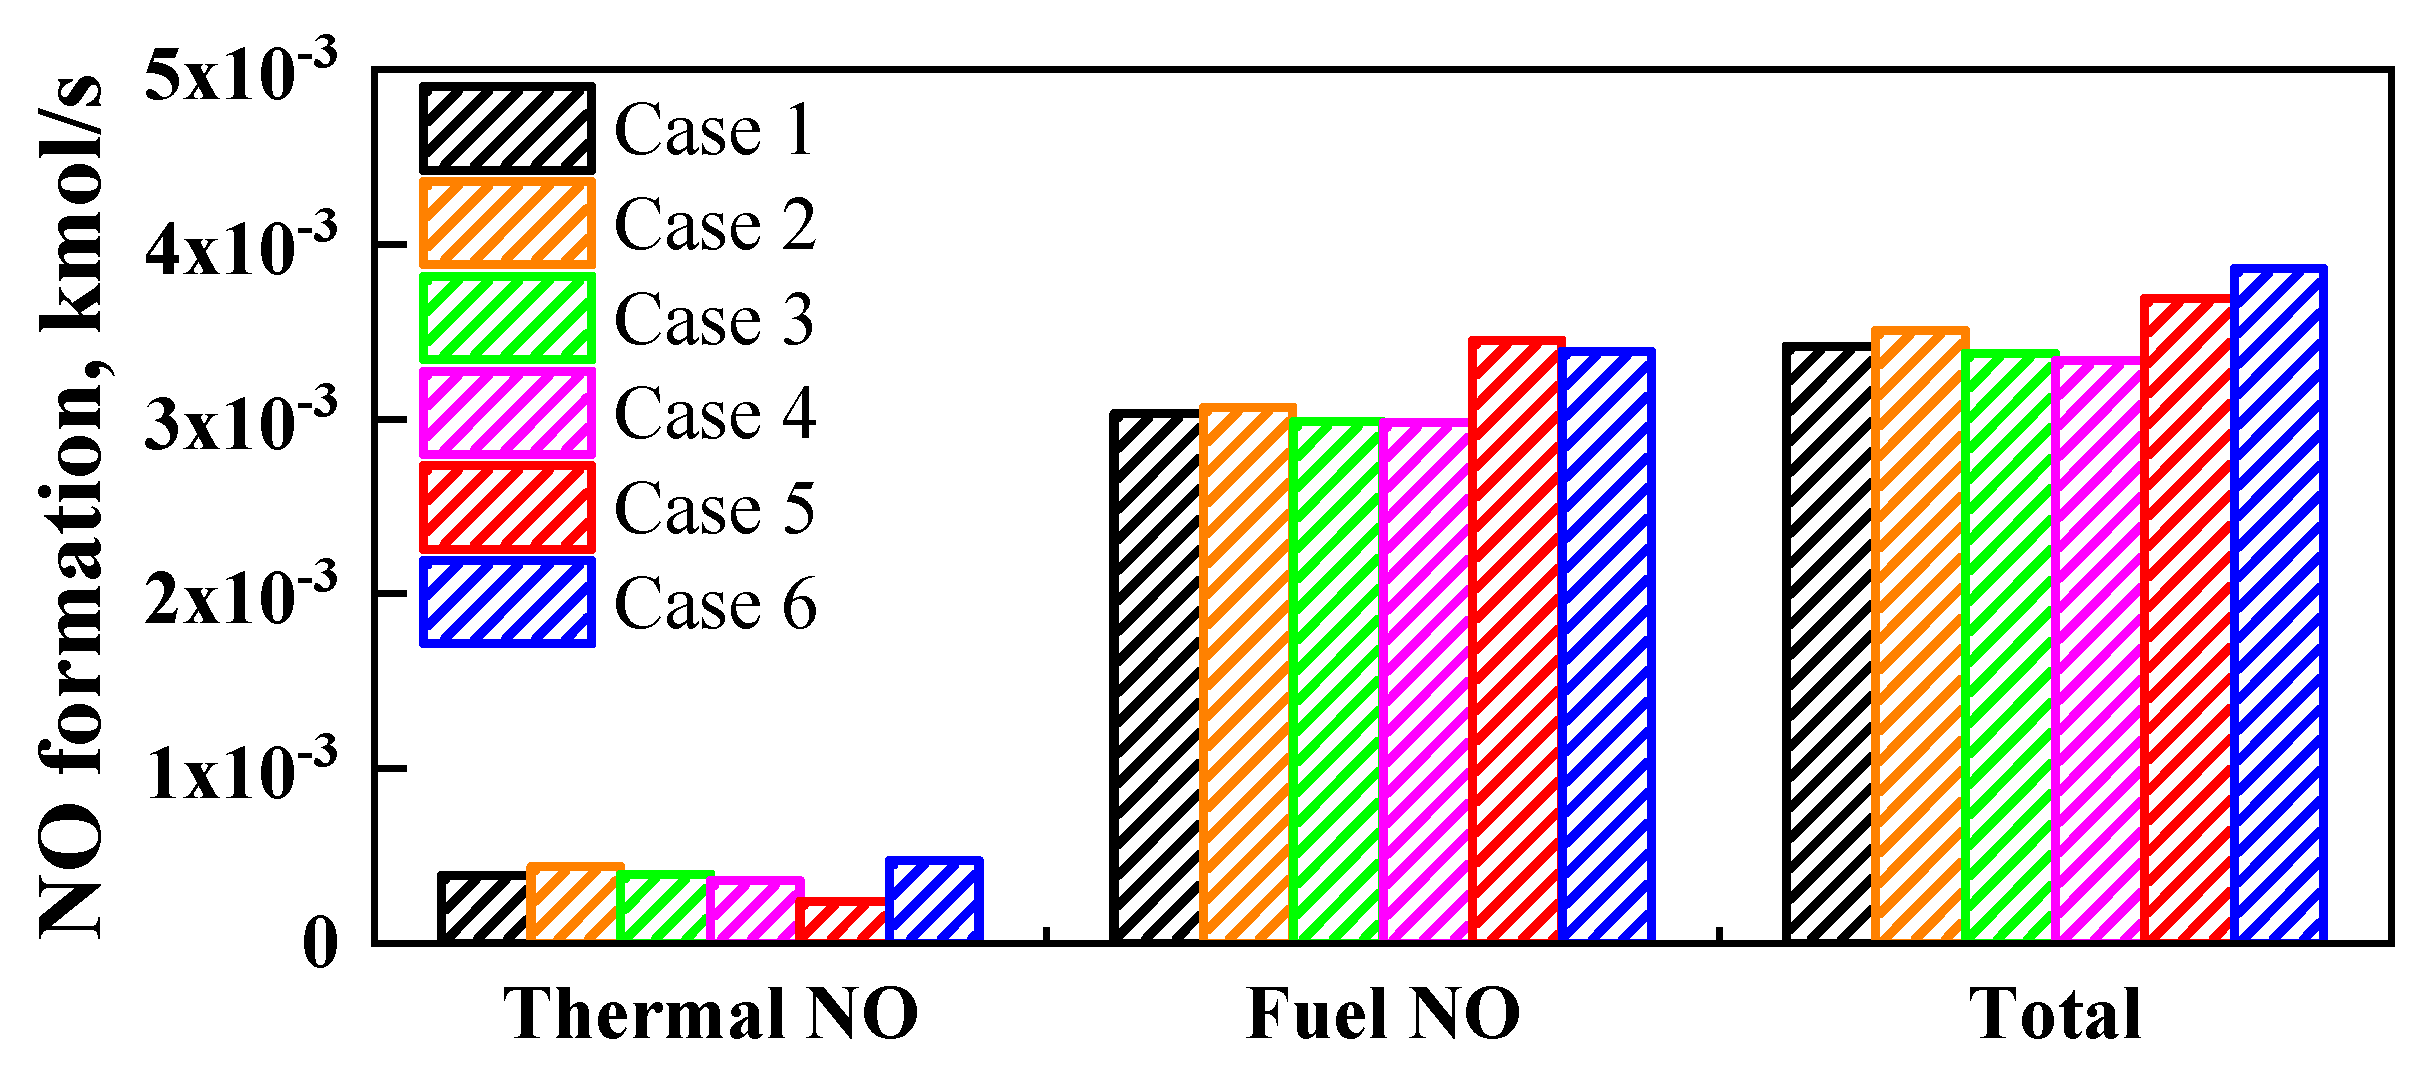
4.2. NO Emission
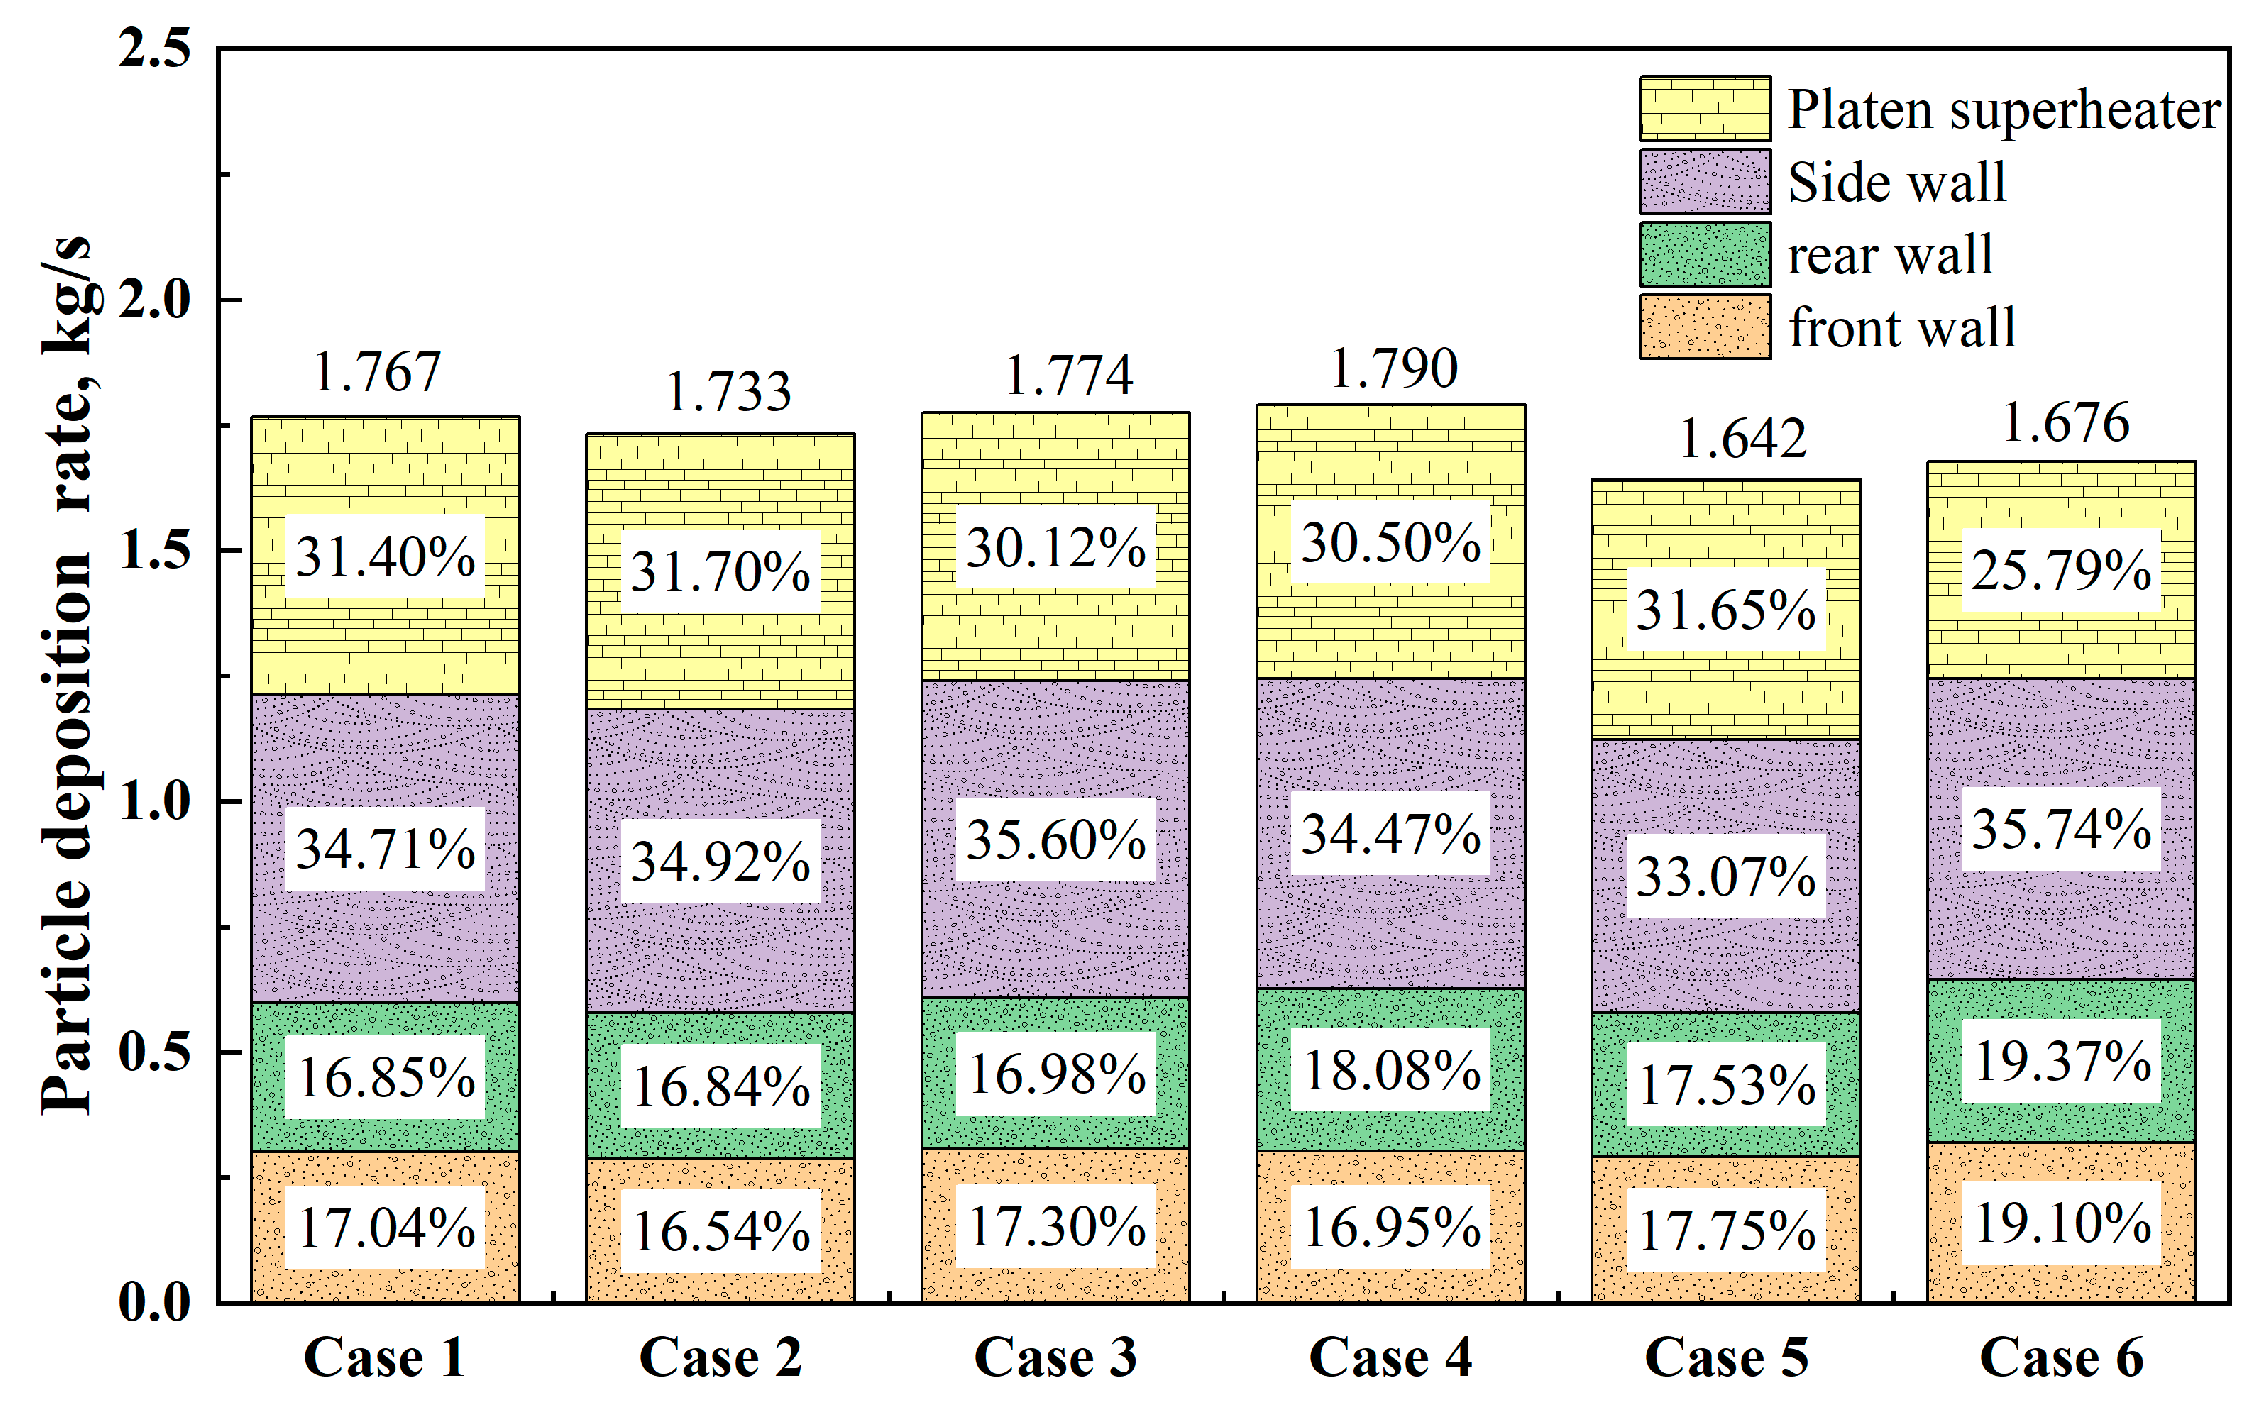
4.3. Slagging Characteristics
4.4. Research Implications for Burner Adjustment Strategies in Boiler Operation
5. Conclusions
- (1)
- Adjusting the burner’s yaw angle (modifying ITCD) results in negligible temperature changes. However, downward tilting induces significant variations in temperature distribution. At a 15° tilt, the actual tangential circle diameter (ATCD) expands, lowering average flue gas temperatures in the main combustion zone and post-SOFA mixing regions compared to the base case. At a 25° tilt, increased particle residence time and O2 concentration enhance combustion completeness, yielding the highest main combustion zone temperatures but the lowest post-SOFA temperatures across all tested configurations due to enhanced cooling.
- (2)
- As the burner’s yaw angle is adjusted to decrease the imaginary tangential circle diameter (ITCD), the average flue gas temperature in the main combustion zone slightly increases, resulting in a higher thermal-NO and fuel-NO formation rate. Increasing ITCD to twice the base case reduced NO emissions by 1.5%, while reducing ITCD to 0.5 times the base case increased NO emissions by 3%.
- (3)
- Tilting the burner downward raises the O2 concentration in the main combustion zone, increasing fuel NO formation. When the downward tilt angle is 15° and 25°, NO emissions increase by 8% and 19%, respectively.
- (4)
- The total particle deposition rate increases slightly as the ITCD increases by modifying the burner’s yaw angle. Increasing ITCD leads to an enlargement of ATCD, thereby elevating the frequency of particle impingement on water-cooled walls and increasing particle deposition rates. Increasing ITCD to twice the base case increased the particle deposition rate by 1.3%, while reducing ITCD to 0.5 times the base case reduced the particle deposition rate by 2%.
- (5)
- Adjusting the burner’s downward tilt angle effectively mitigates slagging. At a 15° downward tilt, reduced average flue gas temperatures in both the primary combustion zone and post-SOFA regions lower particle temperatures, thereby increasing particle viscosity and decreasing deposition rates. Conversely, while the 25° downward tilt achieves the lowest post-SOFA flue gas temperatures (reducing deposition on the platen superheater), the elevated primary zone temperature intensifies particle adhesion on water-cooled walls, resulting in an overall deposition rate marginally higher than that at 15°.
- (6)
- There is a compromise mechanism between NO emission control and furnace slagging mitigation by adjusting the burner’s yaw and downward tilt angles. Optimized burner configurations were identified through parametric analysis, where yaw angle adjustments achieving ITCDs of 548/1032 mm combined with a 15° downward tilt angle demonstrated optimal performance. This configuration increased NO emissions by 8% but reduced particle deposition by 7% compared to the base case, achieving optimal NO emission–slagging compromise. Future work could explore alternative combustion adjustments to enhance simultaneous NO emission and slagging control.
Author Contributions
Funding
Data Availability Statement
Conflicts of Interest
References
- Chen, Y.; Luo, Z.; Fang, M.; Wang, Q. Migration and transformation of sodium during staged coal combustion of Zhundong coal and influence of carbon coating. Fuel Process. Technol. 2020, 203, 106382. [Google Scholar] [CrossRef]
- Shi, H.; Wu, Y.; Zhang, M.; Zhang, Y.; Lyu, J. Ash deposition of Zhundong coal in a 350 MW pulverized coal furnace: Influence of sulfation. Fuel 2020, 260, 116317. [Google Scholar] [CrossRef]
- Guo, Z.; Li, J.; Liang, Y.; Long, X.; Lu, X.; Zhang, D. A numerical simulation study into the effect of longitudinal and transverse pitch on deposition of zhundong coal ash on tube bundles. Processes 2024, 12, 178. [Google Scholar] [CrossRef]
- Tang, C.; Pan, W.; Zhang, J.; Wang, W.; Sun, X. A comprehensive review on efficient utilization methods of high-alkali coals combustion in boilers. Fuel 2022, 316, 123269. [Google Scholar] [CrossRef]
- Hu, H.; Zhang, J.; Pan, W. Exploration of efficient utilization of high-alkali coal based on combustion process and combustion parameter optimization. Sustain. Energy Technol. Assess. 2023, 60, 103554. [Google Scholar] [CrossRef]
- Wang, X.; Xu, Z.; Wei, B.; Zhang, L.; Tan, H.; Yang, T.; Mikulčić, H.; Duić, N. The ash deposition mechanism in boilers burning Zhundong coal with high contents of sodium and calcium: A study from ash evaporating to condensing. Appl. Therm. Eng. 2015, 80, 150–159. [Google Scholar] [CrossRef]
- Jiang, F.; Zhang, S.; Huang, X.; Wang, C.; Li, H.; Zhang, Y. Sodium vapor capture by coal ash during sodium-rich coal combustion. Appl. Therm. Eng. 2019, 161, 114127. [Google Scholar] [CrossRef]
- Zhan, Z.; Chiodo, A.; Zhou, M.; Davis, K.; Wang, D.; Beutler, J.; Cremer, M.; Wang, Y.; Wendt, J.O. Modeling of the submicron particles formation and initial layer ash deposition during high temperature oxy-coal combustion. Proc. Combust. Inst. 2021, 38, 4013–4022. [Google Scholar] [CrossRef]
- Bilirgen, H. Slagging in PC boilers and developing mitigation strategies. Fuel 2014, 115, 618–624. [Google Scholar] [CrossRef]
- Wei, B.; Tan, H.; Wang, Y.; Wang, X.; Yang, T.; Ruan, R. Investigation of characteristics and formation mechanisms of deposits on different positions in full-scale boiler burning high alkali coal. Appl. Therm. Eng. 2017, 119, 449–458. [Google Scholar] [CrossRef]
- Wu, C.; Ma, D.; He, X.; Liu, Z. Numerical simulation study on combustion temperature control technology of quasi-eastern coal-fired boilers. Clean Coal Technol. 2021. (online first). Available online: https://kns.cnki.net/kcms/detail/11.3676.td.20210907.1546.006.html (accessed on 19 March 2025).
- Pei, J.; Zhang, Z.; You, C. Optimizing the combustion of low-quality coal by the wall wind auxiliary combustion method in a tangentially fired utility boiler. Combust. Sci. Technol. 2019, 191, 570–589. [Google Scholar] [CrossRef]
- Li, G.; Li, S.; Dong, M.; Yao, Q.; Guo, C.; Axelbaum, R. Comparison of particulate formation and ash deposition under oxy-fuel and conventional pulverized coal combustions. Fuel 2013, 106, 544–551. [Google Scholar] [CrossRef]
- Han, T.; Sun, R.; Zhu, C.; Liu, Y.; Che, D. Experimental study on ash deposition of Zhundong coal in oxy-fuel combustion. J. Energy Inst. 2019, 92, 1697–1709. [Google Scholar]
- Wang, C.; Sun, R.; Hu, G.; Zhao, L.; Wang, C.; Han, T.; Zhu, C.; Liu, Y.; Che, D. Effects of oxy-fuel condition on morphology and mineral composition of ash deposit during combustion of Zhundong high-alkali coal. J. Energy Inst. 2020, 93, 1216–1228. [Google Scholar]
- Liu, D.; Li, W.; Li, S.; Song, W.; Liu, D.; Kong, R. Transformation characteristics of sodium, chlorine and sulfur of Zhundong coal during O2/CO2 combustion in circulating fluidized bed. Energy 2019, 185, 254–261. [Google Scholar]
- Li, J.; Zhu, M.; Zhang, Z.; Zhang, K.; Shen, G.; Zhang, D. The mineralogy, morphology and sintering characteristics of ash deposits on a probe at different temperatures during combustion of blends of Zhundong lignite and a bituminous coal in a drop tube furnace. Fuel Process. Technol. 2016, 149, 176–186. [Google Scholar]
- Lv, Y.; Niu, Y.; Li, S.; Lei, Y.; Li, P. Effects of leaching and additives on the formation of deposits on the heating surface during high-Na/Ca Zhundong coal combustion. J. Energy Inst. 2021, 94, 319–328. [Google Scholar]
- Wu, X.; Zhang, X.; Yan, K.; Chen, N.; Zhang, J.; Xu, X.; Dai, B.; Zhang, J.; Zhang, L. Ash deposition and slagging behavior of Chinese Xinjiang high-alkali coal in 3 MWth pilot-scale combustion test. Fuel 2016, 181, 1191–1202. [Google Scholar] [CrossRef]
- Zheng, L.; Liu, Z.; Jin, J.; He, X.; Liu, B. Mechanisms for NOx emission control and ash deposition mitigation in sludge-coal blend combustion. J. Clean. Prod. 2024, 455, 142284. [Google Scholar]
- Zeng, G.; Zhou, A.; Fu, J.; Ji, Y. Experimental and numerical investigations on NOx formation and reduction mechanisms of pulverized-coal stereo-staged combustion. Energy 2022, 261, 125358. [Google Scholar]
- Wang, Y.; Zhou, Y.; Bai, N.; Han, J. Experimental investigation of the characteristics of NOx emissions with multiple deep air-staged combustion of lean coal. Fuel 2020, 280, 118416. [Google Scholar]
- Bian, C.; Huang, J.; Sun, R. Numerical optimization of combustion and NOx emission in a retrofitted 600 MWe tangentially-fired boiler using lignite. Appl. Therm. Eng. 2023, 226, 120228. [Google Scholar] [CrossRef]
- Jiang, Y.; Lee, B.-H.; Oh, D.-H.; Jeon, C.-H. Optimization of operating conditions to achieve combustion stability and reduce NOx emission at half-load for a 550-MW tangentially fired pulverized coal boiler. Fuel 2021, 306, 121727. [Google Scholar]
- Zhu, B.; Shang, B.; Guo, X.; Wu, C.; Chen, X.; Zhao, L. Study on combustion characteristics and NOx formation in 600 MW coal-fired boiler based on numerical simulation. Energies 2023, 16, 262. [Google Scholar]
- Jin, W.; Geng, C.; Wang, Y.O.; Ma, H.; Dong, Y.; Si, F. Combined effects of yaw and tilt angles of separated overfire air on the combustion characteristics in a 1,000 MW coal-fired boiler: A numerical study. Korean J. Chem. Eng. 2021, 38, 771–787. [Google Scholar] [CrossRef]
- Liu, T.; Wang, Y.; Zou, L.; Bai, Y.; Shen, T.; Wei, Y.; Li, F.; Zhao, Q. Numerical investigation of stable combustion at ultra-low load for a 350 MW wall tangentially fired pulverized-coal boiler: Effect of burner adjustments and methane co-firing. Appl. Therm. Eng. 2024, 246, 122980. [Google Scholar] [CrossRef]
- Li, Z.; Qiao, X.; Miao, Z. A novel burner arrangement scheme with annularly combined multiple airflows for wall-tangentially fired pulverized coal boiler. Energy 2021, 222, 119912. [Google Scholar]
- Tan, P.; Tian, D.; Fang, Q.; Ma, L.; Zhang, C.; Chen, G.; Zhang, H. Effects of burner tilt angle on the combustion and NOx emission characteristics of a 700 MWe deep-air-staged tangentially pulverized-coal-fired boiler. Fuel 2017, 196, 314–324. [Google Scholar] [CrossRef]
- Sankar, G.; Dhannina, C.S.; Santhosh Kumar, D.; Balasubramanian, K.R. Numerical simulation of the heat transfer and NOx emissions in a 660 MW tangentially fired pulverised-coal supercritical boiler. Heat Mass Transf. 2020, 56, 2693–2709. [Google Scholar]
- Jameel, A.G.A.; Dahiphale, C.; Alquaity, A.B.S.; Zahid, U.; Jayanti, S. Numerical simulation of coal combustion in a tangential pulverized boiler: Effect of burner vertical tilt angle. Arab. J. Sci. Eng. 2022, 47, 5647–5660. [Google Scholar]
- Jo, H.; Park, J.; Kang, W.; Hong, J.; Yoon, S.; Ra, H.; Ryu, C. Influence of uneven secondary air supply and burner tilt on flow pattern, heat transfer, and NOx emissions in a 500 MWe tangential-firing coal boiler. Energies 2021, 14, 8352. [Google Scholar] [CrossRef]
- Cui, K.; Liu, B.; Zhang, H.; Wu, Y.; Matsumoto, K.; Takeno, K. Modeling of pulverized coal combustion in turbulent flow with the consideration of intermediate reactions of volatile matter. Energy Fuels 2013, 27, 2246–2254. [Google Scholar]
- Hill, S.C.; Smoot, L.D. Modeling of nitrogen oxides formation and destruction in combustion systems. Prog. Energy Combust. Sci. 2000, 26, 417–458. [Google Scholar]
- De Soete, G.G. Overall reaction rates of NO and N2 formation from fuel nitrogen. Proc. Combust. Inst. 1975, 15, 1093–1102. [Google Scholar]
- Cai, Y.; Tay, K.; Zheng, Z.; Yang, W.; Wang, H.; Zeng, G.; Li, Z.; Keng Boon, S.; Subbaiah, P. Modeling of ash formation and deposition processes in coal and biomass fired boilers: A comprehensive review. Appl. Energy 2018, 230, 1447–1544. [Google Scholar]
- Kleinhans, U.; Wieland, C.; Frandsen, F.J.; Spliethoff, H. Ash formation and deposition in coal and biomass fired combustion systems: Progress and challenges in the field of ash particle sticking and rebound behavior. Prog. Energy Combust. Sci. 2018, 68, 65–168. [Google Scholar]
- Walsh, P.M.; Sayre, A.N.; Loehden, D.O.; Monroe, L.S.; Beér, J.M.; Sarofim, A.F. Deposition of bituminous coal ash on an isolated heat exchanger tube: Effects of coal properties on deposit growth. Prog. Energy Combust. Sci. 1990, 16, 327–345. [Google Scholar]
- Kær, S.K.; Rosendahl, L.A.; Baxter, L.L. Towards a CFD-based mechanistic deposit formation model for straw-fired boilers. Fuel 2006, 85, 833–848. [Google Scholar]
- Brink, A.; Lindberg, D.; Hupa, M.; de Tejada, M.E.; Paneru, M.; Maier, J.; Scheffknecht, G.; Pranzitelli, A.; Pourkashanian, M. A temperature-history based model for the sticking probability of impacting pulverized coal ash particles. Fuel Process. Technol. 2016, 141, 210–215. [Google Scholar]
- Venturini, P.; Borello, D.; Hanjali’c, K.; Rispoli, F. Modelling of particles deposition in an environment relevant to solid fuel boilers. Appl. Therm. Eng. 2012, 49, 131–138. [Google Scholar]
- Yuan, Z.; Chen, Z.; Zhang, B.; Gao, X.; Li, J.; Qiao, Y.; Li, Z. Study on the slagging trends of the pre-combustion chamber in industrial pulverized coal boiler under different excess air coefficients by CFD numerical simulation. Energy 2023, 264, 126184. [Google Scholar] [CrossRef]
- Zhou, M.M.; Parra-Álvarez, J.C.; Smith, P.J.; Isaac, B.J.; Thornock, J.N.; Wang, Y.; Smith, S.T. Large-eddy simulation of ash deposition in a large-scale laboratory furnace. Proc. Combust. Inst. 2019, 37, 4409–4418. [Google Scholar] [CrossRef]


| Coal * | Proximate Analysis/wt.% | Qar,Net,p | Ultimate Analysis/wt.% | ||||||
|---|---|---|---|---|---|---|---|---|---|
| Mar | Aar | Vdaf | (MJ/kg) | Car | Har | Oar | Nar | Sar | |
| Coal 1 | 8.70 | 18.94 | 37.84 | 22.1 | 58.43 | 3.86 | 8.48 | 0.91 | 0.68 |
| Coal 2 | 20.90 | 15.74 | 33.54 | 17.99 | 50.11 | 2.50 | 9.70 | 0.52 | 0.53 |
| Oxide | SiO2 | Fe2O3 | Al2O3 | CaO | MgO | TiO2 | K2O | Na2O | SO3 |
| wt. % | 54.53 | 6.3 | 21.69 | 5.3 | 2.18 | 0.86 | 1.53 | 1.17 | 4.59 |
| Case | Yaw Angle 1 | Tilt Angle 2 | Remarks on Imaginary Tangential Circle Diameter (ITCD) |
|---|---|---|---|
| 1 | 0°, 0° | 0° | ITCDs are 548 mm and 1032 mm |
| 2 | +47′, +1°28′ | 0° | ITCDs are 274 mm and 516 mm |
| 3 | −47′, −1°28′ | 0° | ITCDs are 822 mm and 1548 mm |
| 4 | −1°34′, −2°57′ | 0° | ITCDs are 1096 mm and 2064 mm |
| 5 | 0°, 0° | −15° | ITCDs are 548 mm and 1032 mm |
| 6 | 0°, 0° | −25° | ITCDs are 548 mm and 1032 mm |
| NO Emission (mg/m3, 6%O2) | CO Emission (ppm) | |
|---|---|---|
| Measured | 219 | 908.8 |
| Predicted | 235 | 945 |
Disclaimer/Publisher’s Note: The statements, opinions and data contained in all publications are solely those of the individual author(s) and contributor(s) and not of MDPI and/or the editor(s). MDPI and/or the editor(s) disclaim responsibility for any injury to people or property resulting from any ideas, methods, instructions or products referred to in the content. |
© 2025 by the authors. Licensee MDPI, Basel, Switzerland. This article is an open access article distributed under the terms and conditions of the Creative Commons Attribution (CC BY) license (https://creativecommons.org/licenses/by/4.0/).
Share and Cite
Xiong, Y.; Liu, R.; Shen, W. Impact of Burner Yaw and Tilt Angles on the NO Emissions and Slagging in a 330 MW Tangentially Fired Boiler Utilizing Zhundong Coal: A Numerical Study. Processes 2025, 13, 1085. https://doi.org/10.3390/pr13041085
Xiong Y, Liu R, Shen W. Impact of Burner Yaw and Tilt Angles on the NO Emissions and Slagging in a 330 MW Tangentially Fired Boiler Utilizing Zhundong Coal: A Numerical Study. Processes. 2025; 13(4):1085. https://doi.org/10.3390/pr13041085
Chicago/Turabian StyleXiong, Yuhang, Ran Liu, and Wenfeng Shen. 2025. "Impact of Burner Yaw and Tilt Angles on the NO Emissions and Slagging in a 330 MW Tangentially Fired Boiler Utilizing Zhundong Coal: A Numerical Study" Processes 13, no. 4: 1085. https://doi.org/10.3390/pr13041085
APA StyleXiong, Y., Liu, R., & Shen, W. (2025). Impact of Burner Yaw and Tilt Angles on the NO Emissions and Slagging in a 330 MW Tangentially Fired Boiler Utilizing Zhundong Coal: A Numerical Study. Processes, 13(4), 1085. https://doi.org/10.3390/pr13041085